Embed Size (px)
Citation preview
VARIABLE MIXE-MODE DELAMINATION IN
COMPOSITE LAMINATE UNDER FATIGUE
CONDITIONS: TESTING AND ANALYSIS
Norbert BLANCO VILLAVERDE
ISBN: 84-689-0990-4 Dipòsit legal: GI-139-2004
Universitat de Girona
Escola Politècnica Superior
Dpt. d’Enginyeria Mecànica i de la Construcció Industrial
Variable mixed-mode delamination in composite laminates under fatigue conditions: testing &
analysis
PhD Thesis
Norbert Blanco Villaverde
Girona, October 2004

Universitat de Girona
Escola Politècnica Superior
Dpt. d’Enginyeria Mecànica i de la Construcció Industrial
Variable mixed-mode delamination in composite laminates under fatigue
conditions: testing & analysis
PhD Thesis
Norbert Blanco Villaverde
Thesis Advisor
Josep Costa Balanzat
Girona, October 2004

To whom it might concern, Dr. Josep Costa Balanzat, Associate Professor of the Department of Physics, University of Girona, CERTIFIES that the study entitled ‘Variable mixed-mode delamination in composite laminates under fatigue conditions: testing & analysis’ has been carried out under his supervision by Norbert Blanco Villaverde to obtain the doctoral degree. Girona, October 2004. Dr. Josep Costa Balanzat


The present study has been partially funded by the Spanish Government under research projects MAT2000-00741-C02-01 and MAT2003-09768-C03-01. The research stays of the author at the Royal Institute of Technology (KTH) in Stockholm, Sweden, have been economically funded by the Catalan Government (2003BEAI00174), the University of Girona (BE-UdG-2002) and the Departament d’Enginyeria Mecànica i de la Construcció Industrial of the University of Girona.

Abstract
Most of the failures in structural elements in use are a consequence of mechanical fatigue. Therefore, fatigue is a decisive factor in designing durable mechanical elements. In laminated composite materials, the fatigue process involves different damage mechanisms that result in the degradation of the material. One of the most important damage mechanisms is the delamination between plies of the laminate. In aeronautical applications, composite plates are sensitive to impact and delamination occurs readily in composite laminates on impact. Many composite components have curved shapes, tapered thickness and plies with different orientations, which make the delamination grow with a mode mix that depends on the extent of the crack. Thus, delaminations generally grow under varying mode mix. It is therefore important to develop methods that can characterise subcritical, mixed-mode growth in fatigue delamination. The main objective of the present investigation is the characterisation of the variable mixed-mode delamination in composite laminates under fatigue conditions. To this end, a mixed-mode fatigue delamination model is proposed. Oppositely to the mixed-mode fatigue delamination models present in the literature, the proposed model takes into account the non-monotonic variation of the propagation parameters with the mode mix observed in different experimental data. Moreover, the mixed-mode end load split (MMELS) test, which main characteristic is that the propagation mode of the interlaminar crack varies with the crack extent, is analysed. Two theoretical approaches present in the literature are considered. However, the resulting expressions for the MMELS test are not equivalent and the differences between approaches can be up to 50 times. A more accurate alternative analysis of the MMELS test is carried out in the present study for comparison. The alternative analysis is based on the finite element method and the virtual crack closure technique. Significant findings are found for precise materials characterisation using the MMELS test. A MMELS test rig is also designed and built. Different specimens of essentially unidirectional carbon/epoxy laminates are tested for the experimental characterisation of fatigue delamination under varying mode mix. A fractographic analysis is also conducted in some of the delaminated fracture surfaces. The

ii
experimental results are compared to the predictions of a proposed model for the fatigue propagation of interlaminar cracks.
Acknowledgements /Agraïments/Agradecimentos
First of all, I would like to thank my advisor, Dr. Josep Costa, for his good advices and encouragement. I would like also to thank Dr. Kristofer Gamstedt for his inspiring enthusiasm and for being the alma mater of the present study and Dr. Federico París for providing the contact with the Dr. Gamstedt. Special thanks to Dr. Leif Asp for his collaboration and for providing the testing specimens and Mr. Hans Öberg for his essential help during the tests. Gràcies a tots els companys de l’àrea d’Enginyeria Mecànica, el departament d’Enginyeria Mecànica i de la Construcció Industrial i el grup de recerca AMADE de la Universitat de Girona, on m’ha estat possible dur a terme aquest treball. En especial, vull agrair la paciència i amistat del meu inseparable company de despatx Joan Andreu Mayugo, els divertits i profitosos moments compartits amb Víctor Martínez i Dani Trias, l’inmillorable dia a dia amb Albert Turon, Benigne Corbella, Jordi Renart i Pere Maimí, el cop de mà per part de María Luisa García-Romeu, l’intercanvi d’opinions amb Lluís Ripoll i el recolzament continu per part de Narcís Gascons, sense oblidar el bon record del nostre amic i company Joan Cabarrocas. I also would like to thank the rest of colleagues at Hållfasthetslära (KTH) for the great time I had in Stockholm, especially the Innebandy team (Alessandro, Anders, Lorant, Magnus, Martin, Mikael Johnson, Mikael Nygårds, Peter, Thomas) and, of course, Cristian. I cannot forget the good friends that made of Stockholm my second home: Janne, Martin, Kalle, Sofia, Maggie, Frida. Tack så mycket till alla. Agradecer a meus pais, Felipe e María, e a meus irmáns, María, Isolina, Matías e Àgata, o ánimo para chegar ata aquí e todos os: ¿Qué, fáltache moito? e ¿Qué, cando acabas? Finalment, el meu més sincer agraïment per la paciència, compressió i recolzament que tant m’han ajudat aquests darrers temps. Moltes gràcies Cris.

Contents
Chapter 1 Introduction ......................................................................................................11.1. Preamble..................................................................................................................11.2. Fibre reinforced polymers .......................................................................................21.3. Design of structural laminated elements...............................................................71.4. Degradation of composite materials.......................................................................91.5. Objective and scope of the study ..........................................................................10
Chapter 2 Delamination of composite laminates ...........................................................132.1. Introduction ...........................................................................................................132.2. Typology of FRP delaminations............................................................................132.3. Interlaminar cracks and linear elastic fracture mechanics ................................16
2.3.1. Basic analysis of interlaminar fracture toughness.......................................162.3.2. Fatigue crack growth .....................................................................................202.3.3. Fracture modes...............................................................................................22
2.4. Microscopic aspects ...............................................................................................232.5. Historical approaches............................................................................................27
2.5.1. The bimaterial interface crack problem........................................................282.5.2. Delamination and matrix cracking ...............................................................292.5.3. The study of delaminations using numerical methods ................................32
2.6. Composite delamination testing...........................................................................332.6.1. Mode I tests ....................................................................................................342.6.2. Mode II tests ...................................................................................................382.6.3. Mixed-mode I/II tests .....................................................................................422.6.4. Mode III tests..................................................................................................502.6.5. Loading systems in delamination tests.........................................................51
2.7. Mixed-mode delamination failure criteria ...........................................................52
Chapter 3 Fatigue delamination of composite laminates ..............................................613.1. Introduction ...........................................................................................................613.2. Fatigue growth of interlaminar cracks ................................................................623.3. Effect of R on fatigue delamination......................................................................663.4. Mixed-mode fatigue delamination models ...........................................................723.5. Non-monotonic variation of the propagation parameters...................................773.6. Non-monotonic mixed-mode fatigue delamination model...................................82
vi
3.7. Conclusions ........................................................................................................... 93
Chapter 4 Experimental fatigue crack growth under variable mode mix .................... 954.1. Introduction........................................................................................................... 954.2. The MMELS test................................................................................................... 964.3. MMELS apparatus ............................................................................................... 99
4.3.1. Test rig............................................................................................................ 994.3.2. Load system.................................................................................................. 102
4.4. MMELS test specimens and material................................................................ 108
Chapter 5 Analysis of the MMELS test........................................................................ 1155.1. Introduction......................................................................................................... 1155.2. Preamble of the analysis .................................................................................... 1165.3. Beam theory approach........................................................................................ 117
5.3.1. Simple beam theory ..................................................................................... 1175.3.2. Modified beam theory .................................................................................. 1255.3.3. Beam theory predictions for the MMELS test ........................................... 134
5.4. Orthotropic rescaling approach.......................................................................... 1425.4.1. Orthotropic rescaling technique.................................................................. 1425.4.2. Orthotropic rescaling equations for the MMELS test................................ 1465.4.3. Orthotropic rescaling predictions for the MMELS test ............................. 148
5.5. Comparison between the beam theory and orthotropic rescaling approaches 1575.6. The MMELS test as the superposition of DCB and ELS tests......................... 1655.7. Conclusions ......................................................................................................... 167
Chapter 6 Analysis of the MMELS test by means of the VCCT method.................... 1716.1. Introduction......................................................................................................... 1716.2. The virtual crack closure technique................................................................... 1726.3. Finite element model of the MMELS test ......................................................... 1766.4. Results of the VCCT analysis............................................................................. 1796.5. Conclusions ......................................................................................................... 195
Chapter 7 Experimental results and discussion .......................................................... 1997.1. Introduction......................................................................................................... 1997.2. Experimental procedure ..................................................................................... 1997.3. Experimental results .......................................................................................... 202
7.3.1. Experimental results of the η = 0.25 specimens ........................................ 2037.3.2. Experimental results of the η = 1 specimens ............................................. 221
7.4. Analysis of the results ........................................................................................ 2377.4.1. Analysis of the results for the η = 0.25 specimens..................................... 2397.4.2. Analysis of the results for the η = 1 specimens.......................................... 246
7.5. Fractographic analysis ....................................................................................... 255
vii
7.6. Comparison between the experimental results and the non-monotonic model ...................................................................................................................260
7.6.1. Comparison for the η = 0.25 specimens ......................................................2617.6.2. Comparison for the η = 1 specimens ...........................................................265
7.7. Conclusions..........................................................................................................269
Chapter 8 Final remarks ...............................................................................................2738.1. Summary .............................................................................................................2738.2. Conclusions..........................................................................................................2748.3. Suggestions for future investigations ................................................................277
Chapter 9 References .....................................................................................................279

Chapter 1 Introduction
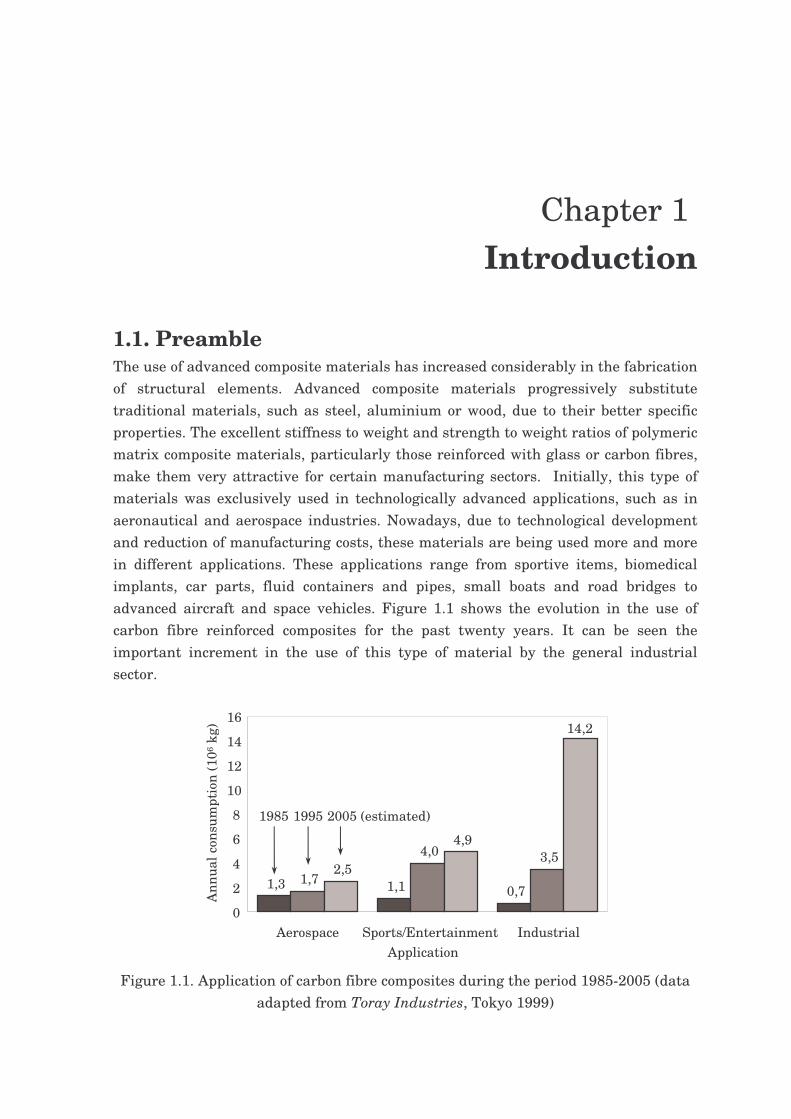
1.1. Preamble The use of advanced composite materials has increased considerably in the fabrication of structural elements. Advanced composite materials progressively substitute traditional materials, such as steel, aluminium or wood, due to their better specific properties. The excellent stiffness to weight and strength to weight ratios of polymeric matrix composite materials, particularly those reinforced with glass or carbon fibres, make them very attractive for certain manufacturing sectors. Initially, this type of materials was exclusively used in technologically advanced applications, such as in aeronautical and aerospace industries. Nowadays, due to technological development and reduction of manufacturing costs, these materials are being used more and more in different applications. These applications range from sportive items, biomedical implants, car parts, fluid containers and pipes, small boats and road bridges to advanced aircraft and space vehicles. Figure 1.1 shows the evolution in the use of carbon fibre reinforced composites for the past twenty years. It can be seen the important increment in the use of this type of material by the general industrial sector.
Figure 1.1. Application of carbon fibre composites during the period 1985-2005 (data
adapted from Toray Industries, Tokyo 1999)
1,3 1,1 0,71,7
4,0 3,5 2,5
4,9
14,2
0
2
4
6
8
10
12
14
16
Aerospace Sports/Entertainment Industrial Application
Ann
ual c
onsu
mpt
ion
(106
kg)
1985 1995 2005 (estimated)
2 Introduction
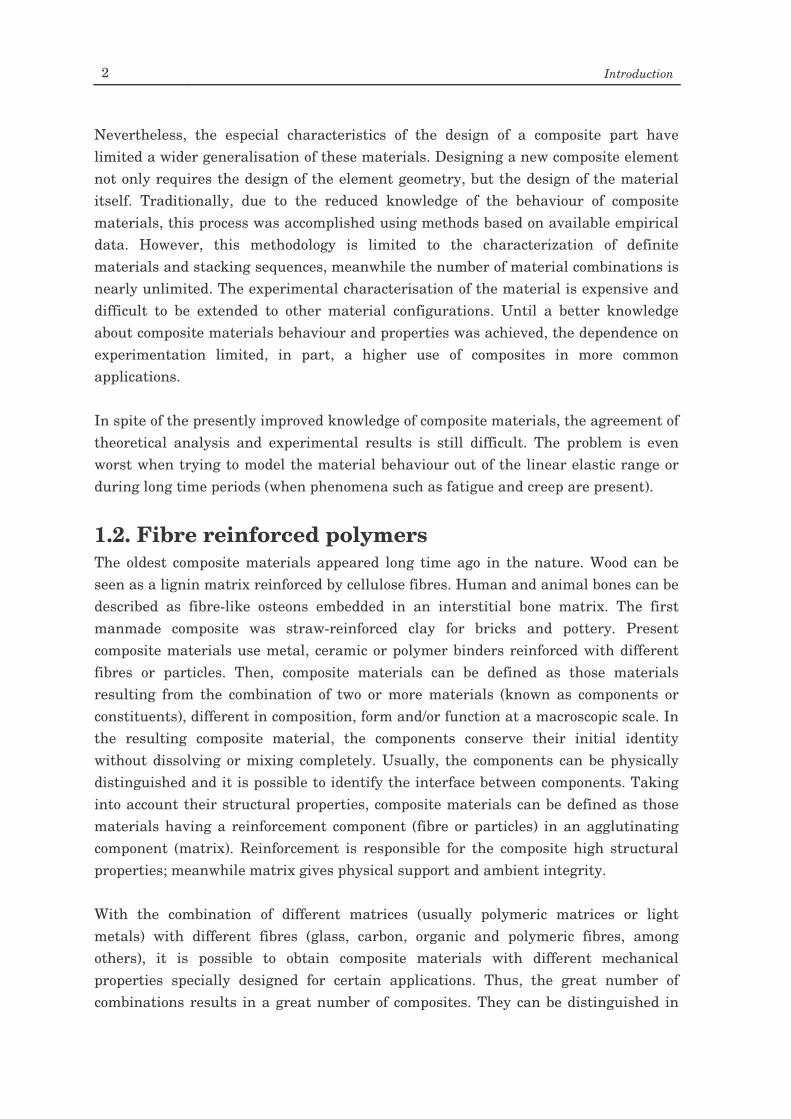
Nevertheless, the especial characteristics of the design of a composite part have limited a wider generalisation of these materials. Designing a new composite element not only requires the design of the element geometry, but the design of the material itself. Traditionally, due to the reduced knowledge of the behaviour of composite materials, this process was accomplished using methods based on available empirical data. However, this methodology is limited to the characterization of definite materials and stacking sequences, meanwhile the number of material combinations is nearly unlimited. The experimental characterisation of the material is expensive and difficult to be extended to other material configurations. Until a better knowledge about composite materials behaviour and properties was achieved, the dependence on experimentation limited, in part, a higher use of composites in more common applications. In spite of the presently improved knowledge of composite materials, the agreement of theoretical analysis and experimental results is still difficult. The problem is even worst when trying to model the material behaviour out of the linear elastic range or during long time periods (when phenomena such as fatigue and creep are present).
1.2. Fibre reinforced polymers The oldest composite materials appeared long time ago in the nature. Wood can be seen as a lignin matrix reinforced by cellulose fibres. Human and animal bones can be described as fibre-like osteons embedded in an interstitial bone matrix. The first manmade composite was straw-reinforced clay for bricks and pottery. Present composite materials use metal, ceramic or polymer binders reinforced with different fibres or particles. Then, composite materials can be defined as those materials resulting from the combination of two or more materials (known as components or constituents), different in composition, form and/or function at a macroscopic scale. In the resulting composite material, the components conserve their initial identity without dissolving or mixing completely. Usually, the components can be physically distinguished and it is possible to identify the interface between components. Taking into account their structural properties, composite materials can be defined as those materials having a reinforcement component (fibre or particles) in an agglutinating component (matrix). Reinforcement is responsible for the composite high structural properties; meanwhile matrix gives physical support and ambient integrity. With the combination of different matrices (usually polymeric matrices or light metals) with different fibres (glass, carbon, organic and polymeric fibres, among others), it is possible to obtain composite materials with different mechanical properties specially designed for certain applications. Thus, the great number of combinations results in a great number of composites. They can be distinguished in
Variable mixed-mode delamination in composite laminates under fatigue conditions: testing & analysis 3
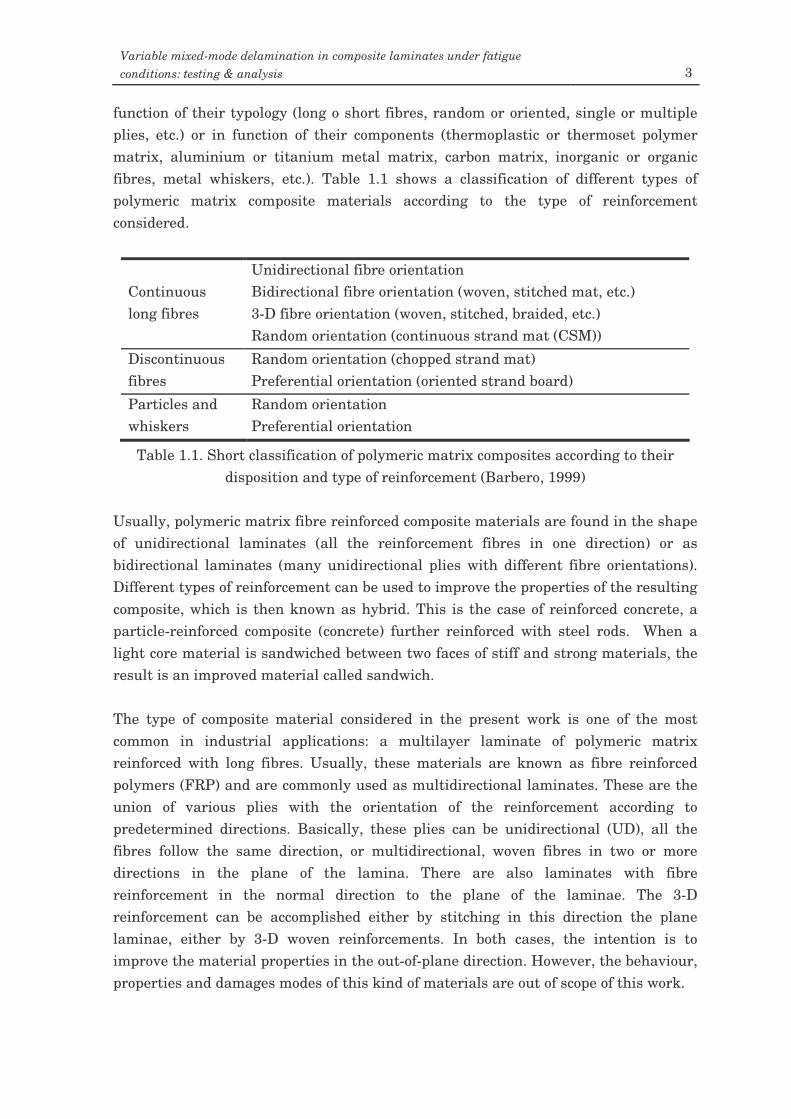
function of their typology (long o short fibres, random or oriented, single or multiple plies, etc.) or in function of their components (thermoplastic or thermoset polymer matrix, aluminium or titanium metal matrix, carbon matrix, inorganic or organic fibres, metal whiskers, etc.). Table 1.1 shows a classification of different types of polymeric matrix composite materials according to the type of reinforcement considered.
Continuous long fibres
Unidirectional fibre orientation Bidirectional fibre orientation (woven, stitched mat, etc.) 3-D fibre orientation (woven, stitched, braided, etc.) Random orientation (continuous strand mat (CSM))
Discontinuous fibres
Random orientation (chopped strand mat) Preferential orientation (oriented strand board)
Particles and whiskers
Random orientation Preferential orientation
Table 1.1. Short classification of polymeric matrix composites according to their disposition and type of reinforcement (Barbero, 1999)
Usually, polymeric matrix fibre reinforced composite materials are found in the shape of unidirectional laminates (all the reinforcement fibres in one direction) or as bidirectional laminates (many unidirectional plies with different fibre orientations). Different types of reinforcement can be used to improve the properties of the resulting composite, which is then known as hybrid. This is the case of reinforced concrete, a particle-reinforced composite (concrete) further reinforced with steel rods. When a light core material is sandwiched between two faces of stiff and strong materials, the result is an improved material called sandwich. The type of composite material considered in the present work is one of the most common in industrial applications: a multilayer laminate of polymeric matrix reinforced with long fibres. Usually, these materials are known as fibre reinforced polymers (FRP) and are commonly used as multidirectional laminates. These are the union of various plies with the orientation of the reinforcement according to predetermined directions. Basically, these plies can be unidirectional (UD), all the fibres follow the same direction, or multidirectional, woven fibres in two or more directions in the plane of the lamina. There are also laminates with fibre reinforcement in the normal direction to the plane of the laminae. The 3-D reinforcement can be accomplished either by stitching in this direction the plane laminae, either by 3-D woven reinforcements. In both cases, the intention is to improve the material properties in the out-of-plane direction. However, the behaviour, properties and damages modes of this kind of materials are out of scope of this work.
4 Introduction
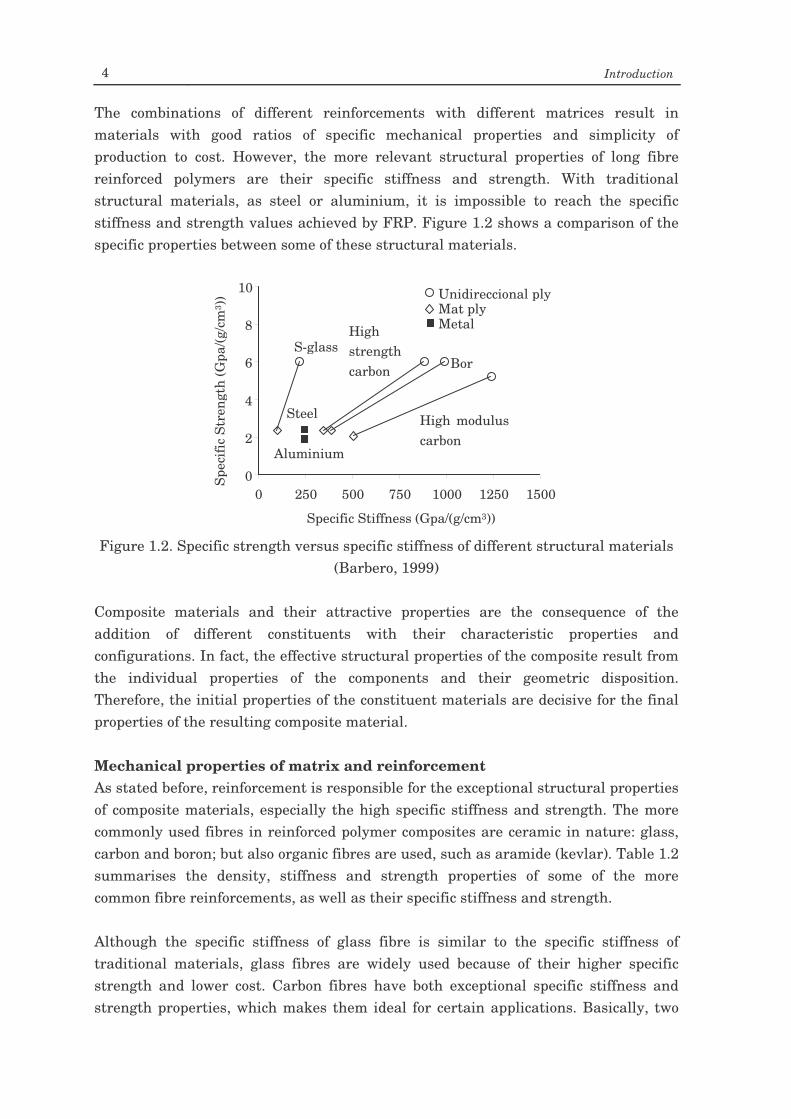
The combinations of different reinforcements with different matrices result in materials with good ratios of specific mechanical properties and simplicity of production to cost. However, the more relevant structural properties of long fibre reinforced polymers are their specific stiffness and strength. With traditional structural materials, as steel or aluminium, it is impossible to reach the specific stiffness and strength values achieved by FRP. Figure 1.2 shows a comparison of the specific properties between some of these structural materials.
Figure 1.2. Specific strength versus specific stiffness of different structural materials
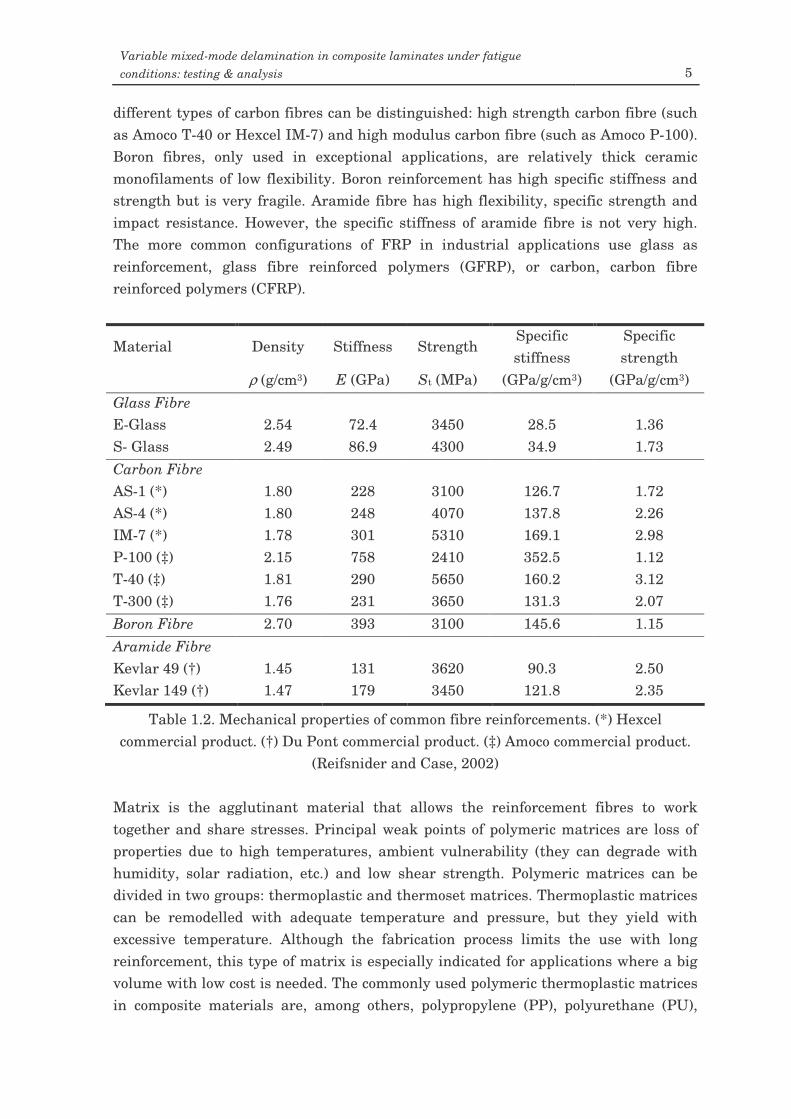
(Barbero, 1999) Composite materials and their attractive properties are the consequence of the addition of different constituents with their characteristic properties and configurations. In fact, the effective structural properties of the composite result from the individual properties of the components and their geometric disposition. Therefore, the initial properties of the constituent materials are decisive for the final properties of the resulting composite material. Mechanical properties of matrix and reinforcement As stated before, reinforcement is responsible for the exceptional structural properties of composite materials, especially the high specific stiffness and strength. The more commonly used fibres in reinforced polymer composites are ceramic in nature: glass, carbon and boron; but also organic fibres are used, such as aramide (kevlar). Table 1.2 summarises the density, stiffness and strength properties of some of the more common fibre reinforcements, as well as their specific stiffness and strength. Although the specific stiffness of glass fibre is similar to the specific stiffness of traditional materials, glass fibres are widely used because of their higher specific strength and lower cost. Carbon fibres have both exceptional specific stiffness and strength properties, which makes them ideal for certain applications. Basically, two
0
2
4
6
8
10
0 250 500 750 1000 1250 1500
Specific Stiffness (Gpa/(g/cm3))
Unidireccional ply Mat ply Metal
S-glass High strength carbon Bor
High modulus carbon
Aluminium
Steel
Spec
ific
Str
engt
h (G
pa/(g
/cm
3 ))
Variable mixed-mode delamination in composite laminates under fatigue conditions: testing & analysis 5
different types of carbon fibres can be distinguished: high strength carbon fibre (such as Amoco T-40 or Hexcel IM-7) and high modulus carbon fibre (such as Amoco P-100). Boron fibres, only used in exceptional applications, are relatively thick ceramic monofilaments of low flexibility. Boron reinforcement has high specific stiffness and strength but is very fragile. Aramide fibre has high flexibility, specific strength and impact resistance. However, the specific stiffness of aramide fibre is not very high. The more common configurations of FRP in industrial applications use glass as reinforcement, glass fibre reinforced polymers (GFRP), or carbon, carbon fibre reinforced polymers (CFRP).
Material Density Stiffness Strength Specific stiffness
Specific strength
ρ (g/cm3) E (GPa) St (MPa) (GPa/g/cm3) (GPa/g/cm3) Glass Fibre E-Glass 2.54 72.4 3450 28.5 1.36 S- Glass 2.49 86.9 4300 34.9 1.73 Carbon Fibre AS-1 (*) 1.80 228 3100 126.7 1.72 AS-4 (*) 1.80 248 4070 137.8 2.26 IM-7 (*) 1.78 301 5310 169.1 2.98 P-100 (‡) 2.15 758 2410 352.5 1.12 T-40 (‡) 1.81 290 5650 160.2 3.12 T-300 (‡) 1.76 231 3650 131.3 2.07 Boron Fibre 2.70 393 3100 145.6 1.15 Aramide Fibre Kevlar 49 (†) 1.45 131 3620 90.3 2.50 Kevlar 149 (†) 1.47 179 3450 121.8 2.35
Table 1.2. Mechanical properties of common fibre reinforcements. (*) Hexcel commercial product. (†) Du Pont commercial product. (‡) Amoco commercial product.
(Reifsnider and Case, 2002) Matrix is the agglutinant material that allows the reinforcement fibres to work together and share stresses. Principal weak points of polymeric matrices are loss of properties due to high temperatures, ambient vulnerability (they can degrade with humidity, solar radiation, etc.) and low shear strength. Polymeric matrices can be divided in two groups: thermoplastic and thermoset matrices. Thermoplastic matrices can be remodelled with adequate temperature and pressure, but they yield with excessive temperature. Although the fabrication process limits the use with long reinforcement, this type of matrix is especially indicated for applications where a big volume with low cost is needed. The commonly used polymeric thermoplastic matrices in composite materials are, among others, polypropylene (PP), polyurethane (PU),
6 Introduction
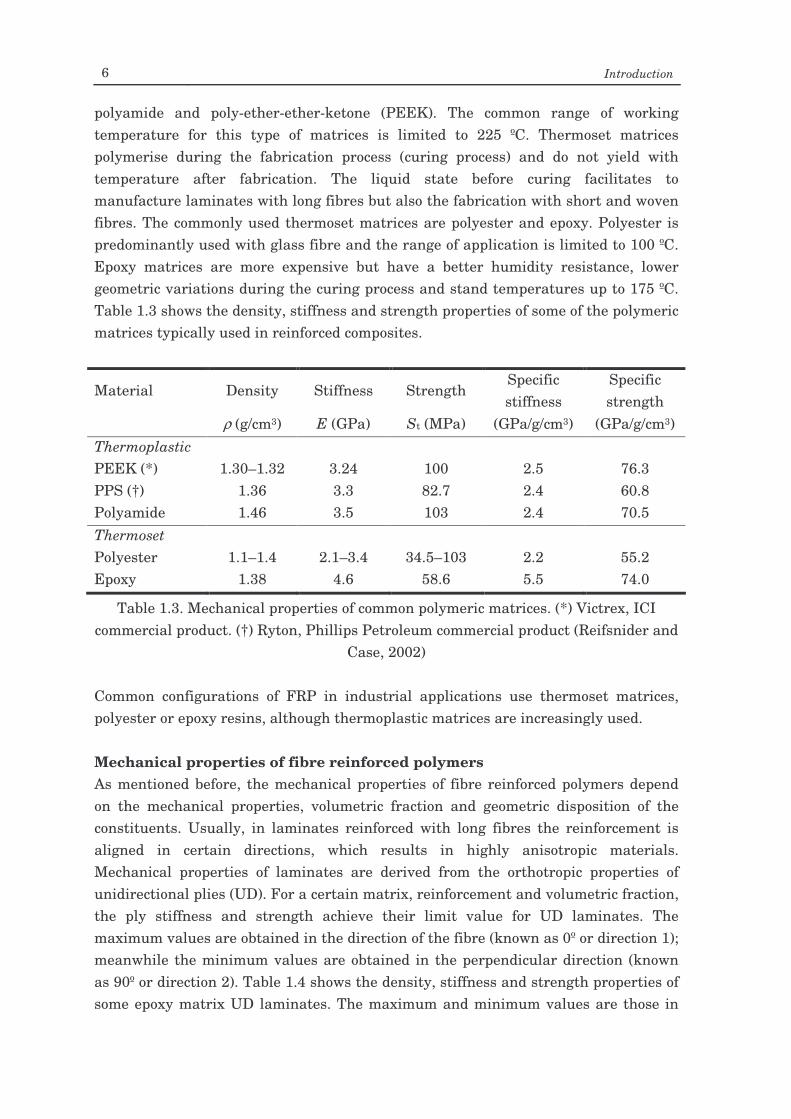
polyamide and poly-ether-ether-ketone (PEEK). The common range of working temperature for this type of matrices is limited to 225 ºC. Thermoset matrices polymerise during the fabrication process (curing process) and do not yield with temperature after fabrication. The liquid state before curing facilitates to manufacture laminates with long fibres but also the fabrication with short and woven fibres. The commonly used thermoset matrices are polyester and epoxy. Polyester is predominantly used with glass fibre and the range of application is limited to 100 ºC. Epoxy matrices are more expensive but have a better humidity resistance, lower geometric variations during the curing process and stand temperatures up to 175 ºC. Table 1.3 shows the density, stiffness and strength properties of some of the polymeric matrices typically used in reinforced composites.
Material Density Stiffness Strength Specific stiffness
Specific strength
ρ (g/cm3) E (GPa) St (MPa) (GPa/g/cm3) (GPa/g/cm3) Thermoplastic PEEK (*) 1.30–1.32 3.24 100 2.5 76.3 PPS (†) 1.36 3.3 82.7 2.4 60.8 Polyamide 1.46 3.5 103 2.4 70.5 Thermoset Polyester 1.1–1.4 2.1–3.4 34.5–103 2.2 55.2 Epoxy 1.38 4.6 58.6 5.5 74.0
Table 1.3. Mechanical properties of common polymeric matrices. (*) Victrex, ICI commercial product. (†) Ryton, Phillips Petroleum commercial product (Reifsnider and
Case, 2002) Common configurations of FRP in industrial applications use thermoset matrices, polyester or epoxy resins, although thermoplastic matrices are increasingly used. Mechanical properties of fibre reinforced polymers As mentioned before, the mechanical properties of fibre reinforced polymers depend on the mechanical properties, volumetric fraction and geometric disposition of the constituents. Usually, in laminates reinforced with long fibres the reinforcement is aligned in certain directions, which results in highly anisotropic materials. Mechanical properties of laminates are derived from the orthotropic properties of unidirectional plies (UD). For a certain matrix, reinforcement and volumetric fraction, the ply stiffness and strength achieve their limit value for UD laminates. The maximum values are obtained in the direction of the fibre (known as 0º or direction 1); meanwhile the minimum values are obtained in the perpendicular direction (known as 90º or direction 2). Table 1.4 shows the density, stiffness and strength properties of some epoxy matrix UD laminates. The maximum and minimum values are those in
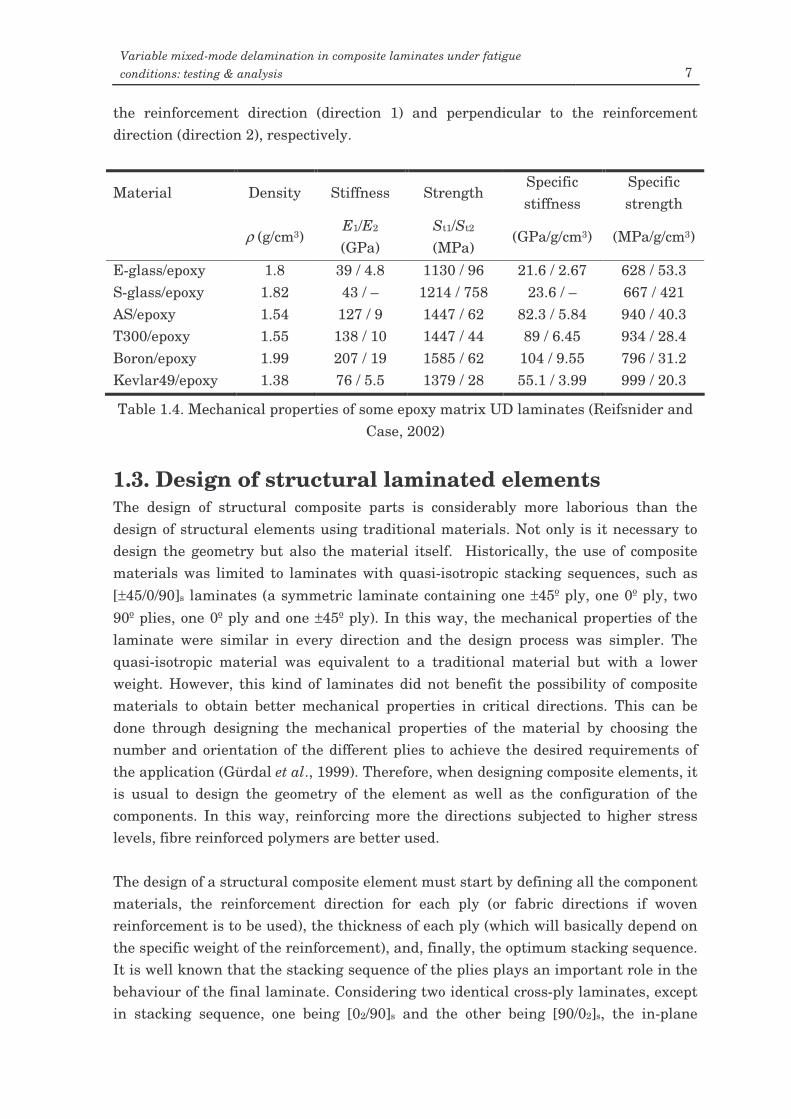
Variable mixed-mode delamination in composite laminates under fatigue conditions: testing & analysis 7
the reinforcement direction (direction 1) and perpendicular to the reinforcement direction (direction 2), respectively.
Material Density Stiffness Strength Specific stiffness
Specific strength
ρ (g/cm3) E1/E2 (GPa)
St1/St2
(MPa) (GPa/g/cm3) (MPa/g/cm3)
E-glass/epoxy 1.8 39 / 4.8 1130 / 96 21.6 / 2.67 628 / 53.3 S-glass/epoxy 1.82 43 / – 1214 / 758 23.6 / – 667 / 421 AS/epoxy 1.54 127 / 9 1447 / 62 82.3 / 5.84 940 / 40.3 T300/epoxy 1.55 138 / 10 1447 / 44 89 / 6.45 934 / 28.4 Boron/epoxy 1.99 207 / 19 1585 / 62 104 / 9.55 796 / 31.2 Kevlar49/epoxy 1.38 76 / 5.5 1379 / 28 55.1 / 3.99 999 / 20.3
Table 1.4. Mechanical properties of some epoxy matrix UD laminates (Reifsnider and Case, 2002)
1.3. Design of structural laminated elements The design of structural composite parts is considerably more laborious than the design of structural elements using traditional materials. Not only is it necessary to design the geometry but also the material itself. Historically, the use of composite materials was limited to laminates with quasi-isotropic stacking sequences, such as [±45/0/90]s laminates (a symmetric laminate containing one ±45º ply, one 0º ply, two 90º plies, one 0º ply and one ±45º ply). In this way, the mechanical properties of the laminate were similar in every direction and the design process was simpler. The quasi-isotropic material was equivalent to a traditional material but with a lower weight. However, this kind of laminates did not benefit the possibility of composite materials to obtain better mechanical properties in critical directions. This can be done through designing the mechanical properties of the material by choosing the number and orientation of the different plies to achieve the desired requirements of the application (Gürdal et al., 1999). Therefore, when designing composite elements, it is usual to design the geometry of the element as well as the configuration of the components. In this way, reinforcing more the directions subjected to higher stress levels, fibre reinforced polymers are better used. The design of a structural composite element must start by defining all the component materials, the reinforcement direction for each ply (or fabric directions if woven reinforcement is to be used), the thickness of each ply (which will basically depend on the specific weight of the reinforcement), and, finally, the optimum stacking sequence. It is well known that the stacking sequence of the plies plays an important role in the behaviour of the final laminate. Considering two identical cross-ply laminates, except in stacking sequence, one being [02/90]s and the other being [90/02]s, the in-plane
8 Introduction
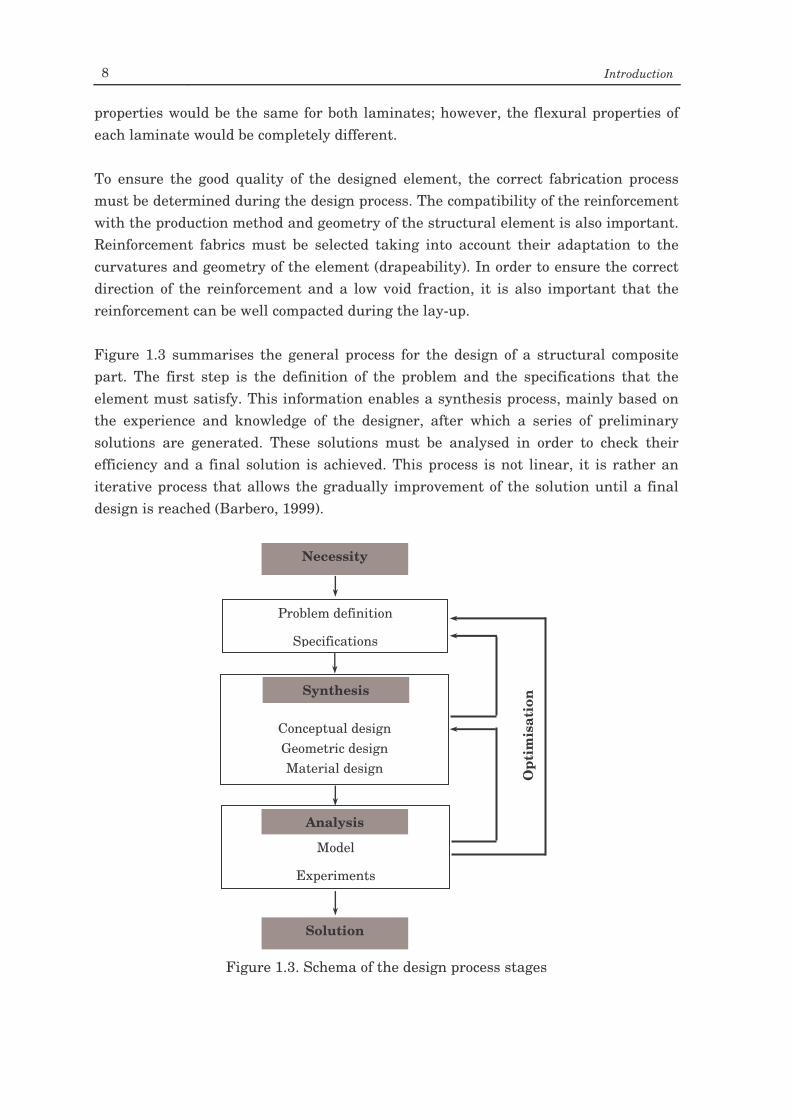
properties would be the same for both laminates; however, the flexural properties of each laminate would be completely different. To ensure the good quality of the designed element, the correct fabrication process must be determined during the design process. The compatibility of the reinforcement with the production method and geometry of the structural element is also important. Reinforcement fabrics must be selected taking into account their adaptation to the curvatures and geometry of the element (drapeability). In order to ensure the correct direction of the reinforcement and a low void fraction, it is also important that the reinforcement can be well compacted during the lay-up. Figure 1.3 summarises the general process for the design of a structural composite part. The first step is the definition of the problem and the specifications that the element must satisfy. This information enables a synthesis process, mainly based on the experience and knowledge of the designer, after which a series of preliminary solutions are generated. These solutions must be analysed in order to check their efficiency and a final solution is achieved. This process is not linear, it is rather an iterative process that allows the gradually improvement of the solution until a final design is reached (Barbero, 1999).
Figure 1.3. Schema of the design process stages
Necessity
Problem definition
Specifications
Synthesis
Model
Experiments
Analysis
Solution
Opt
imis
atio
n
Conceptual design Geometric design Material design
Variable mixed-mode delamination in composite laminates under fatigue conditions: testing & analysis 9
Traditionally, the design process, including synthesis and analysis, has been based on empirical knowledge. However, the number of combinations in composite materials is almost unlimited and experimental characterisation becomes difficult and expensive. The dependence of composite materials on experimentation restricts a more extensive use of composites in usual applications. Nowadays, the use of mathematical models and numerical methods to predict and simulate composites behaviour seems to be a good way for the analysis in the design process. However, these design tools must rely on the physics and micromechanical aspects of the material to be effective.
1.4. Degradation of composite materials The majority of the mechanical and structural elements in service are under the effect of loads of variable amplitude. Mechanical fatigue and the resulting degradation of the material are responsible for most of the failures. Thus, fatigue must be a decisive factor for durable design of mechanical and structural elements. Nowadays, the design of structural elements using different types of fibres as reinforcements of polymeric matrices is the base of most of the actual laminated structures. Therefore, in most of these applications it is necessary to know and predict the behaviour of the laminate under loads of variable amplitude. Traditionally the design of composite structural elements able to stand the effect of cyclic loads has been done following a traditional and semi-empirical approach based on laboratory tests of the material. However, this methodology is limited to the characterisation of particular stacking sequences, while the number of material combinations is nearly unlimited. Moreover, the fatigue degradation of traditional materials is different to the fatigue degradation of composite laminates, due to the anisotropic behaviour and the intrinsic non-homogeneity of the latter. The mechanical fatigue degradation in metallic materials is determined by the growth of a principal crack until it reaches a critical size. In laminated composite materials, the fatigue process involves different non-localised damage mechanisms, dispersed damage, which result in degradation of the material. The more usual damage mechanisms of laminated composite materials are fibre breaking, fibre buckling, transversal matrix cracks, debond between fibre and matrix and debond of two adjacent plies of the laminate. The debonding of two adjacent plies of the laminate, more commonly referred as delamination, is one of the most important damage mechanisms in failure of composite laminates. Moreover, delamination is the damage mechanism that more influence has in the material degradation under fatigue. The study of delaminations is of great importance not only for the reduction of the material strength and stiffness that they imply, but also for the difficulties in detecting them under service conditions. Delamination is prone to form in the interior of the laminate by curved shapes or abrupt changes in the laminate, under impact events, residual stresses, etc.
10 Introduction
The appearance of an interlaminar crack, or delamination, does not necessarily mean that the structural element is not further capable of sustaining any loading, but it implies an important reduction in functionality. Delaminations facilitate a premature buckling of the structure, a direct way for moisture to enter the laminate, a stiffness degradation, excessive vibration, a reduction in the fatigue life of the component, etc. As this damage mechanism can form between two inner plies of the laminate, it is not an easy task to detect these interlaminar cracks and avoid further degradation of the material. These main problems related to composite delaminations prevent an extensive use of fibre reinforced composites in certain fields, such as aeronautical applications. In spite of the many research studies and publications on the subject, delamination failures in composites still are not well understood. Actually, according to Pagano and Schoeppner (2000), this damage mode has often been referred to as the most feared failure mode to attack a structural composite. In laminated composites subjected to service loads, delamination is the major life limiting damage mechanism (Wang, 1983; Chan, 1992; Carlsson and Byron Pipes, 1997). In addition, interlaminar cracks are considered as the most critical type of damage under compression loads (Abrate, 1991; Abrate, 1994; Pavier and Clarke, 1996).
1.5. Objective and scope of the study On the one hand, it is generally accepted that delamination is the most harmful damage mode in composite laminates. On the other hand, fatigue is responsible for the majority of the structural failures. The combination of both factors must be the object of rigorous studies in order to gain a major comprehension about the behaviour of these materials. In this way, a better characterisation of material properties and behaviour can be achieved and structural composite parts designed in a more efficient way. Delamination represents a crack-like discontinuity between the plies, interlaminar crack, which can propagate under the effect of mechanical, thermal and hygrometric loads. Therefore, fracture mechanics is a useful tool for approaching composite delaminations. In addition, fracture mechanics is a suitable approach to deal with materials selection and structural integrity when interlaminar cracks are involved. As it will be explained later, fracture mechanics of composite materials is mostly based on the measure of the strain energy release rate, G. Consequently, this study is found on these concepts. Although the interlaminar damage mechanism should be taken into account during the design process of a composite structure, nowadays the prediction of delamination onset and/or growth is, however, difficult. Predictions must rely on accurate interlaminar toughness material data, both for static and fatigue loading but also for different environmental conditions. Due to the differences in propagation modes
Variable mixed-mode delamination in composite laminates under fatigue conditions: testing & analysis 11
shown by delaminations in real structures, toughness data must comprise pure mode I, pure mode II, as well as different degrees of mixed-mode I/II. Moreover, during the growth of an interlaminar crack in a real component or structure, the propagation mode varies continuously with the delamination extent. Usually, the mode mix varies from a major component of mode I to a more important contribution of mode II. The aim and object of this work is to investigate propagation of composite delaminations under a continuously varying mode mix I/II. To this end, different mixed-mode models of fatigue delamination growth are analysed and compared. Because of this comparison, a new model is proposed. A variable mixed-mode delamination test is also analysed, built and used to characterise the fatigue delamination of a composite laminate under varying mode mix. The work is organised as follows: Chapter 2, following this introduction, includes an overview on the current state of delamination knowledge in composite laminates under static loading conditions. The review comprehends from basic and micromechanical aspects of composite delaminations, to the characterisation of interlaminar cracks by means of fracture mechanics and a description of the most commonly used delamination tests. Finally, a short review on fracture crack models is included. Chapter 3 presents an overview on fatigue delamination onset and propagation in composite laminates. The effect of different parameters on the fatigue propagation of interlaminar cracks is also discussed. The chapter also includes a short review on mixed-mode models for fatigue growth of composite delaminations. All these models assume a monotonic variation of the propagation parameters with the mode mix. When compared to experimental data present in the literature, low agreement is encountered. A new model for the fatigue delamination of composite laminated structures is proposed. The main distinctive characteristic of the proposed model is the assumption of a non-monotonic variation of the parameters with the mode mix. Chapter 4 describes the design of the load system and test rig for the mixed-mode end load split delamination test (MMELS). The test is used for the experimental characterisation of fatigue delaminations under varying mode mix. The designed test rig does not introduce axial forces on the test specimen, while the specific length of the specimen does not vary. The load hinge is designed to apply the external load centred with the neutral axis of the loaded beam of the specimen. The hinge can be adjusted to specimens of different thicknesses. Thus, some non-linear effects can be neglected during the tests. The characteristics and preparation of the test specimens are also described. Basic parameters for the test are included.
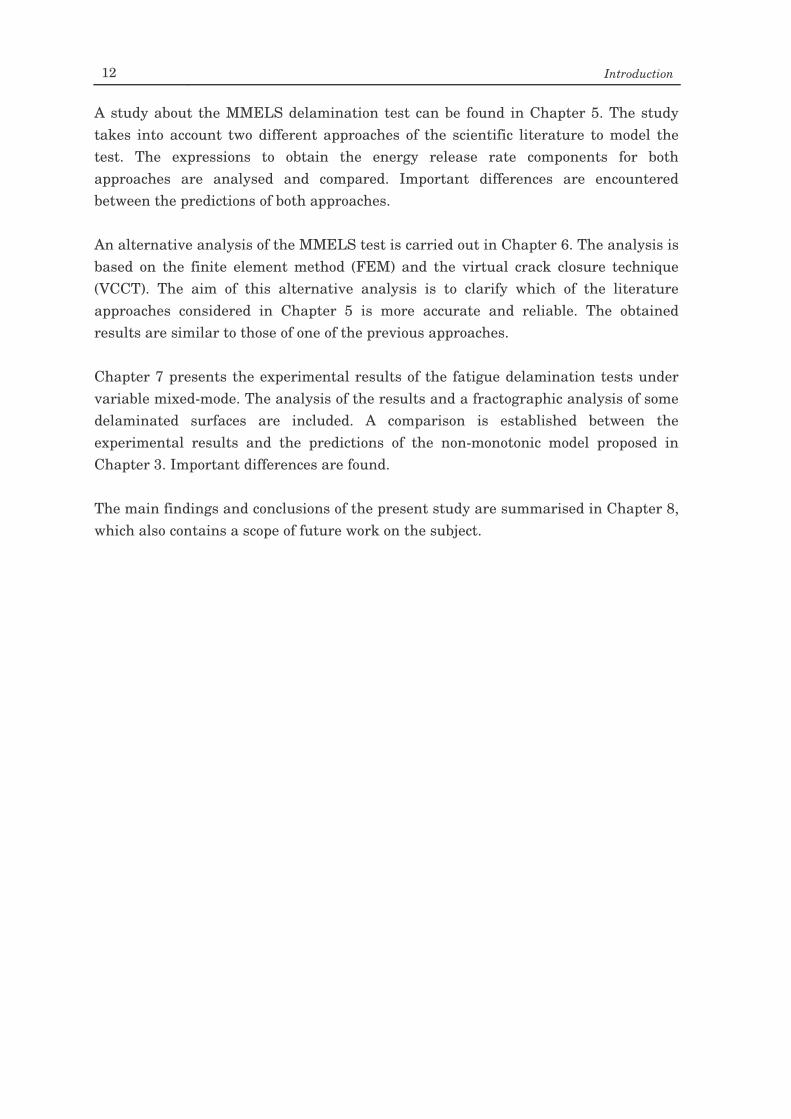
12 Introduction
A study about the MMELS delamination test can be found in Chapter 5. The study takes into account two different approaches of the scientific literature to model the test. The expressions to obtain the energy release rate components for both approaches are analysed and compared. Important differences are encountered between the predictions of both approaches. An alternative analysis of the MMELS test is carried out in Chapter 6. The analysis is based on the finite element method (FEM) and the virtual crack closure technique (VCCT). The aim of this alternative analysis is to clarify which of the literature approaches considered in Chapter 5 is more accurate and reliable. The obtained results are similar to those of one of the previous approaches. Chapter 7 presents the experimental results of the fatigue delamination tests under variable mixed-mode. The analysis of the results and a fractographic analysis of some delaminated surfaces are included. A comparison is established between the experimental results and the predictions of the non-monotonic model proposed in Chapter 3. Important differences are found. The main findings and conclusions of the present study are summarised in Chapter 8, which also contains a scope of future work on the subject.
Chapter 2 Delamination of
composite laminates
2.1. Introduction In the previous chapter, it has been stated that the main objective of the present work is the study of fatigue delamination growth in composite laminates under varying mode mix. However, before analysing the fatigue behaviour of interlaminar cracks, it is necessary to address the principles of the delamination mechanics, the onset and propagation of interlaminar cracks under static conditions, the interaction of delamination with other micromechanisms of composite laminates, etc. In this way, a better understanding of the phenomenon can be achieved. This chapter includes a sort of review on basic aspects of composite delaminations. The aspects related to the fatigue propagation of interlaminar cracks are considered in Chapter 3. The review starts taking into account a classification of interlaminar cracks and continues with the application of fracture mechanics basic concepts. Next, an overview on microscopic aspects of composite delaminations is considered. The historical approaches to the characterisation of this phenomenon under static conditions are also presented and briefly discussed. A short review on common testing procedures for the characterisation of composite delaminations is included. The different tests are shortly described and brief discussions are included for the more commonly used. Finally, the more relevant mixed-mode delamination failure criteria are presented and discussed.
2.2. Typology of FRP delaminations Crack formation between two adjacent plies, or delamination, is a damage mechanism of composite laminates that can form during any moment of the life of the structure: manufacturing, transport, mounting and service. According to Kedward (1995) and Pagano and Schoeppner (2000) the technological causes of the delamination can be grouped in two categories. The first category includes delaminations due to curved sections, such as curved segments, tubular sections, cylinders and spheres, and
14 Delamination of composite laminates
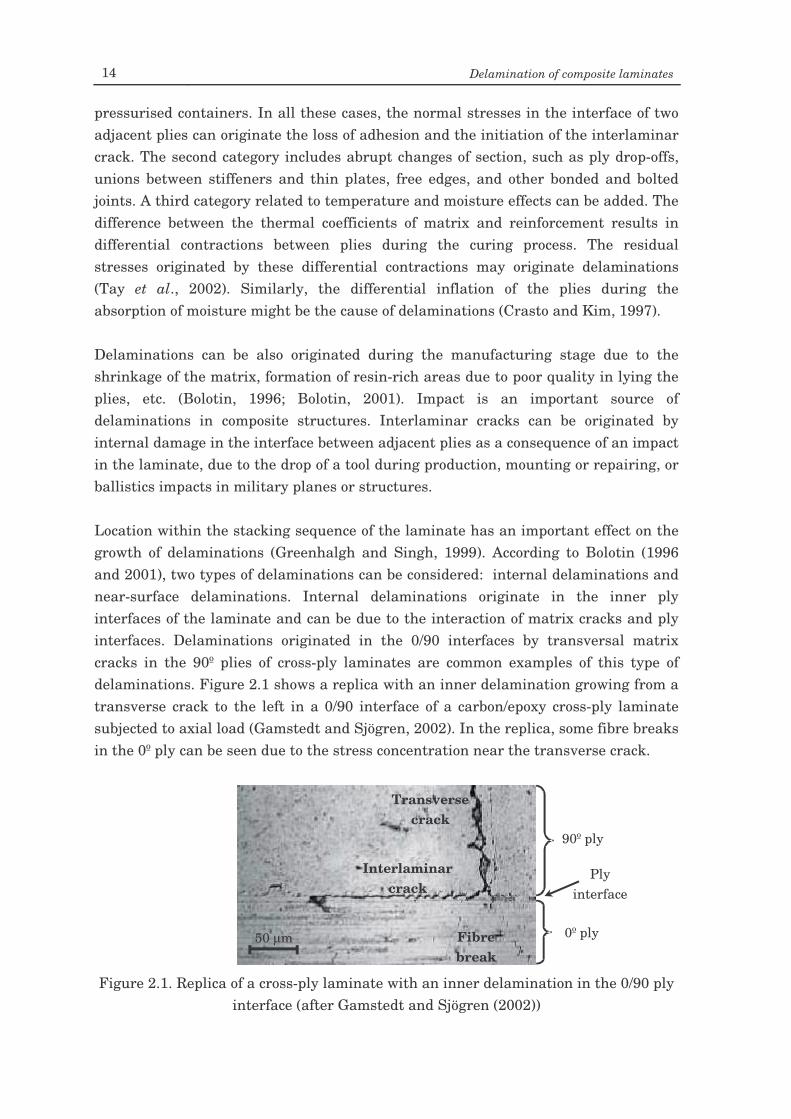
pressurised containers. In all these cases, the normal stresses in the interface of two adjacent plies can originate the loss of adhesion and the initiation of the interlaminar crack. The second category includes abrupt changes of section, such as ply drop-offs, unions between stiffeners and thin plates, free edges, and other bonded and bolted joints. A third category related to temperature and moisture effects can be added. The difference between the thermal coefficients of matrix and reinforcement results in differential contractions between plies during the curing process. The residual stresses originated by these differential contractions may originate delaminations (Tay et al., 2002). Similarly, the differential inflation of the plies during the absorption of moisture might be the cause of delaminations (Crasto and Kim, 1997). Delaminations can be also originated during the manufacturing stage due to the shrinkage of the matrix, formation of resin-rich areas due to poor quality in lying the plies, etc. (Bolotin, 1996; Bolotin, 2001). Impact is an important source of delaminations in composite structures. Interlaminar cracks can be originated by internal damage in the interface between adjacent plies as a consequence of an impact in the laminate, due to the drop of a tool during production, mounting or repairing, or ballistics impacts in military planes or structures. Location within the stacking sequence of the laminate has an important effect on the growth of delaminations (Greenhalgh and Singh, 1999). According to Bolotin (1996 and 2001), two types of delaminations can be considered: internal delaminations and near-surface delaminations. Internal delaminations originate in the inner ply interfaces of the laminate and can be due to the interaction of matrix cracks and ply interfaces. Delaminations originated in the 0/90 interfaces by transversal matrix cracks in the 90º plies of cross-ply laminates are common examples of this type of delaminations. Figure 2.1 shows a replica with an inner delamination growing from a transverse crack to the left in a 0/90 interface of a carbon/epoxy cross-ply laminate subjected to axial load (Gamstedt and Sjögren, 2002). In the replica, some fibre breaks in the 0º ply can be seen due to the stress concentration near the transverse crack.
Figure 2.1. Replica of a cross-ply laminate with an inner delamination in the 0/90 ply
interface (after Gamstedt and Sjögren (2002))
50 µm 0º ply
Ply interface
Transverse crack
Interlaminar crack
Fibre break
90º ply
Variable mixed-mode delamination in composite laminates under fatigue conditions: testing & analysis 15
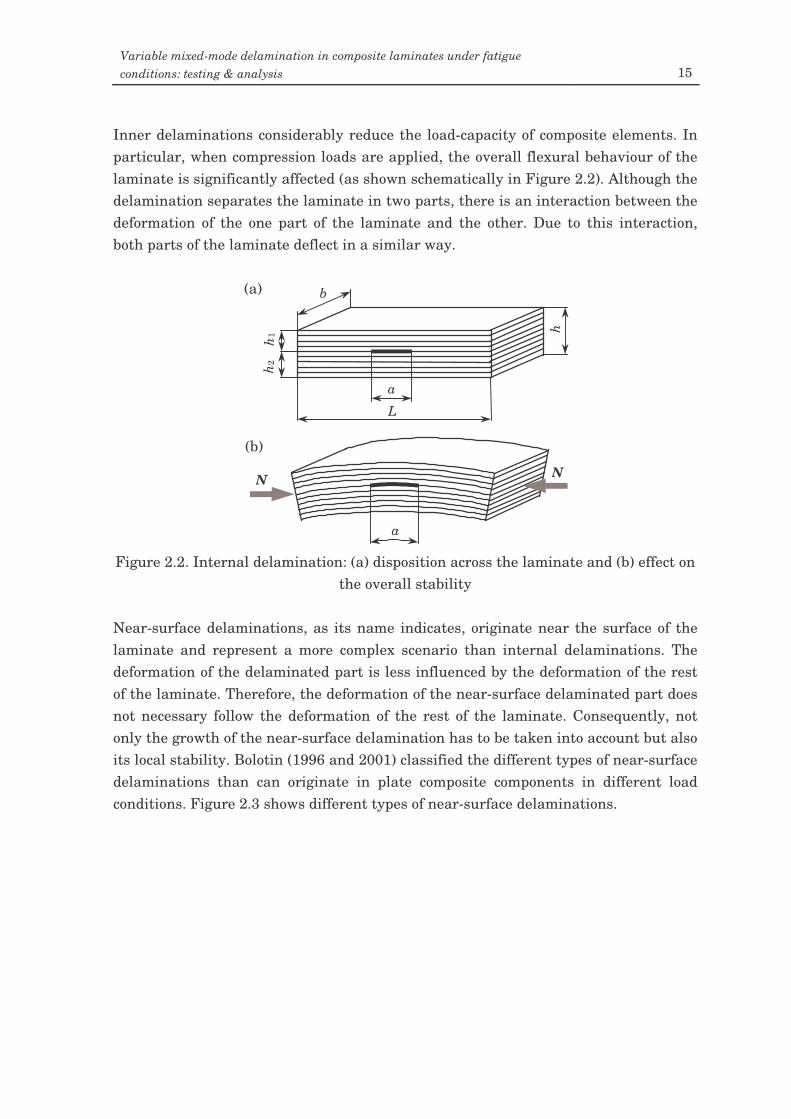
Inner delaminations considerably reduce the load-capacity of composite elements. In particular, when compression loads are applied, the overall flexural behaviour of the laminate is significantly affected (as shown schematically in Figure 2.2). Although the delamination separates the laminate in two parts, there is an interaction between the deformation of the one part of the laminate and the other. Due to this interaction, both parts of the laminate deflect in a similar way.
Figure 2.2. Internal delamination: (a) disposition across the laminate and (b) effect on
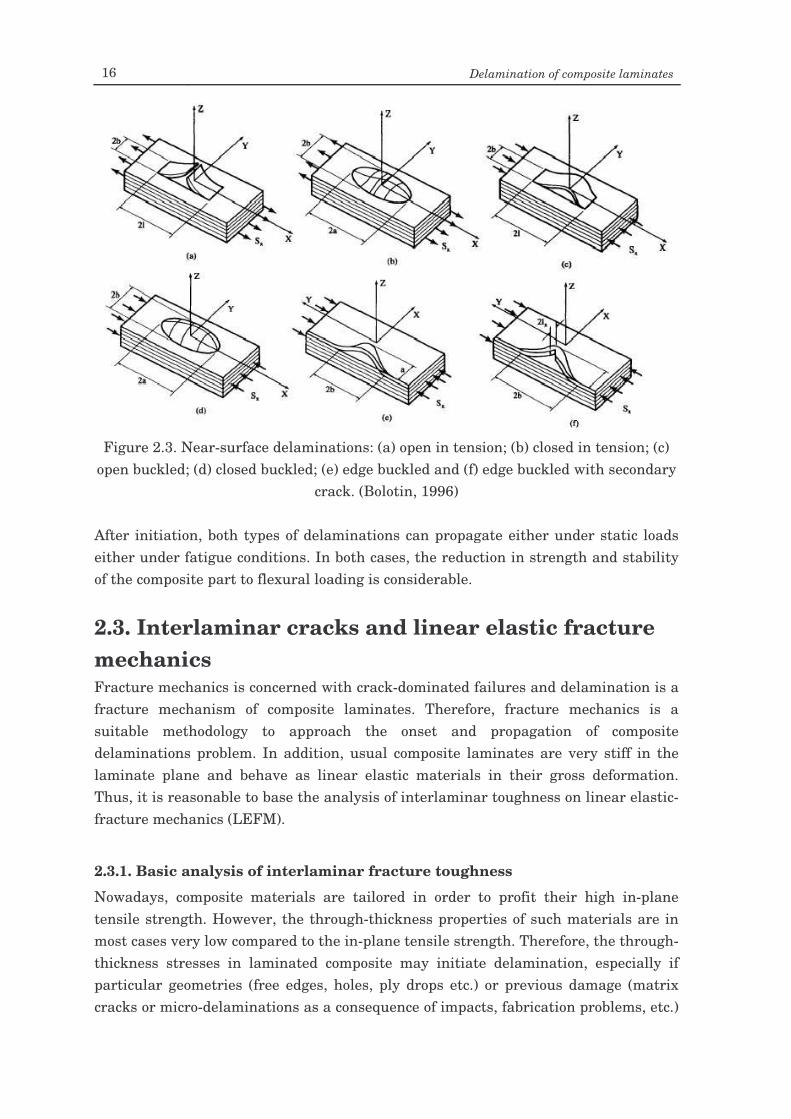
the overall stability Near-surface delaminations, as its name indicates, originate near the surface of the laminate and represent a more complex scenario than internal delaminations. The deformation of the delaminated part is less influenced by the deformation of the rest of the laminate. Therefore, the deformation of the near-surface delaminated part does not necessary follow the deformation of the rest of the laminate. Consequently, not only the growth of the near-surface delamination has to be taken into account but also its local stability. Bolotin (1996 and 2001) classified the different types of near-surface delaminations than can originate in plate composite components in different load conditions. Figure 2.3 shows different types of near-surface delaminations.
L
b
h 2
a
h
h 1
(a)
N N
(b)
a
16 Delamination of composite laminates
Figure 2.3. Near-surface delaminations: (a) open in tension; (b) closed in tension; (c)
open buckled; (d) closed buckled; (e) edge buckled and (f) edge buckled with secondary crack. (Bolotin, 1996)
After initiation, both types of delaminations can propagate either under static loads either under fatigue conditions. In both cases, the reduction in strength and stability of the composite part to flexural loading is considerable.
2.3. Interlaminar cracks and linear elastic fracture mechanics Fracture mechanics is concerned with crack-dominated failures and delamination is a fracture mechanism of composite laminates. Therefore, fracture mechanics is a suitable methodology to approach the onset and propagation of composite delaminations problem. In addition, usual composite laminates are very stiff in the laminate plane and behave as linear elastic materials in their gross deformation. Thus, it is reasonable to base the analysis of interlaminar toughness on linear elastic-fracture mechanics (LEFM).
2.3.1. Basic analysis of interlaminar fracture toughness
Nowadays, composite materials are tailored in order to profit their high in-plane tensile strength. However, the through-thickness properties of such materials are in most cases very low compared to the in-plane tensile strength. Therefore, the through-thickness stresses in laminated composite may initiate delamination, especially if particular geometries (free edges, holes, ply drops etc.) or previous damage (matrix cracks or micro-delaminations as a consequence of impacts, fabrication problems, etc.)
Variable mixed-mode delamination in composite laminates under fatigue conditions: testing & analysis 17
are present in the material (Robinson and Hogkinson, 2000). After delamination onset, the consequent propagation is not controlled by the through-thickness strength any more but by the interlaminar fracture toughness. If the interlaminar toughness is expressed in terms of energy release rate, the delamination will propagate when the energy release rate achieves a critical value, Gc. According to Hashemi et al. (1990a), for any form of elastic behaviour, the energy release rate can be expressed as a function of the increment of external work Ue, strain energy Us (kinetic energy is ignored in this case) and crack increment ∆a. Therefore, for a crack of width b and length a, the energy release rate can be expressed as
∆∆
−∆
∆=
aU
aU
bG se1 (2.1)
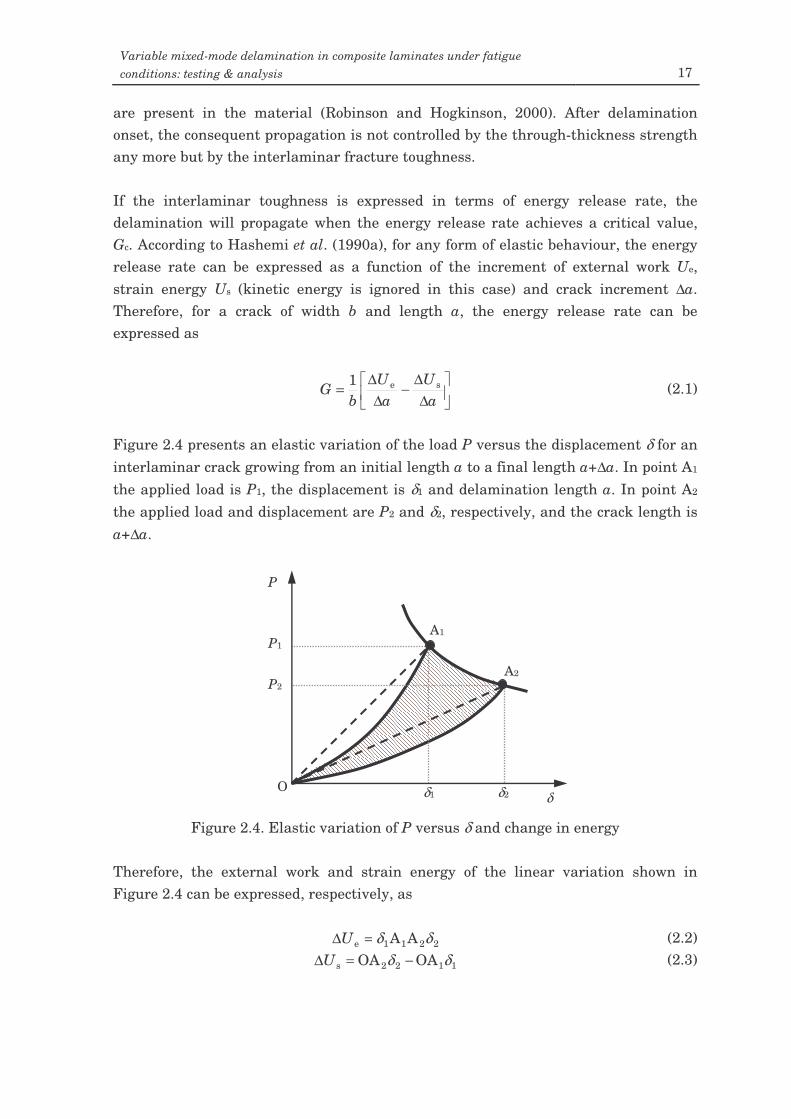
Figure 2.4 presents an elastic variation of the load P versus the displacement δ for an interlaminar crack growing from an initial length a to a final length a+∆a. In point A1 the applied load is P1, the displacement is δ1 and delamination length a. In point A2 the applied load and displacement are P2 and δ2, respectively, and the crack length is a+∆a.
Figure 2.4. Elastic variation of P versus δ and change in energy
Therefore, the external work and strain energy of the linear variation shown in Figure 2.4 can be expressed, respectively, as
2211e AA δδ=∆U (2.2)
1122s OAOA δδ −=∆U (2.3)
P
O
P1
δ1 δ2 δ
A1
A2 P2
18 Delamination of composite laminates
The change in energy is determined by the area OA1A2 (dashed area in the figure). If linear deformation behaviour is assumed, the straight lines showed in the figure are to be used and the change in energy becomes
21221
seδδ PP
UUU−
=∆−∆=∆ (2.4)
For the considered crack increment and width, the increment in crack area would be b∆a. Thus, as the critical energy release rate can be defined as the change in energy per unit of new crack surface and denoting P1 as P, P2 as P+∆P, δ1 as δ and δ2 as δ+∆δ, the expression for Gc can be written as
( ) ( )ab
PPPG∆
∆+−∆+=2c
δδδ (2.5)
The compliance of the system depends on the crack length and is defined as
PC δ= (2.6)
Taking into account the increments of load and displacement and equation (2.6), the increment in displacement can be expressed as
PCCP ∆+∆=∆δ (2.7) and combining equations (2.5) and (2.7) a final expression for the critical energy release rate can be found after mathematical manipulation as:
abCPG
∆∆=
2
2
c (2.8)
or in differential form as
aC
bPG
dd
2
2
c = (2.9)
For the experimental study of interlaminar crack propagation in composite materials, the variation of the applied load with respect the obtained displacement, as shown in Figure 2.4, is basic. This experimental data, together with the crack length, is the basis for the calculation of G and the generation of the R-curve. However, the experimental determination of the onset and propagation values of G for an interlaminar crack is complicated and different methods can be used. The first method is based in the determination of Gc by visual observation of the crack onset.
Variable mixed-mode delamination in composite laminates under fatigue conditions: testing & analysis 19
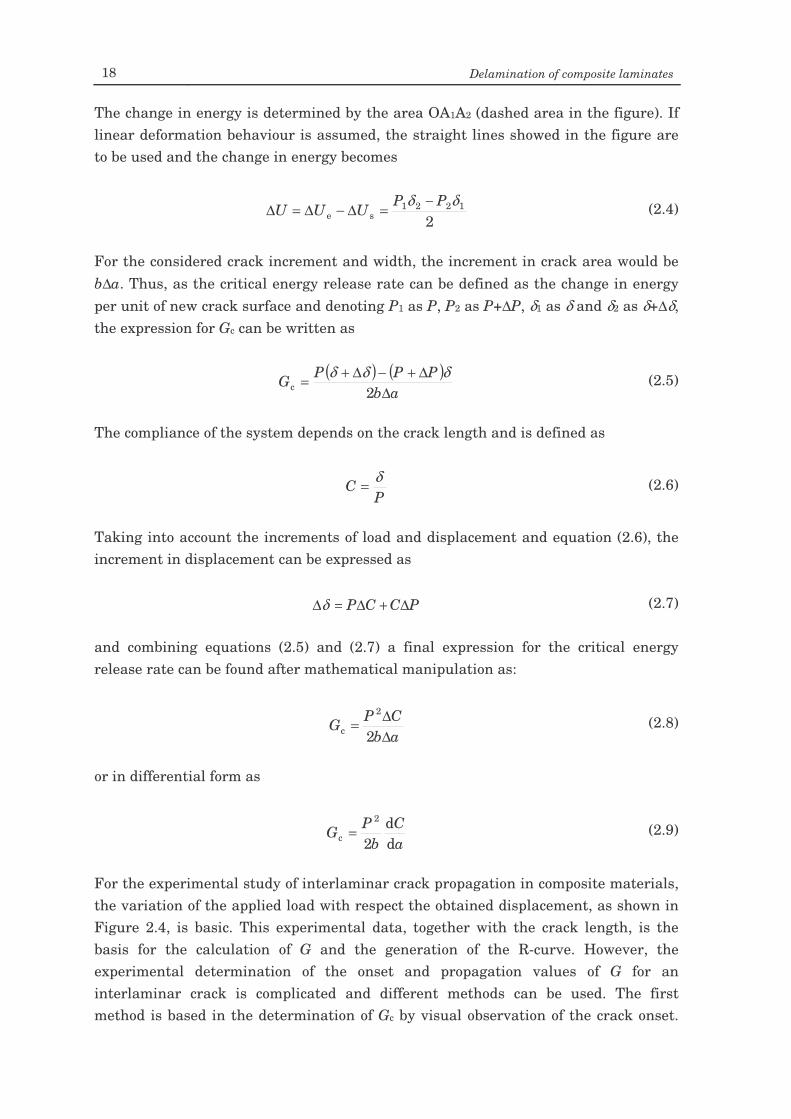
Nevertheless, this method is imprecise and highly dependent on the observer. The second method is based on the calculation of Gc at the point of non-linearity of the load-displacement curve. According to Robinson and Hodgkinson (2000), for brittle matrix composites the non-linearity point coincides with the point at which the initiation of the crack can be observed (see Figure 2.5(a)). However, for tough matrices a region of non-linear behaviour may precede the observation of the crack initiation (see Figure 2.5(b)). In the third method, Gc is determined as the intersection between the load-displacement curve and the line that corresponds to an increase by the 5 % to the original compliance of the system. If the maximum load occurs before intersection, then the maximum load and corresponding displacement are used to compute Gc.
Figure 2.5. Load-displacement curve for stable crack growth in (a) brittle matrix and
(b) tough matrix The load-displacement curves represented in Figure 2.5 are for stable crack growth cases. Unstable crack growth is characterised by one or more periods without crack propagation (or very slow) followed by rapid propagations, which results in sharp drops in the load-displacement curve. These rapid propagations are normally followed by arrest and a reloading, which results in a local peak load when delamination growth restarts. This behaviour is usually known as stick-slip growth and results in typical saw-teeth load-displacement curves (Kusaka et al., 1998). Figure 2.6 shows a typical load-displacement curve for the case of unstable interlaminar crack growth.
P
δ
Non-linearity P
δ
Non-linearity
(a) (b)
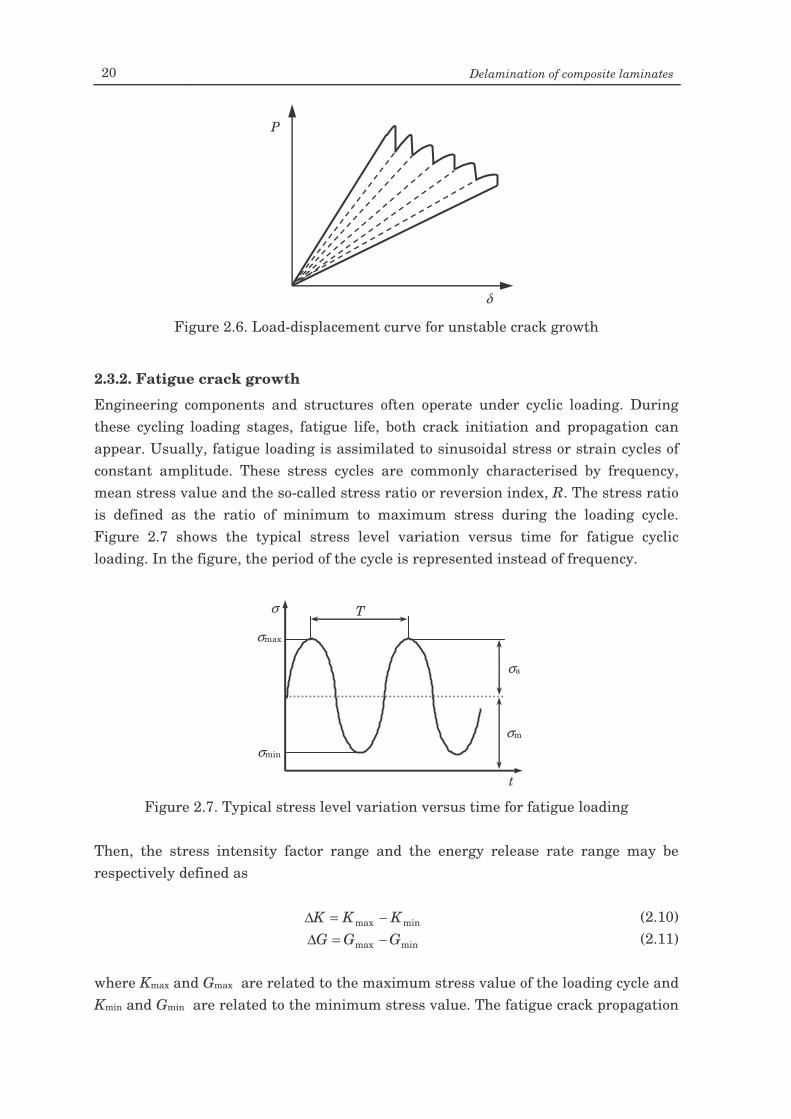
20 Delamination of composite laminates
Figure 2.6. Load-displacement curve for unstable crack growth
2.3.2. Fatigue crack growth
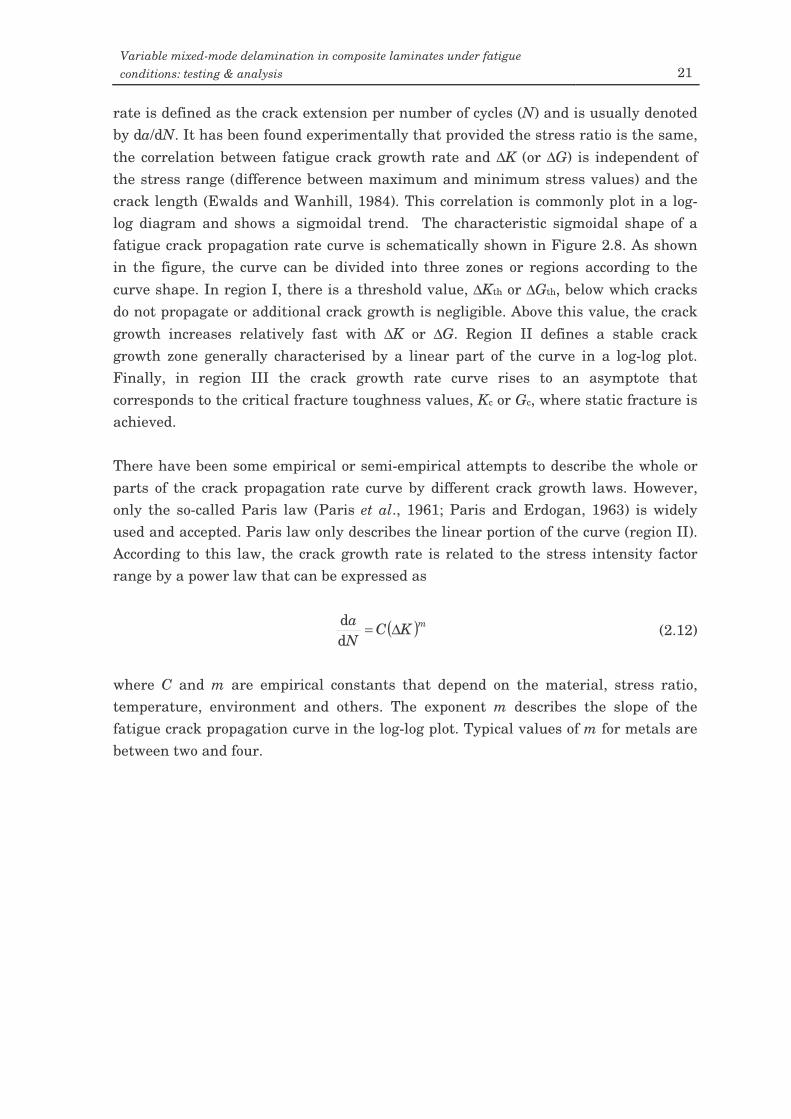
Engineering components and structures often operate under cyclic loading. During these cycling loading stages, fatigue life, both crack initiation and propagation can appear. Usually, fatigue loading is assimilated to sinusoidal stress or strain cycles of constant amplitude. These stress cycles are commonly characterised by frequency, mean stress value and the so-called stress ratio or reversion index, R. The stress ratio is defined as the ratio of minimum to maximum stress during the loading cycle. Figure 2.7 shows the typical stress level variation versus time for fatigue cyclic loading. In the figure, the period of the cycle is represented instead of frequency.
Figure 2.7. Typical stress level variation versus time for fatigue loading
Then, the stress intensity factor range and the energy release rate range may be respectively defined as
minmax KKK −=∆ (2.10)
minmax GGG −=∆ (2.11) where Kmax and Gmax are related to the maximum stress value of the loading cycle and Kmin and Gmin are related to the minimum stress value. The fatigue crack propagation
t
σ
σmax
T
σmin
σa
σm
P
δ
Variable mixed-mode delamination in composite laminates under fatigue conditions: testing & analysis 21
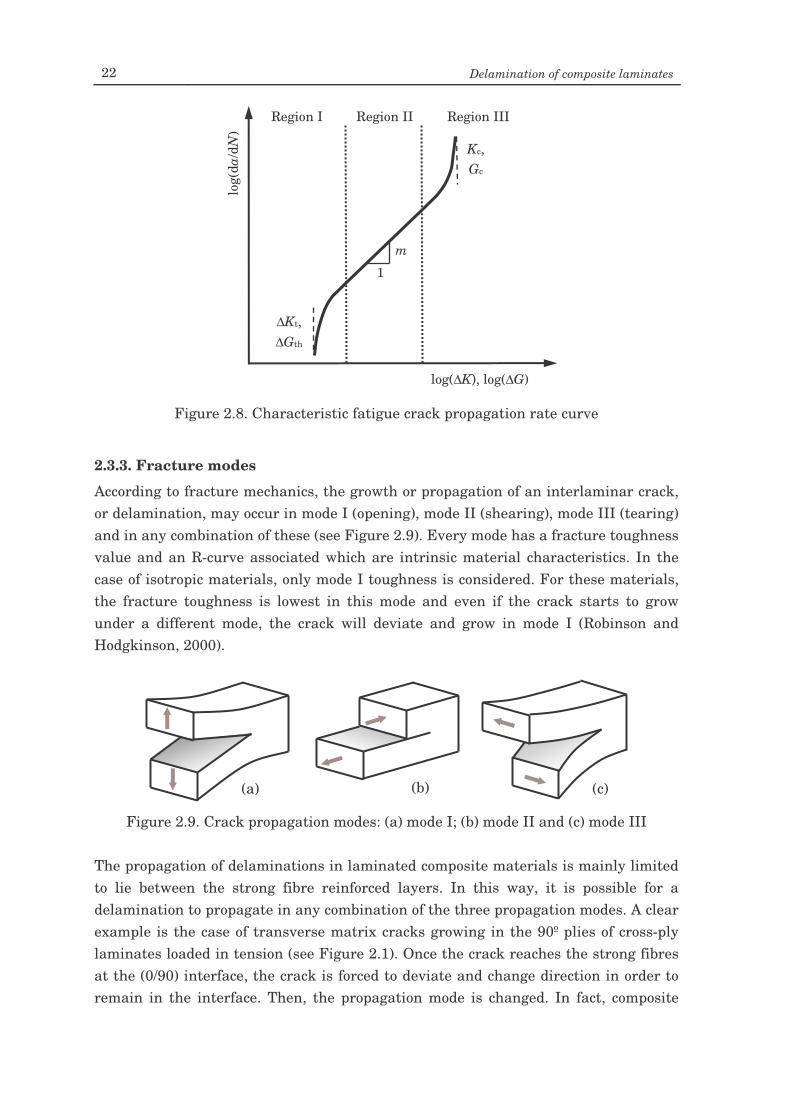
rate is defined as the crack extension per number of cycles (N) and is usually denoted by da/dN. It has been found experimentally that provided the stress ratio is the same, the correlation between fatigue crack growth rate and ∆K (or ∆G) is independent of the stress range (difference between maximum and minimum stress values) and the crack length (Ewalds and Wanhill, 1984). This correlation is commonly plot in a log-log diagram and shows a sigmoidal trend. The characteristic sigmoidal shape of a fatigue crack propagation rate curve is schematically shown in Figure 2.8. As shown in the figure, the curve can be divided into three zones or regions according to the curve shape. In region I, there is a threshold value, ∆Kth or ∆Gth, below which cracks do not propagate or additional crack growth is negligible. Above this value, the crack growth increases relatively fast with ∆K or ∆G. Region II defines a stable crack growth zone generally characterised by a linear part of the curve in a log-log plot. Finally, in region III the crack growth rate curve rises to an asymptote that corresponds to the critical fracture toughness values, Kc or Gc, where static fracture is achieved. There have been some empirical or semi-empirical attempts to describe the whole or parts of the crack propagation rate curve by different crack growth laws. However, only the so-called Paris law (Paris et al., 1961; Paris and Erdogan, 1963) is widely used and accepted. Paris law only describes the linear portion of the curve (region II). According to this law, the crack growth rate is related to the stress intensity factor range by a power law that can be expressed as
( )mKCNa ∆=
dd (2.12)
where C and m are empirical constants that depend on the material, stress ratio, temperature, environment and others. The exponent m describes the slope of the fatigue crack propagation curve in the log-log plot. Typical values of m for metals are between two and four.
22 Delamination of composite laminates
Figure 2.8. Characteristic fatigue crack propagation rate curve
2.3.3. Fracture modes
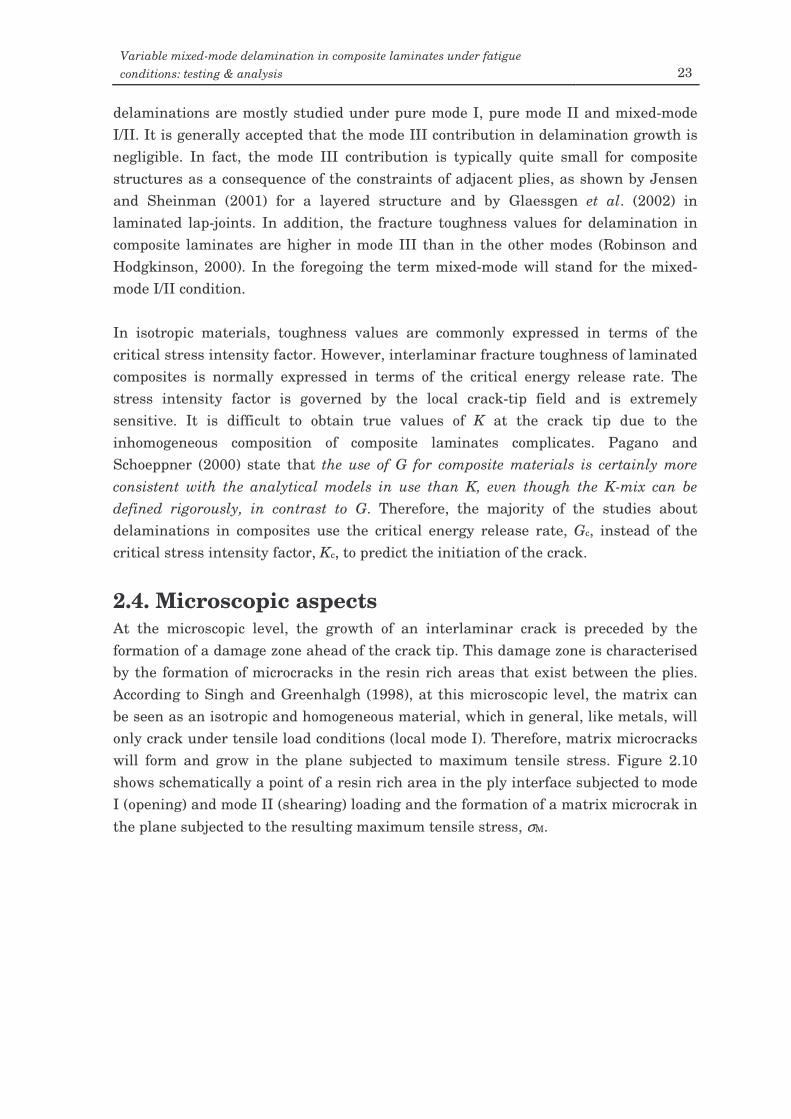
According to fracture mechanics, the growth or propagation of an interlaminar crack, or delamination, may occur in mode I (opening), mode II (shearing), mode III (tearing) and in any combination of these (see Figure 2.9). Every mode has a fracture toughness value and an R-curve associated which are intrinsic material characteristics. In the case of isotropic materials, only mode I toughness is considered. For these materials, the fracture toughness is lowest in this mode and even if the crack starts to grow under a different mode, the crack will deviate and grow in mode I (Robinson and Hodgkinson, 2000).
Figure 2.9. Crack propagation modes: (a) mode I; (b) mode II and (c) mode III
The propagation of delaminations in laminated composite materials is mainly limited to lie between the strong fibre reinforced layers. In this way, it is possible for a delamination to propagate in any combination of the three propagation modes. A clear example is the case of transverse matrix cracks growing in the 90º plies of cross-ply laminates loaded in tension (see Figure 2.1). Once the crack reaches the strong fibres at the (0/90) interface, the crack is forced to deviate and change direction in order to remain in the interface. Then, the propagation mode is changed. In fact, composite
(a) (b) (c)
log(
da/d
N)
log(∆K), log(∆G)
Region III Region II Region I
∆Kt, ∆Gth
Kc, Gc
1
m
Variable mixed-mode delamination in composite laminates under fatigue conditions: testing & analysis 23
delaminations are mostly studied under pure mode I, pure mode II and mixed-mode I/II. It is generally accepted that the mode III contribution in delamination growth is negligible. In fact, the mode III contribution is typically quite small for composite structures as a consequence of the constraints of adjacent plies, as shown by Jensen and Sheinman (2001) for a layered structure and by Glaessgen et al. (2002) in laminated lap-joints. In addition, the fracture toughness values for delamination in composite laminates are higher in mode III than in the other modes (Robinson and Hodgkinson, 2000). In the foregoing the term mixed-mode will stand for the mixed-mode I/II condition. In isotropic materials, toughness values are commonly expressed in terms of the critical stress intensity factor. However, interlaminar fracture toughness of laminated composites is normally expressed in terms of the critical energy release rate. The stress intensity factor is governed by the local crack-tip field and is extremely sensitive. It is difficult to obtain true values of K at the crack tip due to the inhomogeneous composition of composite laminates complicates. Pagano and Schoeppner (2000) state that the use of G for composite materials is certainly more consistent with the analytical models in use than K, even though the K-mix can be defined rigorously, in contrast to G. Therefore, the majority of the studies about delaminations in composites use the critical energy release rate, Gc, instead of the critical stress intensity factor, Kc, to predict the initiation of the crack.
2.4. Microscopic aspects At the microscopic level, the growth of an interlaminar crack is preceded by the formation of a damage zone ahead of the crack tip. This damage zone is characterised by the formation of microcracks in the resin rich areas that exist between the plies. According to Singh and Greenhalgh (1998), at this microscopic level, the matrix can be seen as an isotropic and homogeneous material, which in general, like metals, will only crack under tensile load conditions (local mode I). Therefore, matrix microcracks will form and grow in the plane subjected to maximum tensile stress. Figure 2.10 shows schematically a point of a resin rich area in the ply interface subjected to mode I (opening) and mode II (shearing) loading and the formation of a matrix microcrak in the plane subjected to the resulting maximum tensile stress, σM.
24 Delamination of composite laminates
Figure 2.10. Stress field of a resin rich area point and matrix microcrack formation
ahead of the crack tip
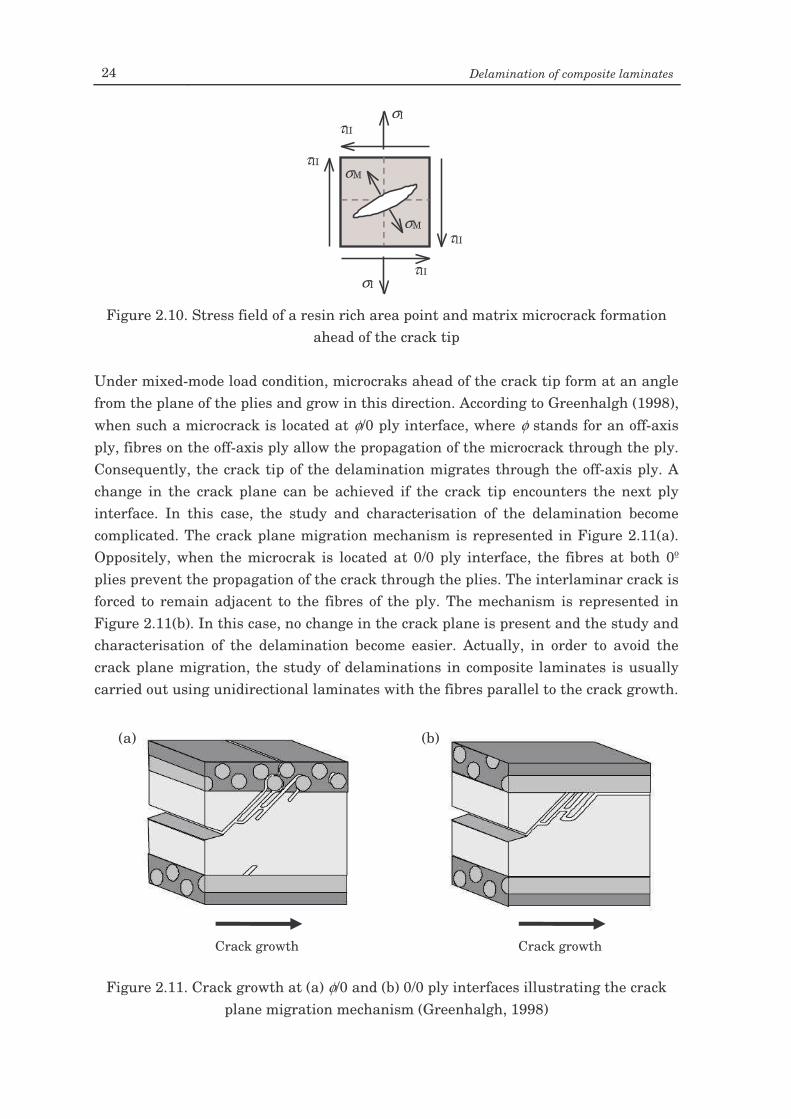
Under mixed-mode load condition, microcraks ahead of the crack tip form at an angle from the plane of the plies and grow in this direction. According to Greenhalgh (1998), when such a microcrack is located at φ/0 ply interface, where φ stands for an off-axis ply, fibres on the off-axis ply allow the propagation of the microcrack through the ply. Consequently, the crack tip of the delamination migrates through the off-axis ply. A change in the crack plane can be achieved if the crack tip encounters the next ply interface. In this case, the study and characterisation of the delamination become complicated. The crack plane migration mechanism is represented in Figure 2.11(a). Oppositely, when the microcrak is located at 0/0 ply interface, the fibres at both 0º plies prevent the propagation of the crack through the plies. The interlaminar crack is forced to remain adjacent to the fibres of the ply. The mechanism is represented in Figure 2.11(b). In this case, no change in the crack plane is present and the study and characterisation of the delamination become easier. Actually, in order to avoid the crack plane migration, the study of delaminations in composite laminates is usually carried out using unidirectional laminates with the fibres parallel to the crack growth.
Figure 2.11. Crack growth at (a) φ/0 and (b) 0/0 ply interfaces illustrating the crack
plane migration mechanism (Greenhalgh, 1998)
(a) (b)
Crack growth Crack growth
τII
τII
τII
τII
σI
σI
σM
σM
Variable mixed-mode delamination in composite laminates under fatigue conditions: testing & analysis 25
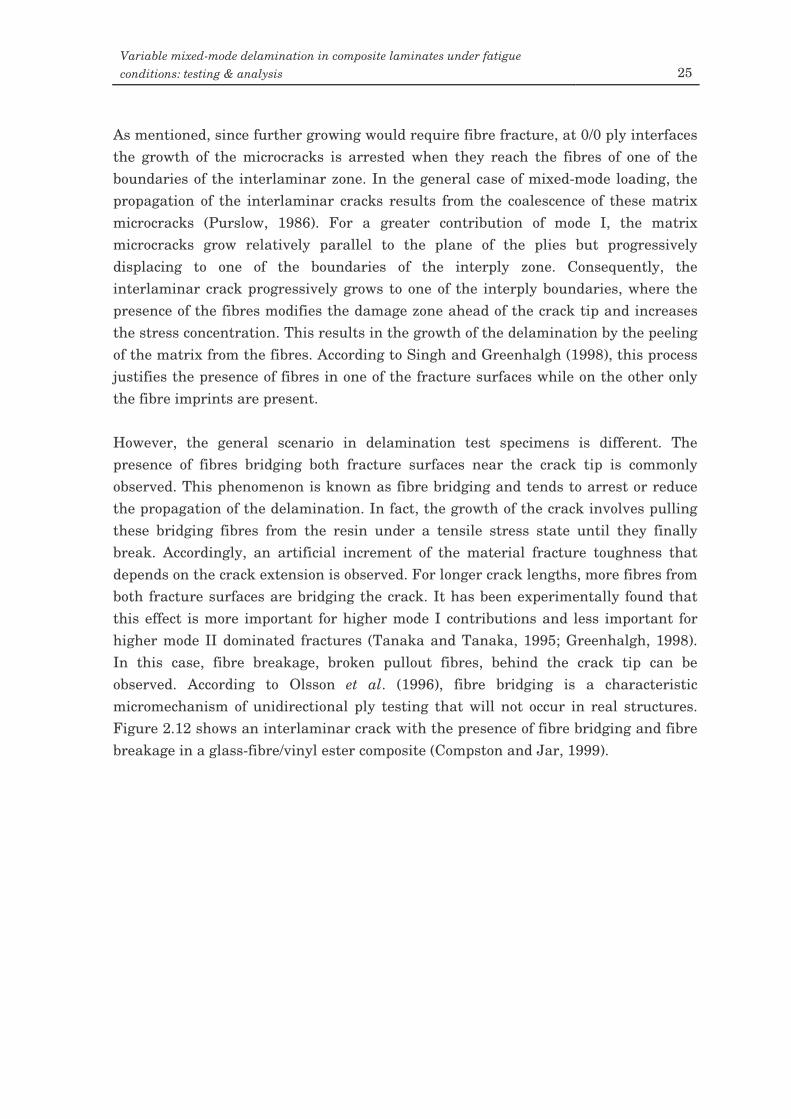
As mentioned, since further growing would require fibre fracture, at 0/0 ply interfaces the growth of the microcracks is arrested when they reach the fibres of one of the boundaries of the interlaminar zone. In the general case of mixed-mode loading, the propagation of the interlaminar cracks results from the coalescence of these matrix microcracks (Purslow, 1986). For a greater contribution of mode I, the matrix microcracks grow relatively parallel to the plane of the plies but progressively displacing to one of the boundaries of the interply zone. Consequently, the interlaminar crack progressively grows to one of the interply boundaries, where the presence of the fibres modifies the damage zone ahead of the crack tip and increases the stress concentration. This results in the growth of the delamination by the peeling of the matrix from the fibres. According to Singh and Greenhalgh (1998), this process justifies the presence of fibres in one of the fracture surfaces while on the other only the fibre imprints are present. However, the general scenario in delamination test specimens is different. The presence of fibres bridging both fracture surfaces near the crack tip is commonly observed. This phenomenon is known as fibre bridging and tends to arrest or reduce the propagation of the delamination. In fact, the growth of the crack involves pulling these bridging fibres from the resin under a tensile stress state until they finally break. Accordingly, an artificial increment of the material fracture toughness that depends on the crack extension is observed. For longer crack lengths, more fibres from both fracture surfaces are bridging the crack. It has been experimentally found that this effect is more important for higher mode I contributions and less important for higher mode II dominated fractures (Tanaka and Tanaka, 1995; Greenhalgh, 1998). In this case, fibre breakage, broken pullout fibres, behind the crack tip can be observed. According to Olsson et al. (1996), fibre bridging is a characteristic micromechanism of unidirectional ply testing that will not occur in real structures. Figure 2.12 shows an interlaminar crack with the presence of fibre bridging and fibre breakage in a glass-fibre/vinyl ester composite (Compston and Jar, 1999).
26 Delamination of composite laminates
Figure 2.12. Fibre bridging in a mode I interlaminar crack. The vertical arrow
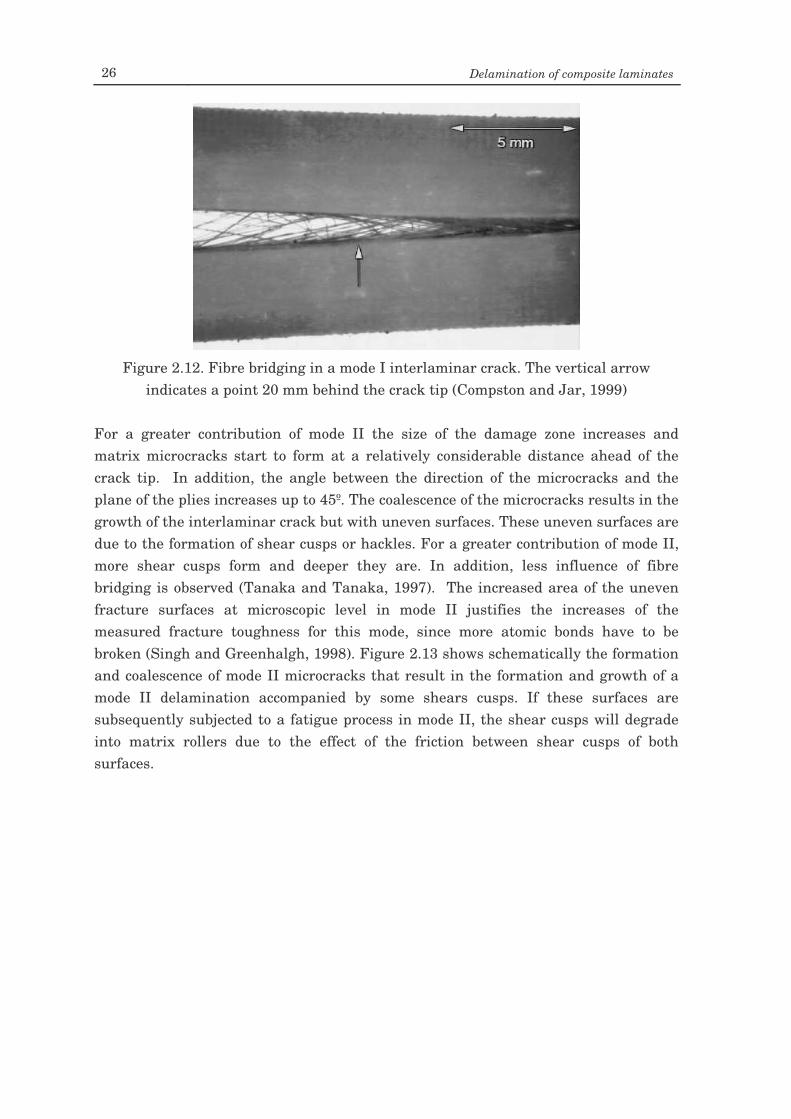
indicates a point 20 mm behind the crack tip (Compston and Jar, 1999) For a greater contribution of mode II the size of the damage zone increases and matrix microcracks start to form at a relatively considerable distance ahead of the crack tip. In addition, the angle between the direction of the microcracks and the plane of the plies increases up to 45º. The coalescence of the microcracks results in the growth of the interlaminar crack but with uneven surfaces. These uneven surfaces are due to the formation of shear cusps or hackles. For a greater contribution of mode II, more shear cusps form and deeper they are. In addition, less influence of fibre bridging is observed (Tanaka and Tanaka, 1997). The increased area of the uneven fracture surfaces at microscopic level in mode II justifies the increases of the measured fracture toughness for this mode, since more atomic bonds have to be broken (Singh and Greenhalgh, 1998). Figure 2.13 shows schematically the formation and coalescence of mode II microcracks that result in the formation and growth of a mode II delamination accompanied by some shears cusps. If these surfaces are subsequently subjected to a fatigue process in mode II, the shear cusps will degrade into matrix rollers due to the effect of the friction between shear cusps of both surfaces.
Variable mixed-mode delamination in composite laminates under fatigue conditions: testing & analysis 27
Figure 2.13. Formation and growth of a mode II delamination at the ply interface: (a) microcrack formation ahead of the crack tip; (b) microcrack growth and opening and
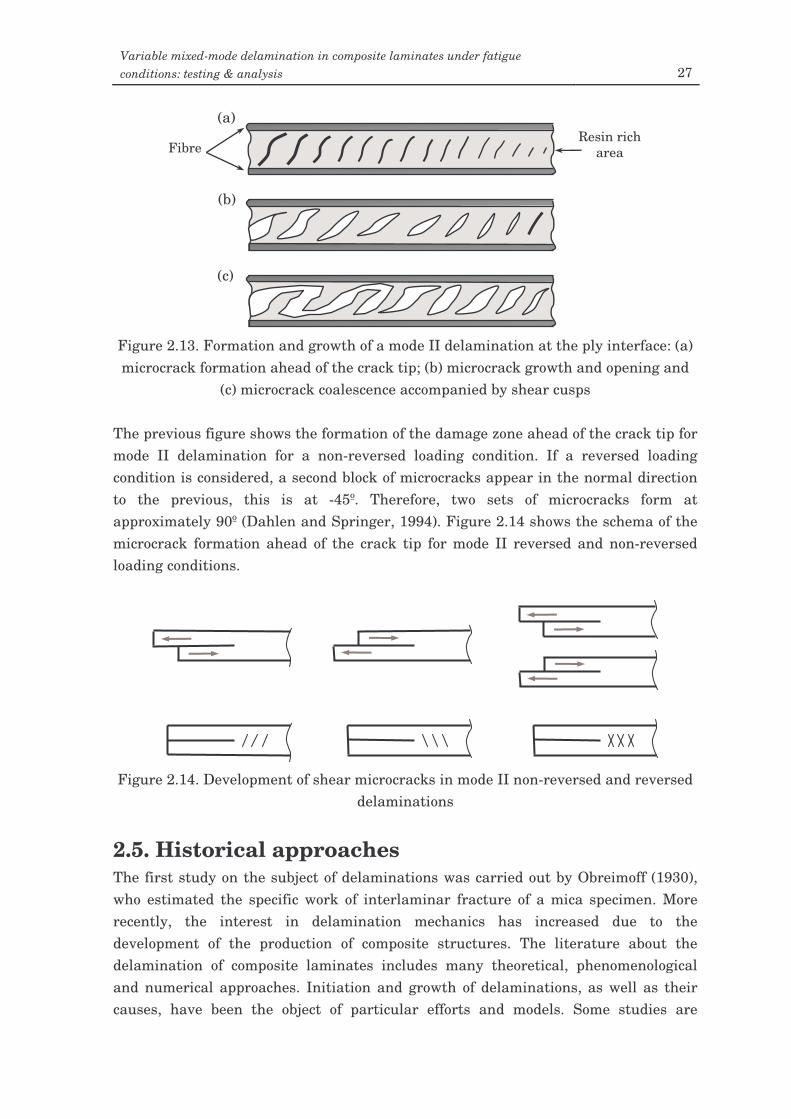
(c) microcrack coalescence accompanied by shear cusps The previous figure shows the formation of the damage zone ahead of the crack tip for mode II delamination for a non-reversed loading condition. If a reversed loading condition is considered, a second block of microcracks appear in the normal direction to the previous, this is at -45º. Therefore, two sets of microcracks form at approximately 90º (Dahlen and Springer, 1994). Figure 2.14 shows the schema of the microcrack formation ahead of the crack tip for mode II reversed and non-reversed loading conditions.
Figure 2.14. Development of shear microcracks in mode II non-reversed and reversed
delaminations
2.5. Historical approaches The first study on the subject of delaminations was carried out by Obreimoff (1930), who estimated the specific work of interlaminar fracture of a mica specimen. More recently, the interest in delamination mechanics has increased due to the development of the production of composite structures. The literature about the delamination of composite laminates includes many theoretical, phenomenological and numerical approaches. Initiation and growth of delaminations, as well as their causes, have been the object of particular efforts and models. Some studies are
Fibre Resin rich
area
(a)
(b)
(c)
28 Delamination of composite laminates
devoted to the initiation and/or propagation of the interlaminar crack under static conditions; meanwhile, others are devoted to fatigue onset and growth. Consequently, the quantity of scientific articles, books, reports and studies about composite delaminations is enormous. In the following, a brief review on the more relevant publications about composite delaminations is presented. This review presents, without deep detail, theoretical, numerical and phenomenological approaches. Only studies focused in static initiation and growth are included. Additionally, a specific review on fatigue delaminations in composite materials is included in Chapter 3.
2.5.1. The bimaterial interface crack problem
The growth of a crack between two solids with different elastic behaviour (even if isotropic) is a difficult problem to deal with. Using the linear elasticity theory, the obtained results show unusual complex singularities in the neighbourhood of the crack tip (England, 1965). In addition, the tree stress intensity factors at the crack tip (KI, KII and KIII) are coupled to each other and achieve complex values. Different approaches to overcome this complexity have been proposed. Barenblatt (1962) assumed the existence of a cohesive zone that enables the complete elimination of the singularity. This approach is still used nowadays in composite delaminations to avoid the numerical problems related to singularities (Borg et al., 2001; Camanho et al., 2001; Dávila et al., 2001; El-Sayed and Sridharan, 2001; Camanho and Dávila, 2002; El-Sayed and Sridharan, 2002b; El-Sayed and Sridharan, 2002a). Erdogan (1965) suggested to consider the crack near the interface but in one of the materials. In this way, the modes separate and conventional fracture mechanics principals prevail. Other researchers calculate the stresses at a certain distance of the crack tip, r0, to avoid the singularity when the distance to the crack tip, r, tends to zero (Rice, 1988). In most of the studies published about composite delaminations, the interlaminar crack is assumed to propagate in the interface between two adjacent plies. The assumption of this interface is based on experimental evidences of resin rich layers between the plies. Moreover, it allows the simplification of the models. In this way, the effective modulus theory (EMT) can be used to represent the behaviour of the laminate. This theory assumes that the different plies of the laminate are anisotropic but homogeneous. Therefore, delamination is rather considered like a fracture process between two homogeneous layers, than taking into account the stresses and micromechanisms between the constituents. Obviously, EMT cannot deal with the stress-state at the crack tip of the delamination. However, and although this kind of models can appear as simple, some experimental results confirm their applicability. An example is the Whitney-Nuismer failure criterion (Whitney and Nuismer, 1974) based on the calculation of stresses at ply-level to predict the initiation of delaminations with certain accuracy. Wang and Wang (1979) and Kim and Hong (1986) assumed a matrix interlayer near the interface. In this way, the interlaminar
Variable mixed-mode delamination in composite laminates under fatigue conditions: testing & analysis 29
crack grows within a homogeneous material. However, this assumption creates artificial singularities at the free edges. Although the many proposals to avoid the stress singularity at the crack tip, the stress intensity factor is governed by the local crack-tip field and is extremely sensitive. Thus, most of the studies about composite delaminations are based on the critical energy release rate Gc, instead of the critical stress intensity factor Kc, to predict the onset of interlaminar cracks.
The first studies about the interlaminar cracks in composite materials began at the end of the 60’s and early 70’s. Hayashi (1967) and Puppo and Evensen (1970) investigated from a theoretical point of view the formation of composite delaminations in the free edges of laminates. The latter used a shear lag model under the assumption of isotropic resin layers between anisotropic composite layers. Tang (1976) proposed an approximate solution for the same problem based on the combination of classical lamination theory and a perturbation model to represent the boundary layer region. An important milestone in the investigation of composite delaminations was the study of Foye and Baker (1970). The authors observed a dependence of the strength and mode of failure on the stacking sequence for different laminates having identical plies but different ply sequences. This effect was attributed to the interlaminar stresses, which can be determined by classical lamination theory in the free edge problem. One of the most complete works about initiation of delaminations in composite materials was carried out by Crasto and Kim (1997). The authors conducted delamination onset tests of multidirectional laminates under different temperature and moisture content combinations and compressive loading. Residuals stresses were also included in the analysis. An average stress non-interactive failure criterion was applied to determine the loading and interface at which delamination would initiate. Good correlation was encountered.
2.5.2. Delamination and matrix cracking
Some studies are focused on the onset of the delamination as a consequence of a previous damage mechanism in the laminate. This is the case of delamination initiation after appearance of matrix cracking. There are many scientific studies dealing with the problem of delaminations initiated after matrix cracking. Kashtalyan and Soutis (2002) include an exhaustive review on the subject. This review is briefly summarised in the following (only the more relevant studies are included).
30 Delamination of composite laminates
The majority of the investigations in the literature about crack-tip delaminations focus on matrix cracks in the 90º plies of a laminate. Crossman and Wang (1982) studied the transverse cracking and delamination of balanced symmetric graphite/epoxy laminates [±25/90n]s, where n = 0.5, 1, 2, 3, 4, 6 and 8. In the case of laminates with n ≥ 4, the authors observed a significant reduction in the delamination
onset strain. The onset and growth of edge delaminations in [(±30)2/90/90 ]s carbon/epoxy laminates under static and fatigue loading was studied by O’Brien (1982). The stiffness of the laminate was observed to decrease linearly with the delamination size. Takeda and Ogihara (1994) observed the initiation and growth of local delaminations from the tips of transverse matrix cracks of different graphite/epoxy cross-ply laminates, [0/90n]s, where n = 2, 4 and 6. The authors noted that the delaminations grew more rapidly and extensively in the case of the laminates containing more 90º plies. Nairn and Hu (1992) investigated the onset of crack-tip delaminations in balanced [(±θ)m/90n]s laminates and observed that delaminations formed after matrix cracking reach a critical density. This critical crack density depends on material properties, laminate structure and fracture toughness for matrix cracks and delaminations, but is independent of the properties of the (±θ)m plies. O’Brien (1985) suggested a simple expression to evaluate the strain-energy release rate (G) for local delaminations growing uniformly from transverse crack tips. The expression is based on simple load shearing rules and the classical laminated plate theory. Salpekar and O’Brien (1991) observed that the results of the previous G expression were in good agreement with the values obtained by finite element analysis. Armanios et al. (1991) analysed the local delaminations originated from transverse cracks in [±25/90n]s applying a shear deformation theory and a sub-laminate approach. The authors also included the hygrotermal effects in the proposed model obtaining reasonable agreement with delamination strain data of Crossman and Wang (1982). Zhang et al. (1999) investigated the constraining effect of the neighbouring plies on stiffness reduction and G for the delaminations induced by transverse cracking at the (φ/90) interfaces in […/ϕj/φm/90n]s laminates. The authors found that the stiffness reduction and the energy release rate depend on the local lay-up of the damaged laminate. It was suggested that G at the considered interface can be analysed using a [φm/90n]s laminate provided the plies are subjected to the same laminate strain.
Variable mixed-mode delamination in composite laminates under fatigue conditions: testing & analysis 31
Many authors have successfully used the shear lag method to model the onset and growth of delaminations originated from transverse crack-tips. Dharani and Tang (1990) used this method to determine the interlaminar shear and normal stresses at the delamination tip. An improved 2-D shear lag analysis was employed by Zhang et al. (1994b and 1994a) to predict G for edge and local delaminations in [(±θ)m/90n]s laminates. Their predictions were in good agreement with the results of Crossman and Wang (1982) and capture accurately the transition from edge to local delamination. Ogihara and Takeda (1995) used a modified shear lag method to predict G and stiffness reduction in [0/90n]s laminates due to the formation of transverse crack tip delaminations. Selvarathinam and Weitsmand (1999) used the shear lag method to model transverse matrix cracking delaminations in cross-ply laminates under environmental fatigue. Berthelot and Le Corre (2000) assumed a constant shear friction between the delaminated plies and used the shear lag method to analyse the stress fields in cross-ply laminates containing transverse cracks and crack tip delaminations. Kashtalyan and Soutis (1999 and 2000) used an improved 2-D shear lag method to examine the effect of crack-tip delaminations on stiffness reduction. As stated before, delaminations originated at the tip of transverse cracks have been the subject of numerous studies in the literature. However, there are less scientific investigations about delaminations growing from the tips of angle-ply cracks. O’Brien and Hooper (1991) and O’Brien (1991) observed delaminations induced by matrix cracking in [02/θ2/-θ2]s (where θ = 15º, 20º, 25º and 30º) carbon/epoxy laminates under static and fatigue loading conditions. Delaminations were observed to occur in the (θ/-θ) interface, bounded by the cracks in the (-θ) ply and the stress-free edge. Based on simple load shearing rules, two closed-form expressions for G were derived for delaminations growing from angle-ply matrix cracks: one for the case of a local delamination with a uniform front across the width of the laminate and one for the case of a partial local delamination bounded by the free edge. Salpekar and O’Brien (1993) used a 3-D FE analysis to study matrix-crack-induced delaminations in [0/θ/-θ]s (where θ = 15º and 45º) carbon/epoxy laminates. The energy release rate for a local delamination growing in the (45/-45) interface from a matrix crack in the (-45º) ply was found to be higher near the laminate edge than in the interior. Later, Salpekar et al. (1996) computed the total energy release rate of local delaminations originated from matrix cracks and bounded by the free edge in [0/θ/-θ]s and [θ/-θ/0]s graphite/epoxy laminates using a 3-D FE method. Three different techniques were employed: virtual crack closure technique, the equivalent domain integral technique and the global energy balance technique. For both lay-ups, the energy release rate associated with mode I was greatest near the matrix crack and decreased near the free edge. It also decreased with increasing delamination length.
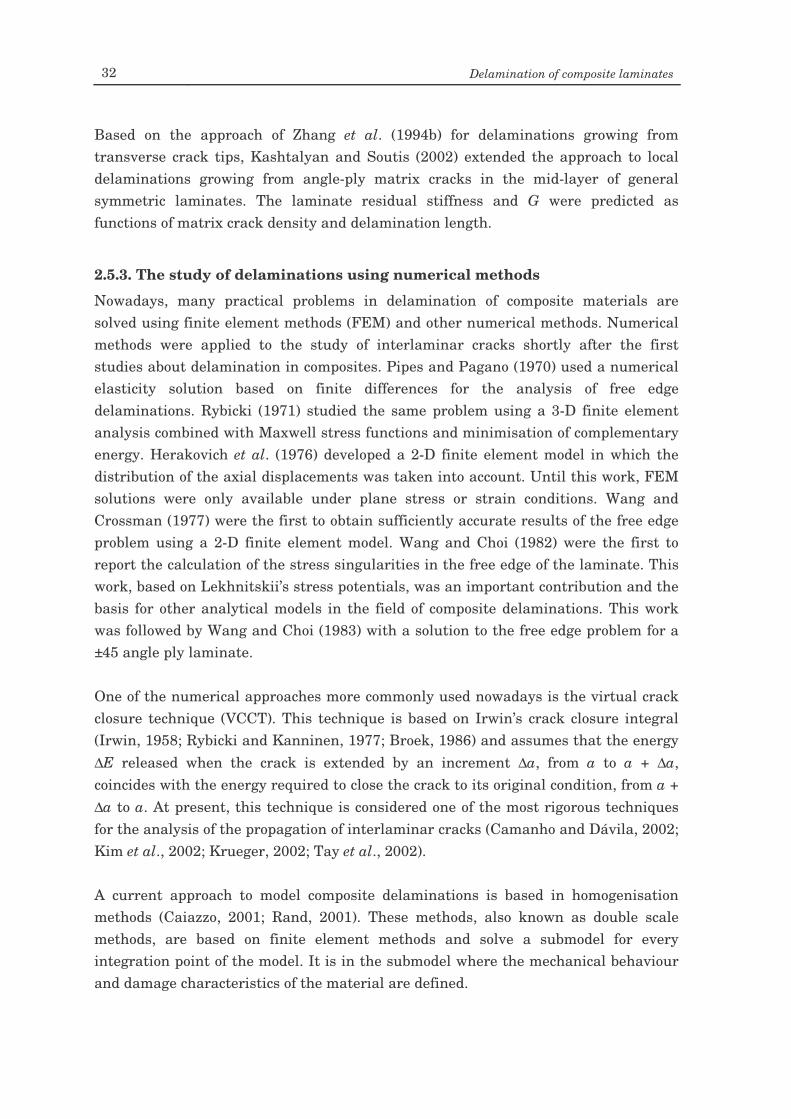
32 Delamination of composite laminates
Based on the approach of Zhang et al. (1994b) for delaminations growing from transverse crack tips, Kashtalyan and Soutis (2002) extended the approach to local delaminations growing from angle-ply matrix cracks in the mid-layer of general symmetric laminates. The laminate residual stiffness and G were predicted as functions of matrix crack density and delamination length.
2.5.3. The study of delaminations using numerical methods
Nowadays, many practical problems in delamination of composite materials are solved using finite element methods (FEM) and other numerical methods. Numerical methods were applied to the study of interlaminar cracks shortly after the first studies about delamination in composites. Pipes and Pagano (1970) used a numerical elasticity solution based on finite differences for the analysis of free edge delaminations. Rybicki (1971) studied the same problem using a 3-D finite element analysis combined with Maxwell stress functions and minimisation of complementary energy. Herakovich et al. (1976) developed a 2-D finite element model in which the distribution of the axial displacements was taken into account. Until this work, FEM solutions were only available under plane stress or strain conditions. Wang and Crossman (1977) were the first to obtain sufficiently accurate results of the free edge problem using a 2-D finite element model. Wang and Choi (1982) were the first to report the calculation of the stress singularities in the free edge of the laminate. This work, based on Lekhnitskii’s stress potentials, was an important contribution and the basis for other analytical models in the field of composite delaminations. This work was followed by Wang and Choi (1983) with a solution to the free edge problem for a ±45 angle ply laminate. One of the numerical approaches more commonly used nowadays is the virtual crack closure technique (VCCT). This technique is based on Irwin’s crack closure integral (Irwin, 1958; Rybicki and Kanninen, 1977; Broek, 1986) and assumes that the energy ∆E released when the crack is extended by an increment ∆a, from a to a + ∆a, coincides with the energy required to close the crack to its original condition, from a + ∆a to a. At present, this technique is considered one of the most rigorous techniques for the analysis of the propagation of interlaminar cracks (Camanho and Dávila, 2002; Kim et al., 2002; Krueger, 2002; Tay et al., 2002). A current approach to model composite delaminations is based in homogenisation methods (Caiazzo, 2001; Rand, 2001). These methods, also known as double scale methods, are based on finite element methods and solve a submodel for every integration point of the model. It is in the submodel where the mechanical behaviour and damage characteristics of the material are defined.
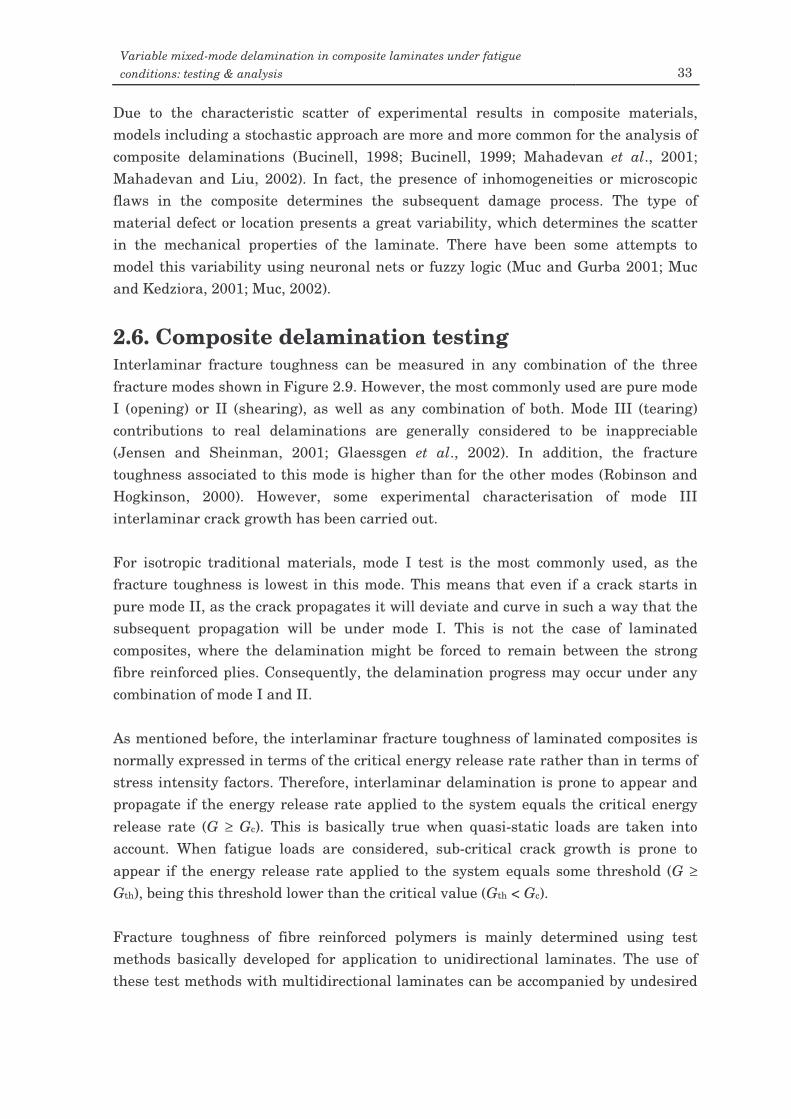
Variable mixed-mode delamination in composite laminates under fatigue conditions: testing & analysis 33
Due to the characteristic scatter of experimental results in composite materials, models including a stochastic approach are more and more common for the analysis of composite delaminations (Bucinell, 1998; Bucinell, 1999; Mahadevan et al., 2001; Mahadevan and Liu, 2002). In fact, the presence of inhomogeneities or microscopic flaws in the composite determines the subsequent damage process. The type of material defect or location presents a great variability, which determines the scatter in the mechanical properties of the laminate. There have been some attempts to model this variability using neuronal nets or fuzzy logic (Muc and Gurba 2001; Muc and Kedziora, 2001; Muc, 2002).
2.6. Composite delamination testing Interlaminar fracture toughness can be measured in any combination of the three fracture modes shown in Figure 2.9. However, the most commonly used are pure mode I (opening) or II (shearing), as well as any combination of both. Mode III (tearing) contributions to real delaminations are generally considered to be inappreciable (Jensen and Sheinman, 2001; Glaessgen et al., 2002). In addition, the fracture toughness associated to this mode is higher than for the other modes (Robinson and Hogkinson, 2000). However, some experimental characterisation of mode III interlaminar crack growth has been carried out. For isotropic traditional materials, mode I test is the most commonly used, as the fracture toughness is lowest in this mode. This means that even if a crack starts in pure mode II, as the crack propagates it will deviate and curve in such a way that the subsequent propagation will be under mode I. This is not the case of laminated composites, where the delamination might be forced to remain between the strong fibre reinforced plies. Consequently, the delamination progress may occur under any combination of mode I and II.
As mentioned before, the interlaminar fracture toughness of laminated composites is normally expressed in terms of the critical energy release rate rather than in terms of stress intensity factors. Therefore, interlaminar delamination is prone to appear and propagate if the energy release rate applied to the system equals the critical energy release rate (G ≥ Gc). This is basically true when quasi-static loads are taken into account. When fatigue loads are considered, sub-critical crack growth is prone to appear if the energy release rate applied to the system equals some threshold (G ≥ Gth), being this threshold lower than the critical value (Gth < Gc). Fracture toughness of fibre reinforced polymers is mainly determined using test methods basically developed for application to unidirectional laminates. The use of these test methods with multidirectional laminates can be accompanied by undesired
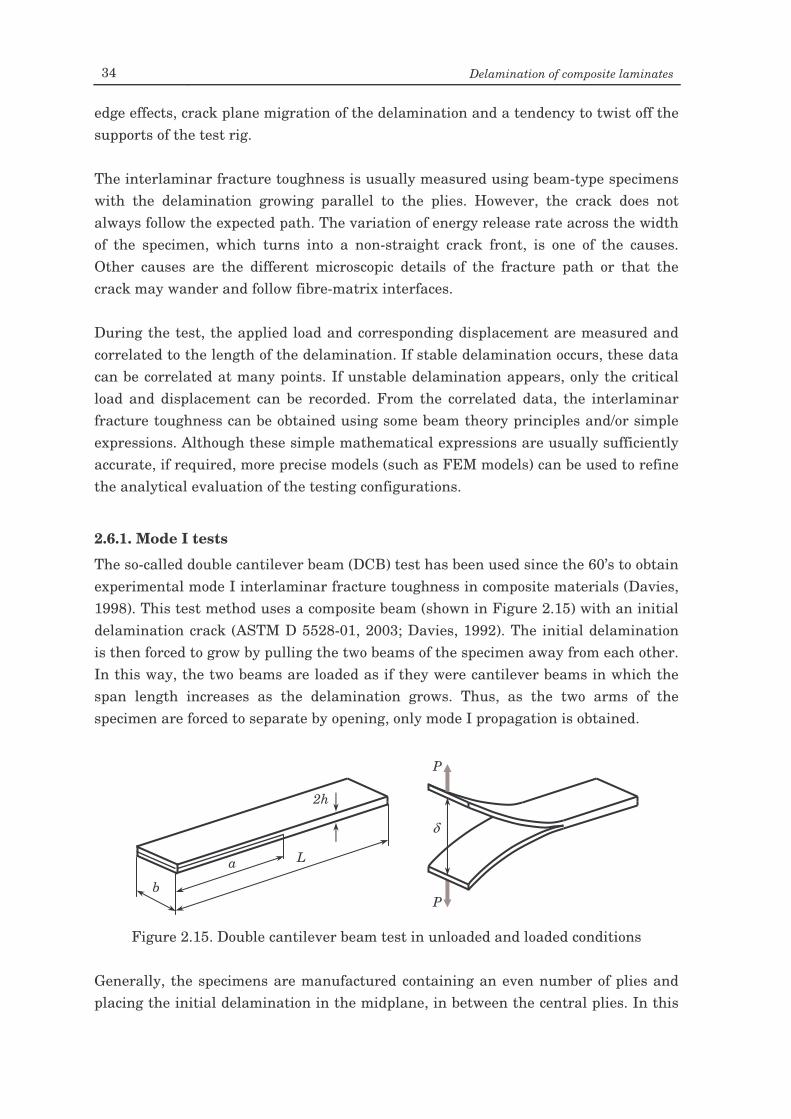
34 Delamination of composite laminates
edge effects, crack plane migration of the delamination and a tendency to twist off the supports of the test rig. The interlaminar fracture toughness is usually measured using beam-type specimens with the delamination growing parallel to the plies. However, the crack does not always follow the expected path. The variation of energy release rate across the width of the specimen, which turns into a non-straight crack front, is one of the causes. Other causes are the different microscopic details of the fracture path or that the crack may wander and follow fibre-matrix interfaces. During the test, the applied load and corresponding displacement are measured and correlated to the length of the delamination. If stable delamination occurs, these data can be correlated at many points. If unstable delamination appears, only the critical load and displacement can be recorded. From the correlated data, the interlaminar fracture toughness can be obtained using some beam theory principles and/or simple expressions. Although these simple mathematical expressions are usually sufficiently accurate, if required, more precise models (such as FEM models) can be used to refine the analytical evaluation of the testing configurations.
2.6.1. Mode I tests
The so-called double cantilever beam (DCB) test has been used since the 60’s to obtain experimental mode I interlaminar fracture toughness in composite materials (Davies, 1998). This test method uses a composite beam (shown in Figure 2.15) with an initial delamination crack (ASTM D 5528-01, 2003; Davies, 1992). The initial delamination is then forced to grow by pulling the two beams of the specimen away from each other. In this way, the two beams are loaded as if they were cantilever beams in which the span length increases as the delamination grows. Thus, as the two arms of the specimen are forced to separate by opening, only mode I propagation is obtained.
Figure 2.15. Double cantilever beam test in unloaded and loaded conditions
Generally, the specimens are manufactured containing an even number of plies and placing the initial delamination in the midplane, in between the central plies. In this
δ
P
P
L a
b
2h
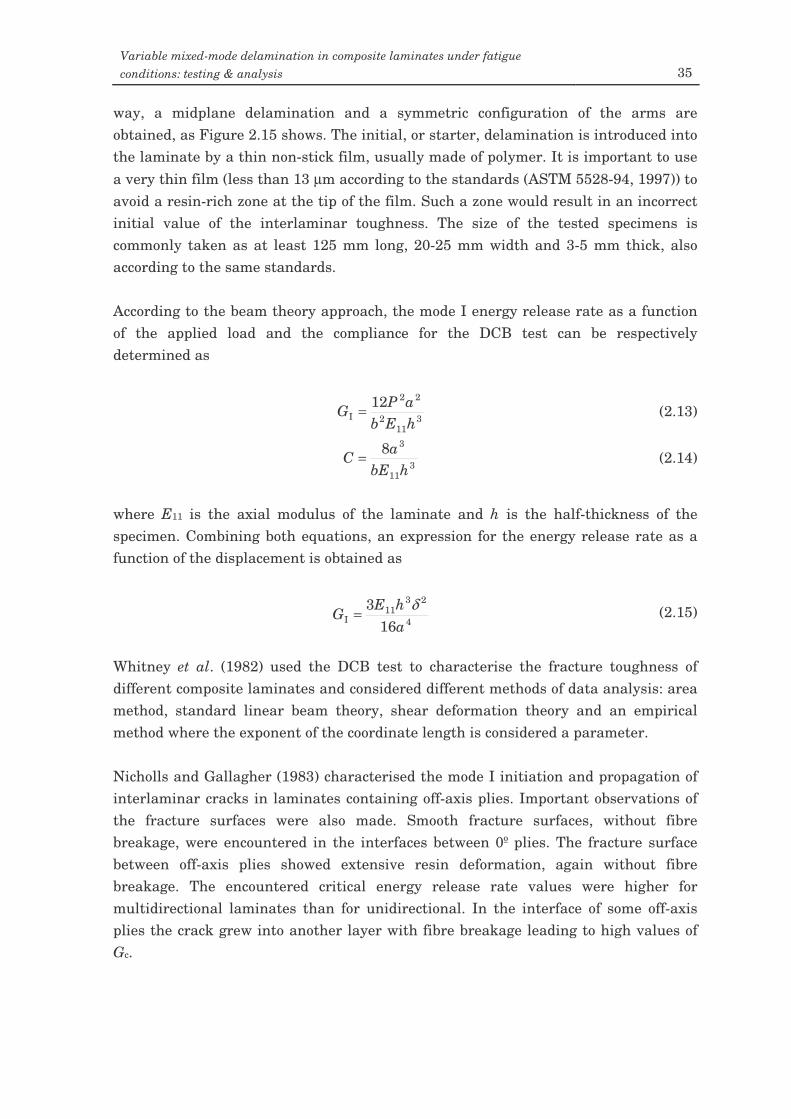
Variable mixed-mode delamination in composite laminates under fatigue conditions: testing & analysis 35
way, a midplane delamination and a symmetric configuration of the arms are obtained, as Figure 2.15 shows. The initial, or starter, delamination is introduced into the laminate by a thin non-stick film, usually made of polymer. It is important to use a very thin film (less than 13 µm according to the standards (ASTM 5528-94, 1997)) to avoid a resin-rich zone at the tip of the film. Such a zone would result in an incorrect initial value of the interlaminar toughness. The size of the tested specimens is commonly taken as at least 125 mm long, 20-25 mm width and 3-5 mm thick, also according to the same standards. According to the beam theory approach, the mode I energy release rate as a function of the applied load and the compliance for the DCB test can be respectively determined as
311
2
22
I12
hEbaPG = (2.13)
311
38hbE
aC = (2.14)
where E11 is the axial modulus of the laminate and h is the half-thickness of the specimen. Combining both equations, an expression for the energy release rate as a function of the displacement is obtained as
4
2311
I 163
ahE
Gδ
= (2.15)
Whitney et al. (1982) used the DCB test to characterise the fracture toughness of different composite laminates and considered different methods of data analysis: area method, standard linear beam theory, shear deformation theory and an empirical method where the exponent of the coordinate length is considered a parameter. Nicholls and Gallagher (1983) characterised the mode I initiation and propagation of interlaminar cracks in laminates containing off-axis plies. Important observations of the fracture surfaces were also made. Smooth fracture surfaces, without fibre breakage, were encountered in the interfaces between 0º plies. The fracture surface between off-axis plies showed extensive resin deformation, again without fibre breakage. The encountered critical energy release rate values were higher for multidirectional laminates than for unidirectional. In the interface of some off-axis plies the crack grew into another layer with fibre breakage leading to high values of Gc.

36 Delamination of composite laminates
Keary et al. (1985) analysed the DCB test taking into account the veracity of Bernouilli-Euler beam theory, shear deformation, assumed clamping and nonlinear and inelastic material behaviour. Bernouilli-Euler beam theory assumes nondeformable normals, meanwhile in the DCB test the normal can rotate. Therefore, the use of simple beam theory approach may lead to inaccurate predictions that would only be true in the particular case that both beams of the specimen were perfectly built-in at the deformation front. In this case, the specimen compliance would be zero at the delamination front. In practice, rotation and some deflection appears at the crack tip during the test. This effect can be taken into account by adding a small fictitious length that depends on the material elastic properties and specimen width to the real delamination length (Hashemi et al., 1990a; Hashemi et al., 1990b; Wang and Williams, 1992; Kinloch et al., 1993; Robinson and Hogkinson, 2000). Composite beam tests, such DCB and others, are subjected to large deflections. This effect must be taken into account to measure fracture toughness correctly. Devitt et al. (1980) considered a large deflection-rotation beam theory to measure mode I fracture toughness of unidirectional glass/epoxy laminates using a DCB test. In Figure 2.16, a comparison between the experimental results, linear theory and the nonlinear proposed approach is shown. As it can be seen, linear theory is unable to predict the experimental behaviour with accuracy. Different approaches are present in the literature to consider the same large deflection-rotation of the composite beams during testing (Hashemi et al., 1990a; Hashemi et al., 1990b; Kinloch et al., 1993; Robinson and Hogkinson, 2000).
Figure 2.16. Nondimensional load-deflection curve for cantilever beams. Symbols
indicate experimental data (Devitt et al., 1980) The DCB test has been the object of a round robin analysis (Davies, 1996). During the test, 36 independent researchers interpreted the same load-displacement curve from a
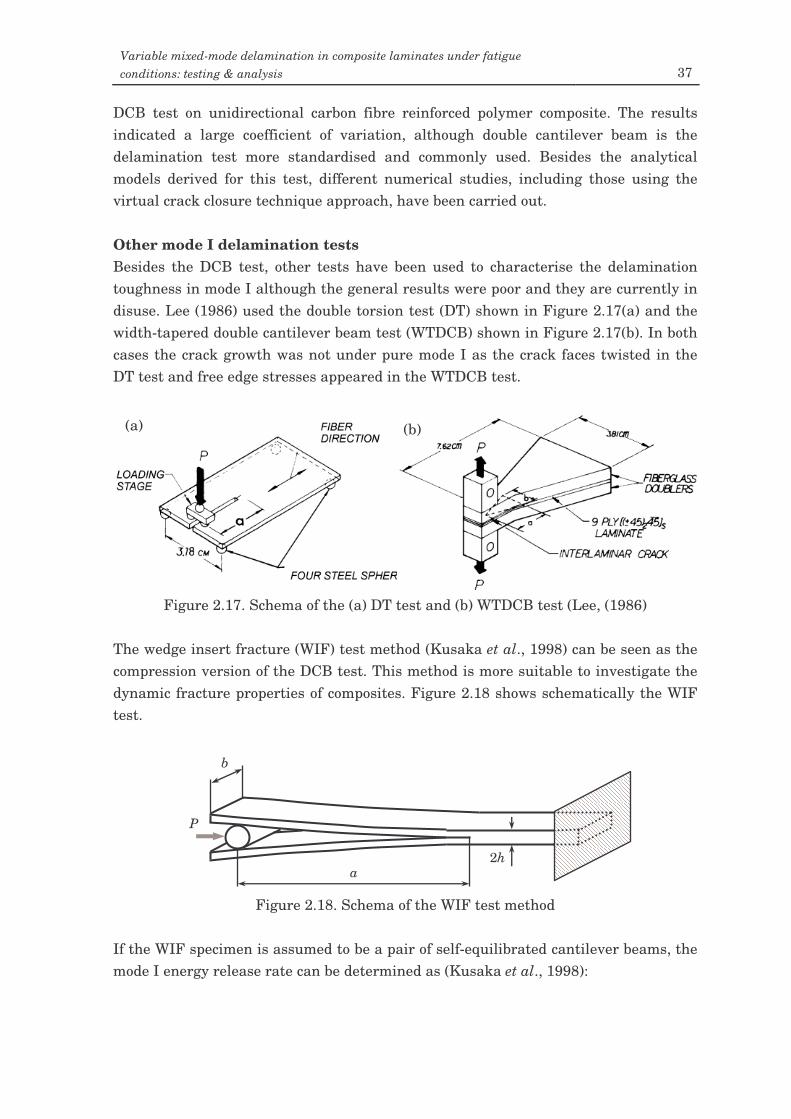
Variable mixed-mode delamination in composite laminates under fatigue conditions: testing & analysis 37
DCB test on unidirectional carbon fibre reinforced polymer composite. The results indicated a large coefficient of variation, although double cantilever beam is the delamination test more standardised and commonly used. Besides the analytical models derived for this test, different numerical studies, including those using the virtual crack closure technique approach, have been carried out. Other mode I delamination tests Besides the DCB test, other tests have been used to characterise the delamination toughness in mode I although the general results were poor and they are currently in disuse. Lee (1986) used the double torsion test (DT) shown in Figure 2.17(a) and the width-tapered double cantilever beam test (WTDCB) shown in Figure 2.17(b). In both cases the crack growth was not under pure mode I as the crack faces twisted in the DT test and free edge stresses appeared in the WTDCB test.
Figure 2.17. Schema of the (a) DT test and (b) WTDCB test (Lee, (1986)
The wedge insert fracture (WIF) test method (Kusaka et al., 1998) can be seen as the compression version of the DCB test. This method is more suitable to investigate the dynamic fracture properties of composites. Figure 2.18 shows schematically the WIF test.
Figure 2.18. Schema of the WIF test method
If the WIF specimen is assumed to be a pair of self-equilibrated cantilever beams, the mode I energy release rate can be determined as (Kusaka et al., 1998):
P
a
b
2h
(a) (b)
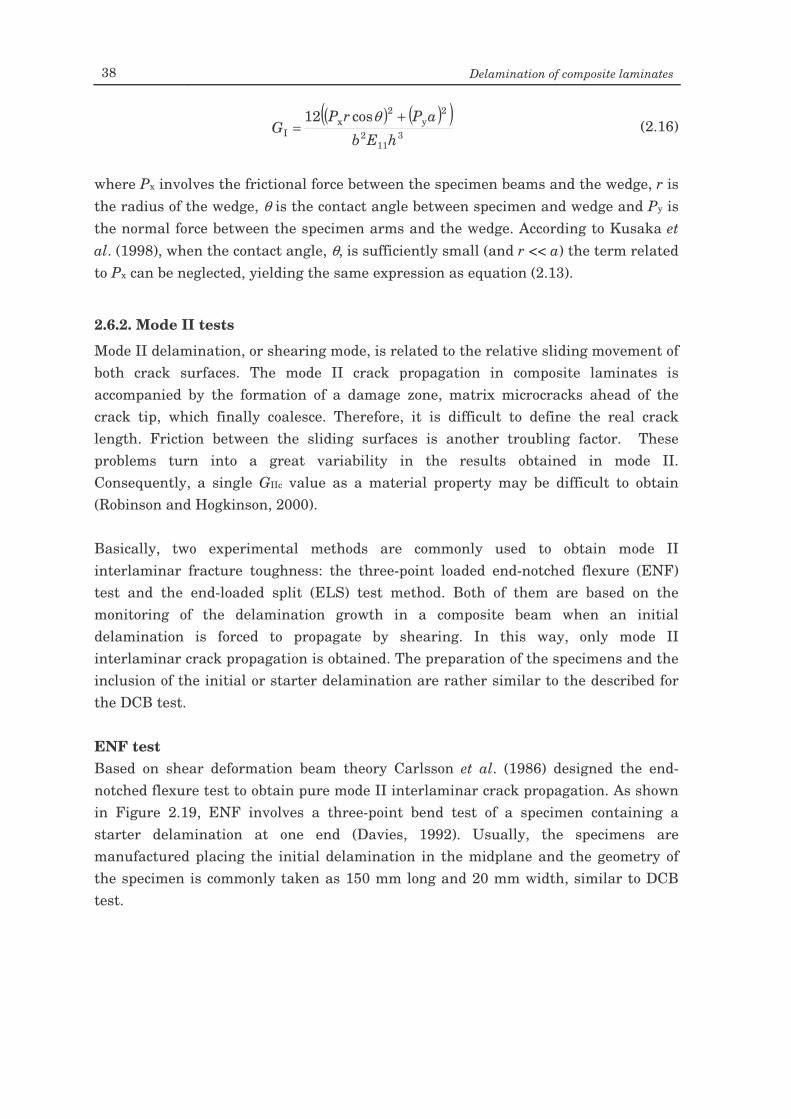
38 Delamination of composite laminates
( ) ( )( )3
112
2y
2x
I
cos12
hEb
aPrPG
+=
θ (2.16)
where Px involves the frictional force between the specimen beams and the wedge, r is the radius of the wedge, θ is the contact angle between specimen and wedge and Py is the normal force between the specimen arms and the wedge. According to Kusaka et al. (1998), when the contact angle, θ, is sufficiently small (and r << a) the term related to Px can be neglected, yielding the same expression as equation (2.13).
2.6.2. Mode II tests
Mode II delamination, or shearing mode, is related to the relative sliding movement of both crack surfaces. The mode II crack propagation in composite laminates is accompanied by the formation of a damage zone, matrix microcracks ahead of the crack tip, which finally coalesce. Therefore, it is difficult to define the real crack length. Friction between the sliding surfaces is another troubling factor. These problems turn into a great variability in the results obtained in mode II. Consequently, a single GIIc value as a material property may be difficult to obtain (Robinson and Hogkinson, 2000). Basically, two experimental methods are commonly used to obtain mode II interlaminar fracture toughness: the three-point loaded end-notched flexure (ENF) test and the end-loaded split (ELS) test method. Both of them are based on the monitoring of the delamination growth in a composite beam when an initial delamination is forced to propagate by shearing. In this way, only mode II interlaminar crack propagation is obtained. The preparation of the specimens and the inclusion of the initial or starter delamination are rather similar to the described for the DCB test. ENF test Based on shear deformation beam theory Carlsson et al. (1986) designed the end-notched flexure test to obtain pure mode II interlaminar crack propagation. As shown in Figure 2.19, ENF involves a three-point bend test of a specimen containing a starter delamination at one end (Davies, 1992). Usually, the specimens are manufactured placing the initial delamination in the midplane and the geometry of the specimen is commonly taken as 150 mm long and 20 mm width, similar to DCB test.
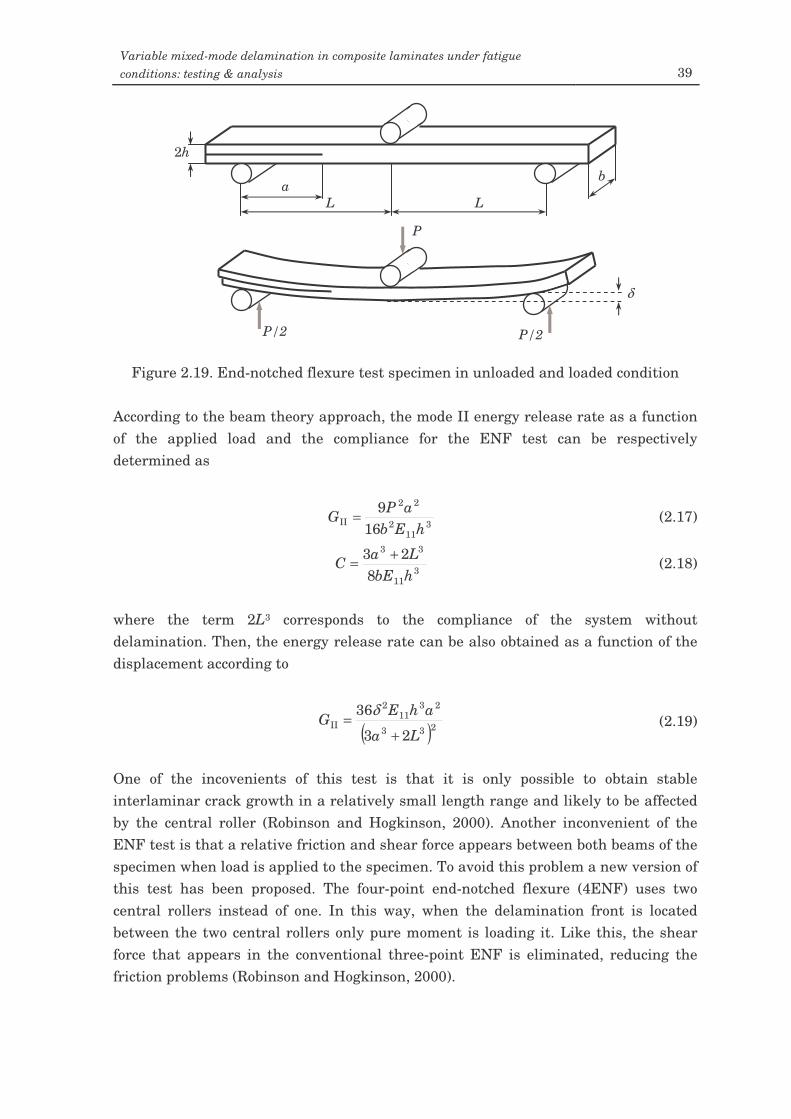
Variable mixed-mode delamination in composite laminates under fatigue conditions: testing & analysis 39
Figure 2.19. End-notched flexure test specimen in unloaded and loaded condition
According to the beam theory approach, the mode II energy release rate as a function of the applied load and the compliance for the ENF test can be respectively determined as
311
2
22
II 169
hEbaPG = (2.17)
311
33
823hbELaC += (2.18)
where the term 2L3 corresponds to the compliance of the system without delamination. Then, the energy release rate can be also obtained as a function of the displacement according to
( )233
2311
2
II23
36
La
ahEG
+=
δ (2.19)
One of the incovenients of this test is that it is only possible to obtain stable interlaminar crack growth in a relatively small length range and likely to be affected by the central roller (Robinson and Hogkinson, 2000). Another inconvenient of the ENF test is that a relative friction and shear force appears between both beams of the specimen when load is applied to the specimen. To avoid this problem a new version of this test has been proposed. The four-point end-notched flexure (4ENF) uses two central rollers instead of one. In this way, when the delamination front is located between the two central rollers only pure moment is loading it. Like this, the shear force that appears in the conventional three-point ENF is eliminated, reducing the friction problems (Robinson and Hogkinson, 2000).
2h
a L L
b
P/2
P
P/2
δ
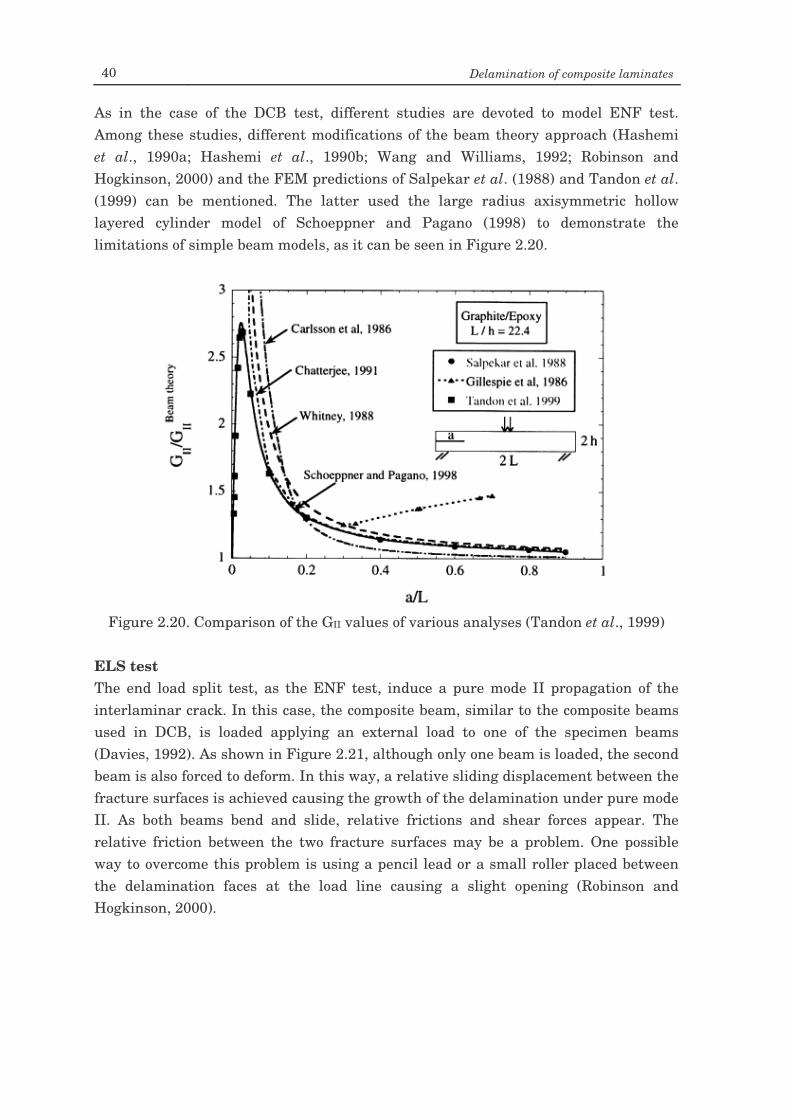
40 Delamination of composite laminates
As in the case of the DCB test, different studies are devoted to model ENF test. Among these studies, different modifications of the beam theory approach (Hashemi et al., 1990a; Hashemi et al., 1990b; Wang and Williams, 1992; Robinson and Hogkinson, 2000) and the FEM predictions of Salpekar et al. (1988) and Tandon et al. (1999) can be mentioned. The latter used the large radius axisymmetric hollow layered cylinder model of Schoeppner and Pagano (1998) to demonstrate the limitations of simple beam models, as it can be seen in Figure 2.20.
Figure 2.20. Comparison of the GII values of various analyses (Tandon et al., 1999)
ELS test The end load split test, as the ENF test, induce a pure mode II propagation of the interlaminar crack. In this case, the composite beam, similar to the composite beams used in DCB, is loaded applying an external load to one of the specimen beams (Davies, 1992). As shown in Figure 2.21, although only one beam is loaded, the second beam is also forced to deform. In this way, a relative sliding displacement between the fracture surfaces is achieved causing the growth of the delamination under pure mode II. As both beams bend and slide, relative frictions and shear forces appear. The relative friction between the two fracture surfaces may be a problem. One possible way to overcome this problem is using a pencil lead or a small roller placed between the delamination faces at the load line causing a slight opening (Robinson and Hogkinson, 2000).
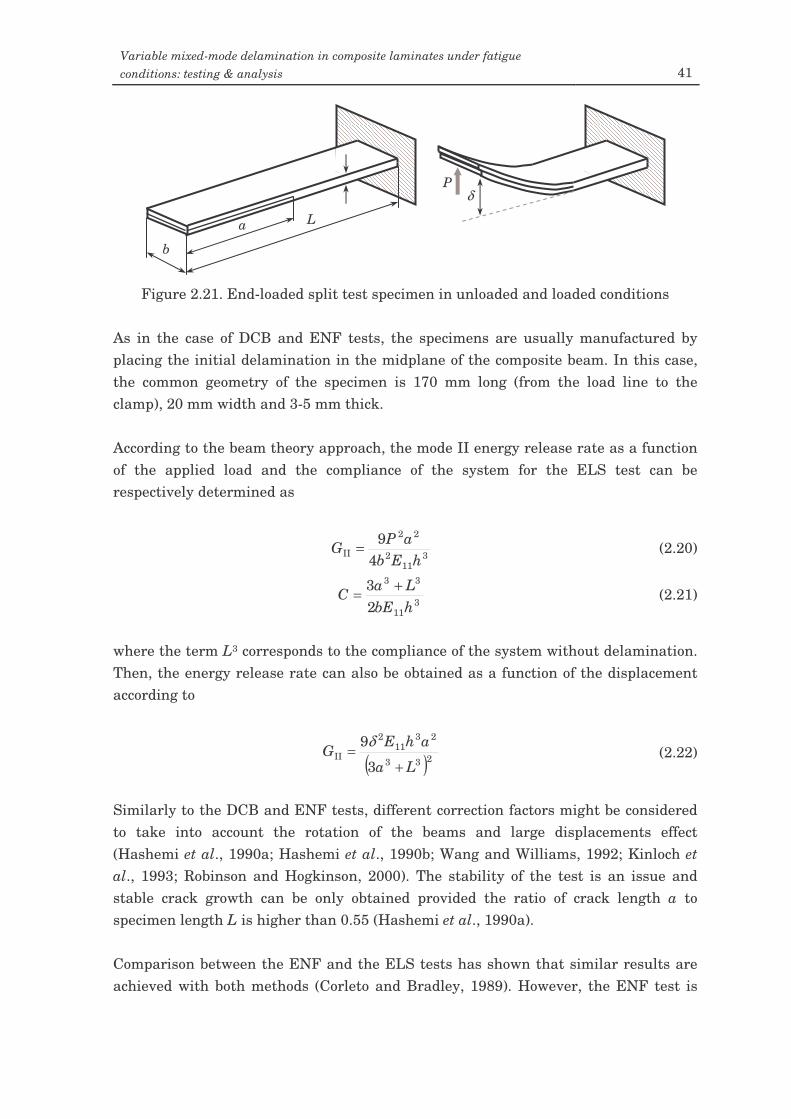
Variable mixed-mode delamination in composite laminates under fatigue conditions: testing & analysis 41
Figure 2.21. End-loaded split test specimen in unloaded and loaded conditions
As in the case of DCB and ENF tests, the specimens are usually manufactured by placing the initial delamination in the midplane of the composite beam. In this case, the common geometry of the specimen is 170 mm long (from the load line to the clamp), 20 mm width and 3-5 mm thick. According to the beam theory approach, the mode II energy release rate as a function of the applied load and the compliance of the system for the ELS test can be respectively determined as
311
2
22
II 49
hEbaPG = (2.20)
311
33
23
hbELaC += (2.21)
where the term L3 corresponds to the compliance of the system without delamination. Then, the energy release rate can also be obtained as a function of the displacement according to
( )233
2311
2
II3
9
La
ahEG
+=
δ (2.22)
Similarly to the DCB and ENF tests, different correction factors might be considered to take into account the rotation of the beams and large displacements effect (Hashemi et al., 1990a; Hashemi et al., 1990b; Wang and Williams, 1992; Kinloch et al., 1993; Robinson and Hogkinson, 2000). The stability of the test is an issue and stable crack growth can be only obtained provided the ratio of crack length a to specimen length L is higher than 0.55 (Hashemi et al., 1990a). Comparison between the ENF and the ELS tests has shown that similar results are achieved with both methods (Corleto and Bradley, 1989). However, the ENF test is
L a
b
δ P
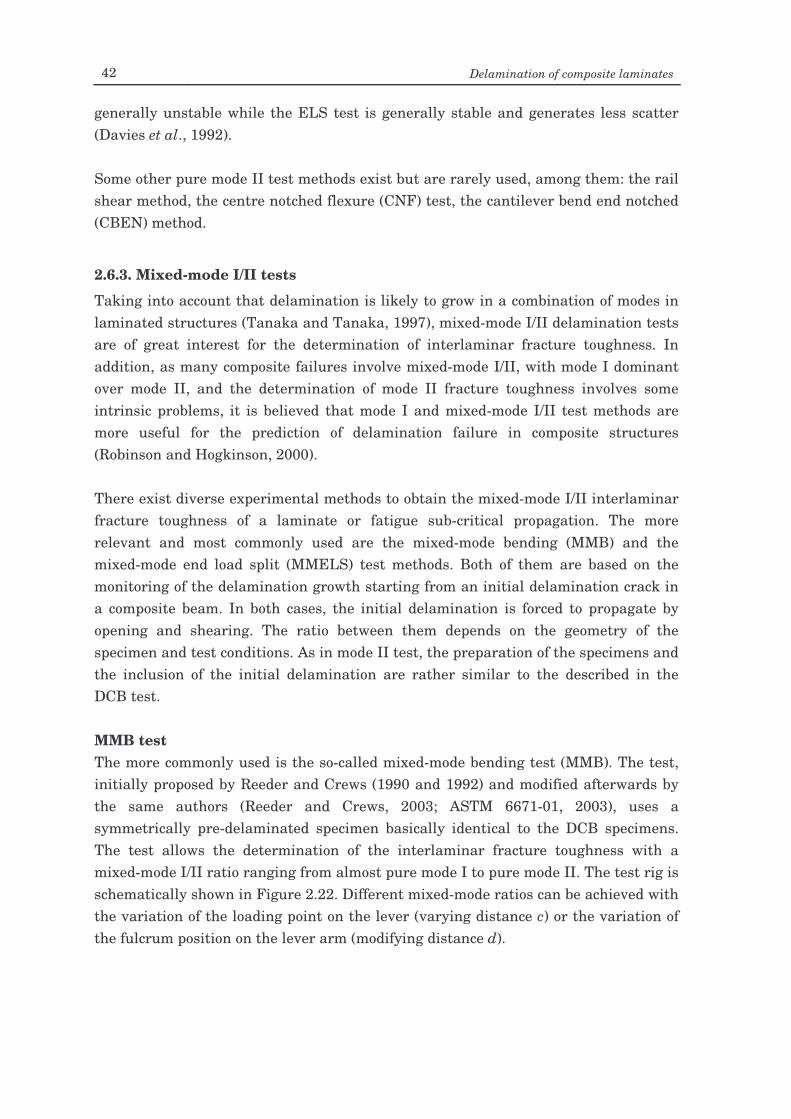
42 Delamination of composite laminates
generally unstable while the ELS test is generally stable and generates less scatter (Davies et al., 1992). Some other pure mode II test methods exist but are rarely used, among them: the rail shear method, the centre notched flexure (CNF) test, the cantilever bend end notched (CBEN) method.
2.6.3. Mixed-mode I/II tests
Taking into account that delamination is likely to grow in a combination of modes in laminated structures (Tanaka and Tanaka, 1997), mixed-mode I/II delamination tests are of great interest for the determination of interlaminar fracture toughness. In addition, as many composite failures involve mixed-mode I/II, with mode I dominant over mode II, and the determination of mode II fracture toughness involves some intrinsic problems, it is believed that mode I and mixed-mode I/II test methods are more useful for the prediction of delamination failure in composite structures (Robinson and Hogkinson, 2000). There exist diverse experimental methods to obtain the mixed-mode I/II interlaminar fracture toughness of a laminate or fatigue sub-critical propagation. The more relevant and most commonly used are the mixed-mode bending (MMB) and the mixed-mode end load split (MMELS) test methods. Both of them are based on the monitoring of the delamination growth starting from an initial delamination crack in a composite beam. In both cases, the initial delamination is forced to propagate by opening and shearing. The ratio between them depends on the geometry of the specimen and test conditions. As in mode II test, the preparation of the specimens and the inclusion of the initial delamination are rather similar to the described in the DCB test. MMB test The more commonly used is the so-called mixed-mode bending test (MMB). The test, initially proposed by Reeder and Crews (1990 and 1992) and modified afterwards by the same authors (Reeder and Crews, 2003; ASTM 6671-01, 2003), uses a symmetrically pre-delaminated specimen basically identical to the DCB specimens. The test allows the determination of the interlaminar fracture toughness with a mixed-mode I/II ratio ranging from almost pure mode I to pure mode II. The test rig is schematically shown in Figure 2.22. Different mixed-mode ratios can be achieved with the variation of the loading point on the lever (varying distance c) or the variation of the fulcrum position on the lever arm (modifying distance d).
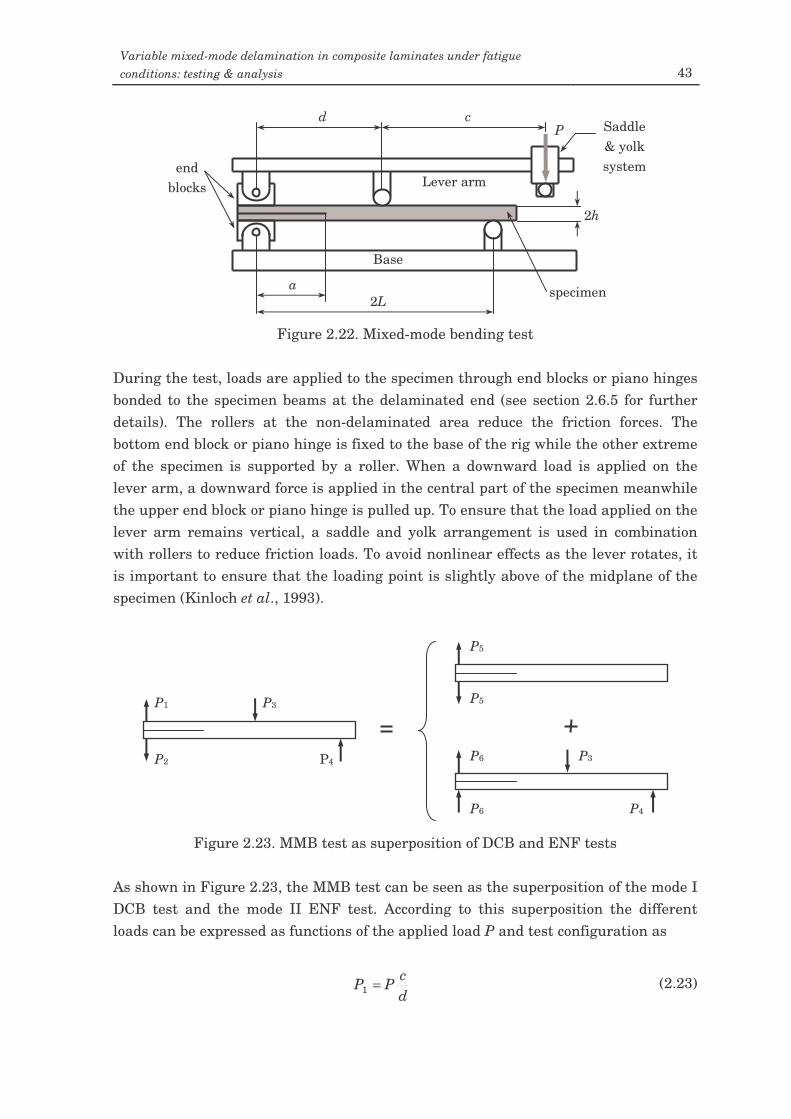
Variable mixed-mode delamination in composite laminates under fatigue conditions: testing & analysis 43
Figure 2.22. Mixed-mode bending test
During the test, loads are applied to the specimen through end blocks or piano hinges bonded to the specimen beams at the delaminated end (see section 2.6.5 for further details). The rollers at the non-delaminated area reduce the friction forces. The bottom end block or piano hinge is fixed to the base of the rig while the other extreme of the specimen is supported by a roller. When a downward load is applied on the lever arm, a downward force is applied in the central part of the specimen meanwhile the upper end block or piano hinge is pulled up. To ensure that the load applied on the lever arm remains vertical, a saddle and yolk arrangement is used in combination with rollers to reduce friction loads. To avoid nonlinear effects as the lever rotates, it is important to ensure that the loading point is slightly above of the midplane of the specimen (Kinloch et al., 1993).
Figure 2.23. MMB test as superposition of DCB and ENF tests
As shown in Figure 2.23, the MMB test can be seen as the superposition of the mode I DCB test and the mode II ENF test. According to this superposition the different loads can be expressed as functions of the applied load P and test configuration as
dcPP =1 (2.23)
2h
2L a
d c P
Base
specimen
Lever arm
Saddle & yolk system end
blocks
P3 P1
P2 P4
P5
P5
P6
P6 P3
P4
44 Delamination of composite laminates
−+= 122 L
dcPP (2.24)
+=d
LcPP3 (2.25)
LdcPP
24+= (2.26)
++−=Ldc
ddcPP
225 (2.27)
+−+=Ldc
ddcPP
226 (2.28)
Taking into account the superposition shown in Figure 2.23 and according to the beam theory approach, the mode I and mode II energy release rate as functions of the applied load and the compliance of the system for the MMB test can be respectively determined as
2
311
2
22
I 12
3
+−+=dc
Ldc
hEbaPG (2.29)
2
311
2
22
II 124
9
−−+=dc
Ldc
hEbaPG (2.30)
( )
−−+−+
−−++
+−+=22222
311
3
12
212
612
84 d
cLdc
Ldld
dc
Ldc
dc
Ldc
hbEaC (2.31)
where the last term in the square-parenthesis corresponds to the compliance of the system without delamination. Then, the energy release rate can also be obtained as a function of the displacement according to
24
311
2
I
12
4
3
+−+=
dc
Ldca
hEG
δ
(2.32)
( ) 22223
2311
2
II
122
23
9
−−+
−+
=
dc
Ldc
LdLda
ahEG
δ
(2.33)
Usually, and according to the standards (ASTM 6671-01, 2003), the distance d is taken as L. In this way, all the previous expressions become simpler. However, only a limited range of crack lengths is achieved (Greenhalgh, 1998). When the position of the fulcrum on the lever arm is set to the half span of the specimen, d = L, the mixed-mode ratio depends only on the distance c. For short c distances, mode II is predominant. On the contrary, for larger c values, mode I predominates.
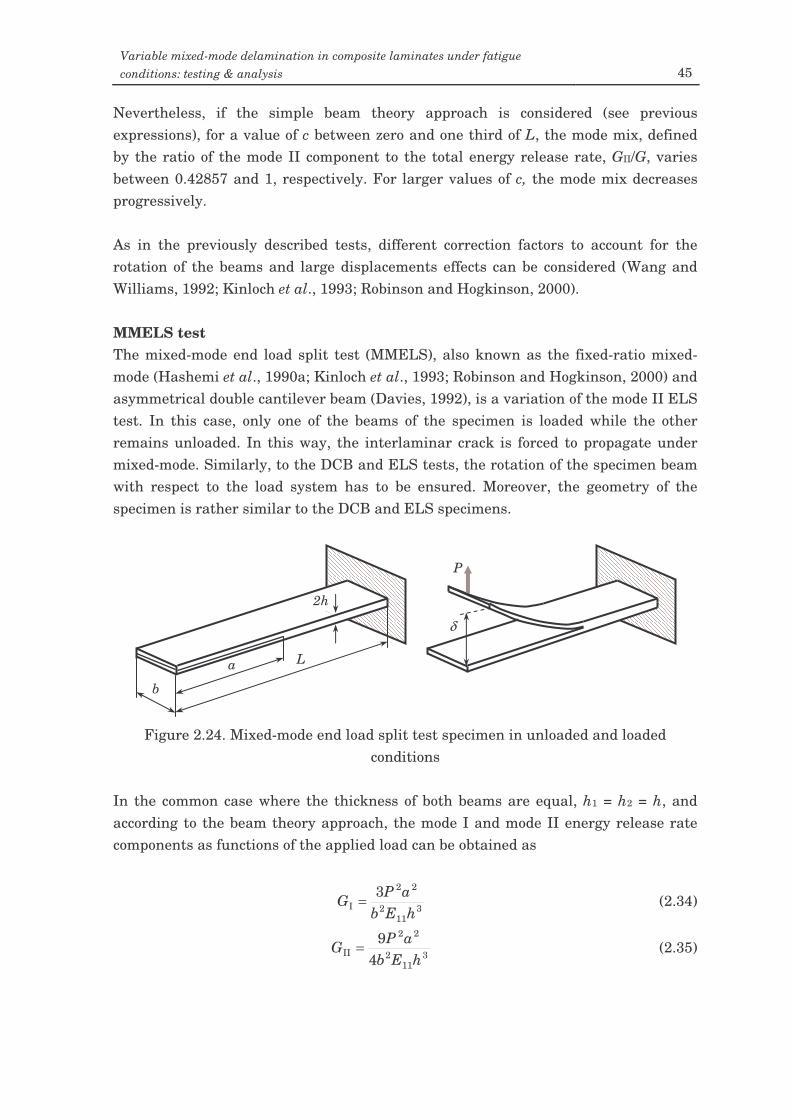
Variable mixed-mode delamination in composite laminates under fatigue conditions: testing & analysis 45
Nevertheless, if the simple beam theory approach is considered (see previous expressions), for a value of c between zero and one third of L, the mode mix, defined by the ratio of the mode II component to the total energy release rate, GII/G, varies between 0.42857 and 1, respectively. For larger values of c, the mode mix decreases progressively. As in the previously described tests, different correction factors to account for the rotation of the beams and large displacements effects can be considered (Wang and Williams, 1992; Kinloch et al., 1993; Robinson and Hogkinson, 2000). MMELS test The mixed-mode end load split test (MMELS), also known as the fixed-ratio mixed-mode (Hashemi et al., 1990a; Kinloch et al., 1993; Robinson and Hogkinson, 2000) and asymmetrical double cantilever beam (Davies, 1992), is a variation of the mode II ELS test. In this case, only one of the beams of the specimen is loaded while the other remains unloaded. In this way, the interlaminar crack is forced to propagate under mixed-mode. Similarly, to the DCB and ELS tests, the rotation of the specimen beam with respect to the load system has to be ensured. Moreover, the geometry of the specimen is rather similar to the DCB and ELS specimens.
Figure 2.24. Mixed-mode end load split test specimen in unloaded and loaded
conditions In the common case where the thickness of both beams are equal, h1 = h2 = h, and according to the beam theory approach, the mode I and mode II energy release rate components as functions of the applied load can be obtained as
311
2
22
I3
hEbaPG = (2.34)
311
2
22
II 49
hEbaPG = (2.35)
L a
b
2h
δ
P
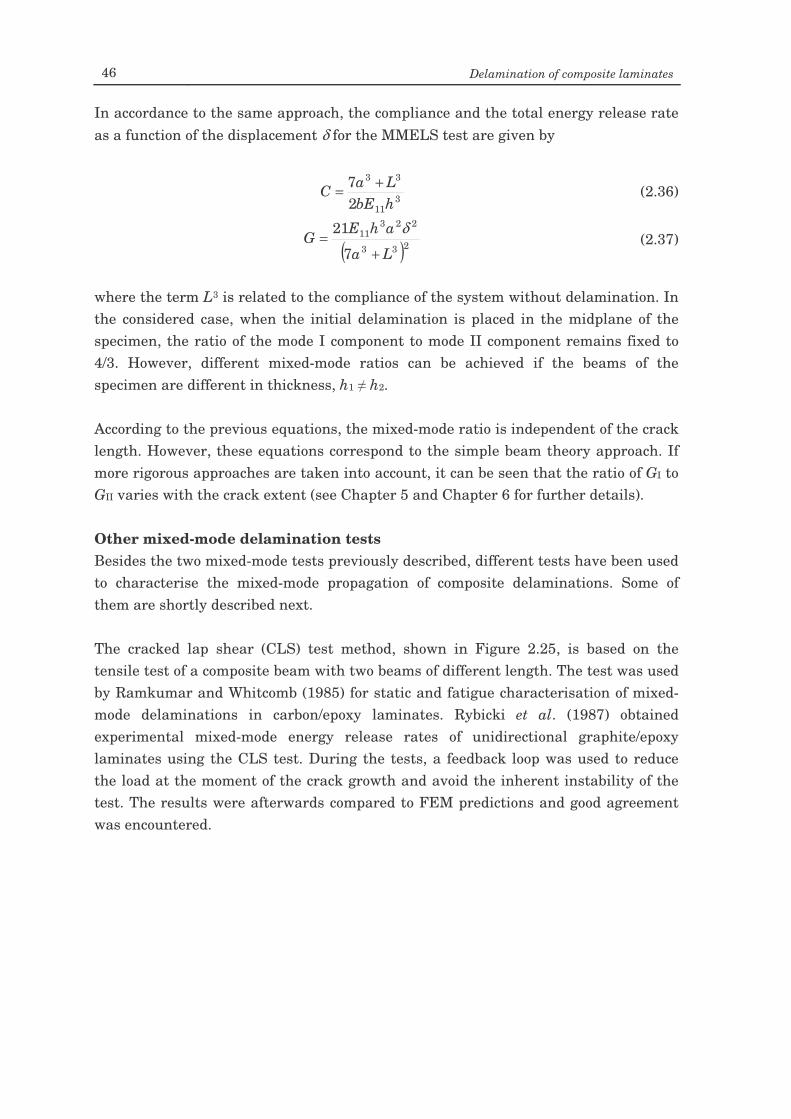
46 Delamination of composite laminates
In accordance to the same approach, the compliance and the total energy release rate as a function of the displacement δ for the MMELS test are given by
311
33
27
hbELaC += (2.36)
( )233
22311
7
21
La
ahEG
+=
δ (2.37)
where the term L3 is related to the compliance of the system without delamination. In the considered case, when the initial delamination is placed in the midplane of the specimen, the ratio of the mode I component to mode II component remains fixed to 4/3. However, different mixed-mode ratios can be achieved if the beams of the specimen are different in thickness, h1 h2. According to the previous equations, the mixed-mode ratio is independent of the crack length. However, these equations correspond to the simple beam theory approach. If more rigorous approaches are taken into account, it can be seen that the ratio of GI to GII varies with the crack extent (see Chapter 5 and Chapter 6 for further details). Other mixed-mode delamination tests Besides the two mixed-mode tests previously described, different tests have been used to characterise the mixed-mode propagation of composite delaminations. Some of them are shortly described next. The cracked lap shear (CLS) test method, shown in Figure 2.25, is based on the tensile test of a composite beam with two beams of different length. The test was used by Ramkumar and Whitcomb (1985) for static and fatigue characterisation of mixed-mode delaminations in carbon/epoxy laminates. Rybicki et al. (1987) obtained experimental mixed-mode energy release rates of unidirectional graphite/epoxy laminates using the CLS test. During the tests, a feedback loop was used to reduce the load at the moment of the crack growth and avoid the inherent instability of the test. The results were afterwards compared to FEM predictions and good agreement was encountered.
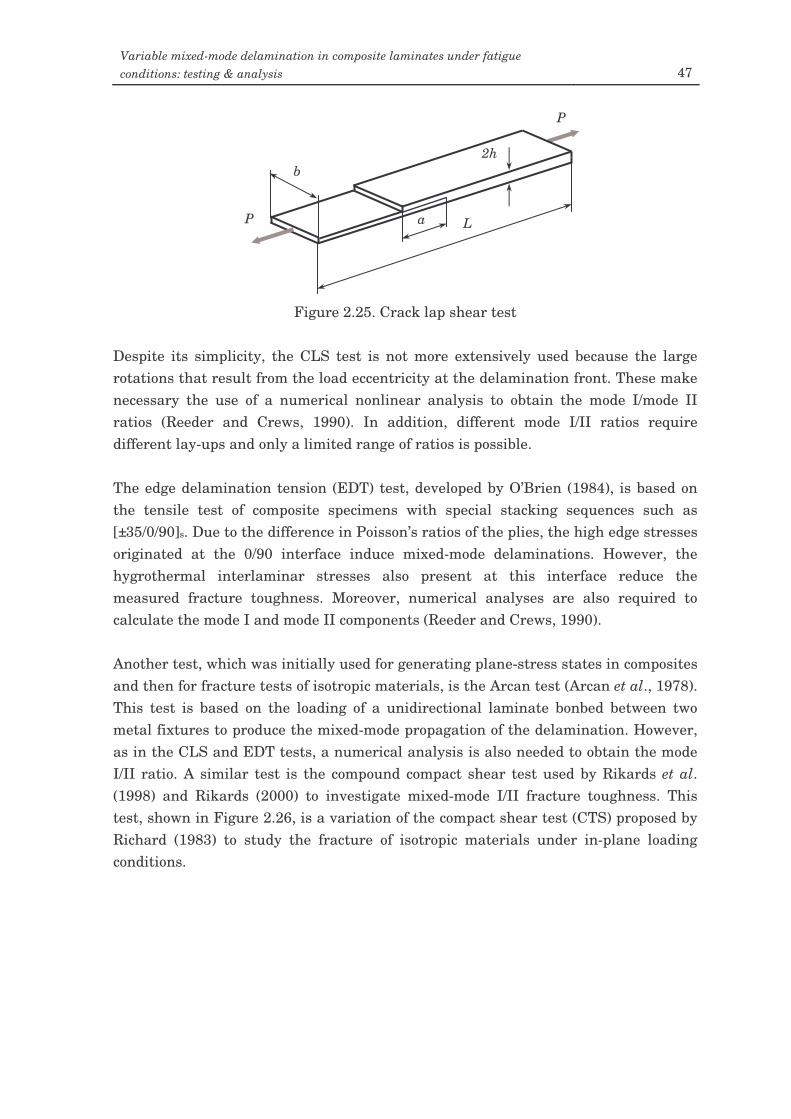
Variable mixed-mode delamination in composite laminates under fatigue conditions: testing & analysis 47
Figure 2.25. Crack lap shear test
Despite its simplicity, the CLS test is not more extensively used because the large rotations that result from the load eccentricity at the delamination front. These make necessary the use of a numerical nonlinear analysis to obtain the mode I/mode II ratios (Reeder and Crews, 1990). In addition, different mode I/II ratios require different lay-ups and only a limited range of ratios is possible. The edge delamination tension (EDT) test, developed by O’Brien (1984), is based on the tensile test of composite specimens with special stacking sequences such as [±35/0/90]s. Due to the difference in Poisson’s ratios of the plies, the high edge stresses originated at the 0/90 interface induce mixed-mode delaminations. However, the hygrothermal interlaminar stresses also present at this interface reduce the measured fracture toughness. Moreover, numerical analyses are also required to calculate the mode I and mode II components (Reeder and Crews, 1990). Another test, which was initially used for generating plane-stress states in composites and then for fracture tests of isotropic materials, is the Arcan test (Arcan et al., 1978). This test is based on the loading of a unidirectional laminate bonbed between two metal fixtures to produce the mixed-mode propagation of the delamination. However, as in the CLS and EDT tests, a numerical analysis is also needed to obtain the mode I/II ratio. A similar test is the compound compact shear test used by Rikards et al. (1998) and Rikards (2000) to investigate mixed-mode I/II fracture toughness. This test, shown in Figure 2.26, is a variation of the compact shear test (CTS) proposed by Richard (1983) to study the fracture of isotropic materials under in-plane loading conditions.
P
L a
b 2h
P
48 Delamination of composite laminates
Figure 2.26. Compact tension test: (a) loading of the specimen and (b) geometry of the
compound version (Rikards, 2000) There exists an asymmetric version of the double cantilever beam test (ADCB) proposed by Bradley and Cohen (1985) to obtain mixed-mode interlaminar fracture toughness. This test consists in loading the two beams of a unidirectional DCB-type specimen with different loads. In fact, the test can be seen as a superposition of the DCB and ELS tests. The un-cracked end of the specimen is fixed to the test rig while vertical loads are applied to both specimen beams. Loads can be chosen to produce a full range of mode I/II ratios; opposite loads produce a pure mode I component and equal loads produce a pure mode II component. This test avoids most of the problems described for the previous mixed-mode methods but requires a complex loading system to control simultaneously the two applied loads. Another version of the same test is based on the use of beams with different thicknesses. In this way, the asymmetry is located in the geometry of the specimen while single or opposite loads are applied (Greenhalgh, 1998). Figure 2.27 shows the mixed-mode flexure test (MMF) proposed by Russell and Street (1985). This test, also known as single leg bending (SLB), is a combination of the ENF and the CLS tests in which the interlaminar crack is forced to grow under a mixed-mode condition. However, different mode I/II ratios require different thicknesses of the specimen beams that might influence the measure of the fracture toughness.
(a) (b)
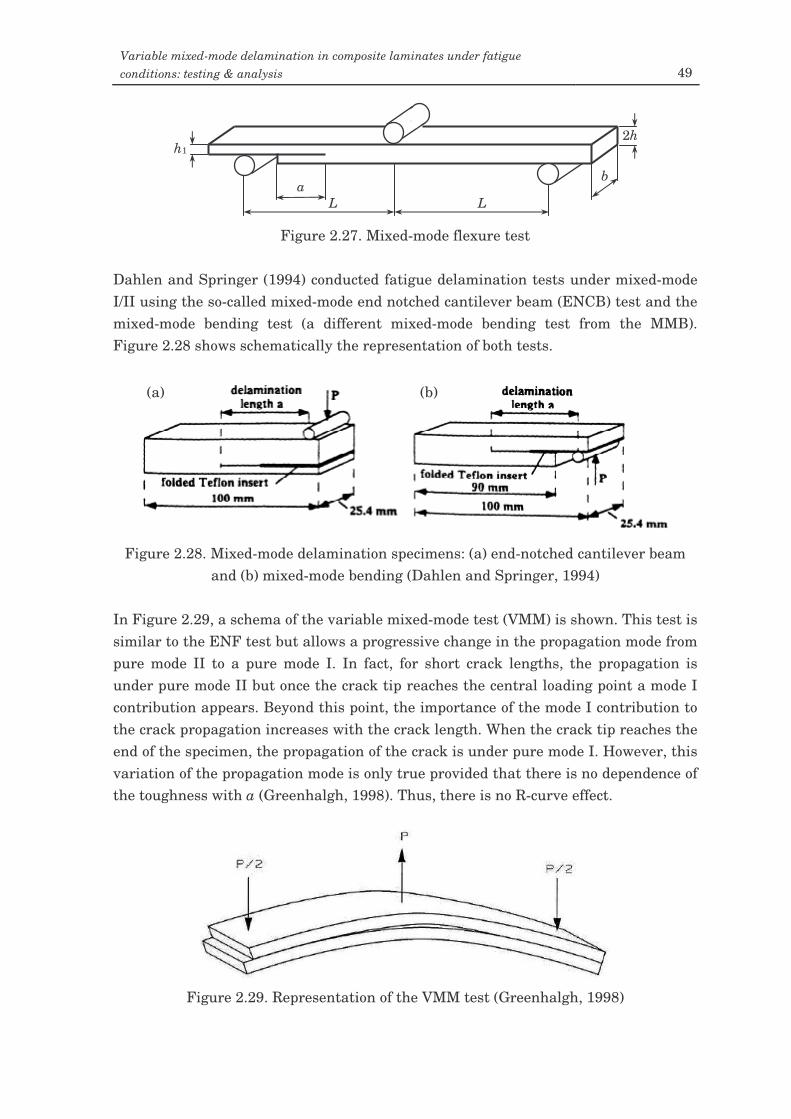
Variable mixed-mode delamination in composite laminates under fatigue conditions: testing & analysis 49
Figure 2.27. Mixed-mode flexure test
Dahlen and Springer (1994) conducted fatigue delamination tests under mixed-mode I/II using the so-called mixed-mode end notched cantilever beam (ENCB) test and the mixed-mode bending test (a different mixed-mode bending test from the MMB). Figure 2.28 shows schematically the representation of both tests.
Figure 2.28. Mixed-mode delamination specimens: (a) end-notched cantilever beam
and (b) mixed-mode bending (Dahlen and Springer, 1994) In Figure 2.29, a schema of the variable mixed-mode test (VMM) is shown. This test is similar to the ENF test but allows a progressive change in the propagation mode from pure mode II to a pure mode I. In fact, for short crack lengths, the propagation is under pure mode II but once the crack tip reaches the central loading point a mode I contribution appears. Beyond this point, the importance of the mode I contribution to the crack propagation increases with the crack length. When the crack tip reaches the end of the specimen, the propagation of the crack is under pure mode I. However, this variation of the propagation mode is only true provided that there is no dependence of the toughness with a (Greenhalgh, 1998). Thus, there is no R-curve effect.
Figure 2.29. Representation of the VMM test (Greenhalgh, 1998)
2h
a L L
b
h1
(a) (b)
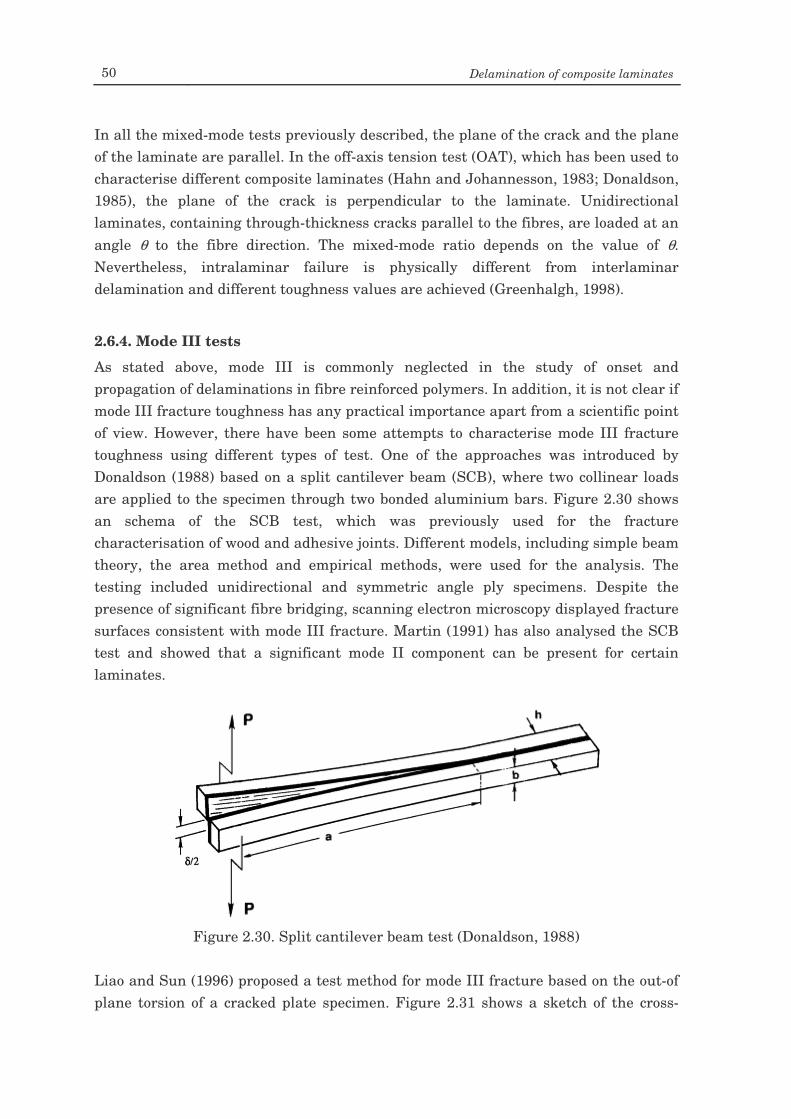
50 Delamination of composite laminates
In all the mixed-mode tests previously described, the plane of the crack and the plane of the laminate are parallel. In the off-axis tension test (OAT), which has been used to characterise different composite laminates (Hahn and Johannesson, 1983; Donaldson, 1985), the plane of the crack is perpendicular to the laminate. Unidirectional laminates, containing through-thickness cracks parallel to the fibres, are loaded at an angle θ to the fibre direction. The mixed-mode ratio depends on the value of θ. Nevertheless, intralaminar failure is physically different from interlaminar delamination and different toughness values are achieved (Greenhalgh, 1998).
2.6.4. Mode III tests
As stated above, mode III is commonly neglected in the study of onset and propagation of delaminations in fibre reinforced polymers. In addition, it is not clear if mode III fracture toughness has any practical importance apart from a scientific point of view. However, there have been some attempts to characterise mode III fracture toughness using different types of test. One of the approaches was introduced by Donaldson (1988) based on a split cantilever beam (SCB), where two collinear loads are applied to the specimen through two bonded aluminium bars. Figure 2.30 shows an schema of the SCB test, which was previously used for the fracture characterisation of wood and adhesive joints. Different models, including simple beam theory, the area method and empirical methods, were used for the analysis. The testing included unidirectional and symmetric angle ply specimens. Despite the presence of significant fibre bridging, scanning electron microscopy displayed fracture surfaces consistent with mode III fracture. Martin (1991) has also analysed the SCB test and showed that a significant mode II component can be present for certain laminates.
Figure 2.30. Split cantilever beam test (Donaldson, 1988)
Liao and Sun (1996) proposed a test method for mode III fracture based on the out-of plane torsion of a cracked plate specimen. Figure 2.31 shows a sketch of the cross-
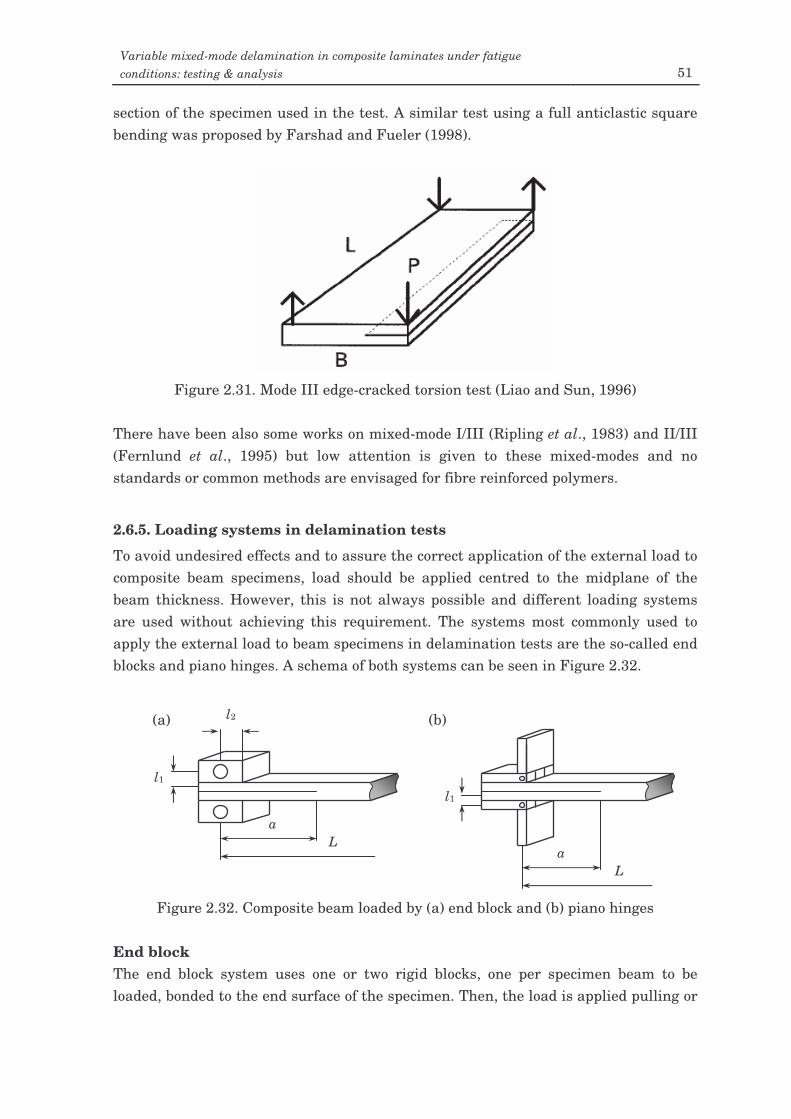
Variable mixed-mode delamination in composite laminates under fatigue conditions: testing & analysis 51
section of the specimen used in the test. A similar test using a full anticlastic square bending was proposed by Farshad and Fueler (1998).
Figure 2.31. Mode III edge-cracked torsion test (Liao and Sun, 1996)
There have been also some works on mixed-mode I/III (Ripling et al., 1983) and II/III (Fernlund et al., 1995) but low attention is given to these mixed-modes and no standards or common methods are envisaged for fibre reinforced polymers.
2.6.5. Loading systems in delamination tests
To avoid undesired effects and to assure the correct application of the external load to composite beam specimens, load should be applied centred to the midplane of the beam thickness. However, this is not always possible and different loading systems are used without achieving this requirement. The systems most commonly used to apply the external load to beam specimens in delamination tests are the so-called end blocks and piano hinges. A schema of both systems can be seen in Figure 2.32.
Figure 2.32. Composite beam loaded by (a) end block and (b) piano hinges
End block The end block system uses one or two rigid blocks, one per specimen beam to be loaded, bonded to the end surface of the specimen. Then, the load is applied pulling or
a L
l1
l2
a L
l1
(a) (b)
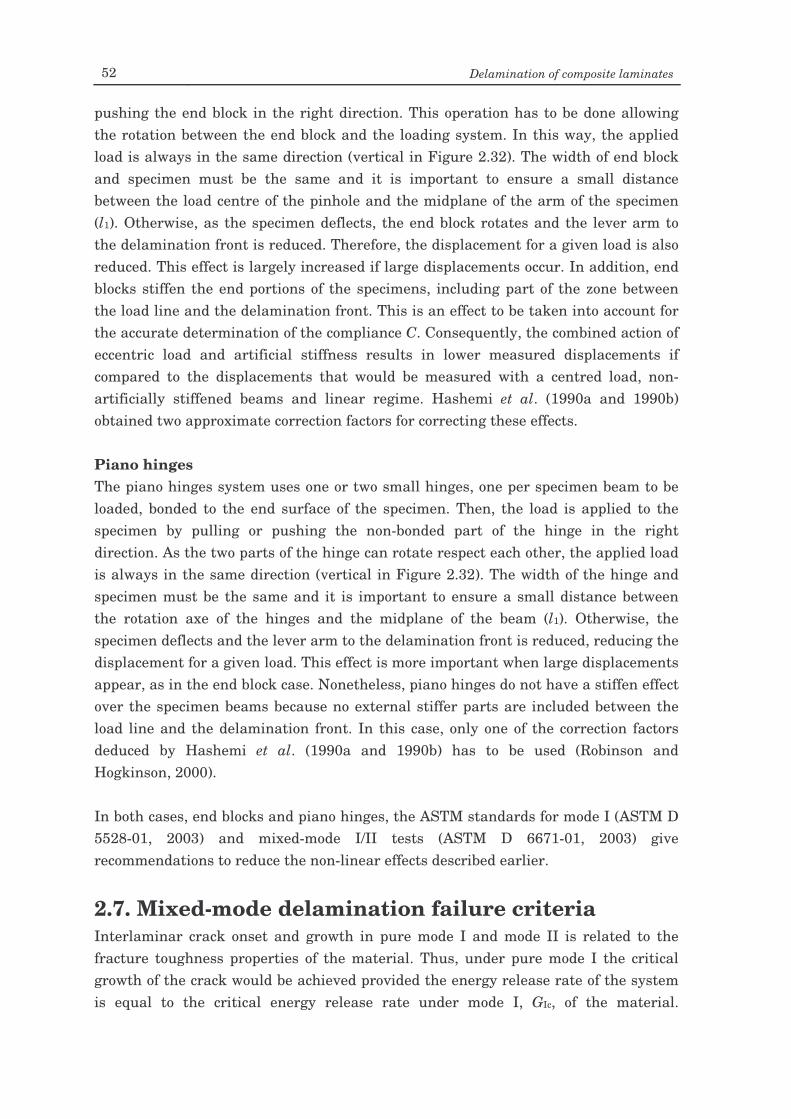
52 Delamination of composite laminates
pushing the end block in the right direction. This operation has to be done allowing the rotation between the end block and the loading system. In this way, the applied load is always in the same direction (vertical in Figure 2.32). The width of end block and specimen must be the same and it is important to ensure a small distance between the load centre of the pinhole and the midplane of the arm of the specimen (l1). Otherwise, as the specimen deflects, the end block rotates and the lever arm to the delamination front is reduced. Therefore, the displacement for a given load is also reduced. This effect is largely increased if large displacements occur. In addition, end blocks stiffen the end portions of the specimens, including part of the zone between the load line and the delamination front. This is an effect to be taken into account for the accurate determination of the compliance C. Consequently, the combined action of eccentric load and artificial stiffness results in lower measured displacements if compared to the displacements that would be measured with a centred load, non-artificially stiffened beams and linear regime. Hashemi et al. (1990a and 1990b) obtained two approximate correction factors for correcting these effects. Piano hinges The piano hinges system uses one or two small hinges, one per specimen beam to be loaded, bonded to the end surface of the specimen. Then, the load is applied to the specimen by pulling or pushing the non-bonded part of the hinge in the right direction. As the two parts of the hinge can rotate respect each other, the applied load is always in the same direction (vertical in Figure 2.32). The width of the hinge and specimen must be the same and it is important to ensure a small distance between the rotation axe of the hinges and the midplane of the beam (l1). Otherwise, the specimen deflects and the lever arm to the delamination front is reduced, reducing the displacement for a given load. This effect is more important when large displacements appear, as in the end block case. Nonetheless, piano hinges do not have a stiffen effect over the specimen beams because no external stiffer parts are included between the load line and the delamination front. In this case, only one of the correction factors deduced by Hashemi et al. (1990a and 1990b) has to be used (Robinson and Hogkinson, 2000). In both cases, end blocks and piano hinges, the ASTM standards for mode I (ASTM D 5528-01, 2003) and mixed-mode I/II tests (ASTM D 6671-01, 2003) give recommendations to reduce the non-linear effects described earlier.
2.7. Mixed-mode delamination failure criteria Interlaminar crack onset and growth in pure mode I and mode II is related to the fracture toughness properties of the material. Thus, under pure mode I the critical growth of the crack would be achieved provided the energy release rate of the system is equal to the critical energy release rate under mode I, GIc, of the material.
Variable mixed-mode delamination in composite laminates under fatigue conditions: testing & analysis 53
Similarly, crack propagation under mode II would occur provided G is equal to GIIc. However, when mixed-mode loading is present, a specific failure criterion is needed for crack propagation. Many attempts have been made to describe the mixed-mode delamination failure response of composite laminates. The works of Greenhalgh (1998) and Reeder (1992) include good reviews on mixed-mode delamination criteria. Some of the more commonly used are briefly summarised in the following. As the GIc value of most of the epoxy matrix laminates is lower than the GIIc value, it can be considered that most structural delamination failures are controlled by mode I toughness. Therefore, the delamination criterion can be expressed as a function of GIc, except for the cases with a high contribution of mode II, where the criterion is expressed as a function of GIIc (Whitcomb, 1986). The criterion is simple to use and can be written as
IcI GG = (2.38)
IIcII GG = (2.39) Another criterion assumes delamination propagation if the total energy release rate, as the sum of the mode I and mode II components, reaches a critical value (Wu and Reuters, 1965). The criterion can be expressed as
cIII GGG =+ (2.40) The so-called linear criterion normalises each component of the fracture toughness and generates a linear locus between GIc and GIIc. This mixed-mode criterion is one of the most commonly used and is given by:
1IIc
II
Ic
I =+GG
GG
(2.41)
The power law criterion is a generalisation of the linear criterion that allows for the non-linearity of the fracture toughness locus. The power law criterion is expressed as (Whitcomb, 1986):
1IIc
II
Ic
I =
+
nm
GG
GG
(2.42)
where m and n are material parameters that must be determined experimentally. When the values of m and n are higher than the unity, the locus is convex, while
54 Delamination of composite laminates
when m and n < 1, the failure locus is concave. If n > m, the locus is skewed towards the mode I axis. The case of m = n = 1 coincides with the linear criterion. A similar criterion was proposed by Yan et al. (1991) assuming a polynomial function to describe the fracture toughness. The criterion is given by
2
I
II
I
IIIcIII
+
+=+
GG
GG
GGG τρ (2.43)
where the material parameters ρ and τ must be determined experimentally. By the adjustment of the correct material parameters, a wide range of material responses with both concave and convex failure locus can be modelled. Moreover, at high mode I ratios, the introduction of a mode II component increases the mode I magnitude, which is in accordance with many composite systems. However, the criterion is unable to model low mode I to mode II ratios. Therefore, and according to Reeder (1992), this criterion is inappropriate as a general mixed-mode criterion. Hahn (1983) proposed a mixed-mode fracture criterion assuming the fracture toughness as a linear function of the critical mode I stress intensity factor. Expressed in terms of energy release rates, the criterion is given by
( )Ic
IIcIIcIIcIII G
GGGGGG −−=+ (2.44)
The criterion is completely defined by the values of GIc and GIIc and describes a concave failure envelope. A variation of the previous criterion is the so-called exponential K criterion:
( ) II
I
IcIIcIcIIIGG
eGGGGGη
−+=+ (2.45)
where η is an arbitrary constant. According to Reeder (1992), the K criterion presents a strange jog in the failure curve near the mode I axis when η 1. Through investigation of the fracture surface morphology Hahn and Johannesson (1983) developed a mixed-mode failure criterion by modelling delamination growth through hackle (shear cusp) formation. The hackle criterion can be written in terms of the pure-mode energy release rates as:
22
11
I
IIIcIII 1
EE
GG
GGG +Ω+Ω−=+ (2.46)
Variable mixed-mode delamination in composite laminates under fatigue conditions: testing & analysis 55
where Ω is a constant that allows to model different material responses. The terms included in the square root are experimentally related to a measure of the hackle angle. However, except when Ω = 0, the hackle criterion predicts an infinite GIIc, therefore being inappropriate as a general mixed-mode criterion (Reeder, 1992). To overcome this inconvenient the previous expression was modified to give the exponential hackle (Donaldson, 1985):
( ) ( )QeGGGGG −−+=+ 1IIcIcIIcIII
γ (2.47) where
22
11
I
II1EE
GG
Q += (2.48)
and γ is a constant that can be chosen to model different material behaviours, as well as concave and convex failure envelopes. Based on the crack opening displacement (COD) approach Hashemi et al. (1987) proposed a mixed-mode failure criterion. Delamination is assumed to propagate when either mode I or mode II critical crack opening displacement is reached. The mode I and mode II expressions of the criterion can be respectively written as
11
22
Ic
I
I
Ic
IIc
II
31
EE
GG
GG
GG
−= (2.49)
22
11
Ic
II2
Ic
IIc
II
Ic
Ic
I 3EE
GG
GG
GG
GG
−
= (2.50)
A simple interaction criterion was developed by Ramkumar et al. (1985):
1IIcIc
III2
IIc
II2
Ic
I =+
+
GGGG
GG
GG
(2.51)
Based on a measure of how much effect the mode I and mode II loadings have on each other, Williams (1989) developed a mixed-mode failure criterion. The criterion can be expressed as a function of the interaction parameter, κ, as
011IIcIc
III
IIc
II
Ic
I =−
−+
−
GGGG
GG
GG κ (2.52)
56 Delamination of composite laminates
The value of κ has to be determined experimentally. Large values of κ indicate a great interaction between the mode I and mode II components. A large change in the components has little effect on Gc when the value of κ is low. On the contrary, small changes in the components have a large effect on Gc when the value of κ is large. If it is taken into account that fibre bridging and friction can change the degree of interaction, a general interaction criterion can be derived (Hashemi et al., 1991):
011IIcIc
III
III
I
IIc
II
Ic
I =
++−
−+
−
GGGG
GGG
GG
GG ϕκ (2.53)
where κ and ϕ are constants. This general interaction criterion can model all the responses of the simpler interaction criterion. However, it is rather complicated and difficult to use. Meziere et al. (2000) also proposed an interaction mixed-mode failure criterion. The criterion was developed after the study of mixed-mode delamination of carbon/epoxy laminates under quasi-static and fatigue loading at different temperature and humidity conditions and is given by
( ) IIcII
IIcIIIcI 1 GkG
GGGG
−−−
= (2.54)
where k is the interaction parameter between the mode I and mode II components. A simple bilinear criterion based on fractographic observations was developed by Reeder (1992):
IcIII GGG += ξ (2.55)
IIcIII GGG ζζ −= (2.56) The criterion depends upon the two parameters, ξ and ζ, which are the slopes of the two line segments used in the criterion. The equation to be used depends on the mixed-mode regime, although fitting experimental data to these expressions is complicated. Based on the study of laminated materials and bimaterial interfaces, Hutchinson and Suo (1992) assumed that the fracture toughness of the interface between the plies where the delamination grows depends on the mode mix. The authors described the variation of the critical energy release rate as
Variable mixed-mode delamination in composite laminates under fatigue conditions: testing & analysis 57
( ) ψ2IIcIcIIc
IIcIcc sinGGG
GGG
−+= (2.57)
where the mode mix angle ψ is defined as
=
I
IIarctanKKψ (2.58)
The criterion proposed by Benzeggagh and Kenane (1996) is one of the most widely used. The criterion is based on the stress intensity factor around the delamination crack tip and can be expressed as a function of the energy release rates:
( )m
GGG
GGGGG
+−+=+
III
IIIcIIcIcIII (2.59)
where the constant m must be determined experimentally. A variation of the previous expression has also been used in which the denominator (GI + GII) is replaced by GIIc. Charalambides et al. (1992) and Kinloch et al. (1993) proposed a criterion based on the hypothesis that an induced critical mode I component, G0, is exceeded during the growth of the delamination. Thus, the apparent mode II fracture is only due to a mode I fracture at an angle to the plane of the laminate. The hypothesis can be expressed as:
ω2III0 sinGGG += (2.60)
where ω is the slope of the surface roughness, which can be found as
IIc
Ic2sinGG
=ω (2.61)
The criterion is then written as
( ) ( ) ( )( )ωφφφφ 20
20
2III0 sinsincos −+−+= GGG (2.62)
where φ0 is the phase angle of the elastic mismatch and φ is given by:
II
I2cotGG
=φ (2.63)
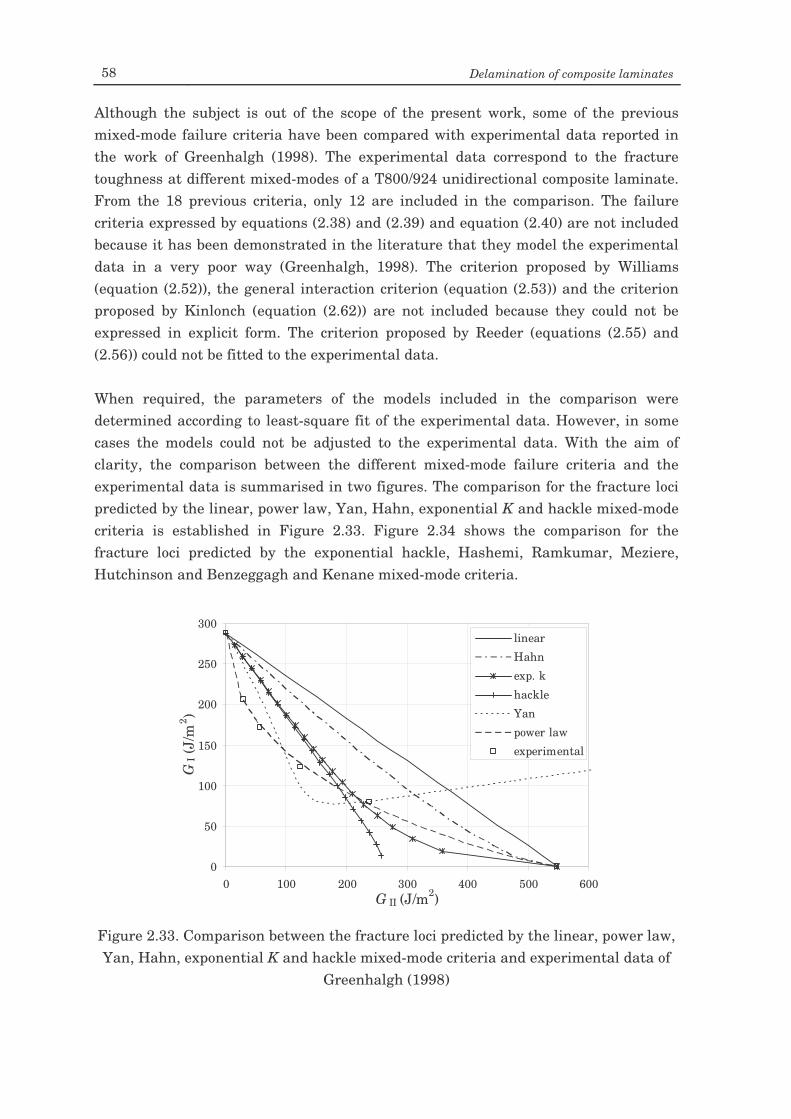
58 Delamination of composite laminates
Although the subject is out of the scope of the present work, some of the previous mixed-mode failure criteria have been compared with experimental data reported in the work of Greenhalgh (1998). The experimental data correspond to the fracture toughness at different mixed-modes of a T800/924 unidirectional composite laminate. From the 18 previous criteria, only 12 are included in the comparison. The failure criteria expressed by equations (2.38) and (2.39) and equation (2.40) are not included because it has been demonstrated in the literature that they model the experimental data in a very poor way (Greenhalgh, 1998). The criterion proposed by Williams (equation (2.52)), the general interaction criterion (equation (2.53)) and the criterion proposed by Kinlonch (equation (2.62)) are not included because they could not be expressed in explicit form. The criterion proposed by Reeder (equations (2.55) and (2.56)) could not be fitted to the experimental data. When required, the parameters of the models included in the comparison were determined according to least-square fit of the experimental data. However, in some cases the models could not be adjusted to the experimental data. With the aim of clarity, the comparison between the different mixed-mode failure criteria and the experimental data is summarised in two figures. The comparison for the fracture loci predicted by the linear, power law, Yan, Hahn, exponential K and hackle mixed-mode criteria is established in Figure 2.33. Figure 2.34 shows the comparison for the fracture loci predicted by the exponential hackle, Hashemi, Ramkumar, Meziere, Hutchinson and Benzeggagh and Kenane mixed-mode criteria.
0
50
100
150
200
250
300
0 100 200 300 400 500 600G II (J/m2)
GI (
J/m
2 )
linear
Hahn
exp. k
hackle
Yan
power law
experimental
Figure 2.33. Comparison between the fracture loci predicted by the linear, power law, Yan, Hahn, exponential K and hackle mixed-mode criteria and experimental data of
Greenhalgh (1998)
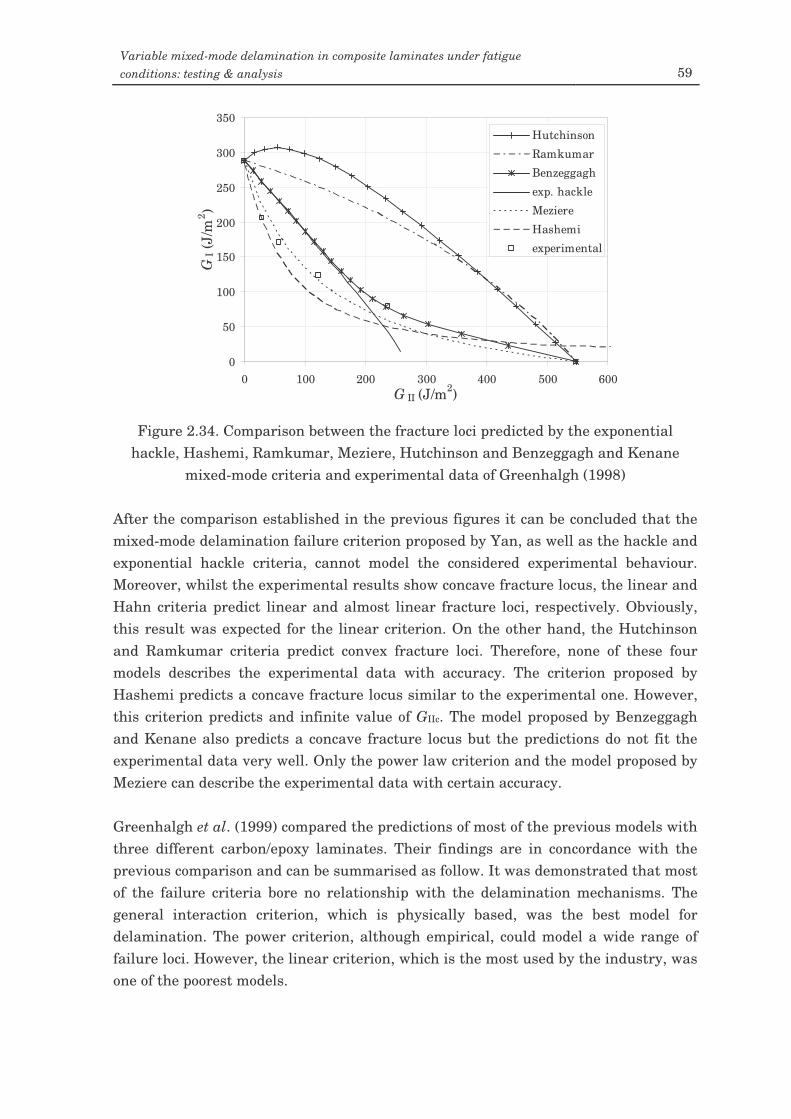
Variable mixed-mode delamination in composite laminates under fatigue conditions: testing & analysis 59
0
50
100
150
200
250
300
350
0 100 200 300 400 500 600G II (J/m2)
GI (
J/m
2 )
Hutchinson
Ramkumar
Benzeggagh
exp. hackle
Meziere
Hashemi
experimental
Figure 2.34. Comparison between the fracture loci predicted by the exponential
hackle, Hashemi, Ramkumar, Meziere, Hutchinson and Benzeggagh and Kenane mixed-mode criteria and experimental data of Greenhalgh (1998)
After the comparison established in the previous figures it can be concluded that the mixed-mode delamination failure criterion proposed by Yan, as well as the hackle and exponential hackle criteria, cannot model the considered experimental behaviour. Moreover, whilst the experimental results show concave fracture locus, the linear and Hahn criteria predict linear and almost linear fracture loci, respectively. Obviously, this result was expected for the linear criterion. On the other hand, the Hutchinson and Ramkumar criteria predict convex fracture loci. Therefore, none of these four models describes the experimental data with accuracy. The criterion proposed by Hashemi predicts a concave fracture locus similar to the experimental one. However, this criterion predicts and infinite value of GIIc. The model proposed by Benzeggagh and Kenane also predicts a concave fracture locus but the predictions do not fit the experimental data very well. Only the power law criterion and the model proposed by Meziere can describe the experimental data with certain accuracy. Greenhalgh et al. (1999) compared the predictions of most of the previous models with three different carbon/epoxy laminates. Their findings are in concordance with the previous comparison and can be summarised as follow. It was demonstrated that most of the failure criteria bore no relationship with the delamination mechanisms. The general interaction criterion, which is physically based, was the best model for delamination. The power criterion, although empirical, could model a wide range of failure loci. However, the linear criterion, which is the most used by the industry, was one of the poorest models.

Chapter 3 Fatigue delamination
of composite laminates
3.1. Introduction Most of the in service failures of structural composite parts are due to fatigue. In addition, delamination is considered as the most important damage mechanism in composite laminates. Therefore, the combination of both factors, delamination and fatigue, is very negative for the integrity of a laminated composite structure. Some studies involving fatigue and delamination have been carried out to gain an improved knowledge about the subject. However, the delamination of a laminate under fatigue loading is far from being completely characterised or even understood. In this chapter, a review on the most relevant research carried out on fatigue delamination of composite laminates is presented. The review includes from scientific research on basic aspects of the fatigue propagation of interlaminar cracks, to those studies dealing with the influence of certain parameters on the fatigue crack growth rate. The most relevant criteria for the mixed-mode fatigue propagation of interlaminar cracks are also included and discussed. These models have in common that the variation of the propagation parameters with the mode mix is assumed to be monotonic. Although the existence of these monotonic models, in this chapter it will be demonstrated that these cannot reproduce certain experimental behaviours. Consequently, a new model derived from experimental results is proposed in this study. The main and distinct characteristic of the proposed model is the non-monotonic variation of the parameters with the mode mix. This non-monotonic variation of the parameters is justified by experimental data. A comparison between the non-monotonic, the monotonic models present in the literature and the experimental data is established. The results show that the non-monotonic model fits the experimental data better than the rest of the models. Only one monotonic model is able to capture the experimental tendency with certain accuracy.
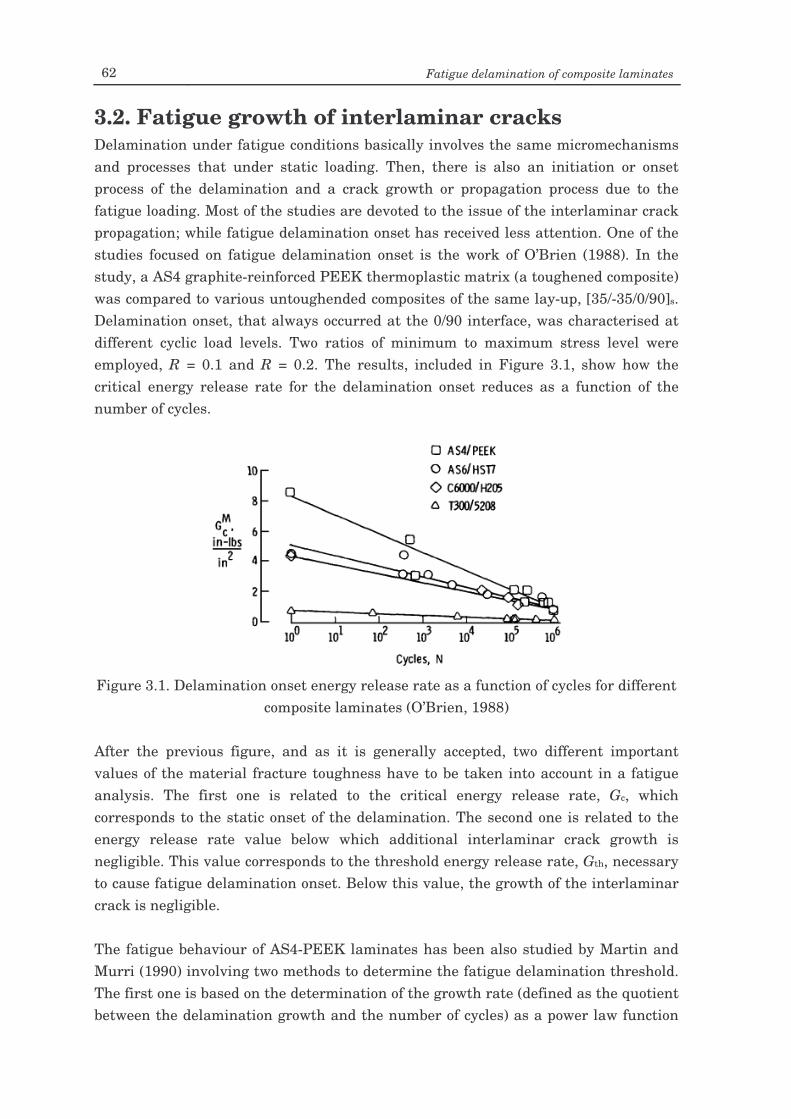
62 Fatigue delamination of composite laminates
3.2. Fatigue growth of interlaminar cracks Delamination under fatigue conditions basically involves the same micromechanisms and processes that under static loading. Then, there is also an initiation or onset process of the delamination and a crack growth or propagation process due to the fatigue loading. Most of the studies are devoted to the issue of the interlaminar crack propagation; while fatigue delamination onset has received less attention. One of the studies focused on fatigue delamination onset is the work of O’Brien (1988). In the study, a AS4 graphite-reinforced PEEK thermoplastic matrix (a toughened composite) was compared to various untoughended composites of the same lay-up, [35/-35/0/90]s. Delamination onset, that always occurred at the 0/90 interface, was characterised at different cyclic load levels. Two ratios of minimum to maximum stress level were employed, R = 0.1 and R = 0.2. The results, included in Figure 3.1, show how the critical energy release rate for the delamination onset reduces as a function of the number of cycles.
Figure 3.1. Delamination onset energy release rate as a function of cycles for different
composite laminates (O’Brien, 1988) After the previous figure, and as it is generally accepted, two different important values of the material fracture toughness have to be taken into account in a fatigue analysis. The first one is related to the critical energy release rate, Gc, which corresponds to the static onset of the delamination. The second one is related to the energy release rate value below which additional interlaminar crack growth is negligible. This value corresponds to the threshold energy release rate, Gth, necessary to cause fatigue delamination onset. Below this value, the growth of the interlaminar crack is negligible. The fatigue behaviour of AS4-PEEK laminates has been also studied by Martin and Murri (1990) involving two methods to determine the fatigue delamination threshold. The first one is based on the determination of the growth rate (defined as the quotient between the delamination growth and the number of cycles) as a power law function
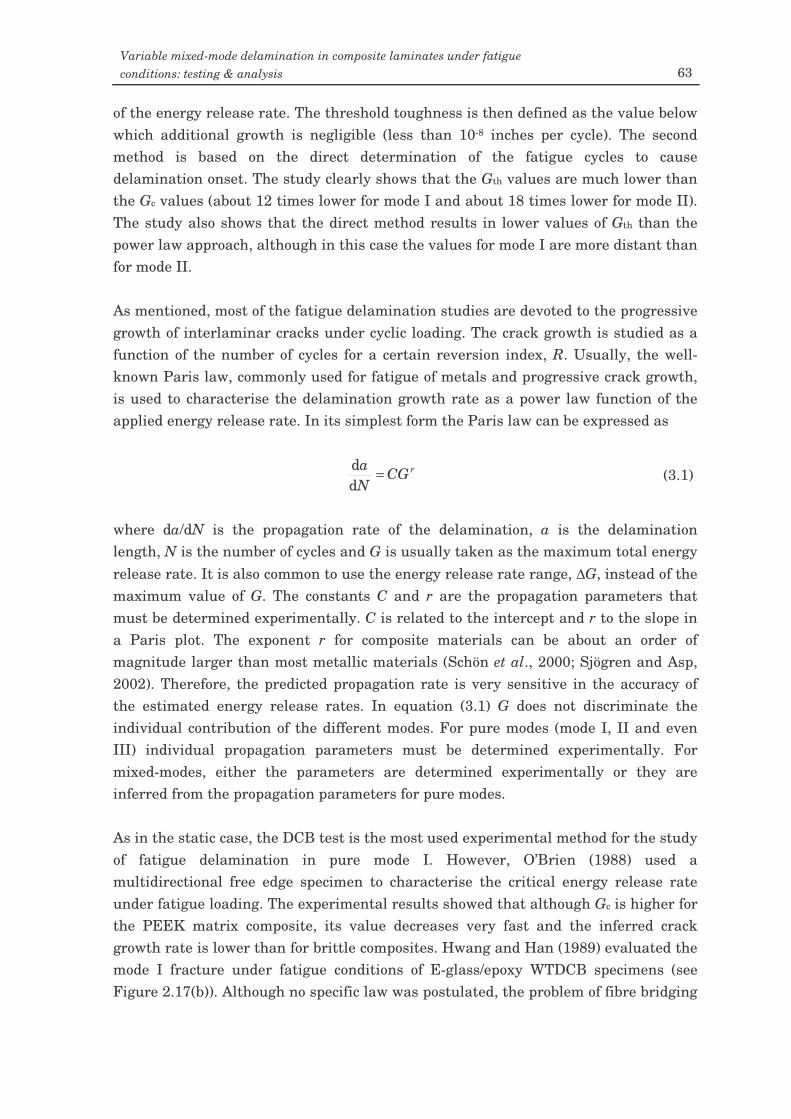
Variable mixed-mode delamination in composite laminates under fatigue conditions: testing & analysis 63
of the energy release rate. The threshold toughness is then defined as the value below which additional growth is negligible (less than 10-8 inches per cycle). The second method is based on the direct determination of the fatigue cycles to cause delamination onset. The study clearly shows that the Gth values are much lower than the Gc values (about 12 times lower for mode I and about 18 times lower for mode II). The study also shows that the direct method results in lower values of Gth than the power law approach, although in this case the values for mode I are more distant than for mode II. As mentioned, most of the fatigue delamination studies are devoted to the progressive growth of interlaminar cracks under cyclic loading. The crack growth is studied as a function of the number of cycles for a certain reversion index, R. Usually, the well-known Paris law, commonly used for fatigue of metals and progressive crack growth, is used to characterise the delamination growth rate as a power law function of the applied energy release rate. In its simplest form the Paris law can be expressed as
rCGNa =
dd (3.1)
where da/dN is the propagation rate of the delamination, a is the delamination length, N is the number of cycles and G is usually taken as the maximum total energy release rate. It is also common to use the energy release rate range, ∆G, instead of the maximum value of G. The constants C and r are the propagation parameters that must be determined experimentally. C is related to the intercept and r to the slope in a Paris plot. The exponent r for composite materials can be about an order of magnitude larger than most metallic materials (Schön et al., 2000; Sjögren and Asp, 2002). Therefore, the predicted propagation rate is very sensitive in the accuracy of the estimated energy release rates. In equation (3.1) G does not discriminate the individual contribution of the different modes. For pure modes (mode I, II and even III) individual propagation parameters must be determined experimentally. For mixed-modes, either the parameters are determined experimentally or they are inferred from the propagation parameters for pure modes. As in the static case, the DCB test is the most used experimental method for the study of fatigue delamination in pure mode I. However, O’Brien (1988) used a multidirectional free edge specimen to characterise the critical energy release rate under fatigue loading. The experimental results showed that although Gc is higher for the PEEK matrix composite, its value decreases very fast and the inferred crack growth rate is lower than for brittle composites. Hwang and Han (1989) evaluated the mode I fracture under fatigue conditions of E-glass/epoxy WTDCB specimens (see Figure 2.17(b)). Although no specific law was postulated, the problem of fibre bridging
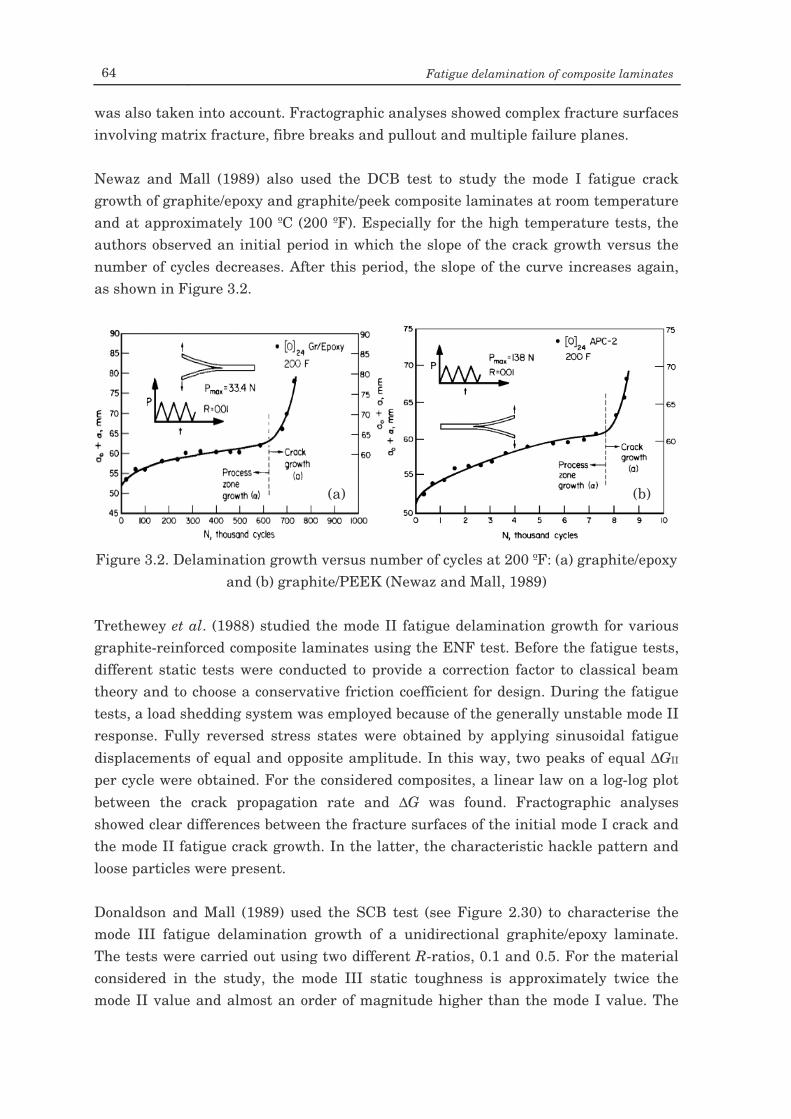
64 Fatigue delamination of composite laminates
was also taken into account. Fractographic analyses showed complex fracture surfaces involving matrix fracture, fibre breaks and pullout and multiple failure planes. Newaz and Mall (1989) also used the DCB test to study the mode I fatigue crack growth of graphite/epoxy and graphite/peek composite laminates at room temperature and at approximately 100 ºC (200 ºF). Especially for the high temperature tests, the authors observed an initial period in which the slope of the crack growth versus the number of cycles decreases. After this period, the slope of the curve increases again, as shown in Figure 3.2.
Figure 3.2. Delamination growth versus number of cycles at 200 ºF: (a) graphite/epoxy
and (b) graphite/PEEK (Newaz and Mall, 1989) Trethewey et al. (1988) studied the mode II fatigue delamination growth for various graphite-reinforced composite laminates using the ENF test. Before the fatigue tests, different static tests were conducted to provide a correction factor to classical beam theory and to choose a conservative friction coefficient for design. During the fatigue tests, a load shedding system was employed because of the generally unstable mode II response. Fully reversed stress states were obtained by applying sinusoidal fatigue displacements of equal and opposite amplitude. In this way, two peaks of equal ∆GII per cycle were obtained. For the considered composites, a linear law on a log-log plot between the crack propagation rate and ∆G was found. Fractographic analyses showed clear differences between the fracture surfaces of the initial mode I crack and the mode II fatigue crack growth. In the latter, the characteristic hackle pattern and loose particles were present. Donaldson and Mall (1989) used the SCB test (see Figure 2.30) to characterise the mode III fatigue delamination growth of a unidirectional graphite/epoxy laminate. The tests were carried out using two different R-ratios, 0.1 and 0.5. For the material considered in the study, the mode III static toughness is approximately twice the mode II value and almost an order of magnitude higher than the mode I value. The
(a) (b)
Variable mixed-mode delamination in composite laminates under fatigue conditions: testing & analysis 65
authors showed in different log-log plots that mode III crack propagation rate can be expressed as a linear function of GIII or ∆GIII. A comparison of crack propagation rate versus the total value of the energy release rate, ∆G, was made for the three different modes. The highest crack growth rate was found for mode I, the intermediate for mode II and the lowest for mode III. However, when the comparison was made versus the ratio ∆G/Gc, the highest crack growth rate was found for mode II, the intermediate for mode III and the lowest for mode I. Figure 3.3 shows the comparison made by the authors of the delamination propagation rates for the three modes. Scanning electron micrographies showed different features between mode III static and fatigue surfaces.
Figure 3.3. Comparison of delamination growth rates for mode I, II and III
(Donaldson, 1989) The paper of Dahlen and Springer (1994) is briefly commented in the following although the subject of mixed-mode fatigue crack growth will be treated in section 3.4. The authors presented a comprehensive study about the fatigue crack growth of composite laminates under mixed-mode I/II. Fatigue tests were conducted under mode I, mode II and different mixed-mode loading conditions. The mixed-mode tests were carried out using the ENCB test and a different version of the mixed-mode bending test (see Figure 2.28). An important distinction was made between reversed and non-reversed shear stress cases. The process zones formed ahead of the crack tip in the two cases were quite different. For the non-reversed case the process zone was formed by 45 º microcracks. The extent of the cracked region, and in consequence the delamination growth, depended on the maximum and minimum values of the energy release rate. For the reversed case, the process zone was formed by the typical X-pattern (see Figure 3.4). In this case, the delaminations grew faster than in the non-reversed case. Moreover, when the maximum displacement in both senses was the same, Gmax = Gmin, the overlap of the matrix microcracks was complete and the
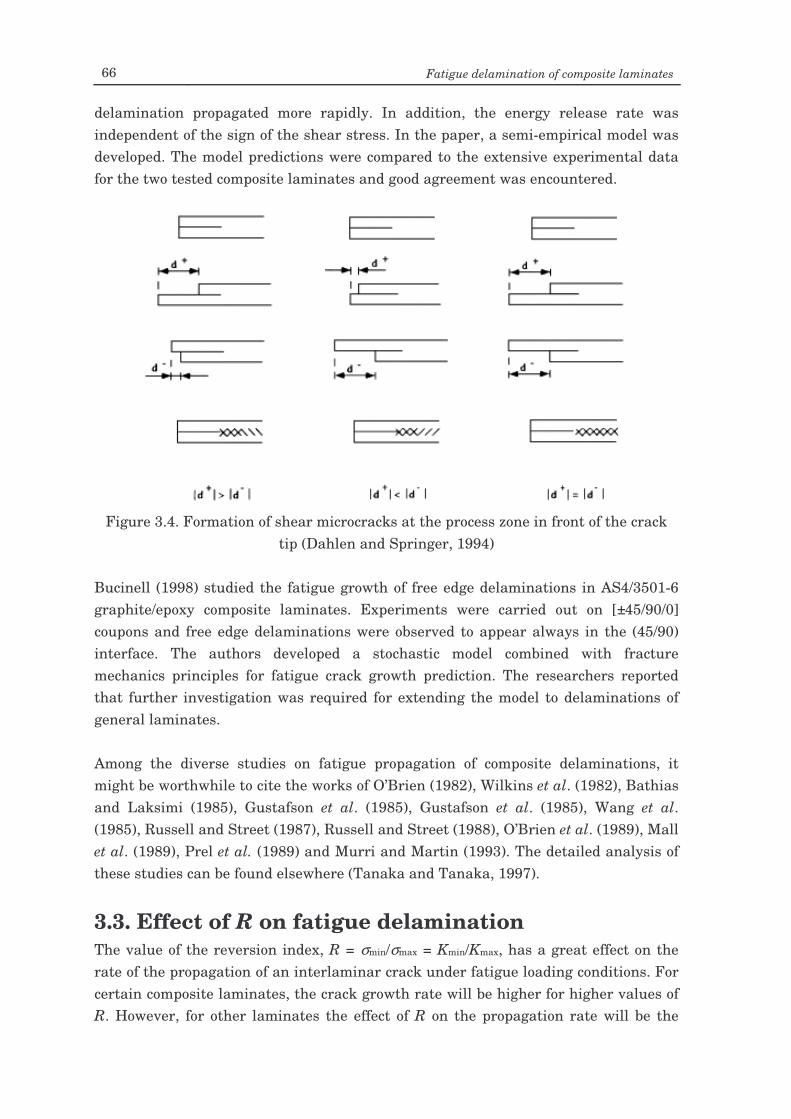
66 Fatigue delamination of composite laminates
delamination propagated more rapidly. In addition, the energy release rate was independent of the sign of the shear stress. In the paper, a semi-empirical model was developed. The model predictions were compared to the extensive experimental data for the two tested composite laminates and good agreement was encountered.
Figure 3.4. Formation of shear microcracks at the process zone in front of the crack
tip (Dahlen and Springer, 1994) Bucinell (1998) studied the fatigue growth of free edge delaminations in AS4/3501-6 graphite/epoxy composite laminates. Experiments were carried out on [±45/90/0] coupons and free edge delaminations were observed to appear always in the (45/90) interface. The authors developed a stochastic model combined with fracture mechanics principles for fatigue crack growth prediction. The researchers reported that further investigation was required for extending the model to delaminations of general laminates. Among the diverse studies on fatigue propagation of composite delaminations, it might be worthwhile to cite the works of O’Brien (1982), Wilkins et al. (1982), Bathias and Laksimi (1985), Gustafson et al. (1985), Gustafson et al. (1985), Wang et al. (1985), Russell and Street (1987), Russell and Street (1988), O’Brien et al. (1989), Mall et al. (1989), Prel et al. (1989) and Murri and Martin (1993). The detailed analysis of these studies can be found elsewhere (Tanaka and Tanaka, 1997).
3.3. Effect of R on fatigue delamination The value of the reversion index, R = σmin/σmax = Kmin/Kmax, has a great effect on the rate of the propagation of an interlaminar crack under fatigue loading conditions. For certain composite laminates, the crack growth rate will be higher for higher values of R. However, for other laminates the effect of R on the propagation rate will be the
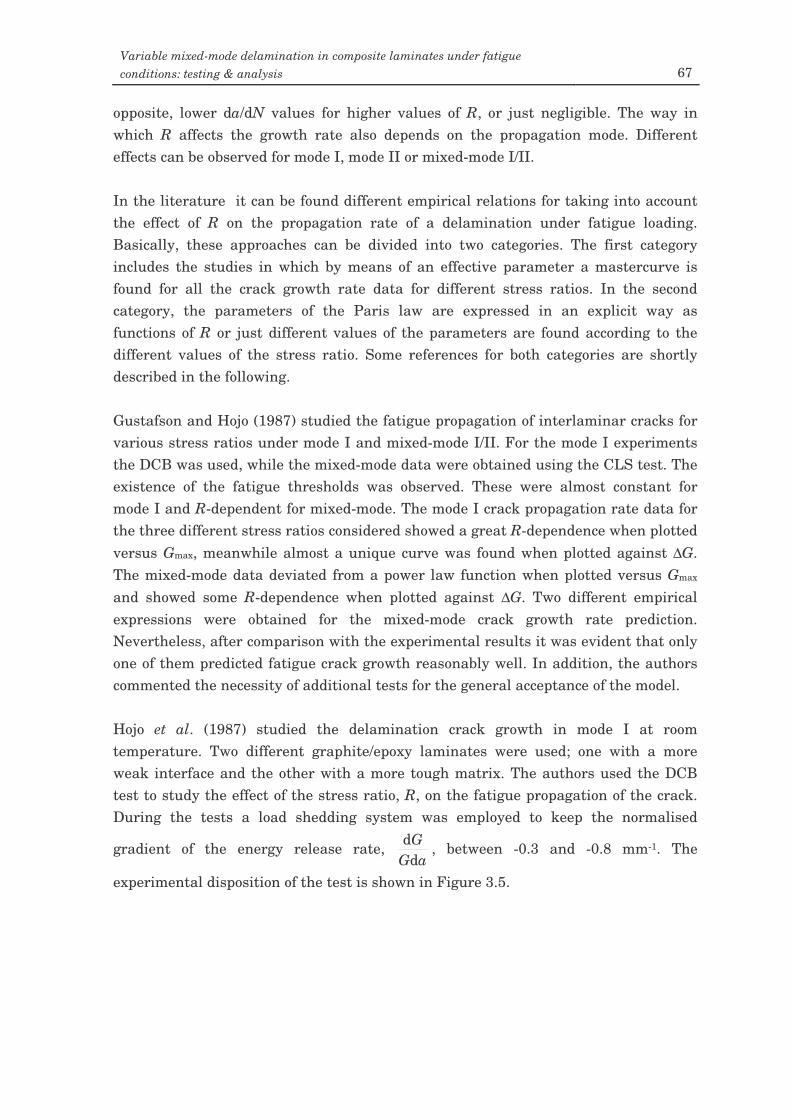
Variable mixed-mode delamination in composite laminates under fatigue conditions: testing & analysis 67
opposite, lower da/dN values for higher values of R, or just negligible. The way in which R affects the growth rate also depends on the propagation mode. Different effects can be observed for mode I, mode II or mixed-mode I/II. In the literature it can be found different empirical relations for taking into account the effect of R on the propagation rate of a delamination under fatigue loading. Basically, these approaches can be divided into two categories. The first category includes the studies in which by means of an effective parameter a mastercurve is found for all the crack growth rate data for different stress ratios. In the second category, the parameters of the Paris law are expressed in an explicit way as functions of R or just different values of the parameters are found according to the different values of the stress ratio. Some references for both categories are shortly described in the following. Gustafson and Hojo (1987) studied the fatigue propagation of interlaminar cracks for various stress ratios under mode I and mixed-mode I/II. For the mode I experiments the DCB was used, while the mixed-mode data were obtained using the CLS test. The existence of the fatigue thresholds was observed. These were almost constant for mode I and R-dependent for mixed-mode. The mode I crack propagation rate data for the three different stress ratios considered showed a great R-dependence when plotted versus Gmax, meanwhile almost a unique curve was found when plotted against ∆G. The mixed-mode data deviated from a power law function when plotted versus Gmax and showed some R-dependence when plotted against ∆G. Two different empirical expressions were obtained for the mixed-mode crack growth rate prediction. Nevertheless, after comparison with the experimental results it was evident that only one of them predicted fatigue crack growth reasonably well. In addition, the authors commented the necessity of additional tests for the general acceptance of the model. Hojo et al. (1987) studied the delamination crack growth in mode I at room temperature. Two different graphite/epoxy laminates were used; one with a more weak interface and the other with a more tough matrix. The authors used the DCB test to study the effect of the stress ratio, R, on the fatigue propagation of the crack. During the tests a load shedding system was employed to keep the normalised
gradient of the energy release rate, aG
Gd
d , between -0.3 and -0.8 mm-1. The
experimental disposition of the test is shown in Figure 3.5.
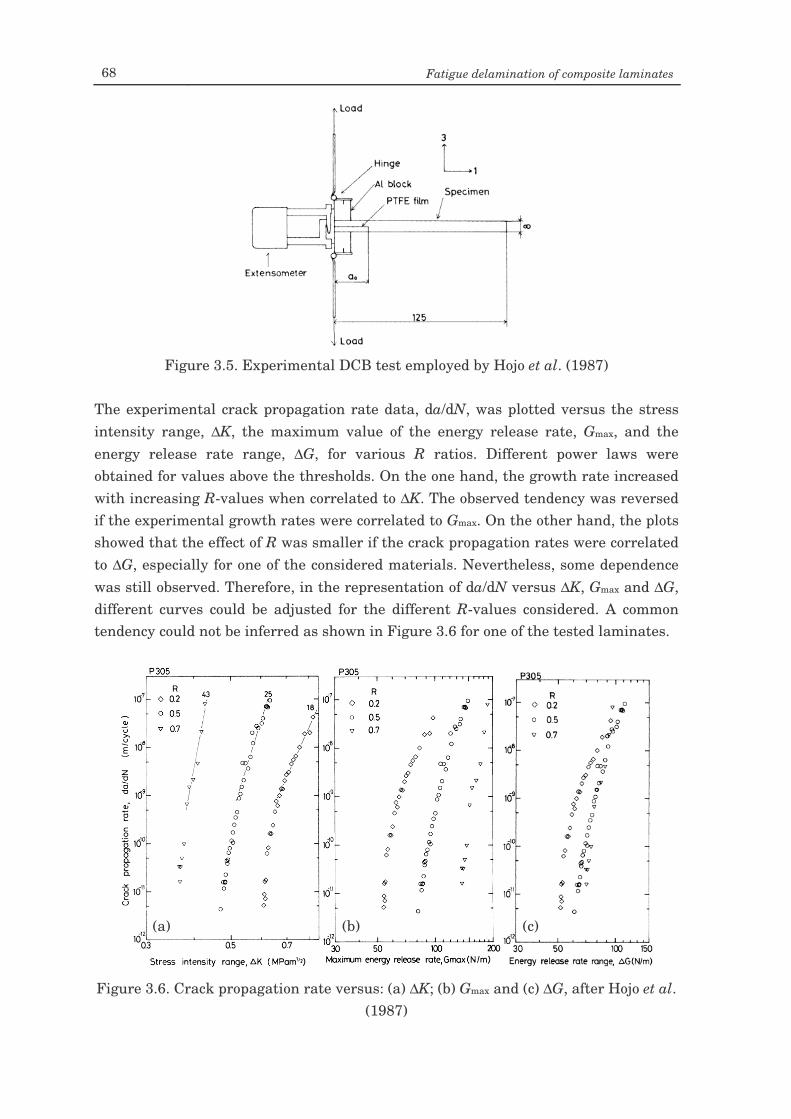
68 Fatigue delamination of composite laminates
Figure 3.5. Experimental DCB test employed by Hojo et al. (1987)
The experimental crack propagation rate data, da/dN, was plotted versus the stress intensity range, ∆K, the maximum value of the energy release rate, Gmax, and the energy release rate range, ∆G, for various R ratios. Different power laws were obtained for values above the thresholds. On the one hand, the growth rate increased with increasing R-values when correlated to ∆K. The observed tendency was reversed if the experimental growth rates were correlated to Gmax. On the other hand, the plots showed that the effect of R was smaller if the crack propagation rates were correlated to ∆G, especially for one of the considered materials. Nevertheless, some dependence was still observed. Therefore, in the representation of da/dN versus ∆K, Gmax and ∆G, different curves could be adjusted for the different R-values considered. A common tendency could not be inferred as shown in Figure 3.6 for one of the tested laminates.
Figure 3.6. Crack propagation rate versus: (a) ∆K; (b) Gmax and (c) ∆G, after Hojo et al.
(1987)
(a) (b) (c)
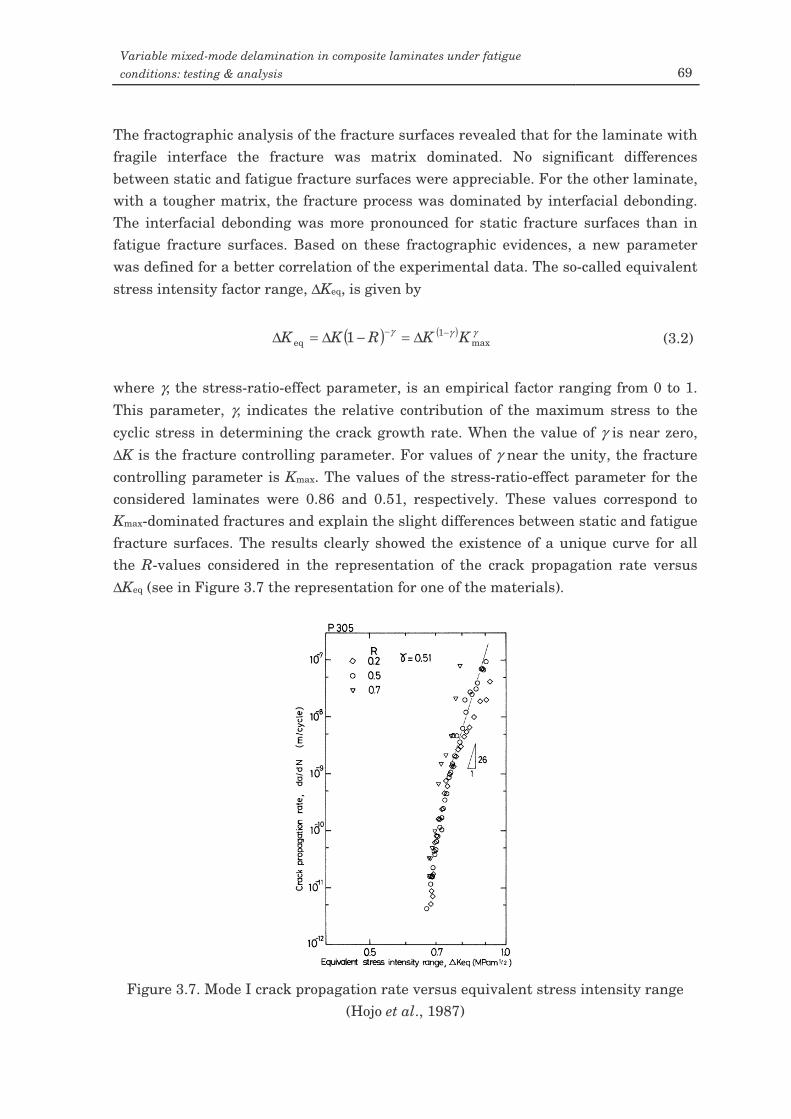
Variable mixed-mode delamination in composite laminates under fatigue conditions: testing & analysis 69
The fractographic analysis of the fracture surfaces revealed that for the laminate with fragile interface the fracture was matrix dominated. No significant differences between static and fatigue fracture surfaces were appreciable. For the other laminate, with a tougher matrix, the fracture process was dominated by interfacial debonding. The interfacial debonding was more pronounced for static fracture surfaces than in fatigue fracture surfaces. Based on these fractographic evidences, a new parameter was defined for a better correlation of the experimental data. The so-called equivalent stress intensity factor range, ∆Keq, is given by
( ) ( ) γγγmax
1eq 1 KKRKK −− ∆=−∆=∆ (3.2)
where γ, the stress-ratio-effect parameter, is an empirical factor ranging from 0 to 1. This parameter, γ, indicates the relative contribution of the maximum stress to the cyclic stress in determining the crack growth rate. When the value of γ is near zero, ∆K is the fracture controlling parameter. For values of γ near the unity, the fracture controlling parameter is Kmax. The values of the stress-ratio-effect parameter for the considered laminates were 0.86 and 0.51, respectively. These values correspond to Kmax-dominated fractures and explain the slight differences between static and fatigue fracture surfaces. The results clearly showed the existence of a unique curve for all the R-values considered in the representation of the crack propagation rate versus ∆Keq (see in Figure 3.7 the representation for one of the materials).
Figure 3.7. Mode I crack propagation rate versus equivalent stress intensity range
(Hojo et al., 1987)
70 Fatigue delamination of composite laminates
The effect of R on the crack growth behaviour near the fatigue thresholds for different laminates under mode I and mode II was investigated by Hojo et al. (1997). The considered laminates included different combinations of carbon fibres with brittle and toughened epoxy matrices and a thermoplastic PEEK matrix. It was found that under mode I the fibre type had little effect on the crack growth rate, while the type of matrix resin played a decisive role. The fracture mechanism observed was dependent on the toughness of the matrix. For brittle matrix composites, the crack growth rate was controlled by Kmax and lower Paris law exponents were observed. The crack growth rate of toughened matrix composites was controlled by ∆K. In addition, for weaker interface matrices an enhancement of fibre bridging was observed. The exponents of the Paris law also depended on the value of the stress ratio. For higher values of R, higher exponent values and vice versa. Though the value of the Paris law exponents increased with R, the effect of the stress ratio was found to be minimal with respect to the toughness of the laminate. Different fracture mechanisms were present under mode I and mode II. Matsuda et al. (1997) investigated the fatigue crack growth behaviour under mode II for various stress ratios in a carbon/epoxy interlayer-toughened laminate. The prepreg interface was modified by adding amorphous thermoplastic polyamide particles. The fatigue thresholds were found to be higher than fatigue thresholds of conventional carbon/epoxy laminates. The crack growth rate data were plotted versus Gmax and ∆K. The effect of R on da/dN was found to be much lower for the case of the latter parameter, especially near the threshold values. Atodaria et al. (1999) studied the fatigue delamination growth behaviour of a glass fabric reinforced laminate under mode I. DCB specimens were subjected to fatigue loading under three different tension-tension stress ratios. A new power law equation relating the strain energy release rate and the crack growth rate was formulated. In the equation, different stages of loading were taken into account using a weight average strain energy release rate. It was observed that the formulated model could represent the fatigue propagation rates at different stress ratios in a single curve. The mode I and mode II fracture toughness and the stress ratio effect on the fatigue delamination of Alumina fibre (ALF)/epoxy unidirectional laminates at 77 ºK and room temperature was investigated by Hojo et al. (2002). Fracture toughness tests at 77 ºK were partially unstable both under mode I and under mode II. In mode I, the plateau values of the R-curves were different at 77 ºK than at room temperature. Meanwhile, for mode II, the fracture data were temperature insensitive, indicating different fracture mechanism for both modes. The exponents of the power law for mode I and mode II fatigue delamination were higher at cryogenic temperatures both versus ∆K and versus Gmax. For both modes, the effects of the stress ratio on the crack
Variable mixed-mode delamination in composite laminates under fatigue conditions: testing & analysis 71
growth at 77 ºK and room temperature were different. The fatigue fracture behaviour proved to be insensitive to da/dN, especially under mode II, which is in concordance with the calculated values of the stress-ratio-effect parameter, γ. Tanaka and Tanaka (1995) studied the dependence on R of the fatigue crack growth rate under mixed-mode loading. For all the stress ratios considered on the study, the exponent of the Paris law increased with increasing values of R. On the same way, for a given value of the stress intensity factor range, the crack growth rate was higher for higher values of R. The authors also found that at high propagation rates the dominant parameter is Kmax, and ∆K controlled the fracture process near the fatigue thresholds. On a posterior research (Tanaka and Tanaka, 1997), the effect of the stress ratio on the propagation behaviour of mode II fatigue delaminations was investigated. In this case, the ENF test was used in the tests with positive values of R and the ELS test for the tests with negative R-values (reversed mode II loading). Fatigue thresholds were found to be independent of the stress ratio value when the crack growth data was plotted against ∆K. When the crack growth data was plotted versus Kmax, Gmax or ∆G, the value of the threshold increased with increasing values of R. Again, at high crack growth rates, Kmax was the controlling parameter whereas near the threshold was ∆K. However, the stress-ratio-effect parameter, γ, was variable for the composite laminate studied and ∆Keq could not be used. Therefore, the parameters of the Paris law depended on the value of the reversion index. Schön (2000) proposed a model for the calculation of fatigue propagation of delaminations. The model is based on the determination of the two parameters of the Paris law. Therefore, two points of the fatigue delamination growth rate curve must be experimentally determined. One of the points corresponds to the threshold, which was found to occur for a constant change in energy release rate. The second point is related to the static interlaminar fracture. In total, five different material parameters are needed for the model: the critical mode I and mode II energy release rate values, the value of the energy release rate range at the threshold in function of R (∆GRth), and the value of the crack growth rate at the threshold and fracture conditions. With these, the parameters of the Paris law are formulated for any energy release rate mode and stress ratio. The model was formulated in such a way that the Paris law exponent decreases with decreasing R-values and increases with mode II contributions. This behaviour was found to be in good agreement with experimental results from the literature. Schön (2001) used the previous model to find the stress ratio for the highest delamination growth rate and shortest fatigue life. The approach is based on the calculation of the range of change in energy release rate for different stress ratios. It was found that according to the model the shortest fatigue life corresponds to R = -1. This finding was found to agree with experimental results from the literature.
72 Fatigue delamination of composite laminates
Andersons et al. (2001) deduced a one-dimensional model for the prediction of fatigue delamination under mixed-mode loading conditions. The proposed model relates the fatigue delamination growth to the damage process ahead of the crack tip. Fatigue damage accumulation was taken into account by means of the Miner’s rule. The authors considered that the stress ratio in mode I is limited to tension-tension loading, 0 R < 1, while the range of interest in mode II admits load reversals, -1 R < 1. Then, the dependence of the Paris law parameters on the stress ratio was approximated by a linear Goodman diagram. The crack growth rate model was proposed as a function of the stress intensity factors where the mixed-mode parameters must be determined from the mode I and mode II parameters. A new one-dimensional empirical model was proposed by Andersons et al. (2004) to account for the stress ratio effect on the fatigue crack growth rate on composite laminates. The model was based on the same assumptions as the previous one. However, only pure mode loading was considered in this case. Two different power law expressions were derived for mode I and mode II crack growth rate. The expression for mode I crack growth was formulated in function of R and the value of the stress intensity factor range at the threshold, ∆KIth. The expression for mode II propagation was also formulated in function of the stress intensity factor range at the threshold, ∆KIIth. However, the authors considered that the effect of R on ∆KIIth is negligible and the latter function does not depend on the value of the stress ratio. Experimental crack growth rate data of brittle and toughened epoxy and tough PEEK matrix laminates obtained from the literature were compared to both power laws and good agreement was encountered. Therefore, it can be concluded that the stress ratio R has a great effect on fatigue crack propagation. Despite the advantages of using certain parameters, such as the stress-ratio-effect parameter γ proposed by Hojo et al. (1987), to collapse the data for different values of R in one unique mastercurve, these parameters are not extensively used. Most of the fatigue delamination models are formulated in such a way that their parameters must be determined for every stress ratio considered. This is the case of the mixed-mode fatigue delamination models presented in next section.
3.4. Mixed-mode fatigue delamination models Ramkumar and Whitcomb (1985) studied the static and fatigue propagation of interlaminar cracks in mode I and mixed-mode I/II for different stacking sequences of the same composite material. The mode I tests were conducted using a DCB method, while the mixed-mode tests were carried out using the CLS test method. The latter were combined with a finite element analysis to obtain the mode I and mode II contributions during the tests. Fatigue tests were conducted for a stress ratio equal to 0.05 and power law relationships between da/dN and Gmax were obtained both for
Variable mixed-mode delamination in composite laminates under fatigue conditions: testing & analysis 73
mode I and mixed-mode. The authors considered that the mode I and mode II contributions to crack growth were additive. A model was proposed in which the propagation rate is determined by the addition of the individual propagation rates for mode I and mode II as
III
IIc
IIII
Ic
IId
drr
GG
CGG
CNa
+
= (3.3)
where Ci and ri are the propagation parameters in mode I and mode II and Gi indicates the maximum energy release rate in mode I and mode II. Gustafson and Hojo (1987) carried out fatigue delamination tests on unidirectional graphite/epoxy laminates for different stress ratios. Mode I tests were carried out using the DCB method while the CLS method was employed for the mixed-mode I/II tests. Two empirical power-law expressions were obtained for the mixed-mode crack growth rate prediction as functions of the energy release rate range instead of on the maximum and critical energy release rates:
( ) ( ) IIIIIIIIId
d rr GCGCNa ∆+∆= (3.4)
( )rGGCNa
IIIdd ∆+∆= (3.5)
Nevertheless, after comparison with the experimental results it was evident that only expression (3.4) predicted fatigue crack growth reasonably well. The previous models proposed by Ramkumar and Whitcomb (equation (3.3)) and Gustafson and Hojo (equation (3.4)) predict the fatigue propagation of the interlaminar crack by addition of the individual propagations in mode I and mode II. In this way, fatigue crack propagation can be predicted for any degree of mixed-mode with the propagation parameters C and r in mode I and mode II. Both models are independent of the value of the propagation parameters for intermediate mixed-modes. However, subsequent studies have demonstrated that in general this assumption is not well correlated with mixed-mode crack propagation under fatigue conditions. Russell and Street (1989) modelled the mixed-mode fatigue propagation rate by a linear rule of mixtures of the Paris law under pure mode I and pure mode II. The authors experimentally demonstrated the mixed-mode dependence of the propagation parameters C and r. The weight factor for the rule of mixtures was determined as a function of the individual maximum energy release rates. Therefore, the model can be expressed as
74 Fatigue delamination of composite laminates
++
+
∆+
∆
++
+=
IIIII
III
III
I
IIc
II
Ic
III
III
III
III
I
dd
rGG
Gr
GGG
GG
GG
CGG
GC
GGG
Na (3.6)
Dahlen and Springer (1994) proposed a semi-empirical model for estimating the fatigue crack growth under mixed-mode. The model includes an effective stress ratio and a dimensionless group according to the Buckingham π theorem:
( )( )IIIIII
III
IIc
II
Ic
IIII2
12
IIc22II2
22
Ic22Id
drgrg
gg
GG
GG
UCCS
GEg
SGE
gNa
+
+
+= (3.7)
where
IcIIIIcI
IIcII GGGG
GGg
+= (3.8)
and
IcIIIIcI
IcIIII GGGG
GGg
+= (3.9)
The parameter S22 is the transverse tensile strength of a unidirectional ply, S12 is the in-plane shear strength of the unidirectional ply and U is an effective stress ratio that can be considered to be 1 when ∆G ≈ 0 for the non-shear reversal case. As mentioned in section 2.7, Hutchinson and Suo (1992) described the variation of the critical energy release rate as a function of the mode mix angle, ψ, as
( ) ψ2IIcIcIIc
IIcIcc sinGGG
GGG
−+= (3.10)
Kardomateas and co-workers (Kardomateas et al., 1994; Kardomateas et al., 1995; Kardomateas and Malik, 1997) studied the mixed-mode growth of internal delaminations in composite plates subjected to cyclic compression. Based on the previous definitions of Hutchinson and Suo (1992), the authors proposed a propagation rate of the delamination as a function of ψ
Variable mixed-mode delamination in composite laminates under fatigue conditions: testing & analysis 75
( )
( )G
GGGGG
GGGGGG
CNa
r
IIcIc
2IIcIcIIc
IIcIc
2IIcIcIIc
sin1
sin
dd
ψ
ψ
−+−
∆
−+
= (3.11)
where G is the sum of the maximum GI-value and the maximum GII-value. C and r are the mixed-mode propagation parameters, which the authors also defined as functions of ψ, in a similar way to expression (3.10):
( ) ψ2IIII sinCCCC −+= (3.12)
( ) ψ2IIII sinrrrr −+= (3.13)
Kenane and Benzeggagh (1997), studied the mode I, mode II and mixed-mode fatigue delamination of unidirectional glass/epoxy laminates. A semi-empirical fatigue criterion was proposed based on a variation of the Paris law
( )rGCNa ∆=
dd (3.14)
The authors mentioned that literature results for graphite/epoxy show that the propagation exponent decreases with the mode mix defined by the ratio of the mode II component to the total energy release rate, GII/G. However, the obtained results for glass/epoxy show that the exponent increased with GII/G. The variation of the propagation parameters with the mode mix is given by
( ) ( ) ( ) ( )( )b
GG
CCCC
−−+= IIIIIII 1lnlnlnln (3.15)
( )d
GG
rrrr
−+= IIIIII (3.16)
where G is the sum of the maximum GI-value and the maximum GII-value, and b and d are material parameters that must be determined experimentally. Andersons et al. (2001) suggested a modified Paris law as a function of the stress intensity factors in the crack tip instead of the energy release rates. The model is combined with the Palmgren-Miner rule for the damage accumulation ahead of the crack tip. The propagation parameters are also defined as a function of the critical stress intensity factors for mode I and mode II and the mode mix angle proposed by Hutchinson and Suo (1992). The model can be expressed as:
76 Fatigue delamination of composite laminates
22
IIc
II2
Ic
I
dd
r
KK
KK
CNa
+
= (3.17)
where
II
2
IIc2II
III
2
Ic2I
I
II
2
IIcII
III
2
IcI
I
sin2cos2
sin2cos2
CKr
rC
Krr
CKr
rC
Krr
r
−+
−
−+
−
=ψψ
ψψ
(3.18)
and
2
IIc
2
Ic
II
2
IIcII
III
2
IcI
I
sincos
sin2cos2
2
+
−+
−
−=
KK
CKr
rC
Krr
rrC
ψψ
ψψ
(3.19)
Ki and Kic are the maximum and critical stress intensity factors in mode I and mode II. Schön (2000) proposed a mixed-mode fatigue delamination model based on the Paris law. The model needs the determination of two experimental points to be defined. The first one corresponds to the threshold value, which the author considered to be independent of the stress ratio and the mode mix. The second point is related to the static fracture, Gc, and therefore depends on the material, the mode mix and the stress ratio. To clearly discriminate between tension-tension and compression-compression loadings a new stress ratio parameter was defined, Q = R when -1 R 1 and Q = 1/R when /R/ > 1. Moreover, to take into account the mode II reversal shear loading when Q is negative, the energy release rate range is defined as ∆Gr = Gmax + Gmin and as usual when Q is positive. Then, the model can be expressed as
( )rGCNa
rdd ∆= (3.20)
If a linear failure criterion is assumed, for the case when Q is positive, the propagation parameters can be determined as
Variable mixed-mode delamination in composite laminates under fatigue conditions: testing & analysis 77
( ) ( )( )2cthr
cth
1loglogddlog
ddlog
QGGNa
Na
r−−∆
−
= (3.21)
( )rG
Na
Cthr
thdd
∆
= (3.22)
where Gc is the critical energy release rate for the given mixed-mode. The symbols c and th stand for critical and threshold, respectively. When Q is negative, C is given by the previous expression and r by
( ) ( )( )2IIcthr
cth
1loglogddlog
ddlog
QGGNa
Na
r+−∆
−
= (3.23)
Therefore, the model predicts that the exponent r depends on the stress-ratio and the mode mix; r decreases when Q decreases and/or the mode mix increases. In this way, the model only needs the experimental determination of the mode I and mode II critical energy release rates and the critical and threshold crack growth rates. However, the assumption that (∆Gr)th is independent of the mixed-mode and stress ratio is based on the experimental data of three different studies; while other two studies show the opposite (see further details in the reference (Schön, 2000)). Hence, and as the authors stated: there is a need for further research in this area to clarify this issue.
3.5. Non-monotonic variation of the propagation parameters The previous section included the mixed-mode fatigue delamination models present in the literature. From these, the models proposed by Ramkumar and Whitcomb (1985) and Gustafson and Hojo (1987) predict the fatigue crack propagation by addition of the individual propagations in mode I and mode II. Only the propagation parameters in pure mode I and pure mode II are needed to predict the fatigue propagation of the crack for any value of the mode mix. Therefore, no assumption is made about the variation of the propagation parameters C and r with the mode mix. In the case of the model proposed by Schön (2000), the propagation parameters are determined according to the threshold and critical crack propagation rates for any mixed-mode considered. Thus, no assumption is made about the variation of C and r with the mode mix and these have to be calculated for every value of the mode mix. The rest of the models assume a monotonic variation of the propagation parameters with the mode mix. In fact, these models base the variation of the propagation parameters on the determination of C and r for pure mode I and mode II. The variation of the
78 Fatigue delamination of composite laminates
propagation parameters with the mode mix is achieved by the assumption of different monotonic experimental functions of GII/G. Only the model proposed by Kenane and Benzeggagh (1997) is based on two extra experimental factors, b and d, to account for the skewness in the mode mix dependence. These two extra parameters allow a more complex variation of the propagation parameters with the mode mix, although still in a monotonic way. The way in which an interlaminar crack propagates is strongly subjected to the micromechanisms active during delamination growth. In mode I, no friction between the arms of the specimen is observed, whereas in mode II, this is an important mechanism. In Asp et al. (2001), a fractographic analysis showed a major presence of matrix rollers for the mode II specimens. In mode II, shear microcracks are known to form in front of the crack tip, and finally coalesce to result in growth of the delamination (Singh and Greenhalgh, 1998). As the mode II component increases, a major number of microcracks develop into shear cusps and they become deeper in the thickness direction. It has been experimentally found that fibre bridging is more important for higher mode I contributions and less important for higher mode II dominated fractures (Tanaka and Tanaka, 1995; Greenhalgh, 1998). Moreover, this micromechanism is more important for longer crack lengths. How all these micromechanisms combine and interact is not a well-known process, but there is no reason to believe that it should follow a linear and monotonic way for propagation rates. In certain composite materials or configurations, the variation of the propagation parameters with the mode mix can be non-monotonic. In this case, the monotonic variation of C and r with the mode mix assumed by the previous models is questionable. The value of the propagation parameters obtained with the models included in the previous section would be different to the real ones and the mixed-mode fatigue crack propagation predicted by these models would be incorrect. An example of non-monotonic variation of C and r with the mode mix can be found if the experimental results of Asp et al. (2001) are taken into account. The fatigue crack propagation tests were carried out under constant mode I, mode II and 50/50 mixed-mode I-II in unidirectional carbon/epoxy laminates. The laminates were made of unidirectional HTA/6376C carbon/epoxy prepreg produced by Hexcel. The principal elastic properties of the unidirectional laminate are summarised in Table 3.1 (Asp et al., 2001), where ‘1’ is in the fibre direction, ‘2’ is in the in-plane transverse direction and ‘3’ is in the out-of-plane direction.
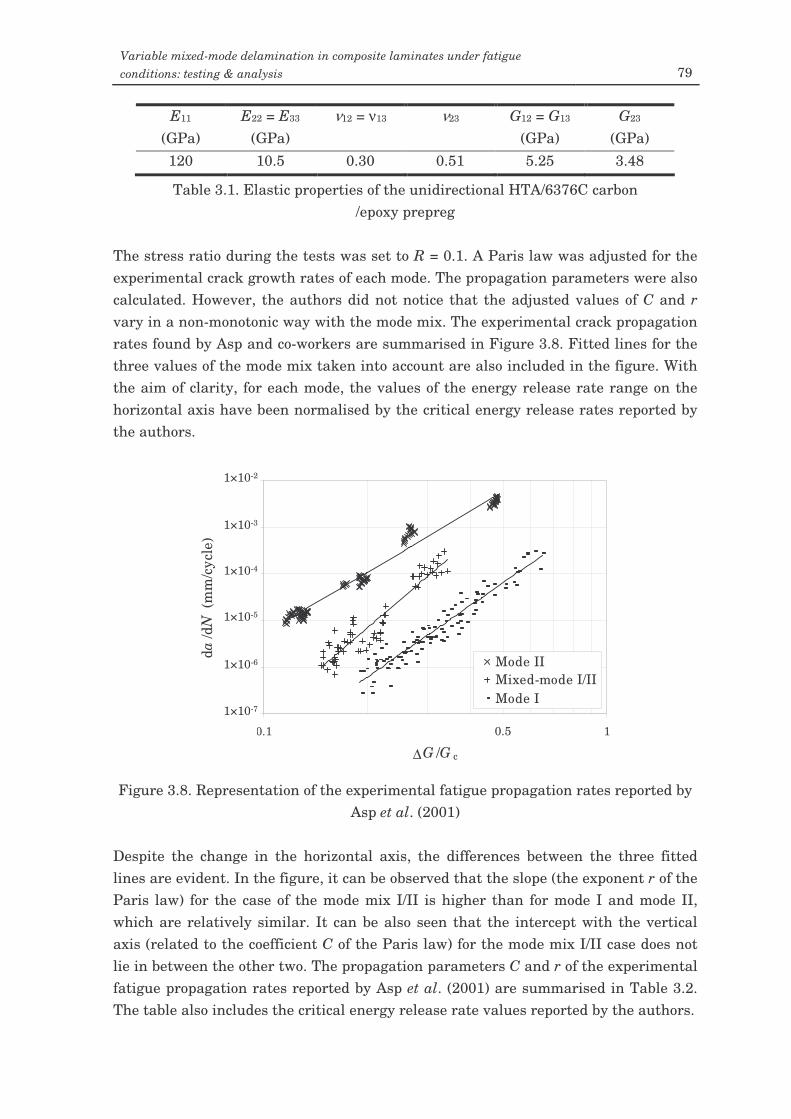
Variable mixed-mode delamination in composite laminates under fatigue conditions: testing & analysis 79
E11 E22 = E33 ν12 = ν13 ν23 G12 = G13 G23 (GPa) (GPa) (GPa) (GPa) 120 10.5 0.30 0.51 5.25 3.48
Table 3.1. Elastic properties of the unidirectional HTA/6376C carbon /epoxy prepreg
The stress ratio during the tests was set to R = 0.1. A Paris law was adjusted for the experimental crack growth rates of each mode. The propagation parameters were also calculated. However, the authors did not notice that the adjusted values of C and r vary in a non-monotonic way with the mode mix. The experimental crack propagation rates found by Asp and co-workers are summarised in Figure 3.8. Fitted lines for the three values of the mode mix taken into account are also included in the figure. With the aim of clarity, for each mode, the values of the energy release rate range on the horizontal axis have been normalised by the critical energy release rates reported by the authors.
Figure 3.8. Representation of the experimental fatigue propagation rates reported by
Asp et al. (2001) Despite the change in the horizontal axis, the differences between the three fitted lines are evident. In the figure, it can be observed that the slope (the exponent r of the Paris law) for the case of the mode mix I/II is higher than for mode I and mode II, which are relatively similar. It can be also seen that the intercept with the vertical axis (related to the coefficient C of the Paris law) for the mode mix I/II case does not lie in between the other two. The propagation parameters C and r of the experimental fatigue propagation rates reported by Asp et al. (2001) are summarised in Table 3.2. The table also includes the critical energy release rate values reported by the authors.
1.E-07
1.E-06
1.E-05
1.E-04
1.E-03
1.E-02
0.1 1
∆G /G c
da/d
N (m
m/c
ycle
)
Mode IIMixed-mode I/IIMode I
1×10⁻³
1×10⁻²
1×10⁻⁵
1×10⁻⁴
1×10⁻⁶
1×10⁻⁷
0.5
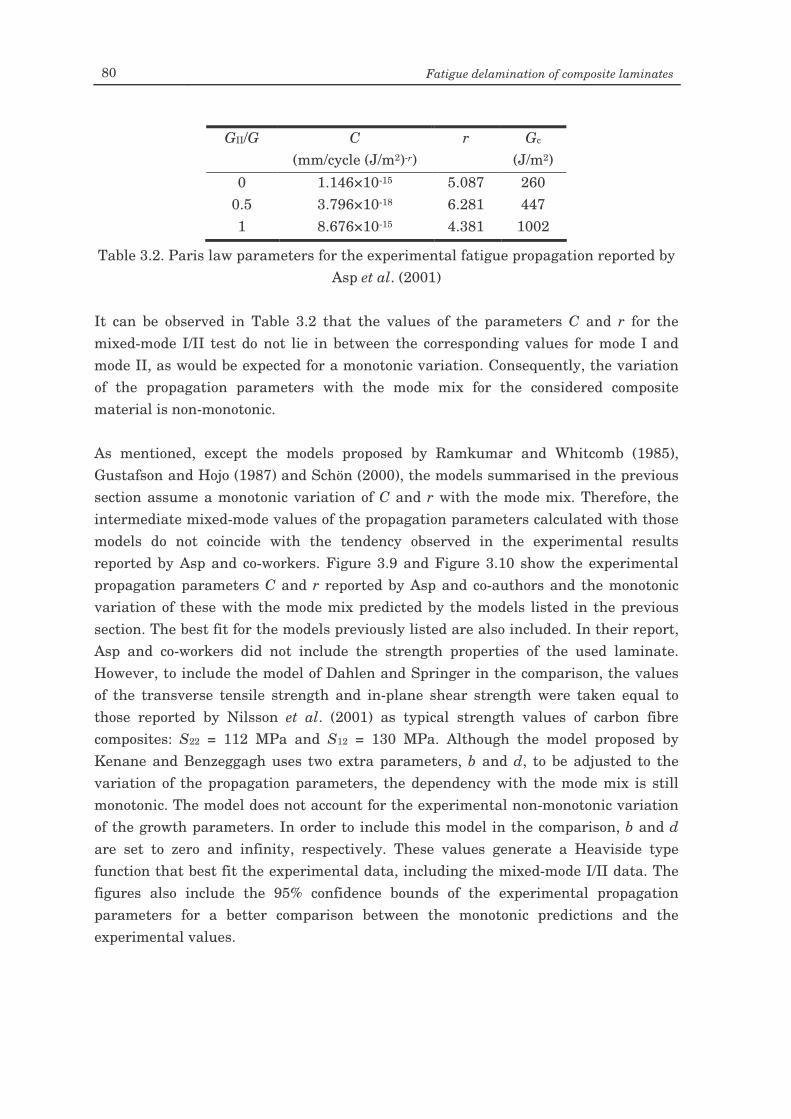
80 Fatigue delamination of composite laminates
GII/G C r Gc
(mm/cycle (J/m2)-r) (J/m2) 0 1.146×10⁻¹⁵ 5.087 260
0.5 3.796×10⁻¹⁸ 6.281 447 1 8.676×10⁻¹⁵ 4.381 1002
Table 3.2. Paris law parameters for the experimental fatigue propagation reported by Asp et al. (2001)
It can be observed in Table 3.2 that the values of the parameters C and r for the mixed-mode I/II test do not lie in between the corresponding values for mode I and mode II, as would be expected for a monotonic variation. Consequently, the variation of the propagation parameters with the mode mix for the considered composite material is non-monotonic. As mentioned, except the models proposed by Ramkumar and Whitcomb (1985), Gustafson and Hojo (1987) and Schön (2000), the models summarised in the previous section assume a monotonic variation of C and r with the mode mix. Therefore, the intermediate mixed-mode values of the propagation parameters calculated with those models do not coincide with the tendency observed in the experimental results reported by Asp and co-workers. Figure 3.9 and Figure 3.10 show the experimental propagation parameters C and r reported by Asp and co-authors and the monotonic variation of these with the mode mix predicted by the models listed in the previous section. The best fit for the models previously listed are also included. In their report, Asp and co-workers did not include the strength properties of the used laminate. However, to include the model of Dahlen and Springer in the comparison, the values of the transverse tensile strength and in-plane shear strength were taken equal to those reported by Nilsson et al. (2001) as typical strength values of carbon fibre composites: S22 = 112 MPa and S12 = 130 MPa. Although the model proposed by Kenane and Benzeggagh uses two extra parameters, b and d, to be adjusted to the variation of the propagation parameters, the dependency with the mode mix is still monotonic. The model does not account for the experimental non-monotonic variation of the growth parameters. In order to include this model in the comparison, b and d are set to zero and infinity, respectively. These values generate a Heaviside type function that best fit the experimental data, including the mixed-mode I/II data. The figures also include the 95% confidence bounds of the experimental propagation parameters for a better comparison between the monotonic predictions and the experimental values.
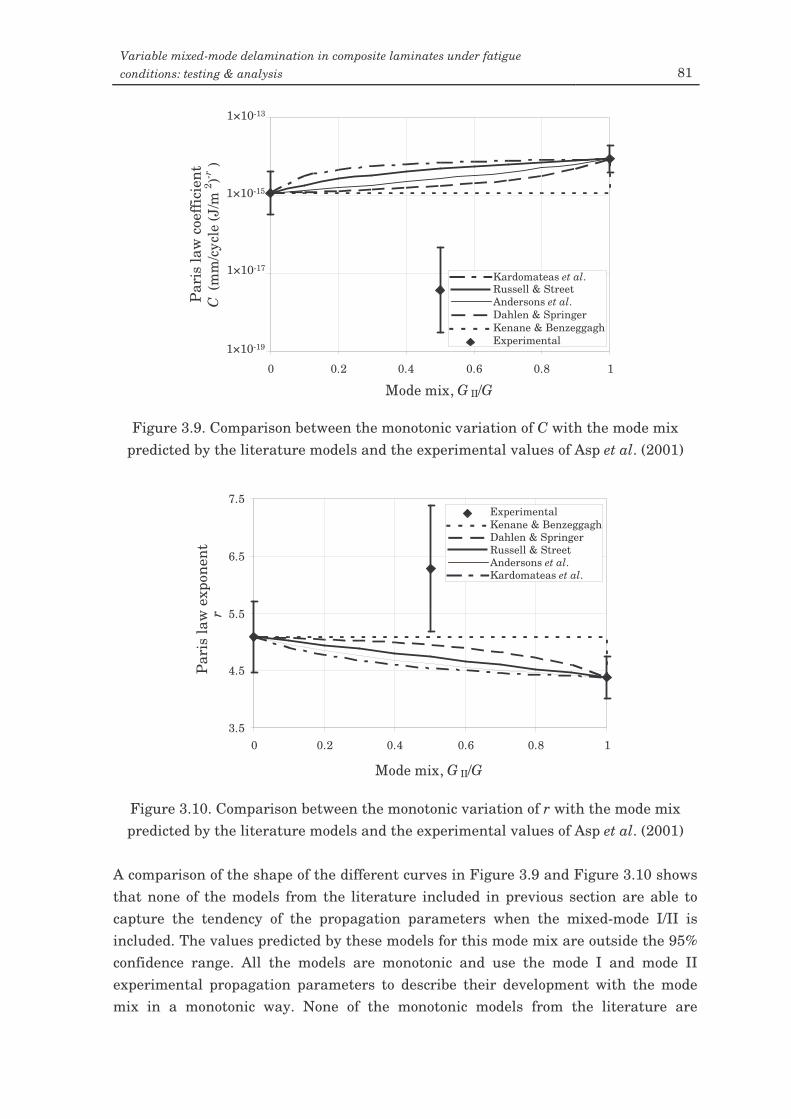
Variable mixed-mode delamination in composite laminates under fatigue conditions: testing & analysis 81
Figure 3.9. Comparison between the monotonic variation of C with the mode mix
predicted by the literature models and the experimental values of Asp et al. (2001)
Figure 3.10. Comparison between the monotonic variation of r with the mode mix predicted by the literature models and the experimental values of Asp et al. (2001)
A comparison of the shape of the different curves in Figure 3.9 and Figure 3.10 shows that none of the models from the literature included in previous section are able to capture the tendency of the propagation parameters when the mixed-mode I/II is included. The values predicted by these models for this mode mix are outside the 95% confidence range. All the models are monotonic and use the mode I and mode II experimental propagation parameters to describe their development with the mode mix in a monotonic way. None of the monotonic models from the literature are
1.E-19
1.E-17
1.E-15
1.E-13
0 0.2 0.4 0.6 0.8 1
Mode mix, G II/G
C (m
m/c
ycle
(J/m
2 )-r)
1×10-13
1×10-15
1×10-17
1×10-19
Par
is la
w c
oeff
icie
nt
Kenane & Benzeggagh Dahlen & Springer
Russell & Street Andersons et al.
Kardomateas et al.
Experimental
3.5
4.5
5.5
6.5
7.5
0 0.2 0.4 0.6 0.8 1
Mode mix, G II/G
rP
aris
law
exp
onen
t
Kenane & Benzeggagh Dahlen & Springer Russell & Street Andersons et al. Kardomateas et al.
Experimental
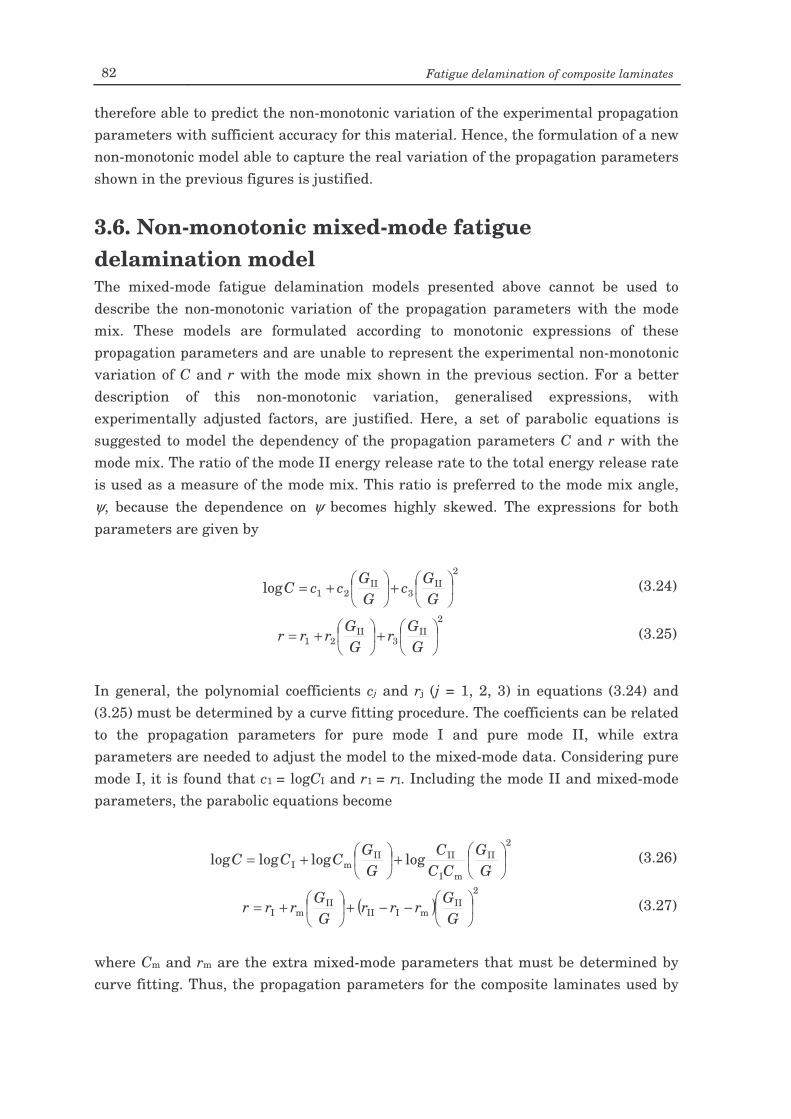
82 Fatigue delamination of composite laminates
therefore able to predict the non-monotonic variation of the experimental propagation parameters with sufficient accuracy for this material. Hence, the formulation of a new non-monotonic model able to capture the real variation of the propagation parameters shown in the previous figures is justified.
3.6. Non-monotonic mixed-mode fatigue delamination model The mixed-mode fatigue delamination models presented above cannot be used to describe the non-monotonic variation of the propagation parameters with the mode mix. These models are formulated according to monotonic expressions of these propagation parameters and are unable to represent the experimental non-monotonic variation of C and r with the mode mix shown in the previous section. For a better description of this non-monotonic variation, generalised expressions, with experimentally adjusted factors, are justified. Here, a set of parabolic equations is suggested to model the dependency of the propagation parameters C and r with the mode mix. The ratio of the mode II energy release rate to the total energy release rate is used as a measure of the mode mix. This ratio is preferred to the mode mix angle, ψ, because the dependence on ψ becomes highly skewed. The expressions for both parameters are given by
2II
3II
21log
+
+=G
Gc
GG
ccC (3.24)
2II
3II
21
+
+=G
Gr
GG
rrr (3.25)
In general, the polynomial coefficients cj and rj (j = 1, 2, 3) in equations (3.24) and (3.25) must be determined by a curve fitting procedure. The coefficients can be related to the propagation parameters for pure mode I and pure mode II, while extra parameters are needed to adjust the model to the mixed-mode data. Considering pure mode I, it is found that c1 = logCI and r1 = rI. Including the mode II and mixed-mode parameters, the parabolic equations become
2II
mI
IIIImI loglogloglog
+
+=G
GCC
CG
GCCC (3.26)
( )2
IImIII
IImI
−−+
+=G
Grrr
GG
rrr (3.27)
where Cm and rm are the extra mixed-mode parameters that must be determined by curve fitting. Thus, the propagation parameters for the composite laminates used by
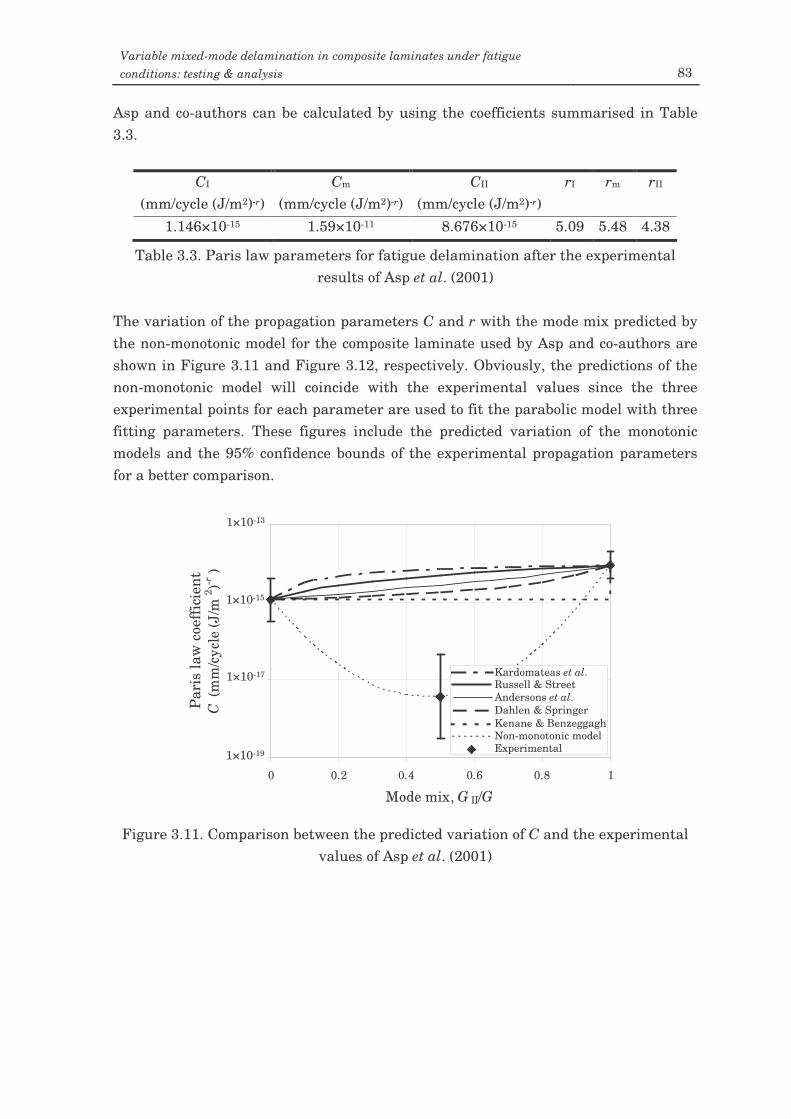
Variable mixed-mode delamination in composite laminates under fatigue conditions: testing & analysis 83
Asp and co-authors can be calculated by using the coefficients summarised in Table 3.3.
CI Cm CII rI rm rII (mm/cycle (J/m2)-r) (mm/cycle (J/m2)-r) (mm/cycle (J/m2)-r)
1.146×10⁻¹⁵ 1.59×10⁻¹¹ 8.676×10⁻¹⁵ 5.09 5.48 4.38
Table 3.3. Paris law parameters for fatigue delamination after the experimental results of Asp et al. (2001)
The variation of the propagation parameters C and r with the mode mix predicted by the non-monotonic model for the composite laminate used by Asp and co-authors are shown in Figure 3.11 and Figure 3.12, respectively. Obviously, the predictions of the non-monotonic model will coincide with the experimental values since the three experimental points for each parameter are used to fit the parabolic model with three fitting parameters. These figures include the predicted variation of the monotonic models and the 95% confidence bounds of the experimental propagation parameters for a better comparison.
Figure 3.11. Comparison between the predicted variation of C and the experimental
values of Asp et al. (2001)
1.E-19
1.E-17
1.E-15
1.E-13
0 0.2 0.4 0.6 0.8 1
Mode mix, G II/G
C (m
m/c
ycle
(J/m
2 )-r)
1×10-13
1×10-15
1×10-17
1×10-19
Par
is la
w c
oeff
icie
nt
Kenane & Benzeggagh Dahlen & Springer
Russell & Street Andersons et al.
Kardomateas et al.
Experimental Non-monotonic model
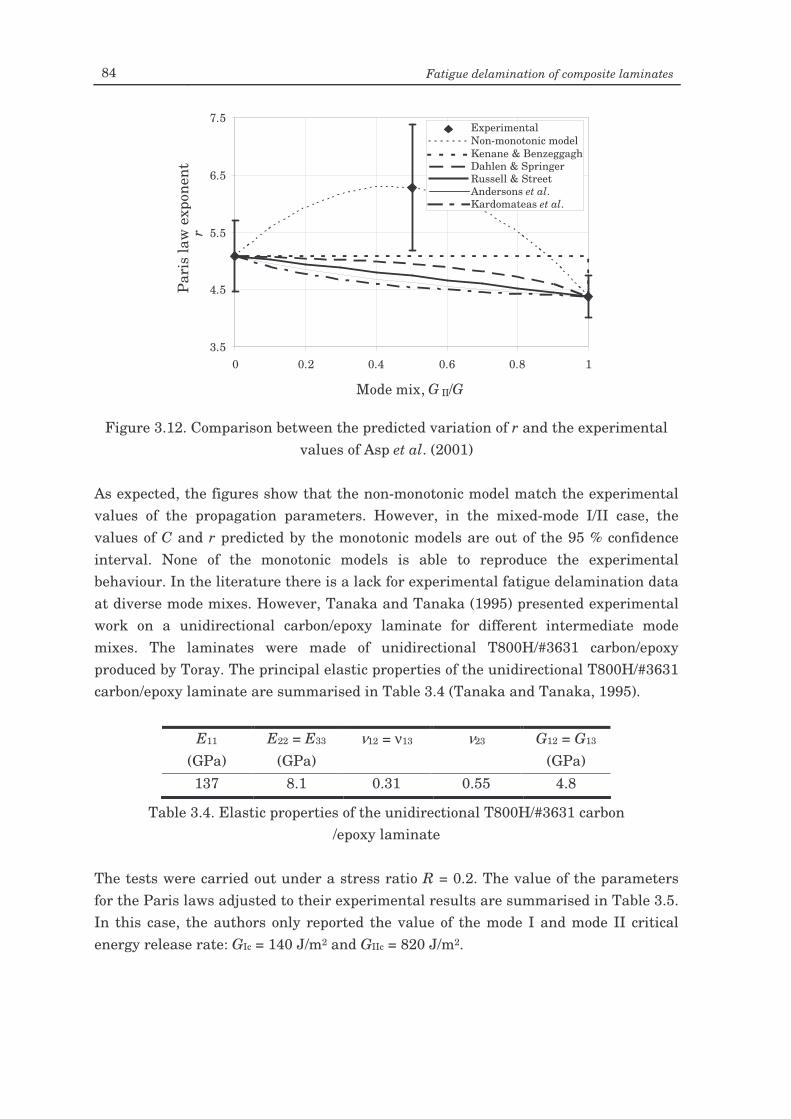
84 Fatigue delamination of composite laminates
Figure 3.12. Comparison between the predicted variation of r and the experimental
values of Asp et al. (2001) As expected, the figures show that the non-monotonic model match the experimental values of the propagation parameters. However, in the mixed-mode I/II case, the values of C and r predicted by the monotonic models are out of the 95 % confidence interval. None of the monotonic models is able to reproduce the experimental behaviour. In the literature there is a lack for experimental fatigue delamination data at diverse mode mixes. However, Tanaka and Tanaka (1995) presented experimental work on a unidirectional carbon/epoxy laminate for different intermediate mode mixes. The laminates were made of unidirectional T800H/#3631 carbon/epoxy produced by Toray. The principal elastic properties of the unidirectional T800H/#3631 carbon/epoxy laminate are summarised in Table 3.4 (Tanaka and Tanaka, 1995).
E11 E22 = E33 ν12 = ν13 ν23 G12 = G13 (GPa) (GPa) (GPa) 137 8.1 0.31 0.55 4.8
Table 3.4. Elastic properties of the unidirectional T800H/#3631 carbon /epoxy laminate
The tests were carried out under a stress ratio R = 0.2. The value of the parameters for the Paris laws adjusted to their experimental results are summarised in Table 3.5. In this case, the authors only reported the value of the mode I and mode II critical energy release rate: GIc = 140 J/m2 and GIIc = 820 J/m2.
3.5
4.5
5.5
6.5
7.5
0 0.2 0.4 0.6 0.8 1
Mode mix, G II/G
rP
aris
law
exp
onen
t
Kenane & Benzeggagh Dahlen & Springer Russell & Street Andersons et al. Kardomateas et al.
Experimental Non-monotonic model
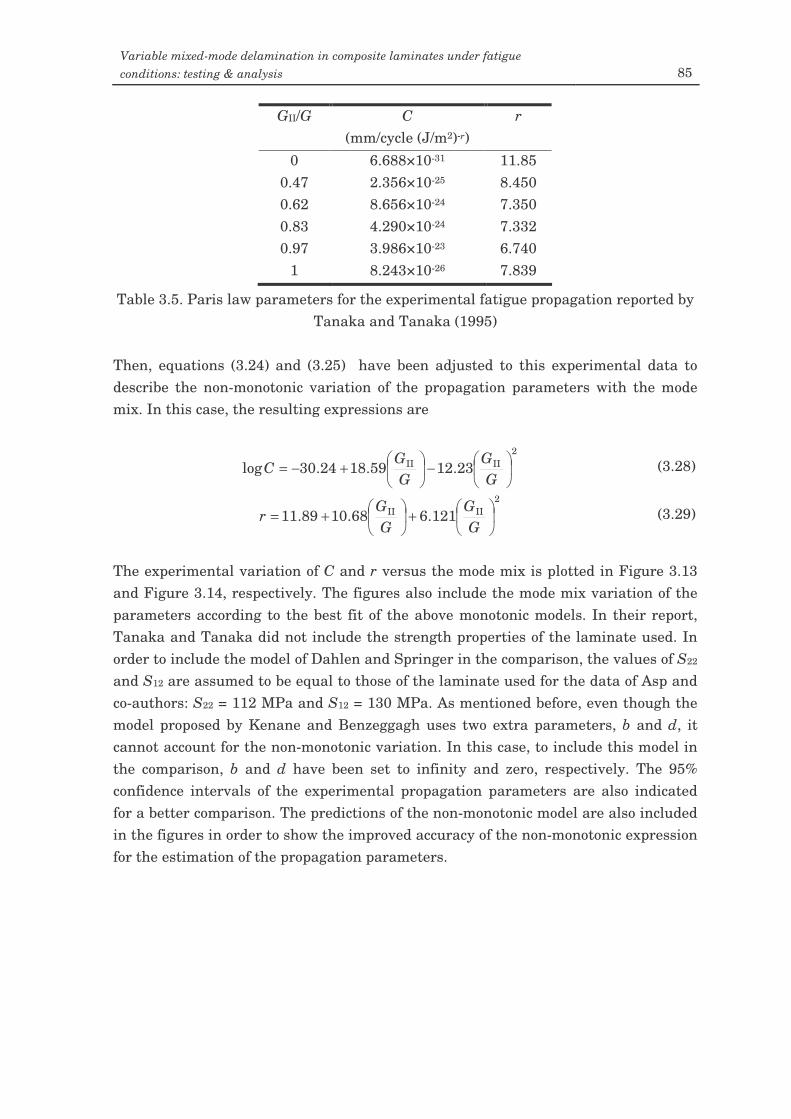
Variable mixed-mode delamination in composite laminates under fatigue conditions: testing & analysis 85
GII/G C r (mm/cycle (J/m2)-r)
0 6.688×10⁻³¹ 11.85 0.47 2.356×10⁻²⁵ 8.450 0.62 8.656×10⁻²⁴ 7.350 0.83 4.290×10⁻²⁴ 7.332 0.97 3.986×10⁻²³ 6.740
1 8.243×10⁻²⁶ 7.839
Table 3.5. Paris law parameters for the experimental fatigue propagation reported by Tanaka and Tanaka (1995)
Then, equations (3.24) and (3.25) have been adjusted to this experimental data to describe the non-monotonic variation of the propagation parameters with the mode mix. In this case, the resulting expressions are
2IIII 23.1259.1824.30log
−
+−=G
GG
GC (3.28)
2IIII 121.668.1089.11
+
+=G
GG
Gr (3.29)
The experimental variation of C and r versus the mode mix is plotted in Figure 3.13 and Figure 3.14, respectively. The figures also include the mode mix variation of the parameters according to the best fit of the above monotonic models. In their report, Tanaka and Tanaka did not include the strength properties of the laminate used. In order to include the model of Dahlen and Springer in the comparison, the values of S22 and S12 are assumed to be equal to those of the laminate used for the data of Asp and co-authors: S22 = 112 MPa and S12 = 130 MPa. As mentioned before, even though the model proposed by Kenane and Benzeggagh uses two extra parameters, b and d, it cannot account for the non-monotonic variation. In this case, to include this model in the comparison, b and d have been set to infinity and zero, respectively. The 95% confidence intervals of the experimental propagation parameters are also indicated for a better comparison. The predictions of the non-monotonic model are also included in the figures in order to show the improved accuracy of the non-monotonic expression for the estimation of the propagation parameters.
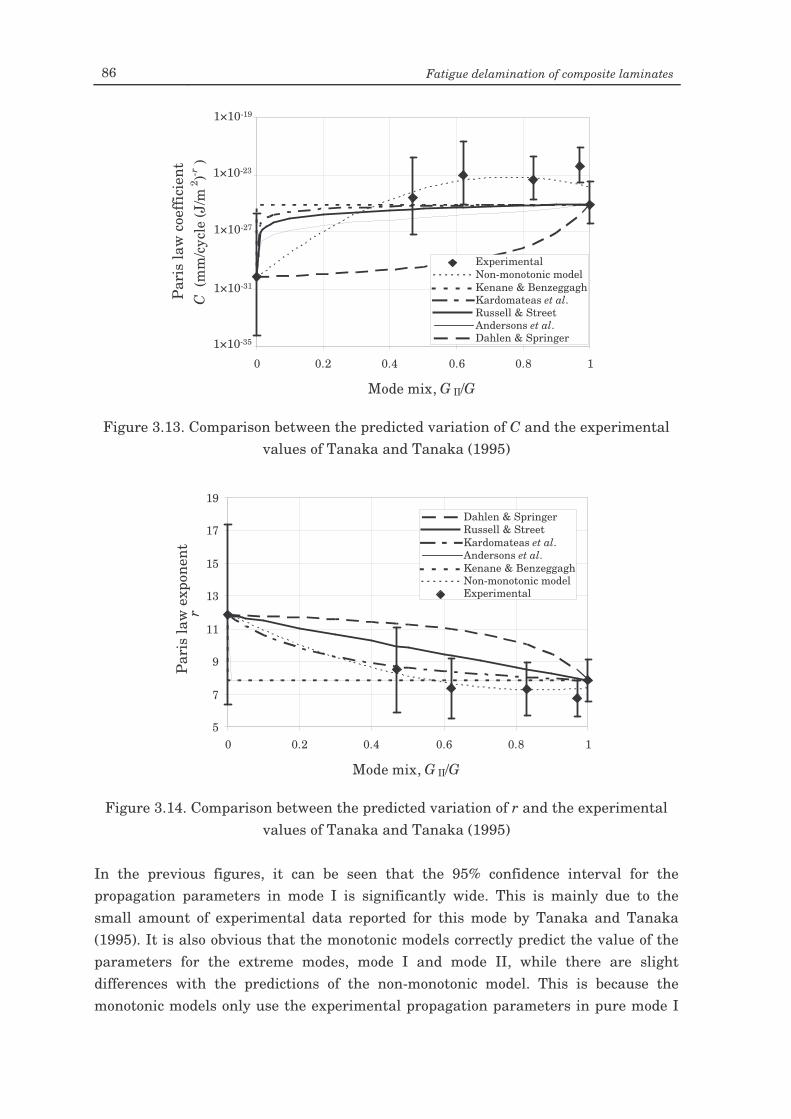
86 Fatigue delamination of composite laminates
Figure 3.13. Comparison between the predicted variation of C and the experimental
values of Tanaka and Tanaka (1995)
Figure 3.14. Comparison between the predicted variation of r and the experimental
values of Tanaka and Tanaka (1995) In the previous figures, it can be seen that the 95% confidence interval for the propagation parameters in mode I is significantly wide. This is mainly due to the small amount of experimental data reported for this mode by Tanaka and Tanaka (1995). It is also obvious that the monotonic models correctly predict the value of the parameters for the extreme modes, mode I and mode II, while there are slight differences with the predictions of the non-monotonic model. This is because the monotonic models only use the experimental propagation parameters in pure mode I
5
7
9
11
13
15
17
19
0 0.2 0.4 0.6 0.8 1
Mode mix, G II/G
rP
aris
law
exp
onen
t
Kenane & Benzeggagh
Dahlen & Springer Russell & Street
Andersons et al. Kardomateas et al.
Experimental Non-monotonic model
1.E-35
1.E-31
1.E-27
1.E-23
1.E-19
0 0.2 0.4 0.6 0.8 1
Mode mix, G II/G
C (
mm
/cyc
le (J
/m2 )-r
)
1×10-19
1×10-23
1×10-27
1×10-35
Par
is la
w c
oeff
icie
nt
1×10-31 Kenane & Benzeggagh
Dahlen & Springer
Russell & Street Andersons et al.
Kardomateas et al.
Experimental Non-monotonic model
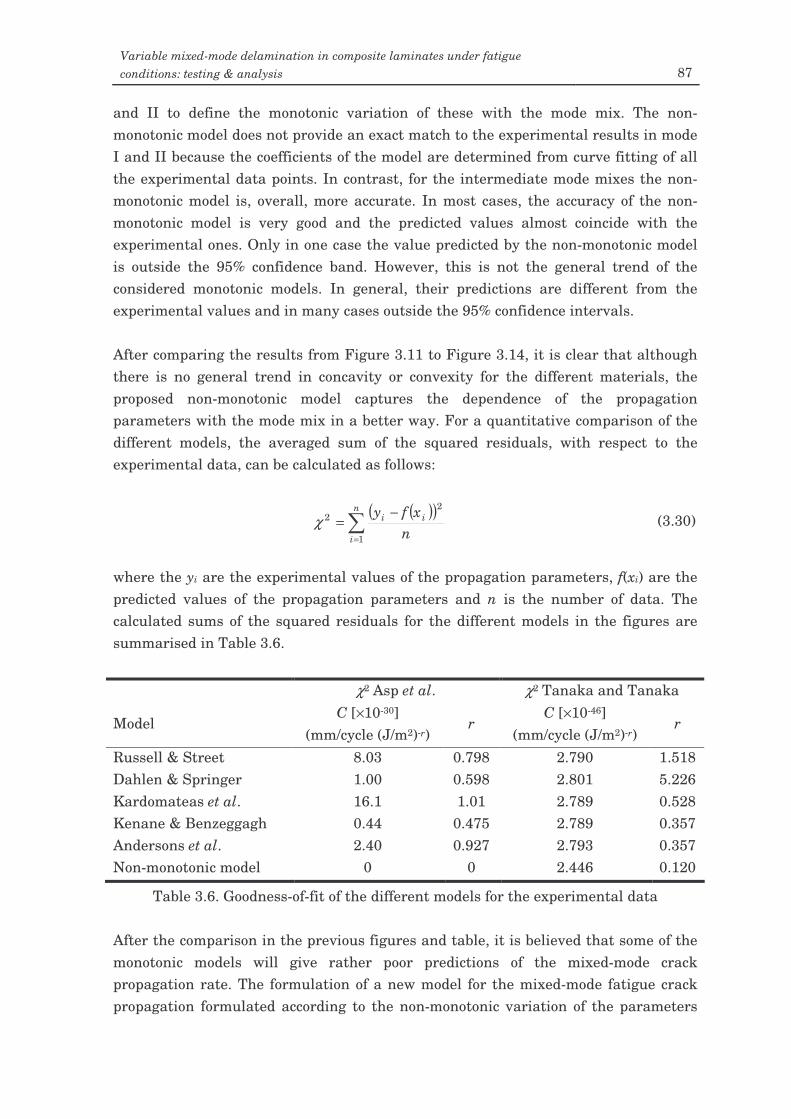
Variable mixed-mode delamination in composite laminates under fatigue conditions: testing & analysis 87
and II to define the monotonic variation of these with the mode mix. The non-monotonic model does not provide an exact match to the experimental results in mode I and II because the coefficients of the model are determined from curve fitting of all the experimental data points. In contrast, for the intermediate mode mixes the non-monotonic model is, overall, more accurate. In most cases, the accuracy of the non-monotonic model is very good and the predicted values almost coincide with the experimental ones. Only in one case the value predicted by the non-monotonic model is outside the 95% confidence band. However, this is not the general trend of the considered monotonic models. In general, their predictions are different from the experimental values and in many cases outside the 95% confidence intervals. After comparing the results from Figure 3.11 to Figure 3.14, it is clear that although there is no general trend in concavity or convexity for the different materials, the proposed non-monotonic model captures the dependence of the propagation parameters with the mode mix in a better way. For a quantitative comparison of the different models, the averaged sum of the squared residuals, with respect to the experimental data, can be calculated as follows:
( )( )
=
−=
n
i
ii
nxfy
1
22χ (3.30)
where the yi are the experimental values of the propagation parameters, f(xi) are the predicted values of the propagation parameters and n is the number of data. The calculated sums of the squared residuals for the different models in the figures are summarised in Table 3.6.
χ2 Asp et al. χ2 Tanaka and Tanaka
Model C [×10-30]
(mm/cycle (J/m2)-r) r
C [×10-46] (mm/cycle (J/m2)-r)
r
Russell & Street 8.03 0.798 2.790 1.518 Dahlen & Springer 1.00 0.598 2.801 5.226 Kardomateas et al. 16.1 1.01 2.789 0.528 Kenane & Benzeggagh 0.44 0.475 2.789 0.357 Andersons et al. 2.40 0.927 2.793 0.357 Non-monotonic model 0 0 2.446 0.120
Table 3.6. Goodness-of-fit of the different models for the experimental data After the comparison in the previous figures and table, it is believed that some of the monotonic models will give rather poor predictions of the mixed-mode crack propagation rate. The formulation of a new model for the mixed-mode fatigue crack propagation formulated according to the non-monotonic variation of the parameters
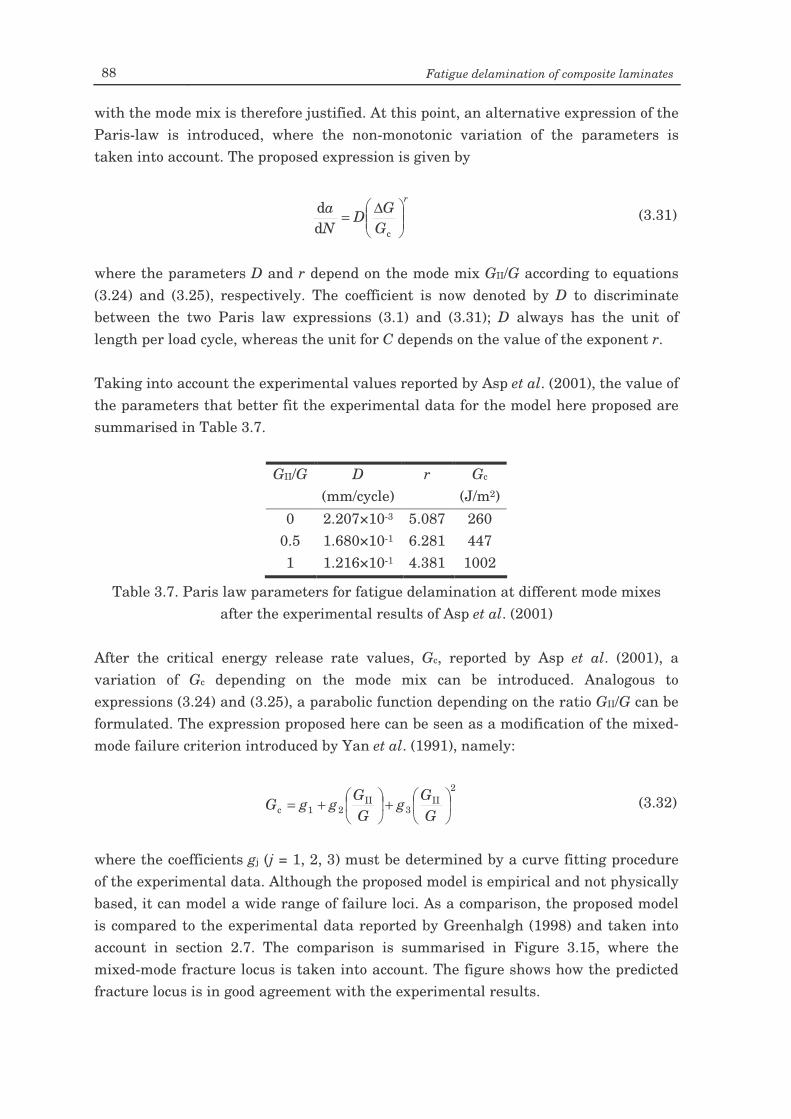
88 Fatigue delamination of composite laminates
with the mode mix is therefore justified. At this point, an alternative expression of the Paris-law is introduced, where the non-monotonic variation of the parameters is taken into account. The proposed expression is given by
r
GGD
Na
∆=cd
d (3.31)
where the parameters D and r depend on the mode mix GII/G according to equations (3.24) and (3.25), respectively. The coefficient is now denoted by D to discriminate between the two Paris law expressions (3.1) and (3.31); D always has the unit of length per load cycle, whereas the unit for C depends on the value of the exponent r. Taking into account the experimental values reported by Asp et al. (2001), the value of the parameters that better fit the experimental data for the model here proposed are summarised in Table 3.7.
GII/G D r Gc
(mm/cycle) (J/m2) 0 2.207×10⁻³ 5.087 260
0.5 1.680×10⁻¹ 6.281 447 1 1.216×10⁻¹ 4.381 1002
Table 3.7. Paris law parameters for fatigue delamination at different mode mixes after the experimental results of Asp et al. (2001)
After the critical energy release rate values, Gc, reported by Asp et al. (2001), a variation of Gc depending on the mode mix can be introduced. Analogous to expressions (3.24) and (3.25), a parabolic function depending on the ratio GII/G can be formulated. The expression proposed here can be seen as a modification of the mixed-mode failure criterion introduced by Yan et al. (1991), namely:
2II
3II
21c
+
+=G
Gg
GG
ggG (3.32)
where the coefficients gj (j = 1, 2, 3) must be determined by a curve fitting procedure of the experimental data. Although the proposed model is empirical and not physically based, it can model a wide range of failure loci. As a comparison, the proposed model is compared to the experimental data reported by Greenhalgh (1998) and taken into account in section 2.7. The comparison is summarised in Figure 3.15, where the mixed-mode fracture locus is taken into account. The figure shows how the predicted fracture locus is in good agreement with the experimental results.
Variable mixed-mode delamination in composite laminates under fatigue conditions: testing & analysis 89
0
50
100
150
200
250
300
0 100 200 300 400 500 600G II (J/m2)
GI (
J/m
2 )
experimentalpresent model
Figure 3.15. Comparison between the predicted mixed-mode fracture locus and the
experimental results reported by Greenhalgh (1998) In this case, it is also possible to fit the parabolic expressions in equations (3.26) and (3.27) to the experimental results of Asp et al. (2001). The coefficients for these equations are summarised in Table 3.8.
DI Dm DII rI rm rII (mm/cycle) (mm/cycle) (mm/cycle) 2.21×10⁻³ 6.09×10⁵ 1.22×10⁻¹ 5.09 5.48 4.38
Table 3.8. Paris law parameters for fatigue delamination at different mode mixes after the experimental results of Asp et al. (2001)
Figure 3.16 shows the comparison between the crack propagation rates for the experimental data of Asp et al. (2001) and the predictions of the monotonic models for a mode mix GII/G = 0.5. Although in this case the crack growth rate predicted by the non-monotonic model coincides with the linear regression of the experimental data, it is also included in the figure for comparison. The models proposed by Gustafson and Hojo and Ramkumar and Whitcomb are also included. However, the model proposed by Schön is not included in the comparison because it could not be adjusted to the experimental data.
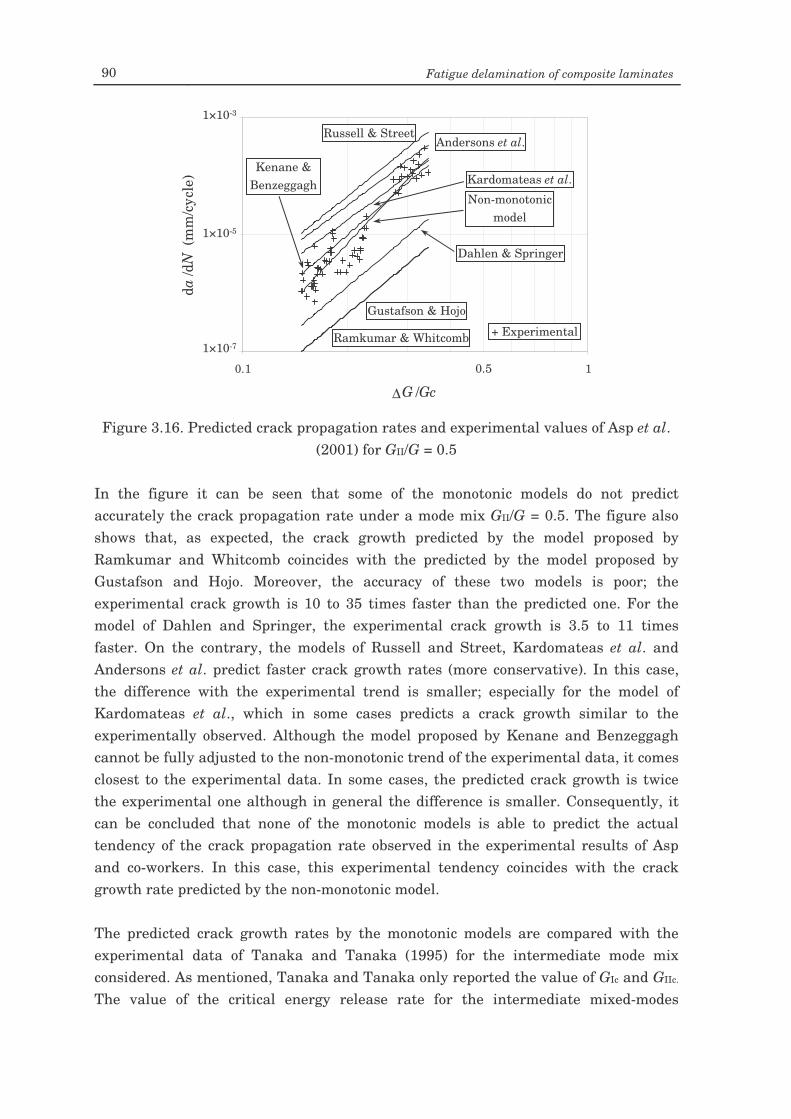
90 Fatigue delamination of composite laminates
Figure 3.16. Predicted crack propagation rates and experimental values of Asp et al.
(2001) for GII/G = 0.5 In the figure it can be seen that some of the monotonic models do not predict accurately the crack propagation rate under a mode mix GII/G = 0.5. The figure also shows that, as expected, the crack growth predicted by the model proposed by Ramkumar and Whitcomb coincides with the predicted by the model proposed by Gustafson and Hojo. Moreover, the accuracy of these two models is poor; the experimental crack growth is 10 to 35 times faster than the predicted one. For the model of Dahlen and Springer, the experimental crack growth is 3.5 to 11 times faster. On the contrary, the models of Russell and Street, Kardomateas et al. and Andersons et al. predict faster crack growth rates (more conservative). In this case, the difference with the experimental trend is smaller; especially for the model of Kardomateas et al., which in some cases predicts a crack growth similar to the experimentally observed. Although the model proposed by Kenane and Benzeggagh cannot be fully adjusted to the non-monotonic trend of the experimental data, it comes closest to the experimental data. In some cases, the predicted crack growth is twice the experimental one although in general the difference is smaller. Consequently, it can be concluded that none of the monotonic models is able to predict the actual tendency of the crack propagation rate observed in the experimental results of Asp and co-workers. In this case, this experimental tendency coincides with the crack growth rate predicted by the non-monotonic model. The predicted crack growth rates by the monotonic models are compared with the experimental data of Tanaka and Tanaka (1995) for the intermediate mode mix considered. As mentioned, Tanaka and Tanaka only reported the value of GIc and GIIc. The value of the critical energy release rate for the intermediate mixed-modes
1.E-07
1.E-05
1.E-03
0.1 1
∆G /Gc
da/d
N (m
m/c
ycle
)
1×10⁻³
1×10⁻⁵
1×10⁻⁷
0.5
Russell & Street Andersons et al.
Kardomateas et al. Kenane &
Benzeggagh
Dahlen & Springer
Gustafson & Hojo
Ramkumar & Whitcomb
Non-monotonic model
+ Experimental
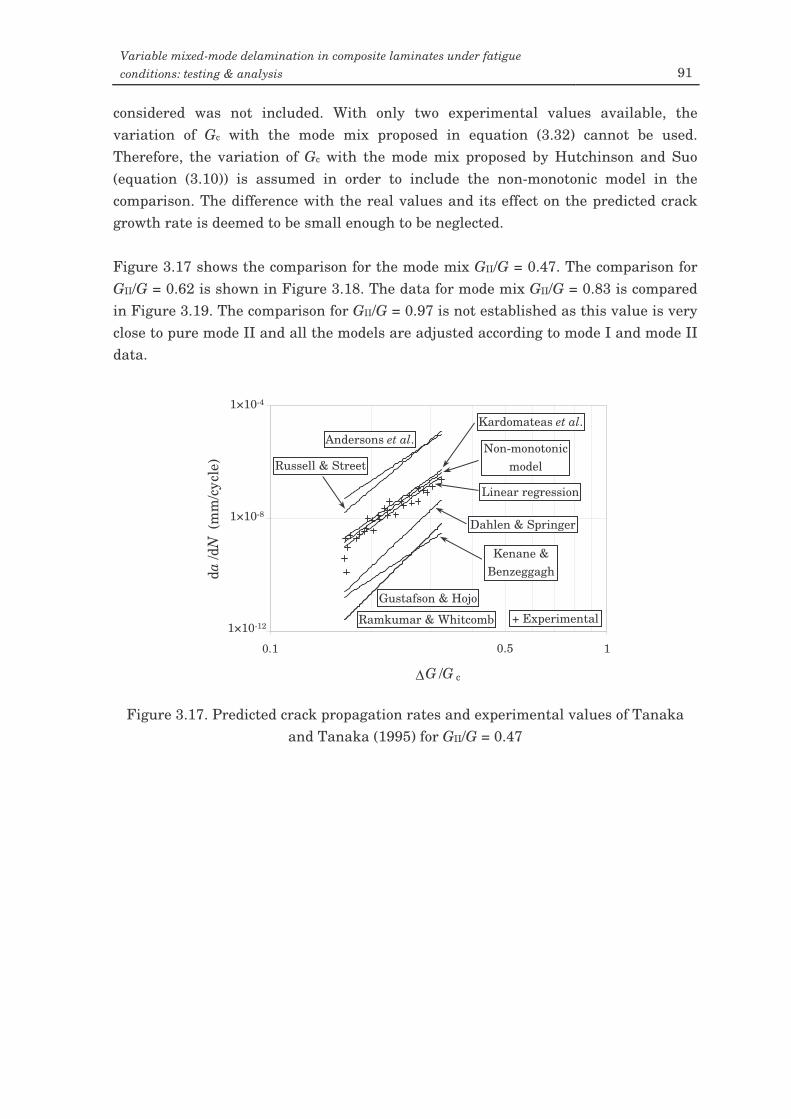
Variable mixed-mode delamination in composite laminates under fatigue conditions: testing & analysis 91
considered was not included. With only two experimental values available, the variation of Gc with the mode mix proposed in equation (3.32) cannot be used. Therefore, the variation of Gc with the mode mix proposed by Hutchinson and Suo (equation (3.10)) is assumed in order to include the non-monotonic model in the comparison. The difference with the real values and its effect on the predicted crack growth rate is deemed to be small enough to be neglected. Figure 3.17 shows the comparison for the mode mix GII/G = 0.47. The comparison for GII/G = 0.62 is shown in Figure 3.18. The data for mode mix GII/G = 0.83 is compared in Figure 3.19. The comparison for GII/G = 0.97 is not established as this value is very close to pure mode II and all the models are adjusted according to mode I and mode II data.
Figure 3.17. Predicted crack propagation rates and experimental values of Tanaka
and Tanaka (1995) for GII/G = 0.47
1.E-12
1.E-08
1.E-04
0.1 1
∆G /G c
da/d
N (m
m/c
ycle
)
1×10⁻⁴
1×10⁻⁸
1×10-12
0.5
Russell & Street
Andersons et al. Kardomateas et al.
Kenane & Benzeggagh
Dahlen & Springer
Gustafson & Hojo
Ramkumar & Whitcomb
Non-monotonic model
+ Experimental
Linear regression
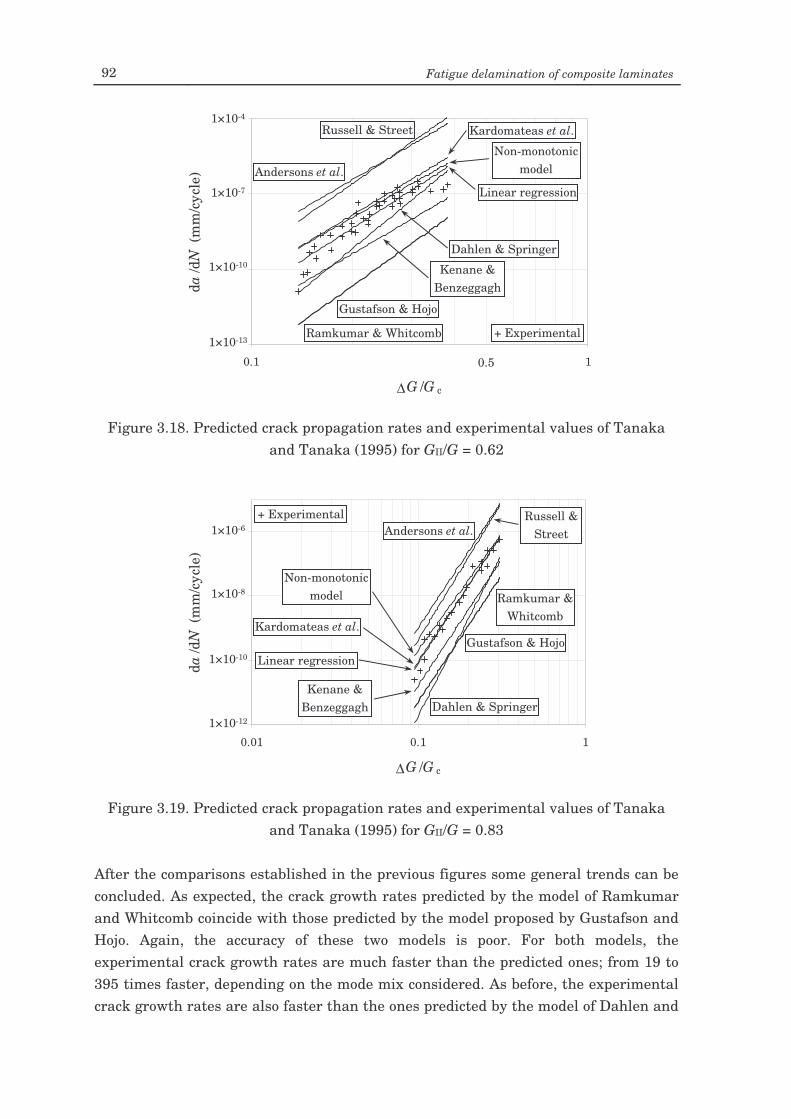
92 Fatigue delamination of composite laminates
Figure 3.18. Predicted crack propagation rates and experimental values of Tanaka
and Tanaka (1995) for GII/G = 0.62
Figure 3.19. Predicted crack propagation rates and experimental values of Tanaka
and Tanaka (1995) for GII/G = 0.83 After the comparisons established in the previous figures some general trends can be concluded. As expected, the crack growth rates predicted by the model of Ramkumar and Whitcomb coincide with those predicted by the model proposed by Gustafson and Hojo. Again, the accuracy of these two models is poor. For both models, the experimental crack growth rates are much faster than the predicted ones; from 19 to 395 times faster, depending on the mode mix considered. As before, the experimental crack growth rates are also faster than the ones predicted by the model of Dahlen and
1.E-12
1.E-10
1.E-08
1.E-06
0.01 0.1 1
∆G /G c
da/d
N (m
m/c
ycle
)
1×10⁻⁶
1×10⁻¹⁰
1×10-12
1×10⁻⁸
Russell & Street Andersons et al.
Kardomateas et al.
Kenane & Benzeggagh Dahlen & Springer
Gustafson & Hojo
Ramkumar & Whitcomb
Non-monotonic model
+ Experimental
Linear regression
1.E-13
1.E-10
1.E-07
1.E-04
0.1 1
∆G /G c
da/d
N (m
m/c
ycle
)
1×10⁻⁴
1×10⁻¹⁰
1×10-13
0.5
1×10⁻⁷
Russell & Street
Andersons et al.
Kardomateas et al.
Kenane & Benzeggagh
Dahlen & Springer
Gustafson & Hojo
Ramkumar & Whitcomb
Non-monotonic model
+ Experimental
Linear regression
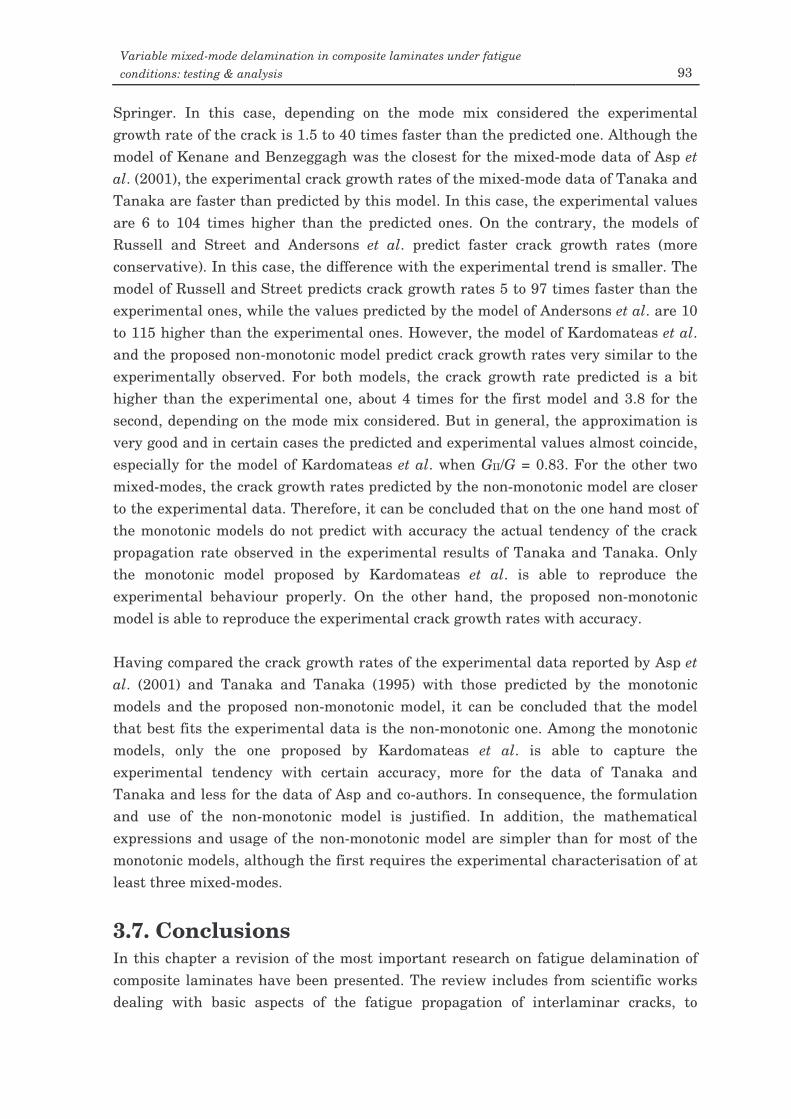
Variable mixed-mode delamination in composite laminates under fatigue conditions: testing & analysis 93
Springer. In this case, depending on the mode mix considered the experimental growth rate of the crack is 1.5 to 40 times faster than the predicted one. Although the model of Kenane and Benzeggagh was the closest for the mixed-mode data of Asp et al. (2001), the experimental crack growth rates of the mixed-mode data of Tanaka and Tanaka are faster than predicted by this model. In this case, the experimental values are 6 to 104 times higher than the predicted ones. On the contrary, the models of Russell and Street and Andersons et al. predict faster crack growth rates (more conservative). In this case, the difference with the experimental trend is smaller. The model of Russell and Street predicts crack growth rates 5 to 97 times faster than the experimental ones, while the values predicted by the model of Andersons et al. are 10 to 115 higher than the experimental ones. However, the model of Kardomateas et al. and the proposed non-monotonic model predict crack growth rates very similar to the experimentally observed. For both models, the crack growth rate predicted is a bit higher than the experimental one, about 4 times for the first model and 3.8 for the second, depending on the mode mix considered. But in general, the approximation is very good and in certain cases the predicted and experimental values almost coincide, especially for the model of Kardomateas et al. when GII/G = 0.83. For the other two mixed-modes, the crack growth rates predicted by the non-monotonic model are closer to the experimental data. Therefore, it can be concluded that on the one hand most of the monotonic models do not predict with accuracy the actual tendency of the crack propagation rate observed in the experimental results of Tanaka and Tanaka. Only the monotonic model proposed by Kardomateas et al. is able to reproduce the experimental behaviour properly. On the other hand, the proposed non-monotonic model is able to reproduce the experimental crack growth rates with accuracy. Having compared the crack growth rates of the experimental data reported by Asp et al. (2001) and Tanaka and Tanaka (1995) with those predicted by the monotonic models and the proposed non-monotonic model, it can be concluded that the model that best fits the experimental data is the non-monotonic one. Among the monotonic models, only the one proposed by Kardomateas et al. is able to capture the experimental tendency with certain accuracy, more for the data of Tanaka and Tanaka and less for the data of Asp and co-authors. In consequence, the formulation and use of the non-monotonic model is justified. In addition, the mathematical expressions and usage of the non-monotonic model are simpler than for most of the monotonic models, although the first requires the experimental characterisation of at least three mixed-modes.
3.7. Conclusions In this chapter a revision of the most important research on fatigue delamination of composite laminates have been presented. The review includes from scientific works dealing with basic aspects of the fatigue propagation of interlaminar cracks, to
94 Fatigue delamination of composite laminates
articles dealing with the influence of the stress ratio on the fatigue crack growth rate. Despite the great effect that R has on the fatigue crack propagation and the advantages of using certain parameters to collapse the data for different values of R in one mastercurve, these parameters are not extensively used. Most of the mixed-mode fatigue delamination models are formulated in such a way that their parameters must be determined for every stress ratio considered. The more relevant criteria for the mixed-mode fatigue propagation of interlaminar cracks have been also included and discussed in this chapter. These models have in common that the variation of the propagation parameters with the mode mix is assumed to be monotonic. However, two sets of experimental data in which the variation of the propagation parameters with the mode mix is non-monotonic have been presented. Hence, the formulation of a new non-monotonic model able to capture the real variation of the propagation parameters is justified. A new model has been proposed; which, due to its parabolic formulation, allows for a non-monotonic variation of the propagation parameters. The newly proposed non-monotonic model and the monotonic models present in the literature have been compared to the experimental crack growth rate data. After the comparison, it can be concluded that whilst the non-monotonic model is able to describe the experimental data with accuracy, only one of the monotonic models (the one proposed by Kardomateas and co-workers) can be considered accurate enough. Therefore, the proposed non-monotonic model can be seen as an improved method to describe the fatigue crack growth of interlaminar cracks in composite laminates. For the complete validation of the non-monotonic model, a set of experimental tests where the mode-mix is varying continuously have been carried out. The description of the experimental tasks and the comparison between the experimental results and the predictions of the non-monotonic model are presented in the following chapters.
Chapter 4 Experimental fatigue crack growth
under variable mode mix
4.1. Introduction It has been stated in the previous chapters that delaminations in composite laminated structures are likely to propagate in any combination of mode I and mode II (Tanaka and Tanaka, 1997). Usually, experimental investigations on mixed-mode I/II delaminations are carried out by means of the MMB test. These investigations, especially when the propagation of the delamination is studied under either static or fatigue loading, are performed under a constant mode mix. The ratio of mode II energy release rate to total energy release rate is assumed constant all over the crack length. However, this is not the real situation when a delamination grows in a laminated composite structure. Many composite components have curved shapes, tapered thickness and plies with different orientations that make the delamination grow with a mode mix that depends on the extent of the delamination. In general, the delamination starts under a predominant opening mode and changes progressively with the crack length to a predominant shearing mode. Thus, the mode mix changes continuously with the crack length. The study of fatigue propagation of interlaminar cracks under varying mode mix is very important for the characterisation of composite delaminations. Moreover, experimental fatigue propagation data under varying mode mix can be very useful to validate the non-monotonic model proposed in Chapter 3. Even though the MMELS test is not commonly used for the investigation of onset and propagation of delaminations, this test has the advantage to cause a varying mode mix (see section 6.4). The fraction of mode II energy release rate increases with the crack length. In this way, crack propagation under laboratory conditions becomes more similar to interlaminar crack propagation in real laminated composite structures. The present chapter describes the preparation of the fatigue interlaminar crack propagation tests under varying mode mix. The tests are carried out using a MMELS
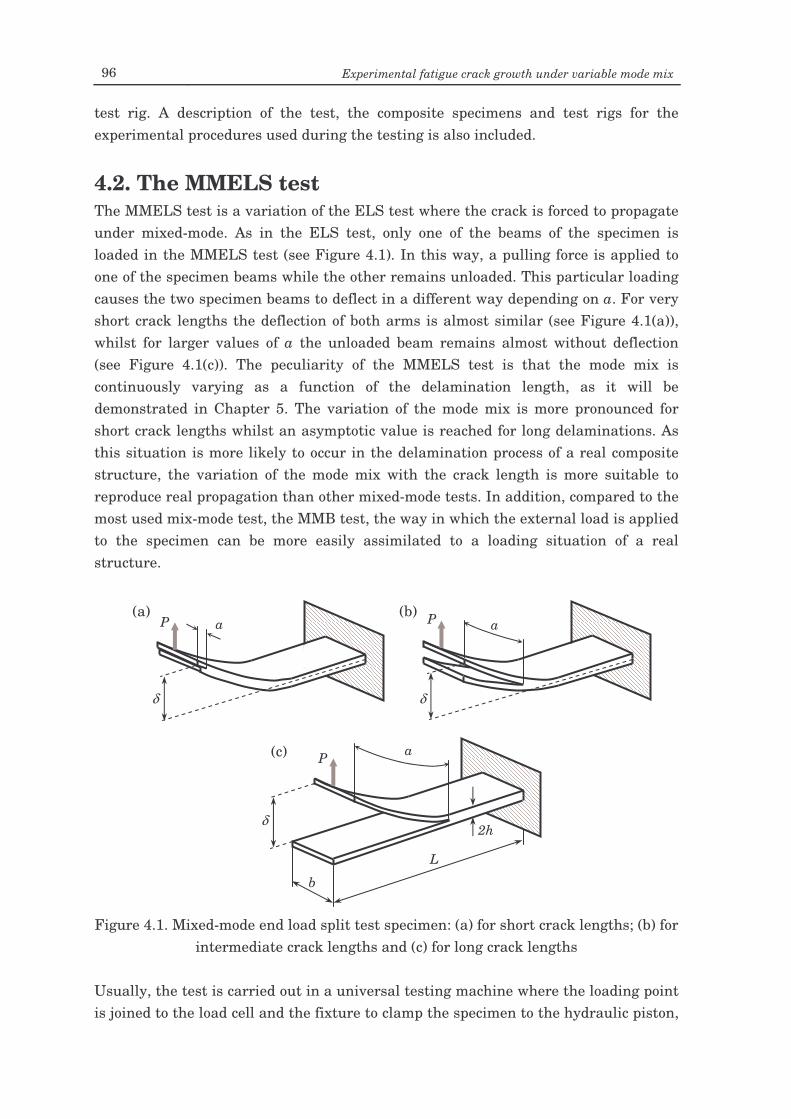
96 Experimental fatigue crack growth under variable mode mix
test rig. A description of the test, the composite specimens and test rigs for the experimental procedures used during the testing is also included.
4.2. The MMELS test The MMELS test is a variation of the ELS test where the crack is forced to propagate under mixed-mode. As in the ELS test, only one of the beams of the specimen is loaded in the MMELS test (see Figure 4.1). In this way, a pulling force is applied to one of the specimen beams while the other remains unloaded. This particular loading causes the two specimen beams to deflect in a different way depending on a. For very short crack lengths the deflection of both arms is almost similar (see Figure 4.1(a)), whilst for larger values of a the unloaded beam remains almost without deflection (see Figure 4.1(c)). The peculiarity of the MMELS test is that the mode mix is continuously varying as a function of the delamination length, as it will be demonstrated in Chapter 5. The variation of the mode mix is more pronounced for short crack lengths whilst an asymptotic value is reached for long delaminations. As this situation is more likely to occur in the delamination process of a real composite structure, the variation of the mode mix with the crack length is more suitable to reproduce real propagation than other mixed-mode tests. In addition, compared to the most used mix-mode test, the MMB test, the way in which the external load is applied to the specimen can be more easily assimilated to a loading situation of a real structure.
Figure 4.1. Mixed-mode end load split test specimen: (a) for short crack lengths; (b) for
intermediate crack lengths and (c) for long crack lengths Usually, the test is carried out in a universal testing machine where the loading point is joined to the load cell and the fixture to clamp the specimen to the hydraulic piston,
a P
δ
(a) a P
δ
a P
δ
(b)
(c)
L
b
2h
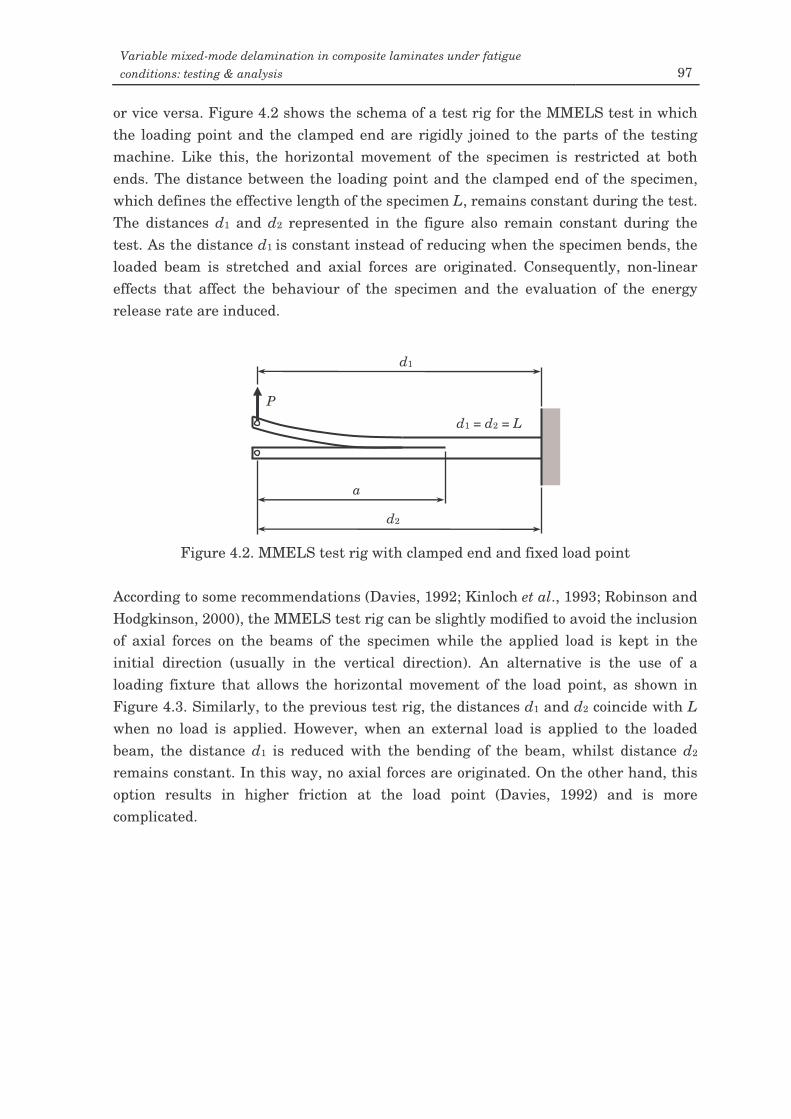
Variable mixed-mode delamination in composite laminates under fatigue conditions: testing & analysis 97
or vice versa. Figure 4.2 shows the schema of a test rig for the MMELS test in which the loading point and the clamped end are rigidly joined to the parts of the testing machine. Like this, the horizontal movement of the specimen is restricted at both ends. The distance between the loading point and the clamped end of the specimen, which defines the effective length of the specimen L, remains constant during the test. The distances d1 and d2 represented in the figure also remain constant during the test. As the distance d1 is constant instead of reducing when the specimen bends, the loaded beam is stretched and axial forces are originated. Consequently, non-linear effects that affect the behaviour of the specimen and the evaluation of the energy release rate are induced.
Figure 4.2. MMELS test rig with clamped end and fixed load point
According to some recommendations (Davies, 1992; Kinloch et al., 1993; Robinson and Hodgkinson, 2000), the MMELS test rig can be slightly modified to avoid the inclusion of axial forces on the beams of the specimen while the applied load is kept in the initial direction (usually in the vertical direction). An alternative is the use of a loading fixture that allows the horizontal movement of the load point, as shown in Figure 4.3. Similarly, to the previous test rig, the distances d1 and d2 coincide with L when no load is applied. However, when an external load is applied to the loaded beam, the distance d1 is reduced with the bending of the beam, whilst distance d2 remains constant. In this way, no axial forces are originated. On the other hand, this option results in higher friction at the load point (Davies, 1992) and is more complicated.
a
d1 = d2 = L
d1
P
d2
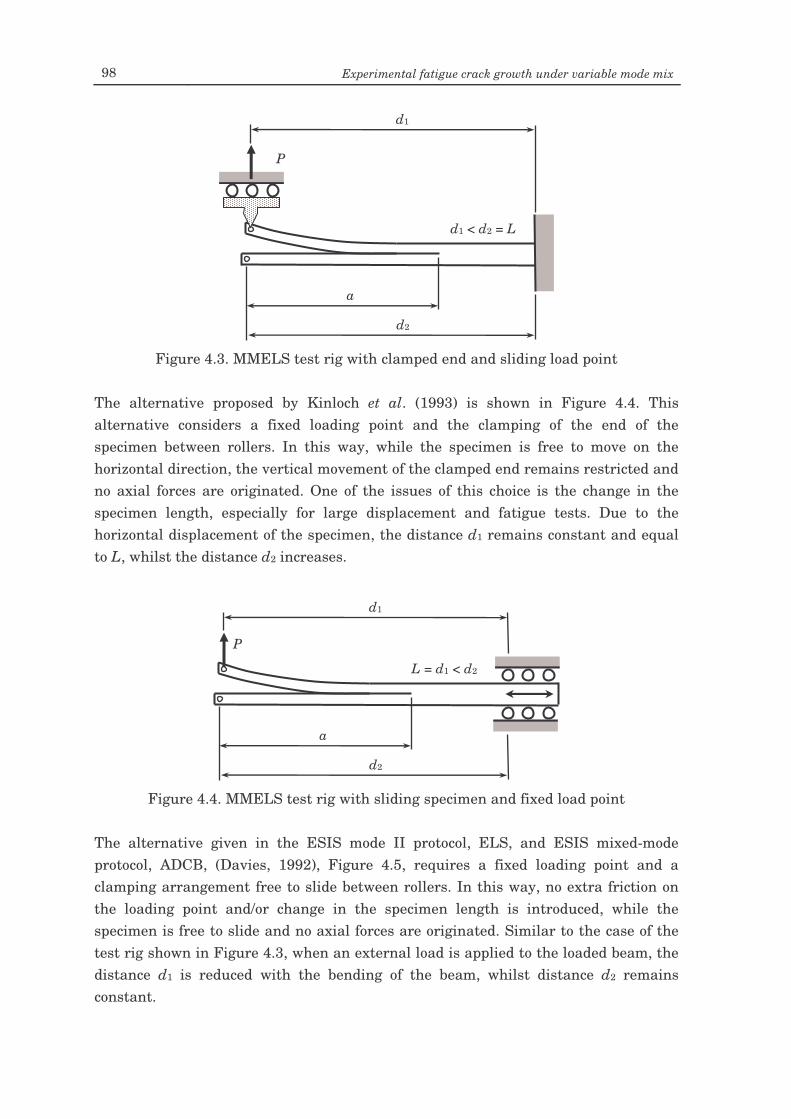
98 Experimental fatigue crack growth under variable mode mix
Figure 4.3. MMELS test rig with clamped end and sliding load point
The alternative proposed by Kinloch et al. (1993) is shown in Figure 4.4. This alternative considers a fixed loading point and the clamping of the end of the specimen between rollers. In this way, while the specimen is free to move on the horizontal direction, the vertical movement of the clamped end remains restricted and no axial forces are originated. One of the issues of this choice is the change in the specimen length, especially for large displacement and fatigue tests. Due to the horizontal displacement of the specimen, the distance d1 remains constant and equal to L, whilst the distance d2 increases.
Figure 4.4. MMELS test rig with sliding specimen and fixed load point
The alternative given in the ESIS mode II protocol, ELS, and ESIS mixed-mode protocol, ADCB, (Davies, 1992), Figure 4.5, requires a fixed loading point and a clamping arrangement free to slide between rollers. In this way, no extra friction on the loading point and/or change in the specimen length is introduced, while the specimen is free to slide and no axial forces are originated. Similar to the case of the test rig shown in Figure 4.3, when an external load is applied to the loaded beam, the distance d1 is reduced with the bending of the beam, whilst distance d2 remains constant.
a
d2
d1
P
L = d1 < d2
a
d2
d1
P
d1 < d2 = L
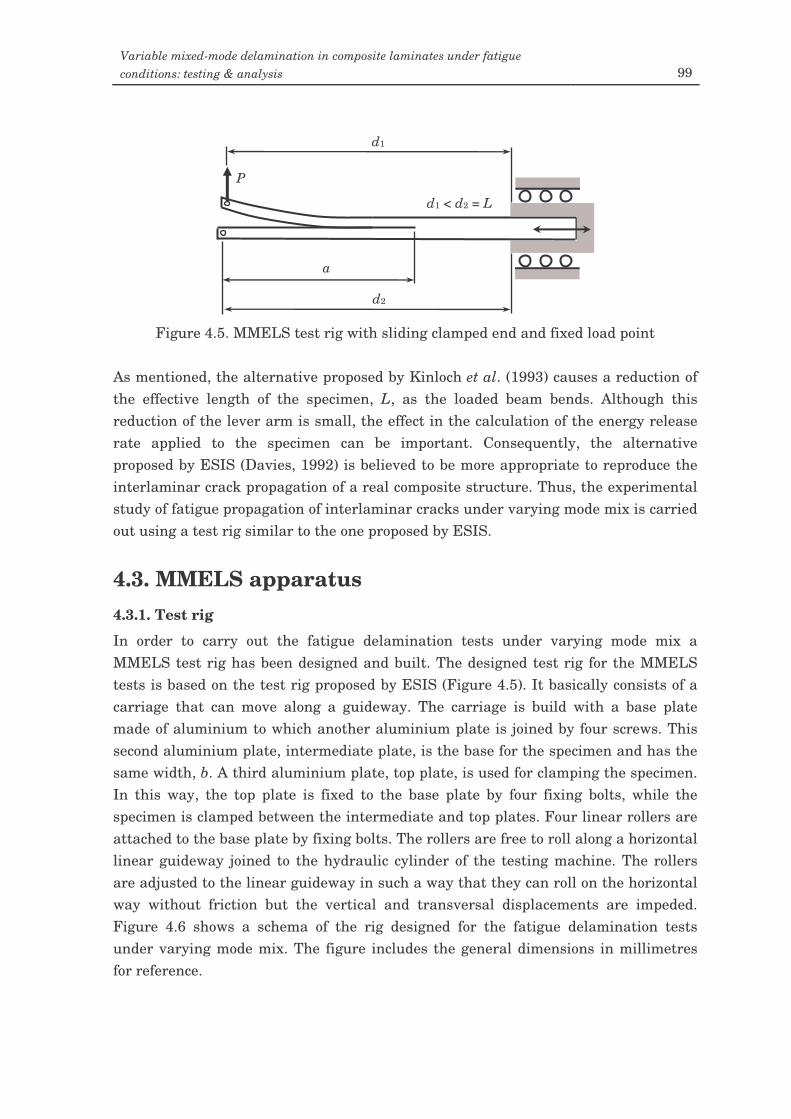
Variable mixed-mode delamination in composite laminates under fatigue conditions: testing & analysis 99
Figure 4.5. MMELS test rig with sliding clamped end and fixed load point
As mentioned, the alternative proposed by Kinloch et al. (1993) causes a reduction of the effective length of the specimen, L, as the loaded beam bends. Although this reduction of the lever arm is small, the effect in the calculation of the energy release rate applied to the specimen can be important. Consequently, the alternative proposed by ESIS (Davies, 1992) is believed to be more appropriate to reproduce the interlaminar crack propagation of a real composite structure. Thus, the experimental study of fatigue propagation of interlaminar cracks under varying mode mix is carried out using a test rig similar to the one proposed by ESIS.
4.3. MMELS apparatus 4.3.1. Test rig
In order to carry out the fatigue delamination tests under varying mode mix a MMELS test rig has been designed and built. The designed test rig for the MMELS tests is based on the test rig proposed by ESIS (Figure 4.5). It basically consists of a carriage that can move along a guideway. The carriage is build with a base plate made of aluminium to which another aluminium plate is joined by four screws. This second aluminium plate, intermediate plate, is the base for the specimen and has the same width, b. A third aluminium plate, top plate, is used for clamping the specimen. In this way, the top plate is fixed to the base plate by four fixing bolts, while the specimen is clamped between the intermediate and top plates. Four linear rollers are attached to the base plate by fixing bolts. The rollers are free to roll along a horizontal linear guideway joined to the hydraulic cylinder of the testing machine. The rollers are adjusted to the linear guideway in such a way that they can roll on the horizontal way without friction but the vertical and transversal displacements are impeded. Figure 4.6 shows a schema of the rig designed for the fatigue delamination tests under varying mode mix. The figure includes the general dimensions in millimetres for reference.
a
d2
d1
P
d1 < d2 = L
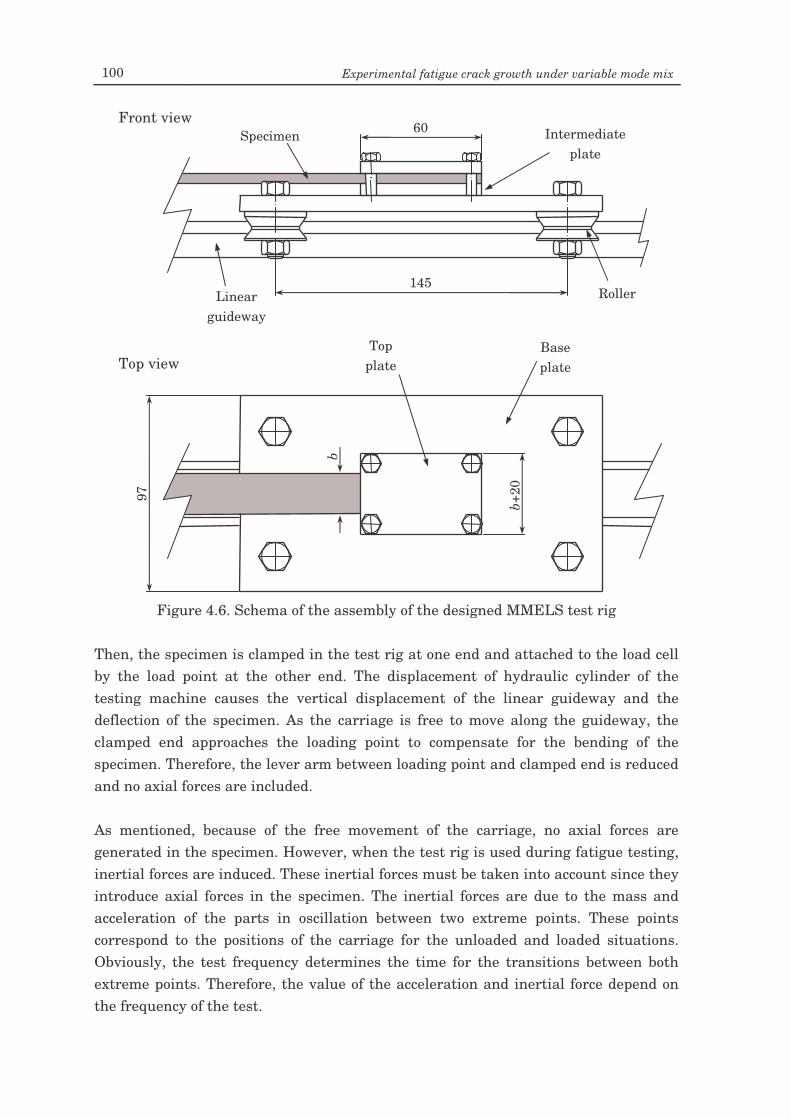
100 Experimental fatigue crack growth under variable mode mix
Figure 4.6. Schema of the assembly of the designed MMELS test rig
Then, the specimen is clamped in the test rig at one end and attached to the load cell by the load point at the other end. The displacement of hydraulic cylinder of the testing machine causes the vertical displacement of the linear guideway and the deflection of the specimen. As the carriage is free to move along the guideway, the clamped end approaches the loading point to compensate for the bending of the specimen. Therefore, the lever arm between loading point and clamped end is reduced and no axial forces are included. As mentioned, because of the free movement of the carriage, no axial forces are generated in the specimen. However, when the test rig is used during fatigue testing, inertial forces are induced. These inertial forces must be taken into account since they introduce axial forces in the specimen. The inertial forces are due to the mass and acceleration of the parts in oscillation between two extreme points. These points correspond to the positions of the carriage for the unloaded and loaded situations. Obviously, the test frequency determines the time for the transitions between both extreme points. Therefore, the value of the acceleration and inertial force depend on the frequency of the test.
145
60 97
b+20
b
Top view
Front view
Top plate
Intermediate plate
Roller
Specimen
Base plate
Linear guideway
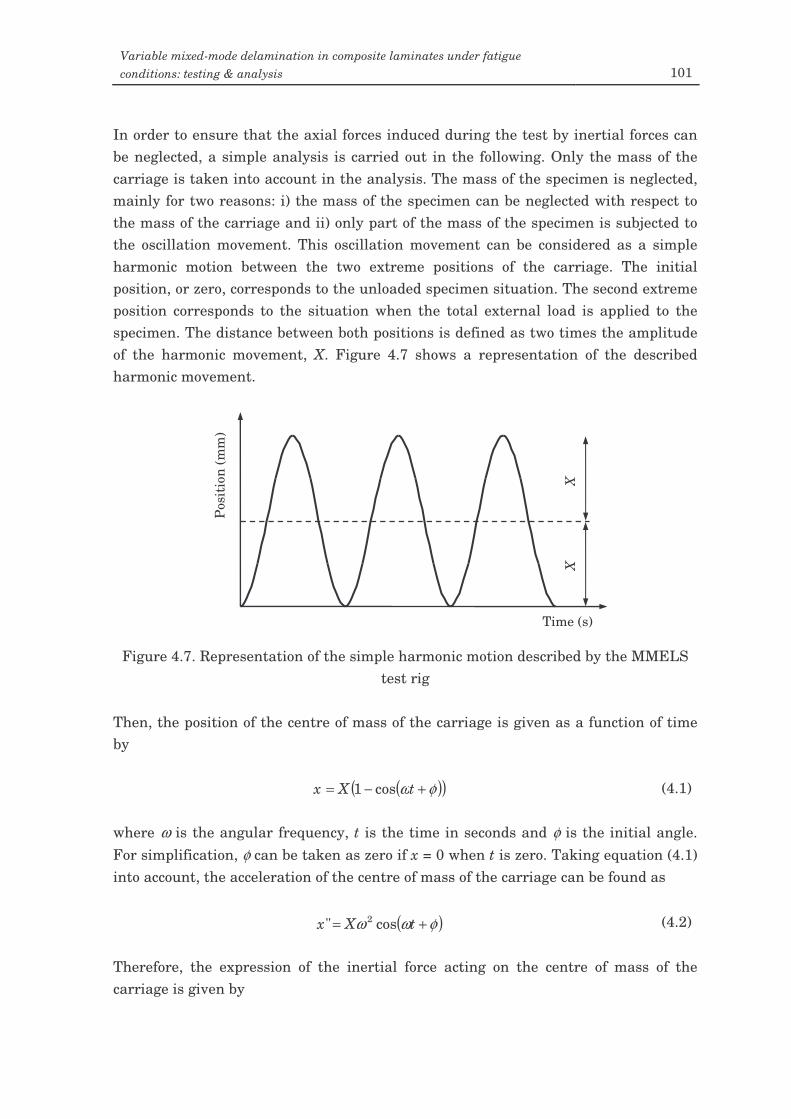
Variable mixed-mode delamination in composite laminates under fatigue conditions: testing & analysis 101
In order to ensure that the axial forces induced during the test by inertial forces can be neglected, a simple analysis is carried out in the following. Only the mass of the carriage is taken into account in the analysis. The mass of the specimen is neglected, mainly for two reasons: i) the mass of the specimen can be neglected with respect to the mass of the carriage and ii) only part of the mass of the specimen is subjected to the oscillation movement. This oscillation movement can be considered as a simple harmonic motion between the two extreme positions of the carriage. The initial position, or zero, corresponds to the unloaded specimen situation. The second extreme position corresponds to the situation when the total external load is applied to the specimen. The distance between both positions is defined as two times the amplitude of the harmonic movement, X. Figure 4.7 shows a representation of the described harmonic movement.
Figure 4.7. Representation of the simple harmonic motion described by the MMELS
test rig Then, the position of the centre of mass of the carriage is given as a function of time by
( )( )φω +−= tXx cos1 (4.1) where ω is the angular frequency, t is the time in seconds and φ is the initial angle. For simplification, φ can be taken as zero if x = 0 when t is zero. Taking equation (4.1) into account, the acceleration of the centre of mass of the carriage can be found as
( )φωω += tXx cos" 2 (4.2) Therefore, the expression of the inertial force acting on the centre of mass of the carriage is given by
Time (s)
Pos
itio
n (m
m)
X
X
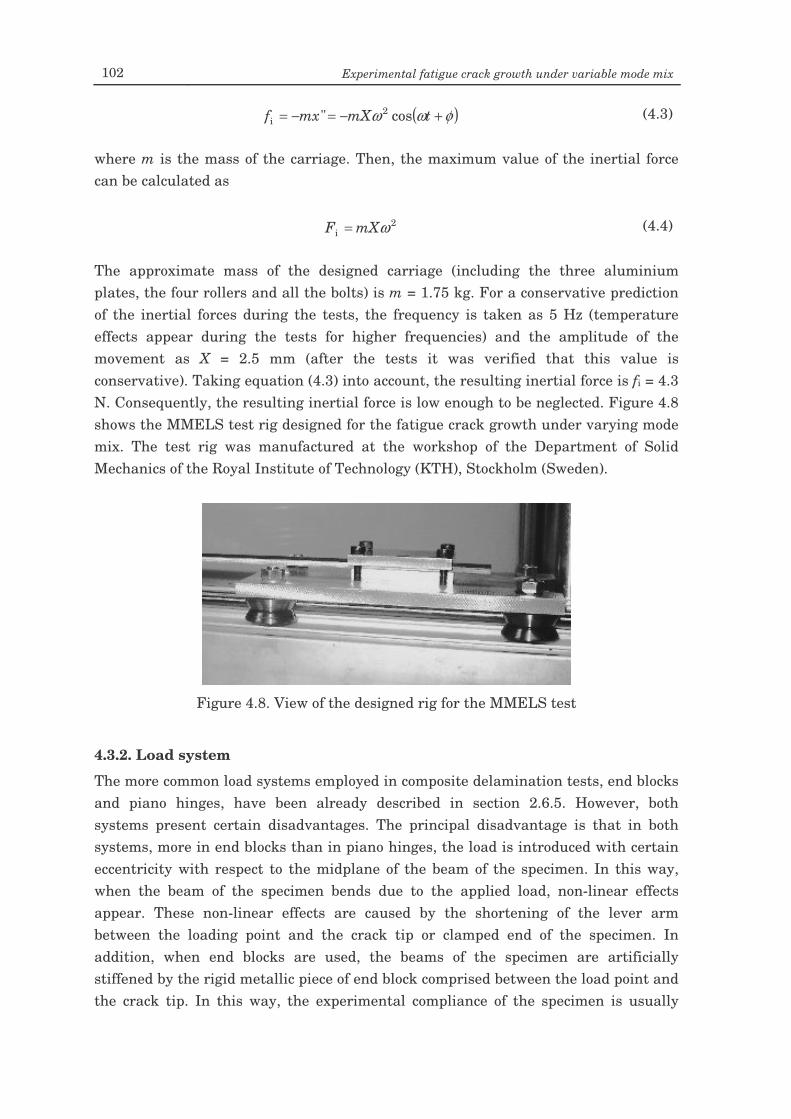
102 Experimental fatigue crack growth under variable mode mix
( )φωω +−=−= tmXmxf cos" 2i (4.3)
where m is the mass of the carriage. Then, the maximum value of the inertial force can be calculated as
2i ωmXF = (4.4)
The approximate mass of the designed carriage (including the three aluminium plates, the four rollers and all the bolts) is m = 1.75 kg. For a conservative prediction of the inertial forces during the tests, the frequency is taken as 5 Hz (temperature effects appear during the tests for higher frequencies) and the amplitude of the movement as X = 2.5 mm (after the tests it was verified that this value is conservative). Taking equation (4.3) into account, the resulting inertial force is fi = 4.3 N. Consequently, the resulting inertial force is low enough to be neglected. Figure 4.8 shows the MMELS test rig designed for the fatigue crack growth under varying mode mix. The test rig was manufactured at the workshop of the Department of Solid Mechanics of the Royal Institute of Technology (KTH), Stockholm (Sweden).
Figure 4.8. View of the designed rig for the MMELS test
4.3.2. Load system
The more common load systems employed in composite delamination tests, end blocks and piano hinges, have been already described in section 2.6.5. However, both systems present certain disadvantages. The principal disadvantage is that in both systems, more in end blocks than in piano hinges, the load is introduced with certain eccentricity with respect to the midplane of the beam of the specimen. In this way, when the beam of the specimen bends due to the applied load, non-linear effects appear. These non-linear effects are caused by the shortening of the lever arm between the loading point and the crack tip or clamped end of the specimen. In addition, when end blocks are used, the beams of the specimen are artificially stiffened by the rigid metallic piece of end block comprised between the load point and the crack tip. In this way, the experimental compliance of the specimen is usually
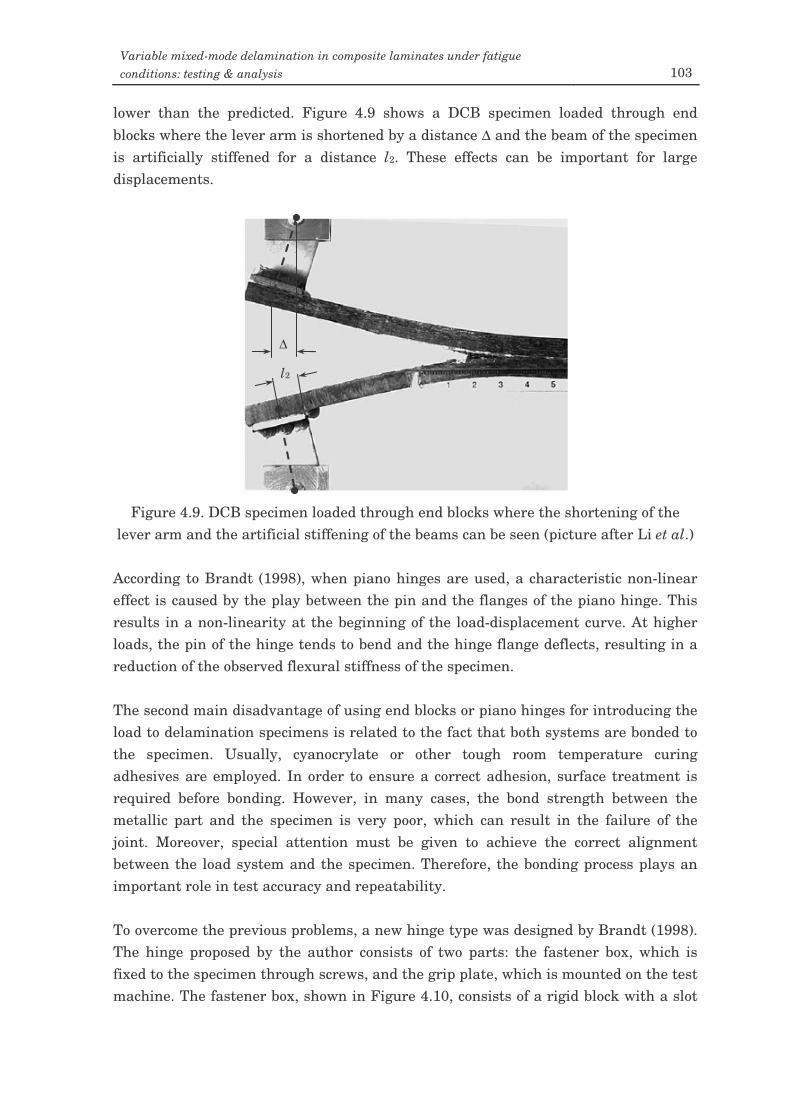
Variable mixed-mode delamination in composite laminates under fatigue conditions: testing & analysis 103
lower than the predicted. Figure 4.9 shows a DCB specimen loaded through end blocks where the lever arm is shortened by a distance ∆ and the beam of the specimen is artificially stiffened for a distance l2. These effects can be important for large displacements.
Figure 4.9. DCB specimen loaded through end blocks where the shortening of the
lever arm and the artificial stiffening of the beams can be seen (picture after Li et al.) According to Brandt (1998), when piano hinges are used, a characteristic non-linear effect is caused by the play between the pin and the flanges of the piano hinge. This results in a non-linearity at the beginning of the load-displacement curve. At higher loads, the pin of the hinge tends to bend and the hinge flange deflects, resulting in a reduction of the observed flexural stiffness of the specimen. The second main disadvantage of using end blocks or piano hinges for introducing the load to delamination specimens is related to the fact that both systems are bonded to the specimen. Usually, cyanocrylate or other tough room temperature curing adhesives are employed. In order to ensure a correct adhesion, surface treatment is required before bonding. However, in many cases, the bond strength between the metallic part and the specimen is very poor, which can result in the failure of the joint. Moreover, special attention must be given to achieve the correct alignment between the load system and the specimen. Therefore, the bonding process plays an important role in test accuracy and repeatability. To overcome the previous problems, a new hinge type was designed by Brandt (1998). The hinge proposed by the author consists of two parts: the fastener box, which is fixed to the specimen through screws, and the grip plate, which is mounted on the test machine. The fastener box, shown in Figure 4.10, consists of a rigid block with a slot
∆
l2
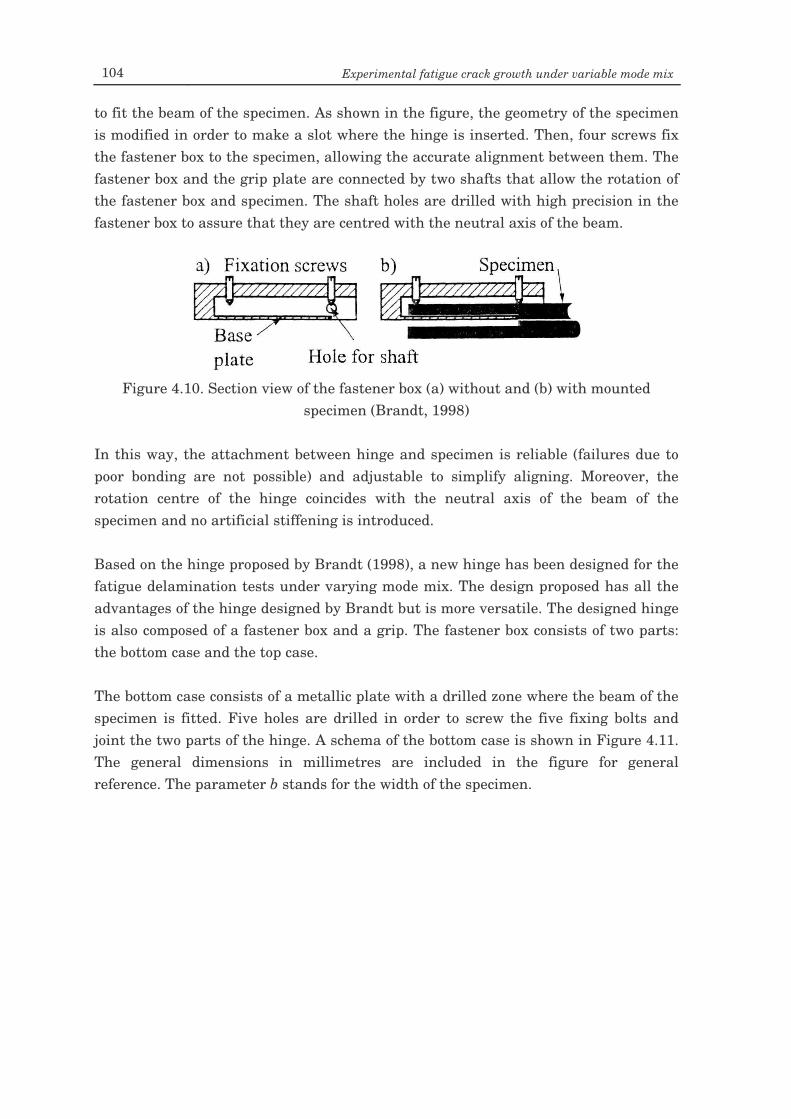
104 Experimental fatigue crack growth under variable mode mix
to fit the beam of the specimen. As shown in the figure, the geometry of the specimen is modified in order to make a slot where the hinge is inserted. Then, four screws fix the fastener box to the specimen, allowing the accurate alignment between them. The fastener box and the grip plate are connected by two shafts that allow the rotation of the fastener box and specimen. The shaft holes are drilled with high precision in the fastener box to assure that they are centred with the neutral axis of the beam.
Figure 4.10. Section view of the fastener box (a) without and (b) with mounted
specimen (Brandt, 1998) In this way, the attachment between hinge and specimen is reliable (failures due to poor bonding are not possible) and adjustable to simplify aligning. Moreover, the rotation centre of the hinge coincides with the neutral axis of the beam of the specimen and no artificial stiffening is introduced. Based on the hinge proposed by Brandt (1998), a new hinge has been designed for the fatigue delamination tests under varying mode mix. The design proposed has all the advantages of the hinge designed by Brandt but is more versatile. The designed hinge is also composed of a fastener box and a grip. The fastener box consists of two parts: the bottom case and the top case. The bottom case consists of a metallic plate with a drilled zone where the beam of the specimen is fitted. Five holes are drilled in order to screw the five fixing bolts and joint the two parts of the hinge. A schema of the bottom case is shown in Figure 4.11. The general dimensions in millimetres are included in the figure for general reference. The parameter b stands for the width of the specimen.
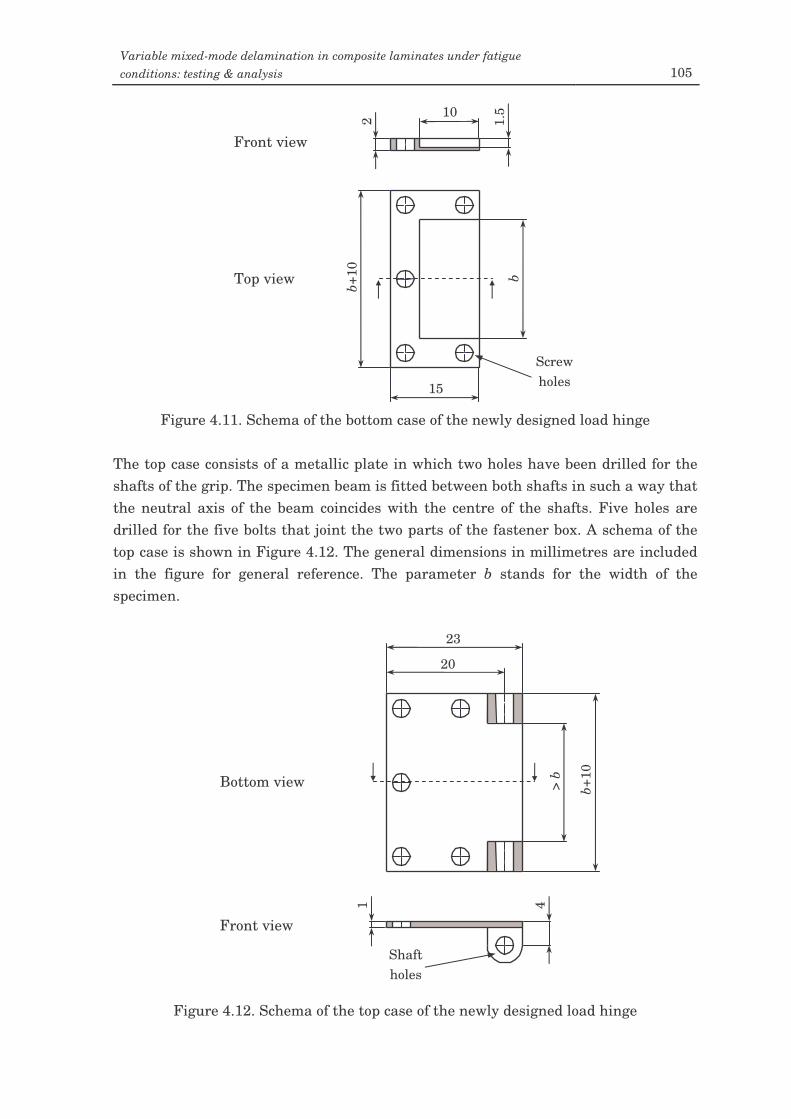
Variable mixed-mode delamination in composite laminates under fatigue conditions: testing & analysis 105
Figure 4.11. Schema of the bottom case of the newly designed load hinge
The top case consists of a metallic plate in which two holes have been drilled for the shafts of the grip. The specimen beam is fitted between both shafts in such a way that the neutral axis of the beam coincides with the centre of the shafts. Five holes are drilled for the five bolts that joint the two parts of the fastener box. A schema of the top case is shown in Figure 4.12. The general dimensions in millimetres are included in the figure for general reference. The parameter b stands for the width of the specimen.
Figure 4.12. Schema of the top case of the newly designed load hinge
> b
b+10
20
23
1 4
Bottom view
Shaft holes
Front view
15
b
b+10
1.5
2
10
Front view
Top view
Screw holes
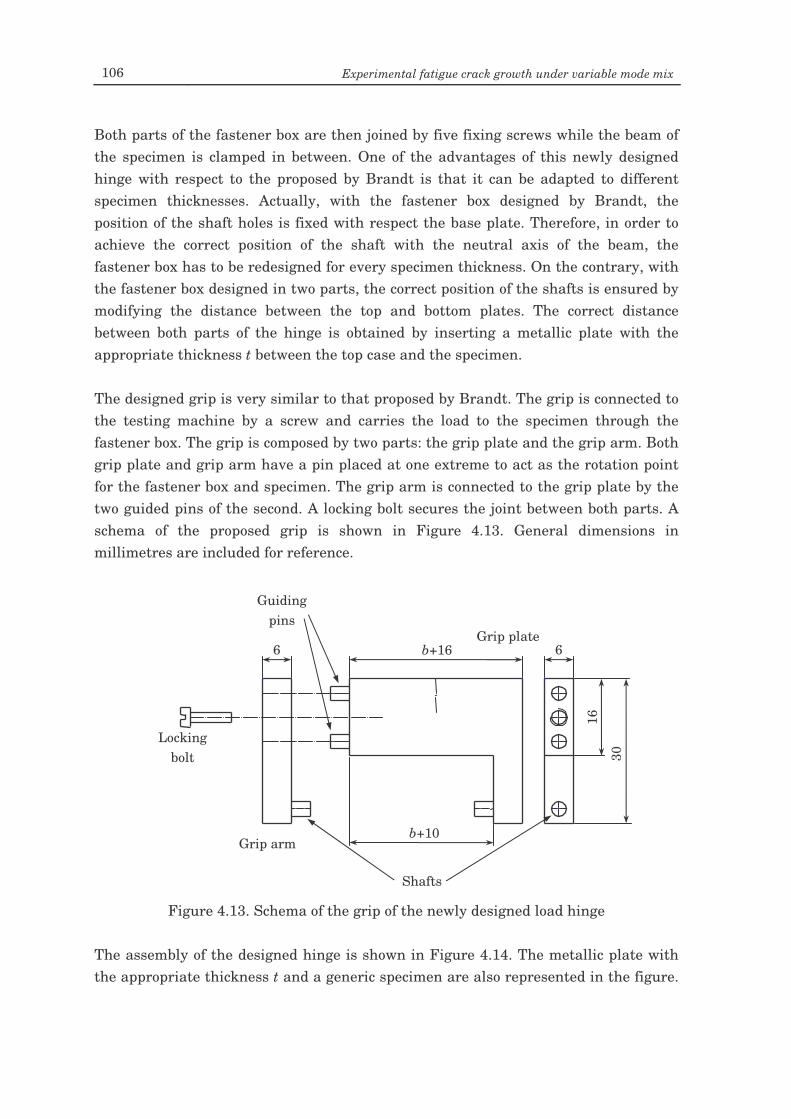
106 Experimental fatigue crack growth under variable mode mix
Both parts of the fastener box are then joined by five fixing screws while the beam of the specimen is clamped in between. One of the advantages of this newly designed hinge with respect to the proposed by Brandt is that it can be adapted to different specimen thicknesses. Actually, with the fastener box designed by Brandt, the position of the shaft holes is fixed with respect the base plate. Therefore, in order to achieve the correct position of the shaft with the neutral axis of the beam, the fastener box has to be redesigned for every specimen thickness. On the contrary, with the fastener box designed in two parts, the correct position of the shafts is ensured by modifying the distance between the top and bottom plates. The correct distance between both parts of the hinge is obtained by inserting a metallic plate with the appropriate thickness t between the top case and the specimen. The designed grip is very similar to that proposed by Brandt. The grip is connected to the testing machine by a screw and carries the load to the specimen through the fastener box. The grip is composed by two parts: the grip plate and the grip arm. Both grip plate and grip arm have a pin placed at one extreme to act as the rotation point for the fastener box and specimen. The grip arm is connected to the grip plate by the two guided pins of the second. A locking bolt secures the joint between both parts. A schema of the proposed grip is shown in Figure 4.13. General dimensions in millimetres are included for reference.
Figure 4.13. Schema of the grip of the newly designed load hinge
The assembly of the designed hinge is shown in Figure 4.14. The metallic plate with the appropriate thickness t and a generic specimen are also represented in the figure.
b+10
30
16
b+16 6 6
Shafts
Guiding pins
Locking bolt
Grip arm
Grip plate
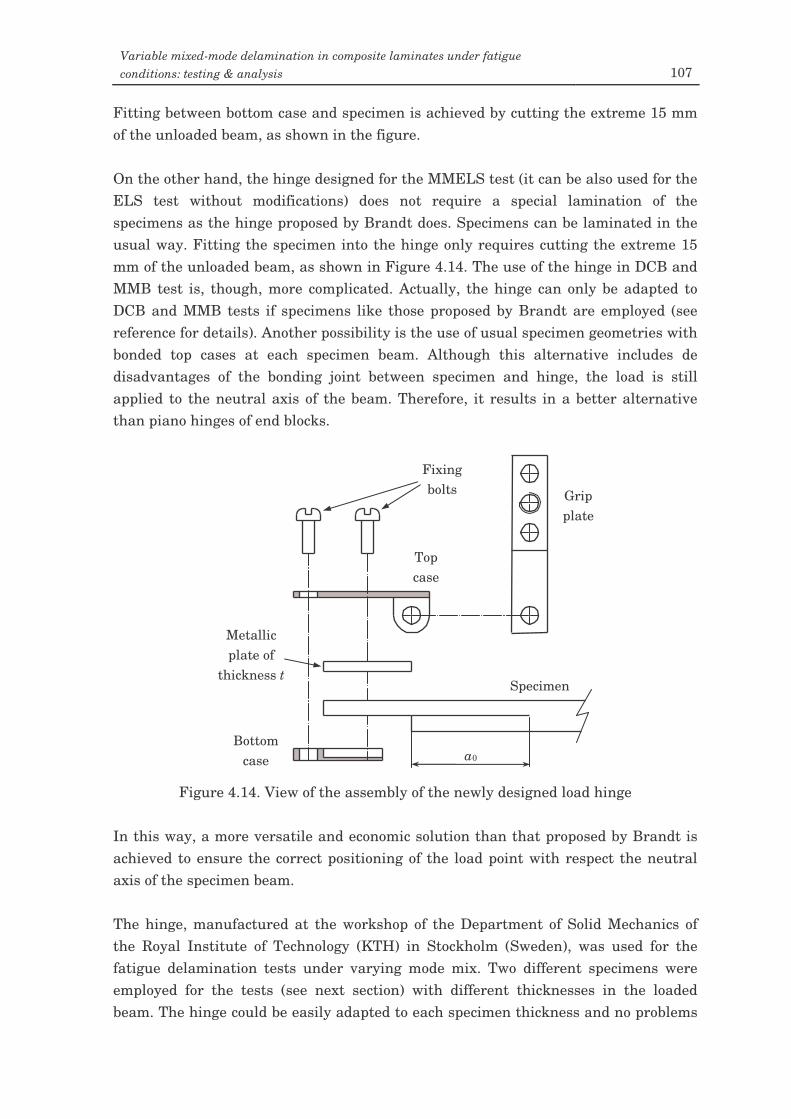
Variable mixed-mode delamination in composite laminates under fatigue conditions: testing & analysis 107
Fitting between bottom case and specimen is achieved by cutting the extreme 15 mm of the unloaded beam, as shown in the figure. On the other hand, the hinge designed for the MMELS test (it can be also used for the ELS test without modifications) does not require a special lamination of the specimens as the hinge proposed by Brandt does. Specimens can be laminated in the usual way. Fitting the specimen into the hinge only requires cutting the extreme 15 mm of the unloaded beam, as shown in Figure 4.14. The use of the hinge in DCB and MMB test is, though, more complicated. Actually, the hinge can only be adapted to DCB and MMB tests if specimens like those proposed by Brandt are employed (see reference for details). Another possibility is the use of usual specimen geometries with bonded top cases at each specimen beam. Although this alternative includes de disadvantages of the bonding joint between specimen and hinge, the load is still applied to the neutral axis of the beam. Therefore, it results in a better alternative than piano hinges of end blocks.
Figure 4.14. View of the assembly of the newly designed load hinge
In this way, a more versatile and economic solution than that proposed by Brandt is achieved to ensure the correct positioning of the load point with respect the neutral axis of the specimen beam. The hinge, manufactured at the workshop of the Department of Solid Mechanics of the Royal Institute of Technology (KTH) in Stockholm (Sweden), was used for the fatigue delamination tests under varying mode mix. Two different specimens were employed for the tests (see next section) with different thicknesses in the loaded beam. The hinge could be easily adapted to each specimen thickness and no problems
a0
Fixing bolts Grip
plate
Specimen
Bottom case
Top case
Metallic plate of
thickness t
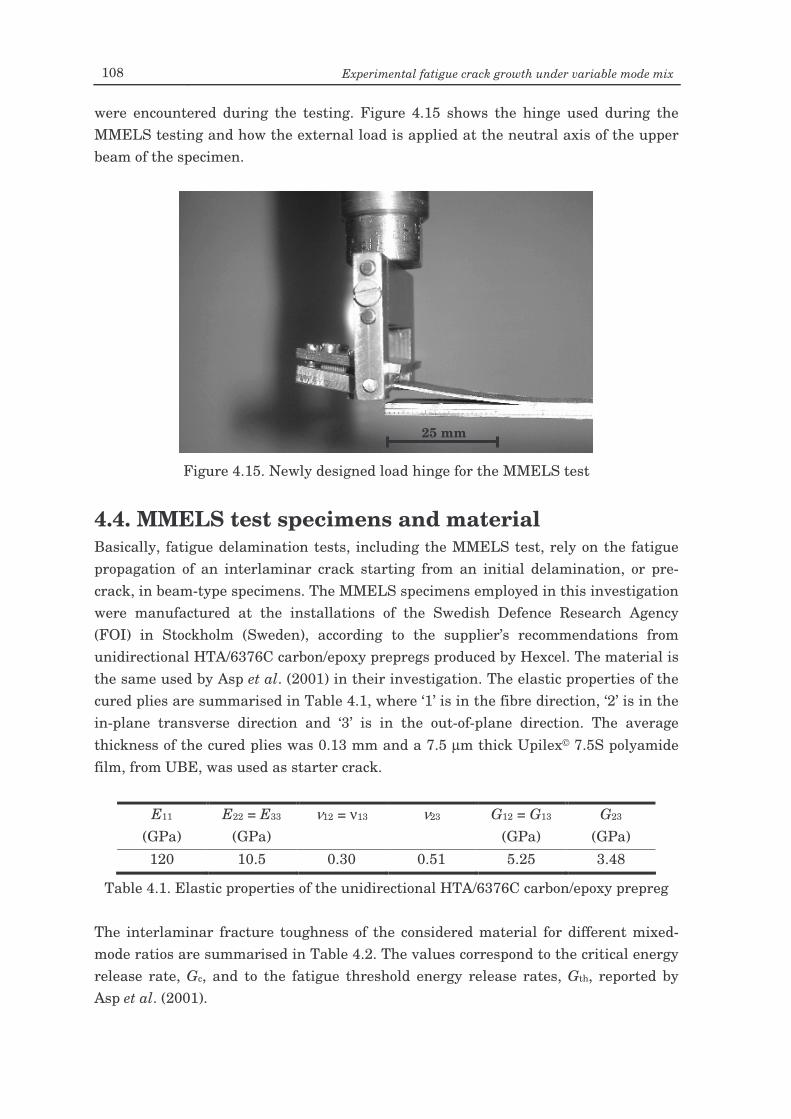
108 Experimental fatigue crack growth under variable mode mix
were encountered during the testing. Figure 4.15 shows the hinge used during the MMELS testing and how the external load is applied at the neutral axis of the upper beam of the specimen.
Figure 4.15. Newly designed load hinge for the MMELS test
4.4. MMELS test specimens and material Basically, fatigue delamination tests, including the MMELS test, rely on the fatigue propagation of an interlaminar crack starting from an initial delamination, or pre-crack, in beam-type specimens. The MMELS specimens employed in this investigation were manufactured at the installations of the Swedish Defence Research Agency (FOI) in Stockholm (Sweden), according to the supplier’s recommendations from unidirectional HTA/6376C carbon/epoxy prepregs produced by Hexcel. The material is the same used by Asp et al. (2001) in their investigation. The elastic properties of the cured plies are summarised in Table 4.1, where ‘1’ is in the fibre direction, ‘2’ is in the in-plane transverse direction and ‘3’ is in the out-of-plane direction. The average thickness of the cured plies was 0.13 mm and a 7.5 µm thick Upilex© 7.5S polyamide film, from UBE, was used as starter crack.
E11 E22 = E33 ν12 = ν13 ν23 G12 = G13 G23 (GPa) (GPa) (GPa) (GPa) 120 10.5 0.30 0.51 5.25 3.48
Table 4.1. Elastic properties of the unidirectional HTA/6376C carbon/epoxy prepreg The interlaminar fracture toughness of the considered material for different mixed-mode ratios are summarised in Table 4.2. The values correspond to the critical energy release rate, Gc, and to the fatigue threshold energy release rates, Gth, reported by Asp et al. (2001).
25 mm
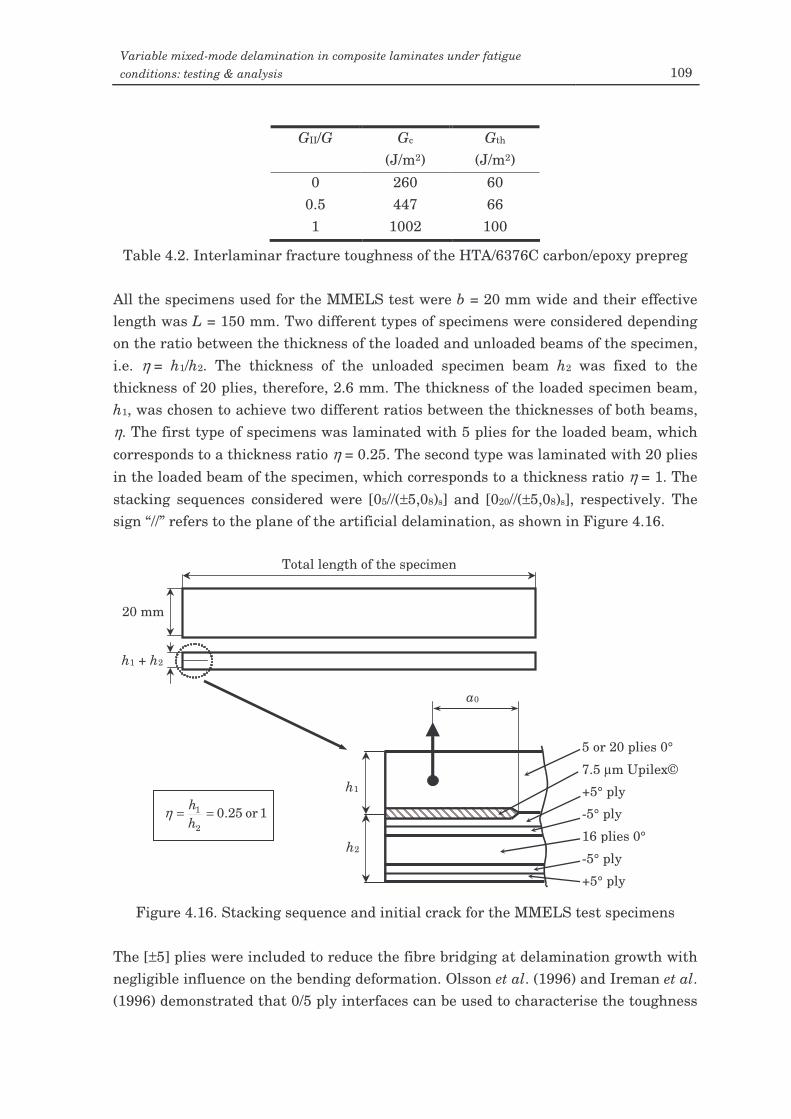
Variable mixed-mode delamination in composite laminates under fatigue conditions: testing & analysis 109
GII/G Gc Gth (J/m2) (J/m2)
0 260 60 0.5 447 66 1 1002 100
Table 4.2. Interlaminar fracture toughness of the HTA/6376C carbon/epoxy prepreg All the specimens used for the MMELS test were b = 20 mm wide and their effective length was L = 150 mm. Two different types of specimens were considered depending on the ratio between the thickness of the loaded and unloaded beams of the specimen, i.e. η = h1/h2. The thickness of the unloaded specimen beam h2 was fixed to the thickness of 20 plies, therefore, 2.6 mm. The thickness of the loaded specimen beam, h1, was chosen to achieve two different ratios between the thicknesses of both beams, η. The first type of specimens was laminated with 5 plies for the loaded beam, which corresponds to a thickness ratio η = 0.25. The second type was laminated with 20 plies in the loaded beam of the specimen, which corresponds to a thickness ratio η = 1. The stacking sequences considered were [05//(±5,08)s] and [020//(±5,08)s], respectively. The sign “//” refers to the plane of the artificial delamination, as shown in Figure 4.16.
Figure 4.16. Stacking sequence and initial crack for the MMELS test specimens
The [±5] plies were included to reduce the fibre bridging at delamination growth with negligible influence on the bending deformation. Olsson et al. (1996) and Ireman et al. (1996) demonstrated that 0/5 ply interfaces can be used to characterise the toughness
Total length of the specimen
20 mm
h1 + h2
a0
h1
h2
1or 25.02
1 ==hhη
7.5 µm Upilex©
5 or 20 plies 0°
+5° ply
-5° ply
16 plies 0°
-5° ply
+5° ply
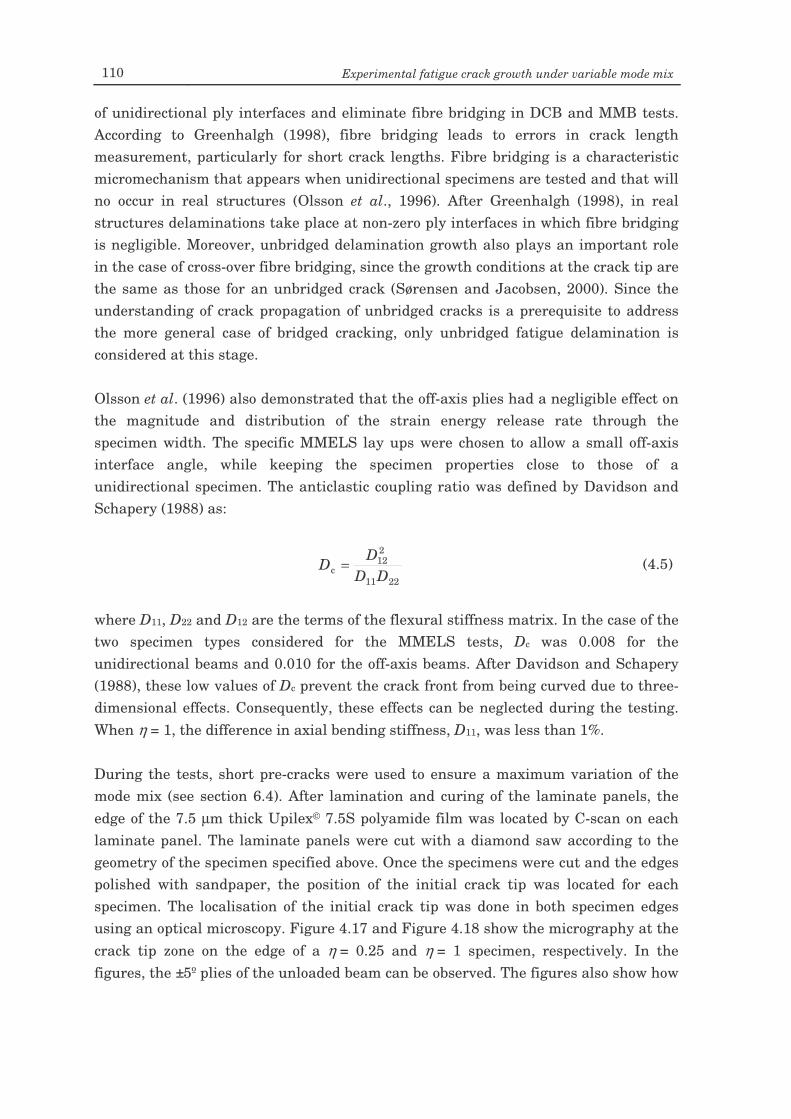
110 Experimental fatigue crack growth under variable mode mix
of unidirectional ply interfaces and eliminate fibre bridging in DCB and MMB tests. According to Greenhalgh (1998), fibre bridging leads to errors in crack length measurement, particularly for short crack lengths. Fibre bridging is a characteristic micromechanism that appears when unidirectional specimens are tested and that will no occur in real structures (Olsson et al., 1996). After Greenhalgh (1998), in real structures delaminations take place at non-zero ply interfaces in which fibre bridging is negligible. Moreover, unbridged delamination growth also plays an important role in the case of cross-over fibre bridging, since the growth conditions at the crack tip are the same as those for an unbridged crack (Sørensen and Jacobsen, 2000). Since the understanding of crack propagation of unbridged cracks is a prerequisite to address the more general case of bridged cracking, only unbridged fatigue delamination is considered at this stage. Olsson et al. (1996) also demonstrated that the off-axis plies had a negligible effect on the magnitude and distribution of the strain energy release rate through the specimen width. The specific MMELS lay ups were chosen to allow a small off-axis interface angle, while keeping the specimen properties close to those of a unidirectional specimen. The anticlastic coupling ratio was defined by Davidson and Schapery (1988) as:
2211
212
c DDD
D = (4.5)
where D11, D22 and D12 are the terms of the flexural stiffness matrix. In the case of the two specimen types considered for the MMELS tests, Dc was 0.008 for the unidirectional beams and 0.010 for the off-axis beams. After Davidson and Schapery (1988), these low values of Dc prevent the crack front from being curved due to three-dimensional effects. Consequently, these effects can be neglected during the testing. When η = 1, the difference in axial bending stiffness, D11, was less than 1%. During the tests, short pre-cracks were used to ensure a maximum variation of the mode mix (see section 6.4). After lamination and curing of the laminate panels, the edge of the 7.5 µm thick Upilex© 7.5S polyamide film was located by C-scan on each laminate panel. The laminate panels were cut with a diamond saw according to the geometry of the specimen specified above. Once the specimens were cut and the edges polished with sandpaper, the position of the initial crack tip was located for each specimen. The localisation of the initial crack tip was done in both specimen edges using an optical microscopy. Figure 4.17 and Figure 4.18 show the micrography at the crack tip zone on the edge of a η = 0.25 and η = 1 specimen, respectively. In the figures, the ±5º plies of the unloaded beam can be observed. The figures also show how
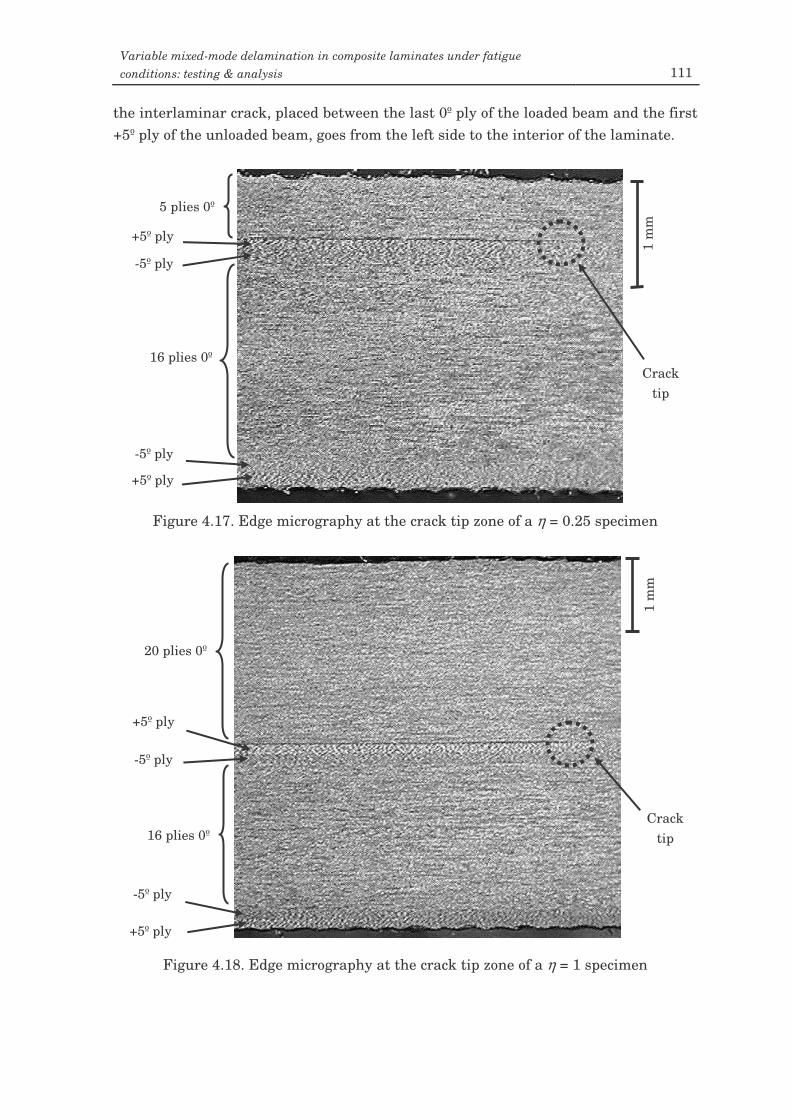
Variable mixed-mode delamination in composite laminates under fatigue conditions: testing & analysis 111
the interlaminar crack, placed between the last 0º ply of the loaded beam and the first +5º ply of the unloaded beam, goes from the left side to the interior of the laminate.
Figure 4.17. Edge micrography at the crack tip zone of a η = 0.25 specimen
Figure 4.18. Edge micrography at the crack tip zone of a η = 1 specimen
1 m
m
Crack tip
+5º ply
-5º ply
16 plies 0º
-5º ply
+5º ply
5 plies 0º
1 m
m
Crack tip
+5º ply
-5º ply
16 plies 0º
-5º ply
+5º ply
20 plies 0º
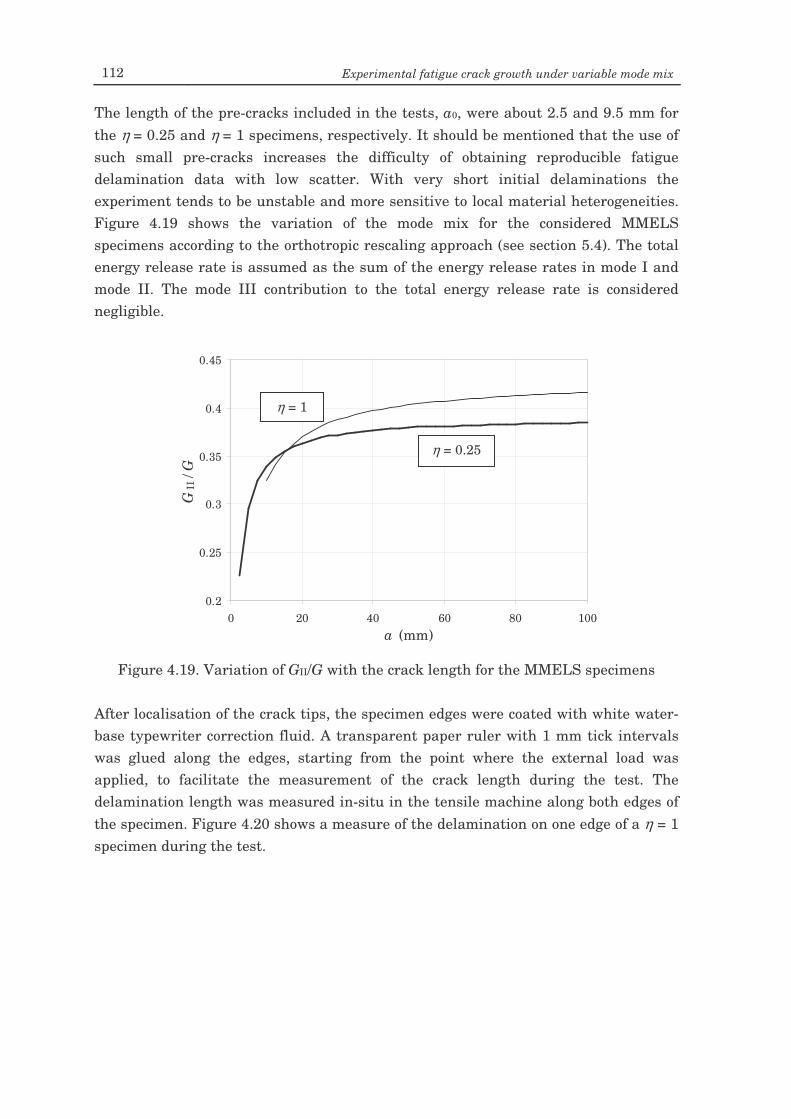
112 Experimental fatigue crack growth under variable mode mix
The length of the pre-cracks included in the tests, a0, were about 2.5 and 9.5 mm for the η = 0.25 and η = 1 specimens, respectively. It should be mentioned that the use of such small pre-cracks increases the difficulty of obtaining reproducible fatigue delamination data with low scatter. With very short initial delaminations the experiment tends to be unstable and more sensitive to local material heterogeneities. Figure 4.19 shows the variation of the mode mix for the considered MMELS specimens according to the orthotropic rescaling approach (see section 5.4). The total energy release rate is assumed as the sum of the energy release rates in mode I and mode II. The mode III contribution to the total energy release rate is considered negligible.
Figure 4.19. Variation of GII/G with the crack length for the MMELS specimens
After localisation of the crack tips, the specimen edges were coated with white water-base typewriter correction fluid. A transparent paper ruler with 1 mm tick intervals was glued along the edges, starting from the point where the external load was applied, to facilitate the measurement of the crack length during the test. The delamination length was measured in-situ in the tensile machine along both edges of the specimen. Figure 4.20 shows a measure of the delamination on one edge of a η = 1 specimen during the test.
0.2
0.25
0.3
0.35
0.4
0.45
0 20 40 60 80 100a (mm)
GII
/ G
η = 0.25
η = 1
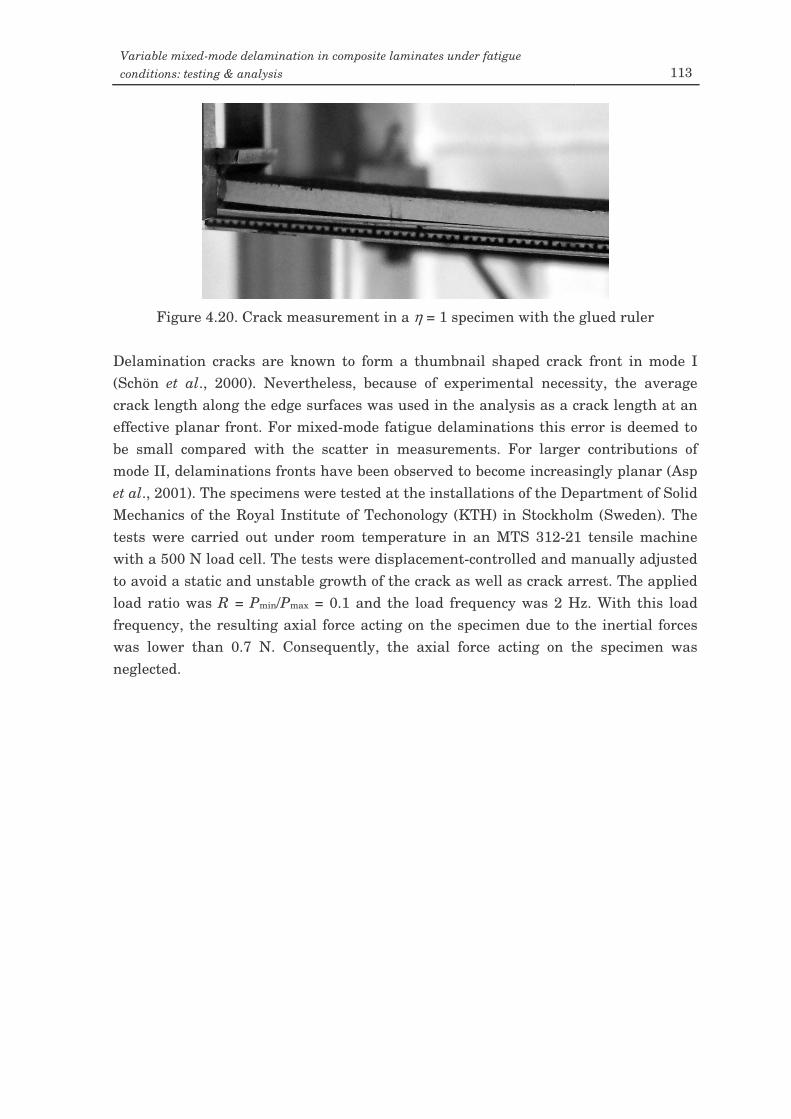
Variable mixed-mode delamination in composite laminates under fatigue conditions: testing & analysis 113
Figure 4.20. Crack measurement in a η = 1 specimen with the glued ruler
Delamination cracks are known to form a thumbnail shaped crack front in mode I (Schön et al., 2000). Nevertheless, because of experimental necessity, the average crack length along the edge surfaces was used in the analysis as a crack length at an effective planar front. For mixed-mode fatigue delaminations this error is deemed to be small compared with the scatter in measurements. For larger contributions of mode II, delaminations fronts have been observed to become increasingly planar (Asp et al., 2001). The specimens were tested at the installations of the Department of Solid Mechanics of the Royal Institute of Techonology (KTH) in Stockholm (Sweden). The tests were carried out under room temperature in an MTS 312-21 tensile machine with a 500 N load cell. The tests were displacement-controlled and manually adjusted to avoid a static and unstable growth of the crack as well as crack arrest. The applied load ratio was R = Pmin/Pmax = 0.1 and the load frequency was 2 Hz. With this load frequency, the resulting axial force acting on the specimen due to the inertial forces was lower than 0.7 N. Consequently, the axial force acting on the specimen was neglected.

Chapter 5 Analysis of the MMELS test
5.1. Introduction In the present work, the study of experimental mixed-mode fatigue propagation of interlaminar cracks in a unidirectional composite laminate is carried out using the MMELS test. Therefore, it is necessary to have a reliable characterisation of this test before starting the experiments. However, this test method is not commonly used for the study of interlaminar crack onset or propagation, either under static or fatigue conditions. Accordingly, the characterisation of the MMELS test has received less attention if compared to other test methods (especially DCB, ENF and MMB). Actually, as it will be proved in this chapter, there exist certain contradictions in the characterisation of the test that make necessary a rigorous analysis of the MMELS test. In this chapter an analysis of the MMELS test is performed. The analysis deals with the growth and stability of the crack under static conditions. The fatigue growth of the delamination is taken into account by the necessary conditions to obtain a sub-critical growth of the crack under cyclic loading (energy release rate, applied load and displacement of the loaded beam of the specimen). No further analysis of the growth under fatigue conditions is considered. The analysis includes two approaches present in the literature: beam theory and orthotropic rescaling. Expressions to characterise the MMELS test in terms of energy release rate according to both approaches are deduced and analysed. The assumptions and simplifications taken into account to obtain these expressions are also presented and discussed. The variation of the energy release rate with the crack length for different configurations of unidirectional composite specimens is taken into account for both approaches. The variation of the mode I and mode II energy release rate components and the compliance of the specimen with the crack length are also presented. Especial attention is given to the variation of the mode mix with the crack length since this is the main characteristic of the test and the reason why this test has been chosen for this study. As it will be demonstrated, the comparison between the predictions of both approaches show that there exist clear differences between them. Finally, the equivalence of the MMELS test to the superposition of the DCB and ELS test is analysed.
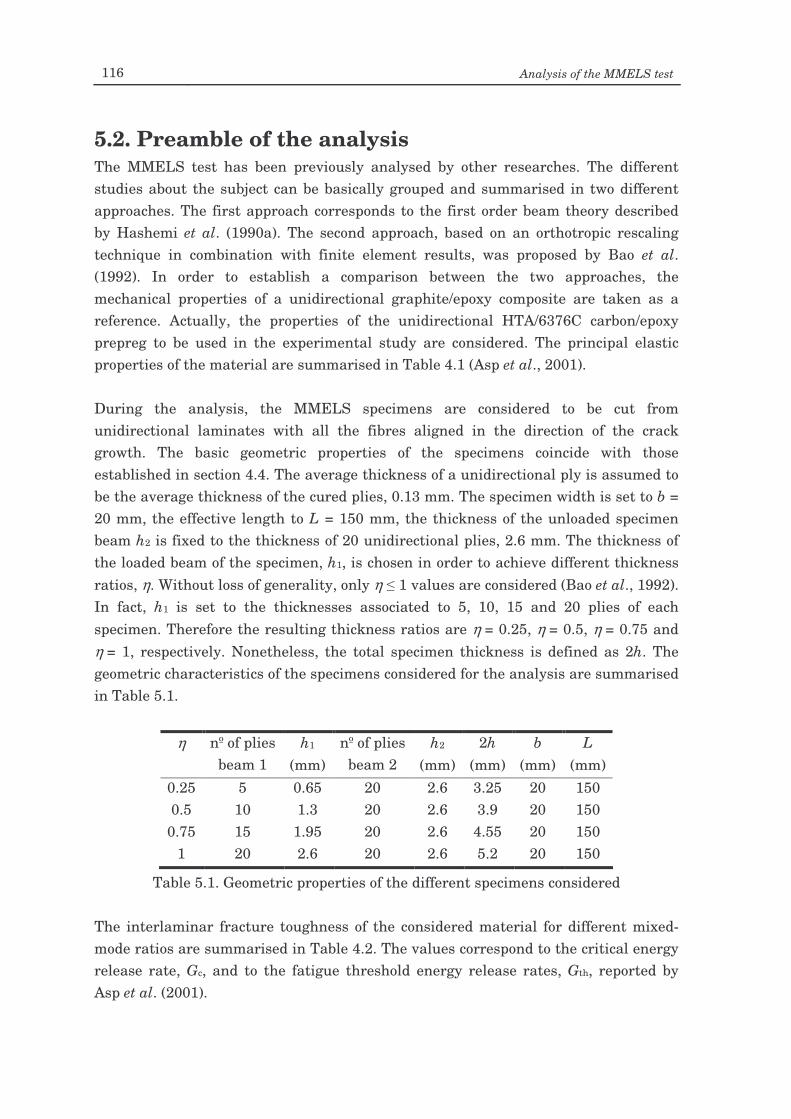
116 Analysis of the MMELS test
5.2. Preamble of the analysis The MMELS test has been previously analysed by other researches. The different studies about the subject can be basically grouped and summarised in two different approaches. The first approach corresponds to the first order beam theory described by Hashemi et al. (1990a). The second approach, based on an orthotropic rescaling technique in combination with finite element results, was proposed by Bao et al. (1992). In order to establish a comparison between the two approaches, the mechanical properties of a unidirectional graphite/epoxy composite are taken as a reference. Actually, the properties of the unidirectional HTA/6376C carbon/epoxy prepreg to be used in the experimental study are considered. The principal elastic properties of the material are summarised in Table 4.1 (Asp et al., 2001). During the analysis, the MMELS specimens are considered to be cut from unidirectional laminates with all the fibres aligned in the direction of the crack growth. The basic geometric properties of the specimens coincide with those established in section 4.4. The average thickness of a unidirectional ply is assumed to be the average thickness of the cured plies, 0.13 mm. The specimen width is set to b = 20 mm, the effective length to L = 150 mm, the thickness of the unloaded specimen beam h2 is fixed to the thickness of 20 unidirectional plies, 2.6 mm. The thickness of the loaded beam of the specimen, h1, is chosen in order to achieve different thickness ratios, η. Without loss of generality, only η 1 values are considered (Bao et al., 1992). In fact, h1 is set to the thicknesses associated to 5, 10, 15 and 20 plies of each specimen. Therefore the resulting thickness ratios are η = 0.25, η = 0.5, η = 0.75 and η = 1, respectively. Nonetheless, the total specimen thickness is defined as 2h. The geometric characteristics of the specimens considered for the analysis are summarised in Table 5.1.
η h1 h2 2h b L
nº of plies beam 1 (mm)
nº of plies beam 2 (mm) (mm) (mm) (mm)
0.25 5 0.65 20 2.6 3.25 20 150 0.5 10 1.3 20 2.6 3.9 20 150
0.75 15 1.95 20 2.6 4.55 20 150 1 20 2.6 20 2.6 5.2 20 150
Table 5.1. Geometric properties of the different specimens considered The interlaminar fracture toughness of the considered material for different mixed-mode ratios are summarised in Table 4.2. The values correspond to the critical energy release rate, Gc, and to the fatigue threshold energy release rates, Gth, reported by Asp et al. (2001).
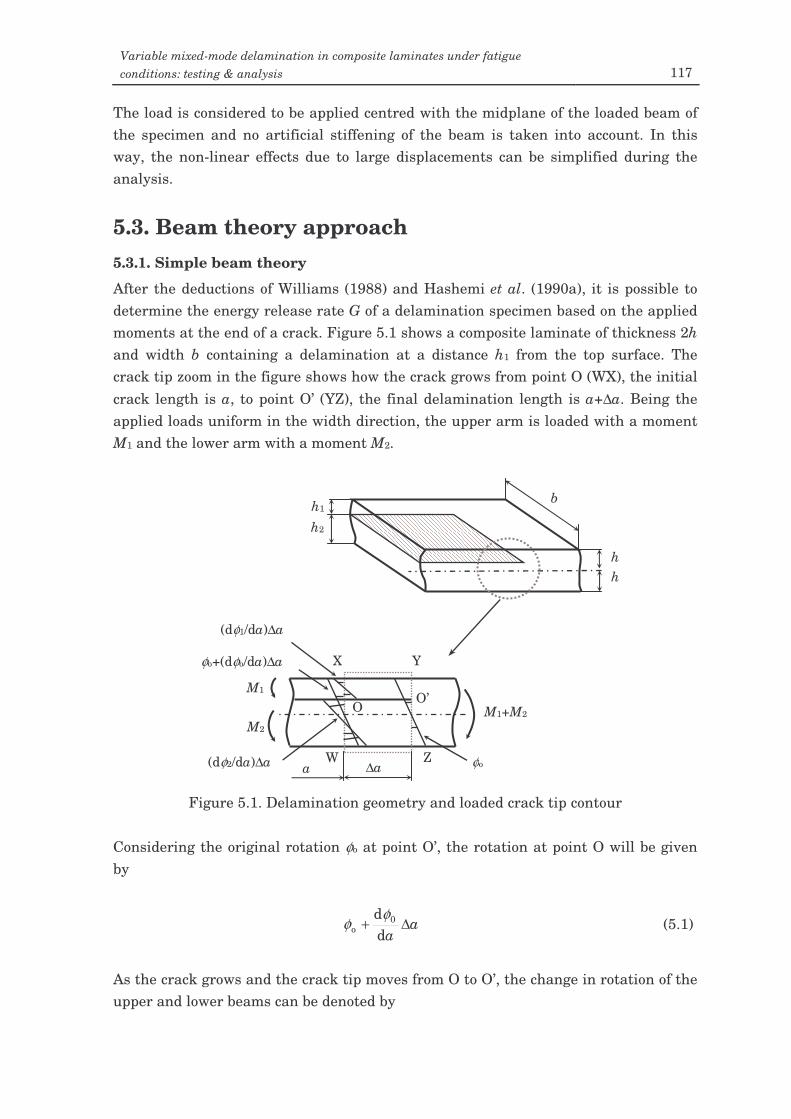
Variable mixed-mode delamination in composite laminates under fatigue conditions: testing & analysis 117
The load is considered to be applied centred with the midplane of the loaded beam of the specimen and no artificial stiffening of the beam is taken into account. In this way, the non-linear effects due to large displacements can be simplified during the analysis.
5.3. Beam theory approach 5.3.1. Simple beam theory
After the deductions of Williams (1988) and Hashemi et al. (1990a), it is possible to determine the energy release rate G of a delamination specimen based on the applied moments at the end of a crack. Figure 5.1 shows a composite laminate of thickness 2h and width b containing a delamination at a distance h1 from the top surface. The crack tip zoom in the figure shows how the crack grows from point O (WX), the initial crack length is a, to point O’ (YZ), the final delamination length is a+∆a. Being the applied loads uniform in the width direction, the upper arm is loaded with a moment M1 and the lower arm with a moment M2.
Figure 5.1. Delamination geometry and loaded crack tip contour
Considering the original rotation φo at point O’, the rotation at point O will be given by
aa
∆+dd 0
oφφ (5.1)
As the crack grows and the crack tip moves from O to O’, the change in rotation of the upper and lower beams can be denoted by
h
b h1
h2
M1+M2
a ∆a
X
W Z
O’ M1
M2 O
(dφ2/da)∆a φo
φo+(dφo/da)∆a
(dφ1/da)∆a
h
Y
118 Analysis of the MMELS test
aaa
∆
−dd
dd o1 φφ
(5.2)
and
aaa
∆
−dd
dd o2 φφ
(5.3)
respectively. Thus, the external work can be expressed as
aaa
Maaa
MU ∆
−+∆
−=∆dd
dd
dd
dd o2
2o1
1eφφφφ
(5.4)
Taking into account that for the bending moments the change in slope is given by
EIM
a=
ddφ (5.5)
equation (5.4) can be rewritten as follows:
aEI
MMEIM
MaEI
MMEIM
MU ∆
+−+∆
+−=∆
0
21
2
22
0
21
1
11e (5.6)
where E is the Young’s modulus of the material in the direction of the crack growth. As in the present case, the experimentation of delamination in composites is carried out in unidirectional laminates with the reinforcement oriented on the direction of the growth of the crack. Thus, for the following the considered Young’s modulus will be the one on the fibres direction, E11. Ii stand for the moments of inertia of the three different sections of the specimen (defined by 2h, h1 and h2). The expressions for the different Ii are given by:
( )3
2122 33
0bhhbI == (5.7)
( )( ) 0
33
331
31
122
1212I
hhbhbh
I ξ=== (5.8)
( )( )
( ) 03
3
332
32
2 122
1212I
hhbhbh
I ξ−=== (5.9)
where the geometric ratio ξ is expressed as
Variable mixed-mode delamination in composite laminates under fatigue conditions: testing & analysis 119
hh2
1=ξ (5.10)
Substituting equations (5.7), (5.8) and (5.9) in equation (5.6) and changing increment, ∆, for derivative, d, the final expression after simplification for the external work is given by
( )( )
+−
−+= 2
213
22
3
21
311
e
123
dd
MMMM
hbEaU
ξξ (5.11)
The general expression for the strain energy in a beam is
EIM
aU
2dd 2
s = (5.12)
therefore, the change within the contour WXYZ in Figure 5.1 is given by
( )a
IEMM
aIE
Ma
IEM
U ∆+
−∆+∆=∆011
221
211
22
111
21
s 222 (5.13)
Substituting equations (5.7), (5.8) and (5.9) in equation (5.13), changing increment for derivative and simplifying, the final expression for the strain energy is given by
( )( )
+−
−+= 2
213
22
3
21
311
s
143
dd
MMMM
hbEaU
ξξ (5.14)
Taking into account equations (5.11), (5.14) and (2.1), after some simplifications the general expression of the energy release rate for the beam theory approach can be found as
( )( )
+−
−+= 2
213
22
3
21
311
2 143 MM
MMhEb
Gξξ
(5.15)
Mode partitioning As the contribution of mode III is not considered, the total energy release rate in equation (5.15) is the sum of mode I and mode II. To obtain the contribution of each individual mode equation (5.15) must be partitioned (Williams, 1988). Pure mode II propagation occurs when the curvature of both arms is the same and therefore
120 Analysis of the MMELS test
aa dd
dd 21 φφ
= (5.16)
If the moments MII and ψMII are respectively applied to the upper and lower specimen beams, the combination of equations (5.5) and (5.16) gives
211
II
111
II
IEM
IEM ψ
= (5.17)
where the parameter ψ can be found as
31
−=ξ
ξψ (5.18)
Pure mode I implies the same moment in both arms but in opposite directions. Then the moment applied to the upper beam is –MI and the moment applied to the lower beam is MI. For a combination of both modes the resulting moments on the arms are given by
III1 MMM −= (5.19)
III2 MMM +=ψ (5.20)
Combining equations (5.19) and (5.20) the mode I and mode II moments are respectively given by:
ψψ
+−
=1
12I
MMM (5.21)
ψ++
=1
12II
MMM (5.22)
Therefore, the resulting mode I and mode II components of the energy release rate in a beam type specimen can be respectively expressed as
( )( ) ( )ψξ
ψ+−
−=
114
333
112
212
IhEb
MMG (5.23)
( ) ( )( ) 23
112
221
II 1419
ξψξ
+−+
=hEbMM
G (5.24)
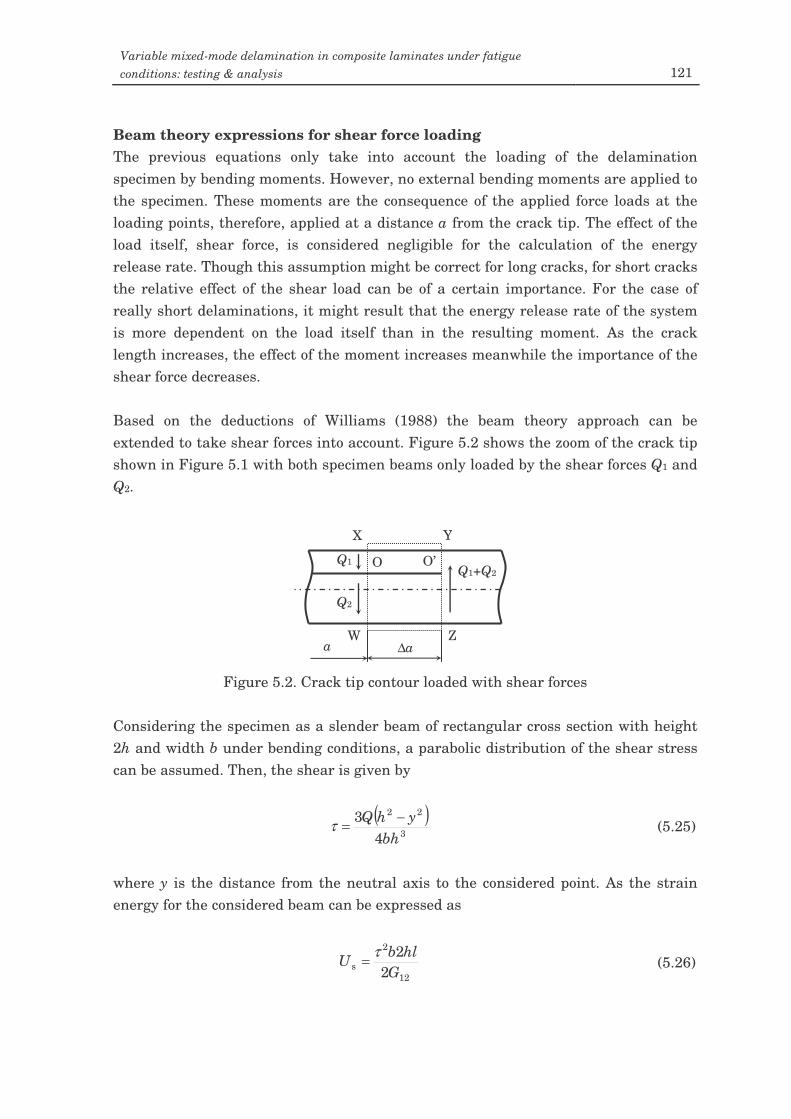
Variable mixed-mode delamination in composite laminates under fatigue conditions: testing & analysis 121
Beam theory expressions for shear force loading The previous equations only take into account the loading of the delamination specimen by bending moments. However, no external bending moments are applied to the specimen. These moments are the consequence of the applied force loads at the loading points, therefore, applied at a distance a from the crack tip. The effect of the load itself, shear force, is considered negligible for the calculation of the energy release rate. Though this assumption might be correct for long cracks, for short cracks the relative effect of the shear load can be of a certain importance. For the case of really short delaminations, it might result that the energy release rate of the system is more dependent on the load itself than in the resulting moment. As the crack length increases, the effect of the moment increases meanwhile the importance of the shear force decreases. Based on the deductions of Williams (1988) the beam theory approach can be extended to take shear forces into account. Figure 5.2 shows the zoom of the crack tip shown in Figure 5.1 with both specimen beams only loaded by the shear forces Q1 and Q2.
Figure 5.2. Crack tip contour loaded with shear forces
Considering the specimen as a slender beam of rectangular cross section with height 2h and width b under bending conditions, a parabolic distribution of the shear stress can be assumed. Then, the shear is given by
( )3
22
43
bhyhQ −=τ (5.25)
where y is the distance from the neutral axis to the considered point. As the strain energy for the considered beam can be expressed as
12
2
s 22
GhlbU τ= (5.26)
Q1+Q2
a ∆a
Y X
W Z
O’ Q1
Q2
O
122 Analysis of the MMELS test
where l is the length of the beam, the gradient of the strain energy is given by
==hs
hbGQy
Gb
aU
0 12
2
12
2
103d2
dd τ (5.27)
Taking into account the previous equation and equation (2.1), the total energy release rate under shear force loading is given by
( )
+−
−+= 2
21
22
21
122 1103 QQ
QQhGb
Gξξ
(5.28)
According to Williams (1988) the expressions for mode I and mode II energy release rates can be found by mode partitioning. For the separation mode, mode I, the shear forces applied to the specimen beams are the same but in opposite directions. The shear force in the upper arm is –QI and the shear force in the lower arm is QI. A mode II growth of the delamination under pure shear loading is not possible and the mode II component of the energy release rate is zero (Williams, 1988). However, following the same process that for the bending moments, if a shear force QII is applied to the upper beam and a shear force αQII to the lower beam, the continuity of the shear deformations on the crack tip results in
2
II
1
II
22 hbQ
hbQ α
= (5.29)
and the parameter α can be found as
−=ξ
ξα 1 (5.30)
For a combination of both modes the resulting shear forces on the arms are given by
III1 QQQ −= (5.31)
III21 QQQ +−=
ξξ (5.32)
Combining equations (5.31) and (5.32) the mode I and mode II shear forces are given by
( ) 12I 1 QQQ ξξ −−= (5.33)
( )21II QQQ += ξ (5.34)
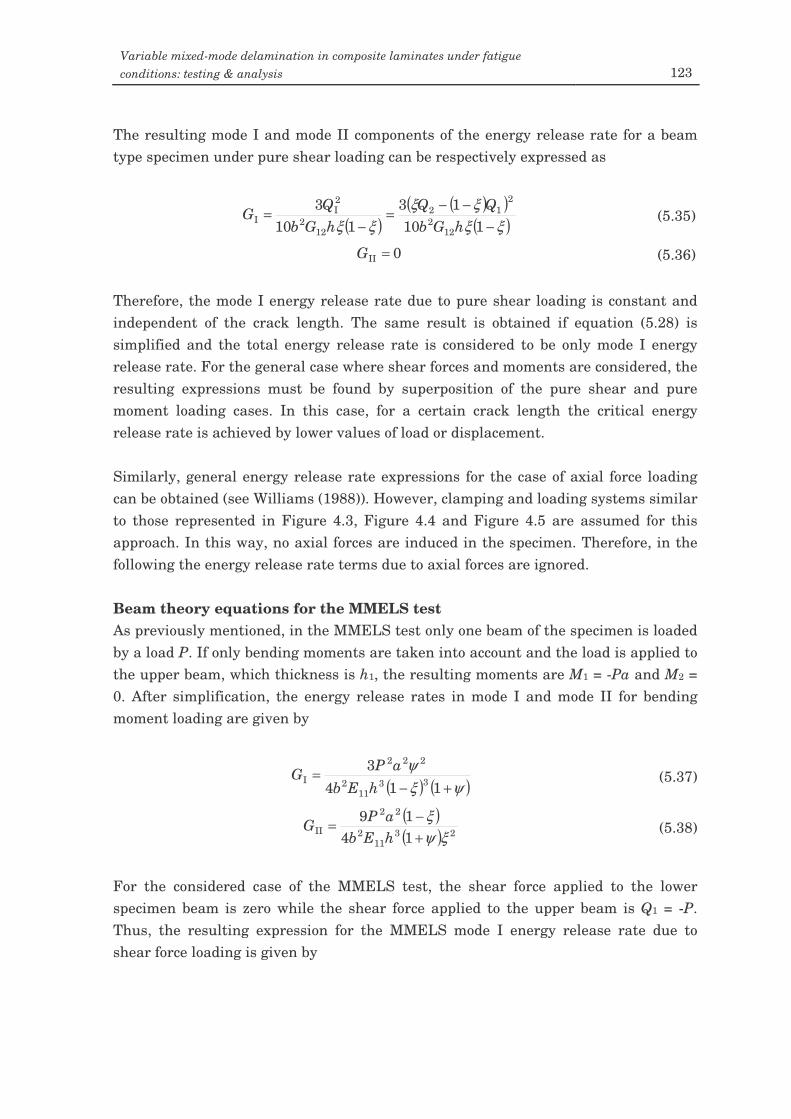
Variable mixed-mode delamination in composite laminates under fatigue conditions: testing & analysis 123
The resulting mode I and mode II components of the energy release rate for a beam type specimen under pure shear loading can be respectively expressed as
( )( )( )
( )ξξξξ
ξξ −−−
=−
=110
13110
3
122
212
122
2I
I hGbQQ
hGbQ
G (5.35)
0II =G (5.36)
Therefore, the mode I energy release rate due to pure shear loading is constant and independent of the crack length. The same result is obtained if equation (5.28) is simplified and the total energy release rate is considered to be only mode I energy release rate. For the general case where shear forces and moments are considered, the resulting expressions must be found by superposition of the pure shear and pure moment loading cases. In this case, for a certain crack length the critical energy release rate is achieved by lower values of load or displacement. Similarly, general energy release rate expressions for the case of axial force loading can be obtained (see Williams (1988)). However, clamping and loading systems similar to those represented in Figure 4.3, Figure 4.4 and Figure 4.5 are assumed for this approach. In this way, no axial forces are induced in the specimen. Therefore, in the following the energy release rate terms due to axial forces are ignored. Beam theory equations for the MMELS test As previously mentioned, in the MMELS test only one beam of the specimen is loaded by a load P. If only bending moments are taken into account and the load is applied to the upper beam, which thickness is h1, the resulting moments are M1 = -Pa and M2 = 0. After simplification, the energy release rates in mode I and mode II for bending moment loading are given by
( ) ( )ψξψ
+−=
1143
3311
2
222
IhEb
aPG (5.37)
( )( ) 23
112
22
II 1419
ξψξ
+−=
hEbaPG (5.38)
For the considered case of the MMELS test, the shear force applied to the lower specimen beam is zero while the shear force applied to the upper beam is Q1 = -P. Thus, the resulting expression for the MMELS mode I energy release rate due to shear force loading is given by
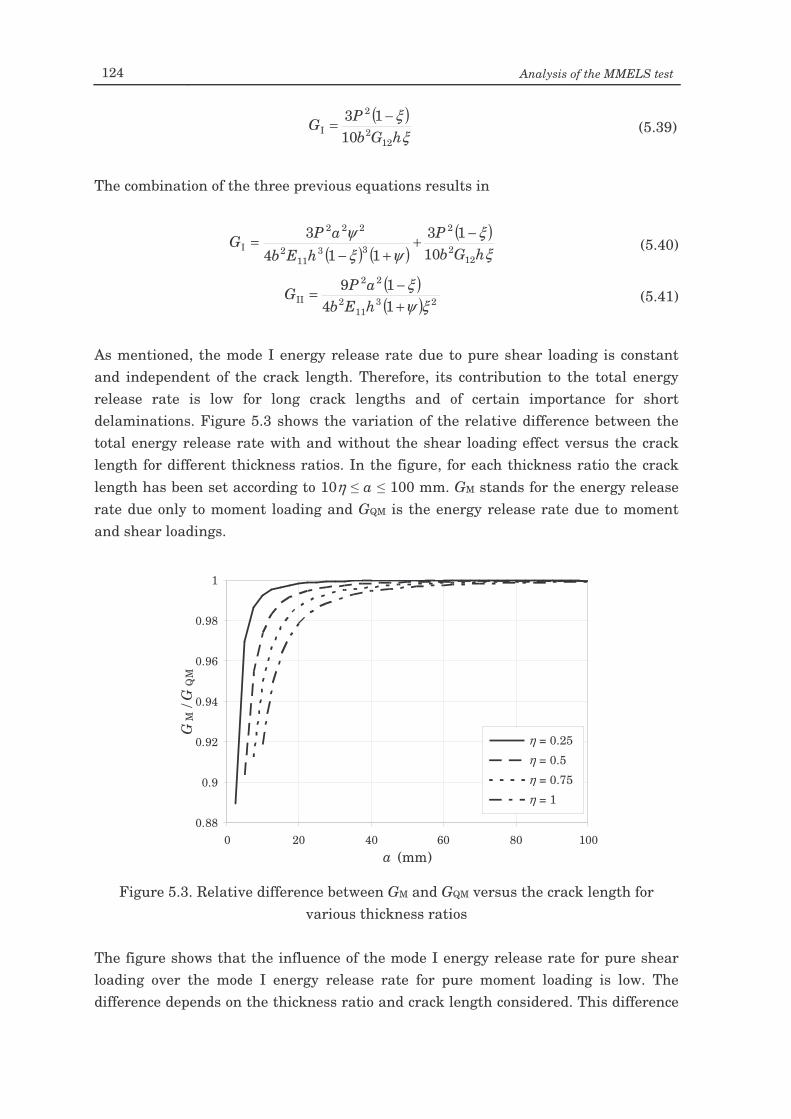
124 Analysis of the MMELS test
( )ξ
ξhGb
PG12
2
2
I 1013 −= (5.39)
The combination of the three previous equations results in
( ) ( )( )
ξξ
ψξψ
hGbP
hEbaPG
122
2
3311
2
222
I 1013
1143 −+
+−= (5.40)
( )( ) 23
112
22
II 1419
ξψξ
+−=
hEbaPG (5.41)
As mentioned, the mode I energy release rate due to pure shear loading is constant and independent of the crack length. Therefore, its contribution to the total energy release rate is low for long crack lengths and of certain importance for short delaminations. Figure 5.3 shows the variation of the relative difference between the total energy release rate with and without the shear loading effect versus the crack length for different thickness ratios. In the figure, for each thickness ratio the crack length has been set according to 10η a 100 mm. GM stands for the energy release rate due only to moment loading and GQM is the energy release rate due to moment and shear loadings.
Figure 5.3. Relative difference between GM and GQM versus the crack length for
various thickness ratios The figure shows that the influence of the mode I energy release rate for pure shear loading over the mode I energy release rate for pure moment loading is low. The difference depends on the thickness ratio and crack length considered. This difference
0.88
0.9
0.92
0.94
0.96
0.98
1
0 20 40 60 80 100a (mm)
GM
/ G
QM
η = 0.25η = 0.5η = 0.75η = 1
η = 0.25 η = 0.5 η = 0.75 η = 1
Variable mixed-mode delamination in composite laminates under fatigue conditions: testing & analysis 125
is more important for short crack lengths, especially for the η = 0.25 specimen. In this case, the predicted value of GM is about 89% of GQM when a = 2.5 mm. However, the value of GM approaches asymptotically the value of GQM when a increases. In fact, for crack lengths longer than 20 mm, the relative difference is less than 2% for all the thickness ratios considered. Consequently, and in accordance to the usual procedures and standards for composite delaminations (Hashemi et al., 1990a; Hashemi et al., 1990b; Davies, 1992; Kinloch et al., 1993; Robinson and Hodgkinson, 2000; ASTM D 5528-01, 2003; ASTM 6671-01, 2003; Reeder and Crews, 2003), the shear loading contribution will be ignored. In the following, the beam theory expressions for the MMELS test will be assumed as equations (5.37) and (5.38) for the mode I and mode II energy release rate, respectively.
5.3.2. Modified beam theory
The simple beam theory equations are valid if the compliance at the crack tip is assumed to be zero. This assumption, however, does not agree with the experimental results because a rotation and deflection of the arms at the crack tip are generally present. Then, the rotation of the arms at the crack tip is modelled considering a larger delamination length by means of a correction factor (Hashemi et al., 1990a; Hashemi et al., 1990b; Davies, 1992; Wang and Williams, 1992; Kinloch et al., 1993; Robinson and Hodgkinson, 2000). A similar approach is used for the other delamination tests and included in the ASTM standards for the DCB and MMB tests (ASTM D 5528-01, 2003; ASTM 6671-01, 2003). Then, the corrected expressions become
( )( ) ( )ψξ
ψχ+−
+=
1143
3311
2
221I
2
IhEb
haPG (5.42)
( ) ( )( ) 23
112
21II
2
II 1419ξψ
ξχ+
−+=
hEbhaP
G (5.43)
where the correction factors χI and χII where firstly assumed to be equal (Hashemi et al., 1990a; Hashemi et al., 1990b). However, Wang and Williams (1992) used a finite element analysis of the ENF and ELS tests to show that the values of χI and χII are different. Therefore, the correction crack length factors can be calculated as (Wang and Williams, 1992; Kinloch et al., 1993; Robinson and Hodgkinson, 2000; ASTM 6671-01, 2003):
2
13
11I 1
2311
Γ+Γ−=
GEχ (5.44)
126 Analysis of the MMELS test
2
13
11II 1
2363
Γ+Γ−=
GEχ (5.45)
where the transverse modulus correction parameter Γ is given by
13
221118.1G
EE=Γ (5.46)
being E22 the transverse modulus and G13 the out-of-plane transverse shear modulus. The latter may be assumed equal to the in-plane transverse shear modulus G12 (Hashemi et al., 1990a; Hashemi et al., 1990b; Kinloch et al., 1993; ASTM 6671-01, 2003). Considering that the mode III contribution is negligible, the total energy release rate of the system can be expressed as G = GI + GII. Thus, G is found as the sum of equations (5.42) and (5.43). Then, the compliance of the MMELS test according to the beam theory approach can be found after integration of equation (2.9) as
( ) ( ) ( ) ( ) ( ) ( )( ) ( ) 233
11
2331I
431II
2231I
11211213
ξψξξψξχξχξψχ
+−+−++−+++
=hbE
hLhahaC (5.47)
The term associated to L corresponds to the compliance of the specimen without delamination (a = 0). In this case, the compliance without delamination corresponds to the compliance of a cantilever with an effective length L, a rectangular cross section defined by the width b and thickness 2h and loaded by an external load P. The correction factor 2χIh1 is introduced to take into account the rotation of the specimen at the clamped end (Williams, 1988; Hashemi et al., 1990a; Hashemi et al., 1990b; Kinloch et al., 1993). Combining equations (2.6), (5.42), (5.43) and (5.47) the beam theory expression for the total energy release rate in function of the crack length and the displacement δ is given by
( ) ( ) ( ) ( ) ( )( )( ) ( ) ( ) ( ) ( ) ( )( )2233
1I43
1II223
1I
2421II
2221I
23311
11213
19311
ξψξχξχξψχ
δξχξψχξψξ
+−++−+++
−++++−=
hLhaha
hahahEG (5.48)
Correction factors for non-linear effects The most common loading systems in composite delamination tests are end blocks and piano hinges. Figure 5.4 shows both loading systems applied to a MMELS specimen. However, the load point of both systems is non-centred with the specimen beam.
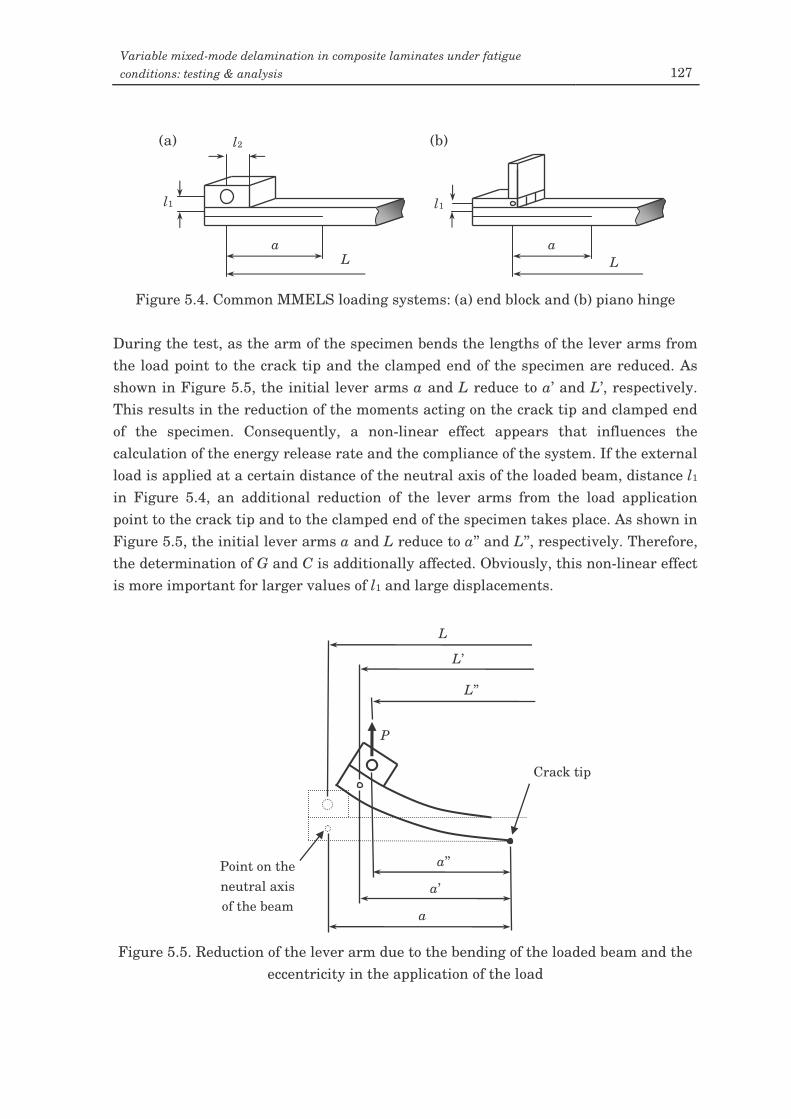
Variable mixed-mode delamination in composite laminates under fatigue conditions: testing & analysis 127
Figure 5.4. Common MMELS loading systems: (a) end block and (b) piano hinge
During the test, as the arm of the specimen bends the lengths of the lever arms from the load point to the crack tip and the clamped end of the specimen are reduced. As shown in Figure 5.5, the initial lever arms a and L reduce to a’ and L’, respectively. This results in the reduction of the moments acting on the crack tip and clamped end of the specimen. Consequently, a non-linear effect appears that influences the calculation of the energy release rate and the compliance of the system. If the external load is applied at a certain distance of the neutral axis of the loaded beam, distance l1 in Figure 5.4, an additional reduction of the lever arms from the load application point to the crack tip and to the clamped end of the specimen takes place. As shown in Figure 5.5, the initial lever arms a and L reduce to a’’ and L’’, respectively. Therefore, the determination of G and C is additionally affected. Obviously, this non-linear effect is more important for larger values of l1 and large displacements.
Figure 5.5. Reduction of the lever arm due to the bending of the loaded beam and the
eccentricity in the application of the load
L
L’’
L’
a’’
a’
a
Crack tip
Point on the neutral axis of the beam
P
a L
l1 l1
l2
a L
(a) (b)
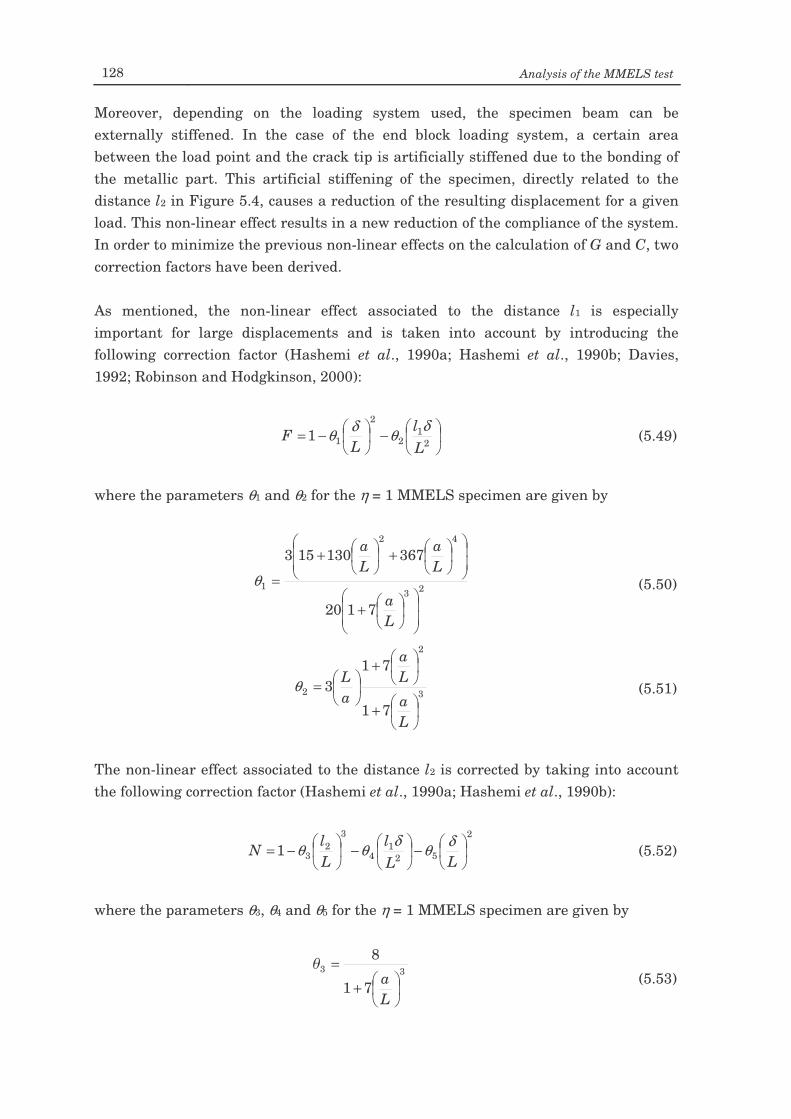
128 Analysis of the MMELS test
Moreover, depending on the loading system used, the specimen beam can be externally stiffened. In the case of the end block loading system, a certain area between the load point and the crack tip is artificially stiffened due to the bonding of the metallic part. This artificial stiffening of the specimen, directly related to the distance l2 in Figure 5.4, causes a reduction of the resulting displacement for a given load. This non-linear effect results in a new reduction of the compliance of the system. In order to minimize the previous non-linear effects on the calculation of G and C, two correction factors have been derived. As mentioned, the non-linear effect associated to the distance l1 is especially important for large displacements and is taken into account by introducing the following correction factor (Hashemi et al., 1990a; Hashemi et al., 1990b; Davies, 1992; Robinson and Hodgkinson, 2000):
−
−= 21
2
2
11Ll
LF
δθδθ (5.49)
where the parameters θ1 and θ2 for the η = 1 MMELS specimen are given by
23
42
1
7120
367130153
+
+
+
=
La
La
La
θ (5.50)
3
2
2
71
713
+
+
=
La
La
aLθ (5.51)
The non-linear effect associated to the distance l2 is corrected by taking into account the following correction factor (Hashemi et al., 1990a; Hashemi et al., 1990b):
2
521
4
32
31
−
−
−=LL
lLl
N δθδθθ (5.52)
where the parameters θ3, θ4 and θ5 for the η = 1 MMELS specimen are given by
33
71
8
+
=
La
(5.53)
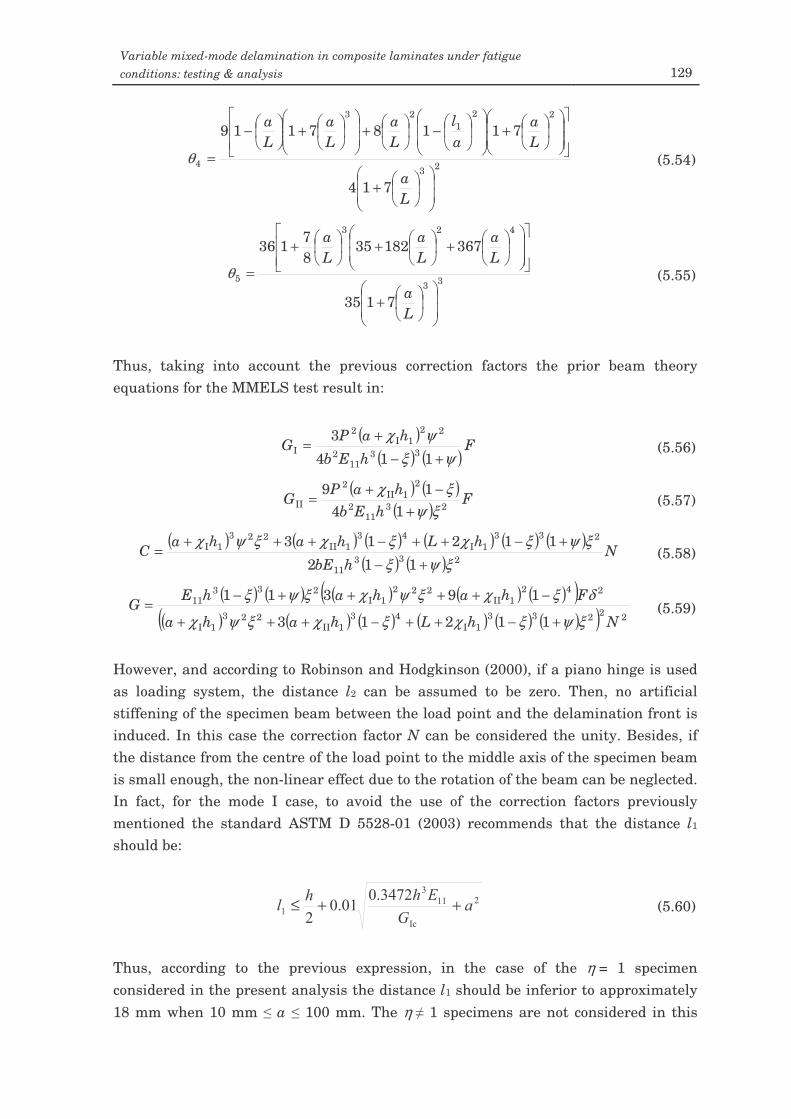
Variable mixed-mode delamination in composite laminates under fatigue conditions: testing & analysis 129
23
221
23
4
714
71187119
+
+
−
+
+
−
=
La
La
al
La
La
La
θ (5.54)
33
423
5
7135
3671823587136
+
+
+
+
=
La
La
La
La
θ (5.55)
Thus, taking into account the previous correction factors the prior beam theory equations for the MMELS test result in:
( )( ) ( )
FhEb
haPG
ψξψχ
+−+
=114
333
112
221I
2
I (5.56)
( ) ( )( ) F
hEbhaP
G23
112
21II
2
II 1419ξψ
ξχ+
−+= (5.57)
( ) ( ) ( ) ( ) ( ) ( )( ) ( )
NhbE
hLhahaC
23311
2331I
431II
2231I
112
11213
ξψξξψξχξχξψχ
+−+−++−+++
= (5.58)
( ) ( ) ( ) ( ) ( )( )( ) ( ) ( ) ( ) ( ) ( )( ) 22233
1I43
1II223
1I
2421II
2221I
23311
11213
19311
NhLhaha
FhahahEG
ξψξχξχξψχ
δξχξψχξψξ
+−++−+++
−++++−= (5.59)
However, and according to Robinson and Hodgkinson (2000), if a piano hinge is used as loading system, the distance l2 can be assumed to be zero. Then, no artificial stiffening of the specimen beam between the load point and the delamination front is induced. In this case the correction factor N can be considered the unity. Besides, if the distance from the centre of the load point to the middle axis of the specimen beam is small enough, the non-linear effect due to the rotation of the beam can be neglected. In fact, for the mode I case, to avoid the use of the correction factors previously mentioned the standard ASTM D 5528-01 (2003) recommends that the distance l1 should be:
++≤ (5.60)
Thus, according to the previous expression, in the case of the η = 1 specimen considered in the present analysis the distance l1 should be inferior to approximately 18 mm when 10 mm a 100 mm. The η 1 specimens are not considered in this
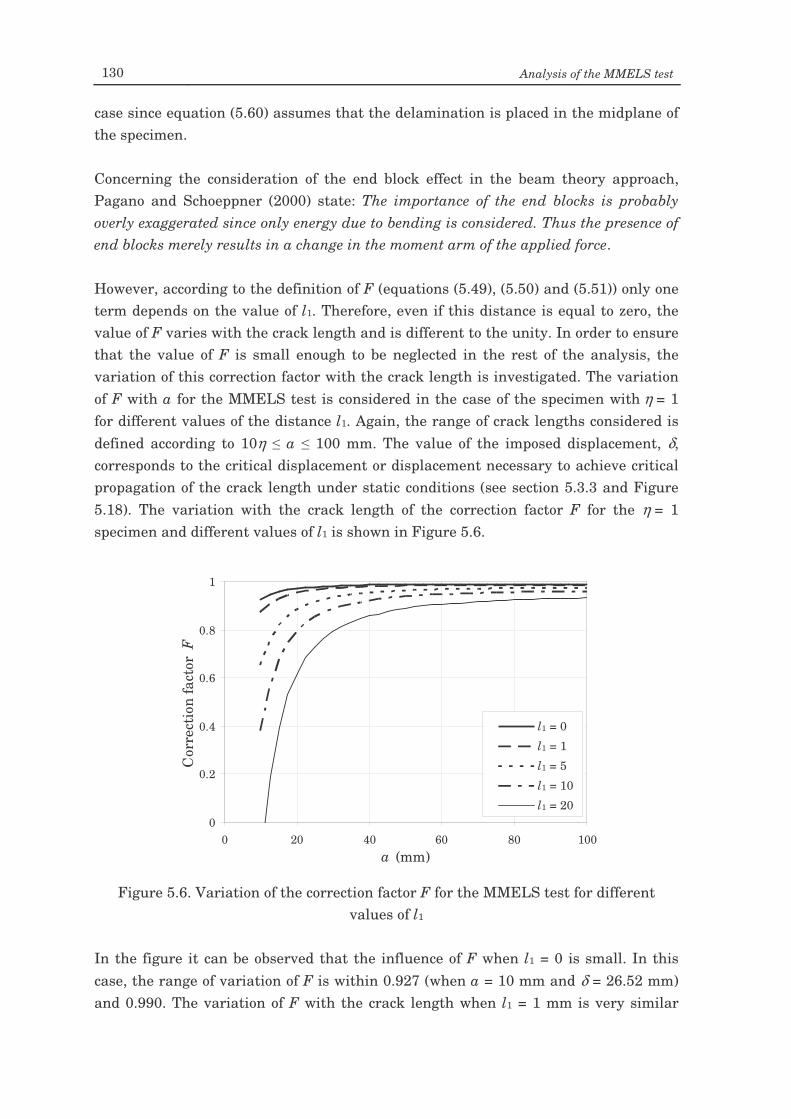
130 Analysis of the MMELS test
case since equation (5.60) assumes that the delamination is placed in the midplane of the specimen. Concerning the consideration of the end block effect in the beam theory approach, Pagano and Schoeppner (2000) state: The importance of the end blocks is probably overly exaggerated since only energy due to bending is considered. Thus the presence of end blocks merely results in a change in the moment arm of the applied force. However, according to the definition of F (equations (5.49), (5.50) and (5.51)) only one term depends on the value of l1. Therefore, even if this distance is equal to zero, the value of F varies with the crack length and is different to the unity. In order to ensure that the value of F is small enough to be neglected in the rest of the analysis, the variation of this correction factor with the crack length is investigated. The variation of F with a for the MMELS test is considered in the case of the specimen with η = 1 for different values of the distance l1. Again, the range of crack lengths considered is defined according to 10η a 100 mm. The value of the imposed displacement, δ, corresponds to the critical displacement or displacement necessary to achieve critical propagation of the crack length under static conditions (see section 5.3.3 and Figure 5.18). The variation with the crack length of the correction factor F for the η = 1 specimen and different values of l1 is shown in Figure 5.6.
Figure 5.6. Variation of the correction factor F for the MMELS test for different
values of l1 In the figure it can be observed that the influence of F when l1 = 0 is small. In this case, the range of variation of F is within 0.927 (when a = 10 mm and δ = 26.52 mm) and 0.990. The variation of F with the crack length when l1 = 1 mm is very similar
0
0.2
0.4
0.6
0.8
1
0 20 40 60 80 100a (mm)
Cor
rect
ion
fact
or F
l1 = 0l1 = 1l1 = 5l1 = 10l1 = 20
l1 = 0 l1 = 1 l1 = 5 l1 = 10 l1 = 20
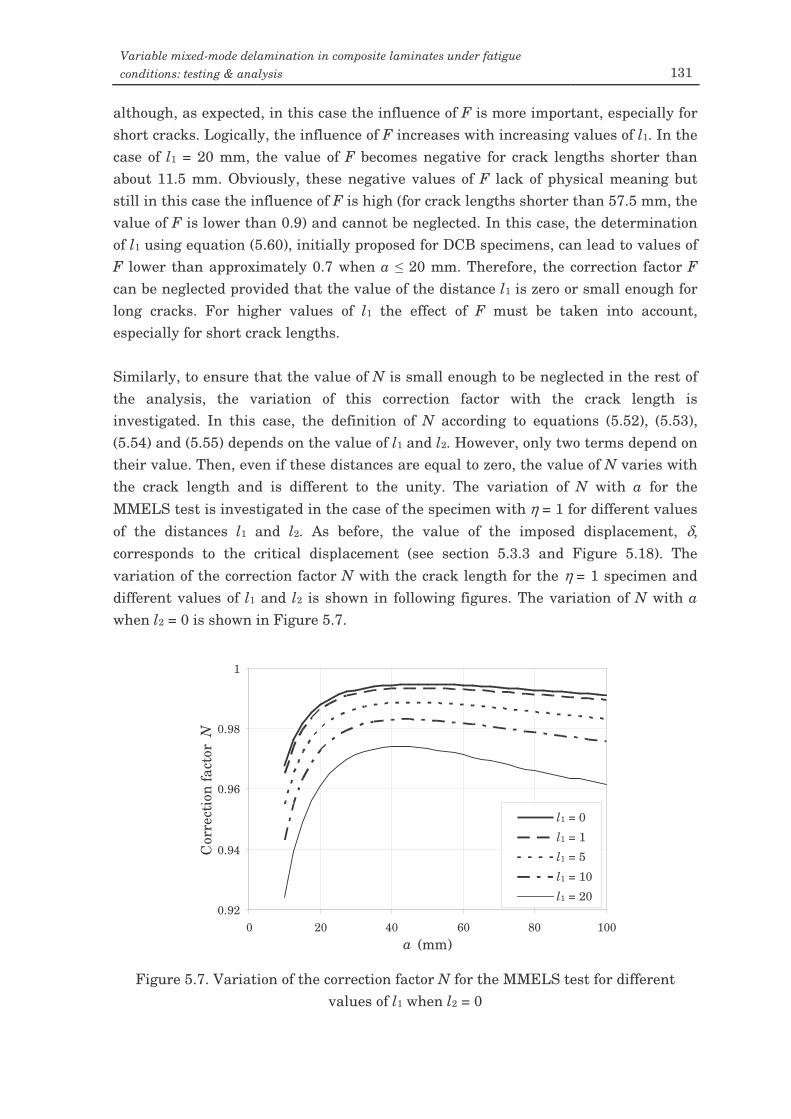
Variable mixed-mode delamination in composite laminates under fatigue conditions: testing & analysis 131
although, as expected, in this case the influence of F is more important, especially for short cracks. Logically, the influence of F increases with increasing values of l1. In the case of l1 = 20 mm, the value of F becomes negative for crack lengths shorter than about 11.5 mm. Obviously, these negative values of F lack of physical meaning but still in this case the influence of F is high (for crack lengths shorter than 57.5 mm, the value of F is lower than 0.9) and cannot be neglected. In this case, the determination of l1 using equation (5.60), initially proposed for DCB specimens, can lead to values of F lower than approximately 0.7 when a 20 mm. Therefore, the correction factor F can be neglected provided that the value of the distance l1 is zero or small enough for long cracks. For higher values of l1 the effect of F must be taken into account, especially for short crack lengths. Similarly, to ensure that the value of N is small enough to be neglected in the rest of the analysis, the variation of this correction factor with the crack length is investigated. In this case, the definition of N according to equations (5.52), (5.53), (5.54) and (5.55) depends on the value of l1 and l2. However, only two terms depend on their value. Then, even if these distances are equal to zero, the value of N varies with the crack length and is different to the unity. The variation of N with a for the MMELS test is investigated in the case of the specimen with η = 1 for different values of the distances l1 and l2. As before, the value of the imposed displacement, δ, corresponds to the critical displacement (see section 5.3.3 and Figure 5.18). The variation of the correction factor N with the crack length for the η = 1 specimen and different values of l1 and l2 is shown in following figures. The variation of N with a when l2 = 0 is shown in Figure 5.7.
Figure 5.7. Variation of the correction factor N for the MMELS test for different
values of l1 when l2 = 0
0.92
0.94
0.96
0.98
1
0 20 40 60 80 100a (mm)
Cor
rect
ion
fact
or N
l1 = 20l1 = 10l1 = 5l1 = 1l1 = 0
l1 = 0 l1 = 1 l1 = 5 l1 = 10 l1 = 20
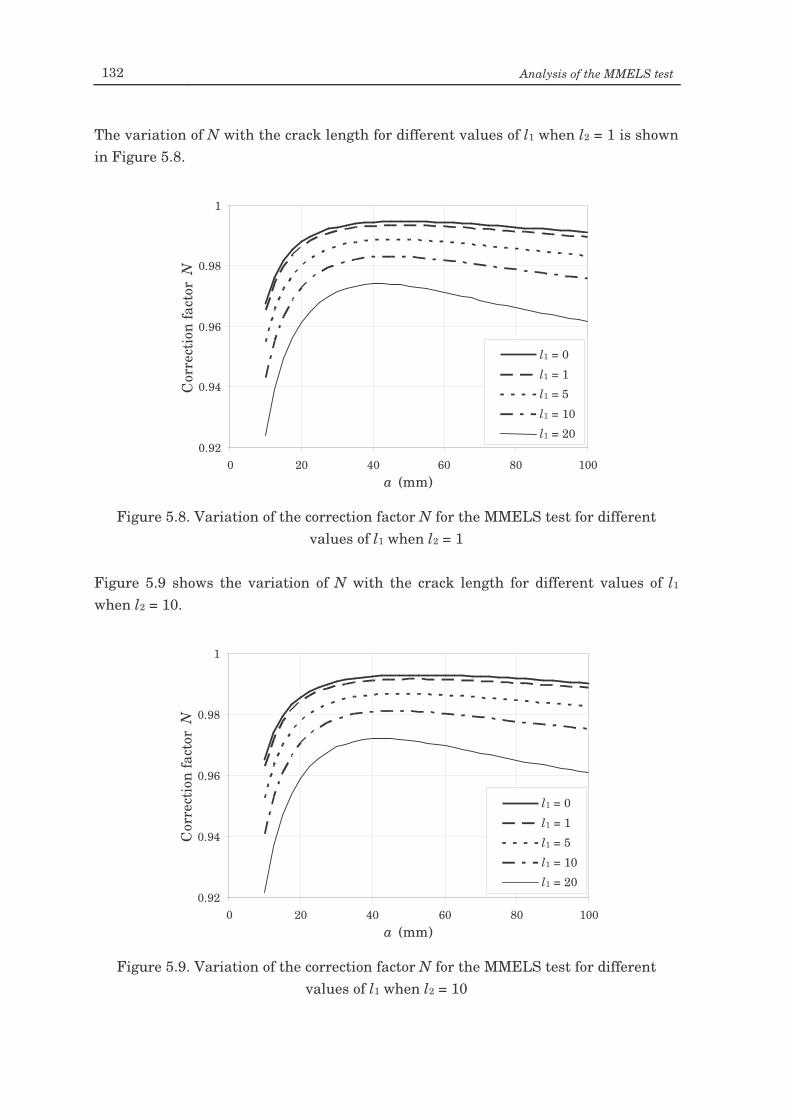
132 Analysis of the MMELS test
The variation of N with the crack length for different values of l1 when l2 = 1 is shown in Figure 5.8.
Figure 5.8. Variation of the correction factor N for the MMELS test for different
values of l1 when l2 = 1 Figure 5.9 shows the variation of N with the crack length for different values of l1 when l2 = 10.
Figure 5.9. Variation of the correction factor N for the MMELS test for different
values of l1 when l2 = 10
0.92
0.94
0.96
0.98
1
0 20 40 60 80 100a (mm)
Cor
rect
ion
fact
or N
l1 = 20l1 = 10l1 = 5l1 = 1l1 = 0
l1 = 0 l1 = 1 l1 = 5 l1 = 10 l1 = 20
0.92
0.94
0.96
0.98
1
0 20 40 60 80 100a (mm)
Cor
rect
ion
fact
or N
l1 = 20l1 = 10l1 = 5l1 = 1l1 = 0
l1 = 0 l1 = 1 l1 = 5 l1 = 10 l1 = 20
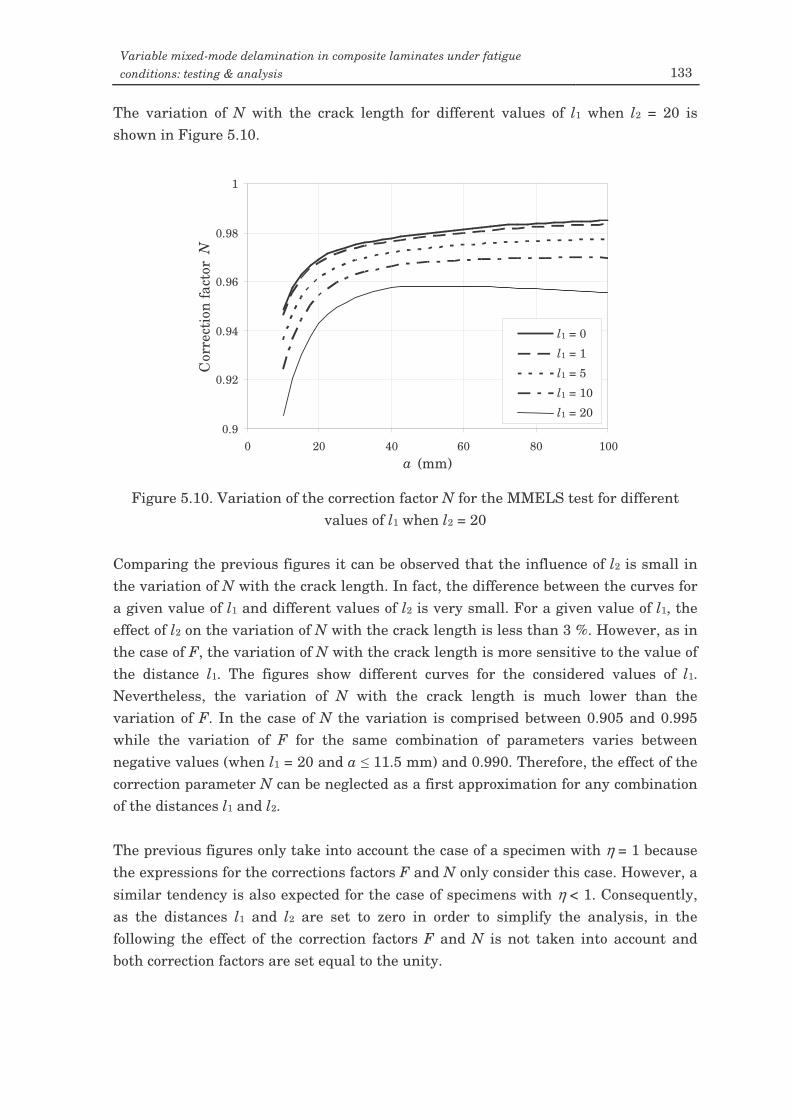
Variable mixed-mode delamination in composite laminates under fatigue conditions: testing & analysis 133
The variation of N with the crack length for different values of l1 when l2 = 20 is shown in Figure 5.10.
Figure 5.10. Variation of the correction factor N for the MMELS test for different
values of l1 when l2 = 20 Comparing the previous figures it can be observed that the influence of l2 is small in the variation of N with the crack length. In fact, the difference between the curves for a given value of l1 and different values of l2 is very small. For a given value of l1, the effect of l2 on the variation of N with the crack length is less than 3 %. However, as in the case of F, the variation of N with the crack length is more sensitive to the value of the distance l1. The figures show different curves for the considered values of l1. Nevertheless, the variation of N with the crack length is much lower than the variation of F. In the case of N the variation is comprised between 0.905 and 0.995 while the variation of F for the same combination of parameters varies between negative values (when l1 = 20 and a 11.5 mm) and 0.990. Therefore, the effect of the correction parameter N can be neglected as a first approximation for any combination of the distances l1 and l2. The previous figures only take into account the case of a specimen with η = 1 because the expressions for the corrections factors F and N only consider this case. However, a similar tendency is also expected for the case of specimens with η < 1. Consequently, as the distances l1 and l2 are set to zero in order to simplify the analysis, in the following the effect of the correction factors F and N is not taken into account and both correction factors are set equal to the unity.
0.9
0.92
0.94
0.96
0.98
1
0 20 40 60 80 100a (mm)
Cor
rect
ion
fact
or N
l1 = 0l1 = 1l1 = 5l1 = 10l1 = 20
l1 = 0 l1 = 1 l1 = 5 l1 = 10 l1 = 20
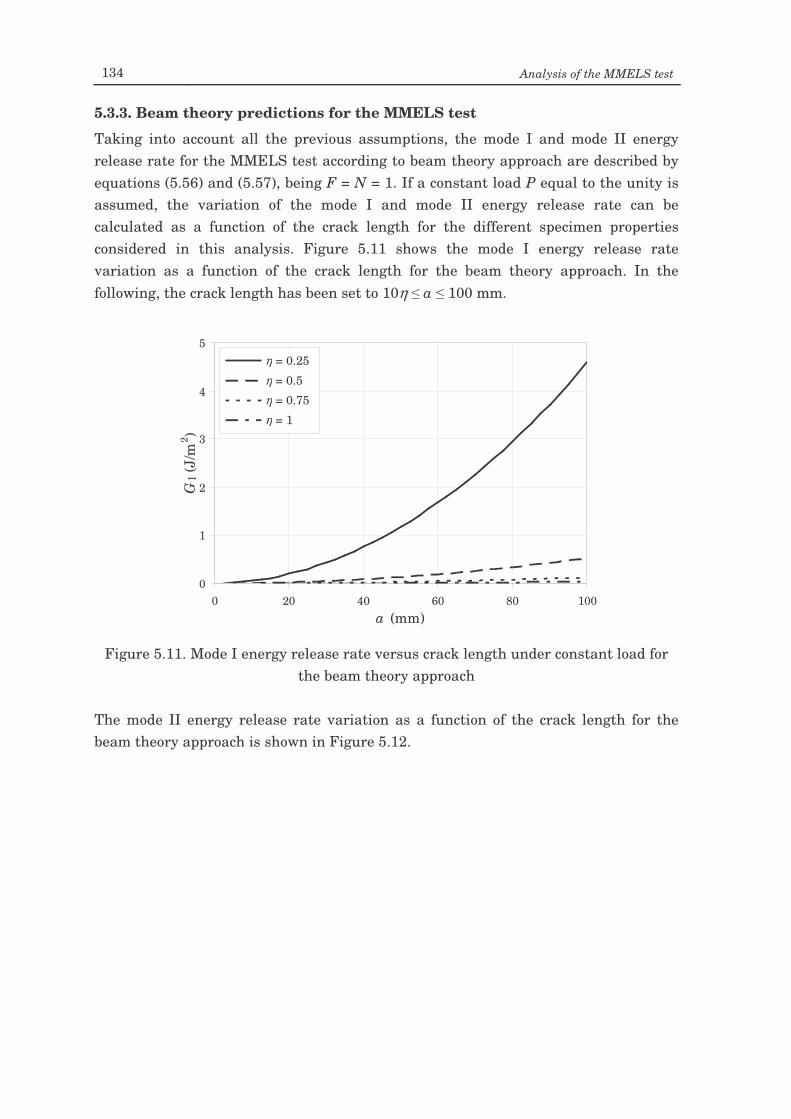
134 Analysis of the MMELS test
5.3.3. Beam theory predictions for the MMELS test
Taking into account all the previous assumptions, the mode I and mode II energy release rate for the MMELS test according to beam theory approach are described by equations (5.56) and (5.57), being F = N = 1. If a constant load P equal to the unity is assumed, the variation of the mode I and mode II energy release rate can be calculated as a function of the crack length for the different specimen properties considered in this analysis. Figure 5.11 shows the mode I energy release rate variation as a function of the crack length for the beam theory approach. In the following, the crack length has been set to 10η a 100 mm.
Figure 5.11. Mode I energy release rate versus crack length under constant load for
the beam theory approach The mode II energy release rate variation as a function of the crack length for the beam theory approach is shown in Figure 5.12.
0
1
2
3
4
5
0 20 40 60 80 100a (mm)
GI (
J/m
2 )
η = 0.25η = 0.5η = 0.75η = 1
η = 0.25 η = 0.5 η = 0.75 η = 1
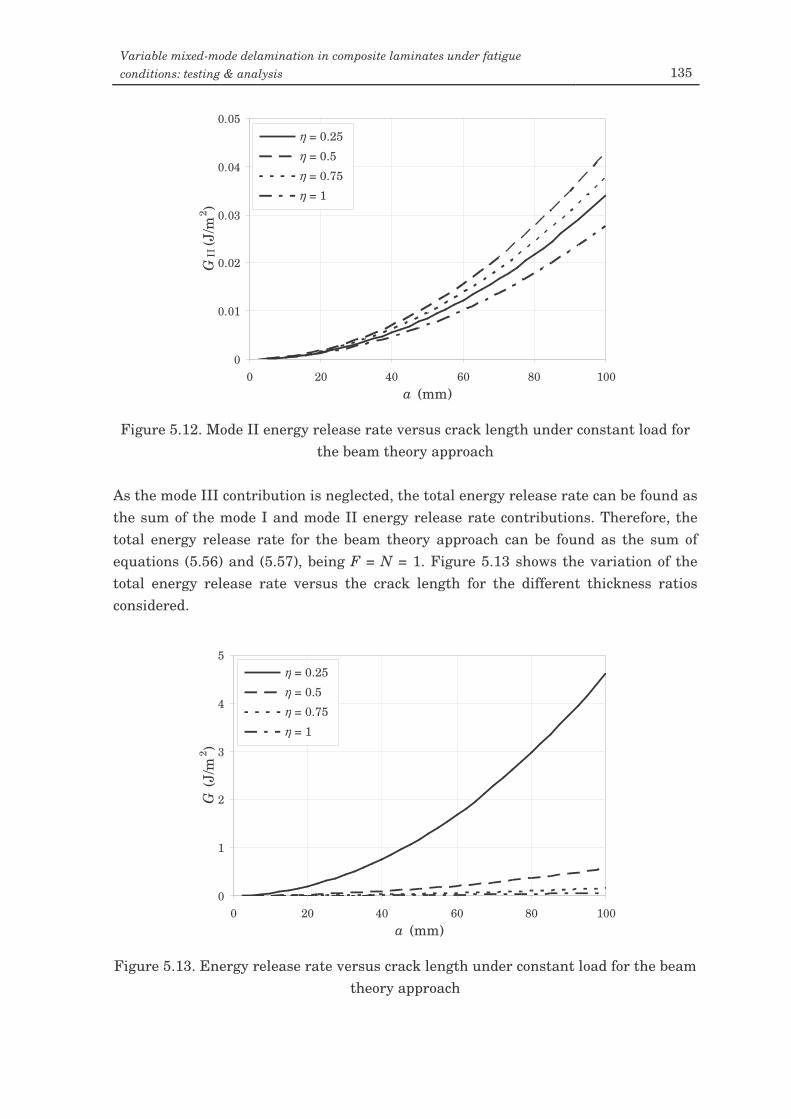
Variable mixed-mode delamination in composite laminates under fatigue conditions: testing & analysis 135
Figure 5.12. Mode II energy release rate versus crack length under constant load for
the beam theory approach As the mode III contribution is neglected, the total energy release rate can be found as the sum of the mode I and mode II energy release rate contributions. Therefore, the total energy release rate for the beam theory approach can be found as the sum of equations (5.56) and (5.57), being F = N = 1. Figure 5.13 shows the variation of the total energy release rate versus the crack length for the different thickness ratios considered.
Figure 5.13. Energy release rate versus crack length under constant load for the beam
theory approach
0
1
2
3
4
5
0 20 40 60 80 100a (mm)
G (J
/m2 )
η = 0.25η = 0.5η = 0.75η = 1
η = 0.25 η = 0.5 η = 0.75 η = 1
0
0.01
0.02
0.03
0.04
0.05
0 20 40 60 80 100a (mm)
GII
(J/m
2 )
η = 0.25η = 0.5η = 0.75η = 1
η = 0.25 η = 0.5 η = 0.75 η = 1
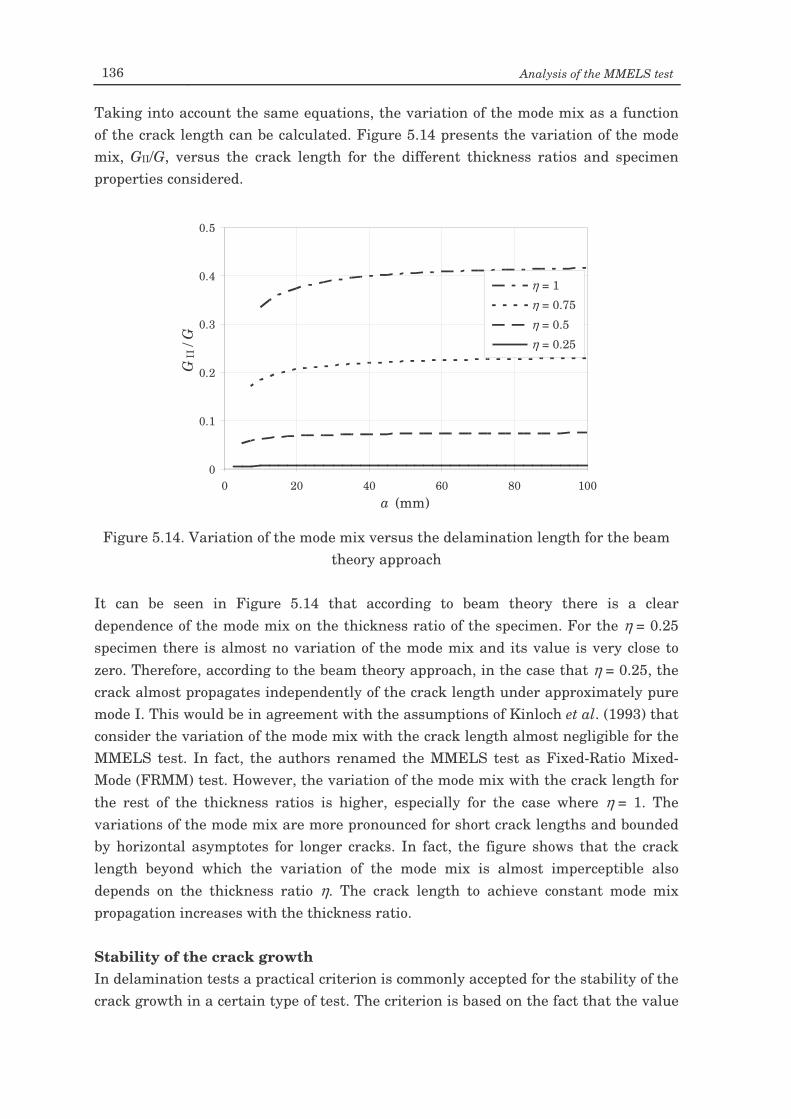
136 Analysis of the MMELS test
Taking into account the same equations, the variation of the mode mix as a function of the crack length can be calculated. Figure 5.14 presents the variation of the mode mix, GII/G, versus the crack length for the different thickness ratios and specimen properties considered.
Figure 5.14. Variation of the mode mix versus the delamination length for the beam
theory approach
It can be seen in Figure 5.14 that according to beam theory there is a clear dependence of the mode mix on the thickness ratio of the specimen. For the η = 0.25 specimen there is almost no variation of the mode mix and its value is very close to zero. Therefore, according to the beam theory approach, in the case that η = 0.25, the crack almost propagates independently of the crack length under approximately pure mode I. This would be in agreement with the assumptions of Kinloch et al. (1993) that consider the variation of the mode mix with the crack length almost negligible for the MMELS test. In fact, the authors renamed the MMELS test as Fixed-Ratio Mixed-Mode (FRMM) test. However, the variation of the mode mix with the crack length for the rest of the thickness ratios is higher, especially for the case where η = 1. The variations of the mode mix are more pronounced for short crack lengths and bounded by horizontal asymptotes for longer cracks. In fact, the figure shows that the crack length beyond which the variation of the mode mix is almost imperceptible also depends on the thickness ratio η. The crack length to achieve constant mode mix propagation increases with the thickness ratio. Stability of the crack growth In delamination tests a practical criterion is commonly accepted for the stability of the crack growth in a certain type of test. The criterion is based on the fact that the value
0
0.1
0.2
0.3
0.4
0.5
0 20 40 60 80 100a (mm)
GII
/ G
η = 1η = 0.75η = 0.5η = 0.25
η = 1 η = 0.75 η = 0.5 η = 0.25
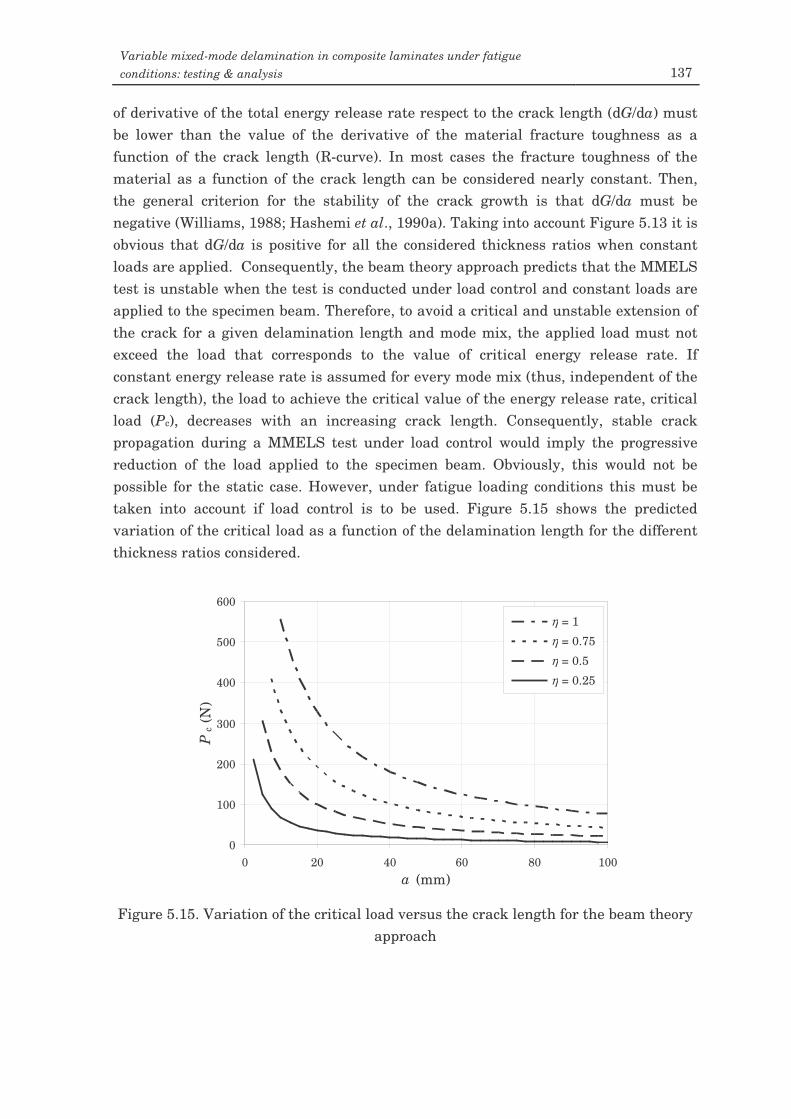
Variable mixed-mode delamination in composite laminates under fatigue conditions: testing & analysis 137
of derivative of the total energy release rate respect to the crack length (dG/da) must be lower than the value of the derivative of the material fracture toughness as a function of the crack length (R-curve). In most cases the fracture toughness of the material as a function of the crack length can be considered nearly constant. Then, the general criterion for the stability of the crack growth is that dG/da must be negative (Williams, 1988; Hashemi et al., 1990a). Taking into account Figure 5.13 it is obvious that dG/da is positive for all the considered thickness ratios when constant loads are applied. Consequently, the beam theory approach predicts that the MMELS test is unstable when the test is conducted under load control and constant loads are applied to the specimen beam. Therefore, to avoid a critical and unstable extension of the crack for a given delamination length and mode mix, the applied load must not exceed the load that corresponds to the value of critical energy release rate. If constant energy release rate is assumed for every mode mix (thus, independent of the crack length), the load to achieve the critical value of the energy release rate, critical load (Pc), decreases with an increasing crack length. Consequently, stable crack propagation during a MMELS test under load control would imply the progressive reduction of the load applied to the specimen beam. Obviously, this would not be possible for the static case. However, under fatigue loading conditions this must be taken into account if load control is to be used. Figure 5.15 shows the predicted variation of the critical load as a function of the delamination length for the different thickness ratios considered.
Figure 5.15. Variation of the critical load versus the crack length for the beam theory
approach
0
100
200
300
400
500
600
0 20 40 60 80 100a (mm)
Pc (
N)
η = 1η = 0.75η = 0.5η = 0.25
η = 1 η = 0.75 η = 0.5 η = 0.25
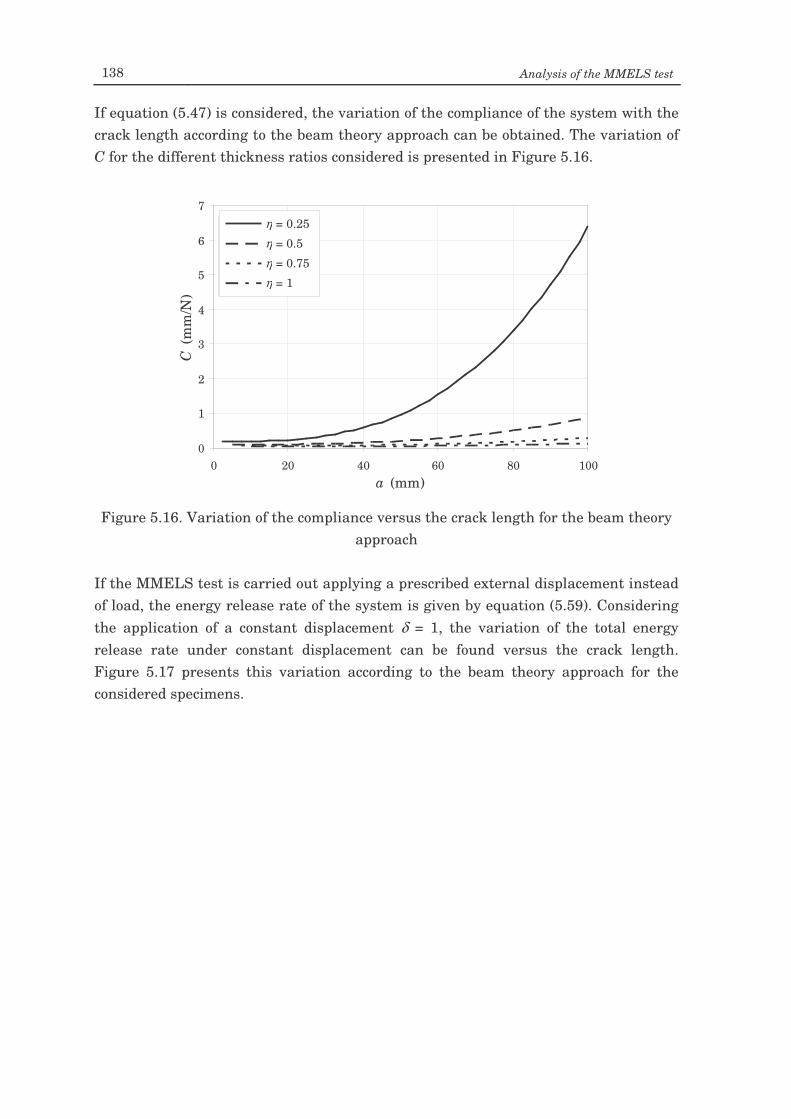
138 Analysis of the MMELS test
If equation (5.47) is considered, the variation of the compliance of the system with the crack length according to the beam theory approach can be obtained. The variation of C for the different thickness ratios considered is presented in Figure 5.16.
Figure 5.16. Variation of the compliance versus the crack length for the beam theory
approach If the MMELS test is carried out applying a prescribed external displacement instead of load, the energy release rate of the system is given by equation (5.59). Considering the application of a constant displacement δ = 1, the variation of the total energy release rate under constant displacement can be found versus the crack length. Figure 5.17 presents this variation according to the beam theory approach for the considered specimens.
0
1
2
3
4
5
6
7
0 20 40 60 80 100a (mm)
C (m
m/N
)
η = 0.25η = 0.5η = 0.75η = 1
η = 0.25 η = 0.5 η = 0.75 η = 1
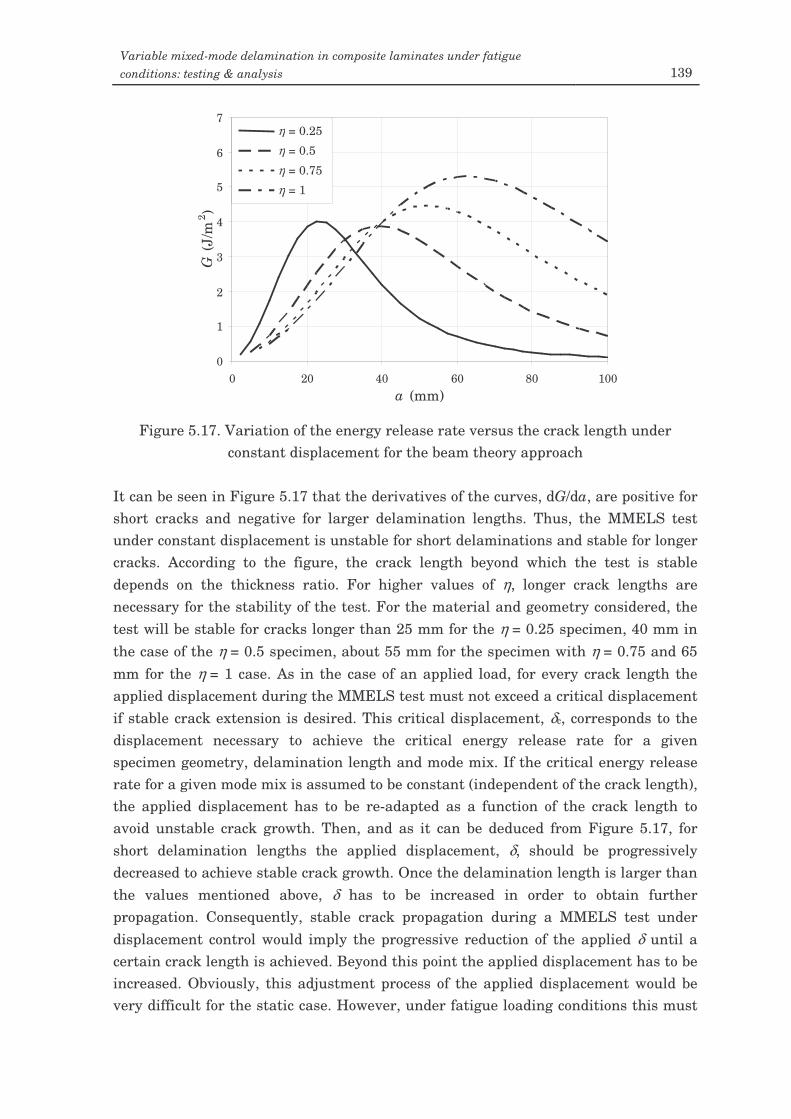
Variable mixed-mode delamination in composite laminates under fatigue conditions: testing & analysis 139
Figure 5.17. Variation of the energy release rate versus the crack length under
constant displacement for the beam theory approach It can be seen in Figure 5.17 that the derivatives of the curves, dG/da, are positive for short cracks and negative for larger delamination lengths. Thus, the MMELS test under constant displacement is unstable for short delaminations and stable for longer cracks. According to the figure, the crack length beyond which the test is stable depends on the thickness ratio. For higher values of η, longer crack lengths are necessary for the stability of the test. For the material and geometry considered, the test will be stable for cracks longer than 25 mm for the η = 0.25 specimen, 40 mm in the case of the η = 0.5 specimen, about 55 mm for the specimen with η = 0.75 and 65 mm for the η = 1 case. As in the case of an applied load, for every crack length the applied displacement during the MMELS test must not exceed a critical displacement if stable crack extension is desired. This critical displacement, δc, corresponds to the displacement necessary to achieve the critical energy release rate for a given specimen geometry, delamination length and mode mix. If the critical energy release rate for a given mode mix is assumed to be constant (independent of the crack length), the applied displacement has to be re-adapted as a function of the crack length to avoid unstable crack growth. Then, and as it can be deduced from Figure 5.17, for short delamination lengths the applied displacement, δ, should be progressively decreased to achieve stable crack growth. Once the delamination length is larger than the values mentioned above, δ has to be increased in order to obtain further propagation. Consequently, stable crack propagation during a MMELS test under displacement control would imply the progressive reduction of the applied δ until a certain crack length is achieved. Beyond this point the applied displacement has to be increased. Obviously, this adjustment process of the applied displacement would be very difficult for the static case. However, under fatigue loading conditions this must
0
1
2
3
4
5
6
7
0 20 40 60 80 100a (mm)
G (J
/m2 )
η = 0.25η = 0.5η = 0.75η = 1
η = 0.25 η = 0.5 η = 0.75 η = 1
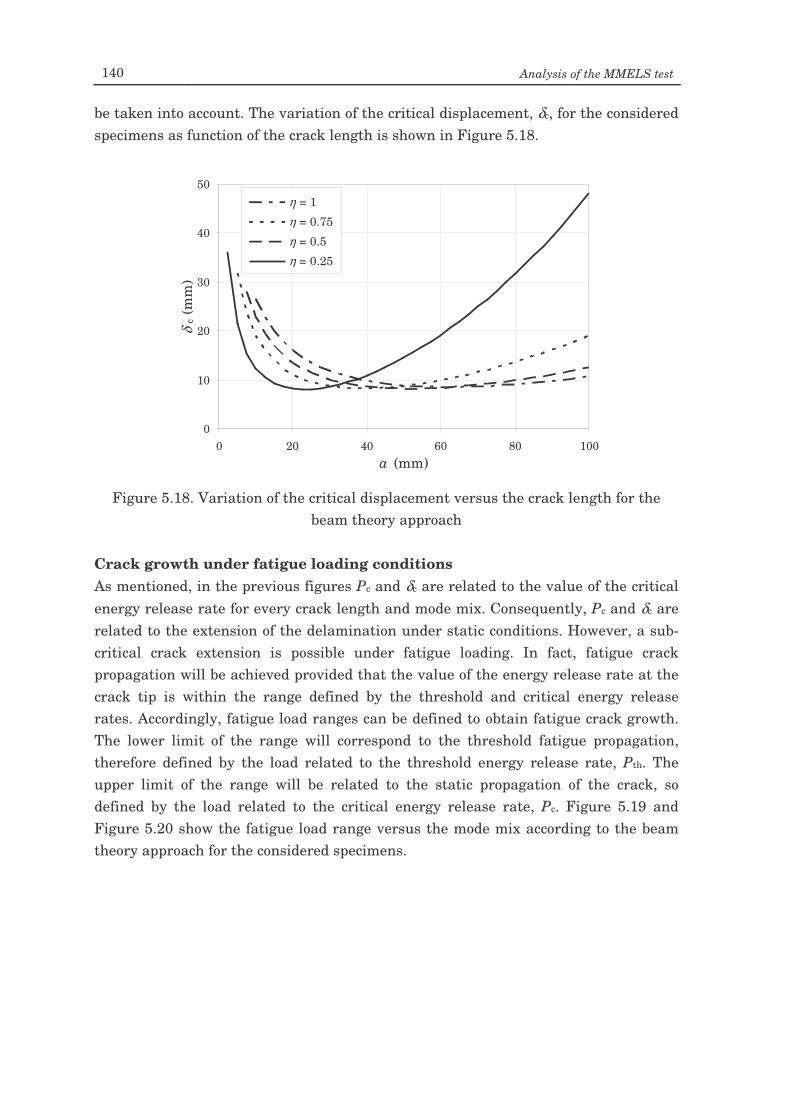
140 Analysis of the MMELS test
be taken into account. The variation of the critical displacement, δc, for the considered specimens as function of the crack length is shown in Figure 5.18.
Figure 5.18. Variation of the critical displacement versus the crack length for the
beam theory approach Crack growth under fatigue loading conditions As mentioned, in the previous figures Pc and δc are related to the value of the critical energy release rate for every crack length and mode mix. Consequently, Pc and δc are related to the extension of the delamination under static conditions. However, a sub-critical crack extension is possible under fatigue loading. In fact, fatigue crack propagation will be achieved provided that the value of the energy release rate at the crack tip is within the range defined by the threshold and critical energy release rates. Accordingly, fatigue load ranges can be defined to obtain fatigue crack growth. The lower limit of the range will correspond to the threshold fatigue propagation, therefore defined by the load related to the threshold energy release rate, Pth. The upper limit of the range will be related to the static propagation of the crack, so defined by the load related to the critical energy release rate, Pc. Figure 5.19 and Figure 5.20 show the fatigue load range versus the mode mix according to the beam theory approach for the considered specimens.
0
10
20
30
40
50
0 20 40 60 80 100a (mm)
δc (
mm
)η = 1η = 0.75η = 0.5η = 0.25
η = 1 η = 0.75 η = 0.5 η = 0.25
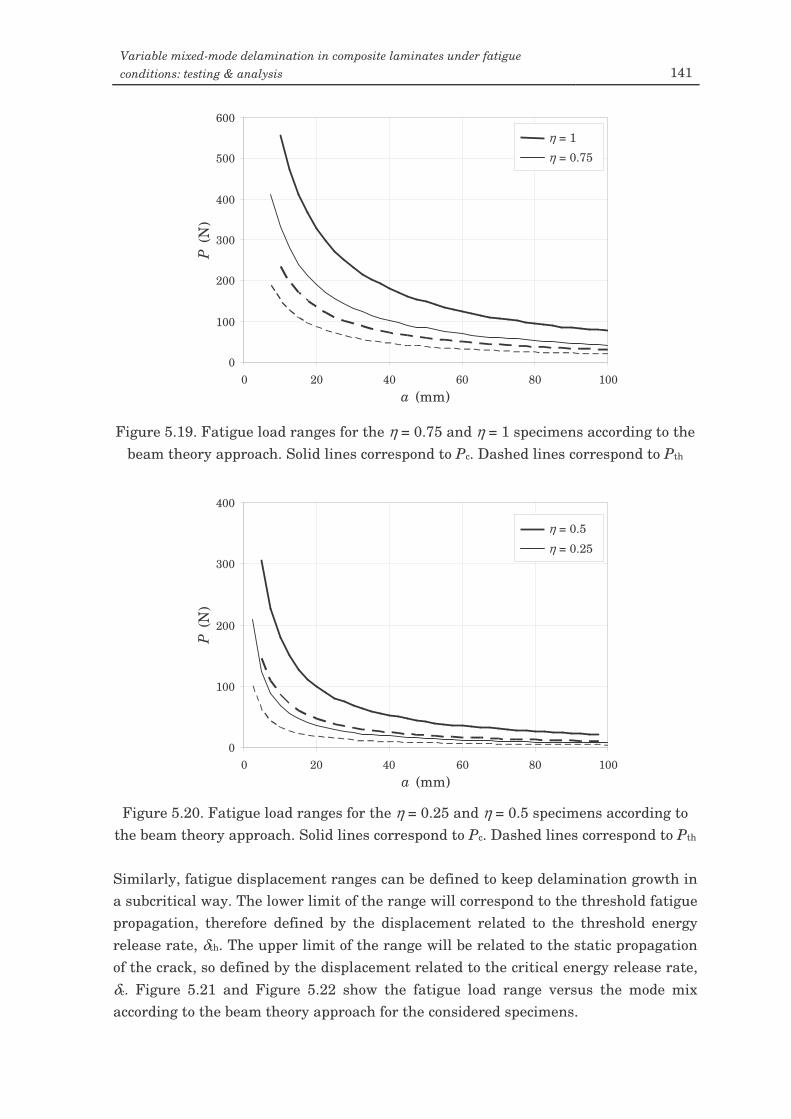
Variable mixed-mode delamination in composite laminates under fatigue conditions: testing & analysis 141
Figure 5.19. Fatigue load ranges for the η = 0.75 and η = 1 specimens according to the
beam theory approach. Solid lines correspond to Pc. Dashed lines correspond to Pth
Figure 5.20. Fatigue load ranges for the η = 0.25 and η = 0.5 specimens according to
the beam theory approach. Solid lines correspond to Pc. Dashed lines correspond to Pth
Similarly, fatigue displacement ranges can be defined to keep delamination growth in a subcritical way. The lower limit of the range will correspond to the threshold fatigue propagation, therefore defined by the displacement related to the threshold energy release rate, δth. The upper limit of the range will be related to the static propagation of the crack, so defined by the displacement related to the critical energy release rate, δc. Figure 5.21 and Figure 5.22 show the fatigue load range versus the mode mix according to the beam theory approach for the considered specimens.
0
100
200
300
400
0 20 40 60 80 100a (mm)
P (N
)
η = 0.5η = 0.25
η = 0.5 η = 0.25
0
100
200
300
400
500
600
0 20 40 60 80 100a (mm)
P (N
)
η = 1η = 0.75
η = 1 η = 0.75
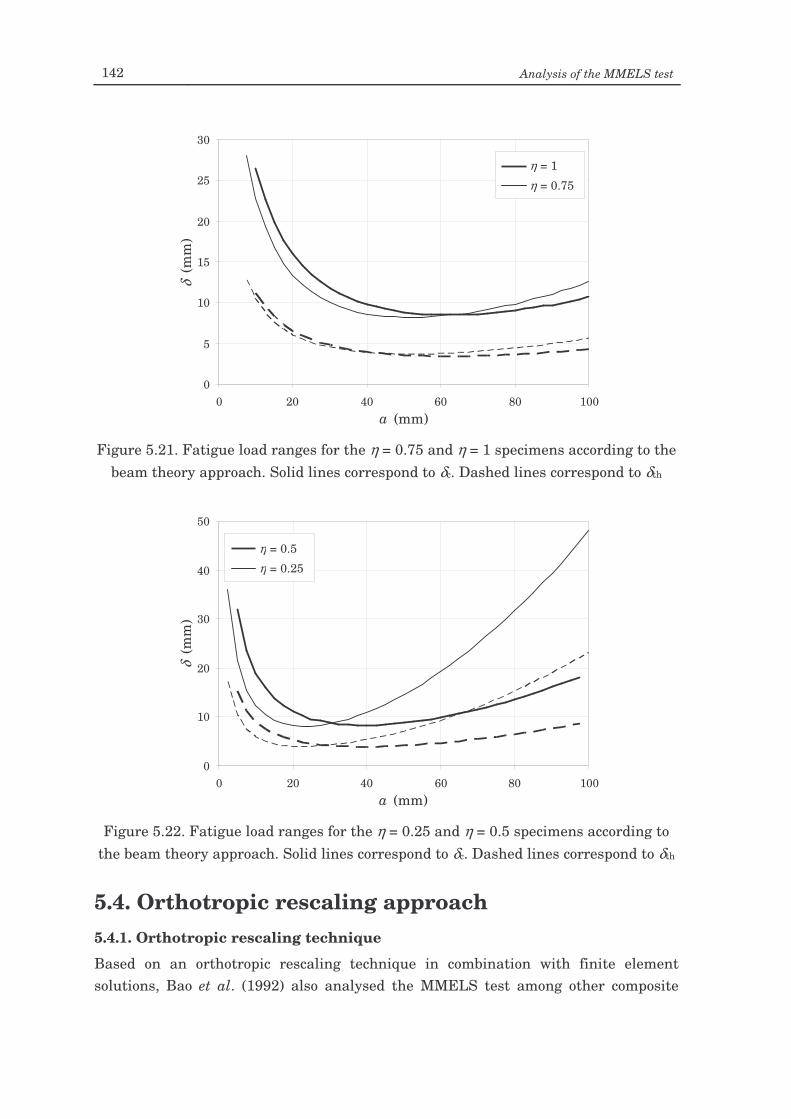
142 Analysis of the MMELS test
Figure 5.21. Fatigue load ranges for the η = 0.75 and η = 1 specimens according to the
beam theory approach. Solid lines correspond to δc. Dashed lines correspond to δth
Figure 5.22. Fatigue load ranges for the η = 0.25 and η = 0.5 specimens according to
the beam theory approach. Solid lines correspond to δc. Dashed lines correspond to δth
5.4. Orthotropic rescaling approach 5.4.1. Orthotropic rescaling technique
Based on an orthotropic rescaling technique in combination with finite element solutions, Bao et al. (1992) also analysed the MMELS test among other composite
0
10
20
30
40
50
0 20 40 60 80 100a (mm)
δ (m
m)
η = 0.5η = 0.25
η = 0.5 η = 0.25
0
5
10
15
20
25
30
0 20 40 60 80 100a (mm)
δ (m
m)
η = 1η = 0.75
η = 1 η = 0.75
Variable mixed-mode delamination in composite laminates under fatigue conditions: testing & analysis 143
delamination tests. The orthotropic rescaling technique was firstly introduced by Suo (1990; 1991) and is shortly summarised in the following. For generally anisotropic materials, the Hooke’s law can be expressed as
...,6 1, 6
1== =
iSj jiji σε (5.61)
where εi and σi refer to the terms of the six-component strain and stress vectors, respectively, and Sij is the six-by-six symmetric compliance matrix. For the case of an orthotropic material with the principal directions on the x-y plane under a plane stress condition, except S11, S12 = S21, S22 and S66, the rest of the compliance matrix terms become zero. Therefore, only four independent elastic constants are needed to characterise the material. According to Suo (1990), for any simply connected domain of orthotropic medium with traction prescribed on its boundary, the stress should only depend on two non-dimensional elastic parameters. Therefore, the two following dimensionless parameters were defined:
11
22
EE
=λ (5.62)
211212
2211
2ννρ −=
GEE
(5.63)
where ν12 and ν21 are the major and minor in-plane Poisson’s ratios, respectively. These parameters are a measure of the in-plane orthotropy: ρ = 1 for solids with cubic symmetry and λ = ρ = 1 for isotropic solids. Typical values for λ and ρ are in the range of 0.05 < λ < 20 and 0 < ρ < 5. Taking U(x, y) as the Airy stress function, the stresses at equilibrium can be expressed as
2
2
x yU
∂∂=σ (5.64)
2
2
y xU
∂∂=σ (5.65)
yxU∂∂
∂−=2
xyτ (5.66)
and the compatibility equation becomes (Lekhnitskii, 1981):
4
4
22
4
4
4
2yU
yxU
xU
∂∂+
∂∂∂+
∂∂ λρλ (5.67)
144 Analysis of the MMELS test
In the previous expression, the dependence of the stresses on material properties is given by λ and ρ. The dependence on λ can be extracted explicitly if the following rescaling of the x-axis is taken into account:
x41
λξ = (5.68)
Then, the compatibility equation only depends on ρ and reduces to
4
4
22
4
4
4
2yU
yUU
∂∂+
∂∂∂+
∂∂
ξρ
ξ (5.69)
and the rescaled boundary conditions for U change to
2
2
x yU
∂∂=σ (5.70)
2
2y
ξλσ
∂∂= U (5.71)
yU∂∂
∂−=ξλ
τ 2
4
xy (5.72)
With the λ-dependence extracted explicitly, the boundary value problem on the ξ-y plane has only one material parameter ρ. For the case of ρ = 1 but λ 1, the compatibility equation is identical to that for isotropic materials. Consequently, similar solutions to those for isotropic materials can be obtained. For a crack in the x-direction, which coincides with the principal material axis, 1, the stress intensity factors are defined such as
xK πσ 2yI ≈ (5.73)
xK πτ 2xyII ≈ (5.74)
where σy and τxy are tractions at a distance x ahead of the crack tip. On the ξ-y plane the stress intensity factors ca be written as
2
2
I83
2ξ
πξλ∂∂≈
− UK (5.75)
yUK∂∂
∂−≈−
ξπξλ
2
II81
2 (5.76)
Variable mixed-mode delamination in composite laminates under fatigue conditions: testing & analysis 145
and taking into account the relations between energy release rates and stress intensity factors (Sih et al., 1965):
2I
41
2211I 2
1 KEE
G−+= λρ (5.77)
2II
41
2211II 2
1 KEE
G λρ+= (5.78)
λλλλ1/4 – Contraction of fracture specimens Suo et al. (1991) studied orthotropic delamination specimens from the point of view of the previously described orthotropic rescaling technique. The authors considered unidirectional specimens and the x-axis was taken parallel to the fibre direction so λ < 1. It was shown that although end-effects were usually supposed to decay rapidly, the end zones for orthotropic specimens are λ1/4 times larger than those of the isotropic case. Therefore, the effective lengths of orthotropic specimens are contracted by a factor of λ1/4. In consequence, larger orthotropic specimens should be used to avoid end-effect complications. In the case of the DCB specimen the analytic energy release rate expression should take the form:
=
−
ahg
hEbaPG
41
311
2
22
, λρ (5.79)
where g is a non-dimensional function of the dimensionless orthotropic rescaling parameters. Taking into account the numerical solution for isotropic materials of Wiederhorn et al. (1968) and the results of the conducted finite element calculations, the authors proposed the following final expression:
2
41
311
2
212
+=
−
hYahEb
PG λ (5.80)
The first term of the previous equation coincides with the result of the simple beam theory, which according to the authors is an exact linear elasticity asymptote when a >> h. The second term is a correction to include the effect of the shear due to the finite ratio a/h. This second term is usually omitted for isotropic materials but becomes non-negligible for high-orthotropic materials (λ << 1). This term also includes the dependence on ρ, which is given by
146 Analysis of the MMELS test
( ) ( )21013.01149.0677.0 −−−+= ρρY (5.81)
These expressions are said to be valid within an error less than 1 % for generally orthotropic materials provided that λ1/4a > h and 0 < ρ < 1.
5.4.2. Orthotropic rescaling equations for the MMELS test
Based on this orthotropic rescaling technique Bao et al. (1992) analysed the DCB, ELS, ENF, MMELS tests in combination with finite element calculations. The expressions presented below were the ones that best fitted the finite element results. For the case of the MMELS test with h1 h2 the total and mode I energy release rates are respectively given by:
( )( )2
1413
3111
2
2
111116
−++
+−=
−−
hFYahEb
PG ληη
(5.82)
( )( )2
141
II3111
2
2
I 11
−++=
−
hFYahEb
APG λη (5.83)
where the first term of both equations is determined from the simple beam theory solution which is the exact asymptote for a >> h. The rest of the parameters are given by
( ) ( ) ( )32 1002.01016.01122.0484.0 −+−−−+= ρρρY (5.84)
ρ181.0468.0 −= eF (5.85) 32 356.0867.0223.0734.3 ηηη +−−=A (5.86)
( ) ( ) ( )32I 100242.010178.01146.0677.0 −+−−−+= ρρρY (5.87)
ρ0244.05185.0I −=F (5.88)
Taking into account that the mode III contribution can be neglected, mode II energy release rate results from the difference between equations (5.82) and (5.83). According to the authors, the previous expressions are valid within an error less than 2 % provided that λ1/4a > 2h1 and 0 < ρ < 4. In the paper of Bao and co-workers no comment is made about how or where the load is applied to the specimen, the inclusion of axial forces on the specimen or if large displacements are taken into account. However, as it can be seen in Figure 5.23, the MMELS test rig considered by the authors corresponds to that represented in Figure 4.3. Thus, in the following it will be considered that the load is applied centred with the specimen beam and no correction factors are needed to account for large
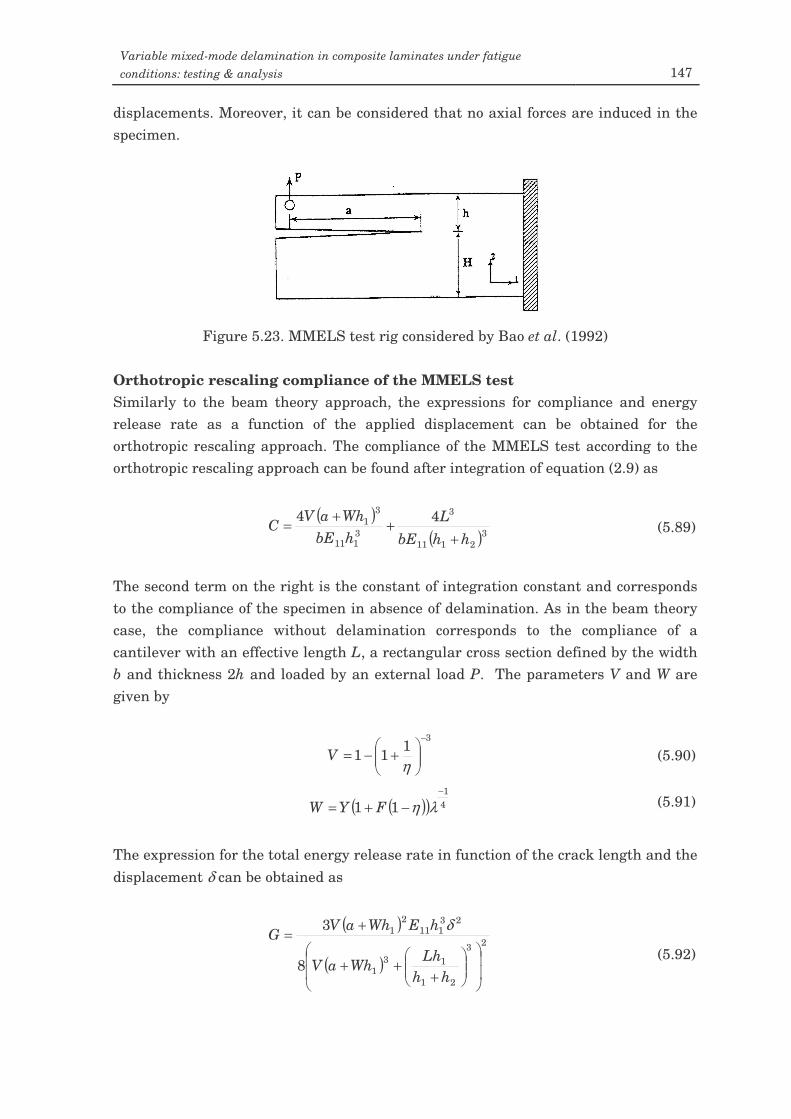
Variable mixed-mode delamination in composite laminates under fatigue conditions: testing & analysis 147
displacements. Moreover, it can be considered that no axial forces are induced in the specimen.
Figure 5.23. MMELS test rig considered by Bao et al. (1992)
Orthotropic rescaling compliance of the MMELS test Similarly to the beam theory approach, the expressions for compliance and energy release rate as a function of the applied displacement can be obtained for the orthotropic rescaling approach. The compliance of the MMELS test according to the orthotropic rescaling approach can be found after integration of equation (2.9) as
( )( )3
2111
3
3111
31 44
hhbEL
hbEWhaV
C+
++
= (5.89)
The second term on the right is the constant of integration constant and corresponds to the compliance of the specimen in absence of delamination. As in the beam theory case, the compliance without delamination corresponds to the compliance of a cantilever with an effective length L, a rectangular cross section defined by the width b and thickness 2h and loaded by an external load P. The parameters V and W are given by
3111
−
+−=
ηV (5.90)
( )( ) 41
11−
−+= ληFYW (5.91)
The expression for the total energy release rate in function of the crack length and the displacement δ can be obtained as
( )
( )23
21
131
23111
21
8
3
+++
+=
hhLh
WhaV
hEWhaVG
δ
(5.92)
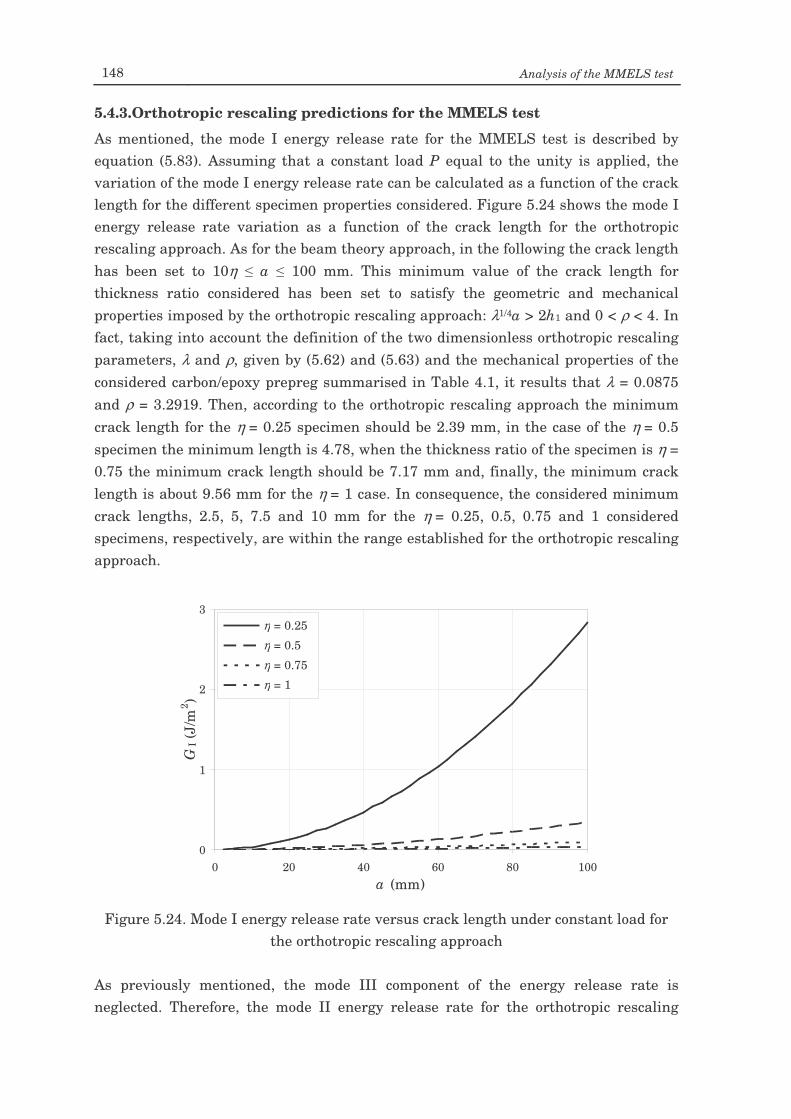
148 Analysis of the MMELS test
5.4.3.Orthotropic rescaling predictions for the MMELS test
As mentioned, the mode I energy release rate for the MMELS test is described by equation (5.83). Assuming that a constant load P equal to the unity is applied, the variation of the mode I energy release rate can be calculated as a function of the crack length for the different specimen properties considered. Figure 5.24 shows the mode I energy release rate variation as a function of the crack length for the orthotropic rescaling approach. As for the beam theory approach, in the following the crack length has been set to 10η a 100 mm. This minimum value of the crack length for thickness ratio considered has been set to satisfy the geometric and mechanical properties imposed by the orthotropic rescaling approach: λ1/4a > 2h1 and 0 < ρ < 4. In fact, taking into account the definition of the two dimensionless orthotropic rescaling parameters, λ and ρ, given by (5.62) and (5.63) and the mechanical properties of the considered carbon/epoxy prepreg summarised in Table 4.1, it results that λ = 0.0875 and ρ = 3.2919. Then, according to the orthotropic rescaling approach the minimum crack length for the η = 0.25 specimen should be 2.39 mm, in the case of the η = 0.5 specimen the minimum length is 4.78, when the thickness ratio of the specimen is η = 0.75 the minimum crack length should be 7.17 mm and, finally, the minimum crack length is about 9.56 mm for the η = 1 case. In consequence, the considered minimum crack lengths, 2.5, 5, 7.5 and 10 mm for the η = 0.25, 0.5, 0.75 and 1 considered specimens, respectively, are within the range established for the orthotropic rescaling approach.
Figure 5.24. Mode I energy release rate versus crack length under constant load for
the orthotropic rescaling approach As previously mentioned, the mode III component of the energy release rate is neglected. Therefore, the mode II energy release rate for the orthotropic rescaling
0
1
2
3
0 20 40 60 80 100a (mm)
GI (
J/m
2 )
η = 0.25η = 0.5η = 0.75η = 1
η = 0.25 η = 0.5 η = 0.75 η = 1
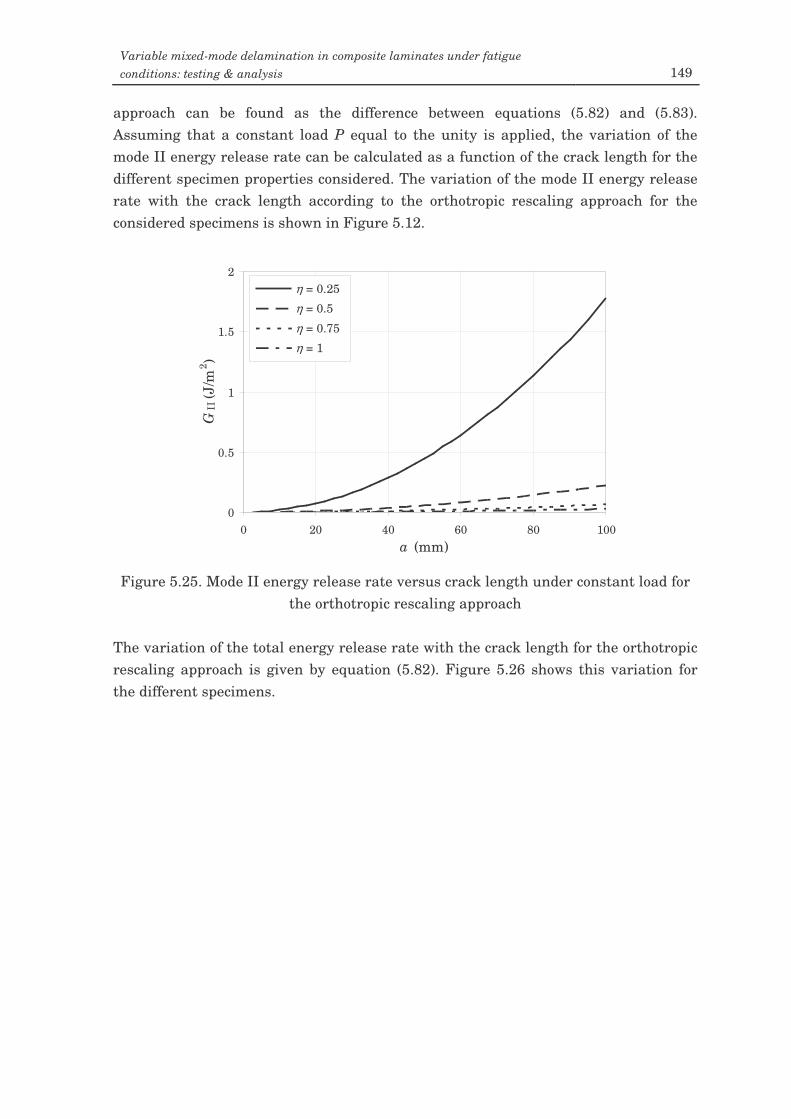
Variable mixed-mode delamination in composite laminates under fatigue conditions: testing & analysis 149
approach can be found as the difference between equations (5.82) and (5.83). Assuming that a constant load P equal to the unity is applied, the variation of the mode II energy release rate can be calculated as a function of the crack length for the different specimen properties considered. The variation of the mode II energy release rate with the crack length according to the orthotropic rescaling approach for the considered specimens is shown in Figure 5.12.
Figure 5.25. Mode II energy release rate versus crack length under constant load for
the orthotropic rescaling approach The variation of the total energy release rate with the crack length for the orthotropic rescaling approach is given by equation (5.82). Figure 5.26 shows this variation for the different specimens.
0
0.5
1
1.5
2
0 20 40 60 80 100a (mm)
GII
(J/m
2 )
η = 0.25η = 0.5η = 0.75η = 1
η = 0.25 η = 0.5 η = 0.75 η = 1
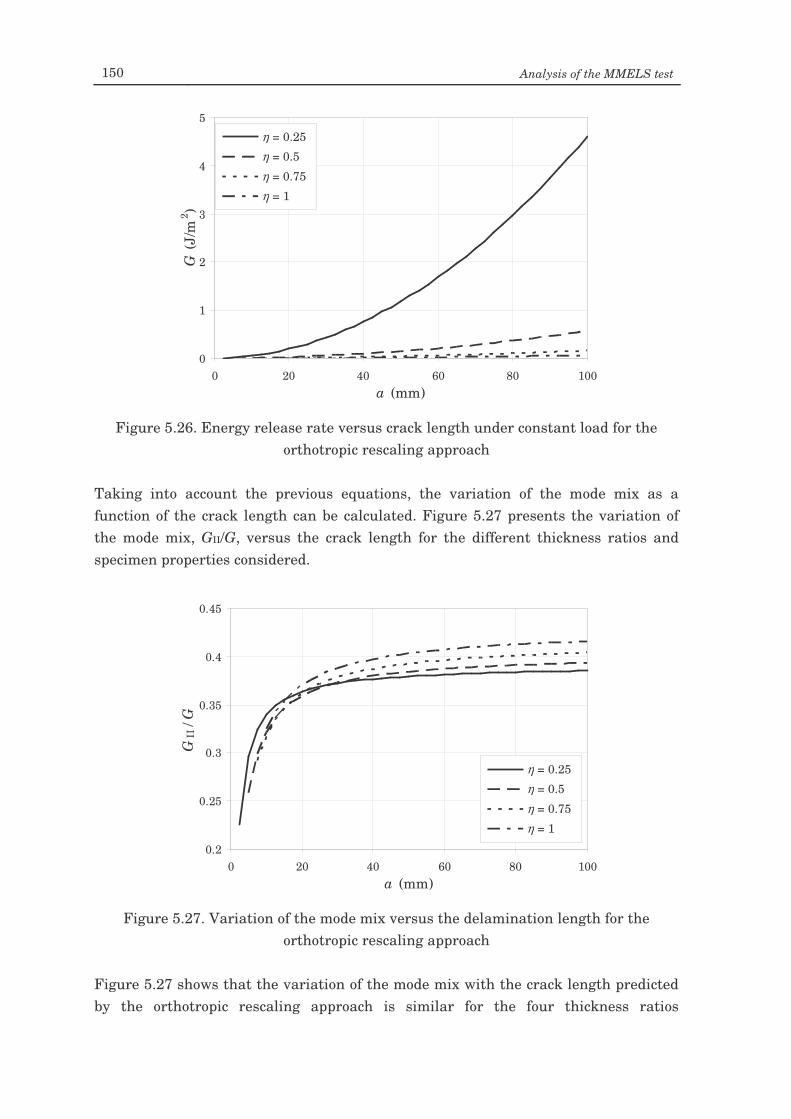
150 Analysis of the MMELS test
Figure 5.26. Energy release rate versus crack length under constant load for the
orthotropic rescaling approach Taking into account the previous equations, the variation of the mode mix as a function of the crack length can be calculated. Figure 5.27 presents the variation of the mode mix, GII/G, versus the crack length for the different thickness ratios and specimen properties considered.
Figure 5.27. Variation of the mode mix versus the delamination length for the
orthotropic rescaling approach
Figure 5.27 shows that the variation of the mode mix with the crack length predicted by the orthotropic rescaling approach is similar for the four thickness ratios
0.2
0.25
0.3
0.35
0.4
0.45
0 20 40 60 80 100a (mm)
GII
/ G
η = 1η = 0.75η = 0.5η = 0.25
η = 0.25 η = 0.5 η = 0.75 η = 1
0
1
2
3
4
5
0 20 40 60 80 100a (mm)
G (J
/m2 )
η = 0.25η = 0.5η = 0.75η = 1
η = 0.25 η = 0.5 η = 0.75 η = 1
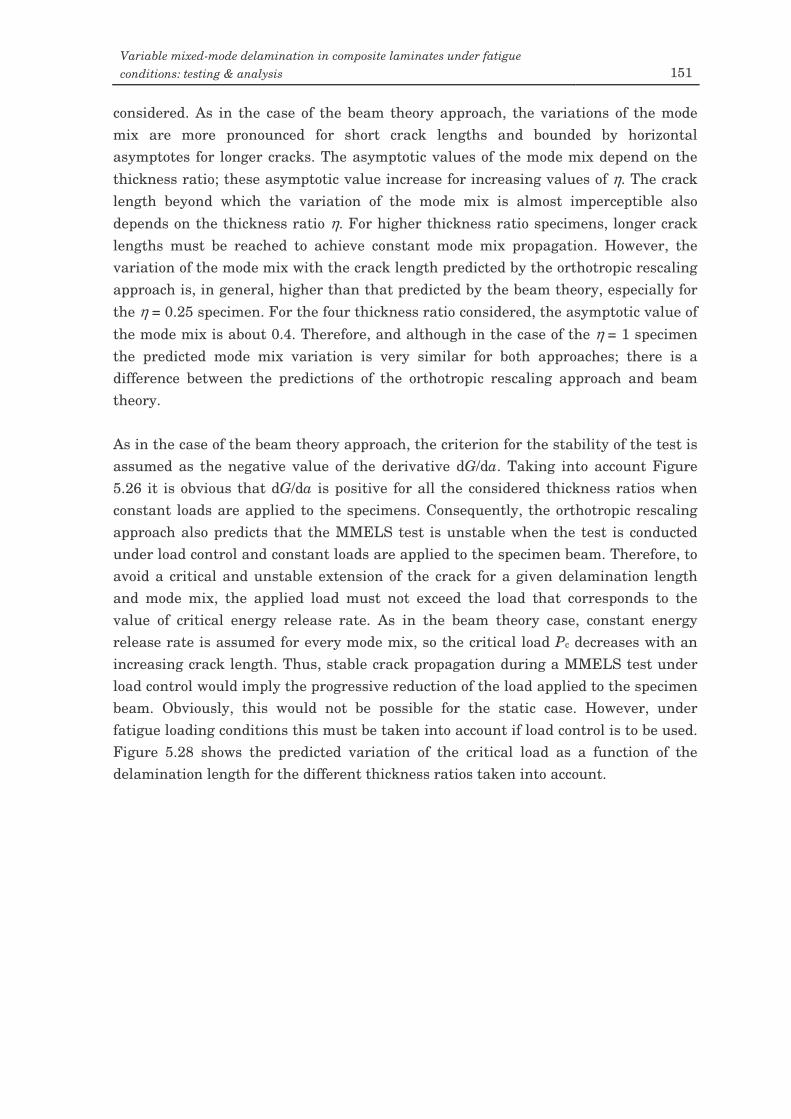
Variable mixed-mode delamination in composite laminates under fatigue conditions: testing & analysis 151
considered. As in the case of the beam theory approach, the variations of the mode mix are more pronounced for short crack lengths and bounded by horizontal asymptotes for longer cracks. The asymptotic values of the mode mix depend on the thickness ratio; these asymptotic value increase for increasing values of η. The crack length beyond which the variation of the mode mix is almost imperceptible also depends on the thickness ratio η. For higher thickness ratio specimens, longer crack lengths must be reached to achieve constant mode mix propagation. However, the variation of the mode mix with the crack length predicted by the orthotropic rescaling approach is, in general, higher than that predicted by the beam theory, especially for the η = 0.25 specimen. For the four thickness ratio considered, the asymptotic value of the mode mix is about 0.4. Therefore, and although in the case of the η = 1 specimen the predicted mode mix variation is very similar for both approaches; there is a difference between the predictions of the orthotropic rescaling approach and beam theory. As in the case of the beam theory approach, the criterion for the stability of the test is assumed as the negative value of the derivative dG/da. Taking into account Figure 5.26 it is obvious that dG/da is positive for all the considered thickness ratios when constant loads are applied to the specimens. Consequently, the orthotropic rescaling approach also predicts that the MMELS test is unstable when the test is conducted under load control and constant loads are applied to the specimen beam. Therefore, to avoid a critical and unstable extension of the crack for a given delamination length and mode mix, the applied load must not exceed the load that corresponds to the value of critical energy release rate. As in the beam theory case, constant energy release rate is assumed for every mode mix, so the critical load Pc decreases with an increasing crack length. Thus, stable crack propagation during a MMELS test under load control would imply the progressive reduction of the load applied to the specimen beam. Obviously, this would not be possible for the static case. However, under fatigue loading conditions this must be taken into account if load control is to be used. Figure 5.28 shows the predicted variation of the critical load as a function of the delamination length for the different thickness ratios taken into account.
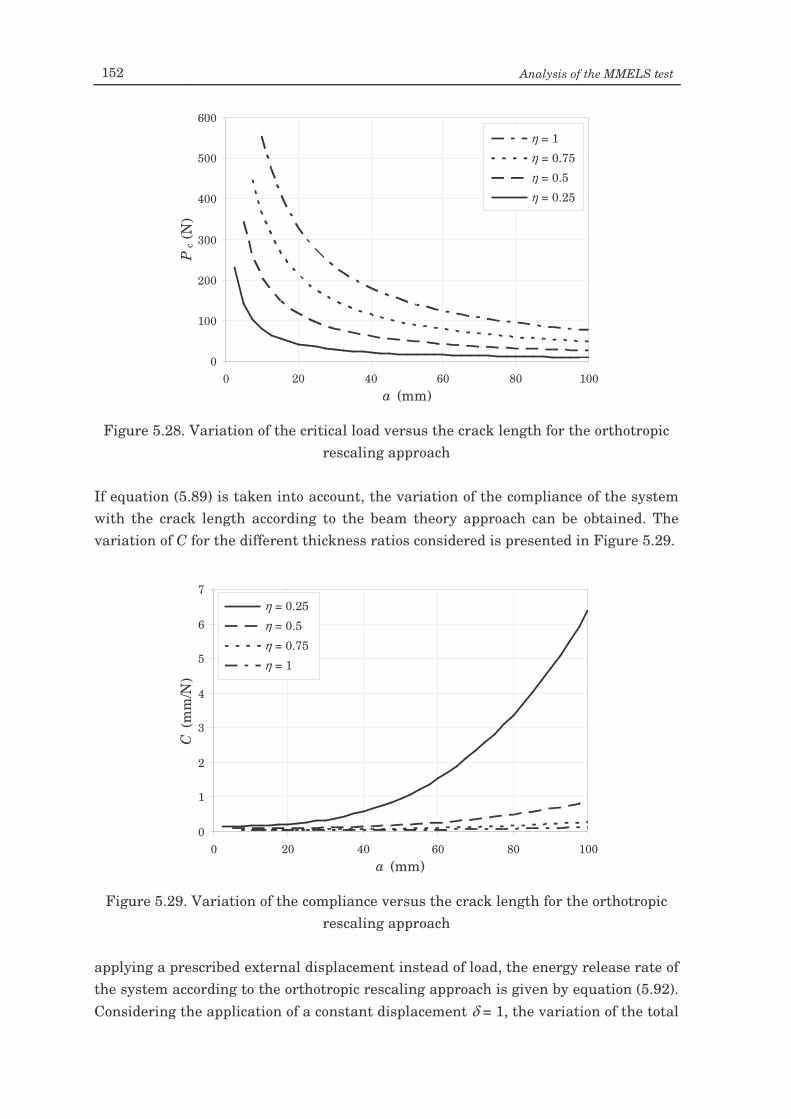
152 Analysis of the MMELS test
Figure 5.28. Variation of the critical load versus the crack length for the orthotropic
rescaling approach If equation (5.89) is taken into account, the variation of the compliance of the system with the crack length according to the beam theory approach can be obtained. The variation of C for the different thickness ratios considered is presented in Figure 5.29.
Figure 5.29. Variation of the compliance versus the crack length for the orthotropic
rescaling approach applying a prescribed external displacement instead of load, the energy release rate of the system according to the orthotropic rescaling approach is given by equation (5.92). Considering the application of a constant displacement δ = 1, the variation of the total
0
1
2
3
4
5
6
7
0 20 40 60 80 100a (mm)
C (m
m/N
)
η = 0.25η = 0.5η = 0.75η = 1
η = 0.25 η = 0.5 η = 0.75 η = 1
0
100
200
300
400
500
600
0 20 40 60 80 100a (mm)
Pc (
N)
η = 1η = 0.75η = 0.5η = 0.25
η = 1 η = 0.75 η = 0.5 η = 0.25
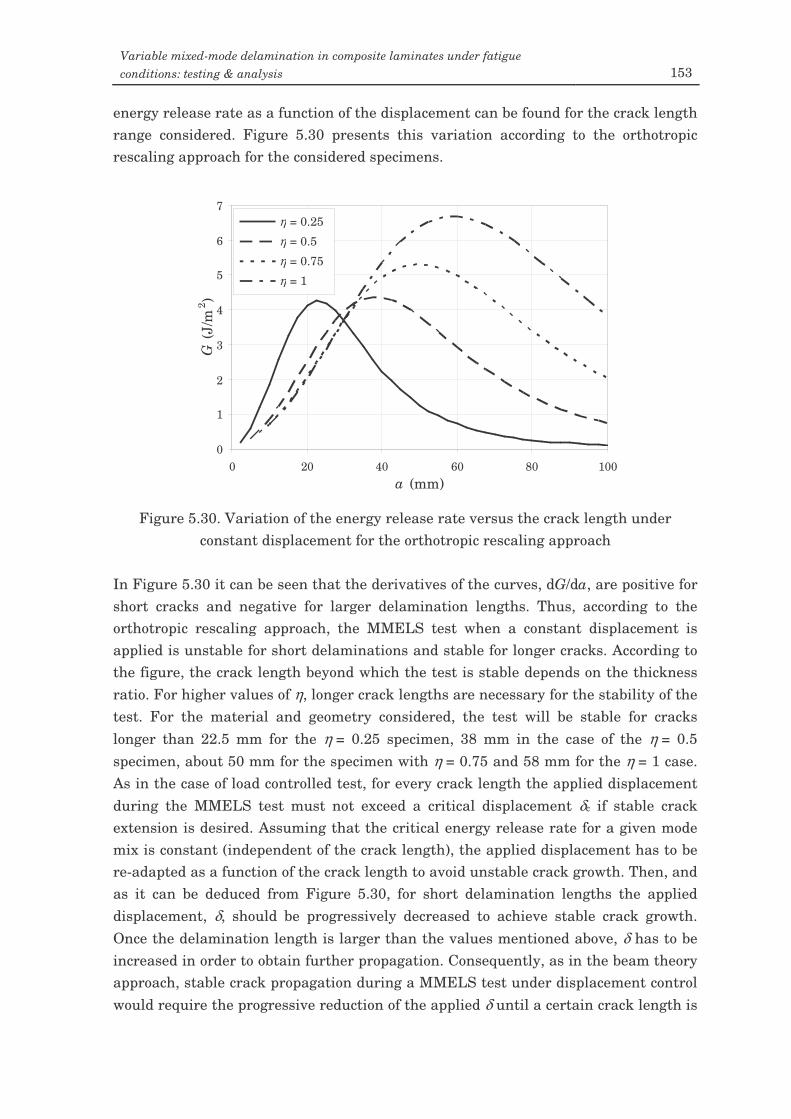
Variable mixed-mode delamination in composite laminates under fatigue conditions: testing & analysis 153
energy release rate as a function of the displacement can be found for the crack length range considered. Figure 5.30 presents this variation according to the orthotropic rescaling approach for the considered specimens.
Figure 5.30. Variation of the energy release rate versus the crack length under
constant displacement for the orthotropic rescaling approach In Figure 5.30 it can be seen that the derivatives of the curves, dG/da, are positive for short cracks and negative for larger delamination lengths. Thus, according to the orthotropic rescaling approach, the MMELS test when a constant displacement is applied is unstable for short delaminations and stable for longer cracks. According to the figure, the crack length beyond which the test is stable depends on the thickness ratio. For higher values of η, longer crack lengths are necessary for the stability of the test. For the material and geometry considered, the test will be stable for cracks longer than 22.5 mm for the η = 0.25 specimen, 38 mm in the case of the η = 0.5 specimen, about 50 mm for the specimen with η = 0.75 and 58 mm for the η = 1 case. As in the case of load controlled test, for every crack length the applied displacement during the MMELS test must not exceed a critical displacement δc if stable crack extension is desired. Assuming that the critical energy release rate for a given mode mix is constant (independent of the crack length), the applied displacement has to be re-adapted as a function of the crack length to avoid unstable crack growth. Then, and as it can be deduced from Figure 5.30, for short delamination lengths the applied displacement, δ, should be progressively decreased to achieve stable crack growth. Once the delamination length is larger than the values mentioned above, δ has to be increased in order to obtain further propagation. Consequently, as in the beam theory approach, stable crack propagation during a MMELS test under displacement control would require the progressive reduction of the applied δ until a certain crack length is
0
1
2
3
4
5
6
7
0 20 40 60 80 100a (mm)
G (J
/m2 )
η = 0.25η = 0.5η = 0.75η = 1
η = 0.25 η = 0.5 η = 0.75 η = 1
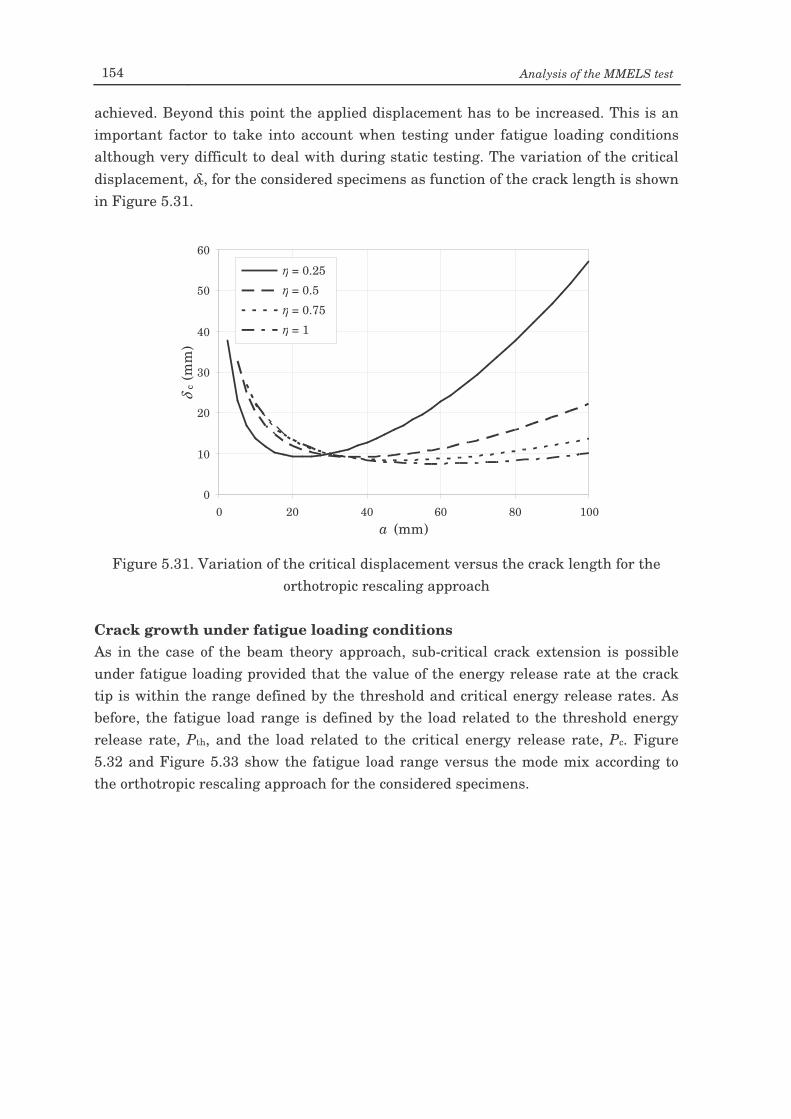
154 Analysis of the MMELS test
achieved. Beyond this point the applied displacement has to be increased. This is an important factor to take into account when testing under fatigue loading conditions although very difficult to deal with during static testing. The variation of the critical displacement, δc, for the considered specimens as function of the crack length is shown in Figure 5.31.
Figure 5.31. Variation of the critical displacement versus the crack length for the
orthotropic rescaling approach Crack growth under fatigue loading conditions As in the case of the beam theory approach, sub-critical crack extension is possible under fatigue loading provided that the value of the energy release rate at the crack tip is within the range defined by the threshold and critical energy release rates. As before, the fatigue load range is defined by the load related to the threshold energy release rate, Pth, and the load related to the critical energy release rate, Pc. Figure 5.32 and Figure 5.33 show the fatigue load range versus the mode mix according to the orthotropic rescaling approach for the considered specimens.
0
10
20
30
40
50
60
0 20 40 60 80 100a (mm)
δc (
mm
)
η = 0.25η = 0.5η = 0.75η = 1
η = 0.25 η = 0.5 η = 0.75 η = 1
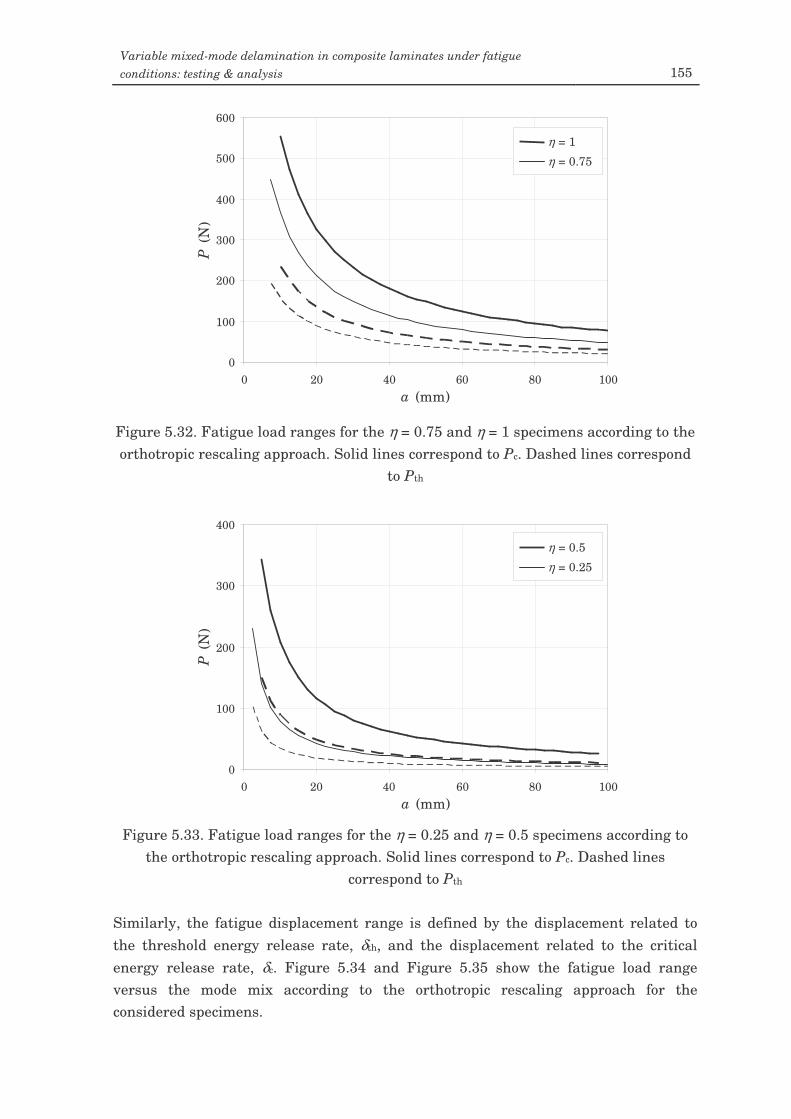
Variable mixed-mode delamination in composite laminates under fatigue conditions: testing & analysis 155
Figure 5.32. Fatigue load ranges for the η = 0.75 and η = 1 specimens according to the orthotropic rescaling approach. Solid lines correspond to Pc. Dashed lines correspond
to Pth
Figure 5.33. Fatigue load ranges for the η = 0.25 and η = 0.5 specimens according to
the orthotropic rescaling approach. Solid lines correspond to Pc. Dashed lines correspond to Pth
Similarly, the fatigue displacement range is defined by the displacement related to the threshold energy release rate, δth, and the displacement related to the critical energy release rate, δc. Figure 5.34 and Figure 5.35 show the fatigue load range versus the mode mix according to the orthotropic rescaling approach for the considered specimens.
0
100
200
300
400
500
600
0 20 40 60 80 100a (mm)
P (N
)
η = 1η = 0.75
η = 1 η = 0.75
0
100
200
300
400
0 20 40 60 80 100a (mm)
P (N
)
η = 0.5η = 0.25
η = 0.5 η = 0.25
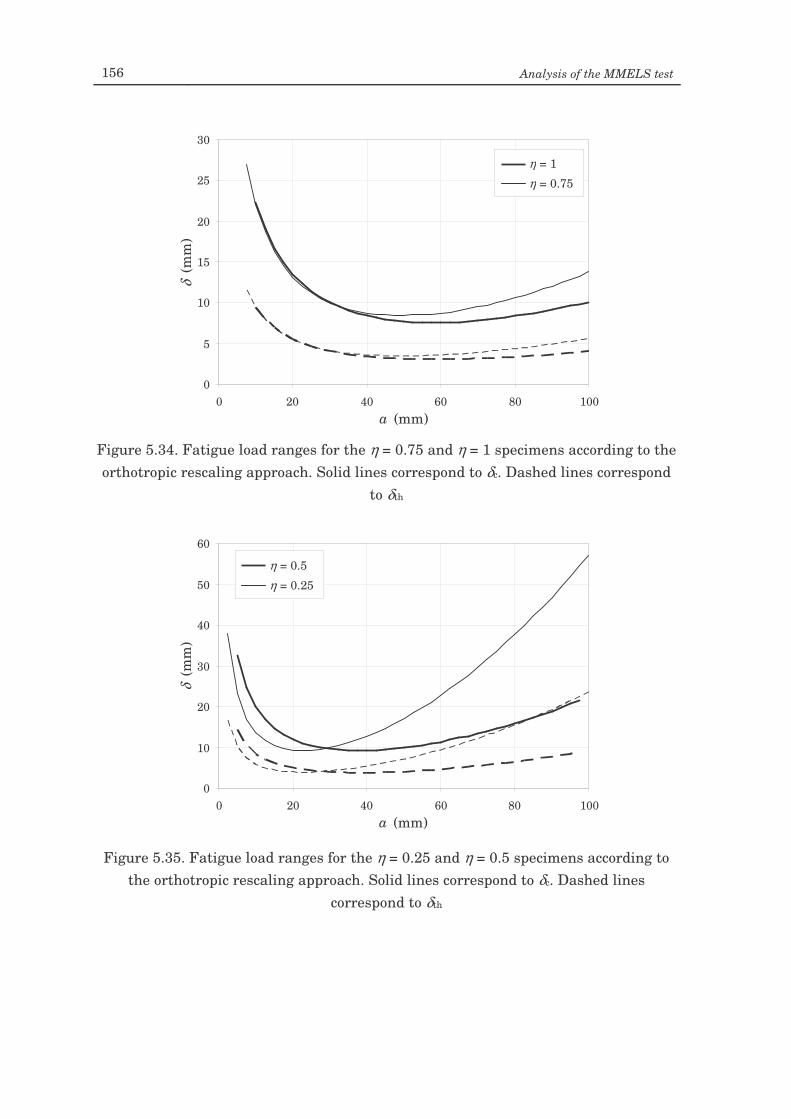
156 Analysis of the MMELS test
Figure 5.34. Fatigue load ranges for the η = 0.75 and η = 1 specimens according to the orthotropic rescaling approach. Solid lines correspond to δc. Dashed lines correspond
to δth
Figure 5.35. Fatigue load ranges for the η = 0.25 and η = 0.5 specimens according to
the orthotropic rescaling approach. Solid lines correspond to δc. Dashed lines correspond to δth
0
5
10
15
20
25
30
0 20 40 60 80 100a (mm)
δ (m
m)
η = 1η = 0.75
η = 1 η = 0.75
0
10
20
30
40
50
60
0 20 40 60 80 100a (mm)
δ (m
m)
η = 0.5η = 0.25η = 0.5 η = 0.25
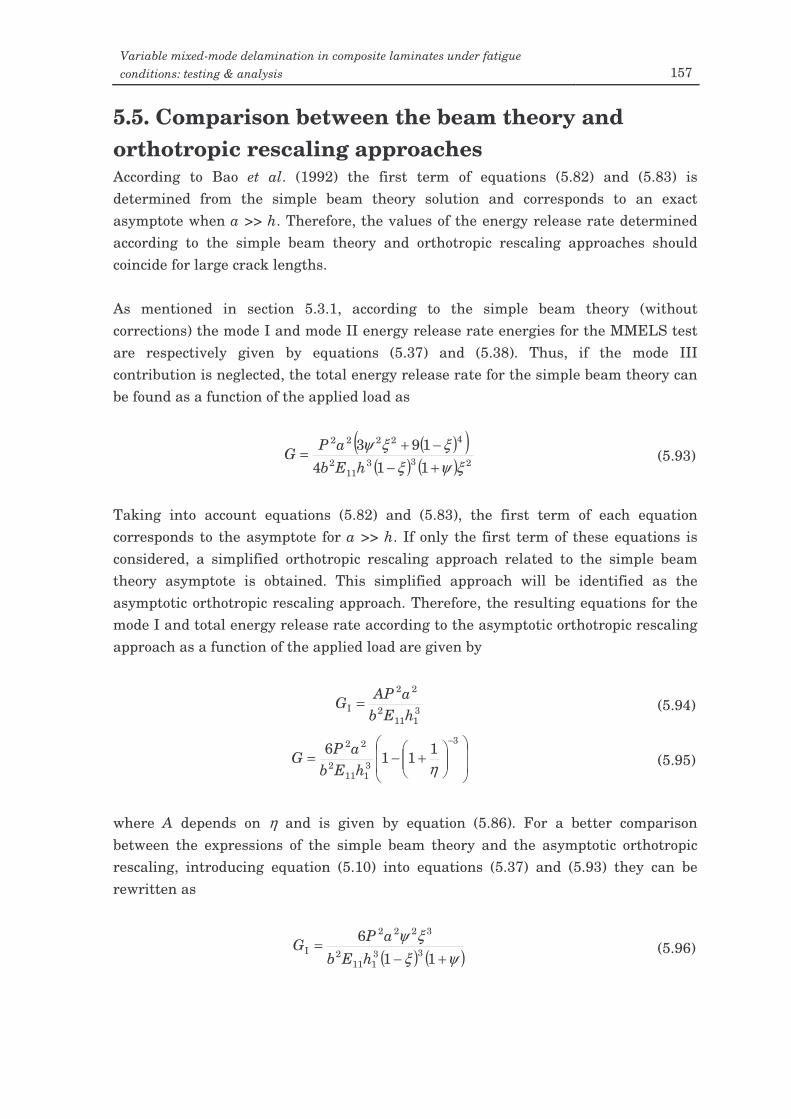
Variable mixed-mode delamination in composite laminates under fatigue conditions: testing & analysis 157
5.5. Comparison between the beam theory and orthotropic rescaling approaches According to Bao et al. (1992) the first term of equations (5.82) and (5.83) is determined from the simple beam theory solution and corresponds to an exact asymptote when a >> h. Therefore, the values of the energy release rate determined according to the simple beam theory and orthotropic rescaling approaches should coincide for large crack lengths. As mentioned in section 5.3.1, according to the simple beam theory (without corrections) the mode I and mode II energy release rate energies for the MMELS test are respectively given by equations (5.37) and (5.38). Thus, if the mode III contribution is neglected, the total energy release rate for the simple beam theory can be found as a function of the applied load as
( )( )( ) ( ) 233
112
42222
114193
ξψξξξψ
+−−+=
hEbaPG (5.93)
Taking into account equations (5.82) and (5.83), the first term of each equation corresponds to the asymptote for a >> h. If only the first term of these equations is considered, a simplified orthotropic rescaling approach related to the simple beam theory asymptote is obtained. This simplified approach will be identified as the asymptotic orthotropic rescaling approach. Therefore, the resulting equations for the mode I and total energy release rate according to the asymptotic orthotropic rescaling approach as a function of the applied load are given by
3111
2
22
I hEbaAPG = (5.94)
+−=
−3
3111
2
22 1116ηhEb
aPG (5.95)
where A depends on η and is given by equation (5.86). For a better comparison between the expressions of the simple beam theory and the asymptotic orthotropic rescaling, introducing equation (5.10) into equations (5.37) and (5.93) they can be rewritten as
( ) ( )ψξξψ
+−=
116
33111
2
3222
IhEb
aPG (5.96)
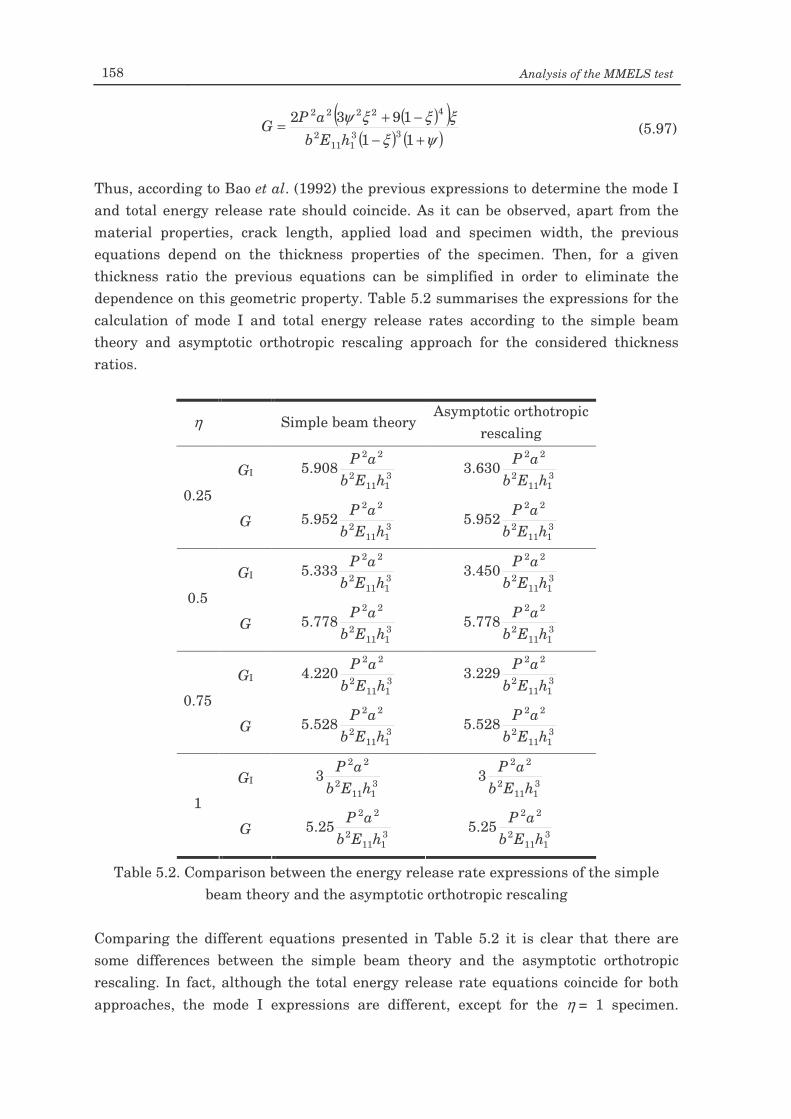
158 Analysis of the MMELS test
( )( )( ) ( )ψξ
ξξξψ+−−+=
111932
33111
2
42222
hEbaPG (5.97)
Thus, according to Bao et al. (1992) the previous expressions to determine the mode I and total energy release rate should coincide. As it can be observed, apart from the material properties, crack length, applied load and specimen width, the previous equations depend on the thickness properties of the specimen. Then, for a given thickness ratio the previous equations can be simplified in order to eliminate the dependence on this geometric property. Table 5.2 summarises the expressions for the calculation of mode I and total energy release rates according to the simple beam theory and asymptotic orthotropic rescaling approach for the considered thickness ratios.
η Simple beam theory Asymptotic orthotropic
rescaling
GI 3111
2
22
908.5hEb
aP 3111
2
22
630.3hEb
aP
0.25
G 3111
2
22
952.5hEb
aP 3111
2
22
952.5hEb
aP
GI 3111
2
22
333.5hEb
aP 3111
2
22
450.3hEb
aP
0.5
G 3111
2
22
778.5hEb
aP 3111
2
22
778.5hEb
aP
GI 3111
2
22
220.4hEb
aP 3111
2
22
229.3hEb
aP
0.75
G 3111
2
22
528.5hEb
aP 3111
2
22
528.5hEb
aP
GI 3111
2
22
3hEb
aP 3111
2
22
3hEb
aP
1
G 3111
2
22
25.5hEb
aP 3111
2
22
25.5hEb
aP
Table 5.2. Comparison between the energy release rate expressions of the simple beam theory and the asymptotic orthotropic rescaling
Comparing the different equations presented in Table 5.2 it is clear that there are some differences between the simple beam theory and the asymptotic orthotropic rescaling. In fact, although the total energy release rate equations coincide for both approaches, the mode I expressions are different, except for the η = 1 specimen.
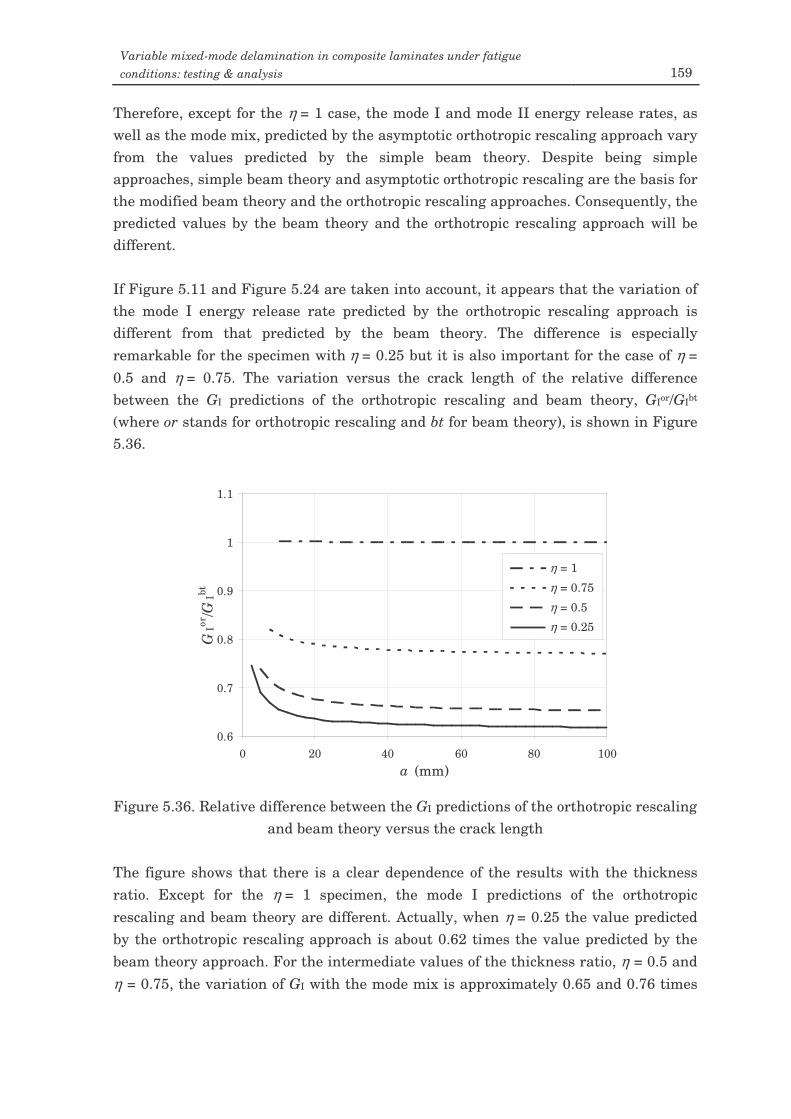
Variable mixed-mode delamination in composite laminates under fatigue conditions: testing & analysis 159
Therefore, except for the η = 1 case, the mode I and mode II energy release rates, as well as the mode mix, predicted by the asymptotic orthotropic rescaling approach vary from the values predicted by the simple beam theory. Despite being simple approaches, simple beam theory and asymptotic orthotropic rescaling are the basis for the modified beam theory and the orthotropic rescaling approaches. Consequently, the predicted values by the beam theory and the orthotropic rescaling approach will be different. If Figure 5.11 and Figure 5.24 are taken into account, it appears that the variation of the mode I energy release rate predicted by the orthotropic rescaling approach is different from that predicted by the beam theory. The difference is especially remarkable for the specimen with η = 0.25 but it is also important for the case of η = 0.5 and η = 0.75. The variation versus the crack length of the relative difference between the GI predictions of the orthotropic rescaling and beam theory, GIor/GIbt
(where or stands for orthotropic rescaling and bt for beam theory), is shown in Figure 5.36.
Figure 5.36. Relative difference between the GI predictions of the orthotropic rescaling
and beam theory versus the crack length The figure shows that there is a clear dependence of the results with the thickness ratio. Except for the η = 1 specimen, the mode I predictions of the orthotropic rescaling and beam theory are different. Actually, when η = 0.25 the value predicted by the orthotropic rescaling approach is about 0.62 times the value predicted by the beam theory approach. For the intermediate values of the thickness ratio, η = 0.5 and η = 0.75, the variation of GI with the mode mix is approximately 0.65 and 0.76 times
0.6
0.7
0.8
0.9
1
1.1
0 20 40 60 80 100a (mm)
GIor
/GIbt
η = 1η = 0.75η = 0.5η = 0.25
η = 1 η = 0.75 η = 0.5 η = 0.25
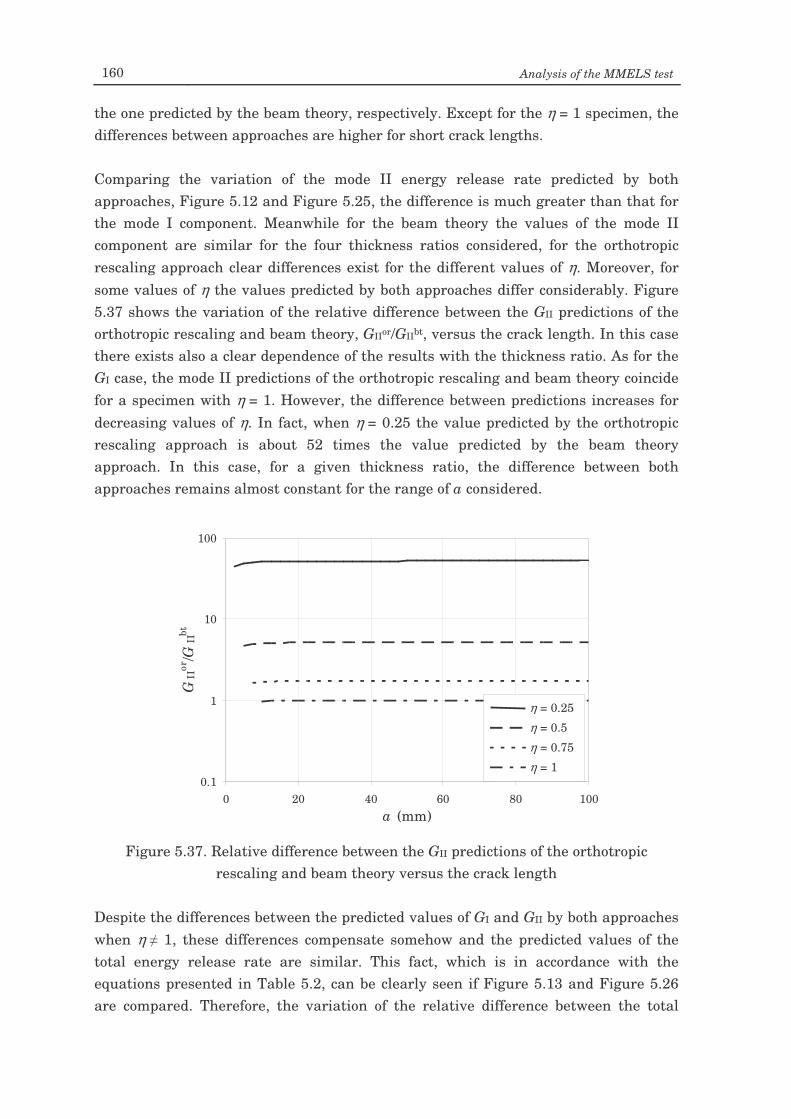
160 Analysis of the MMELS test
the one predicted by the beam theory, respectively. Except for the η = 1 specimen, the differences between approaches are higher for short crack lengths. Comparing the variation of the mode II energy release rate predicted by both approaches, Figure 5.12 and Figure 5.25, the difference is much greater than that for the mode I component. Meanwhile for the beam theory the values of the mode II component are similar for the four thickness ratios considered, for the orthotropic rescaling approach clear differences exist for the different values of η. Moreover, for some values of η the values predicted by both approaches differ considerably. Figure 5.37 shows the variation of the relative difference between the GII predictions of the orthotropic rescaling and beam theory, GIIor/GIIbt, versus the crack length. In this case there exists also a clear dependence of the results with the thickness ratio. As for the GI case, the mode II predictions of the orthotropic rescaling and beam theory coincide for a specimen with η = 1. However, the difference between predictions increases for decreasing values of η. In fact, when η = 0.25 the value predicted by the orthotropic rescaling approach is about 52 times the value predicted by the beam theory approach. In this case, for a given thickness ratio, the difference between both approaches remains almost constant for the range of a considered.
Figure 5.37. Relative difference between the GII predictions of the orthotropic
rescaling and beam theory versus the crack length Despite the differences between the predicted values of GI and GII by both approaches when η 1, these differences compensate somehow and the predicted values of the total energy release rate are similar. This fact, which is in accordance with the equations presented in Table 5.2, can be clearly seen if Figure 5.13 and Figure 5.26 are compared. Therefore, the variation of the relative difference between the total
0.1
1
10
100
0 20 40 60 80 100a (mm)
GII
or/G
IIbt
η = 0.25η = 0.5η = 0.75η = 1
η = 0.25 η = 0.5 η = 0.75 η = 1
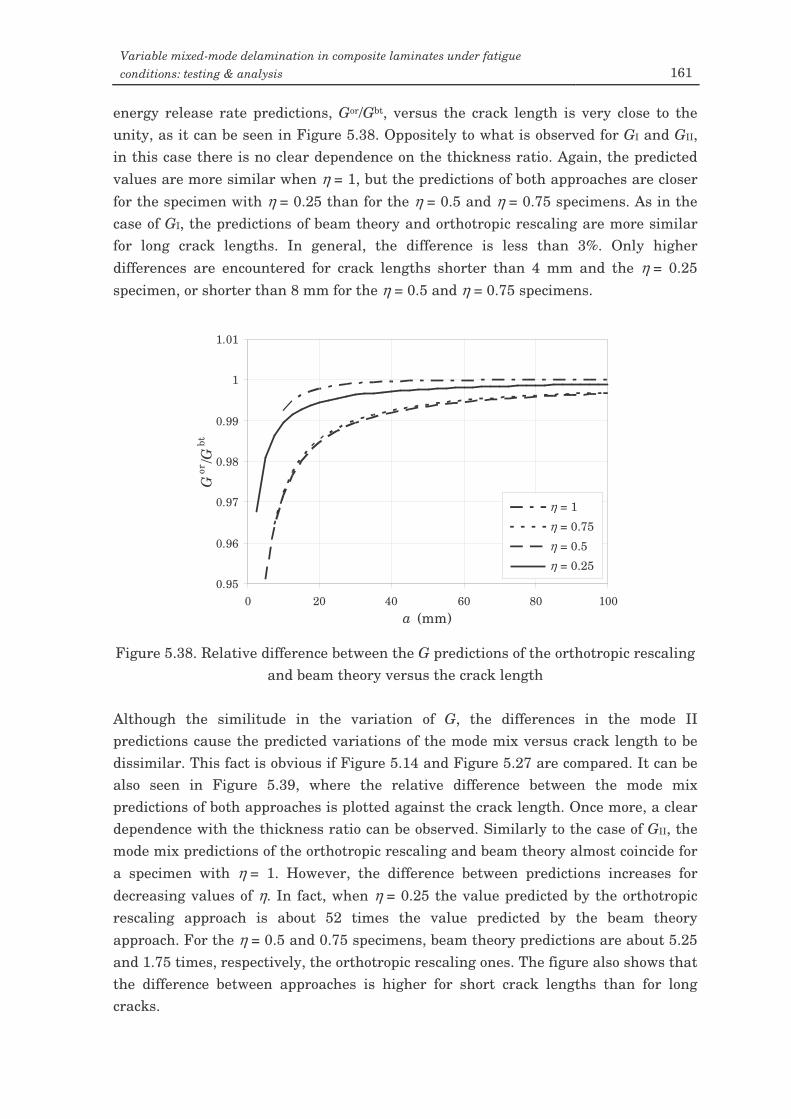
Variable mixed-mode delamination in composite laminates under fatigue conditions: testing & analysis 161
energy release rate predictions, Gor/Gbt, versus the crack length is very close to the unity, as it can be seen in Figure 5.38. Oppositely to what is observed for GI and GII, in this case there is no clear dependence on the thickness ratio. Again, the predicted values are more similar when η = 1, but the predictions of both approaches are closer for the specimen with η = 0.25 than for the η = 0.5 and η = 0.75 specimens. As in the case of GI, the predictions of beam theory and orthotropic rescaling are more similar for long crack lengths. In general, the difference is less than 3%. Only higher differences are encountered for crack lengths shorter than 4 mm and the η = 0.25 specimen, or shorter than 8 mm for the η = 0.5 and η = 0.75 specimens.
Figure 5.38. Relative difference between the G predictions of the orthotropic rescaling
and beam theory versus the crack length Although the similitude in the variation of G, the differences in the mode II predictions cause the predicted variations of the mode mix versus crack length to be dissimilar. This fact is obvious if Figure 5.14 and Figure 5.27 are compared. It can be also seen in Figure 5.39, where the relative difference between the mode mix predictions of both approaches is plotted against the crack length. Once more, a clear dependence with the thickness ratio can be observed. Similarly to the case of GII, the mode mix predictions of the orthotropic rescaling and beam theory almost coincide for a specimen with η = 1. However, the difference between predictions increases for decreasing values of η. In fact, when η = 0.25 the value predicted by the orthotropic rescaling approach is about 52 times the value predicted by the beam theory approach. For the η = 0.5 and 0.75 specimens, beam theory predictions are about 5.25 and 1.75 times, respectively, the orthotropic rescaling ones. The figure also shows that the difference between approaches is higher for short crack lengths than for long cracks.
0.95
0.96
0.97
0.98
0.99
1
1.01
0 20 40 60 80 100a (mm)
Gor
/Gbt
η = 1η = 0.75η = 0.5η = 0.25
η = 1 η = 0.75 η = 0.5 η = 0.25
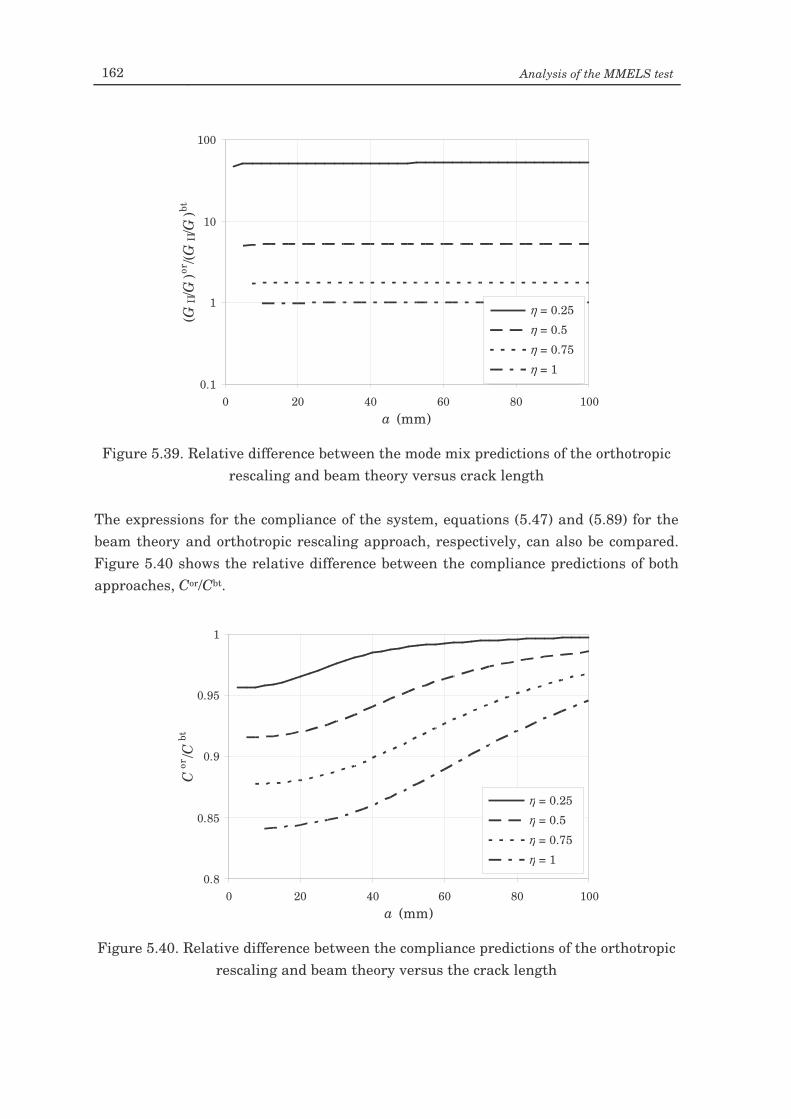
162 Analysis of the MMELS test
Figure 5.39. Relative difference between the mode mix predictions of the orthotropic
rescaling and beam theory versus crack length The expressions for the compliance of the system, equations (5.47) and (5.89) for the beam theory and orthotropic rescaling approach, respectively, can also be compared. Figure 5.40 shows the relative difference between the compliance predictions of both approaches, Cor/Cbt.
Figure 5.40. Relative difference between the compliance predictions of the orthotropic
rescaling and beam theory versus the crack length
0.8
0.85
0.9
0.95
1
0 20 40 60 80 100a (mm)
Cor
/Cbt
η = 0.25η = 0.5η = 0.75η = 1
η = 0.25 η = 0.5 η = 0.75 η = 1
0.1
1
10
100
0 20 40 60 80 100a (mm)
(GII/G
)or/(G
II/G
)bt
η = 0.25η = 0.5η = 0.75η = 1
η = 0.25 η = 0.5 η = 0.75 η = 1
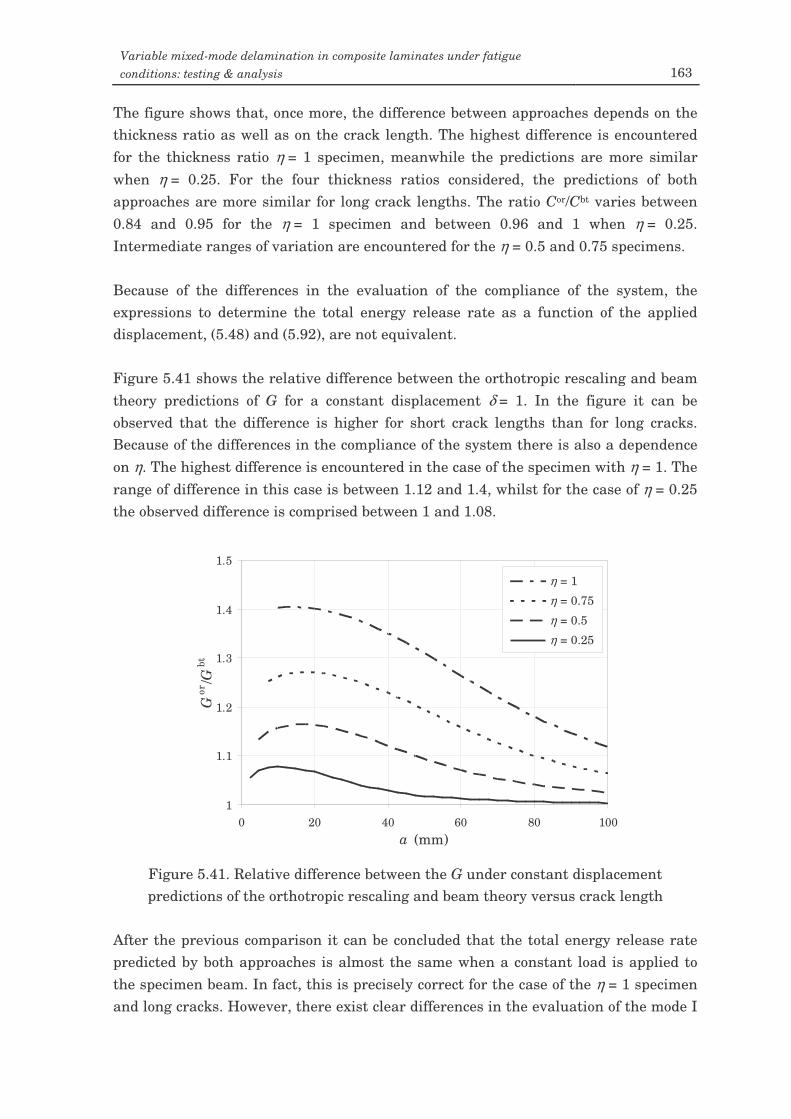
Variable mixed-mode delamination in composite laminates under fatigue conditions: testing & analysis 163
The figure shows that, once more, the difference between approaches depends on the thickness ratio as well as on the crack length. The highest difference is encountered for the thickness ratio η = 1 specimen, meanwhile the predictions are more similar when η = 0.25. For the four thickness ratios considered, the predictions of both approaches are more similar for long crack lengths. The ratio Cor/Cbt varies between 0.84 and 0.95 for the η = 1 specimen and between 0.96 and 1 when η = 0.25. Intermediate ranges of variation are encountered for the η = 0.5 and 0.75 specimens. Because of the differences in the evaluation of the compliance of the system, the expressions to determine the total energy release rate as a function of the applied displacement, (5.48) and (5.92), are not equivalent. Figure 5.41 shows the relative difference between the orthotropic rescaling and beam theory predictions of G for a constant displacement δ = 1. In the figure it can be observed that the difference is higher for short crack lengths than for long cracks. Because of the differences in the compliance of the system there is also a dependence on η. The highest difference is encountered in the case of the specimen with η = 1. The range of difference in this case is between 1.12 and 1.4, whilst for the case of η = 0.25 the observed difference is comprised between 1 and 1.08.
Figure 5.41. Relative difference between the G under constant displacement predictions of the orthotropic rescaling and beam theory versus crack length
After the previous comparison it can be concluded that the total energy release rate predicted by both approaches is almost the same when a constant load is applied to the specimen beam. In fact, this is precisely correct for the case of the η = 1 specimen and long cracks. However, there exist clear differences in the evaluation of the mode I
1
1.1
1.2
1.3
1.4
1.5
0 20 40 60 80 100a (mm)
Gor
/Gbt
η = 1η = 0.75η = 0.5η = 0.25
η = 1 η = 0.75 η = 0.5 η = 0.25
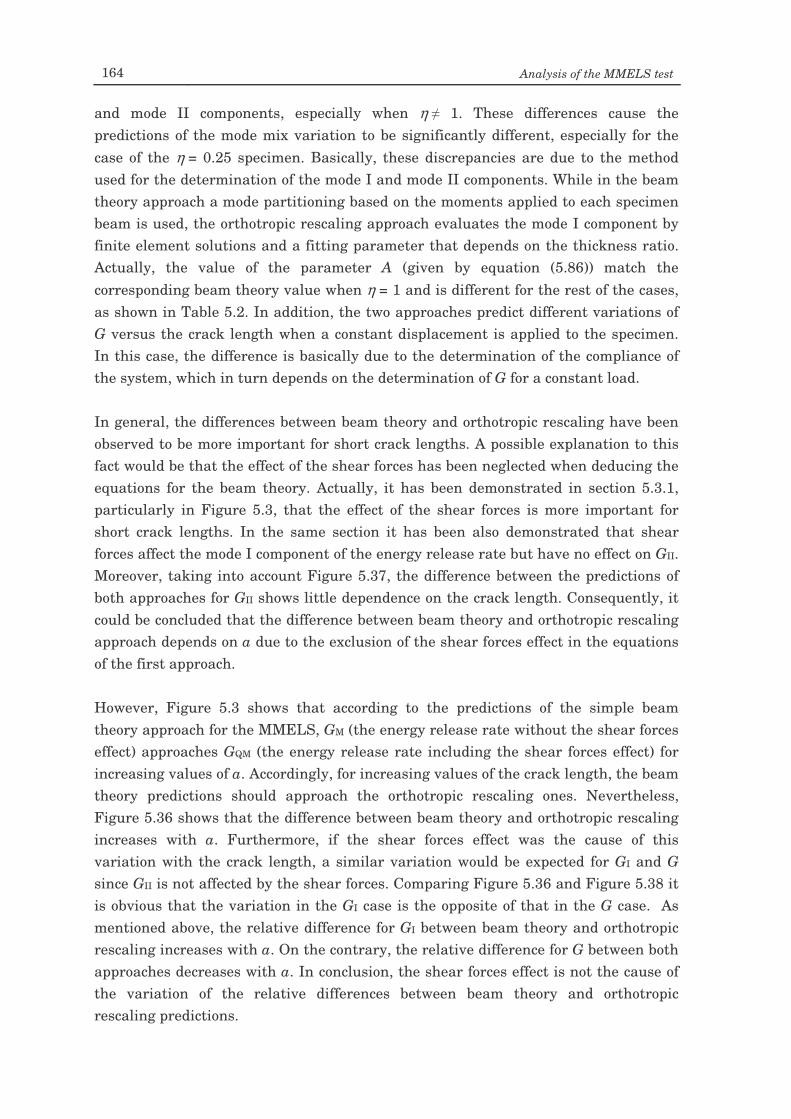
164 Analysis of the MMELS test
and mode II components, especially when η 1. These differences cause the predictions of the mode mix variation to be significantly different, especially for the case of the η = 0.25 specimen. Basically, these discrepancies are due to the method used for the determination of the mode I and mode II components. While in the beam theory approach a mode partitioning based on the moments applied to each specimen beam is used, the orthotropic rescaling approach evaluates the mode I component by finite element solutions and a fitting parameter that depends on the thickness ratio. Actually, the value of the parameter A (given by equation (5.86)) match the corresponding beam theory value when η = 1 and is different for the rest of the cases, as shown in Table 5.2. In addition, the two approaches predict different variations of G versus the crack length when a constant displacement is applied to the specimen. In this case, the difference is basically due to the determination of the compliance of the system, which in turn depends on the determination of G for a constant load. In general, the differences between beam theory and orthotropic rescaling have been observed to be more important for short crack lengths. A possible explanation to this fact would be that the effect of the shear forces has been neglected when deducing the equations for the beam theory. Actually, it has been demonstrated in section 5.3.1, particularly in Figure 5.3, that the effect of the shear forces is more important for short crack lengths. In the same section it has been also demonstrated that shear forces affect the mode I component of the energy release rate but have no effect on GII. Moreover, taking into account Figure 5.37, the difference between the predictions of both approaches for GII shows little dependence on the crack length. Consequently, it could be concluded that the difference between beam theory and orthotropic rescaling approach depends on a due to the exclusion of the shear forces effect in the equations of the first approach. However, Figure 5.3 shows that according to the predictions of the simple beam theory approach for the MMELS, GM (the energy release rate without the shear forces effect) approaches GQM (the energy release rate including the shear forces effect) for increasing values of a. Accordingly, for increasing values of the crack length, the beam theory predictions should approach the orthotropic rescaling ones. Nevertheless, Figure 5.36 shows that the difference between beam theory and orthotropic rescaling increases with a. Furthermore, if the shear forces effect was the cause of this variation with the crack length, a similar variation would be expected for GI and G since GII is not affected by the shear forces. Comparing Figure 5.36 and Figure 5.38 it is obvious that the variation in the GI case is the opposite of that in the G case. As mentioned above, the relative difference for GI between beam theory and orthotropic rescaling increases with a. On the contrary, the relative difference for G between both approaches decreases with a. In conclusion, the shear forces effect is not the cause of the variation of the relative differences between beam theory and orthotropic rescaling predictions.
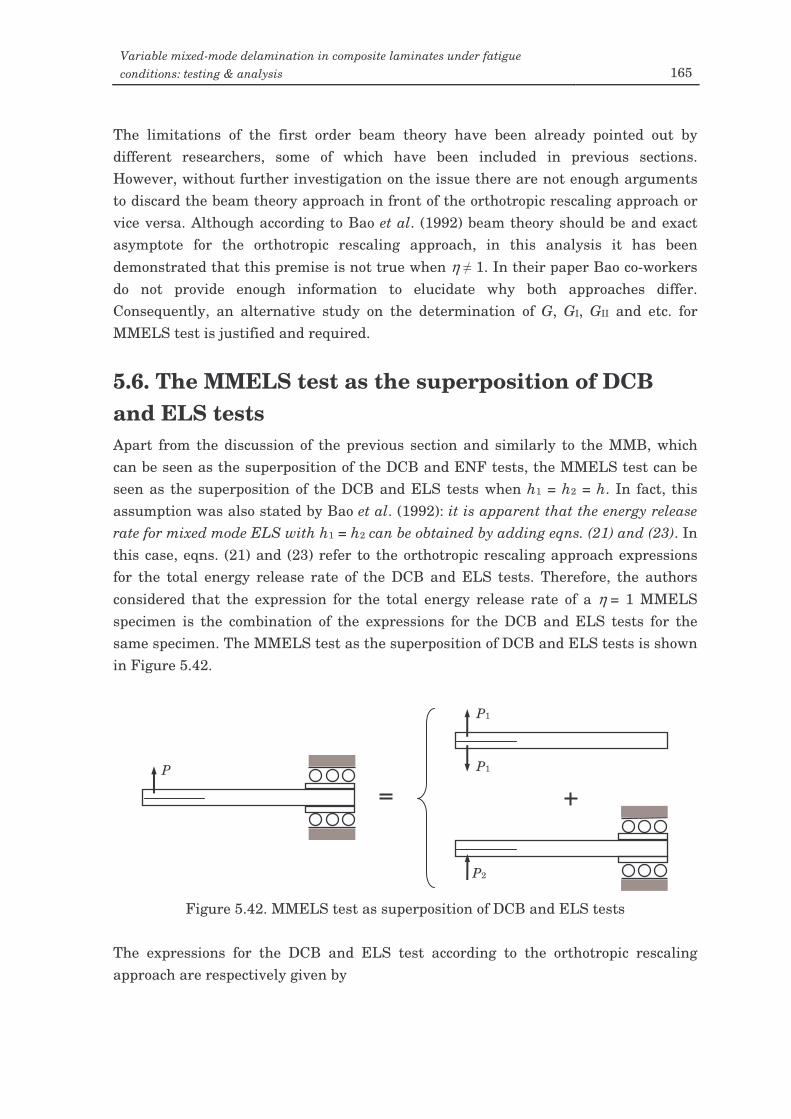
Variable mixed-mode delamination in composite laminates under fatigue conditions: testing & analysis 165
The limitations of the first order beam theory have been already pointed out by different researchers, some of which have been included in previous sections. However, without further investigation on the issue there are not enough arguments to discard the beam theory approach in front of the orthotropic rescaling approach or vice versa. Although according to Bao et al. (1992) beam theory should be and exact asymptote for the orthotropic rescaling approach, in this analysis it has been demonstrated that this premise is not true when η 1. In their paper Bao co-workers do not provide enough information to elucidate why both approaches differ. Consequently, an alternative study on the determination of G, GI, GII and etc. for MMELS test is justified and required.
5.6. The MMELS test as the superposition of DCB and ELS tests Apart from the discussion of the previous section and similarly to the MMB, which can be seen as the superposition of the DCB and ENF tests, the MMELS test can be seen as the superposition of the DCB and ELS tests when h1 = h2 = h. In fact, this assumption was also stated by Bao et al. (1992): it is apparent that the energy release rate for mixed mode ELS with h1 = h2 can be obtained by adding eqns. (21) and (23). In this case, eqns. (21) and (23) refer to the orthotropic rescaling approach expressions for the total energy release rate of the DCB and ELS tests. Therefore, the authors considered that the expression for the total energy release rate of a η = 1 MMELS specimen is the combination of the expressions for the DCB and ELS tests for the same specimen. The MMELS test as the superposition of DCB and ELS tests is shown in Figure 5.42.
Figure 5.42. MMELS test as superposition of DCB and ELS tests
The expressions for the DCB and ELS test according to the orthotropic rescaling approach are respectively given by
P
P1
P2
P1
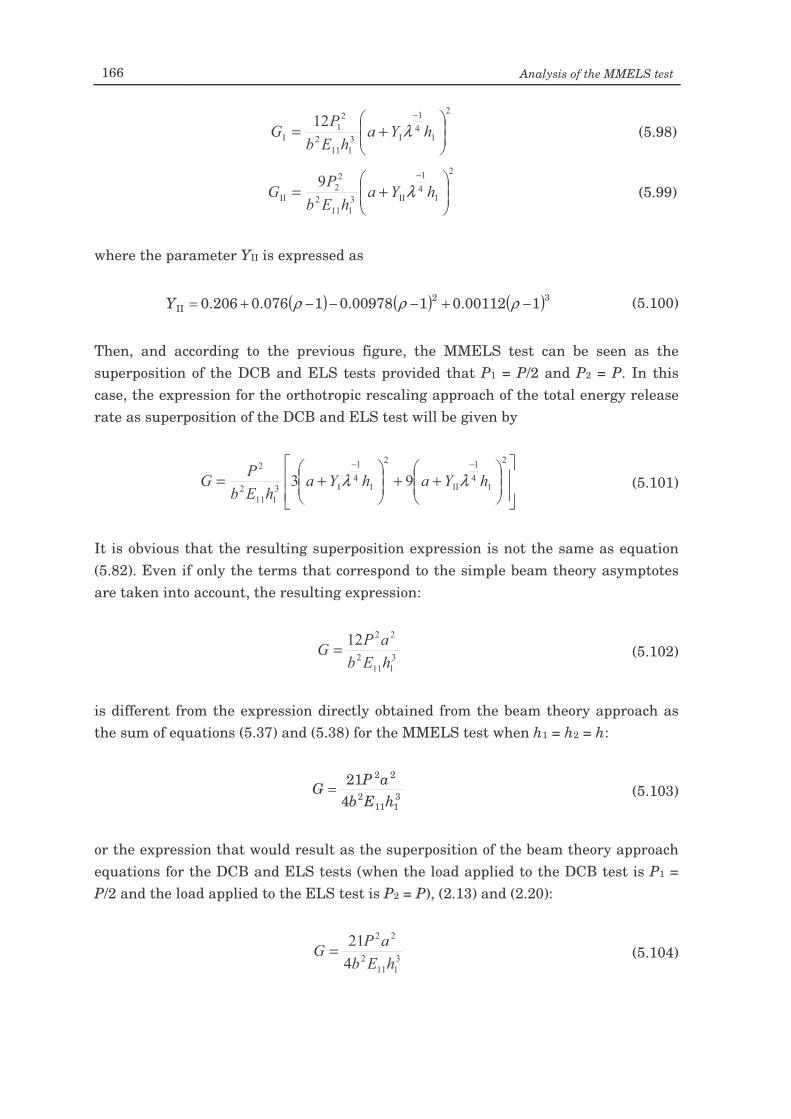
166 Analysis of the MMELS test
+=
−
λ (5.98)
+=
−
λ (5.99)
where the parameter YII is expressed as
( ) ( ) ( )32II 100112.0100978.01076.0206.0 −+−−−+= ρρρY (5.100)
Then, and according to the previous figure, the MMELS test can be seen as the superposition of the DCB and ELS tests provided that P1 = P/2 and P2 = P. In this case, the expression for the orthotropic rescaling approach of the total energy release rate as superposition of the DCB and ELS test will be given by
++
+=
−−
λλ (5.101)
It is obvious that the resulting superposition expression is not the same as equation (5.82). Even if only the terms that correspond to the simple beam theory asymptotes are taken into account, the resulting expression:
= (5.102)
is different from the expression directly obtained from the beam theory approach as the sum of equations (5.37) and (5.38) for the MMELS test when h1 = h2 = h:
3111
2
22
421
hEbaPG = (5.103)
or the expression that would result as the superposition of the beam theory approach equations for the DCB and ELS tests (when the load applied to the DCB test is P1 = P/2 and the load applied to the ELS test is P2 = P), (2.13) and (2.20):
= (5.104)
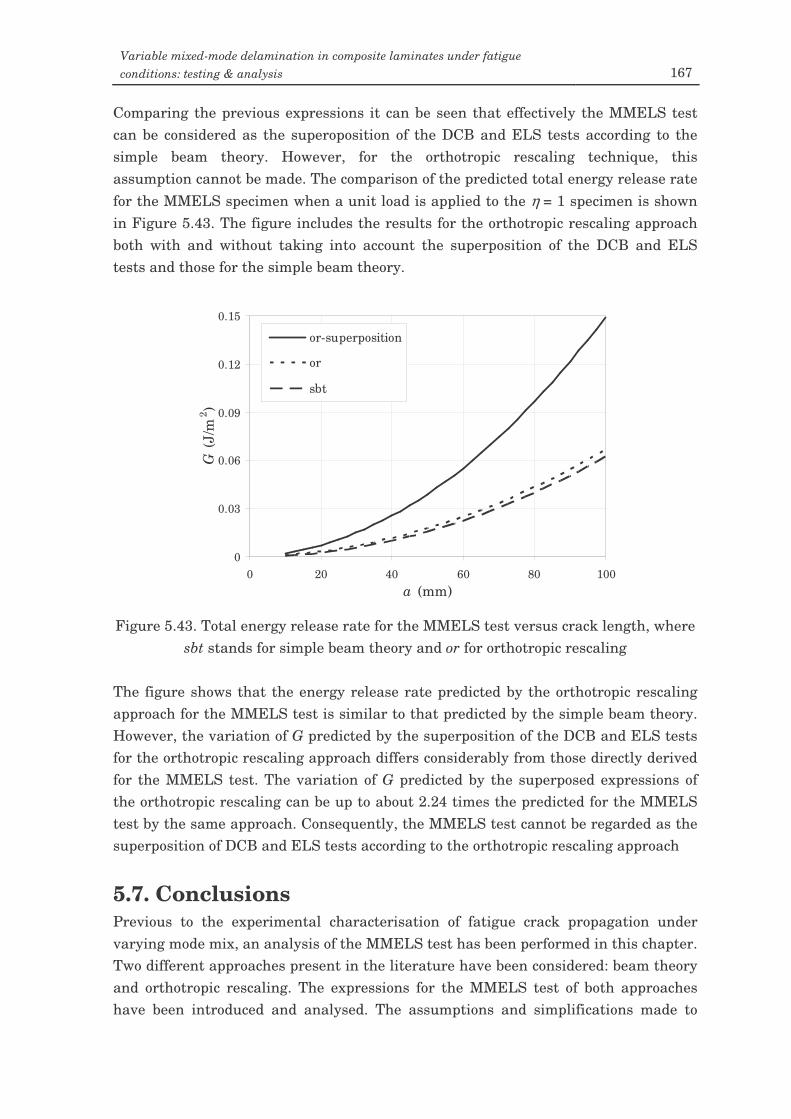
Variable mixed-mode delamination in composite laminates under fatigue conditions: testing & analysis 167
Comparing the previous expressions it can be seen that effectively the MMELS test can be considered as the superoposition of the DCB and ELS tests according to the simple beam theory. However, for the orthotropic rescaling technique, this assumption cannot be made. The comparison of the predicted total energy release rate for the MMELS specimen when a unit load is applied to the η = 1 specimen is shown in Figure 5.43. The figure includes the results for the orthotropic rescaling approach both with and without taking into account the superposition of the DCB and ELS tests and those for the simple beam theory.
0
0.03
0.06
0.09
0.12
0.15
0 20 40 60 80 100a (mm)
G (J
/m2 )
or-superposition
or
sbt
Figure 5.43. Total energy release rate for the MMELS test versus crack length, where
sbt stands for simple beam theory and or for orthotropic rescaling The figure shows that the energy release rate predicted by the orthotropic rescaling approach for the MMELS test is similar to that predicted by the simple beam theory. However, the variation of G predicted by the superposition of the DCB and ELS tests for the orthotropic rescaling approach differs considerably from those directly derived for the MMELS test. The variation of G predicted by the superposed expressions of the orthotropic rescaling can be up to about 2.24 times the predicted for the MMELS test by the same approach. Consequently, the MMELS test cannot be regarded as the superposition of DCB and ELS tests according to the orthotropic rescaling approach
5.7. Conclusions Previous to the experimental characterisation of fatigue crack propagation under varying mode mix, an analysis of the MMELS test has been performed in this chapter. Two different approaches present in the literature have been considered: beam theory and orthotropic rescaling. The expressions for the MMELS test of both approaches have been introduced and analysed. The assumptions and simplifications made to
168 Analysis of the MMELS test
deduce these expressions have been also presented and discussed for both approaches. The predictions for the MMELS test of both approaches have been analysed and a comparison between the beam theory and orthotropic rescaling approaches has been established. After the analysis and comparison, the following deductions can be concluded: • The loading and clamping system considered during the analysis avoid the
inclusion of axial forces in the specimen. Consequently, in the deduction of the beam theory expressions for the energy release rate of the MMELS test, the effect of the axial forces is neglected.
• Similarly, the effect of the shear forces is also neglected in the deduction of the
beam theory expressions. Only bending moments are taken into account to obtain the value of G. The relative error of this assumption has been shown to depend on the thickness ratio and crack length considered. However, for crack lengths longer than 20 mm this error is less than 2% for the four thickness ratios considered.
• It has been already demonstrated in the literature that the modified beam theory
is in better agreement with experimental results than the simple beam theory. Therefore, the expressions of the modified beam theory are considered. In this way, the rotation of the specimen beams at the crack tip is modelled by assuming a larger delamination length. However, in this chapter it has been shown that the effect of the correction factors for non-linear effects, F and N, can be neglected as l1 = l2 = 0.
• The analysis of the expressions of the beam theory and orthotropic rescaling for the
MMELS test has shown that there exist clear differences in the prediction of GI and GII for the thickness ratios considered. Moreover, these differences depend on the value of the thickness ratio. When η = 1, the variations of GI and GII predicted by both approaches are very similar. However, when η 1, the variations of GI and GII predicted by both approaches are very different. These differences are especially important for the η = 0.25 specimen.
• In spite of the differences observed in the variations of GI and GII with the crack
length, the variation of the total energy release rate, G, predicted by both approaches is very similar. Though the maximum difference observed is about 3%, the difference is less than 1.5% for crack lengths longer than 20 mm. In this case, the dependence with the thickness ratio is low.
• It has been shown that the variation of the mode mix with the crack length
predicted by the beam theory depends on the thickness ratio. While the mode mix for the η = 1 specimen varies between 0.335 and 0.416, when η = 0.25 the GII/G
Variable mixed-mode delamination in composite laminates under fatigue conditions: testing & analysis 169
variation is in between 0.005 and 0.007. Even though the variation is very small for the latter case, the mode mix does not remain constant as considered by Kinloch et al. (1993;). Actually, the variation of the mode mix is more important for short crack lengths. The variation of the mode mix with the crack length predicted by the orthotropic rescaling approach shows lower dependence on the thickness ratio. Although the variation of GII/G is more pronounced for short crack lengths, the asymptotic value is approximately 0.4 for all the thickness ratios considered.
• Certain differences have been encountered between beam theory and orthotropic
rescaling when predicting the variation of the compliance of the system with the crack length. These differences are found to depend on the thickness ratio. For the η = 0.25 specimen, the variation of the compliance predicted by both approaches is similar. However, the difference is more important when the thickness ratio increases. Similar considerations apply for the variation of G with a when a constant displacement is applied to the loaded beam of the specimen. In this case, the difference is basically due to the determination of the compliance of the system, which in turn depends on the determination of G for a constant load.
• Bao et al. (1992) affirmed that the first term of the orthotropic rescaling
expressions considered in this analysis are determined from the simple beam theory solution, which corresponds to an exact asymptote when a >> h. However, it has been demonstrated by the comparison of modified beam theory and orthotropic rescaling that there exist clear differences in the estimation of G, especially for the specimens with η 1. The differences between both approaches are mainly due to the difference in the estimation of the mode I and especially mode II energy release rates. Meanwhile both approaches almost coincide in the predicted value of total energy release rate for all the thickness ratios, the relative difference in the predicted values of the mode I and mode II components can be up to 62 and 98%, respectively.
• It has been shown that in general the differences between beam theory and
orthotropic rescaling are more important for short crack lengths. Even though the shear forces effect has been neglected in the deduction of the beam theory equations, the shear forces effect is not the cause of the variation of these differences with the crack length.
• The assumption that the MMELS test can be seen as a superposition of the DCB
and ELS tests (Bao et al., 1992), has been proven to be incorrect. The superposed expressions of the DCB and ELS tests for the MMELS have been deduced and analysed for the beam theory and orthotropic rescaling approaches. The comparison of these expressions showed that the superposition of the DCB and
170 Analysis of the MMELS test
ELS tests is not equivalent to the MMELS test for the orthotropic rescaling approach, although it is correct for the beam theory.
Consequently, it can be stated that beam theory and orthotropic rescaling approaches are not equivalent for the MMELS test, especially when the thickness ratio of the specimen is η 1. Moreover, it can be also said that the MMELS test does not correspond to the superposition of the DCB and ELS tests. Actually, the differences between both approaches are obvious but there are no decisive factors to clarify which one is more accurate. In the present study, the experimental investigation of fatigue crack growth in a unidirectional composite laminate under varying mode mix is carried out using the MMELS test. Therefore, an accurate characterisation of the test is required. To this end, an alternative study on the determination of G, GI, GII and etc. for MMELS test is carried out in the following chapter.
Chapter 6 Analysis of the MMELS test by
means of the VCCT method
6.1. Introduction It has been shown in the previous chapter that there exist some differences between the energy release rate predictions of the beam theory and orthotropic rescaling approaches for the MMELS test. In fact, there are clear differences in the evaluation of the mode I and mode II components, especially when the thickness ratio of the specimen is η 1. These differences cause the predictions of the mode mix variation to differ significantly, especially for the case when the thickness ratio of the specimen is η = 0.25. In addition, the two approaches predict different variations of the compliance of the system, C, versus the crack length. The differences in the compliance prediction result in different values of G when a constant displacement is applied to the specimen. All this discrepancies are basically due to the method used to obtain the mode I and mode II components by each approach. Different researchers have already pointed out the limitations of the first order beam theory. According to Bao et al. (1992) the simple beam theory predictions should be an exact asymptote for the orthotropic rescaling approach. Nevertheless, in the previous chapter it has been proved that for some reason this hypothesis is not accomplished. In their paper, Bao et al. (1992) do not give enough information to elucidate exactly how their model is derived or why both approaches differ. Thus, there is a need of additional investigation on the issue to clarify which of the two approaches, beam theory or orthotropic rescaling, achieve better predictions of the energy release rate components for the MMELS test. As mentioned, a main objective of the present work is the experimental characterisation of fatigue delamination under varying mode mix. To this end, the experimental investigation of fatigue crack growth in a unidirectional composite laminate is carried out using the MMELS test (see Chapter 4 and Chapter 7). Therefore, it is necessary to elucidate which of the two approaches aforementioned is more reliable. With this objective, an alternative study on the determination of G, GI,
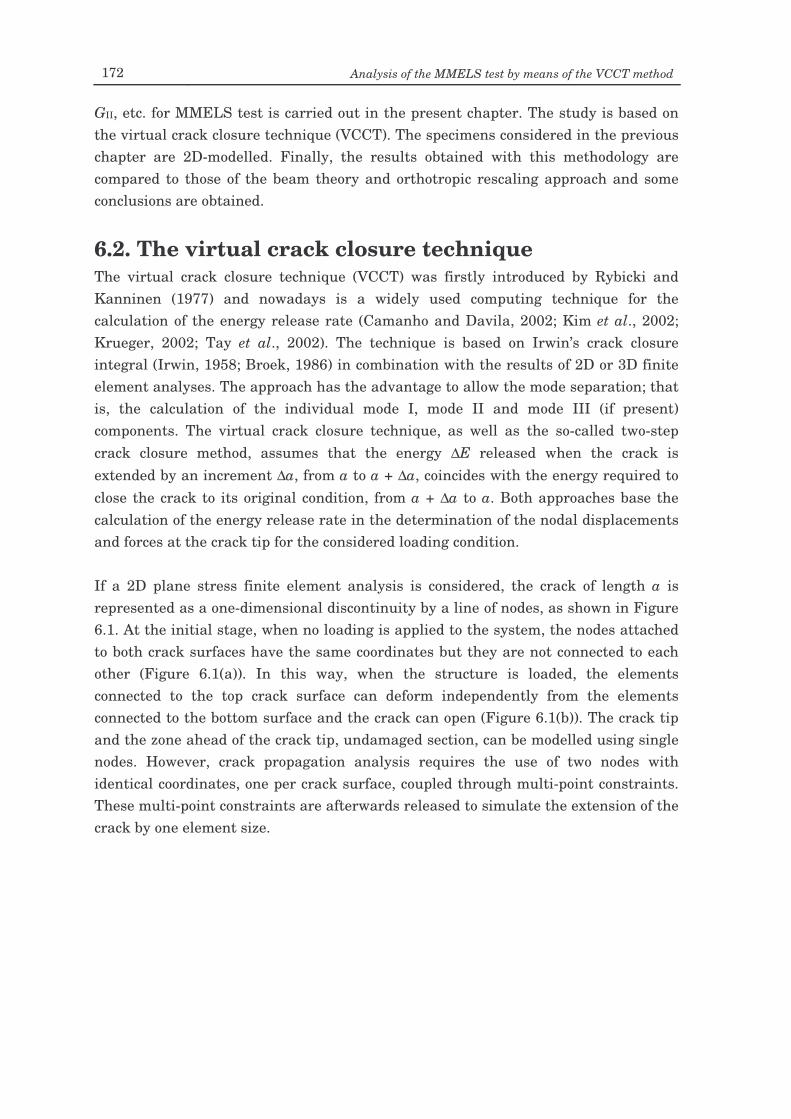
172 Analysis of the MMELS test by means of the VCCT method
GII, etc. for MMELS test is carried out in the present chapter. The study is based on the virtual crack closure technique (VCCT). The specimens considered in the previous chapter are 2D-modelled. Finally, the results obtained with this methodology are compared to those of the beam theory and orthotropic rescaling approach and some conclusions are obtained.
6.2. The virtual crack closure technique The virtual crack closure technique (VCCT) was firstly introduced by Rybicki and Kanninen (1977) and nowadays is a widely used computing technique for the calculation of the energy release rate (Camanho and Davila, 2002; Kim et al., 2002; Krueger, 2002; Tay et al., 2002). The technique is based on Irwin’s crack closure integral (Irwin, 1958; Broek, 1986) in combination with the results of 2D or 3D finite element analyses. The approach has the advantage to allow the mode separation; that is, the calculation of the individual mode I, mode II and mode III (if present) components. The virtual crack closure technique, as well as the so-called two-step crack closure method, assumes that the energy ∆E released when the crack is extended by an increment ∆a, from a to a + ∆a, coincides with the energy required to close the crack to its original condition, from a + ∆a to a. Both approaches base the calculation of the energy release rate in the determination of the nodal displacements and forces at the crack tip for the considered loading condition. If a 2D plane stress finite element analysis is considered, the crack of length a is represented as a one-dimensional discontinuity by a line of nodes, as shown in Figure 6.1. At the initial stage, when no loading is applied to the system, the nodes attached to both crack surfaces have the same coordinates but they are not connected to each other (Figure 6.1(a)). In this way, when the structure is loaded, the elements connected to the top crack surface can deform independently from the elements connected to the bottom surface and the crack can open (Figure 6.1(b)). The crack tip and the zone ahead of the crack tip, undamaged section, can be modelled using single nodes. However, crack propagation analysis requires the use of two nodes with identical coordinates, one per crack surface, coupled through multi-point constraints. These multi-point constraints are afterwards released to simulate the extension of the crack by one element size.
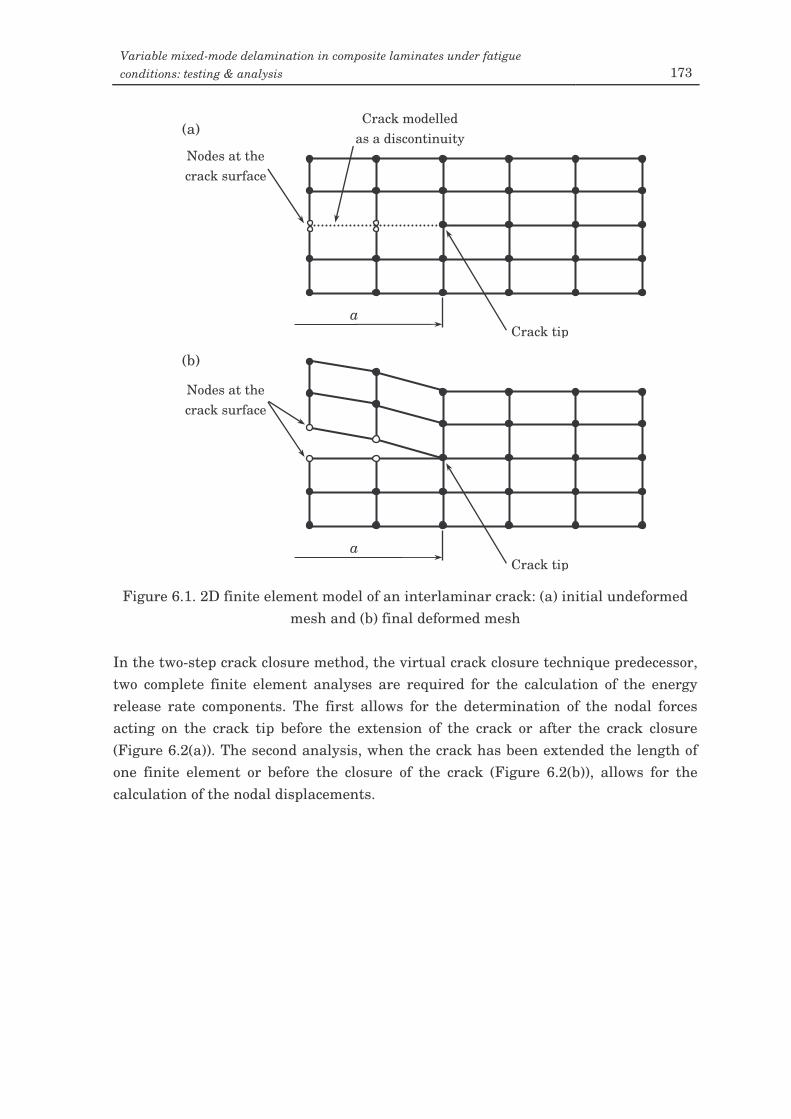
Variable mixed-mode delamination in composite laminates under fatigue conditions: testing & analysis 173
Figure 6.1. 2D finite element model of an interlaminar crack: (a) initial undeformed
mesh and (b) final deformed mesh In the two-step crack closure method, the virtual crack closure technique predecessor, two complete finite element analyses are required for the calculation of the energy release rate components. The first allows for the determination of the nodal forces acting on the crack tip before the extension of the crack or after the crack closure (Figure 6.2(a)). The second analysis, when the crack has been extended the length of one finite element or before the closure of the crack (Figure 6.2(b)), allows for the calculation of the nodal displacements.
a Crack tip
Crack modelled as a discontinuity
Nodes at the crack surface
a Crack tip
Nodes at the crack surface
(a)
(b)
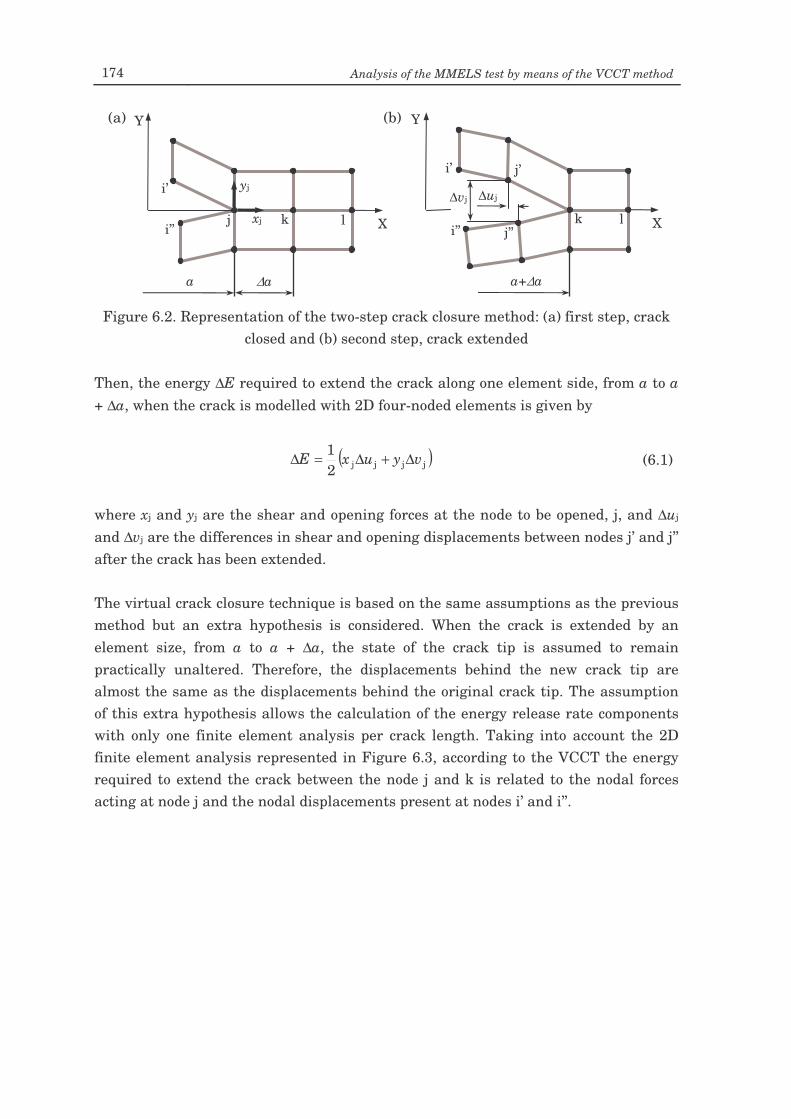
174 Analysis of the MMELS test by means of the VCCT method
Figure 6.2. Representation of the two-step crack closure method: (a) first step, crack
closed and (b) second step, crack extended Then, the energy ∆E required to extend the crack along one element side, from a to a + ∆a, when the crack is modelled with 2D four-noded elements is given by
( )jjjj21 vyuxE ∆+∆=∆ (6.1)
where xj and yj are the shear and opening forces at the node to be opened, j, and ∆uj and ∆vj are the differences in shear and opening displacements between nodes j’ and j’’ after the crack has been extended. The virtual crack closure technique is based on the same assumptions as the previous method but an extra hypothesis is considered. When the crack is extended by an element size, from a to a + ∆a, the state of the crack tip is assumed to remain practically unaltered. Therefore, the displacements behind the new crack tip are almost the same as the displacements behind the original crack tip. The assumption of this extra hypothesis allows the calculation of the energy release rate components with only one finite element analysis per crack length. Taking into account the 2D finite element analysis represented in Figure 6.3, according to the VCCT the energy required to extend the crack between the node j and k is related to the nodal forces acting at node j and the nodal displacements present at nodes i’ and i’’.
a ∆a
X
Y
xj
yj
j k l
i’
i’’ X
∆uj ∆vj
k l
i’
i’’
Y
j’’
j’
a+∆a
(a) (b)
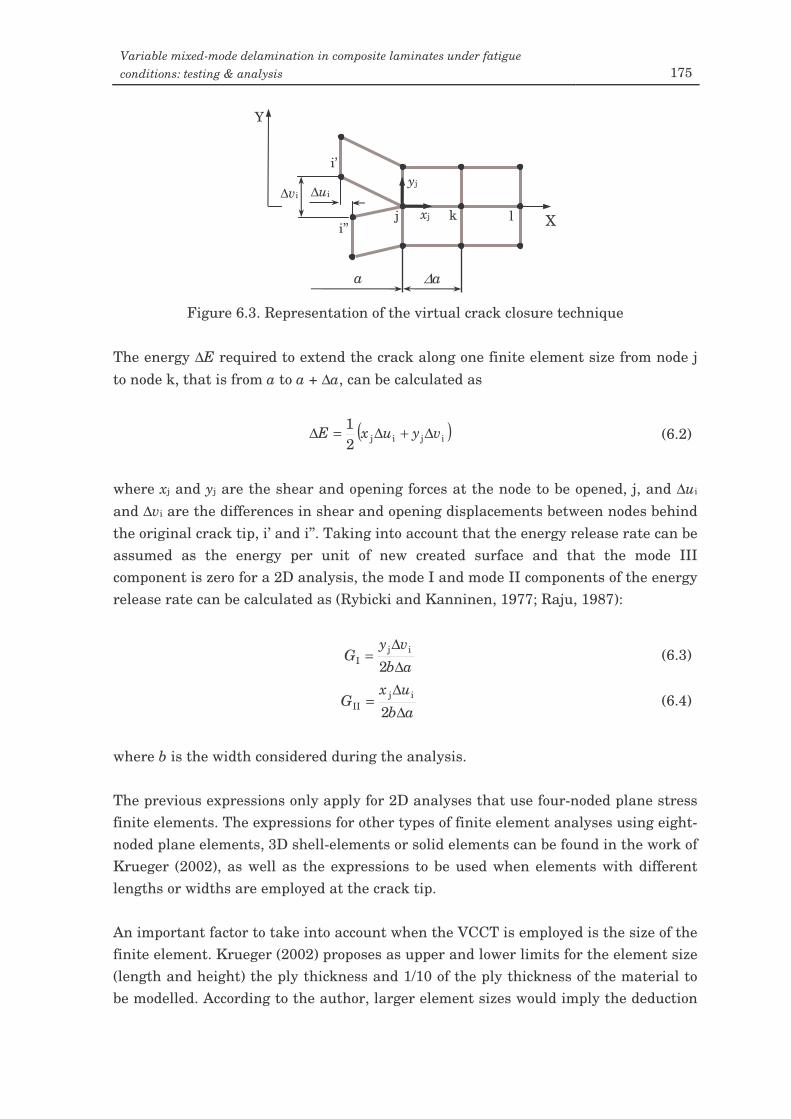
Variable mixed-mode delamination in composite laminates under fatigue conditions: testing & analysis 175
Figure 6.3. Representation of the virtual crack closure technique
The energy ∆E required to extend the crack along one finite element size from node j to node k, that is from a to a + ∆a, can be calculated as
( )ijij21 vyuxE ∆+∆=∆ (6.2)
where xj and yj are the shear and opening forces at the node to be opened, j, and ∆ui and ∆vi are the differences in shear and opening displacements between nodes behind the original crack tip, i’ and i’’. Taking into account that the energy release rate can be assumed as the energy per unit of new created surface and that the mode III component is zero for a 2D analysis, the mode I and mode II components of the energy release rate can be calculated as (Rybicki and Kanninen, 1977; Raju, 1987):
abvy
G∆∆
=2
ijI (6.3)
abux
G∆
∆=
2ij
II (6.4)
where b is the width considered during the analysis. The previous expressions only apply for 2D analyses that use four-noded plane stress finite elements. The expressions for other types of finite element analyses using eight-noded plane elements, 3D shell-elements or solid elements can be found in the work of Krueger (2002), as well as the expressions to be used when elements with different lengths or widths are employed at the crack tip. An important factor to take into account when the VCCT is employed is the size of the finite element. Krueger (2002) proposes as upper and lower limits for the element size (length and height) the ply thickness and 1/10 of the ply thickness of the material to be modelled. According to the author, larger element sizes would imply the deduction
a ∆a
X
Y
xj
yj
j k l
i’
i’’
∆ui ∆vi
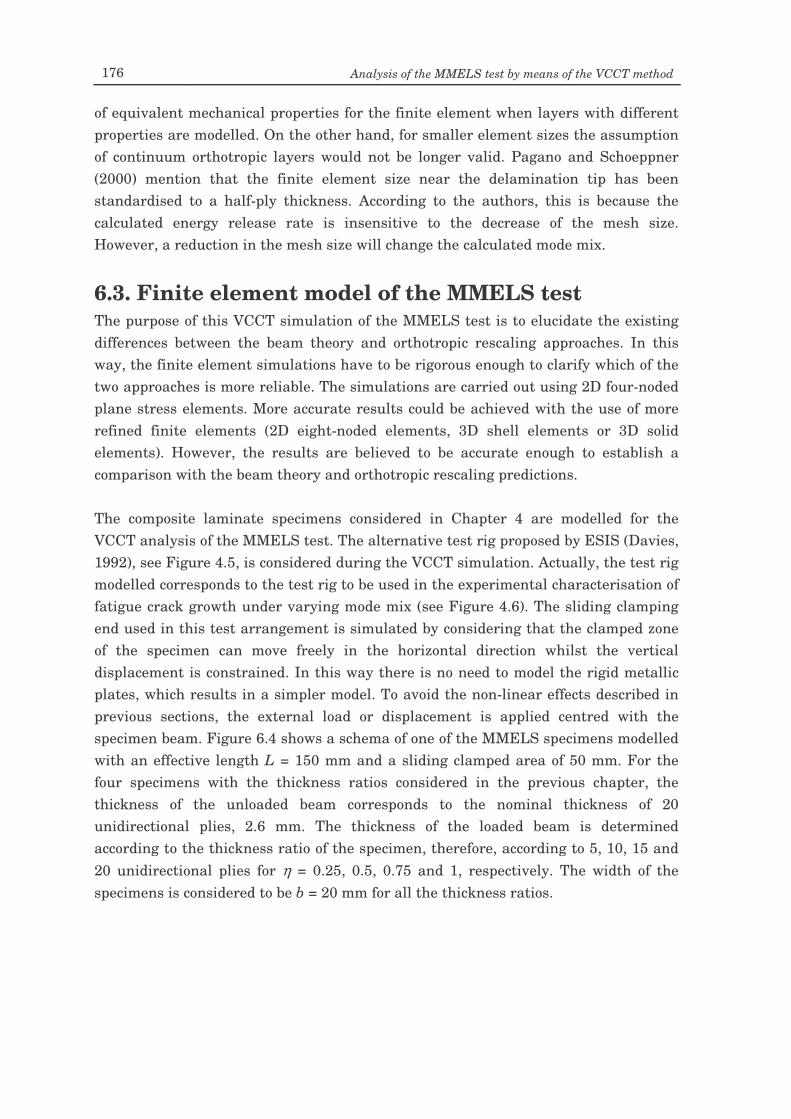
176 Analysis of the MMELS test by means of the VCCT method
of equivalent mechanical properties for the finite element when layers with different properties are modelled. On the other hand, for smaller element sizes the assumption of continuum orthotropic layers would not be longer valid. Pagano and Schoeppner (2000) mention that the finite element size near the delamination tip has been standardised to a half-ply thickness. According to the authors, this is because the calculated energy release rate is insensitive to the decrease of the mesh size. However, a reduction in the mesh size will change the calculated mode mix.
6.3. Finite element model of the MMELS test The purpose of this VCCT simulation of the MMELS test is to elucidate the existing differences between the beam theory and orthotropic rescaling approaches. In this way, the finite element simulations have to be rigorous enough to clarify which of the two approaches is more reliable. The simulations are carried out using 2D four-noded plane stress elements. More accurate results could be achieved with the use of more refined finite elements (2D eight-noded elements, 3D shell elements or 3D solid elements). However, the results are believed to be accurate enough to establish a comparison with the beam theory and orthotropic rescaling predictions. The composite laminate specimens considered in Chapter 4 are modelled for the VCCT analysis of the MMELS test. The alternative test rig proposed by ESIS (Davies, 1992), see Figure 4.5, is considered during the VCCT simulation. Actually, the test rig modelled corresponds to the test rig to be used in the experimental characterisation of fatigue crack growth under varying mode mix (see Figure 4.6). The sliding clamping end used in this test arrangement is simulated by considering that the clamped zone of the specimen can move freely in the horizontal direction whilst the vertical displacement is constrained. In this way there is no need to model the rigid metallic plates, which results in a simpler model. To avoid the non-linear effects described in previous sections, the external load or displacement is applied centred with the specimen beam. Figure 6.4 shows a schema of one of the MMELS specimens modelled with an effective length L = 150 mm and a sliding clamped area of 50 mm. For the four specimens with the thickness ratios considered in the previous chapter, the thickness of the unloaded beam corresponds to the nominal thickness of 20 unidirectional plies, 2.6 mm. The thickness of the loaded beam is determined according to the thickness ratio of the specimen, therefore, according to 5, 10, 15 and 20 unidirectional plies for η = 0.25, 0.5, 0.75 and 1, respectively. The width of the specimens is considered to be b = 20 mm for all the thickness ratios.
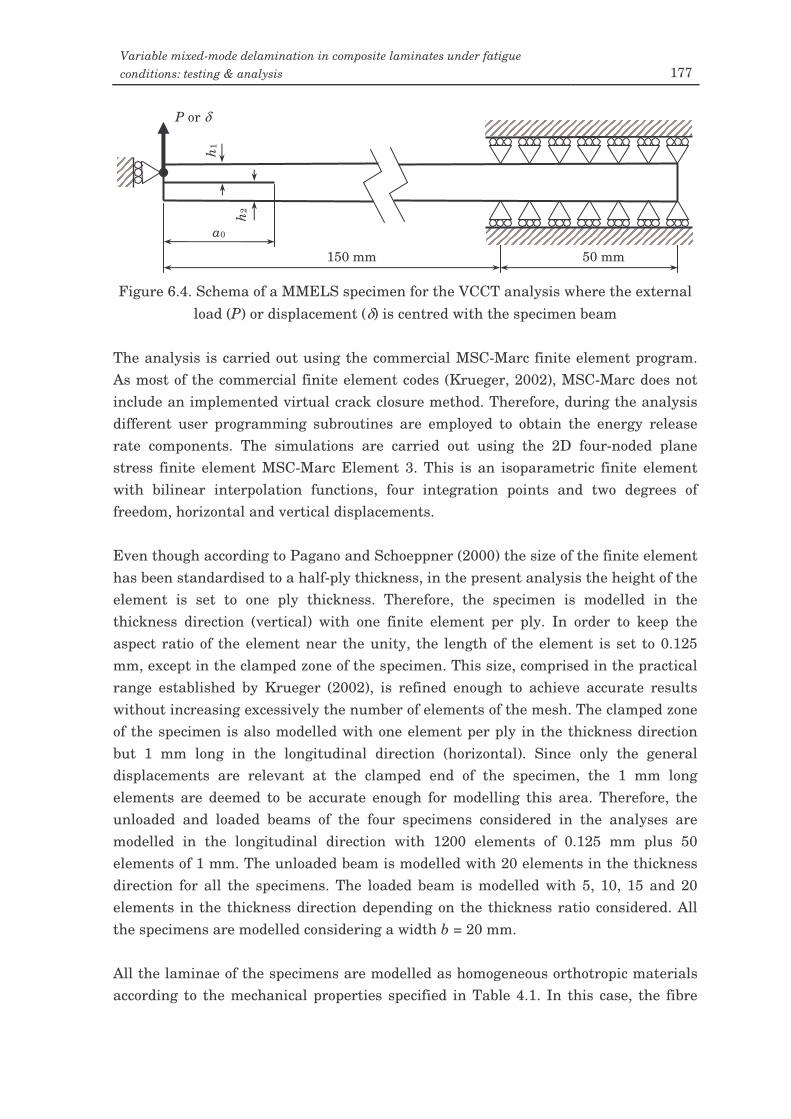
Variable mixed-mode delamination in composite laminates under fatigue conditions: testing & analysis 177
Figure 6.4. Schema of a MMELS specimen for the VCCT analysis where the external
load (P) or displacement (δ) is centred with the specimen beam The analysis is carried out using the commercial MSC-Marc finite element program. As most of the commercial finite element codes (Krueger, 2002), MSC-Marc does not include an implemented virtual crack closure method. Therefore, during the analysis different user programming subroutines are employed to obtain the energy release rate components. The simulations are carried out using the 2D four-noded plane stress finite element MSC-Marc Element 3. This is an isoparametric finite element with bilinear interpolation functions, four integration points and two degrees of freedom, horizontal and vertical displacements. Even though according to Pagano and Schoeppner (2000) the size of the finite element has been standardised to a half-ply thickness, in the present analysis the height of the element is set to one ply thickness. Therefore, the specimen is modelled in the thickness direction (vertical) with one finite element per ply. In order to keep the aspect ratio of the element near the unity, the length of the element is set to 0.125 mm, except in the clamped zone of the specimen. This size, comprised in the practical range established by Krueger (2002), is refined enough to achieve accurate results without increasing excessively the number of elements of the mesh. The clamped zone of the specimen is also modelled with one element per ply in the thickness direction but 1 mm long in the longitudinal direction (horizontal). Since only the general displacements are relevant at the clamped end of the specimen, the 1 mm long elements are deemed to be accurate enough for modelling this area. Therefore, the unloaded and loaded beams of the four specimens considered in the analyses are modelled in the longitudinal direction with 1200 elements of 0.125 mm plus 50 elements of 1 mm. The unloaded beam is modelled with 20 elements in the thickness direction for all the specimens. The loaded beam is modelled with 5, 10, 15 and 20 elements in the thickness direction depending on the thickness ratio considered. All the specimens are modelled considering a width b = 20 mm. All the laminae of the specimens are modelled as homogeneous orthotropic materials according to the mechanical properties specified in Table 4.1. In this case, the fibre
150 mm 50 mm
a0
h 1
h 2
P or δ
178 Analysis of the MMELS test by means of the VCCT method
direction (direction 11) coincides with the longitudinal direction or x-direction, the transverse direction (direction 22) coincides with the third-dimension (width direction) and the through thickness direction (direction 33) coincides with the vertical direction or y-direction. The interlaminar crack is modelled as a longitudinal discontinuity with different nodes attached to the top and bottom crack surfaces. The nodes at both discontinuity (crack) sides have the same coordinates and are coupled through multi-point constraints. In this case, the multi-point constraint type used is the MSC-Marc tying type 100. This multi-point constraint type ties all the degrees of freedom at the tied node to the corresponding degrees of freedom at the retained node. Therefore, at the closed crack zone the vertical and horizontal displacements at both sides of the crack coincide. In order to compare the variation of the G components versus the a with those predicted by the beam theory and orthotropic rescaling approaches, a propagation analysis is carried out. The propagation of the interlaminar crack is achieved by the progressive release of the multi-point constraints. The pre-crack included in the specimens is set to a0 = 2.5, 5, 7.5 and 10 mm for the η = 0.25, 0.5, 0.75 and 1 specimens, respectively. Figure 6.5 shows a zoom of the finite element mesh at the initial crack tip zone of the η = 0.25 specimen. In the figure the loaded beam of the specimen (dark grey) has been shifted respect the unloaded beam (light grey) to show the multi-point constraints linking the nodes at both sides of the crack.
Figure 6.5. Finite element mesh of the initial crack tip zone for the η = 0.25 specimen.
The loaded beam has been shifted to show the multi-point constraints
Multi-point constraints
1200 + 50 elements
a0 = 2.5 mm
20 e
lem
ents
5
elem
ents
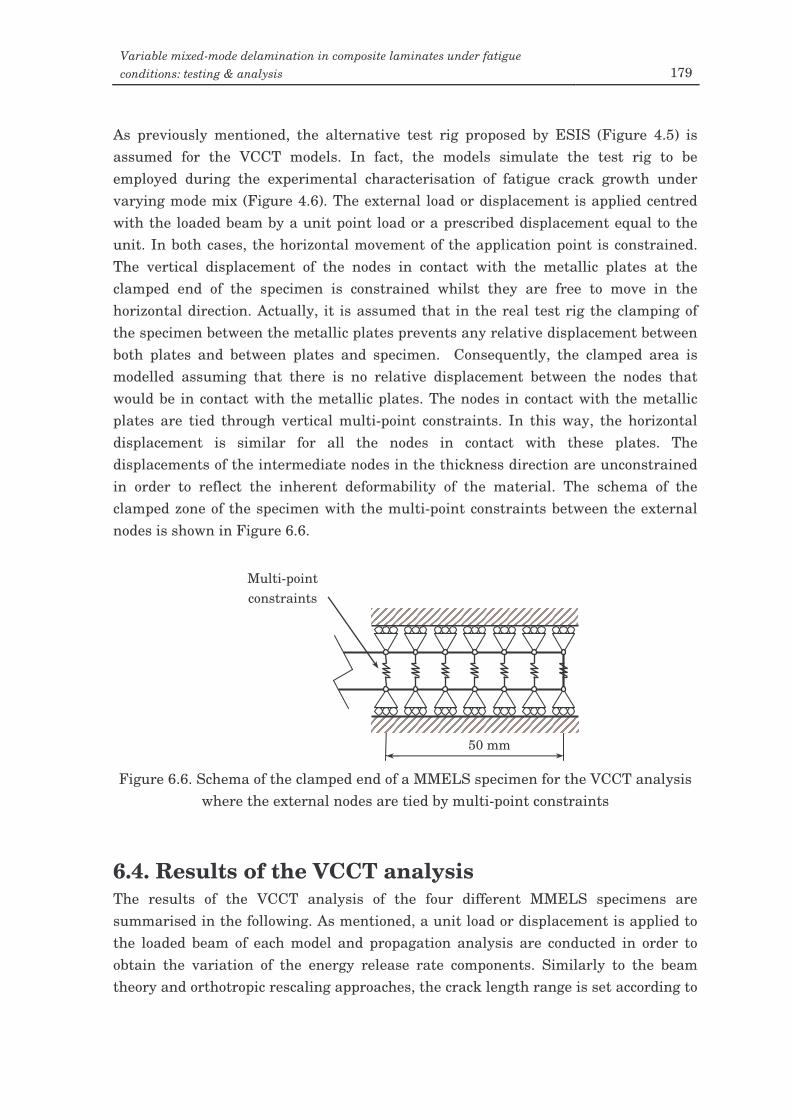
Variable mixed-mode delamination in composite laminates under fatigue conditions: testing & analysis 179
As previously mentioned, the alternative test rig proposed by ESIS (Figure 4.5) is assumed for the VCCT models. In fact, the models simulate the test rig to be employed during the experimental characterisation of fatigue crack growth under varying mode mix (Figure 4.6). The external load or displacement is applied centred with the loaded beam by a unit point load or a prescribed displacement equal to the unit. In both cases, the horizontal movement of the application point is constrained. The vertical displacement of the nodes in contact with the metallic plates at the clamped end of the specimen is constrained whilst they are free to move in the horizontal direction. Actually, it is assumed that in the real test rig the clamping of the specimen between the metallic plates prevents any relative displacement between both plates and between plates and specimen. Consequently, the clamped area is modelled assuming that there is no relative displacement between the nodes that would be in contact with the metallic plates. The nodes in contact with the metallic plates are tied through vertical multi-point constraints. In this way, the horizontal displacement is similar for all the nodes in contact with these plates. The displacements of the intermediate nodes in the thickness direction are unconstrained in order to reflect the inherent deformability of the material. The schema of the clamped zone of the specimen with the multi-point constraints between the external nodes is shown in Figure 6.6.
Figure 6.6. Schema of the clamped end of a MMELS specimen for the VCCT analysis
where the external nodes are tied by multi-point constraints
6.4. Results of the VCCT analysis The results of the VCCT analysis of the four different MMELS specimens are summarised in the following. As mentioned, a unit load or displacement is applied to the loaded beam of each model and propagation analysis are conducted in order to obtain the variation of the energy release rate components. Similarly to the beam theory and orthotropic rescaling approaches, the crack length range is set according to
50 mm
Multi-point constraints
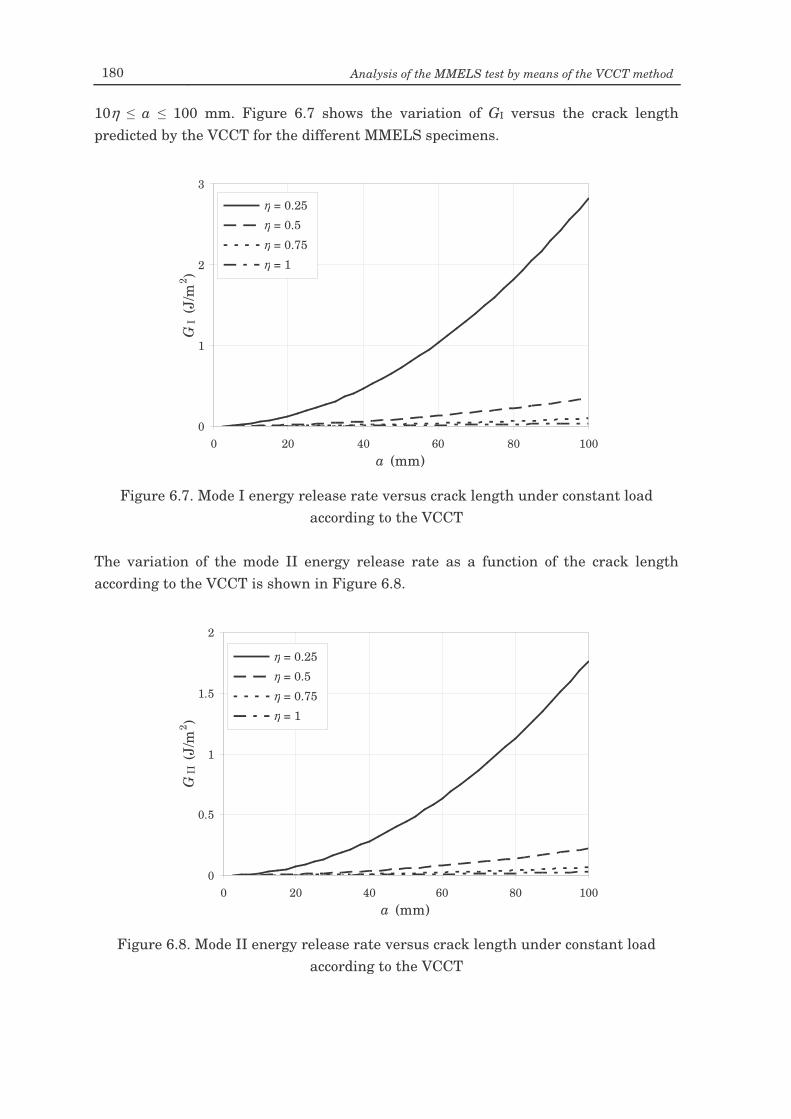
180 Analysis of the MMELS test by means of the VCCT method
10η a 100 mm. Figure 6.7 shows the variation of GI versus the crack length predicted by the VCCT for the different MMELS specimens.
Figure 6.7. Mode I energy release rate versus crack length under constant load
according to the VCCT The variation of the mode II energy release rate as a function of the crack length according to the VCCT is shown in Figure 6.8.
Figure 6.8. Mode II energy release rate versus crack length under constant load
according to the VCCT
0
0.5
1
1.5
2
0 20 40 60 80 100a (mm)
GII
(J/
m2 )
η = 0.25η = 0.5η = 0.75η = 1
η = 0.25 η = 0.5 η = 0.75 η = 1
0
1
2
3
0 20 40 60 80 100a (mm)
GI
(J/m
2 )η = 0.25η = 0.5η = 0.75η = 1
η = 0.25 η = 0.5 η = 0.75 η = 1
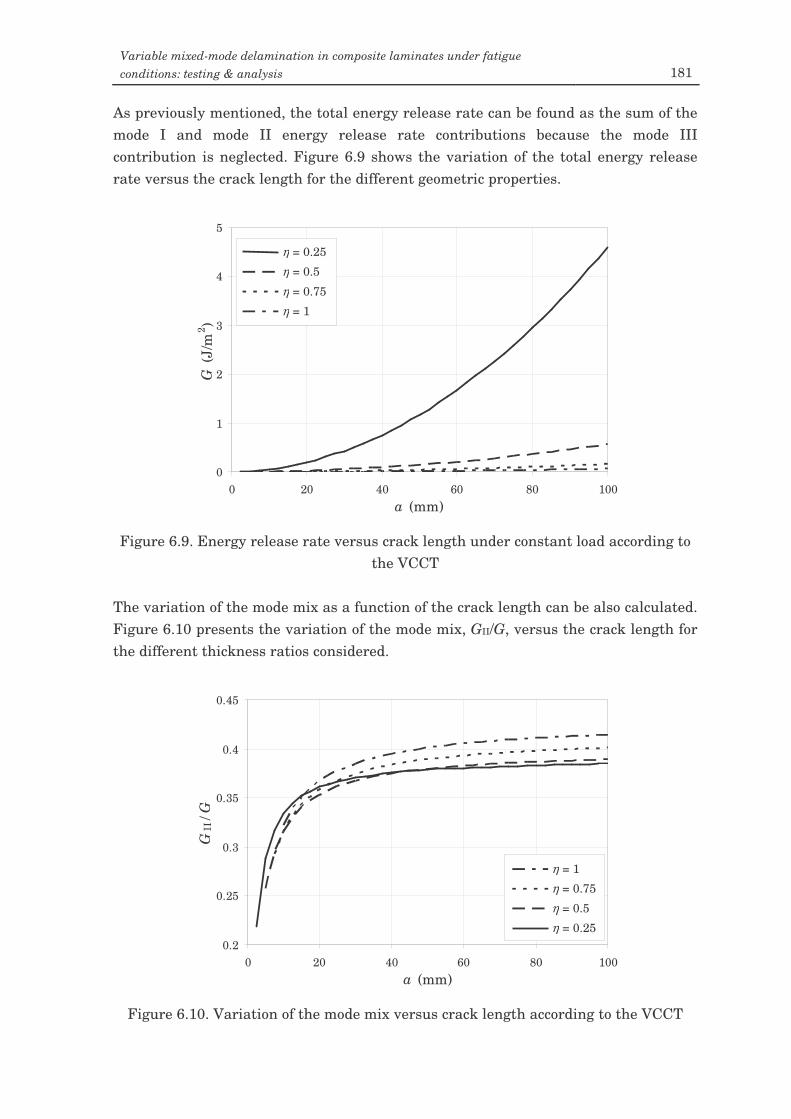
Variable mixed-mode delamination in composite laminates under fatigue conditions: testing & analysis 181
As previously mentioned, the total energy release rate can be found as the sum of the mode I and mode II energy release rate contributions because the mode III contribution is neglected. Figure 6.9 shows the variation of the total energy release rate versus the crack length for the different geometric properties.
Figure 6.9. Energy release rate versus crack length under constant load according to
the VCCT The variation of the mode mix as a function of the crack length can be also calculated. Figure 6.10 presents the variation of the mode mix, GII/G, versus the crack length for the different thickness ratios considered.
Figure 6.10. Variation of the mode mix versus crack length according to the VCCT
0.2
0.25
0.3
0.35
0.4
0.45
0 20 40 60 80 100a (mm)
GII
/ G
η = 1η = 0.75η = 0.5η = 0.25
η = 1 η = 0.75 η = 0.5 η = 0.25
0
1
2
3
4
5
0 20 40 60 80 100a (mm)
G (
J/m
2 )
η = 0.25η = 0.5η = 0.75η = 1
η = 0.25 η = 0.5 η = 0.75 η = 1
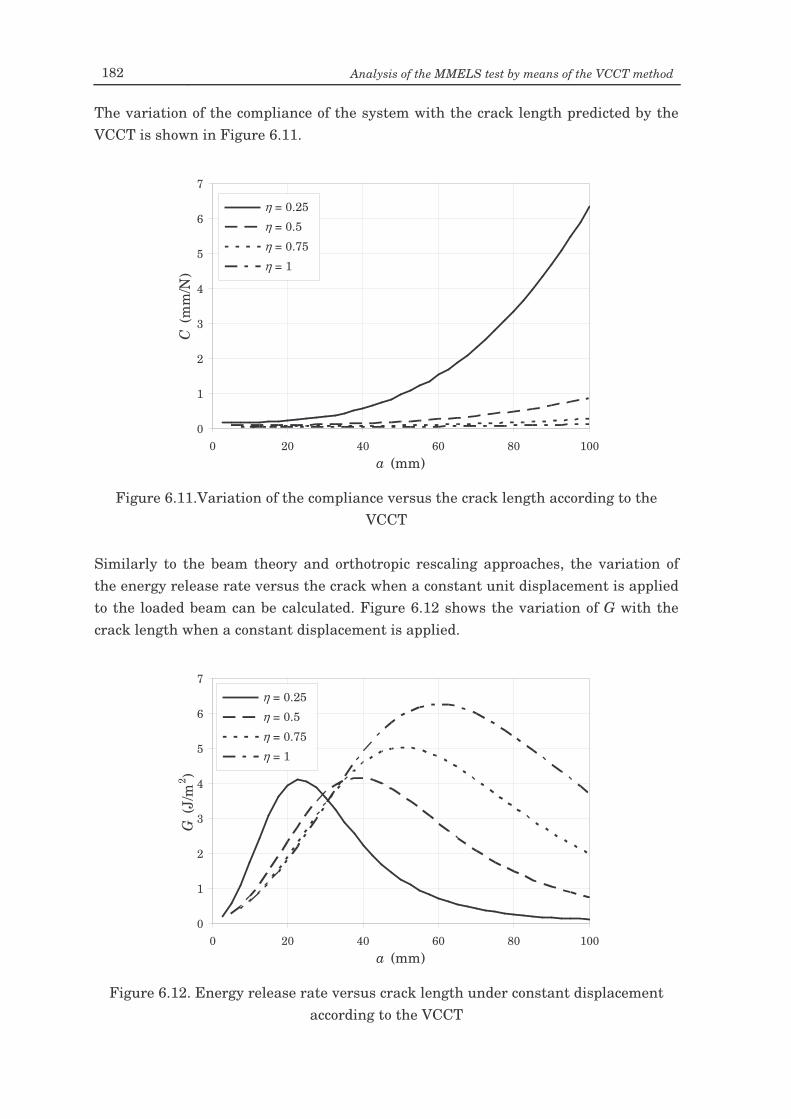
182 Analysis of the MMELS test by means of the VCCT method
The variation of the compliance of the system with the crack length predicted by the VCCT is shown in Figure 6.11.
Figure 6.11.Variation of the compliance versus the crack length according to the
VCCT Similarly to the beam theory and orthotropic rescaling approaches, the variation of the energy release rate versus the crack when a constant unit displacement is applied to the loaded beam can be calculated. Figure 6.12 shows the variation of G with the crack length when a constant displacement is applied.
Figure 6.12. Energy release rate versus crack length under constant displacement
according to the VCCT
0
1
2
3
4
5
6
7
0 20 40 60 80 100a (mm)
G (
J/m
2 )
η = 0.25η = 0.5η = 0.75η = 1
η = 0.25 η = 0.5 η = 0.75 η = 1
0
1
2
3
4
5
6
7
0 20 40 60 80 100a (mm)
C (m
m/N
)
η = 0.25η = 0.5η = 0.75η = 1
η = 0.25 η = 0.5 η = 0.75 η = 1
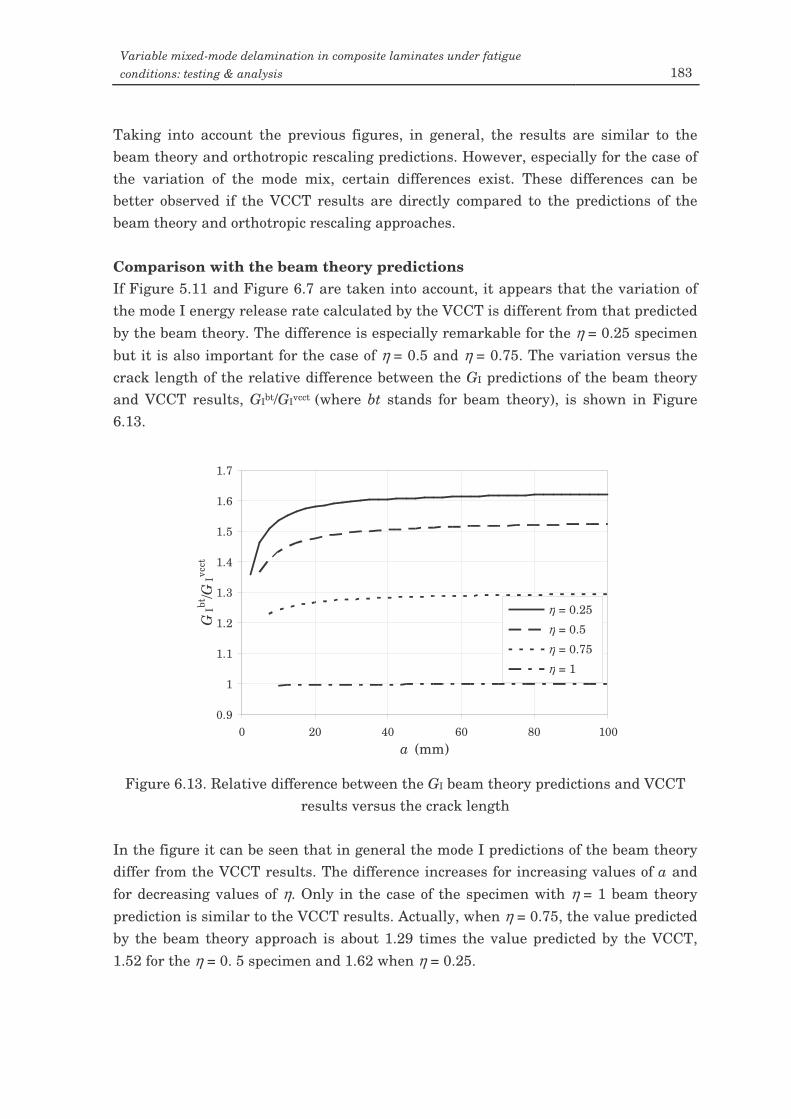
Variable mixed-mode delamination in composite laminates under fatigue conditions: testing & analysis 183
Taking into account the previous figures, in general, the results are similar to the beam theory and orthotropic rescaling predictions. However, especially for the case of the variation of the mode mix, certain differences exist. These differences can be better observed if the VCCT results are directly compared to the predictions of the beam theory and orthotropic rescaling approaches. Comparison with the beam theory predictions If Figure 5.11 and Figure 6.7 are taken into account, it appears that the variation of the mode I energy release rate calculated by the VCCT is different from that predicted by the beam theory. The difference is especially remarkable for the η = 0.25 specimen but it is also important for the case of η = 0.5 and η = 0.75. The variation versus the crack length of the relative difference between the GI predictions of the beam theory and VCCT results, GIbt/GIvcct (where bt stands for beam theory), is shown in Figure 6.13.
Figure 6.13. Relative difference between the GI beam theory predictions and VCCT
results versus the crack length In the figure it can be seen that in general the mode I predictions of the beam theory differ from the VCCT results. The difference increases for increasing values of a and for decreasing values of η. Only in the case of the specimen with η = 1 beam theory prediction is similar to the VCCT results. Actually, when η = 0.75, the value predicted by the beam theory approach is about 1.29 times the value predicted by the VCCT, 1.52 for the η = 0. 5 specimen and 1.62 when η = 0.25.
0.9
1
1.1
1.2
1.3
1.4
1.5
1.6
1.7
0 20 40 60 80 100a (mm)
GIbt
/GIvc
ct
η = 0.25η = 0.5η = 0.75η = 1
η = 0.25 η = 0.5 η = 0.75 η = 1
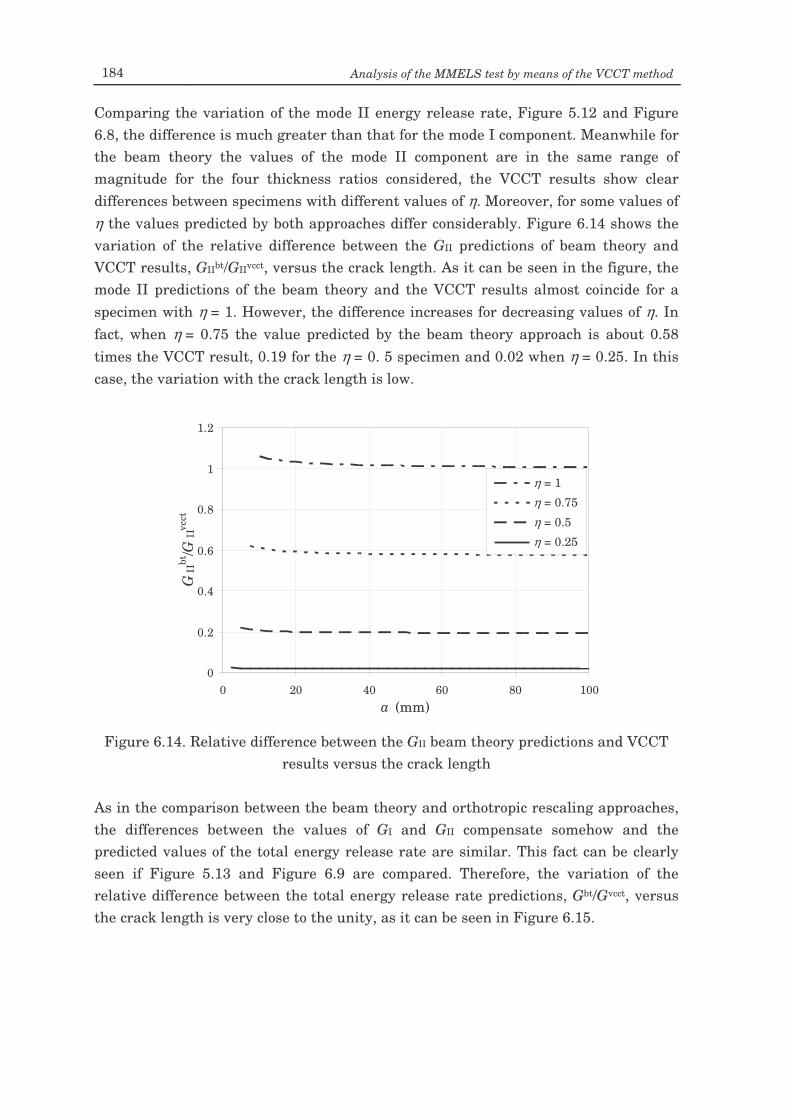
184 Analysis of the MMELS test by means of the VCCT method
Comparing the variation of the mode II energy release rate, Figure 5.12 and Figure 6.8, the difference is much greater than that for the mode I component. Meanwhile for the beam theory the values of the mode II component are in the same range of magnitude for the four thickness ratios considered, the VCCT results show clear differences between specimens with different values of η. Moreover, for some values of η the values predicted by both approaches differ considerably. Figure 6.14 shows the variation of the relative difference between the GII predictions of beam theory and VCCT results, GIIbt/GIIvcct, versus the crack length. As it can be seen in the figure, the mode II predictions of the beam theory and the VCCT results almost coincide for a specimen with η = 1. However, the difference increases for decreasing values of η. In fact, when η = 0.75 the value predicted by the beam theory approach is about 0.58 times the VCCT result, 0.19 for the η = 0. 5 specimen and 0.02 when η = 0.25. In this case, the variation with the crack length is low.
Figure 6.14. Relative difference between the GII beam theory predictions and VCCT
results versus the crack length As in the comparison between the beam theory and orthotropic rescaling approaches, the differences between the values of GI and GII compensate somehow and the predicted values of the total energy release rate are similar. This fact can be clearly seen if Figure 5.13 and Figure 6.9 are compared. Therefore, the variation of the relative difference between the total energy release rate predictions, Gbt/Gvcct, versus the crack length is very close to the unity, as it can be seen in Figure 6.15.
0
0.2
0.4
0.6
0.8
1
1.2
0 20 40 60 80 100a (mm)
GII
bt/G
IIvc
ct
η = 1η = 0.75η = 0.5η = 0.25
η = 1 η = 0.75 η = 0.5 η = 0.25
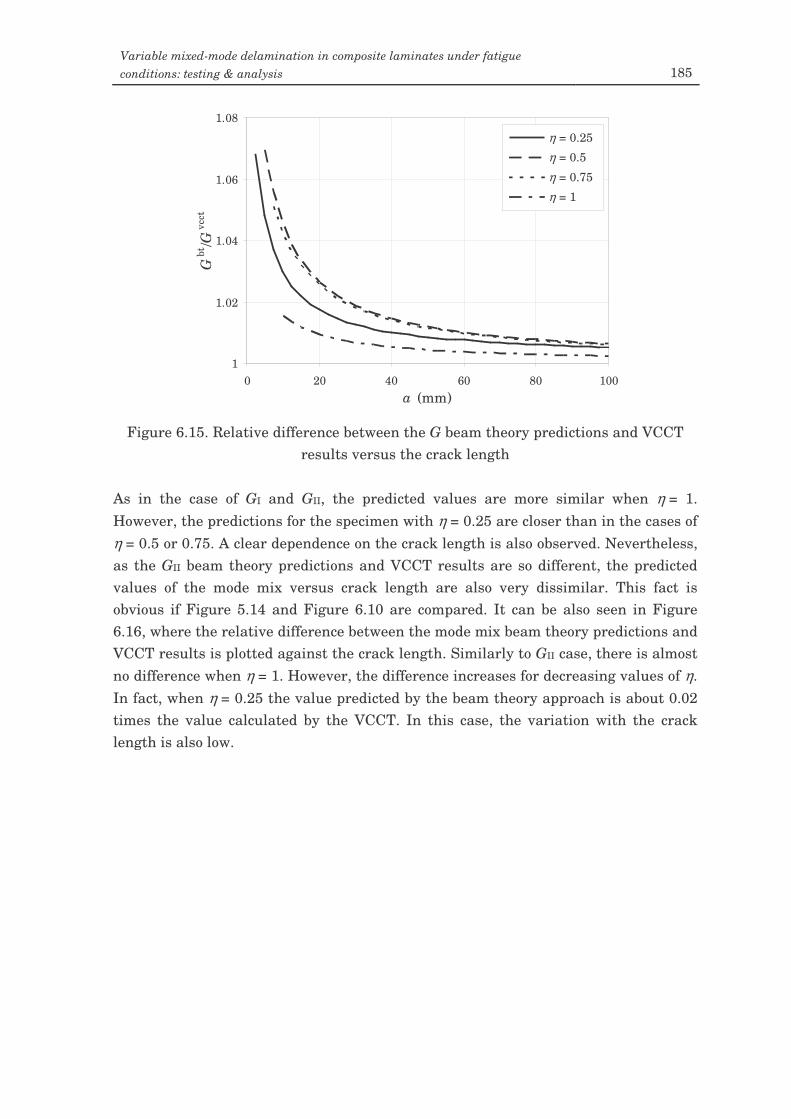
Variable mixed-mode delamination in composite laminates under fatigue conditions: testing & analysis 185
Figure 6.15. Relative difference between the G beam theory predictions and VCCT
results versus the crack length As in the case of GI and GII, the predicted values are more similar when η = 1. However, the predictions for the specimen with η = 0.25 are closer than in the cases of η = 0.5 or 0.75. A clear dependence on the crack length is also observed. Nevertheless, as the GII beam theory predictions and VCCT results are so different, the predicted values of the mode mix versus crack length are also very dissimilar. This fact is obvious if Figure 5.14 and Figure 6.10 are compared. It can be also seen in Figure 6.16, where the relative difference between the mode mix beam theory predictions and VCCT results is plotted against the crack length. Similarly to GII case, there is almost no difference when η = 1. However, the difference increases for decreasing values of η. In fact, when η = 0.25 the value predicted by the beam theory approach is about 0.02 times the value calculated by the VCCT. In this case, the variation with the crack length is also low.
1
1.02
1.04
1.06
1.08
0 20 40 60 80 100a (mm)
Gbt
/Gvc
ct
η = 0.25η = 0.5η = 0.75η = 1
η = 0.25 η = 0.5 η = 0.75 η = 1
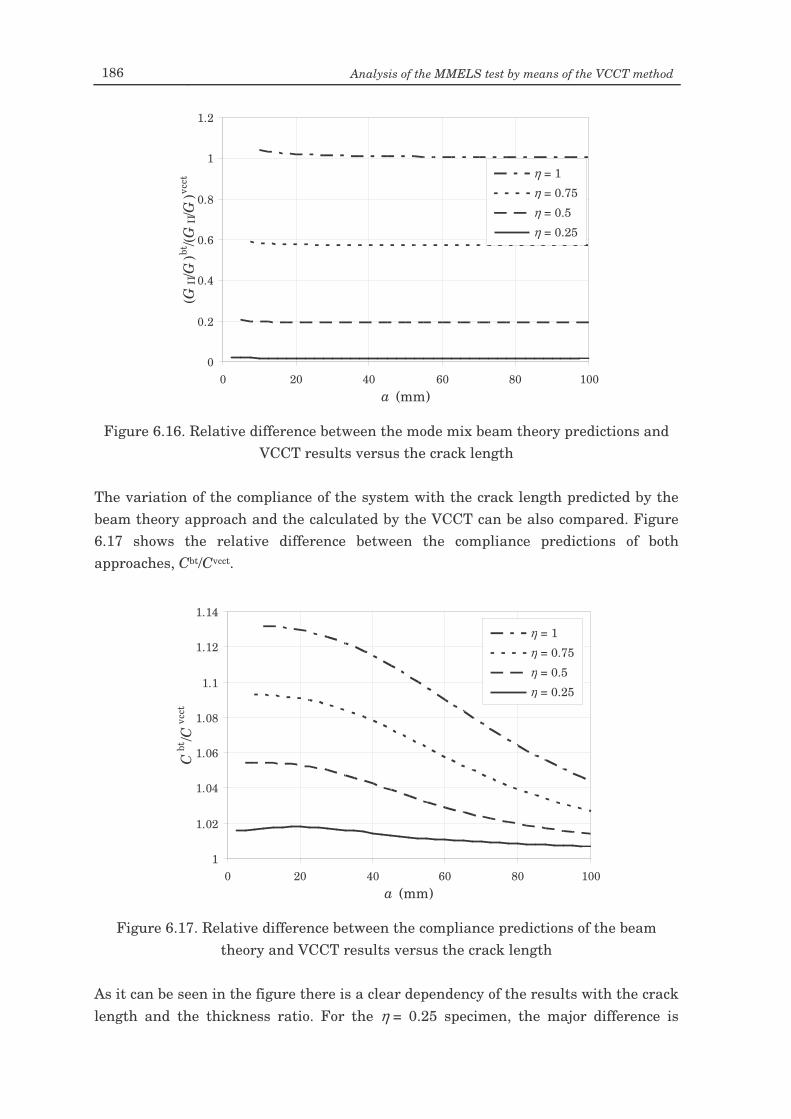
186 Analysis of the MMELS test by means of the VCCT method
Figure 6.16. Relative difference between the mode mix beam theory predictions and
VCCT results versus the crack length The variation of the compliance of the system with the crack length predicted by the beam theory approach and the calculated by the VCCT can be also compared. Figure 6.17 shows the relative difference between the compliance predictions of both approaches, Cbt/Cvcct.
Figure 6.17. Relative difference between the compliance predictions of the beam
theory and VCCT results versus the crack length As it can be seen in the figure there is a clear dependency of the results with the crack length and the thickness ratio. For the η = 0.25 specimen, the major difference is
1
1.02
1.04
1.06
1.08
1.1
1.12
1.14
0 20 40 60 80 100a (mm)
Cbt
/Cvc
ct
η = 1η = 0.75η = 0.5η = 0.25
η = 1 η = 0.75 η = 0.5 η = 0.25
0
0.2
0.4
0.6
0.8
1
1.2
0 20 40 60 80 100a (mm)
(GII/G
)bt/(G
II/G
)vcct
η = 1η = 0.75η = 0.5η = 0.25
η = 1 η = 0.75 η = 0.5 η = 0.25
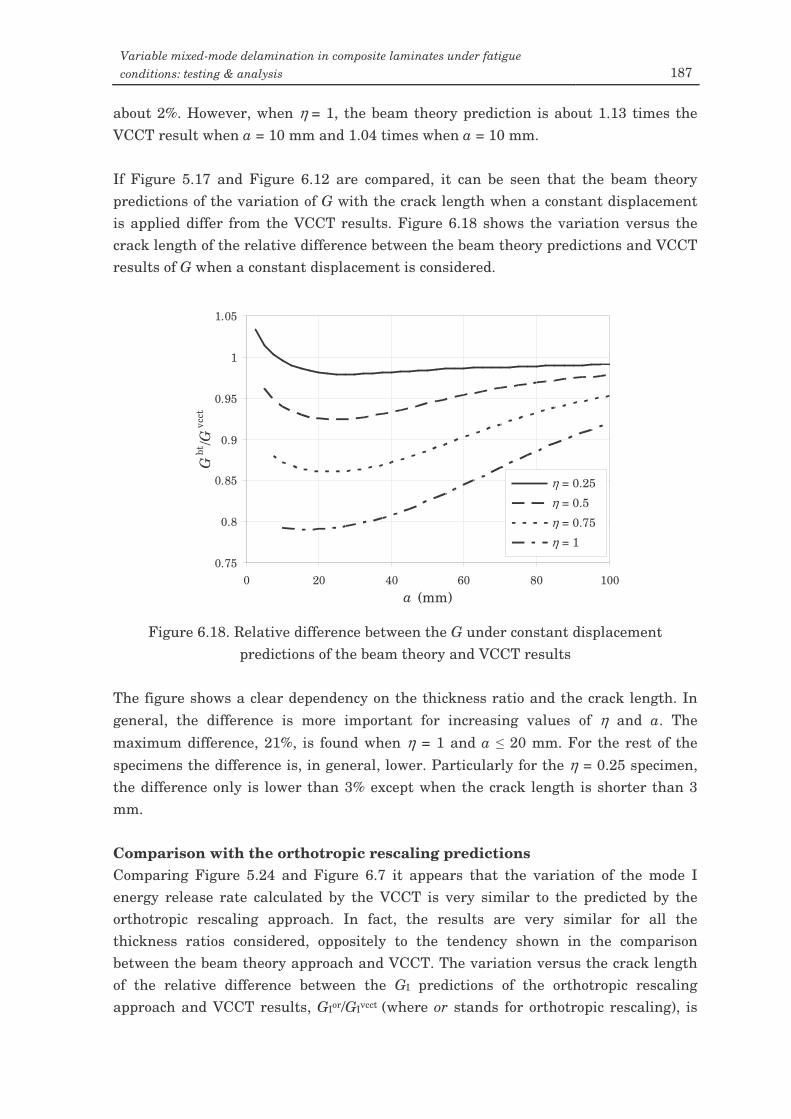
Variable mixed-mode delamination in composite laminates under fatigue conditions: testing & analysis 187
about 2%. However, when η = 1, the beam theory prediction is about 1.13 times the VCCT result when a = 10 mm and 1.04 times when a = 10 mm. If Figure 5.17 and Figure 6.12 are compared, it can be seen that the beam theory predictions of the variation of G with the crack length when a constant displacement is applied differ from the VCCT results. Figure 6.18 shows the variation versus the crack length of the relative difference between the beam theory predictions and VCCT results of G when a constant displacement is considered.
Figure 6.18. Relative difference between the G under constant displacement
predictions of the beam theory and VCCT results The figure shows a clear dependency on the thickness ratio and the crack length. In general, the difference is more important for increasing values of η and a. The maximum difference, 21%, is found when η = 1 and a 20 mm. For the rest of the specimens the difference is, in general, lower. Particularly for the η = 0.25 specimen, the difference only is lower than 3% except when the crack length is shorter than 3 mm. Comparison with the orthotropic rescaling predictions Comparing Figure 5.24 and Figure 6.7 it appears that the variation of the mode I energy release rate calculated by the VCCT is very similar to the predicted by the orthotropic rescaling approach. In fact, the results are very similar for all the thickness ratios considered, oppositely to the tendency shown in the comparison between the beam theory approach and VCCT. The variation versus the crack length of the relative difference between the GI predictions of the orthotropic rescaling approach and VCCT results, GIor/GIvcct (where or stands for orthotropic rescaling), is
0.75
0.8
0.85
0.9
0.95
1
1.05
0 20 40 60 80 100a (mm)
Gbt
/Gvc
ct
η = 0.25η = 0.5η = 0.75η = 1
η = 0.25 η = 0.5 η = 0.75 η = 1
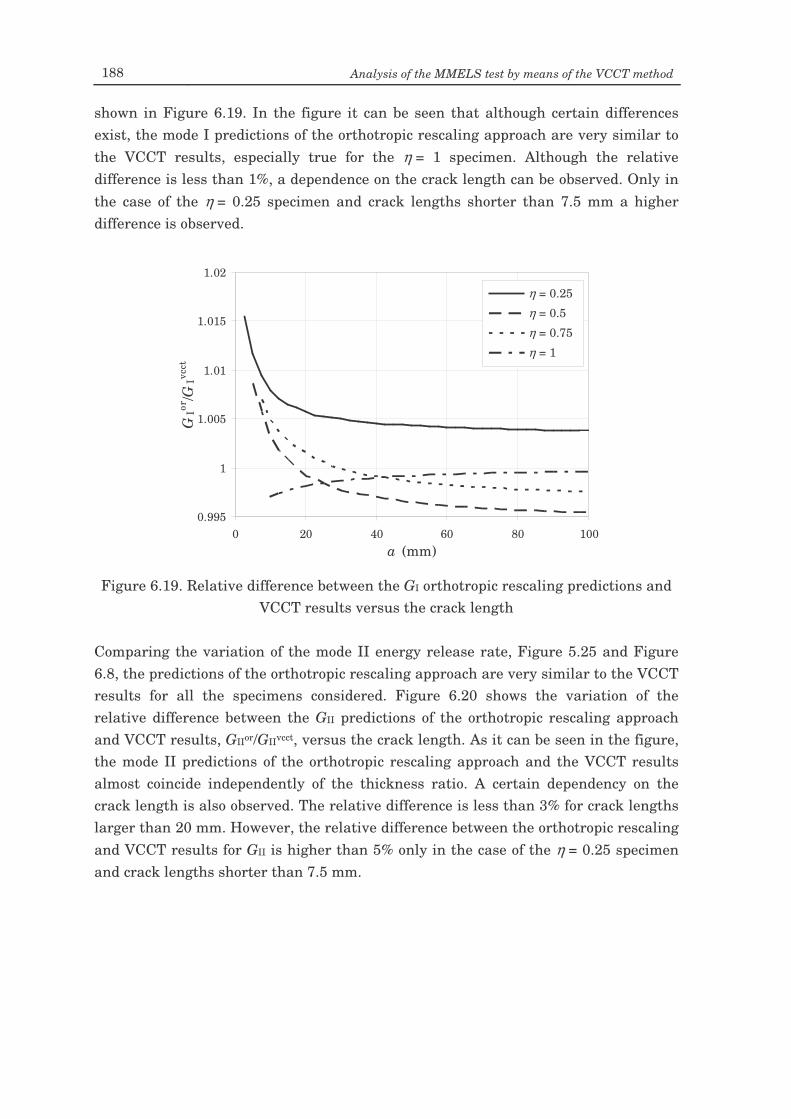
188 Analysis of the MMELS test by means of the VCCT method
shown in Figure 6.19. In the figure it can be seen that although certain differences exist, the mode I predictions of the orthotropic rescaling approach are very similar to the VCCT results, especially true for the η = 1 specimen. Although the relative difference is less than 1%, a dependence on the crack length can be observed. Only in the case of the η = 0.25 specimen and crack lengths shorter than 7.5 mm a higher difference is observed.
Figure 6.19. Relative difference between the GI orthotropic rescaling predictions and
VCCT results versus the crack length Comparing the variation of the mode II energy release rate, Figure 5.25 and Figure 6.8, the predictions of the orthotropic rescaling approach are very similar to the VCCT results for all the specimens considered. Figure 6.20 shows the variation of the relative difference between the GII predictions of the orthotropic rescaling approach and VCCT results, GIIor/GIIvcct, versus the crack length. As it can be seen in the figure, the mode II predictions of the orthotropic rescaling approach and the VCCT results almost coincide independently of the thickness ratio. A certain dependency on the crack length is also observed. The relative difference is less than 3% for crack lengths larger than 20 mm. However, the relative difference between the orthotropic rescaling and VCCT results for GII is higher than 5% only in the case of the η = 0.25 specimen and crack lengths shorter than 7.5 mm.
0.995
1
1.005
1.01
1.015
1.02
0 20 40 60 80 100a (mm)
GIor
/GIvc
ct
η = 0.25η = 0.5η = 0.75η = 1
η = 0.25 η = 0.5 η = 0.75 η = 1
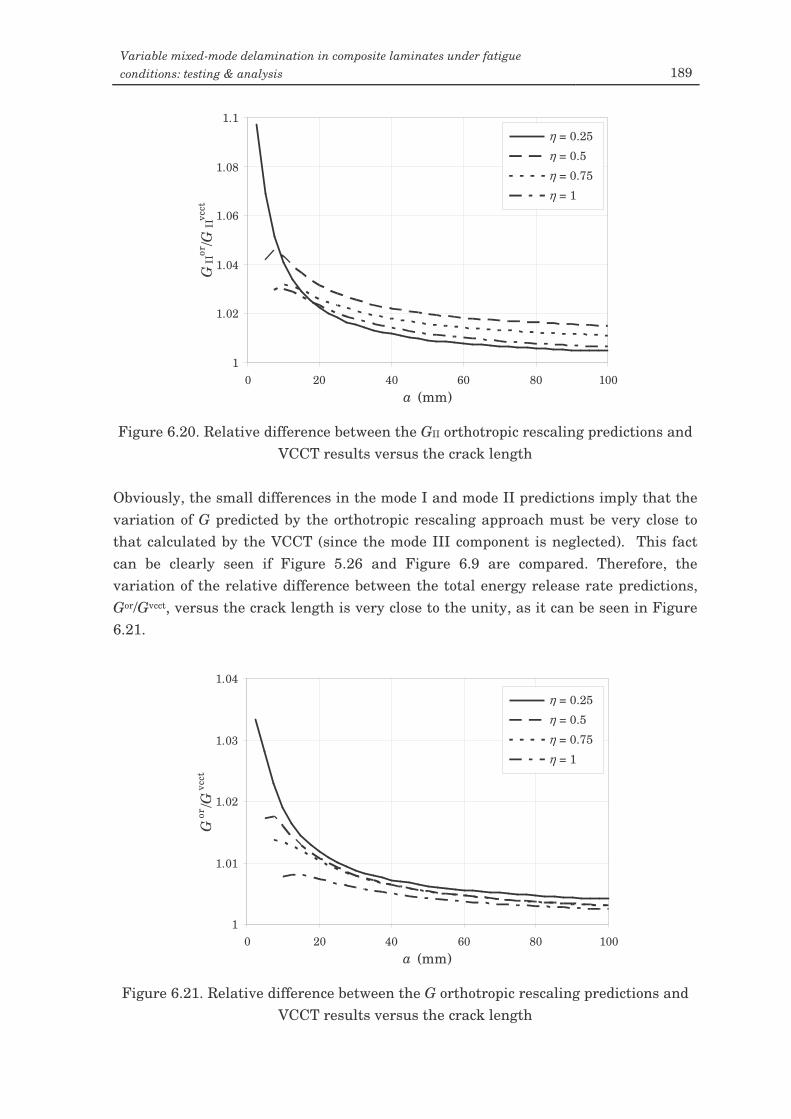
Variable mixed-mode delamination in composite laminates under fatigue conditions: testing & analysis 189
Figure 6.20. Relative difference between the GII orthotropic rescaling predictions and
VCCT results versus the crack length Obviously, the small differences in the mode I and mode II predictions imply that the variation of G predicted by the orthotropic rescaling approach must be very close to that calculated by the VCCT (since the mode III component is neglected). This fact can be clearly seen if Figure 5.26 and Figure 6.9 are compared. Therefore, the variation of the relative difference between the total energy release rate predictions, Gor/Gvcct, versus the crack length is very close to the unity, as it can be seen in Figure 6.21.
Figure 6.21. Relative difference between the G orthotropic rescaling predictions and
VCCT results versus the crack length
1
1.01
1.02
1.03
1.04
0 20 40 60 80 100a (mm)
Gor
/Gvc
ct
η = 0.25η = 0.5η = 0.75η = 1
η = 0.25 η = 0.5 η = 0.75 η = 1
1
1.02
1.04
1.06
1.08
1.1
0 20 40 60 80 100a (mm)
GII
or/G
IIvc
ct
η = 0.25η = 0.5η = 0.75η = 1
η = 0.25 η = 0.5 η = 0.75 η = 1
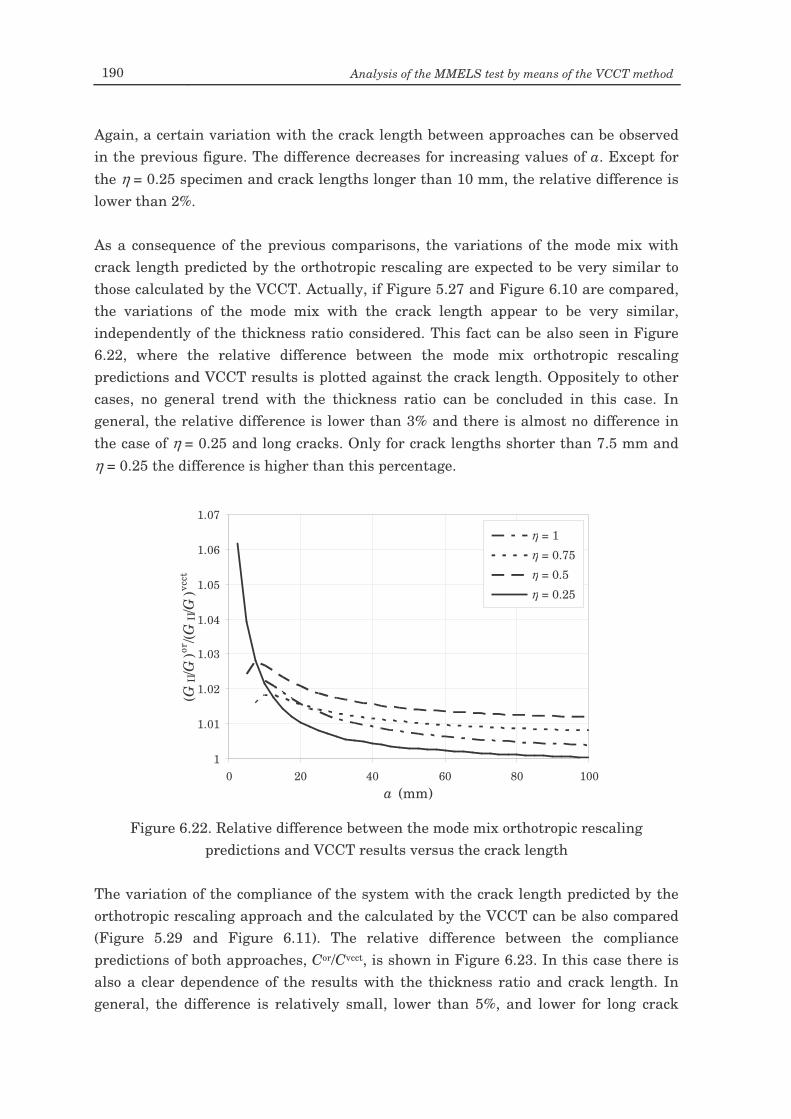
190 Analysis of the MMELS test by means of the VCCT method
Again, a certain variation with the crack length between approaches can be observed in the previous figure. The difference decreases for increasing values of a. Except for the η = 0.25 specimen and crack lengths longer than 10 mm, the relative difference is lower than 2%. As a consequence of the previous comparisons, the variations of the mode mix with crack length predicted by the orthotropic rescaling are expected to be very similar to those calculated by the VCCT. Actually, if Figure 5.27 and Figure 6.10 are compared, the variations of the mode mix with the crack length appear to be very similar, independently of the thickness ratio considered. This fact can be also seen in Figure 6.22, where the relative difference between the mode mix orthotropic rescaling predictions and VCCT results is plotted against the crack length. Oppositely to other cases, no general trend with the thickness ratio can be concluded in this case. In general, the relative difference is lower than 3% and there is almost no difference in the case of η = 0.25 and long cracks. Only for crack lengths shorter than 7.5 mm and η = 0.25 the difference is higher than this percentage.
Figure 6.22. Relative difference between the mode mix orthotropic rescaling
predictions and VCCT results versus the crack length The variation of the compliance of the system with the crack length predicted by the orthotropic rescaling approach and the calculated by the VCCT can be also compared (Figure 5.29 and Figure 6.11). The relative difference between the compliance predictions of both approaches, Cor/Cvcct, is shown in Figure 6.23. In this case there is also a clear dependence of the results with the thickness ratio and crack length. In general, the difference is relatively small, lower than 5%, and lower for long crack
1
1.01
1.02
1.03
1.04
1.05
1.06
1.07
0 20 40 60 80 100a (mm)
(GII/G
)or/(G
II/G
)vcct
η = 1η = 0.75η = 0.5η = 0.25
η = 1 η = 0.75 η = 0.5 η = 0.25
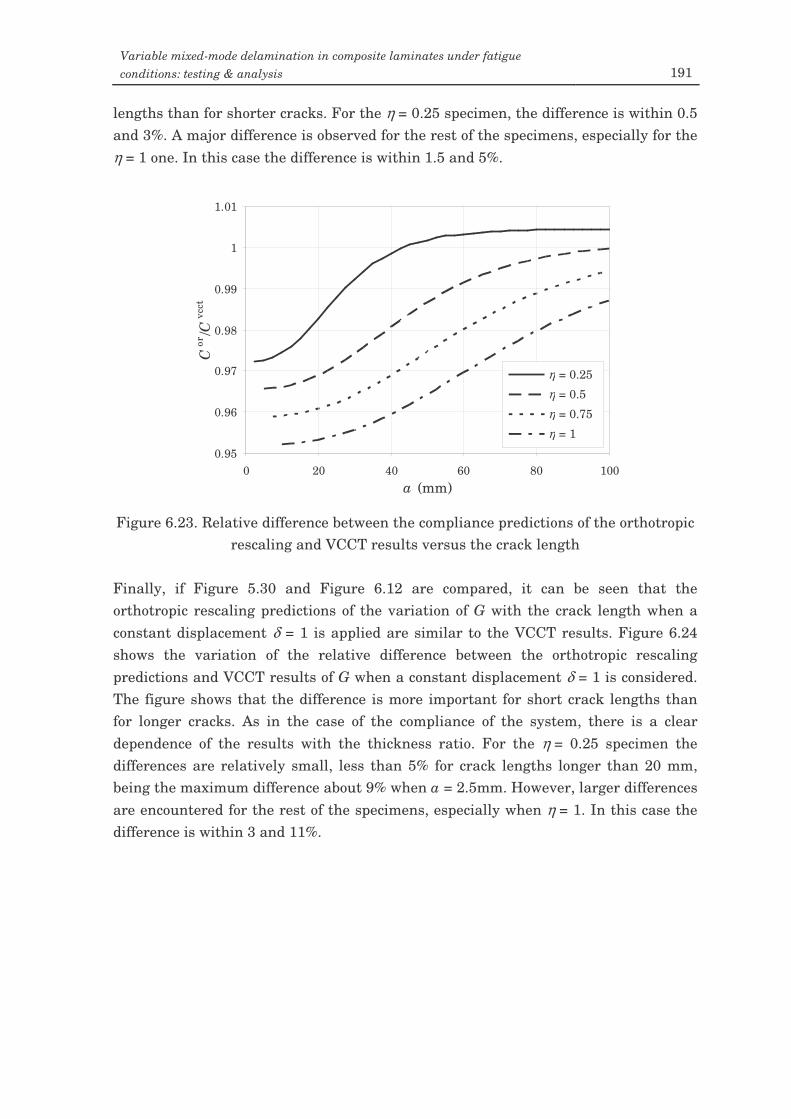
Variable mixed-mode delamination in composite laminates under fatigue conditions: testing & analysis 191
lengths than for shorter cracks. For the η = 0.25 specimen, the difference is within 0.5 and 3%. A major difference is observed for the rest of the specimens, especially for the η = 1 one. In this case the difference is within 1.5 and 5%.
Figure 6.23. Relative difference between the compliance predictions of the orthotropic
rescaling and VCCT results versus the crack length Finally, if Figure 5.30 and Figure 6.12 are compared, it can be seen that the orthotropic rescaling predictions of the variation of G with the crack length when a constant displacement δ = 1 is applied are similar to the VCCT results. Figure 6.24 shows the variation of the relative difference between the orthotropic rescaling predictions and VCCT results of G when a constant displacement δ = 1 is considered. The figure shows that the difference is more important for short crack lengths than for longer cracks. As in the case of the compliance of the system, there is a clear dependence of the results with the thickness ratio. For the η = 0.25 specimen the differences are relatively small, less than 5% for crack lengths longer than 20 mm, being the maximum difference about 9% when a = 2.5mm. However, larger differences are encountered for the rest of the specimens, especially when η = 1. In this case the difference is within 3 and 11%.
0.95
0.96
0.97
0.98
0.99
1
1.01
0 20 40 60 80 100a (mm)
Cor
/Cvc
ct
η = 0.25η = 0.5η = 0.75η = 1
η = 0.25 η = 0.5 η = 0.75 η = 1
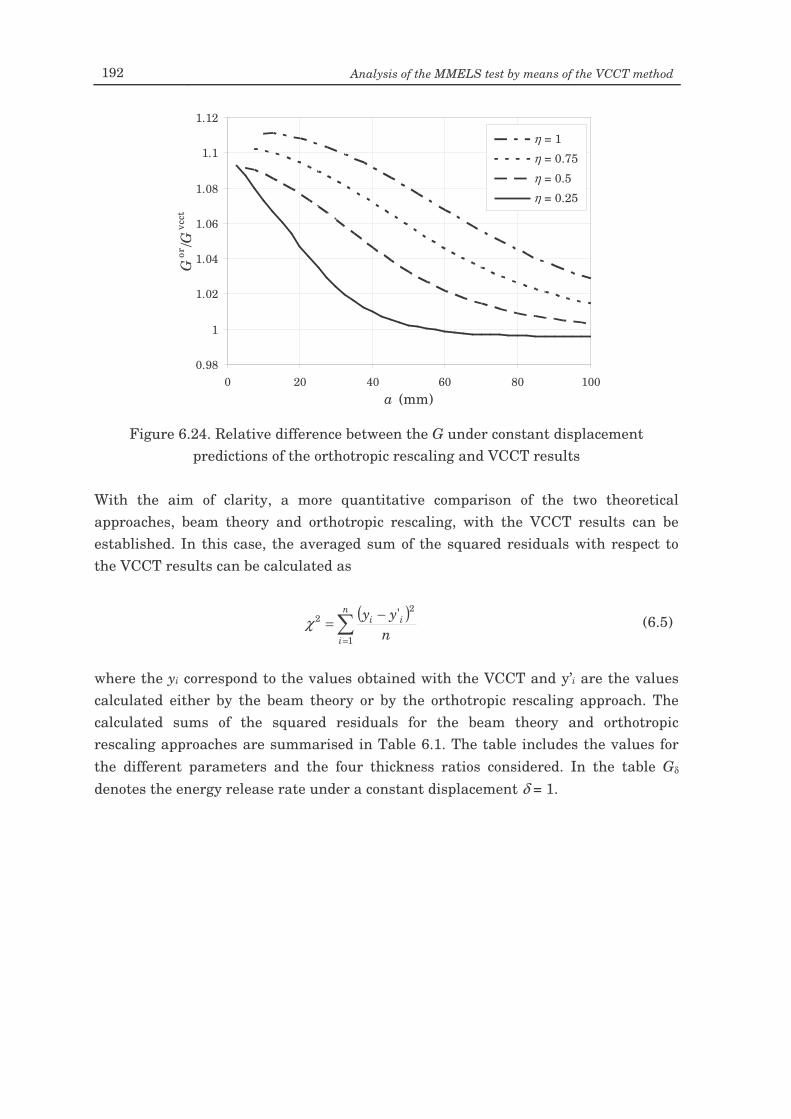
192 Analysis of the MMELS test by means of the VCCT method
Figure 6.24. Relative difference between the G under constant displacement
predictions of the orthotropic rescaling and VCCT results With the aim of clarity, a more quantitative comparison of the two theoretical approaches, beam theory and orthotropic rescaling, with the VCCT results can be established. In this case, the averaged sum of the squared residuals with respect to the VCCT results can be calculated as
( )
=
−=n
i
ii
nyy
1
22 'χ (6.5)
where the yi correspond to the values obtained with the VCCT and y’i are the values calculated either by the beam theory or by the orthotropic rescaling approach. The calculated sums of the squared residuals for the beam theory and orthotropic rescaling approaches are summarised in Table 6.1. The table includes the values for the different parameters and the four thickness ratios considered. In the table Gδ denotes the energy release rate under a constant displacement δ = 1.
0.98
1
1.02
1.04
1.06
1.08
1.1
1.12
0 20 40 60 80 100a (mm)
Gor
/Gvc
ct
η = 1η = 0.75η = 0.5η = 0.25
η = 1 η = 0.75 η = 0.5 η = 0.25
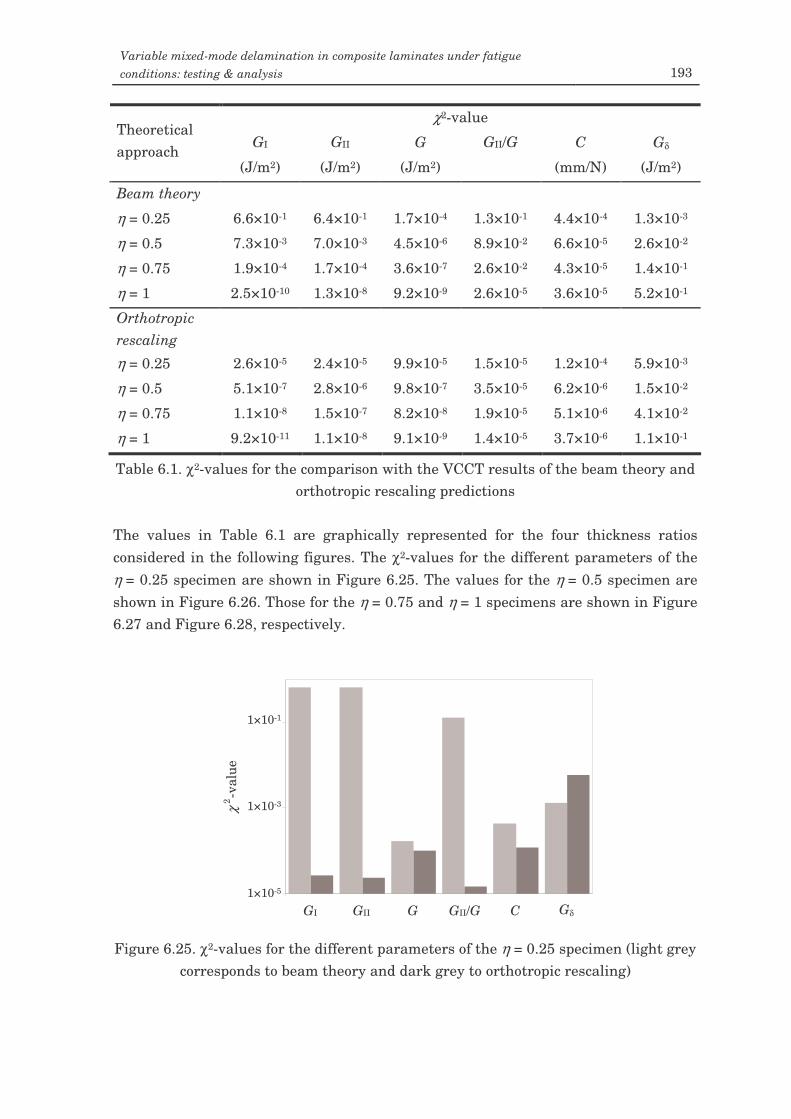
Variable mixed-mode delamination in composite laminates under fatigue conditions: testing & analysis 193
χ2-value
GI GII G GII/G C Gδ Theoretical approach
(J/m2) (J/m2) (J/m2) (mm/N) (J/m2)
Beam theory
η = 0.25 6.6×10⁻¹ 6.4×10⁻¹ 1.7×10⁻⁴ 1.3×10⁻¹ 4.4×10⁻⁴ 1.3×10⁻³
η = 0.5 7.3×10⁻³ 7.0×10⁻³ 4.5×10⁻⁶ 8.9×10⁻² 6.6×10⁻⁵ 2.6×10⁻²
η = 0.75 1.9×10⁻⁴ 1.7×10⁻⁴ 3.6×10⁻⁷ 2.6×10⁻² 4.3×10⁻⁵ 1.4×10⁻¹
η = 1 2.5×10⁻¹⁰ 1.3×10⁻⁸ 9.2×10⁻⁹ 2.6×10⁻⁵ 3.6×10⁻⁵ 5.2×10⁻¹
Orthotropic rescaling
η = 0.25 2.6×10⁻⁵ 2.4×10⁻⁵ 9.9×10⁻⁵ 1.5×10⁻⁵ 1.2×10⁻⁴ 5.9×10⁻³
η = 0.5 5.1×10⁻⁷ 2.8×10⁻⁶ 9.8×10⁻⁷ 3.5×10⁻⁵ 6.2×10⁻⁶ 1.5×10⁻²
η = 0.75 1.1×10⁻⁸ 1.5×10⁻⁷ 8.2×10⁻⁸ 1.9×10⁻⁵ 5.1×10⁻⁶ 4.1×10⁻²
η = 1 9.2×10⁻¹¹ 1.1×10⁻⁸ 9.1×10⁻⁹ 1.4×10⁻⁵ 3.7×10⁻⁶ 1.1×10⁻¹
Table 6.1. χ2-values for the comparison with the VCCT results of the beam theory and orthotropic rescaling predictions
The values in Table 6.1 are graphically represented for the four thickness ratios considered in the following figures. The χ2-values for the different parameters of the η = 0.25 specimen are shown in Figure 6.25. The values for the η = 0.5 specimen are shown in Figure 6.26. Those for the η = 0.75 and η = 1 specimens are shown in Figure 6.27 and Figure 6.28, respectively.
Figure 6.25. χ2-values for the different parameters of the η = 0.25 specimen (light grey
corresponds to beam theory and dark grey to orthotropic rescaling)
1.E-05
1.E-03
1.E-01
GI GII G GII/G C Gd
χ2 -v
alue
1×10⁻⁵
1×10⁻³
1×10⁻¹
GI GII GII/G C Gδ G
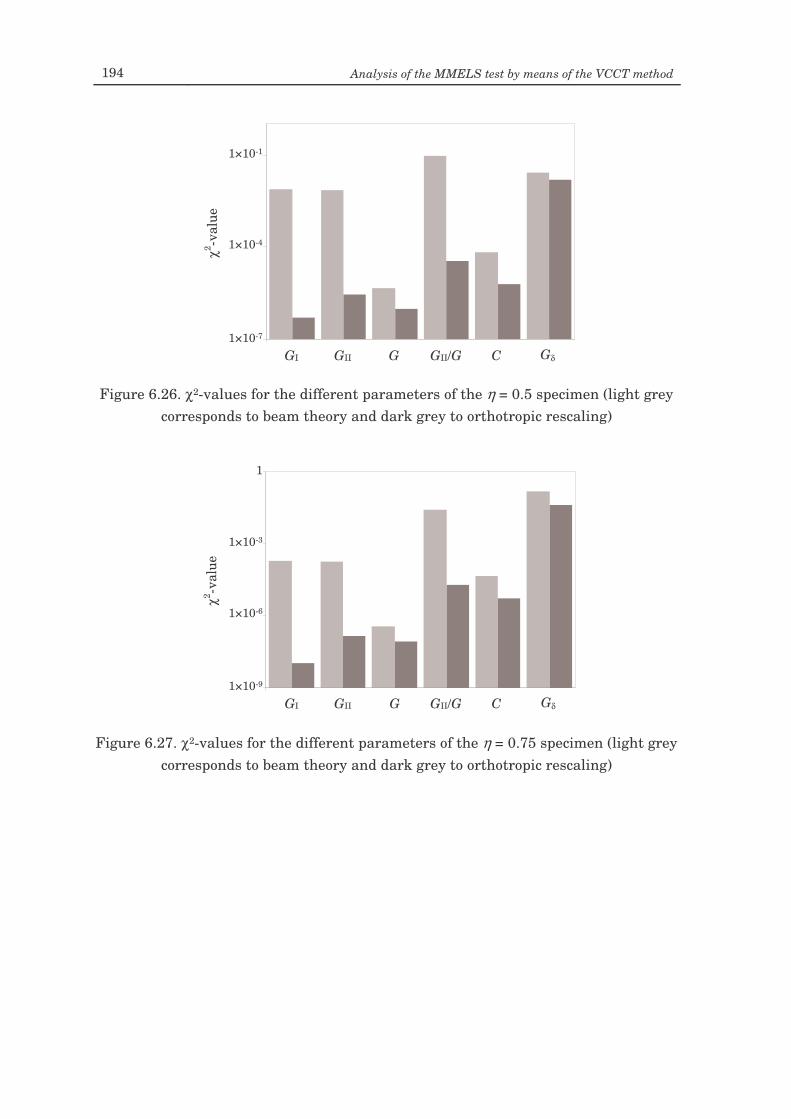
194 Analysis of the MMELS test by means of the VCCT method
Figure 6.26. χ2-values for the different parameters of the η = 0.5 specimen (light grey
corresponds to beam theory and dark grey to orthotropic rescaling)
Figure 6.27. χ2-values for the different parameters of the η = 0.75 specimen (light grey
corresponds to beam theory and dark grey to orthotropic rescaling)
1.E-09
1.E-06
1.E-03
1.E+00
GI GII G GII/G C Gd
χ2 -val
ue
1×10⁻⁹
1×10⁻⁶
1
GI GII GII/G C Gδ
1×10⁻³
G
1.E-07
1.E-04
1.E-01
GI GII G GII/G C Gd
χ2 -val
ue
1×10⁻⁷
1×10⁻⁴
1×10⁻¹
GI GII GII/G C Gδ G
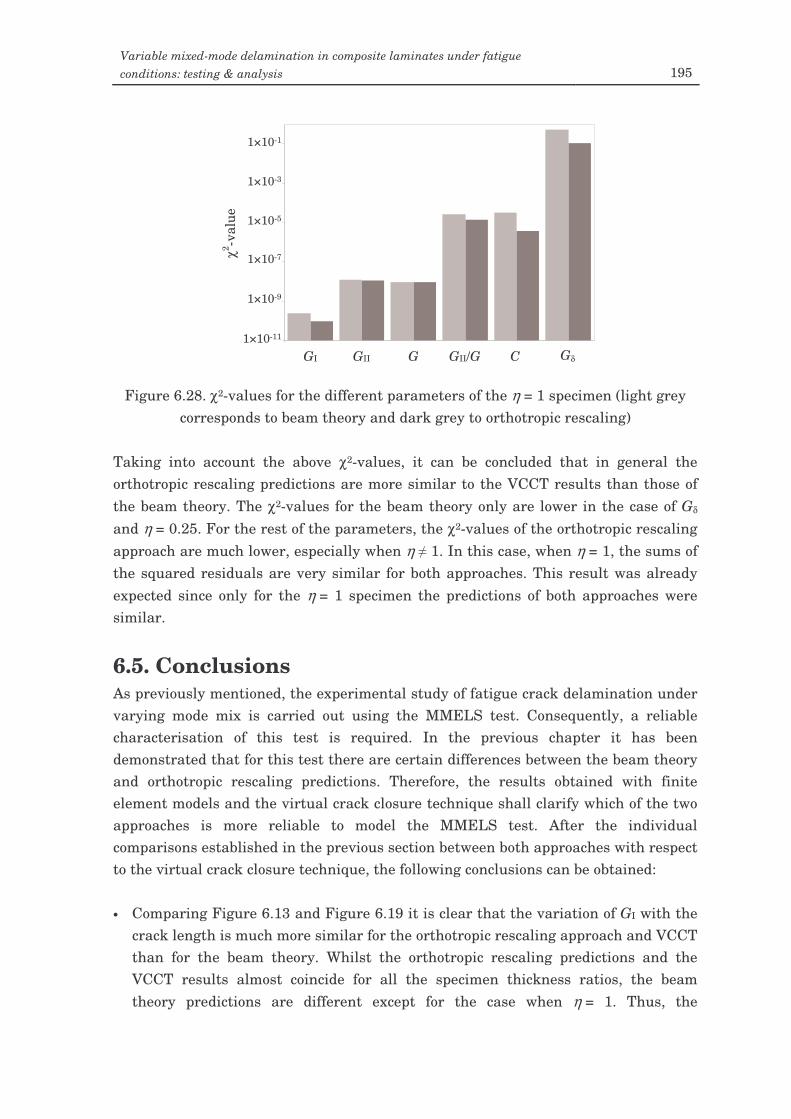
Variable mixed-mode delamination in composite laminates under fatigue conditions: testing & analysis 195
Figure 6.28. χ2-values for the different parameters of the η = 1 specimen (light grey
corresponds to beam theory and dark grey to orthotropic rescaling) Taking into account the above χ2-values, it can be concluded that in general the orthotropic rescaling predictions are more similar to the VCCT results than those of the beam theory. The χ2-values for the beam theory only are lower in the case of Gδ and η = 0.25. For the rest of the parameters, the χ2-values of the orthotropic rescaling approach are much lower, especially when η 1. In this case, when η = 1, the sums of the squared residuals are very similar for both approaches. This result was already expected since only for the η = 1 specimen the predictions of both approaches were similar.
6.5. Conclusions As previously mentioned, the experimental study of fatigue crack delamination under varying mode mix is carried out using the MMELS test. Consequently, a reliable characterisation of this test is required. In the previous chapter it has been demonstrated that for this test there are certain differences between the beam theory and orthotropic rescaling predictions. Therefore, the results obtained with finite element models and the virtual crack closure technique shall clarify which of the two approaches is more reliable to model the MMELS test. After the individual comparisons established in the previous section between both approaches with respect to the virtual crack closure technique, the following conclusions can be obtained: • Comparing Figure 6.13 and Figure 6.19 it is clear that the variation of GI with the
crack length is much more similar for the orthotropic rescaling approach and VCCT than for the beam theory. Whilst the orthotropic rescaling predictions and the VCCT results almost coincide for all the specimen thickness ratios, the beam theory predictions are different except for the case when η = 1. Thus, the
1.E-11
1.E-09
1.E-07
1.E-05
1.E-03
1.E-01
GI GII G GII/G C Gd
χ2 -val
ue
1×10-11
1×10⁻⁷
GI GII GII/G C Gδ
1×10⁻³
G
1×10⁻⁹
1×10⁻⁵
1×10⁻¹
196 Analysis of the MMELS test by means of the VCCT method
orthotropic rescaling approach can model the variation of GI with the crack length in the MMELS test in a better way.
• The comparison of Figure 6.14 and Figure 6.20 shows that the variation of GII with
the crack length predicted by the beam theory is very different to that predicted by the orthotropic rescaling approach and VCCT. On the contrary, the orthotropic rescaling predictions and the VCCT results almost coincide for all the specimen thickness ratios. The beam theory predictions are very different from those of the other two approaches except for the η = 1 specimen. Therefore, the orthotropic rescaling approach predicts more accurately the variation of GII with the crack length for the MMELS test.
• In the case of the total energy release rate, the differences between the beam
theory and orthotropic rescaling predictions with the VCCT results, Figure 6.15 and Figure 6.21, are very small in both cases. However, the orthotropic rescaling predictions and VCCT results are more similar. So, and although in this case the differences are less important, it can be also concluded that the orthotropic rescaling approach models in a better way the variation of G with the crack length for the MMELS test.
• Comparing Figure 6.16 and Figure 6.22 indicates that the variation of the mode
mix with the crack length is more similar for the orthotropic rescaling approach and VCCT than for the beam theory. While the beam theory predictions and the VCCT results only coincide for the η = 1 specimen, the orthotropic rescaling predictions and the VCCT results almost coincide for all the specimen thickness ratios. Consequently, the variation of GII/G with the crack length in the MMELS test is better modelled by the orthotropic rescaling approach.
• Considering the comparisons between the predictions of the compliance of the
system, Figure 6.17 and Figure 6.23, the differences are again higher between the beam theory predictions and the VCCT results. In general, the orthotropic rescaling predictions and the VCCT results are relatively similar, within a 5%. Only for the η = 0.25 specimen the difference is lower between beam theory and VCCT results. Therefore, the orthotropic rescaling approach models the variation of C with the crack length for the MMELS test in a better way.
• If Figure 6.18 and Figure 6.24 are compared, the variation with the crack length of
G under constant displacement predicted by the orthotropic rescaling approach is, in general, more similar to the VCCT results than that predicted by the beam theory. Only in the case of the η = 0.25 and 0.5 specimens and short crack lengths the relative difference is lower between beam theory and VCCT results. Actually, this result is a direct consequence of the tendency observed in the comparison of
Variable mixed-mode delamination in composite laminates under fatigue conditions: testing & analysis 197
the predicted compliances of the system. Thus, the orthotropic rescaling approach predicts more accurately the variation of G with the crack length under constant displacement for the MMELS test.
Because of the previous conclusions, it can be concluded that the orthotropic rescaling approach can be considered to model accurately the MMELS test. Although some differences exist in the determination of the compliance of the system and Gδ, these are basically due to the different test rig assumed. Whilst in the orthotropic rescaling approach the specimen was supposed to be ideally clamped, in the VCCT simulations a sliding clamped end of the specimen was assumed. Thus, the differences observed are mainly due to the compliance of the system without delamination. During the experimental study of fatigue crack propagation under varying mode mix, the orthotropic rescaling approach will be used to model the MMELS test.

Chapter 7 Experimental results
and discussion
7.1. Introduction As stated in the previous chapters, the main objective of the present work is the experimental study of fatigue delamination growth in unidirectional composite laminates under varying mode mix. The purpose of this experimental study is to mimic fatigue delamination in real composite structures in the laboratory. The experimental results aim to validate the non-monotonic model proposed in Chapter 3. Although the scatter of the results has not permitted the deduction of clear conclusions, the experimental procedure and results of the fatigue delamination tests under variable mixed-mode are presented and discussed in this chapter. A comparison is established between the experimental results and the predictions of the non-monotonic model. The experimental study is complemented with a fractographic analysis. The fracture surfaces of some of the specimens used during the testing are analysed with an scanning electron microscope. Some characteristic features are observed.
7.2. Experimental procedure As mentioned in Chapter 4, the fatigue delamination tests under varying mode mix were carried out at the installations of the Department of Solid Mechanics of the Royal Institute of Techonology (KTH), Stockholm (Sweden). The specimens were tested at room temperature under displacement control in an MTS 312-21 universal testing machine with a 500 N load cell. The applied load ratio was R = 0.1 and the load frequency was 2 Hz. The load system and the test rig have been previously described in Chapter 4. The load system applied the external load centred with the neutral axis of the loaded beam without artificial stiffening of the specimen. Thus, the correction factors for non-linear effects presented in section 5.3.2 have been neglected. The test rig employed was similar to the alternative MMELS test proposed by ESIS (Davies, 1992). Then, the loading point remained fixed while the clamped end of the
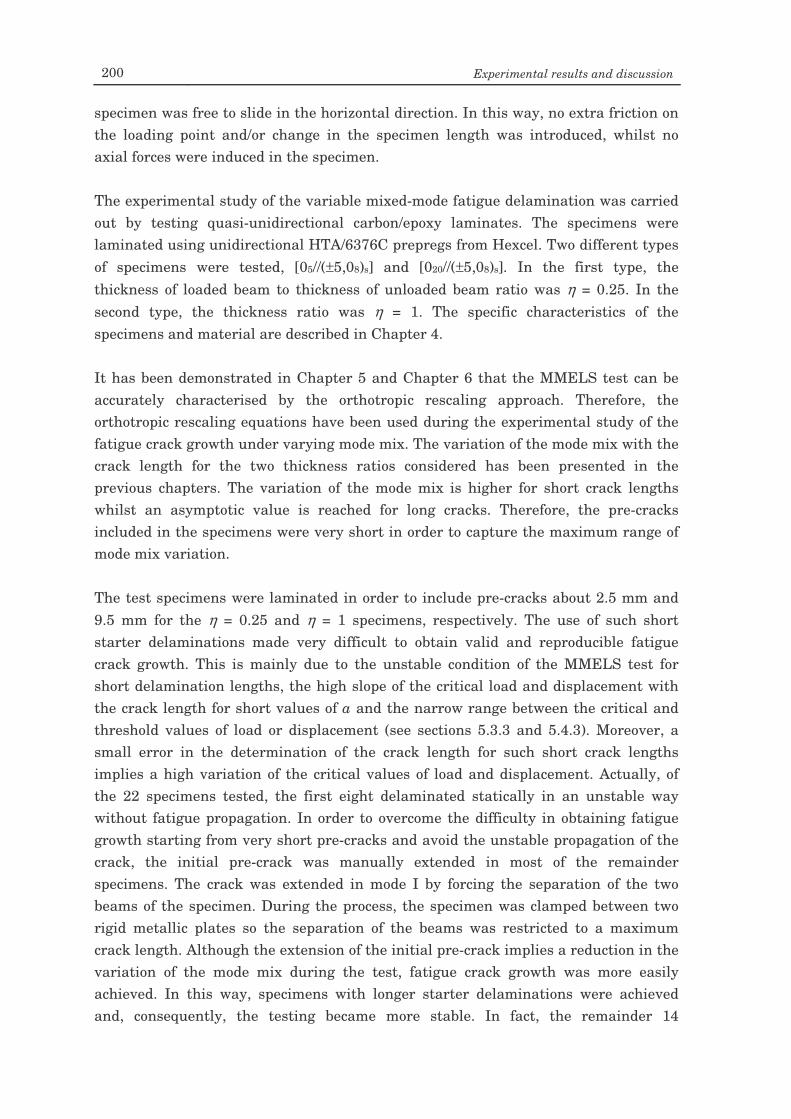
200 Experimental results and discussion
specimen was free to slide in the horizontal direction. In this way, no extra friction on the loading point and/or change in the specimen length was introduced, whilst no axial forces were induced in the specimen. The experimental study of the variable mixed-mode fatigue delamination was carried out by testing quasi-unidirectional carbon/epoxy laminates. The specimens were laminated using unidirectional HTA/6376C prepregs from Hexcel. Two different types of specimens were tested, [05//(±5,08)s] and [020//(±5,08)s]. In the first type, the thickness of loaded beam to thickness of unloaded beam ratio was η = 0.25. In the second type, the thickness ratio was η = 1. The specific characteristics of the specimens and material are described in Chapter 4. It has been demonstrated in Chapter 5 and Chapter 6 that the MMELS test can be accurately characterised by the orthotropic rescaling approach. Therefore, the orthotropic rescaling equations have been used during the experimental study of the fatigue crack growth under varying mode mix. The variation of the mode mix with the crack length for the two thickness ratios considered has been presented in the previous chapters. The variation of the mode mix is higher for short crack lengths whilst an asymptotic value is reached for long cracks. Therefore, the pre-cracks included in the specimens were very short in order to capture the maximum range of mode mix variation. The test specimens were laminated in order to include pre-cracks about 2.5 mm and 9.5 mm for the η = 0.25 and η = 1 specimens, respectively. The use of such short starter delaminations made very difficult to obtain valid and reproducible fatigue crack growth. This is mainly due to the unstable condition of the MMELS test for short delamination lengths, the high slope of the critical load and displacement with the crack length for short values of a and the narrow range between the critical and threshold values of load or displacement (see sections 5.3.3 and 5.4.3). Moreover, a small error in the determination of the crack length for such short crack lengths implies a high variation of the critical values of load and displacement. Actually, of the 22 specimens tested, the first eight delaminated statically in an unstable way without fatigue propagation. In order to overcome the difficulty in obtaining fatigue growth starting from very short pre-cracks and avoid the unstable propagation of the crack, the initial pre-crack was manually extended in most of the remainder specimens. The crack was extended in mode I by forcing the separation of the two beams of the specimen. During the process, the specimen was clamped between two rigid metallic plates so the separation of the beams was restricted to a maximum crack length. Although the extension of the initial pre-crack implies a reduction in the variation of the mode mix during the test, fatigue crack growth was more easily achieved. In this way, specimens with longer starter delaminations were achieved and, consequently, the testing became more stable. In fact, the remainder 14
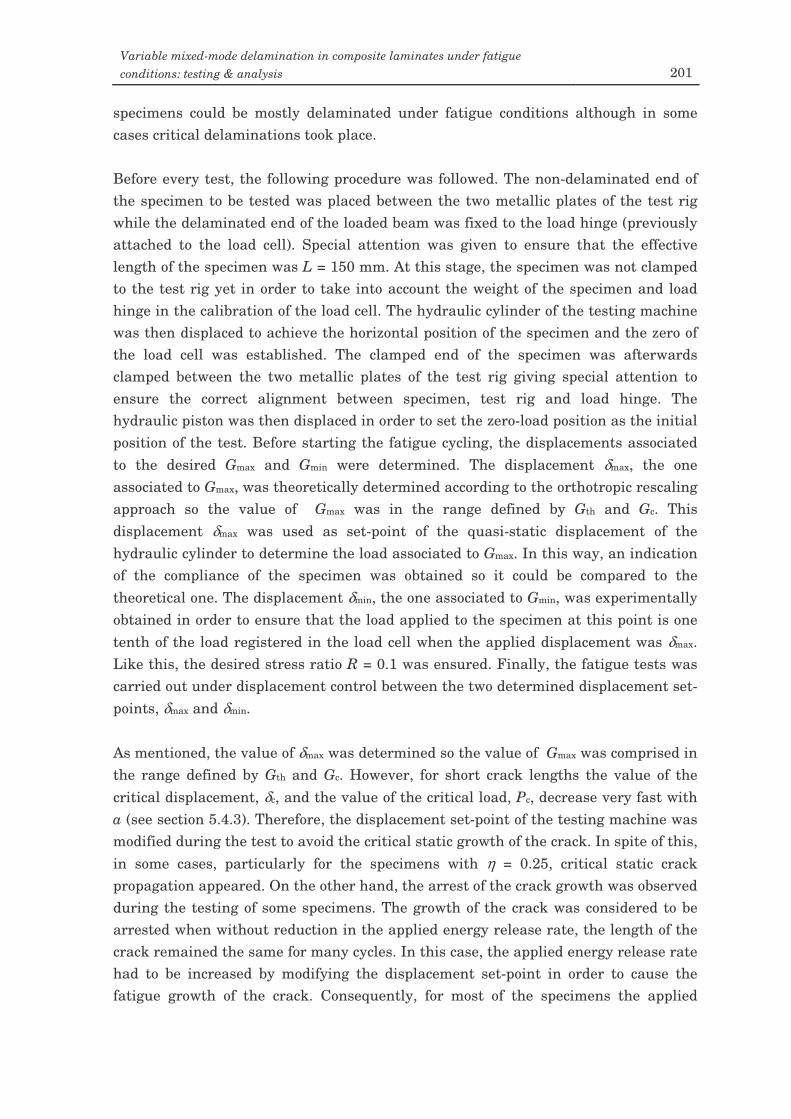
Variable mixed-mode delamination in composite laminates under fatigue conditions: testing & analysis 201
specimens could be mostly delaminated under fatigue conditions although in some cases critical delaminations took place. Before every test, the following procedure was followed. The non-delaminated end of the specimen to be tested was placed between the two metallic plates of the test rig while the delaminated end of the loaded beam was fixed to the load hinge (previously attached to the load cell). Special attention was given to ensure that the effective length of the specimen was L = 150 mm. At this stage, the specimen was not clamped to the test rig yet in order to take into account the weight of the specimen and load hinge in the calibration of the load cell. The hydraulic cylinder of the testing machine was then displaced to achieve the horizontal position of the specimen and the zero of the load cell was established. The clamped end of the specimen was afterwards clamped between the two metallic plates of the test rig giving special attention to ensure the correct alignment between specimen, test rig and load hinge. The hydraulic piston was then displaced in order to set the zero-load position as the initial position of the test. Before starting the fatigue cycling, the displacements associated to the desired Gmax and Gmin were determined. The displacement δmax, the one associated to Gmax, was theoretically determined according to the orthotropic rescaling approach so the value of Gmax was in the range defined by Gth and Gc. This displacement δmax was used as set-point of the quasi-static displacement of the hydraulic cylinder to determine the load associated to Gmax. In this way, an indication of the compliance of the specimen was obtained so it could be compared to the theoretical one. The displacement δmin, the one associated to Gmin, was experimentally obtained in order to ensure that the load applied to the specimen at this point is one tenth of the load registered in the load cell when the applied displacement was δmax. Like this, the desired stress ratio R = 0.1 was ensured. Finally, the fatigue tests was carried out under displacement control between the two determined displacement set-points, δmax and δmin. As mentioned, the value of δmax was determined so the value of Gmax was comprised in the range defined by Gth and Gc. However, for short crack lengths the value of the critical displacement, δc, and the value of the critical load, Pc, decrease very fast with a (see section 5.4.3). Therefore, the displacement set-point of the testing machine was modified during the test to avoid the critical static growth of the crack. In spite of this, in some cases, particularly for the specimens with η = 0.25, critical static crack propagation appeared. On the other hand, the arrest of the crack growth was observed during the testing of some specimens. The growth of the crack was considered to be arrested when without reduction in the applied energy release rate, the length of the crack remained the same for many cycles. In this case, the applied energy release rate had to be increased by modifying the displacement set-point in order to cause the fatigue growth of the crack. Consequently, for most of the specimens the applied
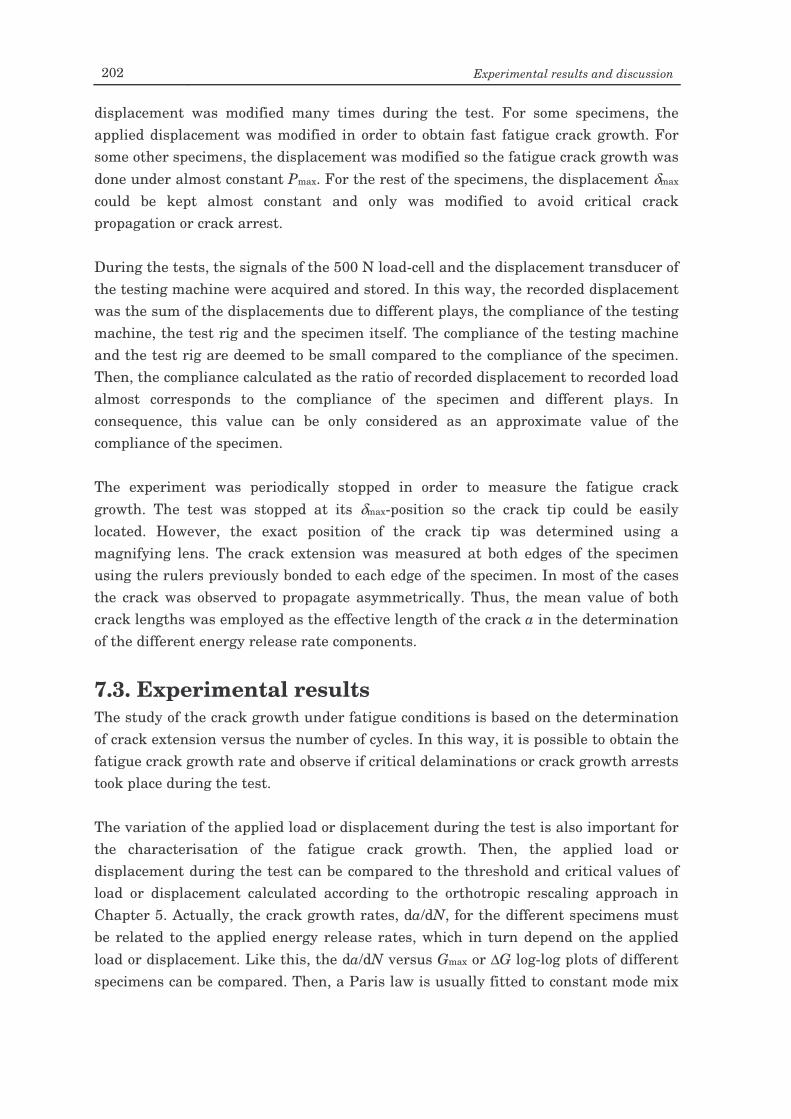
202 Experimental results and discussion
displacement was modified many times during the test. For some specimens, the applied displacement was modified in order to obtain fast fatigue crack growth. For some other specimens, the displacement was modified so the fatigue crack growth was done under almost constant Pmax. For the rest of the specimens, the displacement δmax could be kept almost constant and only was modified to avoid critical crack propagation or crack arrest. During the tests, the signals of the 500 N load-cell and the displacement transducer of the testing machine were acquired and stored. In this way, the recorded displacement was the sum of the displacements due to different plays, the compliance of the testing machine, the test rig and the specimen itself. The compliance of the testing machine and the test rig are deemed to be small compared to the compliance of the specimen. Then, the compliance calculated as the ratio of recorded displacement to recorded load almost corresponds to the compliance of the specimen and different plays. In consequence, this value can be only considered as an approximate value of the compliance of the specimen. The experiment was periodically stopped in order to measure the fatigue crack growth. The test was stopped at its δmax-position so the crack tip could be easily located. However, the exact position of the crack tip was determined using a magnifying lens. The crack extension was measured at both edges of the specimen using the rulers previously bonded to each edge of the specimen. In most of the cases the crack was observed to propagate asymmetrically. Thus, the mean value of both crack lengths was employed as the effective length of the crack a in the determination of the different energy release rate components.
7.3. Experimental results The study of the crack growth under fatigue conditions is based on the determination of crack extension versus the number of cycles. In this way, it is possible to obtain the fatigue crack growth rate and observe if critical delaminations or crack growth arrests took place during the test. The variation of the applied load or displacement during the test is also important for the characterisation of the fatigue crack growth. Then, the applied load or displacement during the test can be compared to the threshold and critical values of load or displacement calculated according to the orthotropic rescaling approach in Chapter 5. Actually, the crack growth rates, da/dN, for the different specimens must be related to the applied energy release rates, which in turn depend on the applied load or displacement. Like this, the da/dN versus Gmax or ∆G log-log plots of different specimens can be compared. Then, a Paris law is usually fitted to constant mode mix
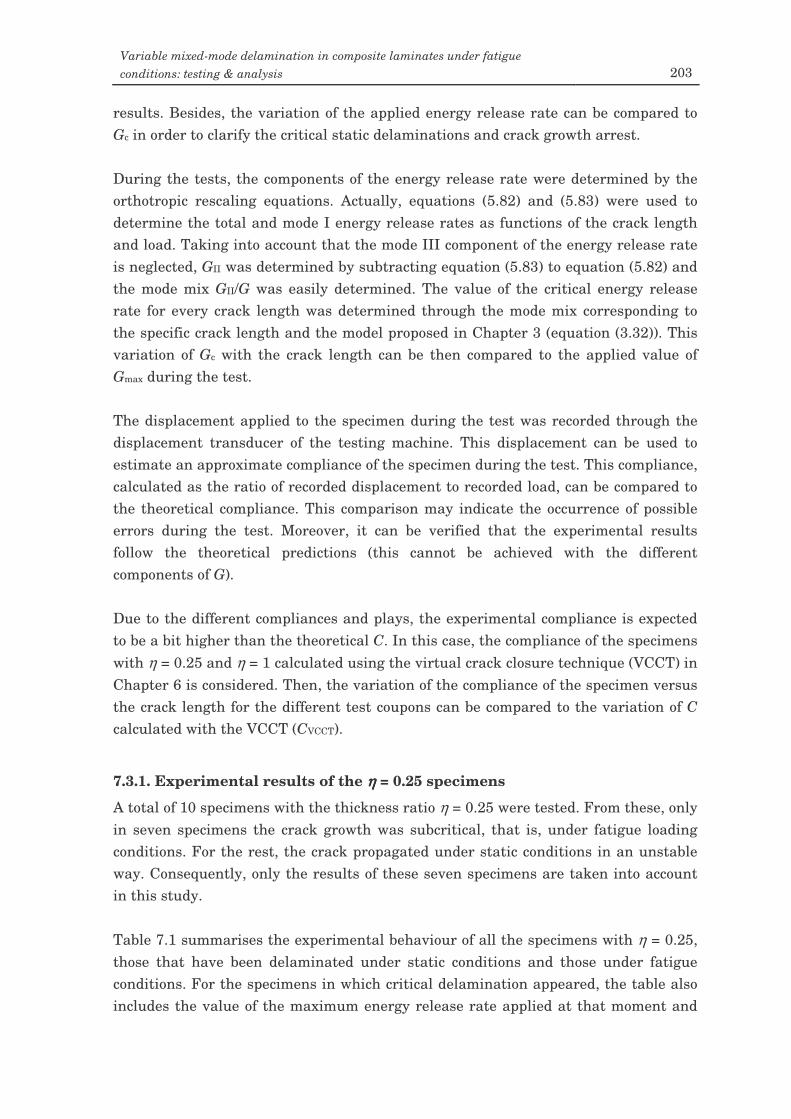
Variable mixed-mode delamination in composite laminates under fatigue conditions: testing & analysis 203
results. Besides, the variation of the applied energy release rate can be compared to Gc in order to clarify the critical static delaminations and crack growth arrest. During the tests, the components of the energy release rate were determined by the orthotropic rescaling equations. Actually, equations (5.82) and (5.83) were used to determine the total and mode I energy release rates as functions of the crack length and load. Taking into account that the mode III component of the energy release rate is neglected, GII was determined by subtracting equation (5.83) to equation (5.82) and the mode mix GII/G was easily determined. The value of the critical energy release rate for every crack length was determined through the mode mix corresponding to the specific crack length and the model proposed in Chapter 3 (equation (3.32)). This variation of Gc with the crack length can be then compared to the applied value of Gmax during the test. The displacement applied to the specimen during the test was recorded through the displacement transducer of the testing machine. This displacement can be used to estimate an approximate compliance of the specimen during the test. This compliance, calculated as the ratio of recorded displacement to recorded load, can be compared to the theoretical compliance. This comparison may indicate the occurrence of possible errors during the test. Moreover, it can be verified that the experimental results follow the theoretical predictions (this cannot be achieved with the different components of G). Due to the different compliances and plays, the experimental compliance is expected to be a bit higher than the theoretical C. In this case, the compliance of the specimens with η = 0.25 and η = 1 calculated using the virtual crack closure technique (VCCT) in Chapter 6 is considered. Then, the variation of the compliance of the specimen versus the crack length for the different test coupons can be compared to the variation of C calculated with the VCCT (CVCCT).
7.3.1. Experimental results of the ηηηη = 0.25 specimens
A total of 10 specimens with the thickness ratio η = 0.25 were tested. From these, only in seven specimens the crack growth was subcritical, that is, under fatigue loading conditions. For the rest, the crack propagated under static conditions in an unstable way. Consequently, only the results of these seven specimens are taken into account in this study. Table 7.1 summarises the experimental behaviour of all the specimens with η = 0.25, those that have been delaminated under static conditions and those under fatigue conditions. For the specimens in which critical delamination appeared, the table also includes the value of the maximum energy release rate applied at that moment and
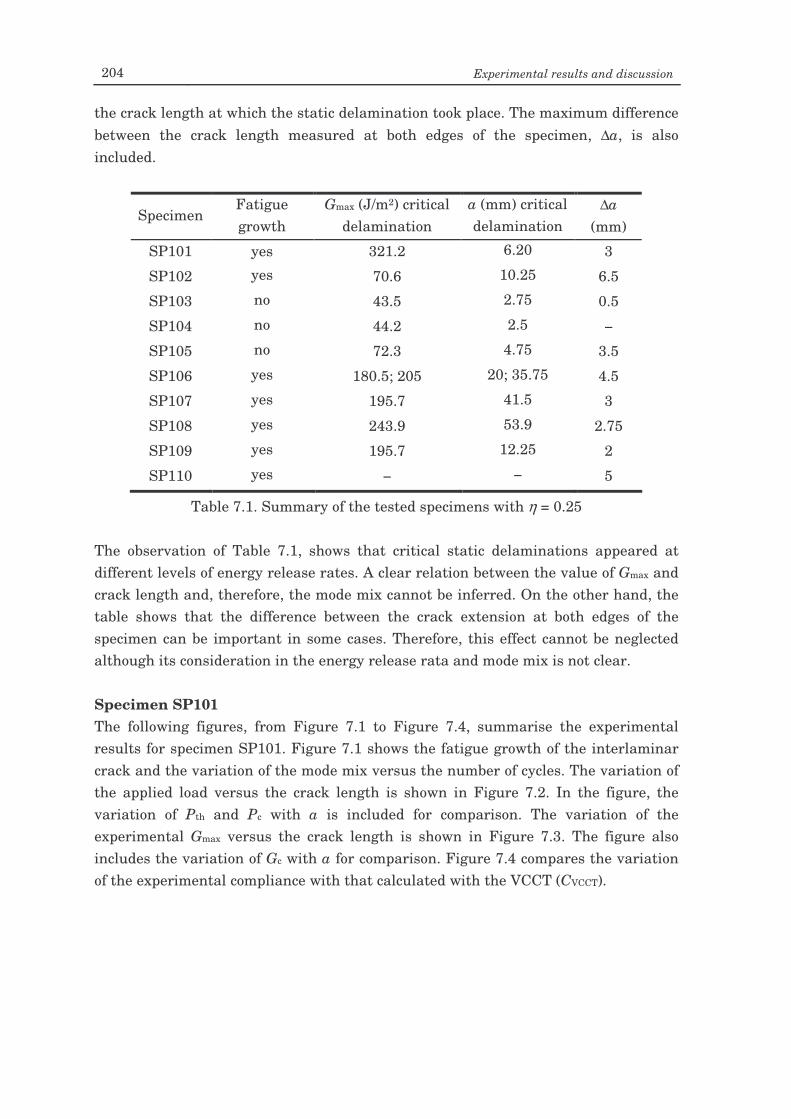
204 Experimental results and discussion
the crack length at which the static delamination took place. The maximum difference between the crack length measured at both edges of the specimen, ∆a, is also included.
Specimen Fatigue growth
Gmax (J/m2) critical delamination
a (mm) critical delamination
∆a (mm)
SP101 yes 321.2 6.20 3
SP102 yes 70.6 10.25 6.5
SP103 no 43.5 2.75 0.5
SP104 no 44.2 2.5 −
SP105 no 72.3 4.75 3.5
SP106 yes 180.5; 205 20; 35.75 4.5
SP107 yes 195.7 41.5 3
SP108 yes 243.9 53.9 2.75
SP109 yes 195.7 12.25 2
SP110 yes − − 5
Table 7.1. Summary of the tested specimens with η = 0.25 The observation of Table 7.1, shows that critical static delaminations appeared at different levels of energy release rates. A clear relation between the value of Gmax and crack length and, therefore, the mode mix cannot be inferred. On the other hand, the table shows that the difference between the crack extension at both edges of the specimen can be important in some cases. Therefore, this effect cannot be neglected although its consideration in the energy release rata and mode mix is not clear. Specimen SP101 The following figures, from Figure 7.1 to Figure 7.4, summarise the experimental results for specimen SP101. Figure 7.1 shows the fatigue growth of the interlaminar crack and the variation of the mode mix versus the number of cycles. The variation of the applied load versus the crack length is shown in Figure 7.2. In the figure, the variation of Pth and Pc with a is included for comparison. The variation of the experimental Gmax versus the crack length is shown in Figure 7.3. The figure also includes the variation of Gc with a for comparison. Figure 7.4 compares the variation of the experimental compliance with that calculated with the VCCT (CVCCT).
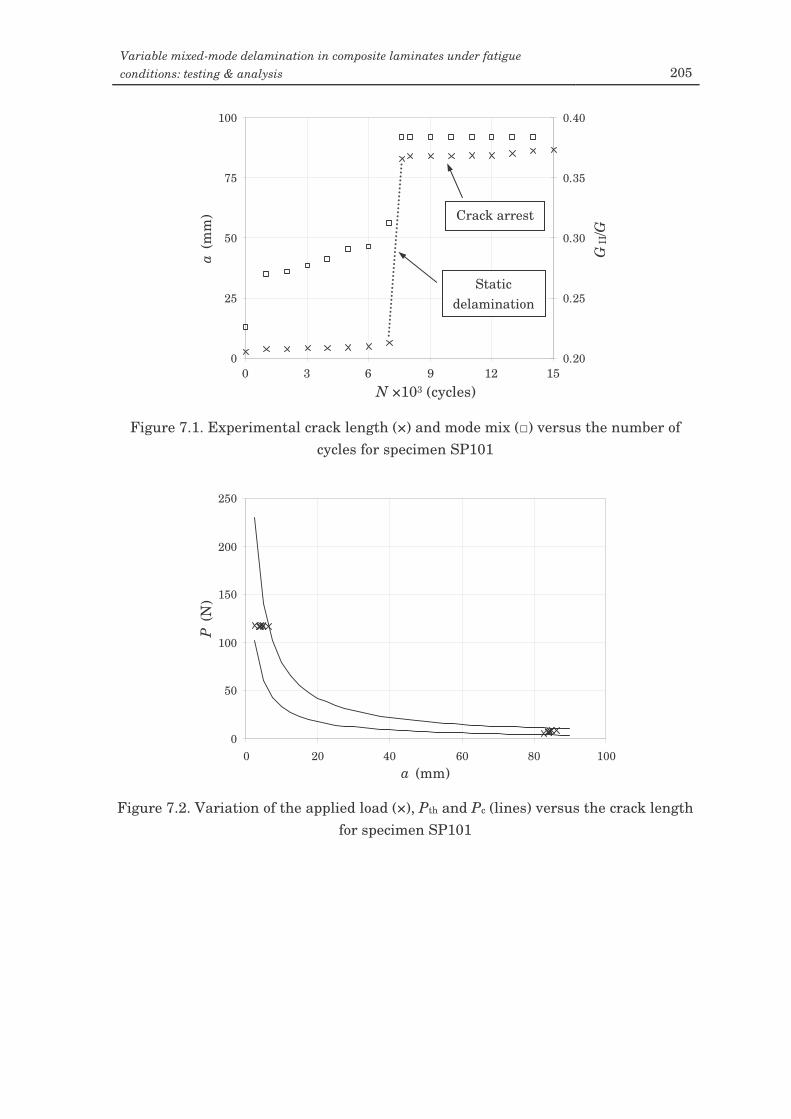
Variable mixed-mode delamination in composite laminates under fatigue conditions: testing & analysis 205
Figure 7.1. Experimental crack length (×) and mode mix () versus the number of
cycles for specimen SP101
0
50
100
150
200
250
0 20 40 60 80 100a (mm)
P (N
)
Figure 7.2. Variation of the applied load (×), Pth and Pc (lines) versus the crack length
for specimen SP101
0
25
50
75
100
0 3000 6000 9000 12000 15000N (cycles)
a (m
m)
0.20
0.25
0.30
0.35
0.40
GII
/G
Static delamination
0 15 3 6 9 12
N ×103 (cycles)
Crack arrest
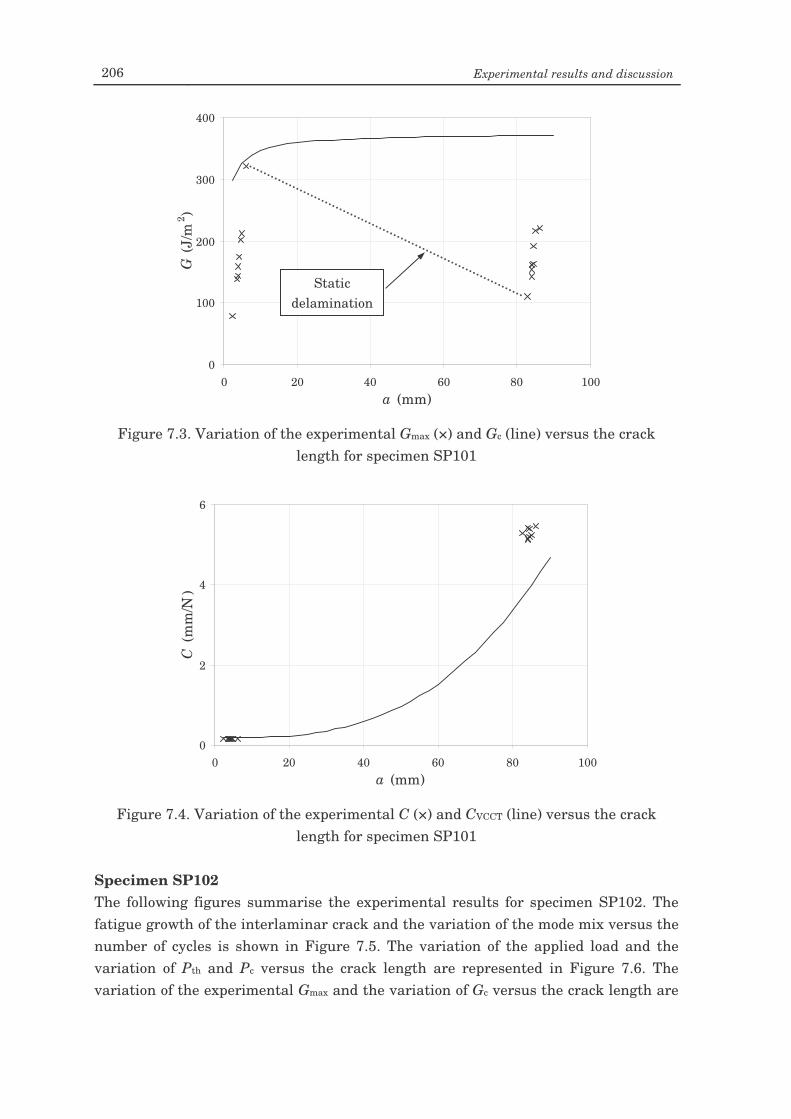
206 Experimental results and discussion
Figure 7.3. Variation of the experimental Gmax (×) and Gc (line) versus the crack
length for specimen SP101
0
2
4
6
0 20 40 60 80 100a (mm)
C (m
m/N
)
Figure 7.4. Variation of the experimental C (×) and CVCCT (line) versus the crack
length for specimen SP101 Specimen SP102 The following figures summarise the experimental results for specimen SP102. The fatigue growth of the interlaminar crack and the variation of the mode mix versus the number of cycles is shown in Figure 7.5. The variation of the applied load and the variation of Pth and Pc versus the crack length are represented in Figure 7.6. The variation of the experimental Gmax and the variation of Gc versus the crack length are
0
100
200
300
400
0 20 40 60 80 100a (mm)
G (J
/m2 )
Static delamination
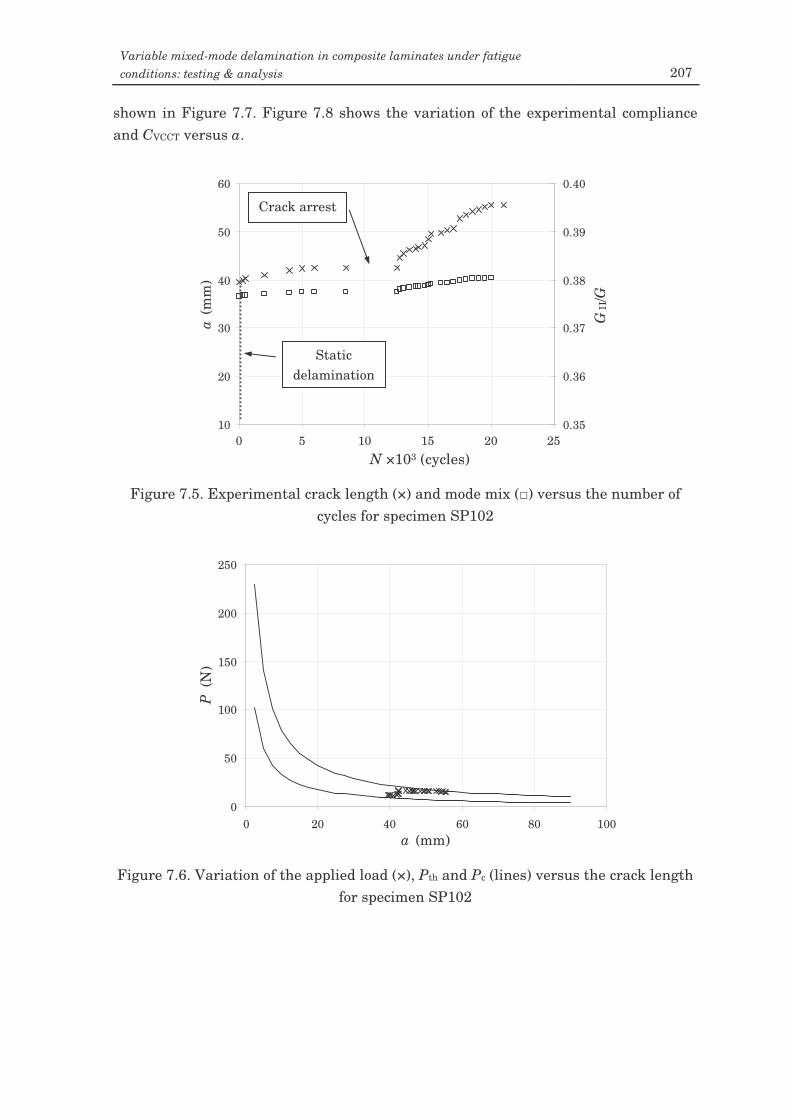
Variable mixed-mode delamination in composite laminates under fatigue conditions: testing & analysis 207
shown in Figure 7.7. Figure 7.8 shows the variation of the experimental compliance and CVCCT versus a.
Figure 7.5. Experimental crack length (×) and mode mix () versus the number of
cycles for specimen SP102
0
50
100
150
200
250
0 20 40 60 80 100a (mm)
P (
N)
Figure 7.6. Variation of the applied load (×), Pth and Pc (lines) versus the crack length
for specimen SP102
10
20
30
40
50
60
0 5000 10000 15000 20000 25000N (cycles)
a (m
m)
0.35
0.36
0.37
0.38
0.39
0.40
GII
/G
Crack arrest
Static delamination
0 25 5 10 15 20
N ×103 (cycles)
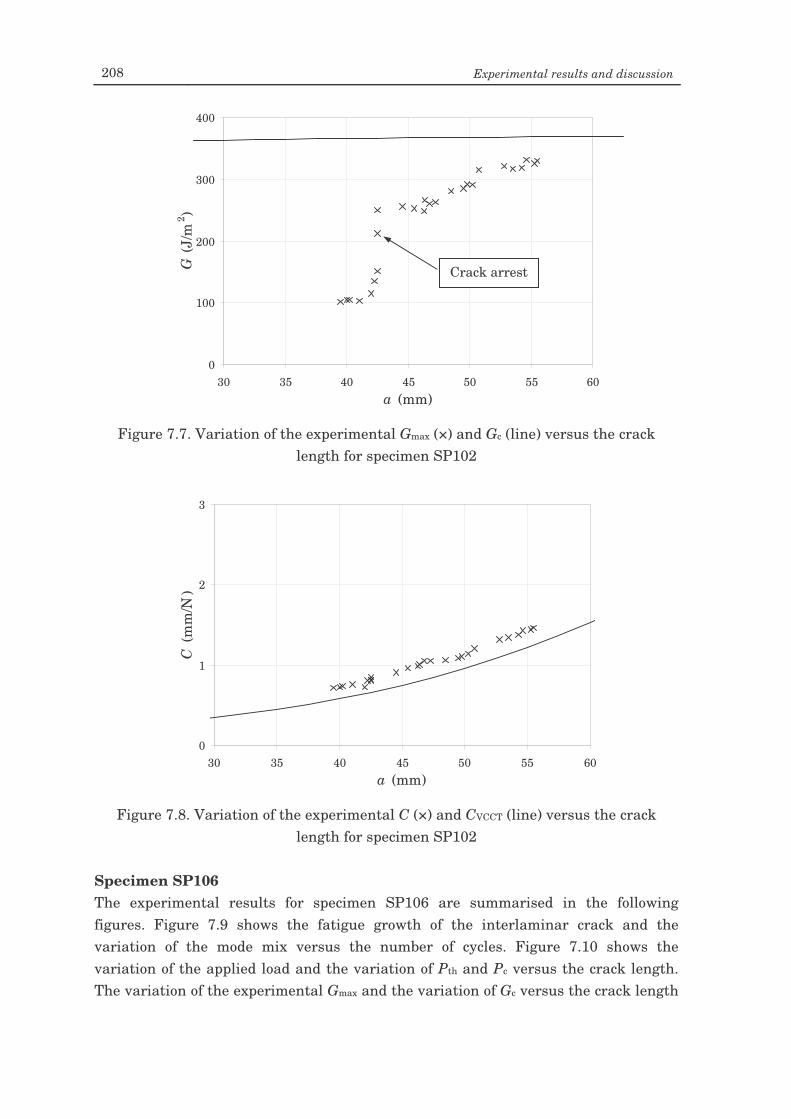
208 Experimental results and discussion
Figure 7.7. Variation of the experimental Gmax (×) and Gc (line) versus the crack
length for specimen SP102
0
1
2
3
30 35 40 45 50 55 60a (mm)
C (m
m/N
)
Figure 7.8. Variation of the experimental C (×) and CVCCT (line) versus the crack
length for specimen SP102 Specimen SP106 The experimental results for specimen SP106 are summarised in the following figures. Figure 7.9 shows the fatigue growth of the interlaminar crack and the variation of the mode mix versus the number of cycles. Figure 7.10 shows the variation of the applied load and the variation of Pth and Pc versus the crack length. The variation of the experimental Gmax and the variation of Gc versus the crack length
0
100
200
300
400
30 35 40 45 50 55 60a (mm)
G (J
/m2 )
Crack arrest
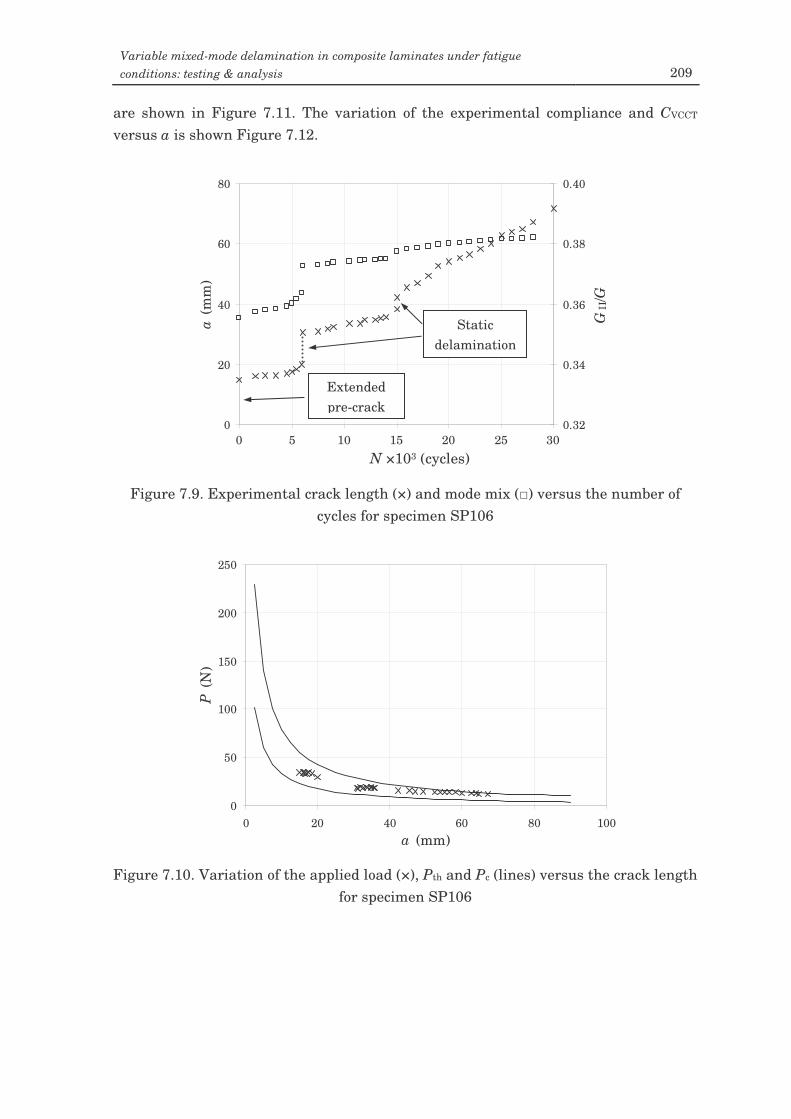
Variable mixed-mode delamination in composite laminates under fatigue conditions: testing & analysis 209
are shown in Figure 7.11. The variation of the experimental compliance and CVCCT versus a is shown Figure 7.12.
Figure 7.9. Experimental crack length (×) and mode mix () versus the number of
cycles for specimen SP106
0
50
100
150
200
250
0 20 40 60 80 100a (mm)
P (N
)
Figure 7.10. Variation of the applied load (×), Pth and Pc (lines) versus the crack length
for specimen SP106
0
20
40
60
80
0 5000 10000 15000 20000 25000 30000N (cycles)
a (m
m)
0.32
0.34
0.36
0.38
0.40
GII
/G
Static delamination
0 25 5 10 15 20
N ×103 (cycles) 30
Extended pre-crack
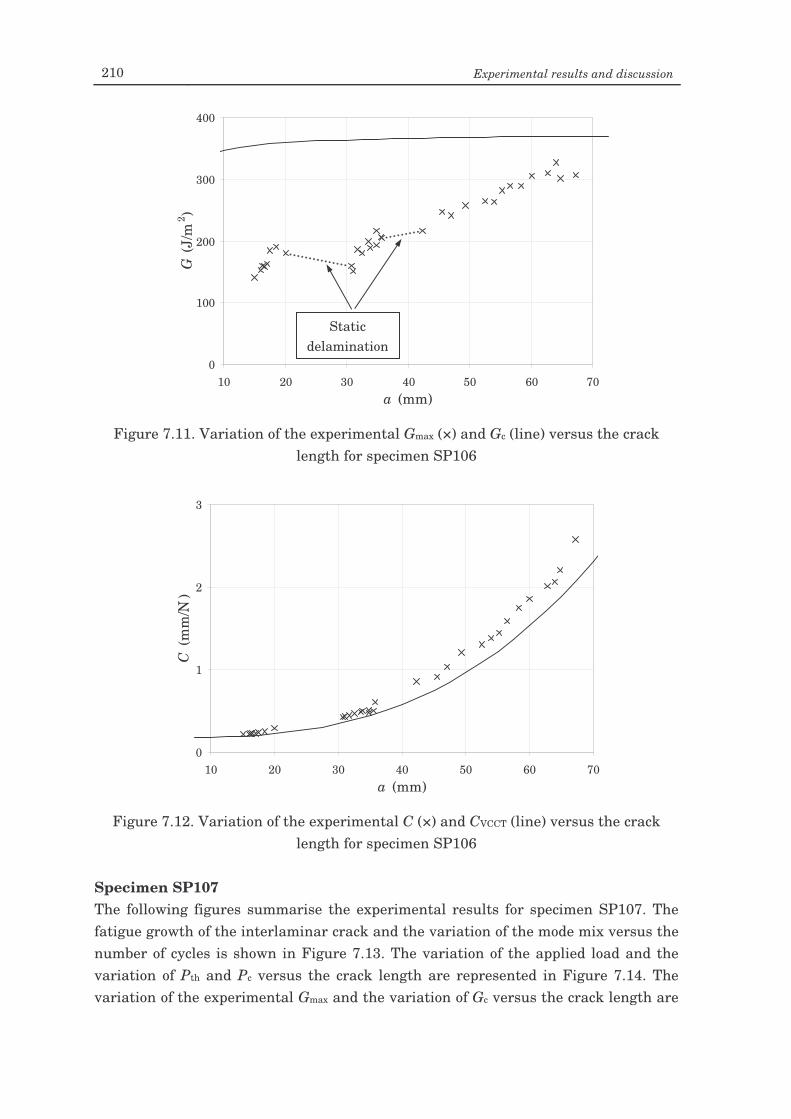
210 Experimental results and discussion
Figure 7.11. Variation of the experimental Gmax (×) and Gc (line) versus the crack
length for specimen SP106
0
1
2
3
10 20 30 40 50 60 70a (mm)
C (m
m/N
)
Figure 7.12. Variation of the experimental C (×) and CVCCT (line) versus the crack
length for specimen SP106 Specimen SP107 The following figures summarise the experimental results for specimen SP107. The fatigue growth of the interlaminar crack and the variation of the mode mix versus the number of cycles is shown in Figure 7.13. The variation of the applied load and the variation of Pth and Pc versus the crack length are represented in Figure 7.14. The variation of the experimental Gmax and the variation of Gc versus the crack length are
0
100
200
300
400
10 20 30 40 50 60 70a (mm)
G (J
/m2 )
Static delamination
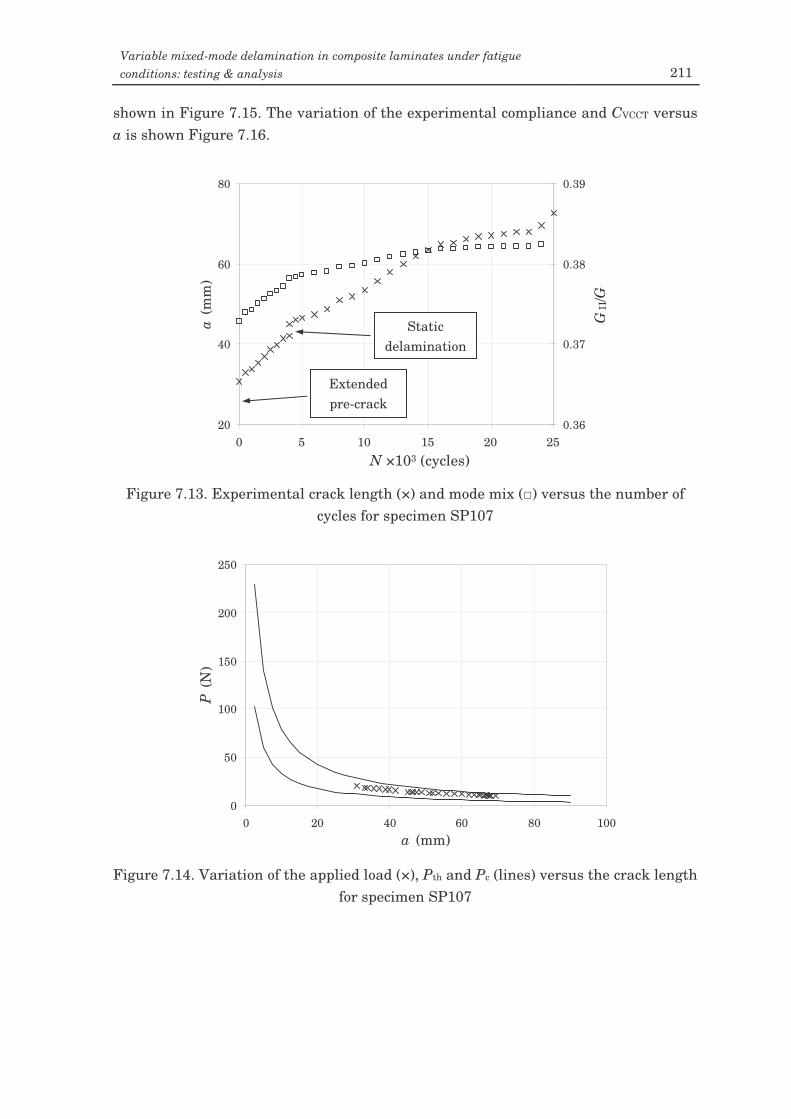
Variable mixed-mode delamination in composite laminates under fatigue conditions: testing & analysis 211
shown in Figure 7.15. The variation of the experimental compliance and CVCCT versus a is shown Figure 7.16.
Figure 7.13. Experimental crack length (×) and mode mix () versus the number of
cycles for specimen SP107
0
50
100
150
200
250
0 20 40 60 80 100a (mm)
P (N
)
Figure 7.14. Variation of the applied load (×), Pth and Pc (lines) versus the crack length
for specimen SP107
20
40
60
80
0 5000 10000 15000 20000 25000N (cycles)
a (m
m)
0.36
0.37
0.38
0.39
GII
/G
Static delamination
0 5 10 15 20
N ×103 (cycles) 25
Extended pre-crack
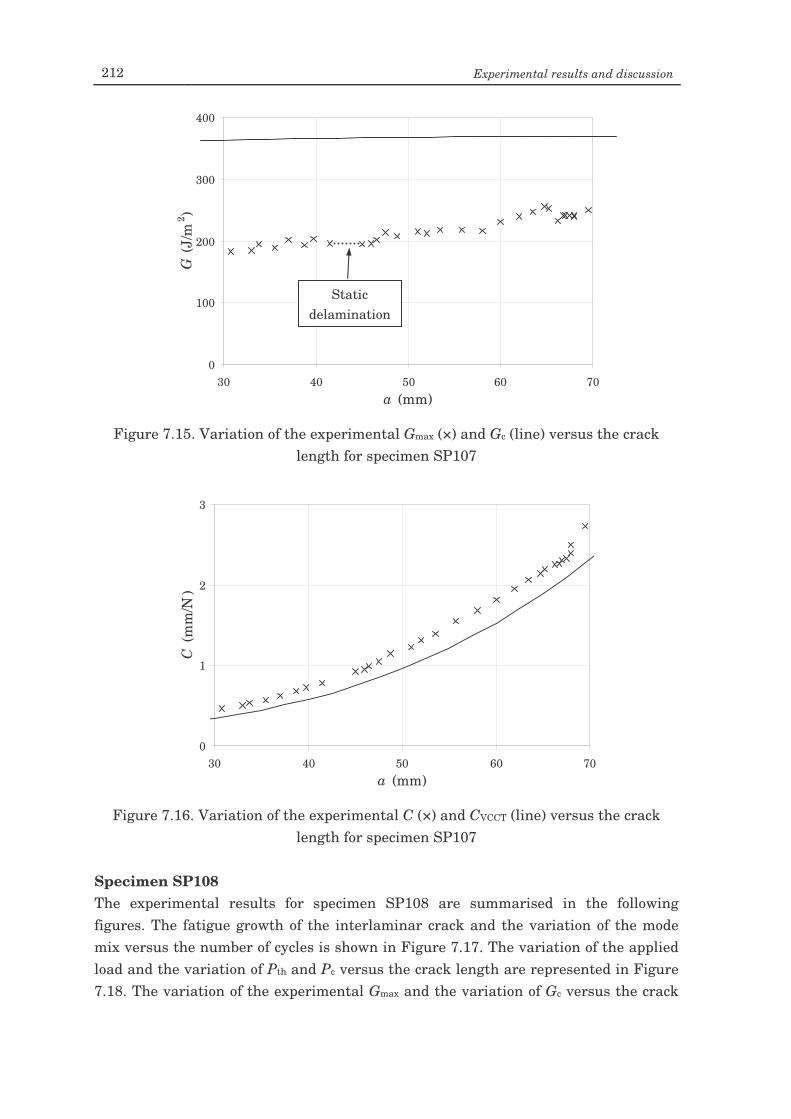
212 Experimental results and discussion
Figure 7.15. Variation of the experimental Gmax (×) and Gc (line) versus the crack
length for specimen SP107
0
1
2
3
30 40 50 60 70a (mm)
C (m
m/N
)
Figure 7.16. Variation of the experimental C (×) and CVCCT (line) versus the crack
length for specimen SP107 Specimen SP108 The experimental results for specimen SP108 are summarised in the following figures. The fatigue growth of the interlaminar crack and the variation of the mode mix versus the number of cycles is shown in Figure 7.17. The variation of the applied load and the variation of Pth and Pc versus the crack length are represented in Figure 7.18. The variation of the experimental Gmax and the variation of Gc versus the crack
0
100
200
300
400
30 40 50 60 70a (mm)
G (J
/m2 )
Static delamination
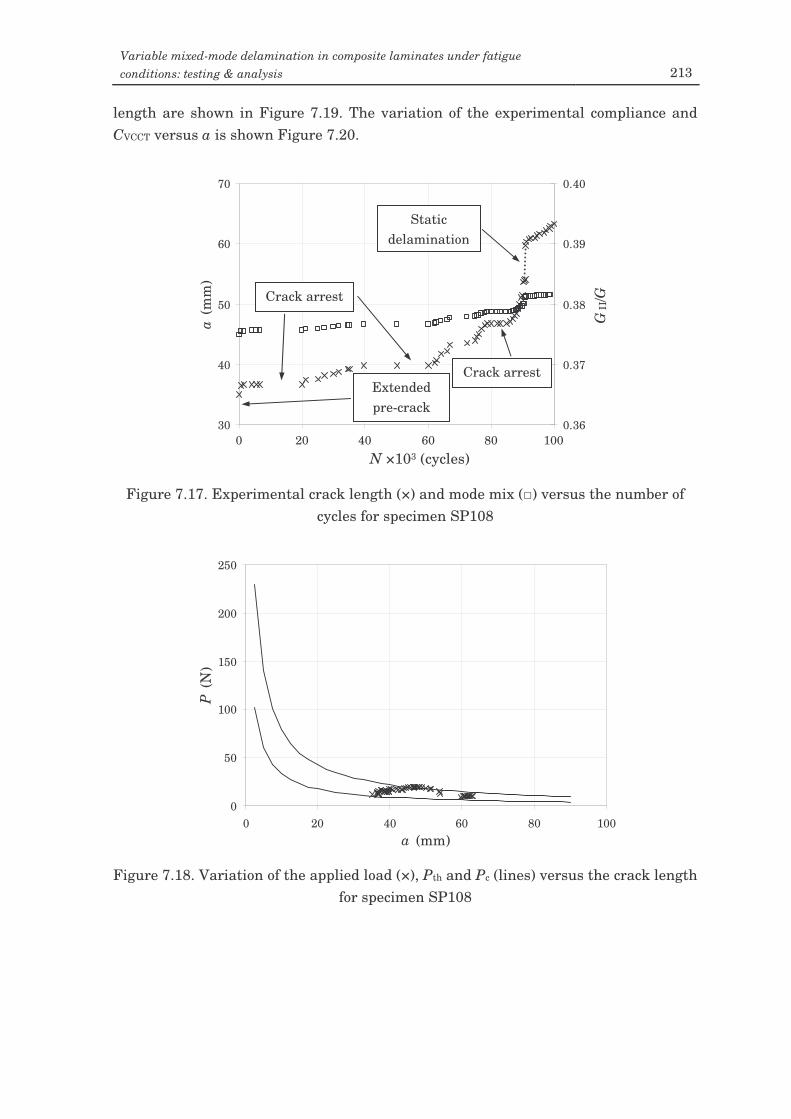
Variable mixed-mode delamination in composite laminates under fatigue conditions: testing & analysis 213
length are shown in Figure 7.19. The variation of the experimental compliance and CVCCT versus a is shown Figure 7.20.
Figure 7.17. Experimental crack length (×) and mode mix () versus the number of
cycles for specimen SP108
0
50
100
150
200
250
0 20 40 60 80 100a (mm)
P (N
)
Figure 7.18. Variation of the applied load (×), Pth and Pc (lines) versus the crack length
for specimen SP108
30
40
50
60
70
0 20000 40000 60000 80000 100000N (cycles)
a (m
m)
0.36
0.37
0.38
0.39
0.40
GII
/G
Static delamination
Crack arrest
0 100 20 40 60 80
N ×103 (cycles)
Extended pre-crack
Crack arrest
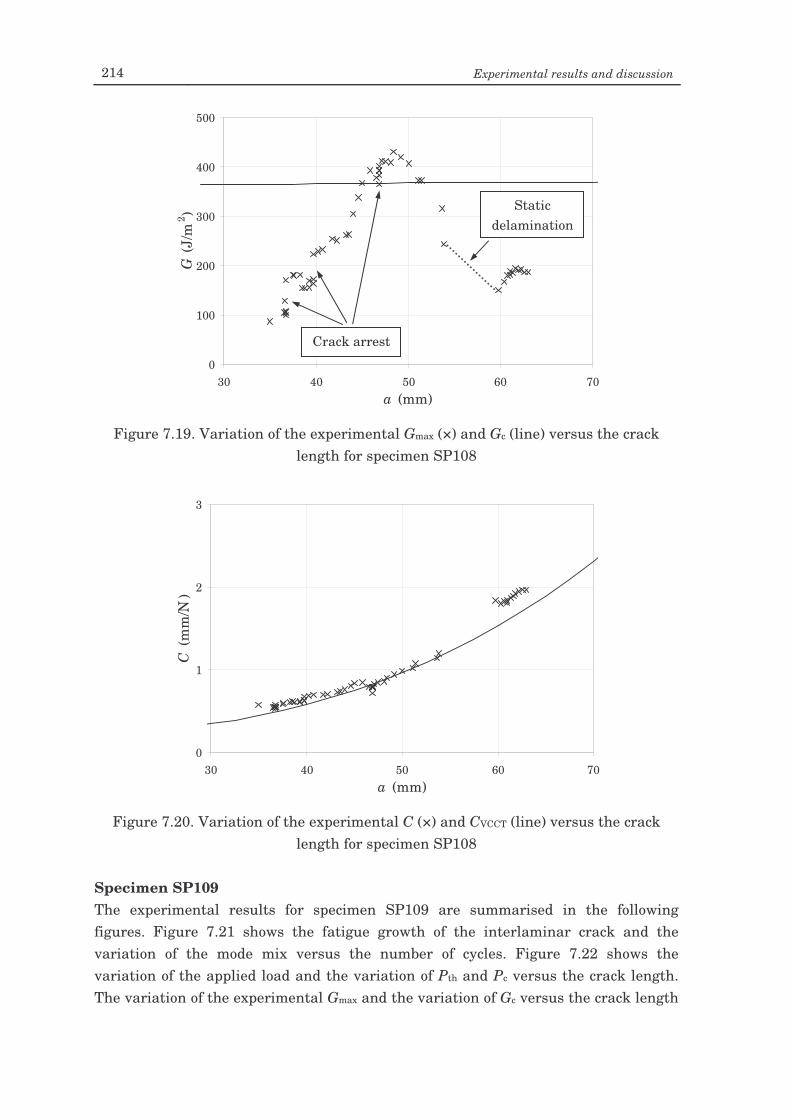
214 Experimental results and discussion
Figure 7.19. Variation of the experimental Gmax (×) and Gc (line) versus the crack
length for specimen SP108
0
1
2
3
30 40 50 60 70a (mm)
C (m
m/N
)
Figure 7.20. Variation of the experimental C (×) and CVCCT (line) versus the crack
length for specimen SP108 Specimen SP109 The experimental results for specimen SP109 are summarised in the following figures. Figure 7.21 shows the fatigue growth of the interlaminar crack and the variation of the mode mix versus the number of cycles. Figure 7.22 shows the variation of the applied load and the variation of Pth and Pc versus the crack length. The variation of the experimental Gmax and the variation of Gc versus the crack length
0
100
200
300
400
500
30 40 50 60 70a (mm)
G (J
/m2 ) Static
delamination
Crack arrest
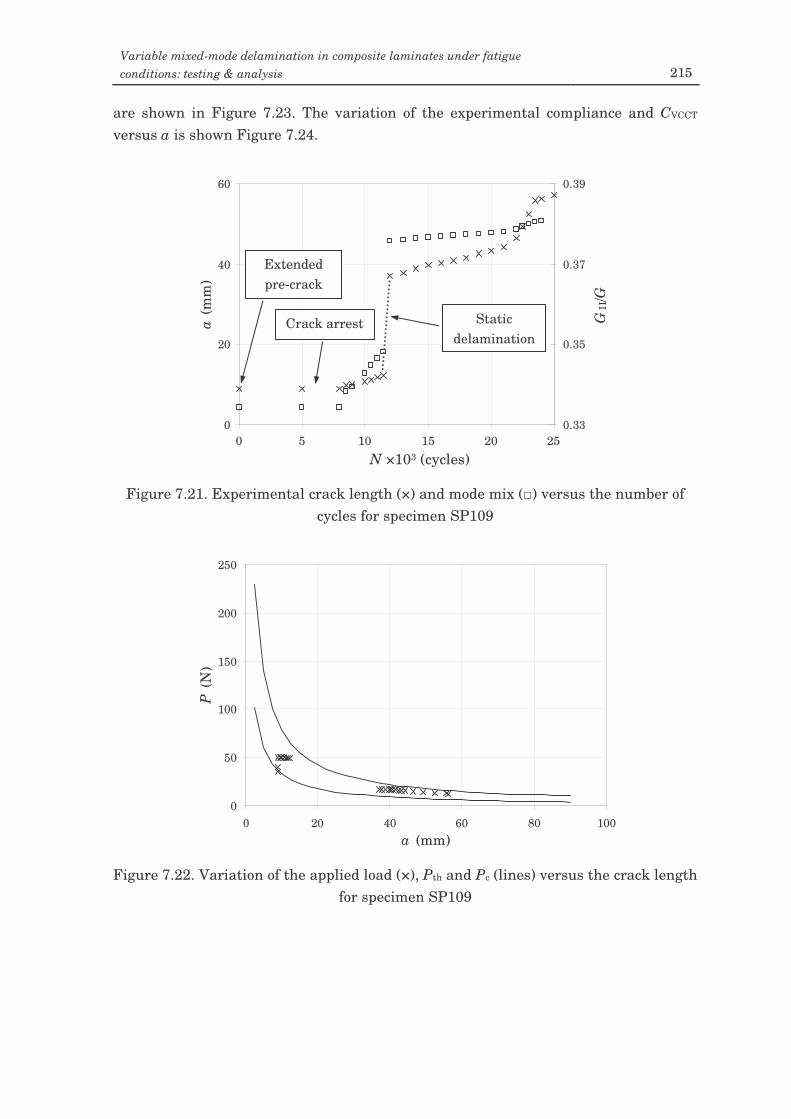
Variable mixed-mode delamination in composite laminates under fatigue conditions: testing & analysis 215
are shown in Figure 7.23. The variation of the experimental compliance and CVCCT versus a is shown Figure 7.24.
Figure 7.21. Experimental crack length (×) and mode mix () versus the number of
cycles for specimen SP109
0
50
100
150
200
250
0 20 40 60 80 100a (mm)
P (N
)
Figure 7.22. Variation of the applied load (×), Pth and Pc (lines) versus the crack length
for specimen SP109
0
20
40
60
0 5000 10000 15000 20000 25000N (cycles)
a (m
m)
0.33
0.35
0.37
0.39
GII
/G
Static delamination
Crack arrest
0 25 5 10 15 20
N ×103 (cycles)
Extended pre-crack
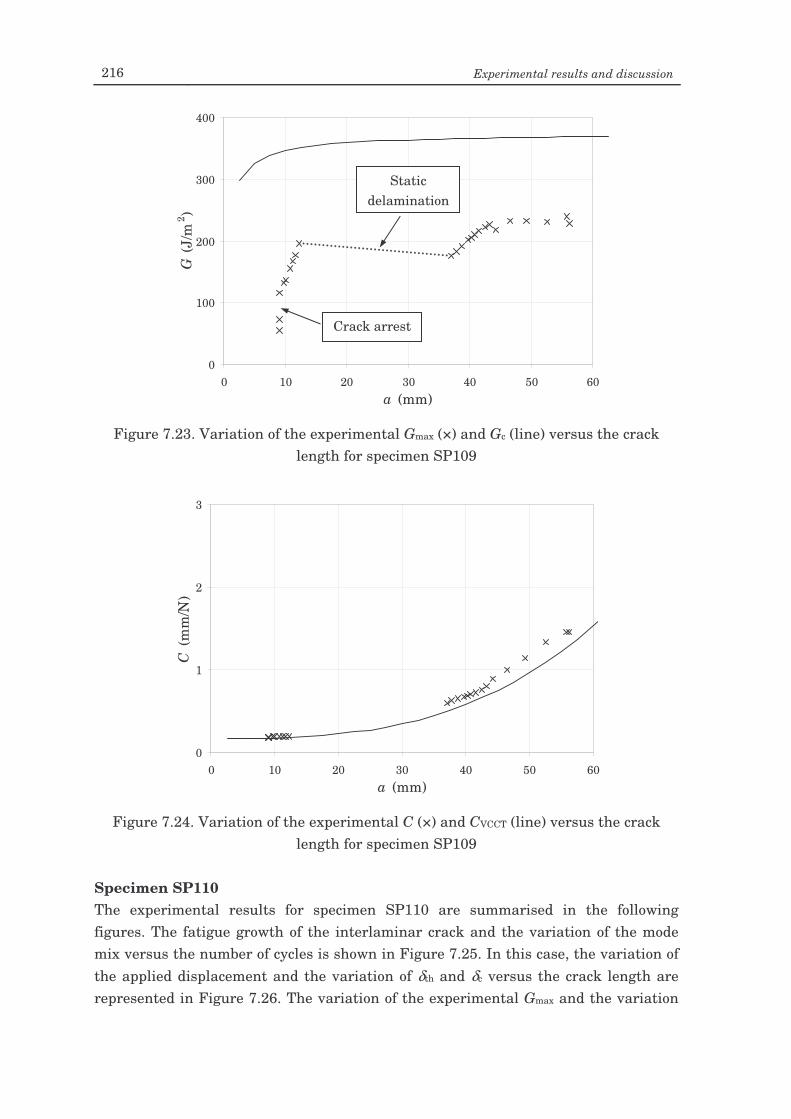
216 Experimental results and discussion
Figure 7.23. Variation of the experimental Gmax (×) and Gc (line) versus the crack
length for specimen SP109
0
1
2
3
0 10 20 30 40 50 60a (mm)
C (m
m/N
)
Figure 7.24. Variation of the experimental C (×) and CVCCT (line) versus the crack
length for specimen SP109 Specimen SP110 The experimental results for specimen SP110 are summarised in the following figures. The fatigue growth of the interlaminar crack and the variation of the mode mix versus the number of cycles is shown in Figure 7.25. In this case, the variation of the applied displacement and the variation of δth and δc versus the crack length are represented in Figure 7.26. The variation of the experimental Gmax and the variation
0
100
200
300
400
0 10 20 30 40 50 60a (mm)
G (J
/m2 )
Static delamination
Crack arrest
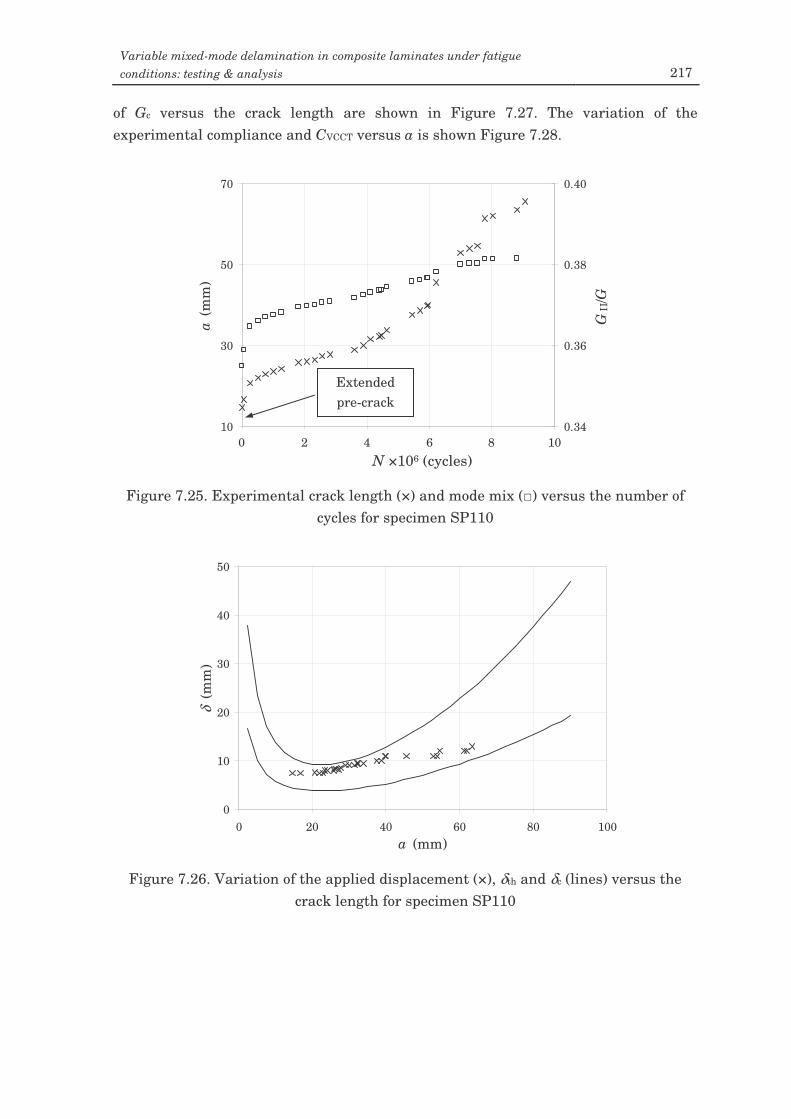
Variable mixed-mode delamination in composite laminates under fatigue conditions: testing & analysis 217
of Gc versus the crack length are shown in Figure 7.27. The variation of the experimental compliance and CVCCT versus a is shown Figure 7.28.
Figure 7.25. Experimental crack length (×) and mode mix () versus the number of
cycles for specimen SP110
0
10
20
30
40
50
0 20 40 60 80 100a (mm)
δ (m
m)
Figure 7.26. Variation of the applied displacement (×), δth and δc (lines) versus the
crack length for specimen SP110
10
30
50
70
0 2000000 4000000 6000000 8000000 10000000N (cycles)
a (m
m)
0.34
0.36
0.38
0.40
GII
/G
0 2 N ×106 (cycles)
4 6 8
Extended pre-crack
10
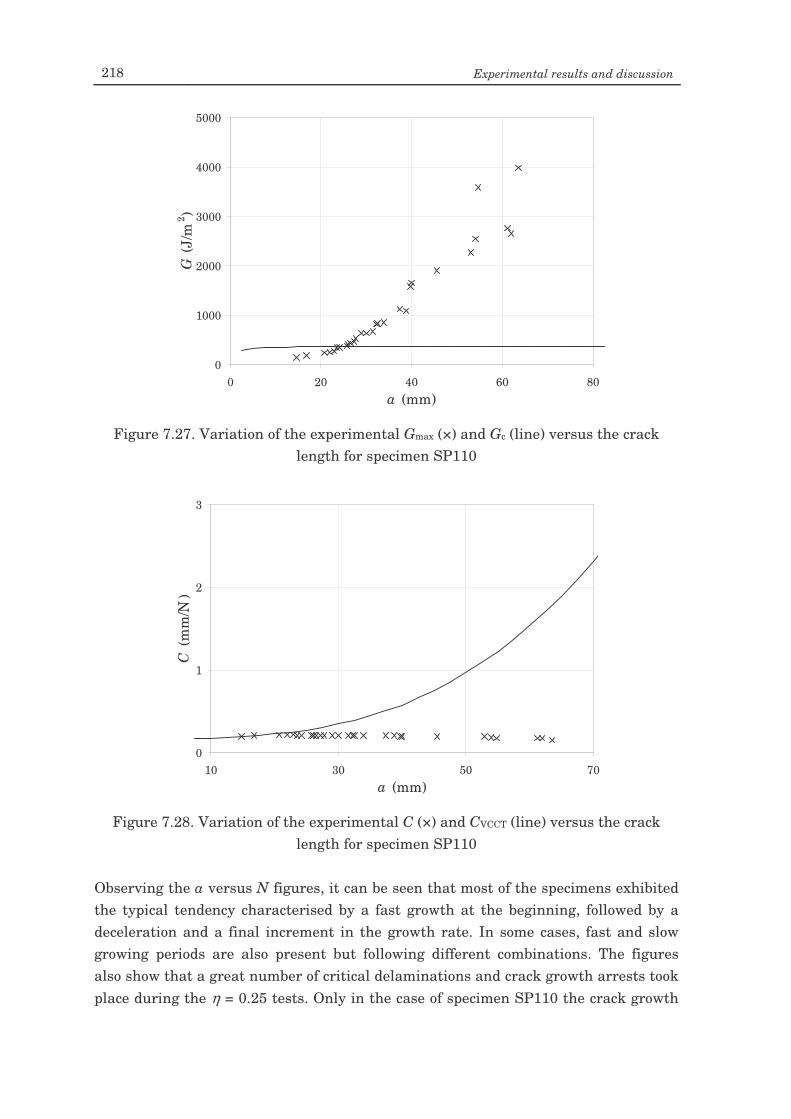
218 Experimental results and discussion
0
1000
2000
3000
4000
5000
0 20 40 60 80a (mm)
G (J
/m2 )
Figure 7.27. Variation of the experimental Gmax (×) and Gc (line) versus the crack
length for specimen SP110
0
1
2
3
10 30 50 70a (mm)
C (m
m/N
)
Figure 7.28. Variation of the experimental C (×) and CVCCT (line) versus the crack
length for specimen SP110 Observing the a versus N figures, it can be seen that most of the specimens exhibited the typical tendency characterised by a fast growth at the beginning, followed by a deceleration and a final increment in the growth rate. In some cases, fast and slow growing periods are also present but following different combinations. The figures also show that a great number of critical delaminations and crack growth arrests took place during the η = 0.25 tests. Only in the case of specimen SP110 the crack growth
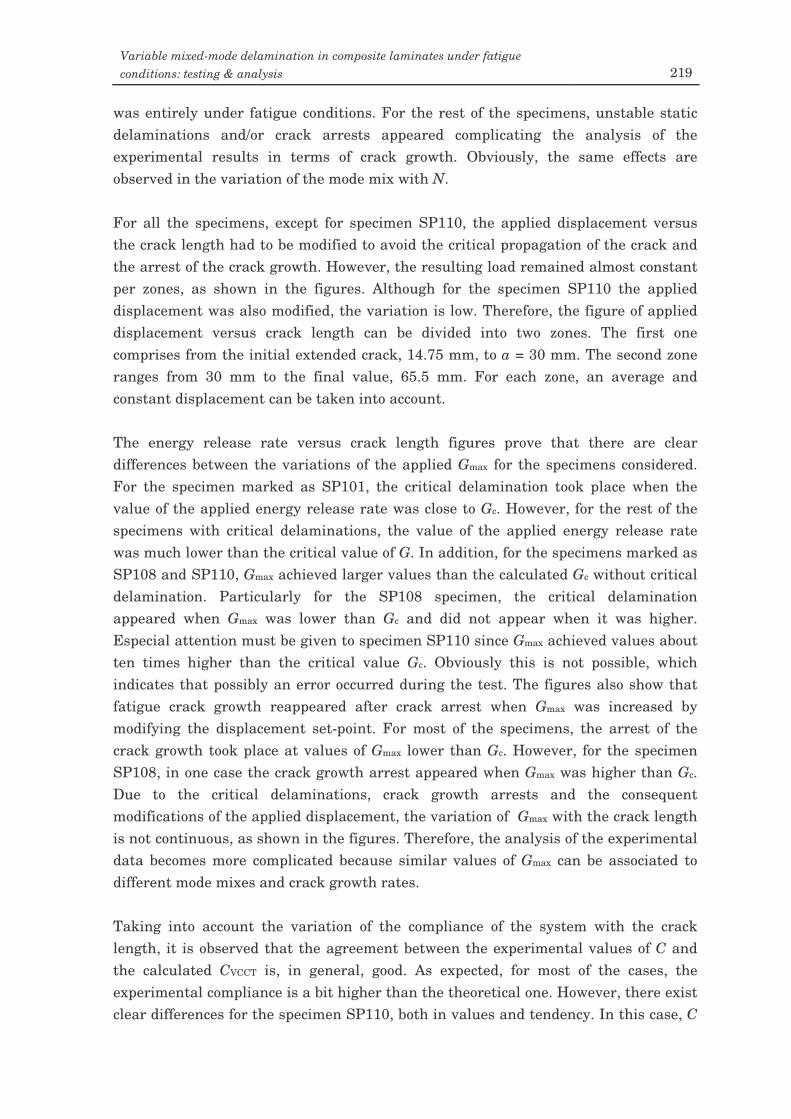
Variable mixed-mode delamination in composite laminates under fatigue conditions: testing & analysis 219
was entirely under fatigue conditions. For the rest of the specimens, unstable static delaminations and/or crack arrests appeared complicating the analysis of the experimental results in terms of crack growth. Obviously, the same effects are observed in the variation of the mode mix with N. For all the specimens, except for specimen SP110, the applied displacement versus the crack length had to be modified to avoid the critical propagation of the crack and the arrest of the crack growth. However, the resulting load remained almost constant per zones, as shown in the figures. Although for the specimen SP110 the applied displacement was also modified, the variation is low. Therefore, the figure of applied displacement versus crack length can be divided into two zones. The first one comprises from the initial extended crack, 14.75 mm, to a = 30 mm. The second zone ranges from 30 mm to the final value, 65.5 mm. For each zone, an average and constant displacement can be taken into account. The energy release rate versus crack length figures prove that there are clear differences between the variations of the applied Gmax for the specimens considered. For the specimen marked as SP101, the critical delamination took place when the value of the applied energy release rate was close to Gc. However, for the rest of the specimens with critical delaminations, the value of the applied energy release rate was much lower than the critical value of G. In addition, for the specimens marked as SP108 and SP110, Gmax achieved larger values than the calculated Gc without critical delamination. Particularly for the SP108 specimen, the critical delamination appeared when Gmax was lower than Gc and did not appear when it was higher. Especial attention must be given to specimen SP110 since Gmax achieved values about ten times higher than the critical value Gc. Obviously this is not possible, which indicates that possibly an error occurred during the test. The figures also show that fatigue crack growth reappeared after crack arrest when Gmax was increased by modifying the displacement set-point. For most of the specimens, the arrest of the crack growth took place at values of Gmax lower than Gc. However, for the specimen SP108, in one case the crack growth arrest appeared when Gmax was higher than Gc. Due to the critical delaminations, crack growth arrests and the consequent modifications of the applied displacement, the variation of Gmax with the crack length is not continuous, as shown in the figures. Therefore, the analysis of the experimental data becomes more complicated because similar values of Gmax can be associated to different mode mixes and crack growth rates. Taking into account the variation of the compliance of the system with the crack length, it is observed that the agreement between the experimental values of C and the calculated CVCCT is, in general, good. As expected, for most of the cases, the experimental compliance is a bit higher than the theoretical one. However, there exist clear differences for the specimen SP110, both in values and tendency. In this case, C
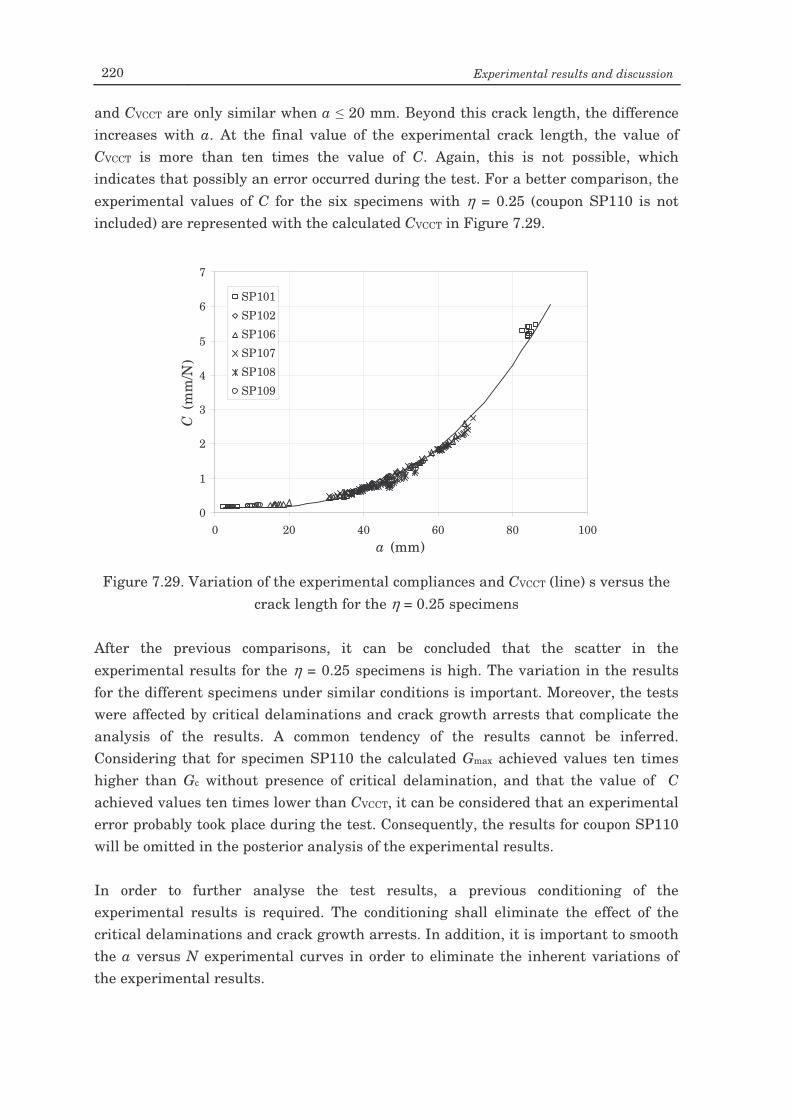
220 Experimental results and discussion
and CVCCT are only similar when a 20 mm. Beyond this crack length, the difference increases with a. At the final value of the experimental crack length, the value of CVCCT is more than ten times the value of C. Again, this is not possible, which indicates that possibly an error occurred during the test. For a better comparison, the experimental values of C for the six specimens with η = 0.25 (coupon SP110 is not included) are represented with the calculated CVCCT in Figure 7.29.
0
1
2
3
4
5
6
7
0 20 40 60 80 100a (mm)
C (m
m/N
)
SP101
SP102
SP106
SP107
SP108
SP109
Figure 7.29. Variation of the experimental compliances and CVCCT (line) s versus the
crack length for the η = 0.25 specimens After the previous comparisons, it can be concluded that the scatter in the experimental results for the η = 0.25 specimens is high. The variation in the results for the different specimens under similar conditions is important. Moreover, the tests were affected by critical delaminations and crack growth arrests that complicate the analysis of the results. A common tendency of the results cannot be inferred. Considering that for specimen SP110 the calculated Gmax achieved values ten times higher than Gc without presence of critical delamination, and that the value of C achieved values ten times lower than CVCCT, it can be considered that an experimental error probably took place during the test. Consequently, the results for coupon SP110 will be omitted in the posterior analysis of the experimental results. In order to further analyse the test results, a previous conditioning of the experimental results is required. The conditioning shall eliminate the effect of the critical delaminations and crack growth arrests. In addition, it is important to smooth the a versus N experimental curves in order to eliminate the inherent variations of the experimental results.
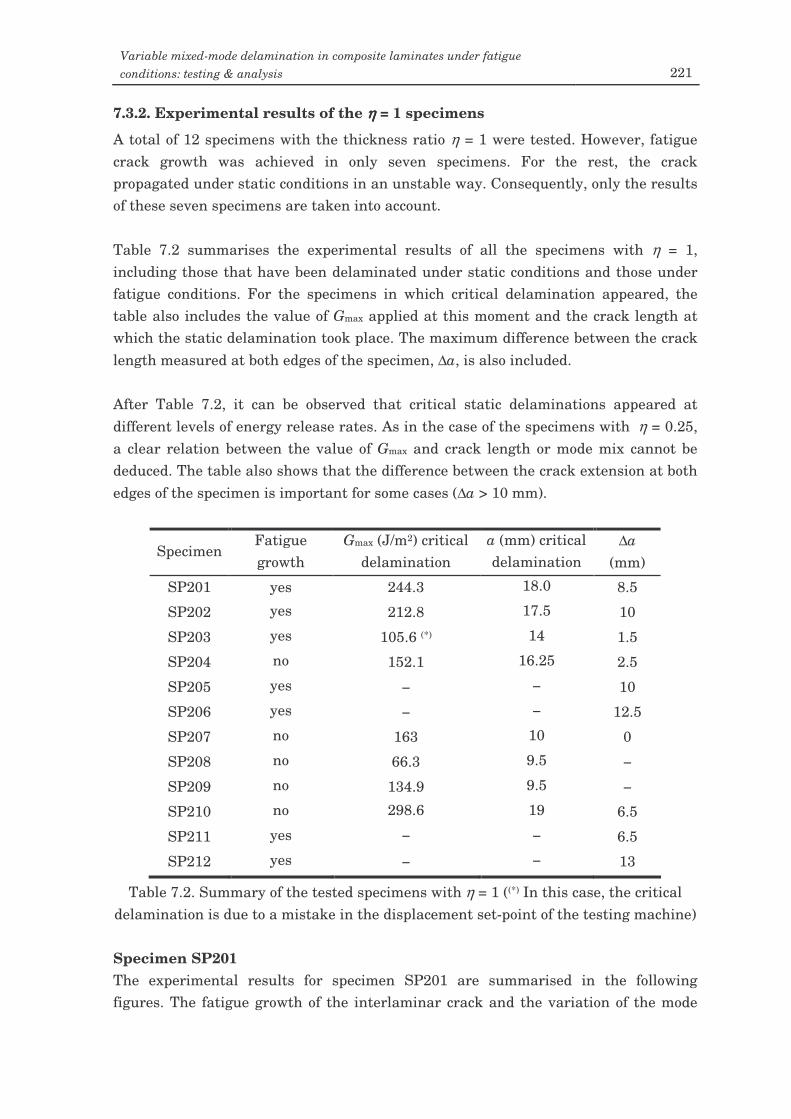
Variable mixed-mode delamination in composite laminates under fatigue conditions: testing & analysis 221
7.3.2. Experimental results of the ηηηη = 1 specimens
A total of 12 specimens with the thickness ratio η = 1 were tested. However, fatigue crack growth was achieved in only seven specimens. For the rest, the crack propagated under static conditions in an unstable way. Consequently, only the results of these seven specimens are taken into account. Table 7.2 summarises the experimental results of all the specimens with η = 1, including those that have been delaminated under static conditions and those under fatigue conditions. For the specimens in which critical delamination appeared, the table also includes the value of Gmax applied at this moment and the crack length at which the static delamination took place. The maximum difference between the crack length measured at both edges of the specimen, ∆a, is also included. After Table 7.2, it can be observed that critical static delaminations appeared at different levels of energy release rates. As in the case of the specimens with η = 0.25, a clear relation between the value of Gmax and crack length or mode mix cannot be deduced. The table also shows that the difference between the crack extension at both edges of the specimen is important for some cases (∆a > 10 mm).
Specimen Fatigue growth
Gmax (J/m2) critical delamination
a (mm) critical delamination
∆a (mm)
SP201 yes 244.3 18.0 8.5
SP202 yes 212.8 17.5 10
SP203 yes 105.6 (*) 14 1.5
SP204 no 152.1 16.25 2.5
SP205 yes − − 10
SP206 yes − − 12.5
SP207 no 163 10 0
SP208 no 66.3 9.5 −
SP209 no 134.9 9.5 −
SP210 no 298.6 19 6.5
SP211 yes − − 6.5
SP212 yes − − 13
Table 7.2. Summary of the tested specimens with η = 1 ((*) In this case, the critical delamination is due to a mistake in the displacement set-point of the testing machine) Specimen SP201 The experimental results for specimen SP201 are summarised in the following figures. The fatigue growth of the interlaminar crack and the variation of the mode
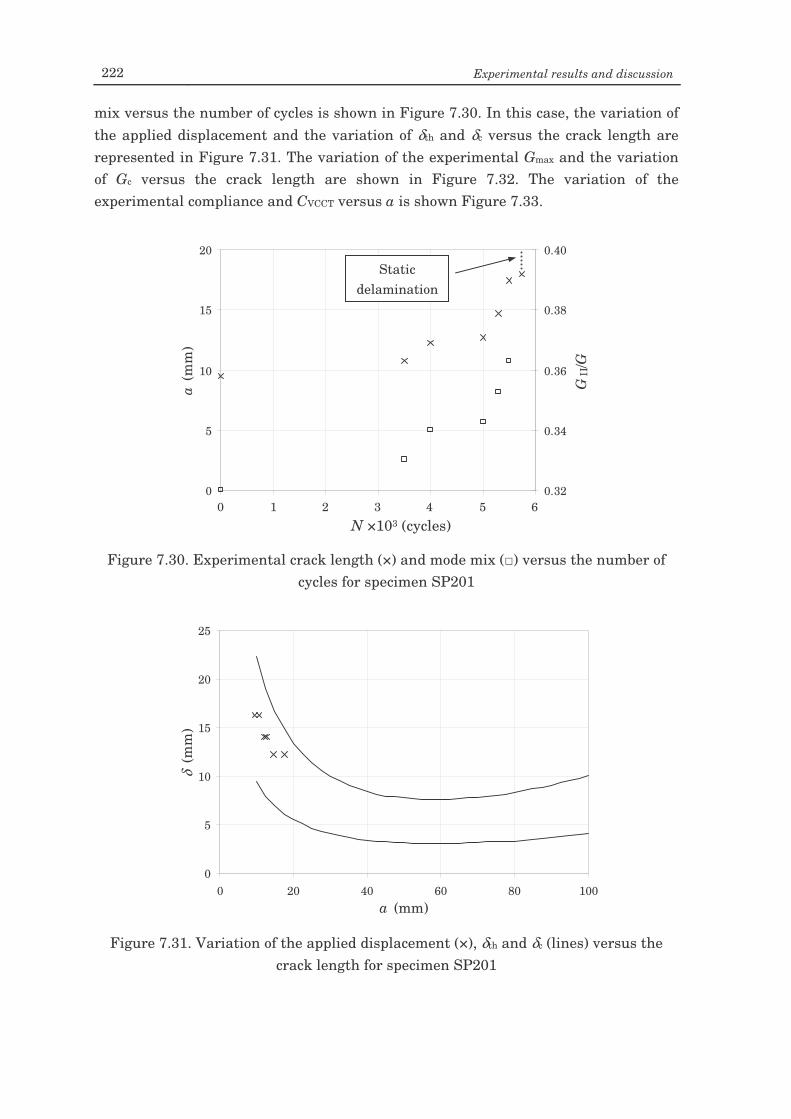
222 Experimental results and discussion
mix versus the number of cycles is shown in Figure 7.30. In this case, the variation of the applied displacement and the variation of δth and δc versus the crack length are represented in Figure 7.31. The variation of the experimental Gmax and the variation of Gc versus the crack length are shown in Figure 7.32. The variation of the experimental compliance and CVCCT versus a is shown Figure 7.33.
Figure 7.30. Experimental crack length (×) and mode mix () versus the number of
cycles for specimen SP201
0
5
10
15
20
25
0 20 40 60 80 100a (mm)
δ (m
m)
Figure 7.31. Variation of the applied displacement (×), δth and δc (lines) versus the
crack length for specimen SP201
0
5
10
15
20
0 1000 2000 3000 4000 5000 6000N (cycles)
a (m
m)
0.32
0.34
0.36
0.38
0.40
GII
/G
Static delamination
0 2 4 6
N ×103 (cycles) 1 3 5
Variable mixed-mode delamination in composite laminates under fatigue conditions: testing & analysis 223
Figure 7.32. Variation of the experimental Gmax (×) and Gc (line) versus the crack
length for specimen SP201
0
0.05
0.1
0.15
0 5 10 15 20a (mm)
C (m
m/N
)
Figure 7.33. Variation of the experimental C (×) and CVCCT (line) versus the crack
length for specimen SP201 Specimen SP202 The experimental results for specimen SP202 are summarised in the following figures. Figure 7.34 shows the fatigue growth of the interlaminar crack and the variation of the mode mix versus the number of cycles. Figure 7.35 shows the variation of the applied displacement and the variation of δth and δc versus the crack length. The variation of the experimental Gmax and the variation of Gc versus the
0
100
200
300
400
0 5 10 15 20a (mm)
G (J
/m2 )
Static delamination
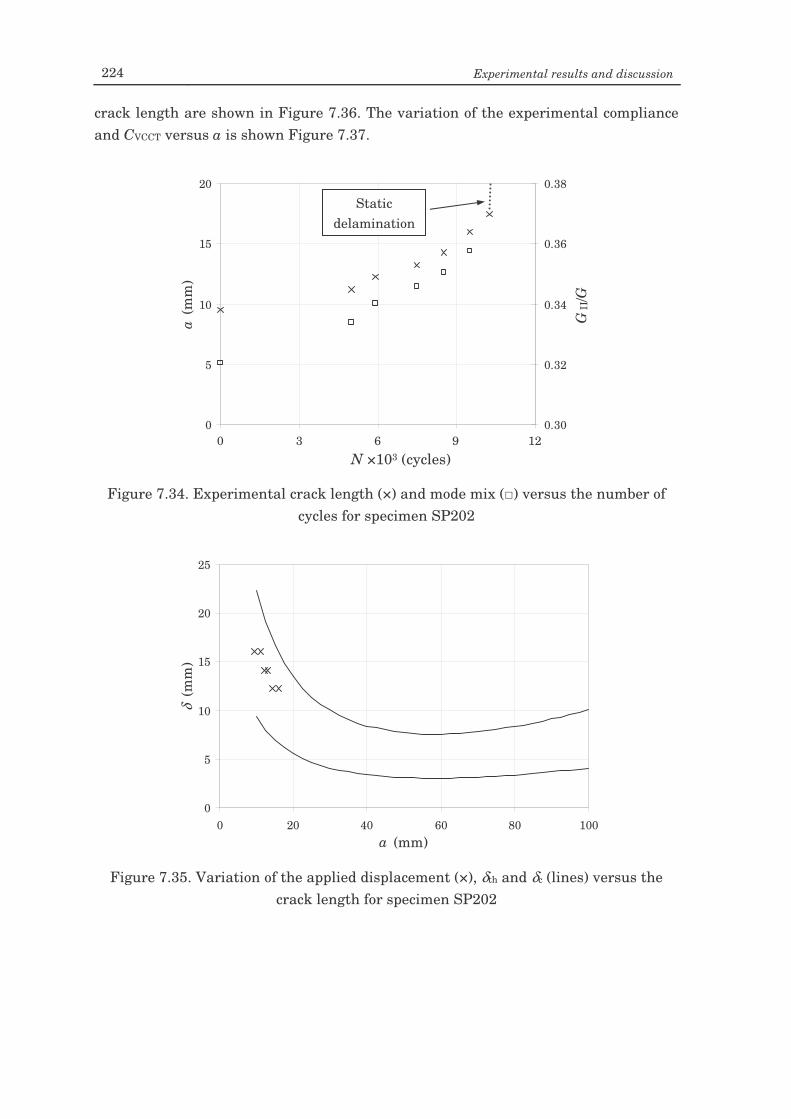
224 Experimental results and discussion
crack length are shown in Figure 7.36. The variation of the experimental compliance and CVCCT versus a is shown Figure 7.37.
Figure 7.34. Experimental crack length (×) and mode mix () versus the number of
cycles for specimen SP202
0
5
10
15
20
25
0 20 40 60 80 100a (mm)
δ (m
m)
Figure 7.35. Variation of the applied displacement (×), δth and δc (lines) versus the
crack length for specimen SP202
0
5
10
15
20
0 3000 6000 9000 12000N (cycles)
a (m
m)
0.30
0.32
0.34
0.36
0.38
GII
/G
Static delamination
0 3 6 9
N ×103 (cycles) 12
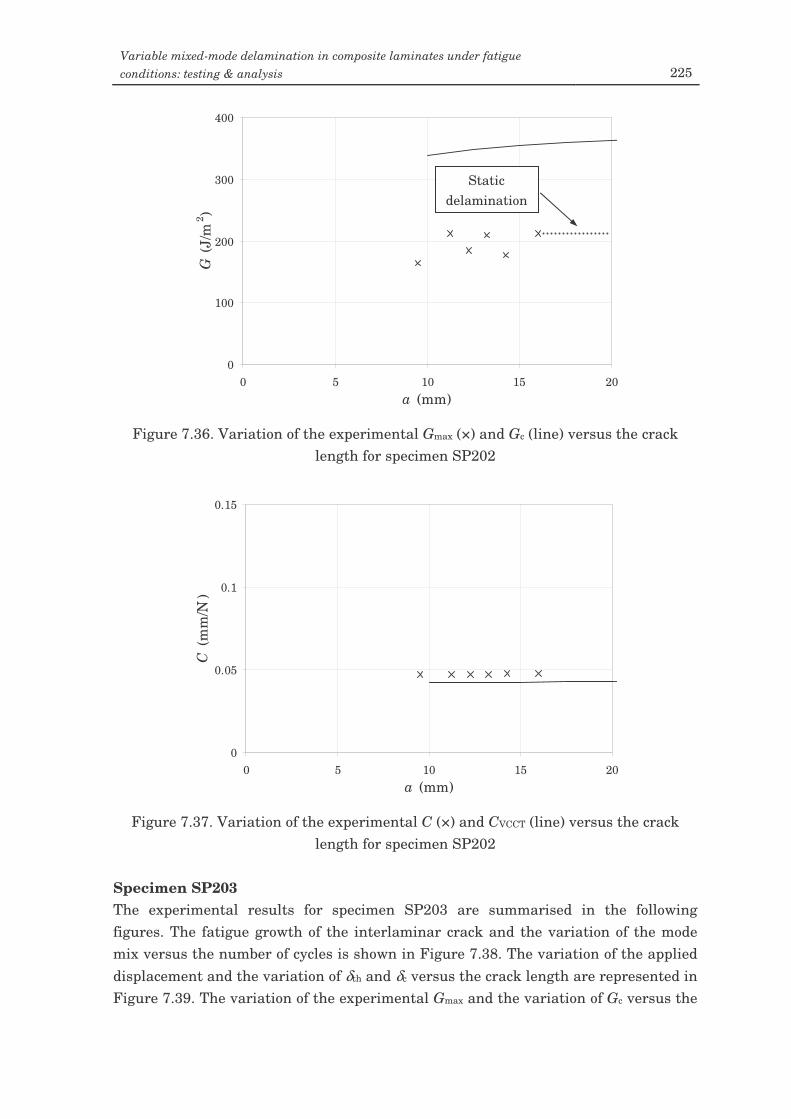
Variable mixed-mode delamination in composite laminates under fatigue conditions: testing & analysis 225
Figure 7.36. Variation of the experimental Gmax (×) and Gc (line) versus the crack
length for specimen SP202
0
0.05
0.1
0.15
0 5 10 15 20a (mm)
C (m
m/N
)
Figure 7.37. Variation of the experimental C (×) and CVCCT (line) versus the crack
length for specimen SP202 Specimen SP203 The experimental results for specimen SP203 are summarised in the following figures. The fatigue growth of the interlaminar crack and the variation of the mode mix versus the number of cycles is shown in Figure 7.38. The variation of the applied displacement and the variation of δth and δc versus the crack length are represented in Figure 7.39. The variation of the experimental Gmax and the variation of Gc versus the
0
100
200
300
400
0 5 10 15 20a (mm)
G (J
/m2 )
Static delamination
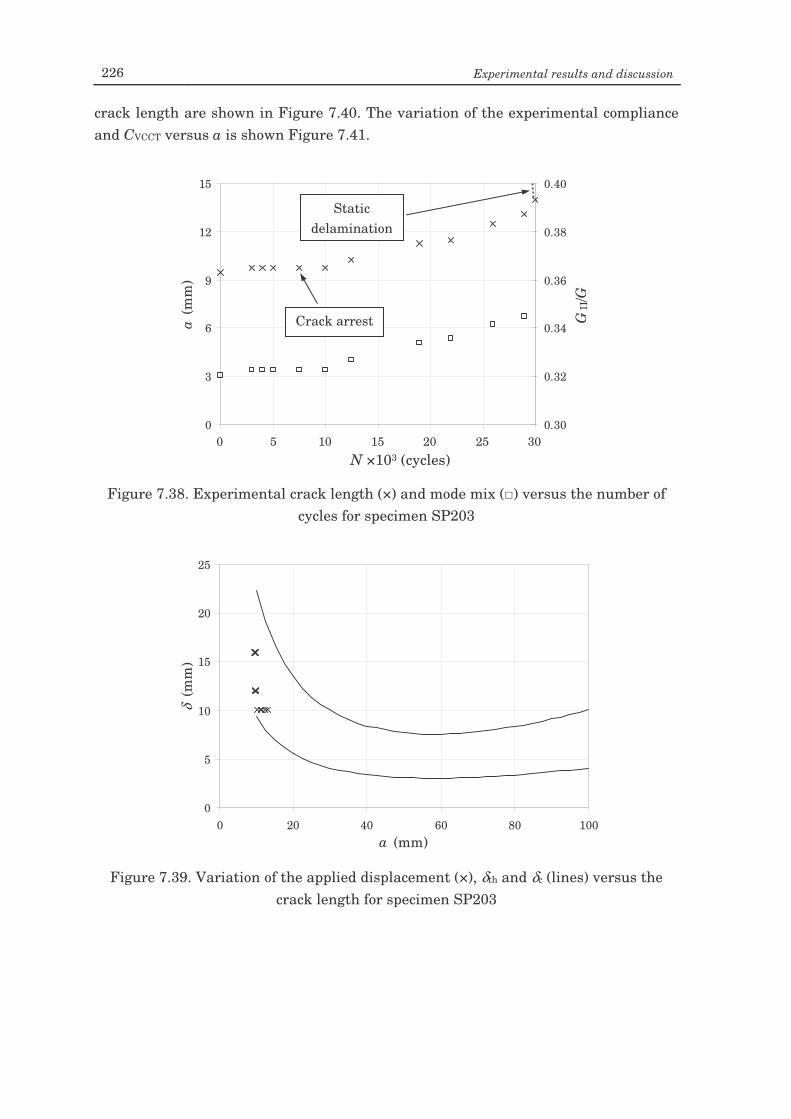
226 Experimental results and discussion
crack length are shown in Figure 7.40. The variation of the experimental compliance and CVCCT versus a is shown Figure 7.41.
Figure 7.38. Experimental crack length (×) and mode mix () versus the number of
cycles for specimen SP203
0
5
10
15
20
25
0 20 40 60 80 100a (mm)
δ (m
m)
Figure 7.39. Variation of the applied displacement (×), δth and δc (lines) versus the
crack length for specimen SP203
0
3
6
9
12
15
0 5000 10000 15000 20000 25000 30000N (cycles)
a (m
m)
0.30
0.32
0.34
0.36
0.38
0.40
GII
/G
Static delamination
Crack arrest
0 25 5 10 15 20 N ×103 (cycles)
30
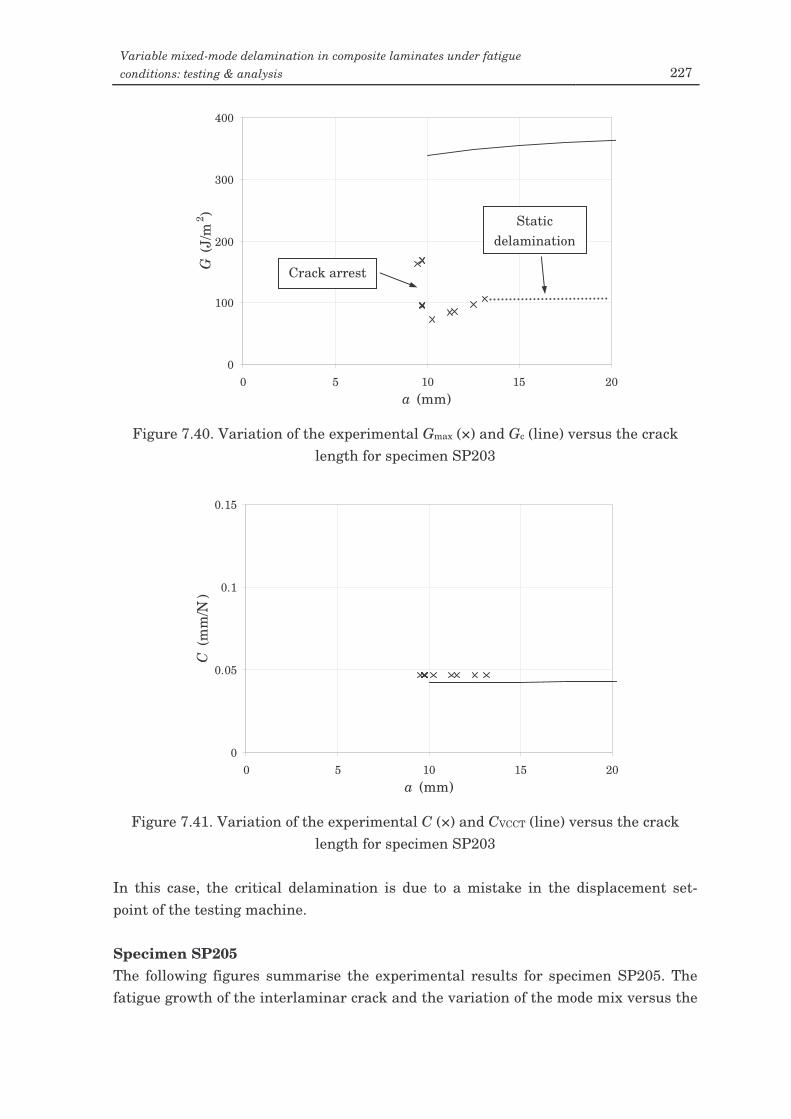
Variable mixed-mode delamination in composite laminates under fatigue conditions: testing & analysis 227
Figure 7.40. Variation of the experimental Gmax (×) and Gc (line) versus the crack
length for specimen SP203
0
0.05
0.1
0.15
0 5 10 15 20a (mm)
C (m
m/N
)
Figure 7.41. Variation of the experimental C (×) and CVCCT (line) versus the crack
length for specimen SP203 In this case, the critical delamination is due to a mistake in the displacement set-point of the testing machine. Specimen SP205 The following figures summarise the experimental results for specimen SP205. The fatigue growth of the interlaminar crack and the variation of the mode mix versus the
0
100
200
300
400
0 5 10 15 20a (mm)
G (J
/m2 )
Static delamination
Crack arrest
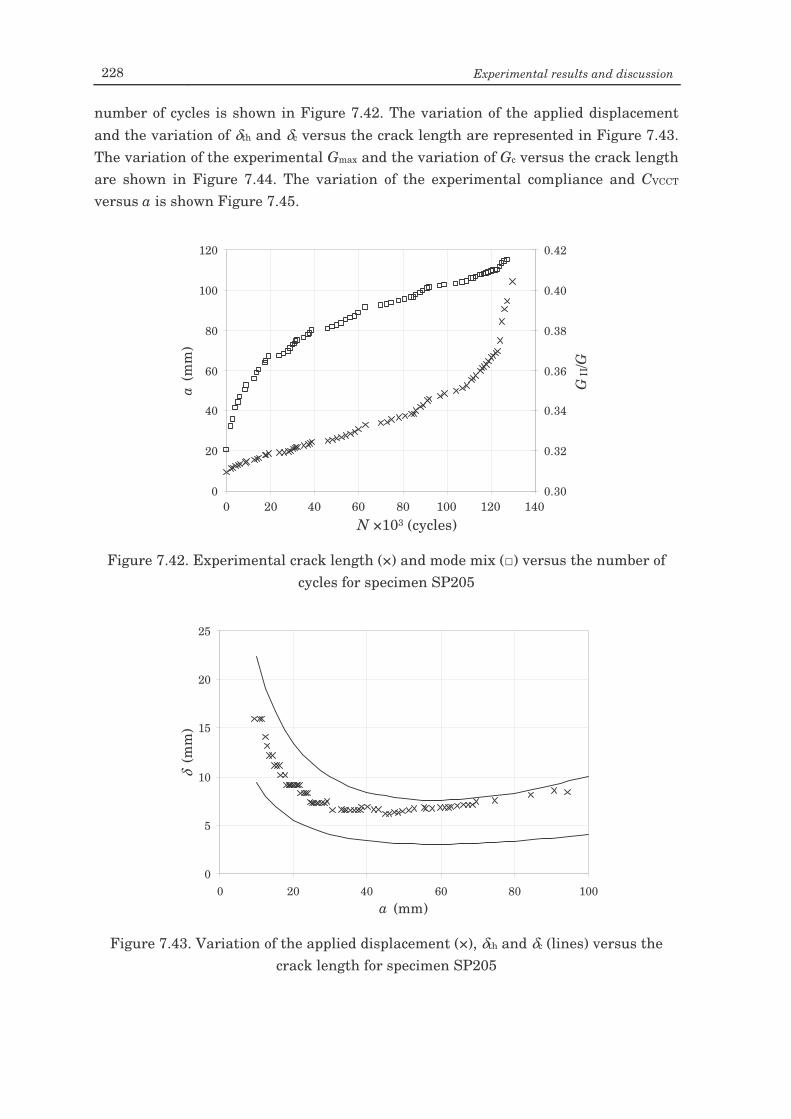
228 Experimental results and discussion
number of cycles is shown in Figure 7.42. The variation of the applied displacement and the variation of δth and δc versus the crack length are represented in Figure 7.43. The variation of the experimental Gmax and the variation of Gc versus the crack length are shown in Figure 7.44. The variation of the experimental compliance and CVCCT versus a is shown Figure 7.45.
Figure 7.42. Experimental crack length (×) and mode mix () versus the number of
cycles for specimen SP205
0
5
10
15
20
25
0 20 40 60 80 100a (mm)
δ (m
m)
Figure 7.43. Variation of the applied displacement (×), δth and δc (lines) versus the
crack length for specimen SP205
0
20
40
60
80
100
120
0 20000 40000 60000 80000 100000 120000 140000N (cycles)
a (m
m)
0.30
0.32
0.34
0.36
0.38
0.40
0.42
GII
/G
0 100 20 40 60 80 N ×103 (cycles)
120 140
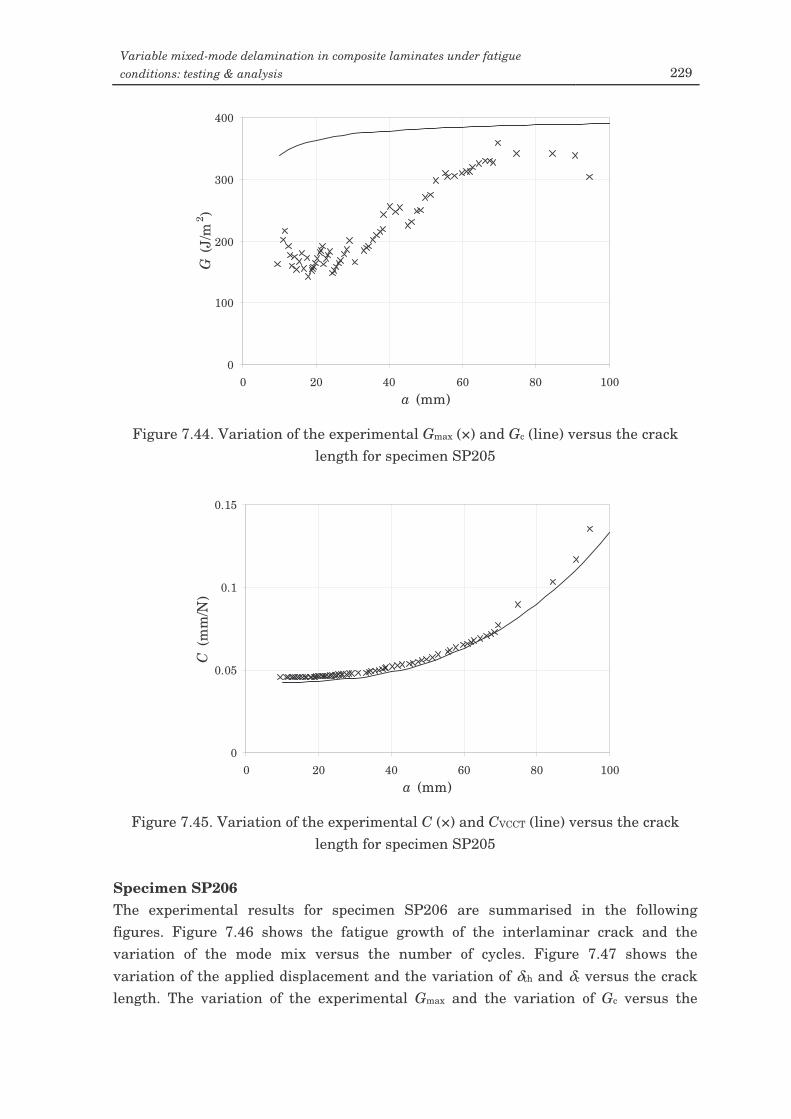
Variable mixed-mode delamination in composite laminates under fatigue conditions: testing & analysis 229
0
100
200
300
400
0 20 40 60 80 100a (mm)
G (J
/m2 )
Figure 7.44. Variation of the experimental Gmax (×) and Gc (line) versus the crack
length for specimen SP205
0
0.05
0.1
0.15
0 20 40 60 80 100a (mm)
C (m
m/N
)
Figure 7.45. Variation of the experimental C (×) and CVCCT (line) versus the crack
length for specimen SP205 Specimen SP206 The experimental results for specimen SP206 are summarised in the following figures. Figure 7.46 shows the fatigue growth of the interlaminar crack and the variation of the mode mix versus the number of cycles. Figure 7.47 shows the variation of the applied displacement and the variation of δth and δc versus the crack length. The variation of the experimental Gmax and the variation of Gc versus the
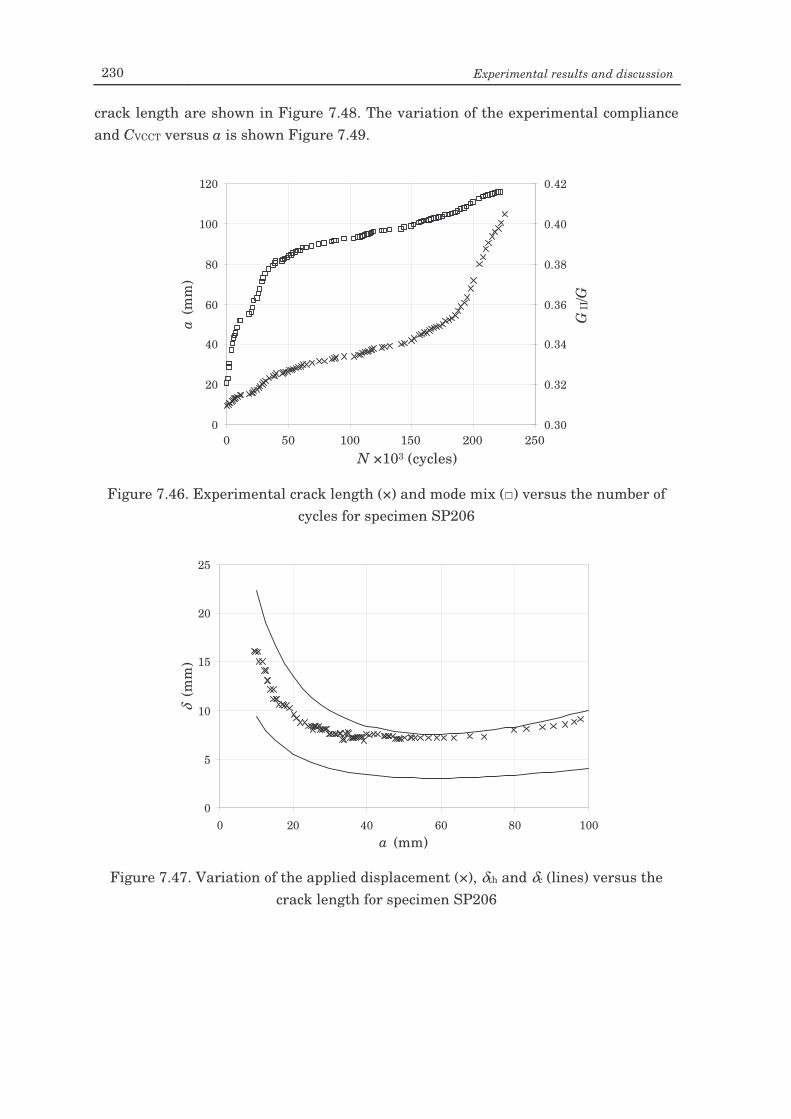
230 Experimental results and discussion
crack length are shown in Figure 7.48. The variation of the experimental compliance and CVCCT versus a is shown Figure 7.49.
Figure 7.46. Experimental crack length (×) and mode mix () versus the number of
cycles for specimen SP206
0
5
10
15
20
25
0 20 40 60 80 100a (mm)
δ (m
m)
Figure 7.47. Variation of the applied displacement (×), δth and δc (lines) versus the
crack length for specimen SP206
0
20
40
60
80
100
120
0 50000 100000 150000 200000 250000N (cycles)
a (m
m)
0.30
0.32
0.34
0.36
0.38
0.40
0.42
GII
/G
0 200 50 100 150 N ×103 (cycles)
250
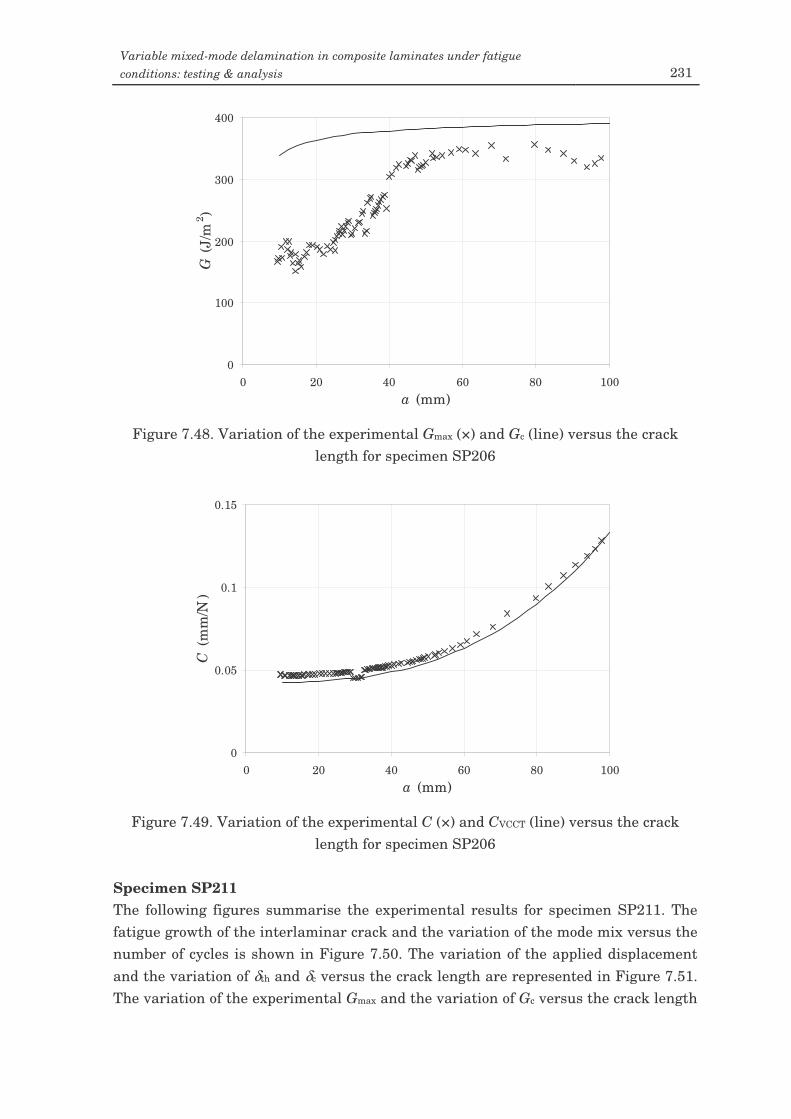
Variable mixed-mode delamination in composite laminates under fatigue conditions: testing & analysis 231
0
100
200
300
400
0 20 40 60 80 100a (mm)
G (J
/m2 )
Figure 7.48. Variation of the experimental Gmax (×) and Gc (line) versus the crack
length for specimen SP206
0
0.05
0.1
0.15
0 20 40 60 80 100a (mm)
C (m
m/N
)
Figure 7.49. Variation of the experimental C (×) and CVCCT (line) versus the crack
length for specimen SP206 Specimen SP211 The following figures summarise the experimental results for specimen SP211. The fatigue growth of the interlaminar crack and the variation of the mode mix versus the number of cycles is shown in Figure 7.50. The variation of the applied displacement and the variation of δth and δc versus the crack length are represented in Figure 7.51. The variation of the experimental Gmax and the variation of Gc versus the crack length
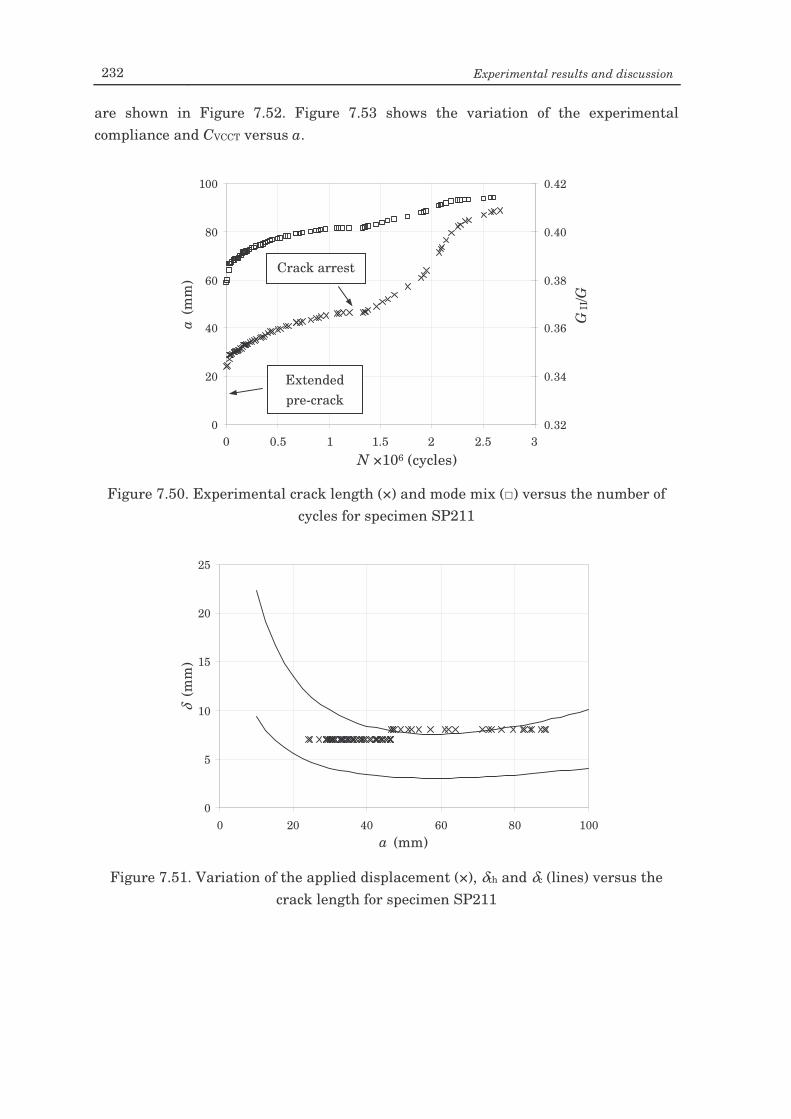
232 Experimental results and discussion
are shown in Figure 7.52. Figure 7.53 shows the variation of the experimental compliance and CVCCT versus a.
Figure 7.50. Experimental crack length (×) and mode mix () versus the number of
cycles for specimen SP211
0
5
10
15
20
25
0 20 40 60 80 100a (mm)
δ (m
m)
Figure 7.51. Variation of the applied displacement (×), δth and δc (lines) versus the
crack length for specimen SP211
0
20
40
60
80
100
0 500000 1000000 1500000 2000000 2500000 3000000N (cycles)
a (m
m)
0.32
0.34
0.36
0.38
0.40
0.42
GII
/G
Crack arrest
0 2.5 0.5 1 1.5 N ×106 (cycles)
3 2
Extended pre-crack
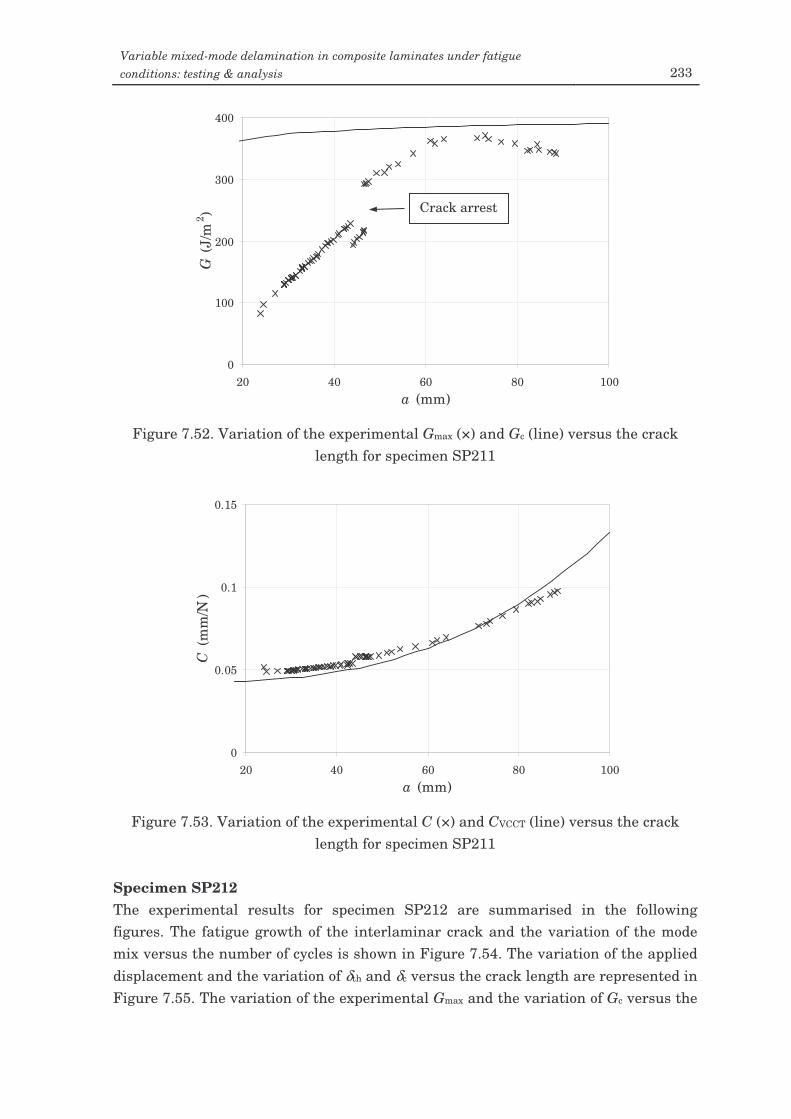
Variable mixed-mode delamination in composite laminates under fatigue conditions: testing & analysis 233
Figure 7.52. Variation of the experimental Gmax (×) and Gc (line) versus the crack
length for specimen SP211
0
0.05
0.1
0.15
20 40 60 80 100a (mm)
C (m
m/N
)
Figure 7.53. Variation of the experimental C (×) and CVCCT (line) versus the crack
length for specimen SP211 Specimen SP212 The experimental results for specimen SP212 are summarised in the following figures. The fatigue growth of the interlaminar crack and the variation of the mode mix versus the number of cycles is shown in Figure 7.54. The variation of the applied displacement and the variation of δth and δc versus the crack length are represented in Figure 7.55. The variation of the experimental Gmax and the variation of Gc versus the
0
100
200
300
400
20 40 60 80 100a (mm)
G (J
/m2 ) Crack arrest
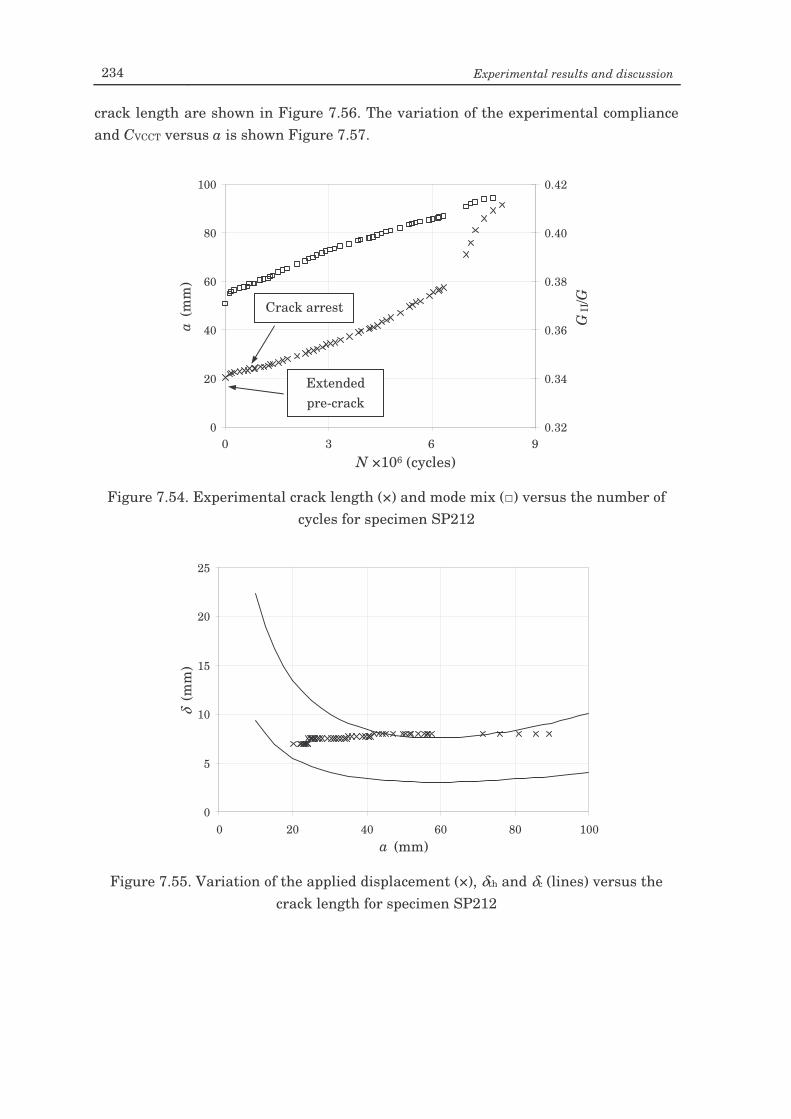
234 Experimental results and discussion
crack length are shown in Figure 7.56. The variation of the experimental compliance and CVCCT versus a is shown Figure 7.57.
Figure 7.54. Experimental crack length (×) and mode mix () versus the number of
cycles for specimen SP212
0
5
10
15
20
25
0 20 40 60 80 100a (mm)
δ (m
m)
Figure 7.55. Variation of the applied displacement (×), δth and δc (lines) versus the
crack length for specimen SP212
0
20
40
60
80
100
0 3000000 6000000 9000000N (cycles)
a (m
m)
0.32
0.34
0.36
0.38
0.40
0.42
GII
/GCrack arrest
0 3 N ×106 (cycles)
9 6
Extended pre-crack
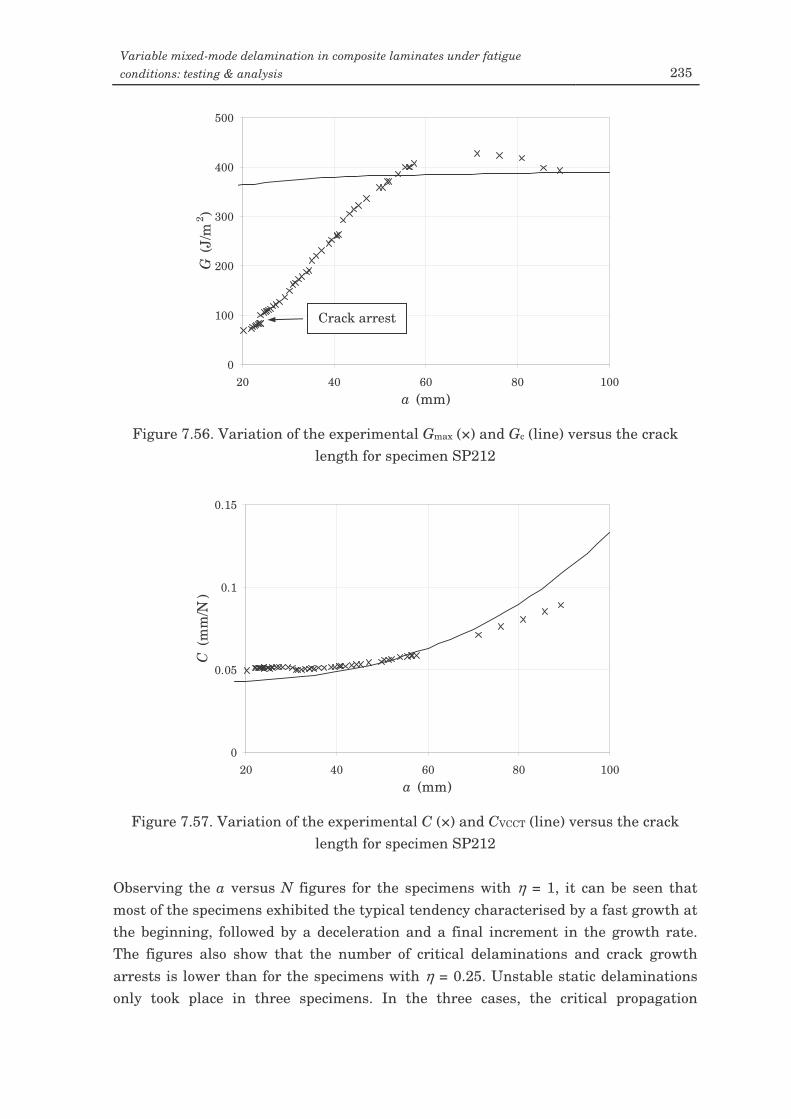
Variable mixed-mode delamination in composite laminates under fatigue conditions: testing & analysis 235
Figure 7.56. Variation of the experimental Gmax (×) and Gc (line) versus the crack
length for specimen SP212
0
0.05
0.1
0.15
20 40 60 80 100a (mm)
C (m
m/N
)
Figure 7.57. Variation of the experimental C (×) and CVCCT (line) versus the crack
length for specimen SP212 Observing the a versus N figures for the specimens with η = 1, it can be seen that most of the specimens exhibited the typical tendency characterised by a fast growth at the beginning, followed by a deceleration and a final increment in the growth rate. The figures also show that the number of critical delaminations and crack growth arrests is lower than for the specimens with η = 0.25. Unstable static delaminations only took place in three specimens. In the three cases, the critical propagation
0
100
200
300
400
500
20 40 60 80 100a (mm)
G (J
/m2 )
Crack arrest
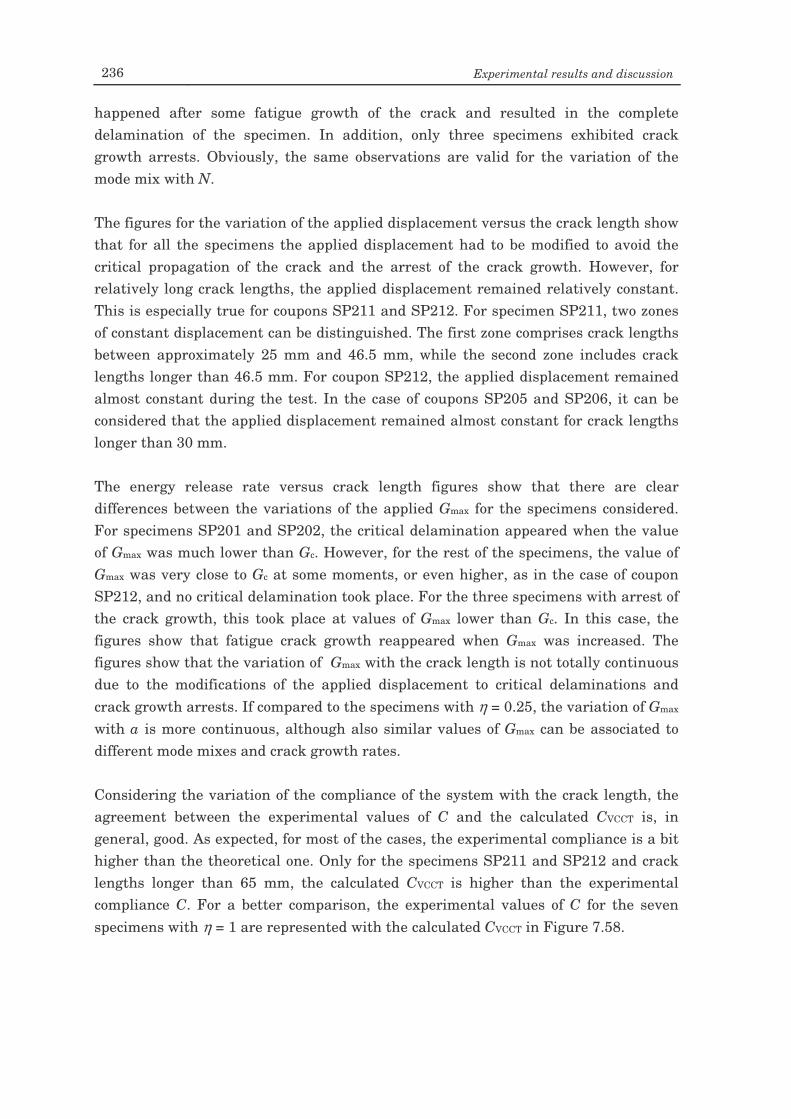
236 Experimental results and discussion
happened after some fatigue growth of the crack and resulted in the complete delamination of the specimen. In addition, only three specimens exhibited crack growth arrests. Obviously, the same observations are valid for the variation of the mode mix with N. The figures for the variation of the applied displacement versus the crack length show that for all the specimens the applied displacement had to be modified to avoid the critical propagation of the crack and the arrest of the crack growth. However, for relatively long crack lengths, the applied displacement remained relatively constant. This is especially true for coupons SP211 and SP212. For specimen SP211, two zones of constant displacement can be distinguished. The first zone comprises crack lengths between approximately 25 mm and 46.5 mm, while the second zone includes crack lengths longer than 46.5 mm. For coupon SP212, the applied displacement remained almost constant during the test. In the case of coupons SP205 and SP206, it can be considered that the applied displacement remained almost constant for crack lengths longer than 30 mm. The energy release rate versus crack length figures show that there are clear differences between the variations of the applied Gmax for the specimens considered. For specimens SP201 and SP202, the critical delamination appeared when the value of Gmax was much lower than Gc. However, for the rest of the specimens, the value of Gmax was very close to Gc at some moments, or even higher, as in the case of coupon SP212, and no critical delamination took place. For the three specimens with arrest of the crack growth, this took place at values of Gmax lower than Gc. In this case, the figures show that fatigue crack growth reappeared when Gmax was increased. The figures show that the variation of Gmax with the crack length is not totally continuous due to the modifications of the applied displacement to critical delaminations and crack growth arrests. If compared to the specimens with η = 0.25, the variation of Gmax with a is more continuous, although also similar values of Gmax can be associated to different mode mixes and crack growth rates. Considering the variation of the compliance of the system with the crack length, the agreement between the experimental values of C and the calculated CVCCT is, in general, good. As expected, for most of the cases, the experimental compliance is a bit higher than the theoretical one. Only for the specimens SP211 and SP212 and crack lengths longer than 65 mm, the calculated CVCCT is higher than the experimental compliance C. For a better comparison, the experimental values of C for the seven specimens with η = 1 are represented with the calculated CVCCT in Figure 7.58.
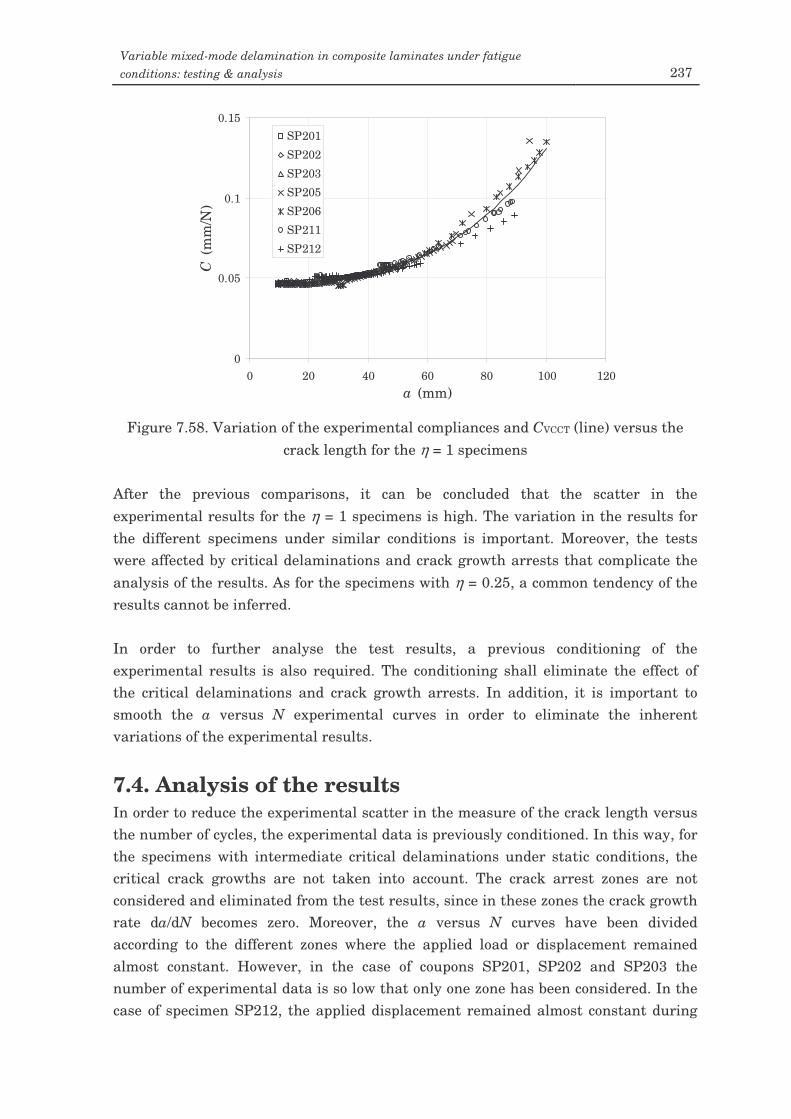
Variable mixed-mode delamination in composite laminates under fatigue conditions: testing & analysis 237
0
0.05
0.1
0.15
0 20 40 60 80 100 120a (mm)
C (m
m/N
)
SP201
SP202
SP203
SP205
SP206
SP211
SP212
Figure 7.58. Variation of the experimental compliances and CVCCT (line) versus the
crack length for the η = 1 specimens After the previous comparisons, it can be concluded that the scatter in the experimental results for the η = 1 specimens is high. The variation in the results for the different specimens under similar conditions is important. Moreover, the tests were affected by critical delaminations and crack growth arrests that complicate the analysis of the results. As for the specimens with η = 0.25, a common tendency of the results cannot be inferred. In order to further analyse the test results, a previous conditioning of the experimental results is also required. The conditioning shall eliminate the effect of the critical delaminations and crack growth arrests. In addition, it is important to smooth the a versus N experimental curves in order to eliminate the inherent variations of the experimental results.
7.4. Analysis of the results In order to reduce the experimental scatter in the measure of the crack length versus the number of cycles, the experimental data is previously conditioned. In this way, for the specimens with intermediate critical delaminations under static conditions, the critical crack growths are not taken into account. The crack arrest zones are not considered and eliminated from the test results, since in these zones the crack growth rate da/dN becomes zero. Moreover, the a versus N curves have been divided according to the different zones where the applied load or displacement remained almost constant. However, in the case of coupons SP201, SP202 and SP203 the number of experimental data is so low that only one zone has been considered. In the case of specimen SP212, the applied displacement remained almost constant during
238 Experimental results and discussion
the whole test, therefore, only one zone is considered. Thus, the effect of the experimental scatter is reduced in the determination of da/dN. For a higher reduction in the experimental scatter, different polynomials are adjusted to the different zones of the conditioned experimental curves. Actually, a second- or third-degree polynomial is fitted to the each section of conditioned curve according to a = A3N3 + A2N2 + A1N + A0. Although better fits could be achieved by higher degree polynomials, this would imply higher variations in the derivatives da/dN. In some cases, negative values of the crack growth rate would result, which, obviously, lacks of physical meaning since it would indicate a reduction in the crack length with N. When possible, second-degree polynomials are employed because the reduction in the experimental scatter is higher. However, when the tendency of the curve is not well described by a second-degree polynomial or the fit is poor, a third-degree polynomial is employed. The coefficients of the polynomials are determined through a least-square residuals process in order to achieve the best fit. For the second-degree polynomials, the coefficient A3 is set to zero. As it will be shown, the fit between the adjusted polynomials and the conditioned experimental results is, in general, good. The experimental crack growth rates of the tested MMELS specimens are also calculated by using the fitted values of a versus N. Usually, fatigue delamination tests are carried out under constant mixed-mode conditions and the experimental crack growth rates can be well described by a linear regression in a da/dN versus G log-log plot (also known as Paris plot). However, in the MMELS test, the mode mix is continuously varying and the resulting da/dN can differ from a linear regression in a log-log plot. Moreover, the applied energy release rate during the tests was modified to avoid critical delaminations and the arrest of the crack growth. Thus, the applied energy release rate does not depend on the crack length in a monotonic way (as shown in the previous section). Consequently, the resulting crack growth rate can differ from a linear regression in a Paris plot. Actually, the same energy release rate applied to the same specimen at different crack lengths implies different mixed-modes and different values of da/dN. Nevertheless, for long cracks, where the mode mix approaches the asymptotic value, this non-linearity effect is deemed to be small. In order to verify the improvement achieved by using the polynomial fit, the crack growth rates da/dN are calculated in two different ways, experimental and polynomial. In the first one, the value of da/dN is calculated for each point of the a versus N curve as the slope of the curve between the point and the following one. That is, the increment in crack length divided by the increment in number of cycles, ∆a/∆N. In the second one, the value of da/dN is calculated for each point taken into account the derivative of the fitted polynomial.
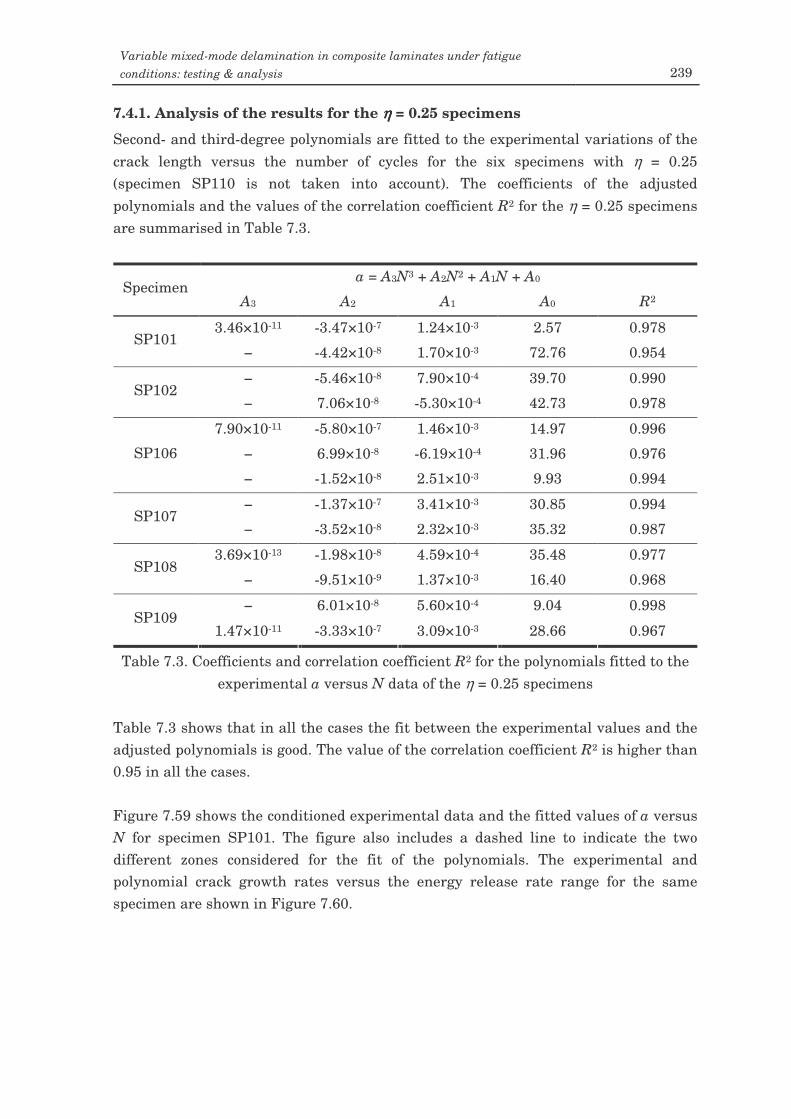
Variable mixed-mode delamination in composite laminates under fatigue conditions: testing & analysis 239
7.4.1. Analysis of the results for the ηηηη = 0.25 specimens
Second- and third-degree polynomials are fitted to the experimental variations of the crack length versus the number of cycles for the six specimens with η = 0.25 (specimen SP110 is not taken into account). The coefficients of the adjusted polynomials and the values of the correlation coefficient R2 for the η = 0.25 specimens are summarised in Table 7.3.
a = A3N3 + A2N2 + A1N + A0 Specimen
A3 A2 A1 A0 R2
3.46×10⁻¹¹ -3.47×10⁻⁷ 1.24×10⁻³ 2.57 0.978 SP101
− -4.42×10⁻⁸ 1.70×10⁻³ 72.76 0.954
− -5.46×10⁻⁸ 7.90×10⁻⁴ 39.70 0.990 SP102
− 7.06×10⁻⁸ -5.30×10⁻⁴ 42.73 0.978
7.90×10⁻¹¹ -5.80×10⁻⁷ 1.46×10⁻³ 14.97 0.996
− 6.99×10⁻⁸ -6.19×10⁻⁴ 31.96 0.976 SP106
− -1.52×10⁻⁸ 2.51×10⁻³ 9.93 0.994
− -1.37×10⁻⁷ 3.41×10⁻³ 30.85 0.994 SP107
− -3.52×10⁻⁸ 2.32×10⁻³ 35.32 0.987
3.69×10⁻¹³ -1.98×10⁻⁸ 4.59×10⁻⁴ 35.48 0.977 SP108
− -9.51×10⁻⁹ 1.37×10⁻³ 16.40 0.968
− 6.01×10⁻⁸ 5.60×10⁻⁴ 9.04 0.998 SP109
1.47×10⁻¹¹ -3.33×10⁻⁷ 3.09×10⁻³ 28.66 0.967
Table 7.3. Coefficients and correlation coefficient R2 for the polynomials fitted to the experimental a versus N data of the η = 0.25 specimens
Table 7.3 shows that in all the cases the fit between the experimental values and the adjusted polynomials is good. The value of the correlation coefficient R2 is higher than 0.95 in all the cases. Figure 7.59 shows the conditioned experimental data and the fitted values of a versus N for specimen SP101. The figure also includes a dashed line to indicate the two different zones considered for the fit of the polynomials. The experimental and polynomial crack growth rates versus the energy release rate range for the same specimen are shown in Figure 7.60.
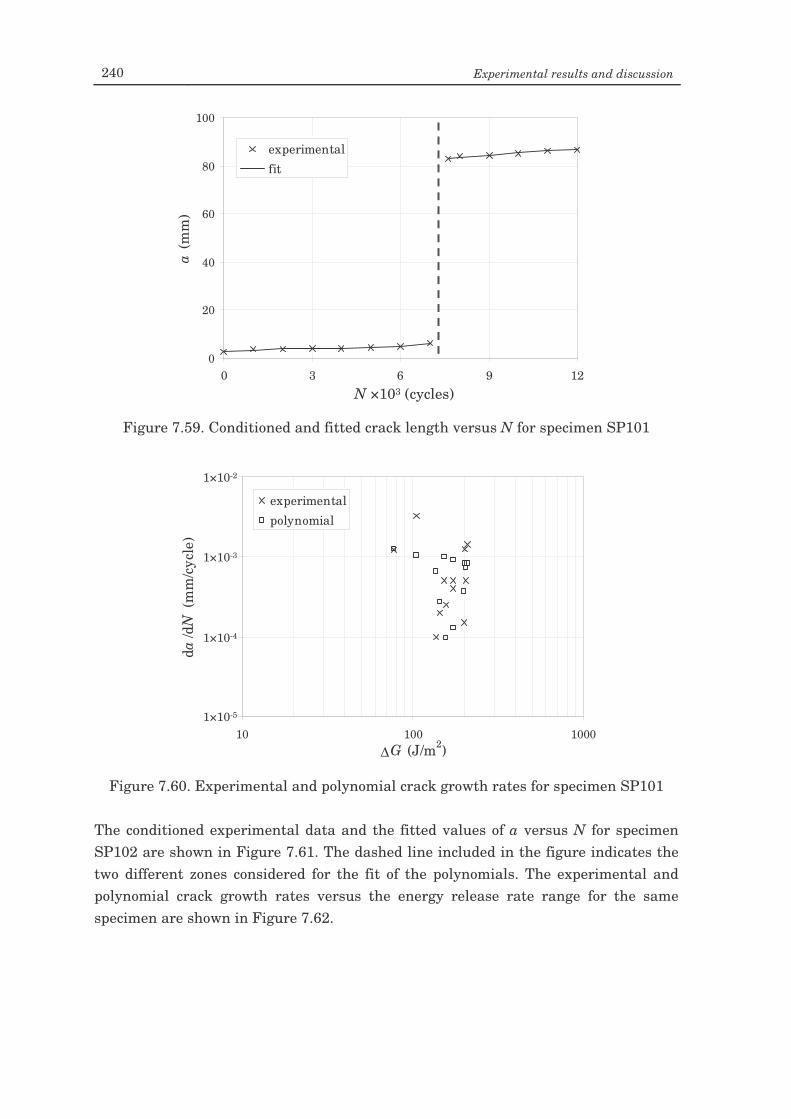
240 Experimental results and discussion
Figure 7.59. Conditioned and fitted crack length versus N for specimen SP101
Figure 7.60. Experimental and polynomial crack growth rates for specimen SP101
The conditioned experimental data and the fitted values of a versus N for specimen SP102 are shown in Figure 7.61. The dashed line included in the figure indicates the two different zones considered for the fit of the polynomials. The experimental and polynomial crack growth rates versus the energy release rate range for the same specimen are shown in Figure 7.62.
1.E-05
1.E-04
1.E-03
1.E-02
10 100 1000∆G (J/m2)
da/d
N (m
m/c
ycle
)
experimentalpolynomial
1×10⁻⁵
1×10⁻⁴
1×10⁻³
1×10⁻²
0
20
40
60
80
100
0 3000 6000 9000 12000N (cycles)
a (m
m)
experimentalfit
0 12 3 6 9 N ×103 (cycles)
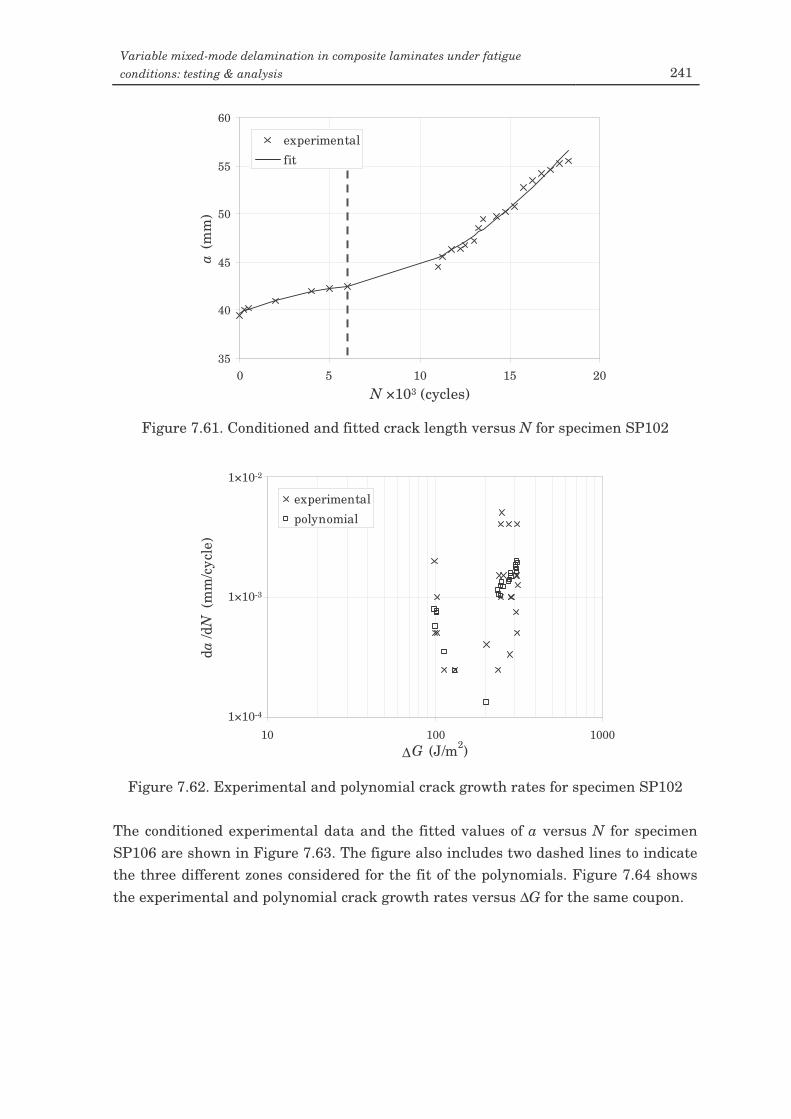
Variable mixed-mode delamination in composite laminates under fatigue conditions: testing & analysis 241
Figure 7.61. Conditioned and fitted crack length versus N for specimen SP102
Figure 7.62. Experimental and polynomial crack growth rates for specimen SP102
The conditioned experimental data and the fitted values of a versus N for specimen SP106 are shown in Figure 7.63. The figure also includes two dashed lines to indicate the three different zones considered for the fit of the polynomials. Figure 7.64 shows the experimental and polynomial crack growth rates versus ∆G for the same coupon.
1.0E-04
1.0E-03
1.0E-02
10 100 1000∆G (J/m2)
da/d
N (m
m/c
ycle
)
experimentalpolynomial
1×10⁻⁴
1×10⁻³
1×10⁻²
35
40
45
50
55
60
0 5000 10000 15000 20000N (cycles)
a (m
m)
experimentalfit
0 20 5 10 15 N ×103 (cycles)
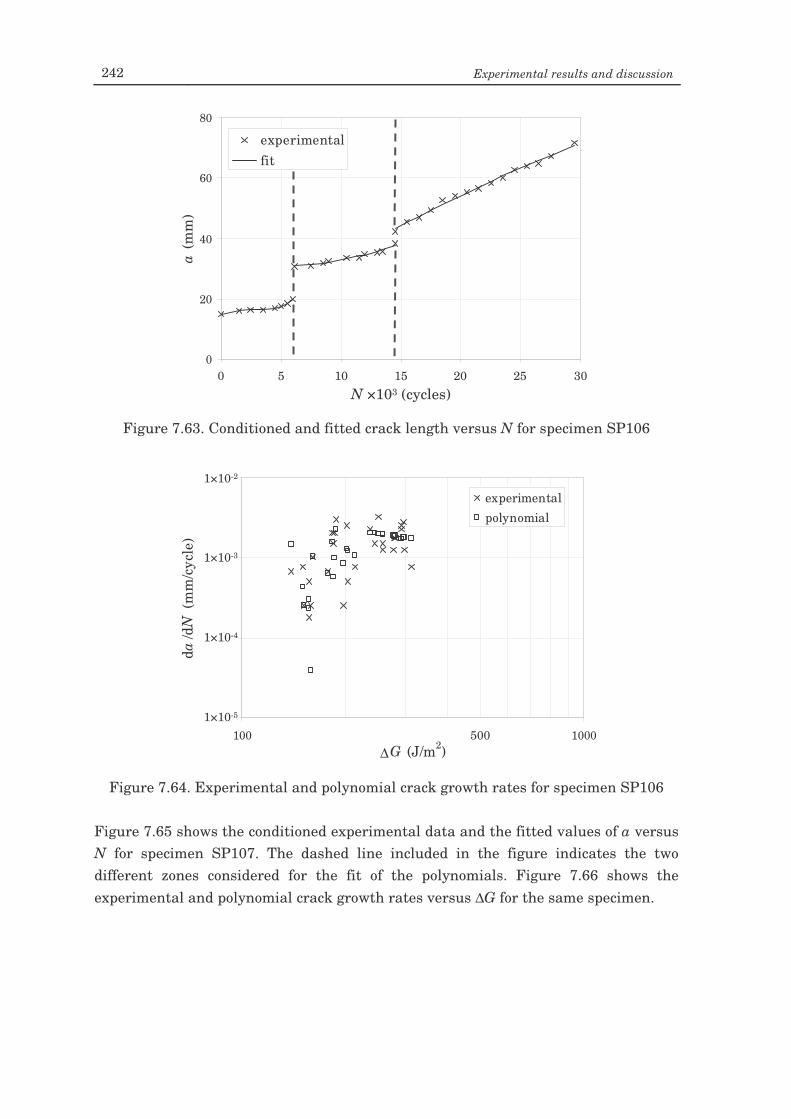
242 Experimental results and discussion
Figure 7.63. Conditioned and fitted crack length versus N for specimen SP106
Figure 7.64. Experimental and polynomial crack growth rates for specimen SP106
Figure 7.65 shows the conditioned experimental data and the fitted values of a versus N for specimen SP107. The dashed line included in the figure indicates the two different zones considered for the fit of the polynomials. Figure 7.66 shows the experimental and polynomial crack growth rates versus ∆G for the same specimen.
1.E-05
1.E-04
1.E-03
1.E-02
100 1000∆G (J/m2)
da/d
N (m
m/c
ycle
)
experimentalpolynomial
1×10⁻⁵
1×10⁻⁴
1×10⁻³
1×10⁻²
500
0
20
40
60
80
0 5000 10000 15000 20000 25000 30000N (cycles)
a (m
m)
experimentalfit
0 20 5 10 15 N ×103 (cycles)
25 30
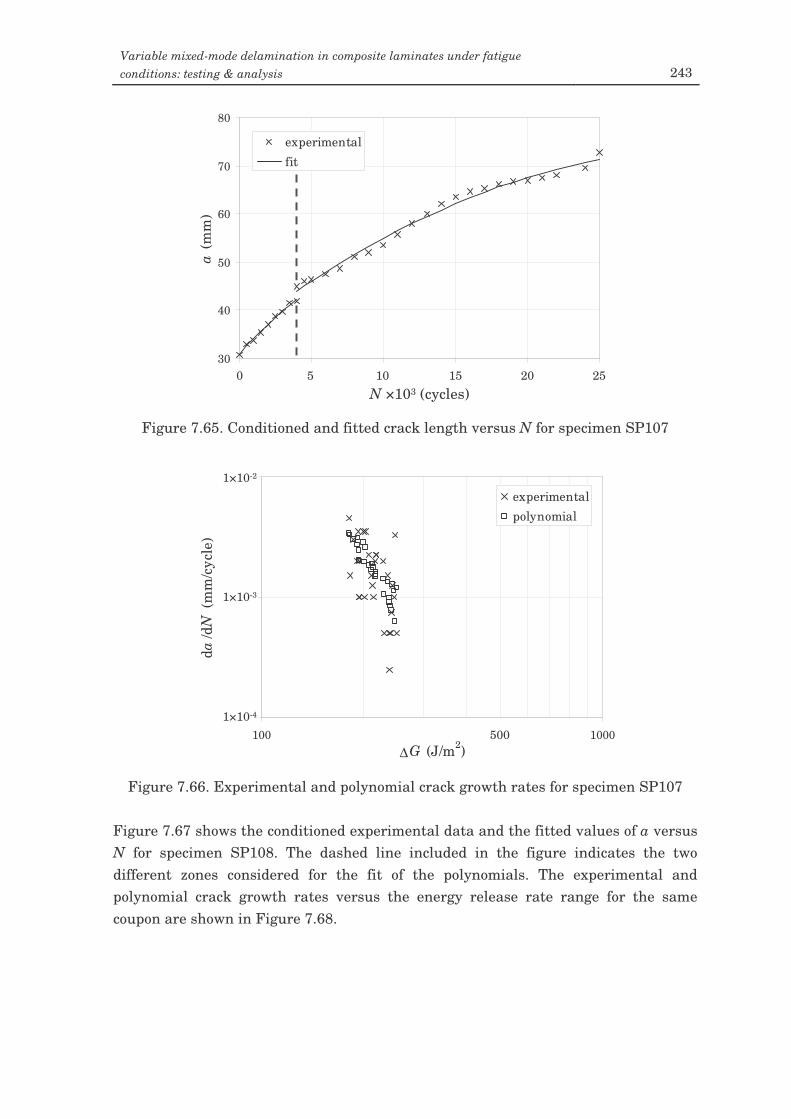
Variable mixed-mode delamination in composite laminates under fatigue conditions: testing & analysis 243
Figure 7.65. Conditioned and fitted crack length versus N for specimen SP107
Figure 7.66. Experimental and polynomial crack growth rates for specimen SP107
Figure 7.67 shows the conditioned experimental data and the fitted values of a versus N for specimen SP108. The dashed line included in the figure indicates the two different zones considered for the fit of the polynomials. The experimental and polynomial crack growth rates versus the energy release rate range for the same coupon are shown in Figure 7.68.
1.E-04
1.E-03
1.E-02
100 1000∆G (J/m2)
da/d
N (m
m/c
ycle
)
experimentalpolynomial
1×10⁻⁴
1×10⁻³
1×10⁻²
500
30
40
50
60
70
80
0 5000 10000 15000 20000 25000N (cycles)
a (m
m)
experimentalfit
0 20 5 10 15 N ×103 (cycles)
25
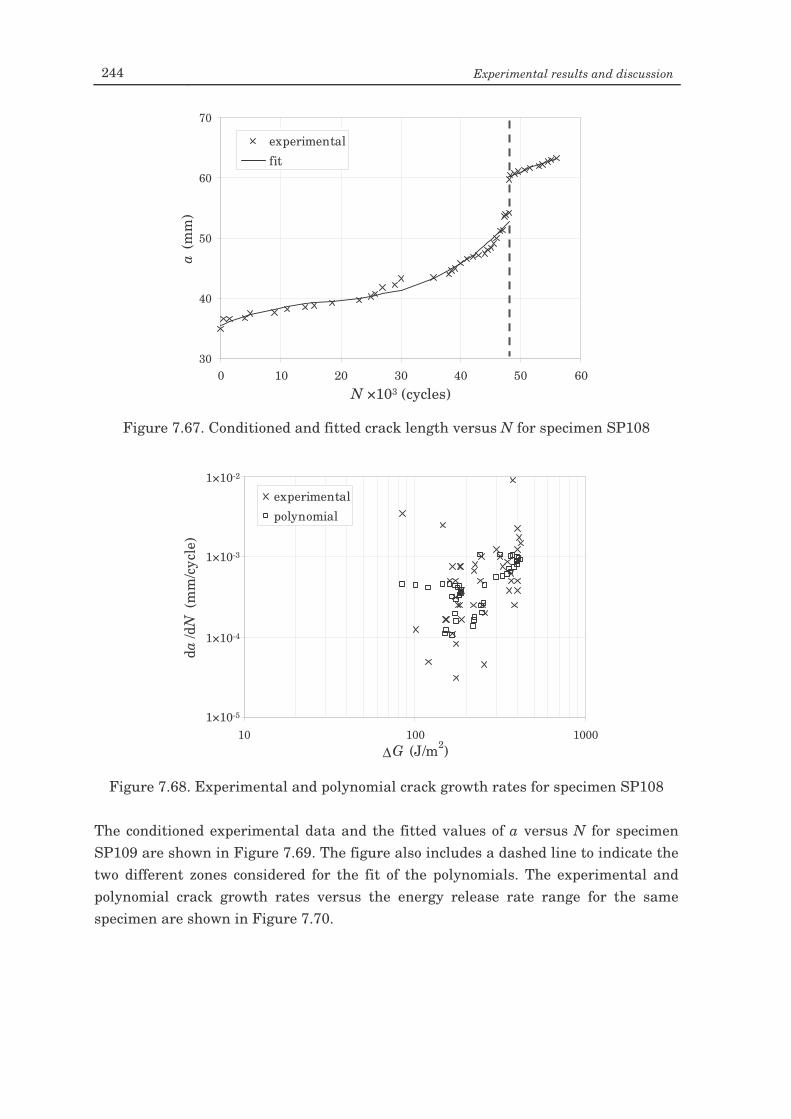
244 Experimental results and discussion
Figure 7.67. Conditioned and fitted crack length versus N for specimen SP108
Figure 7.68. Experimental and polynomial crack growth rates for specimen SP108
The conditioned experimental data and the fitted values of a versus N for specimen SP109 are shown in Figure 7.69. The figure also includes a dashed line to indicate the two different zones considered for the fit of the polynomials. The experimental and polynomial crack growth rates versus the energy release rate range for the same specimen are shown in Figure 7.70.
1.E-05
1.E-04
1.E-03
1.E-02
10 100 1000∆G (J/m2)
da/d
N (m
m/c
ycle
)
experimentalpolynomial
1×10⁻⁴
1×10⁻³
1×10⁻²
1×10⁻⁵
30
40
50
60
70
0 10000 20000 30000 40000 50000 60000N (cycles)
a (m
m)
experimentalfit
0 50 10 20 40 N ×103 (cycles)
60 30
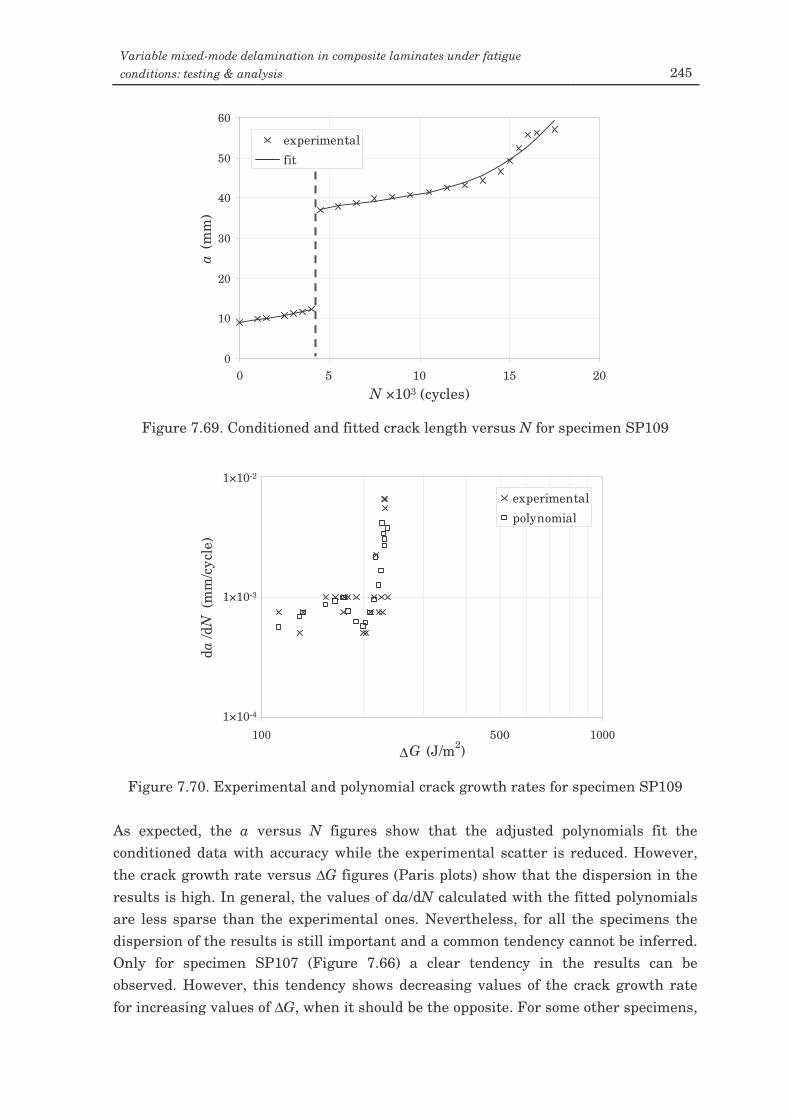
Variable mixed-mode delamination in composite laminates under fatigue conditions: testing & analysis 245
Figure 7.69. Conditioned and fitted crack length versus N for specimen SP109
Figure 7.70. Experimental and polynomial crack growth rates for specimen SP109
As expected, the a versus N figures show that the adjusted polynomials fit the conditioned data with accuracy while the experimental scatter is reduced. However, the crack growth rate versus ∆G figures (Paris plots) show that the dispersion in the results is high. In general, the values of da/dN calculated with the fitted polynomials are less sparse than the experimental ones. Nevertheless, for all the specimens the dispersion of the results is still important and a common tendency cannot be inferred. Only for specimen SP107 (Figure 7.66) a clear tendency in the results can be observed. However, this tendency shows decreasing values of the crack growth rate for increasing values of ∆G, when it should be the opposite. For some other specimens,
1.E-04
1.E-03
1.E-02
100 1000∆G (J/m2)
da/d
N (m
m/c
ycle
)
experimentalpolynomial
1×10⁻⁴
1×10⁻³
1×10⁻²
500
0
10
20
30
40
50
60
0 5000 10000 15000 20000N (cycles)
a (m
m)
experimentalfit
0 15 5 N ×103 (cycles)
20 10
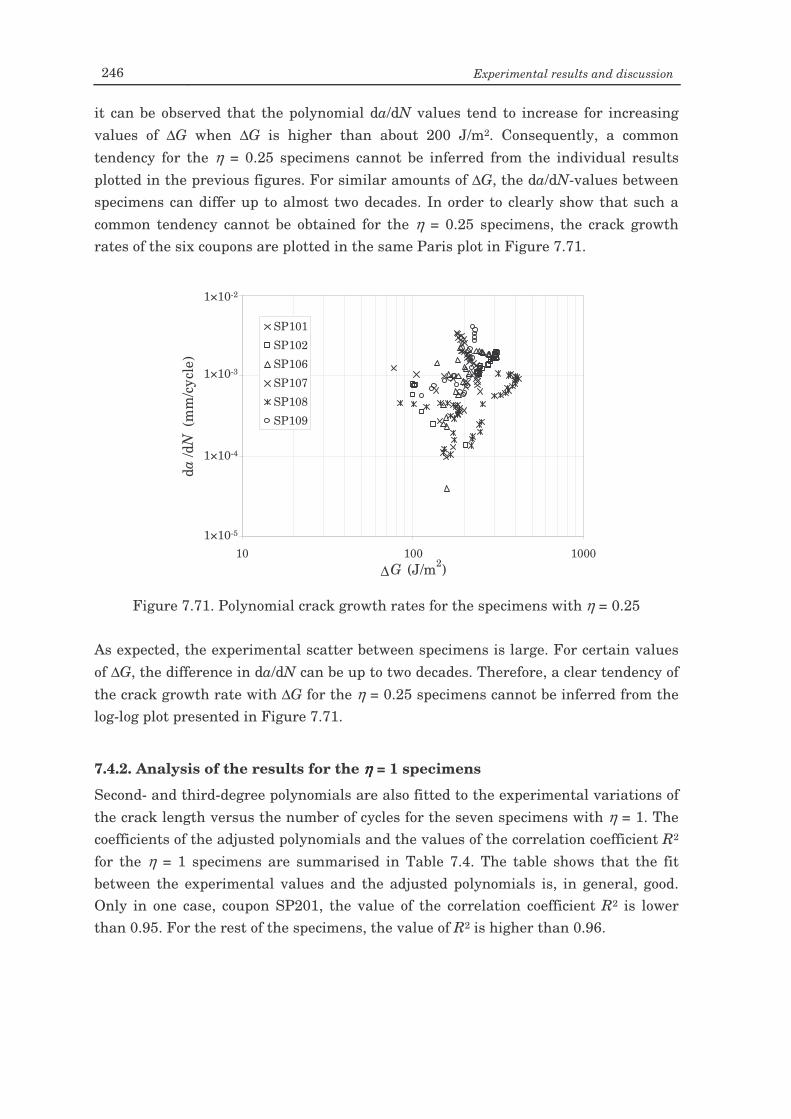
246 Experimental results and discussion
it can be observed that the polynomial da/dN values tend to increase for increasing values of ∆G when ∆G is higher than about 200 J/m2. Consequently, a common tendency for the η = 0.25 specimens cannot be inferred from the individual results plotted in the previous figures. For similar amounts of ∆G, the da/dN-values between specimens can differ up to almost two decades. In order to clearly show that such a common tendency cannot be obtained for the η = 0.25 specimens, the crack growth rates of the six coupons are plotted in the same Paris plot in Figure 7.71.
Figure 7.71. Polynomial crack growth rates for the specimens with η = 0.25
As expected, the experimental scatter between specimens is large. For certain values of ∆G, the difference in da/dN can be up to two decades. Therefore, a clear tendency of the crack growth rate with ∆G for the η = 0.25 specimens cannot be inferred from the log-log plot presented in Figure 7.71.
7.4.2. Analysis of the results for the ηηηη = 1 specimens
Second- and third-degree polynomials are also fitted to the experimental variations of the crack length versus the number of cycles for the seven specimens with η = 1. The coefficients of the adjusted polynomials and the values of the correlation coefficient R2 for the η = 1 specimens are summarised in Table 7.4. The table shows that the fit between the experimental values and the adjusted polynomials is, in general, good. Only in one case, coupon SP201, the value of the correlation coefficient R2 is lower than 0.95. For the rest of the specimens, the value of R2 is higher than 0.96.
1.E-05
1.E-04
1.E-03
1.E-02
10 100 1000∆G (J/m2)
da/d
N (m
m/c
ycle
)
SP101
SP102
SP106
SP107
SP108
SP109
1×10⁻⁵
1×10⁻³
1×10⁻²
1×10⁻⁴
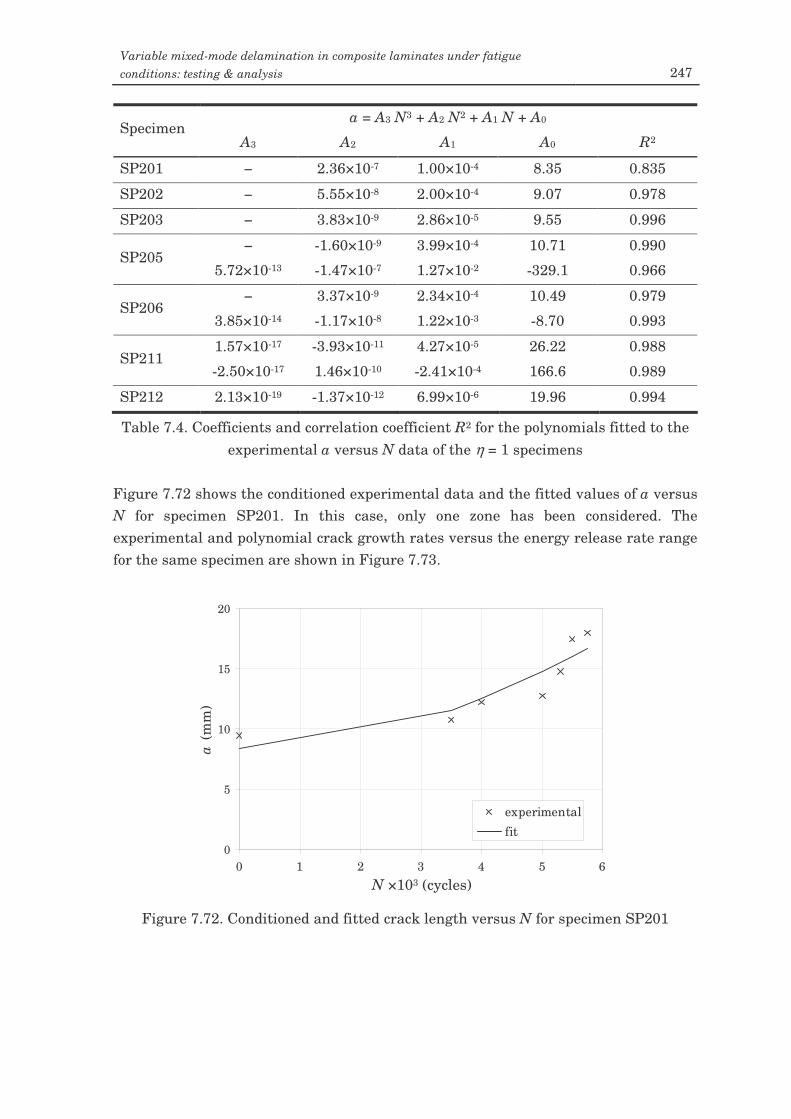
Variable mixed-mode delamination in composite laminates under fatigue conditions: testing & analysis 247
a = A3 N3 + A2 N2 + A1 N + A0 Specimen
A3 A2 A1 A0 R2
SP201 − 2.36×10⁻⁷ 1.00×10⁻⁴ 8.35 0.835
SP202 − 5.55×10⁻⁸ 2.00×10⁻⁴ 9.07 0.978
SP203 − 3.83×10⁻⁹ 2.86×10⁻⁵ 9.55 0.996
− -1.60×10⁻⁹ 3.99×10⁻⁴ 10.71 0.990 SP205
5.72×10⁻¹³ -1.47×10⁻⁷ 1.27×10⁻² -329.1 0.966
− 3.37×10⁻⁹ 2.34×10⁻⁴ 10.49 0.979 SP206
3.85×10⁻¹⁴ -1.17×10⁻⁸ 1.22×10⁻³ -8.70 0.993
1.57×10⁻¹⁷ -3.93×10⁻¹¹ 4.27×10⁻⁵ 26.22 0.988 SP211
-2.50×10⁻¹⁷ 1.46×10⁻¹⁰ -2.41×10⁻⁴ 166.6 0.989
SP212 2.13×10⁻¹⁹ -1.37×10⁻¹² 6.99×10⁻⁶ 19.96 0.994
Table 7.4. Coefficients and correlation coefficient R2 for the polynomials fitted to the experimental a versus N data of the η = 1 specimens
Figure 7.72 shows the conditioned experimental data and the fitted values of a versus N for specimen SP201. In this case, only one zone has been considered. The experimental and polynomial crack growth rates versus the energy release rate range for the same specimen are shown in Figure 7.73.
Figure 7.72. Conditioned and fitted crack length versus N for specimen SP201
0
5
10
15
20
0 1000 2000 3000 4000 5000 6000N (cycles)
a (m
m)
experimentalfit
0 5 1 N ×103 (cycles)
6 3 2 4
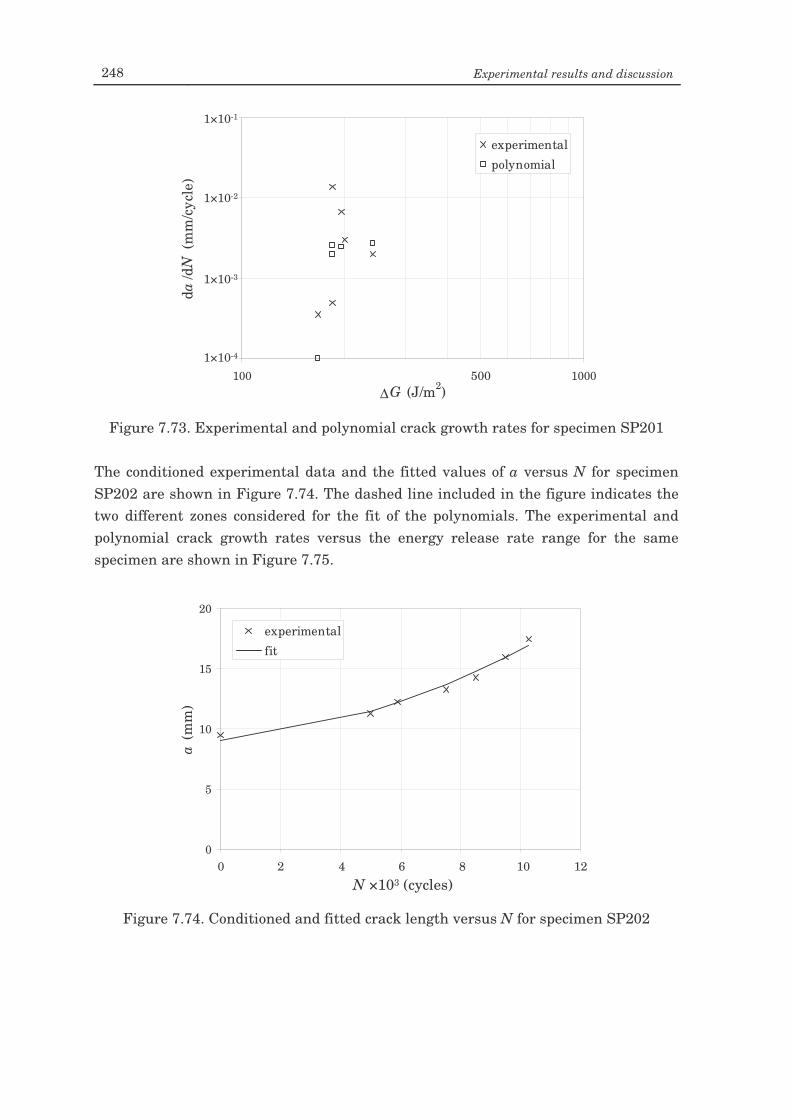
248 Experimental results and discussion
Figure 7.73. Experimental and polynomial crack growth rates for specimen SP201
The conditioned experimental data and the fitted values of a versus N for specimen SP202 are shown in Figure 7.74. The dashed line included in the figure indicates the two different zones considered for the fit of the polynomials. The experimental and polynomial crack growth rates versus the energy release rate range for the same specimen are shown in Figure 7.75.
Figure 7.74. Conditioned and fitted crack length versus N for specimen SP202
1.E-04
1.E-03
1.E-02
1.E-01
100 1000∆G (J/m2)
da/d
N (m
m/c
ycle
)
experimentalpolynomial
1×10⁻⁴
1×10⁻³
1×10⁻¹
500
1×10⁻²
0
5
10
15
20
0 2000 4000 6000 8000 10000 12000N (cycles)
a (m
m)
experimentalfit
0 10 2 N ×103 (cycles)
12 6 4 8
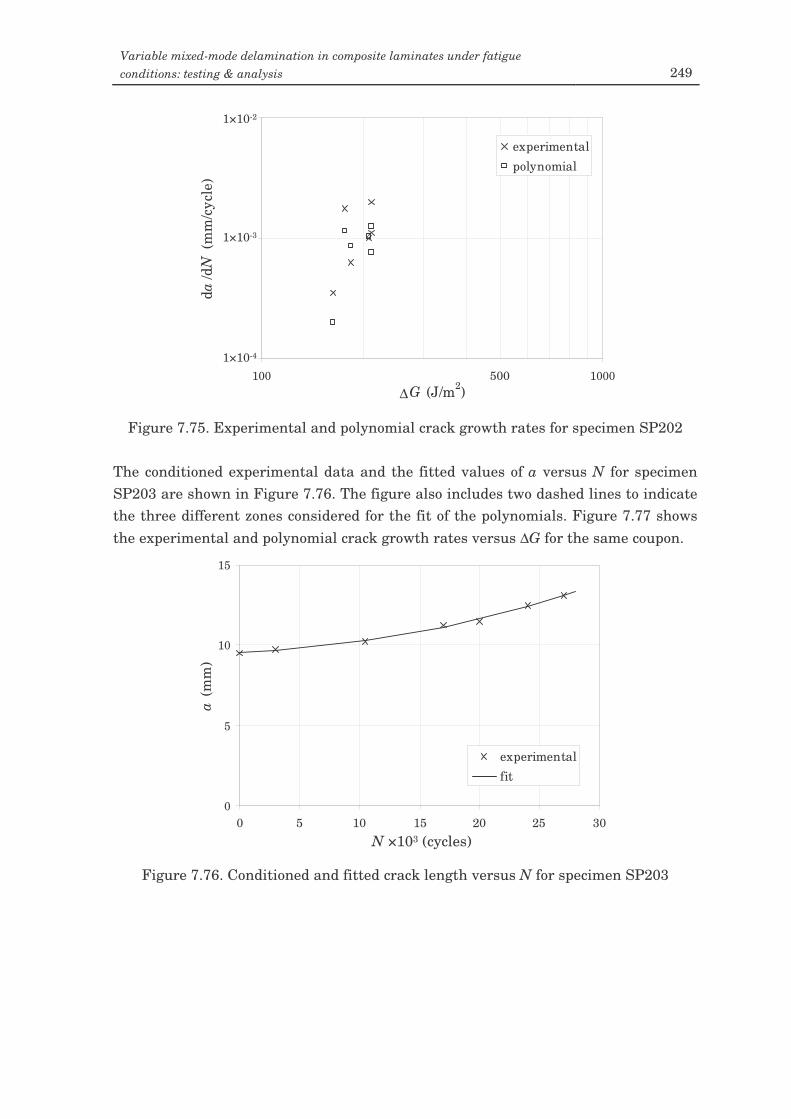
Variable mixed-mode delamination in composite laminates under fatigue conditions: testing & analysis 249
Figure 7.75. Experimental and polynomial crack growth rates for specimen SP202
The conditioned experimental data and the fitted values of a versus N for specimen SP203 are shown in Figure 7.76. The figure also includes two dashed lines to indicate the three different zones considered for the fit of the polynomials. Figure 7.77 shows the experimental and polynomial crack growth rates versus ∆G for the same coupon.
Figure 7.76. Conditioned and fitted crack length versus N for specimen SP203
1.E-04
1.E-03
1.E-02
100 1000∆G (J/m2)
da/d
N (m
m/c
ycle
)
experimentalpolynomial
1×10⁻⁴
1×10⁻³
1×10⁻²
500
0
5
10
15
0 5000 10000 15000 20000 25000 30000N (cycles)
a (m
m)
experimentalfit
0 25 5 N ×103 (cycles)
30 15 10 20
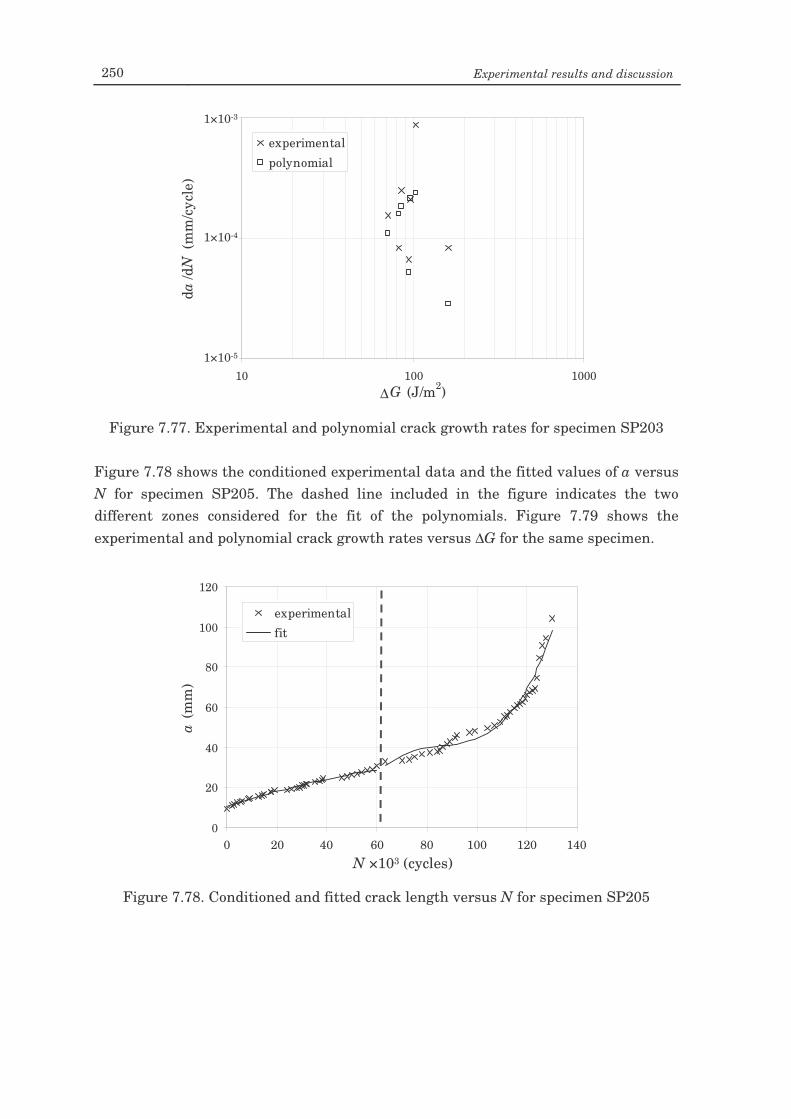
250 Experimental results and discussion
Figure 7.77. Experimental and polynomial crack growth rates for specimen SP203
Figure 7.78 shows the conditioned experimental data and the fitted values of a versus N for specimen SP205. The dashed line included in the figure indicates the two different zones considered for the fit of the polynomials. Figure 7.79 shows the experimental and polynomial crack growth rates versus ∆G for the same specimen.
Figure 7.78. Conditioned and fitted crack length versus N for specimen SP205
1.E-05
1.E-04
1.E-03
10 100 1000∆G (J/m2)
da/d
N (m
m/c
ycle
)
experimentalpolynomial
1×10⁻⁵
1×10⁻⁴
1×10⁻³
0
20
40
60
80
100
120
0 20000 40000 60000 80000 100000 120000 140000N (cycles)
a (m
m)
experimentalfit
0 20 N ×103 (cycles)
140 100 40 120 80 60
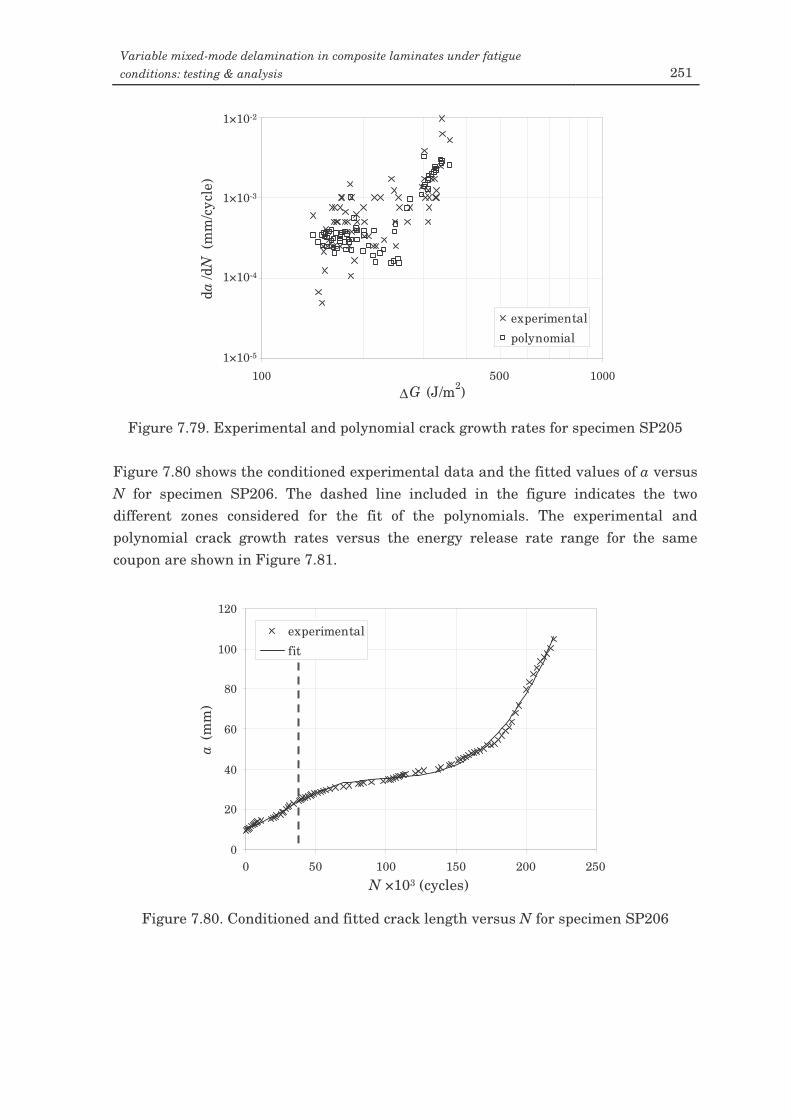
Variable mixed-mode delamination in composite laminates under fatigue conditions: testing & analysis 251
Figure 7.79. Experimental and polynomial crack growth rates for specimen SP205
Figure 7.80 shows the conditioned experimental data and the fitted values of a versus N for specimen SP206. The dashed line included in the figure indicates the two different zones considered for the fit of the polynomials. The experimental and polynomial crack growth rates versus the energy release rate range for the same coupon are shown in Figure 7.81.
Figure 7.80. Conditioned and fitted crack length versus N for specimen SP206
0
20
40
60
80
100
120
0 50000 100000 150000 200000 250000N (cycles)
a (m
m)
experimentalfit
0 50 250 150 100 200
N ×103 (cycles)
1.E-05
1.E-04
1.E-03
1.E-02
100 1000∆G (J/m2)
da/d
N (m
m/c
ycle
)
experimentalpolynomial
1×10⁻⁵
1×10⁻³
1×10⁻²
500
1×10⁻⁴
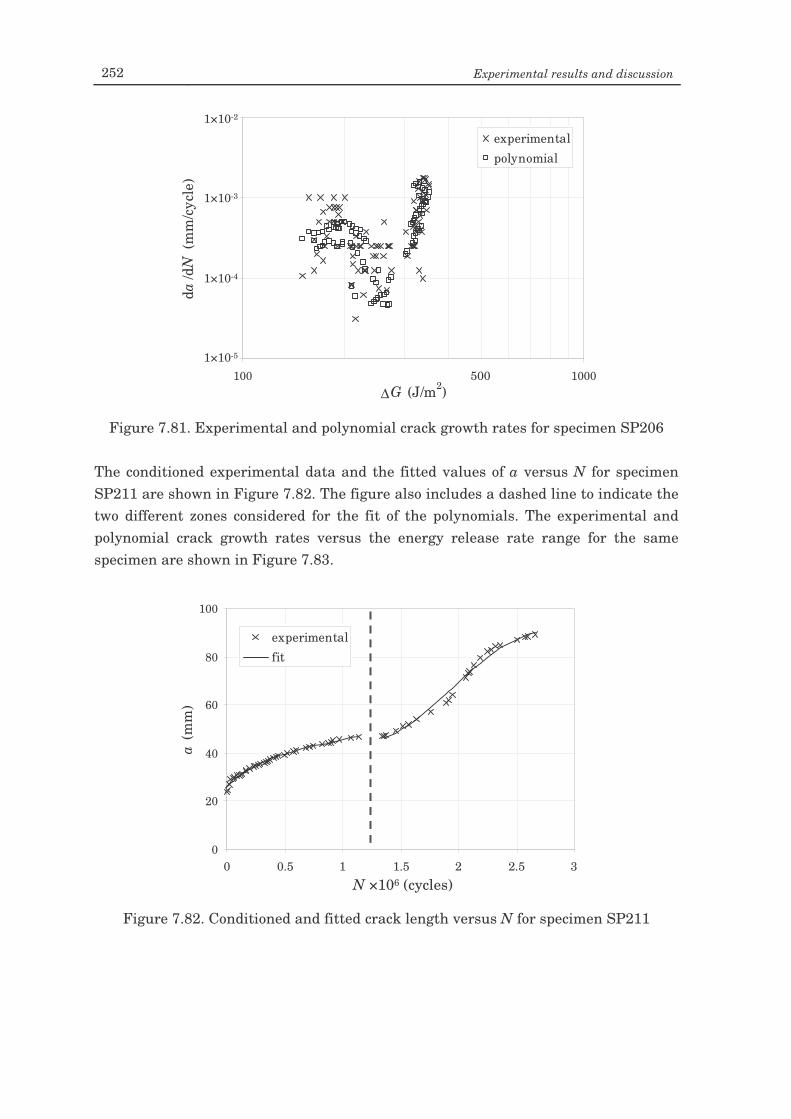
252 Experimental results and discussion
Figure 7.81. Experimental and polynomial crack growth rates for specimen SP206
The conditioned experimental data and the fitted values of a versus N for specimen SP211 are shown in Figure 7.82. The figure also includes a dashed line to indicate the two different zones considered for the fit of the polynomials. The experimental and polynomial crack growth rates versus the energy release rate range for the same specimen are shown in Figure 7.83.
Figure 7.82. Conditioned and fitted crack length versus N for specimen SP211
1.E-05
1.E-04
1.E-03
1.E-02
100 1000∆G (J/m2)
da/d
N (m
m/c
ycle
)
experimentalpolynomial
1×10⁻⁵
1×10⁻²
500
1×10⁻⁴
1×10⁻³
0
20
40
60
80
100
0 500000 1000000 1500000 2000000 2500000 3000000N (cycles)
a (m
m)
experimentalfit
0 0.5 N ×106 (cycles)
2.5 1.5 1 2 3
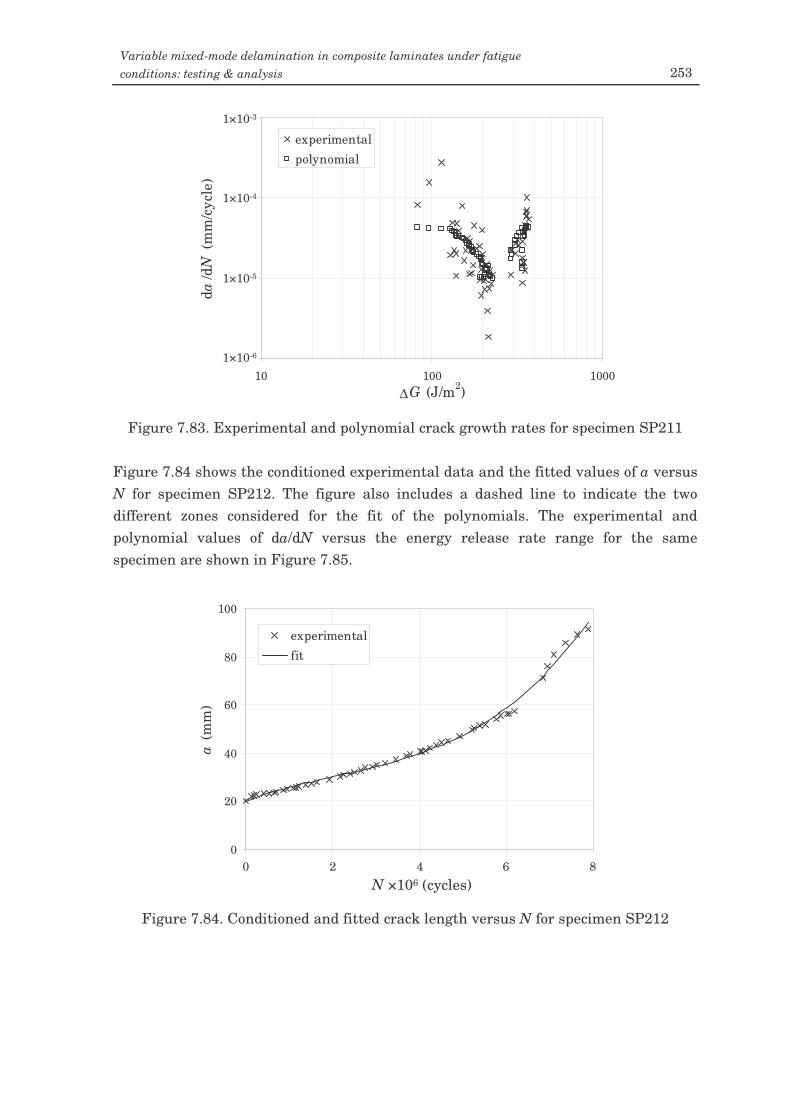
Variable mixed-mode delamination in composite laminates under fatigue conditions: testing & analysis 253
Figure 7.83. Experimental and polynomial crack growth rates for specimen SP211
Figure 7.84 shows the conditioned experimental data and the fitted values of a versus N for specimen SP212. The figure also includes a dashed line to indicate the two different zones considered for the fit of the polynomials. The experimental and polynomial values of da/dN versus the energy release rate range for the same specimen are shown in Figure 7.85.
Figure 7.84. Conditioned and fitted crack length versus N for specimen SP212
1.E-06
1.E-05
1.E-04
1.E-03
10 100 1000∆G (J/m2)
da/d
N (m
m/c
ycle
)
experimentalpolynomial
1×10⁻⁶
1×10⁻³
1×10⁻⁵
1×10⁻⁴
0
20
40
60
80
100
0 2000000 4000000 6000000 8000000N (cycles)
a (m
m)
experimentalfit
0 2 N ×106 (cycles)
8 6 4
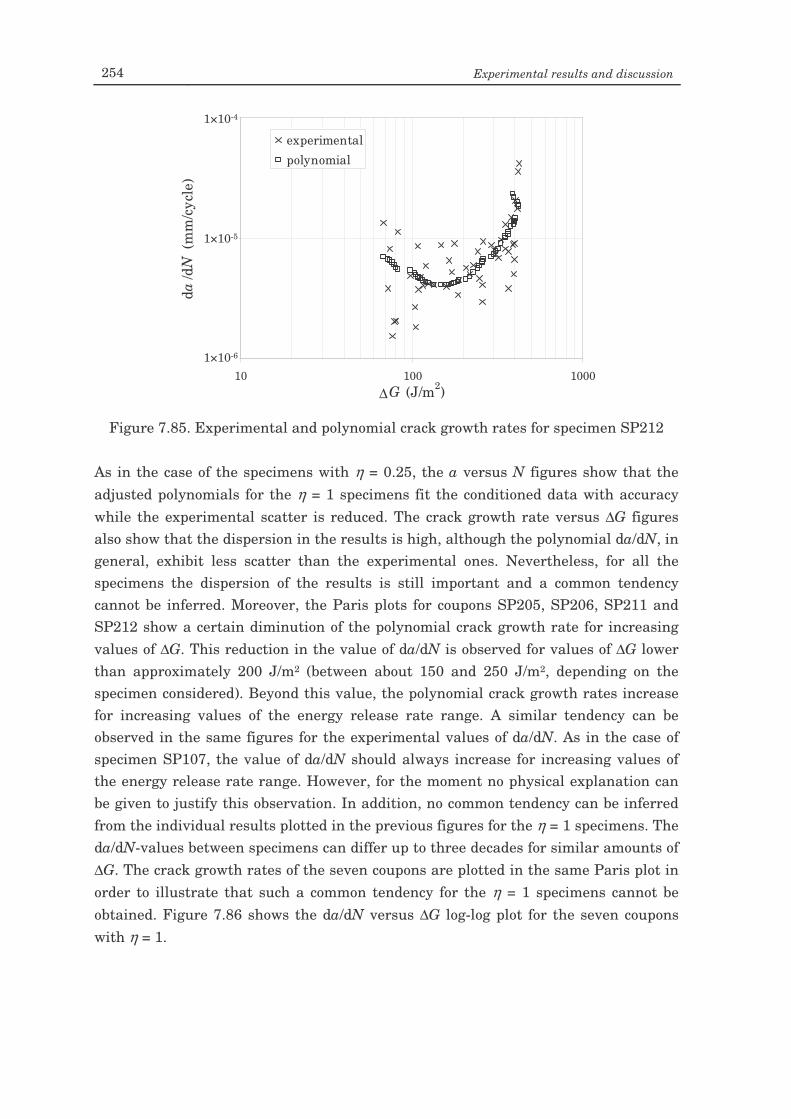
254 Experimental results and discussion
Figure 7.85. Experimental and polynomial crack growth rates for specimen SP212
As in the case of the specimens with η = 0.25, the a versus N figures show that the adjusted polynomials for the η = 1 specimens fit the conditioned data with accuracy while the experimental scatter is reduced. The crack growth rate versus ∆G figures also show that the dispersion in the results is high, although the polynomial da/dN, in general, exhibit less scatter than the experimental ones. Nevertheless, for all the specimens the dispersion of the results is still important and a common tendency cannot be inferred. Moreover, the Paris plots for coupons SP205, SP206, SP211 and SP212 show a certain diminution of the polynomial crack growth rate for increasing values of ∆G. This reduction in the value of da/dN is observed for values of ∆G lower than approximately 200 J/m2 (between about 150 and 250 J/m2, depending on the specimen considered). Beyond this value, the polynomial crack growth rates increase for increasing values of the energy release rate range. A similar tendency can be observed in the same figures for the experimental values of da/dN. As in the case of specimen SP107, the value of da/dN should always increase for increasing values of the energy release rate range. However, for the moment no physical explanation can be given to justify this observation. In addition, no common tendency can be inferred from the individual results plotted in the previous figures for the η = 1 specimens. The da/dN-values between specimens can differ up to three decades for similar amounts of ∆G. The crack growth rates of the seven coupons are plotted in the same Paris plot in order to illustrate that such a common tendency for the η = 1 specimens cannot be obtained. Figure 7.86 shows the da/dN versus ∆G log-log plot for the seven coupons with η = 1.
1.E-06
1.E-05
1.E-04
10 100 1000∆G (J/m2)
da/d
N (m
m/c
ycle
)
experimentalpolynomial
1×10⁻⁶
1×10⁻⁴
1×10⁻⁵
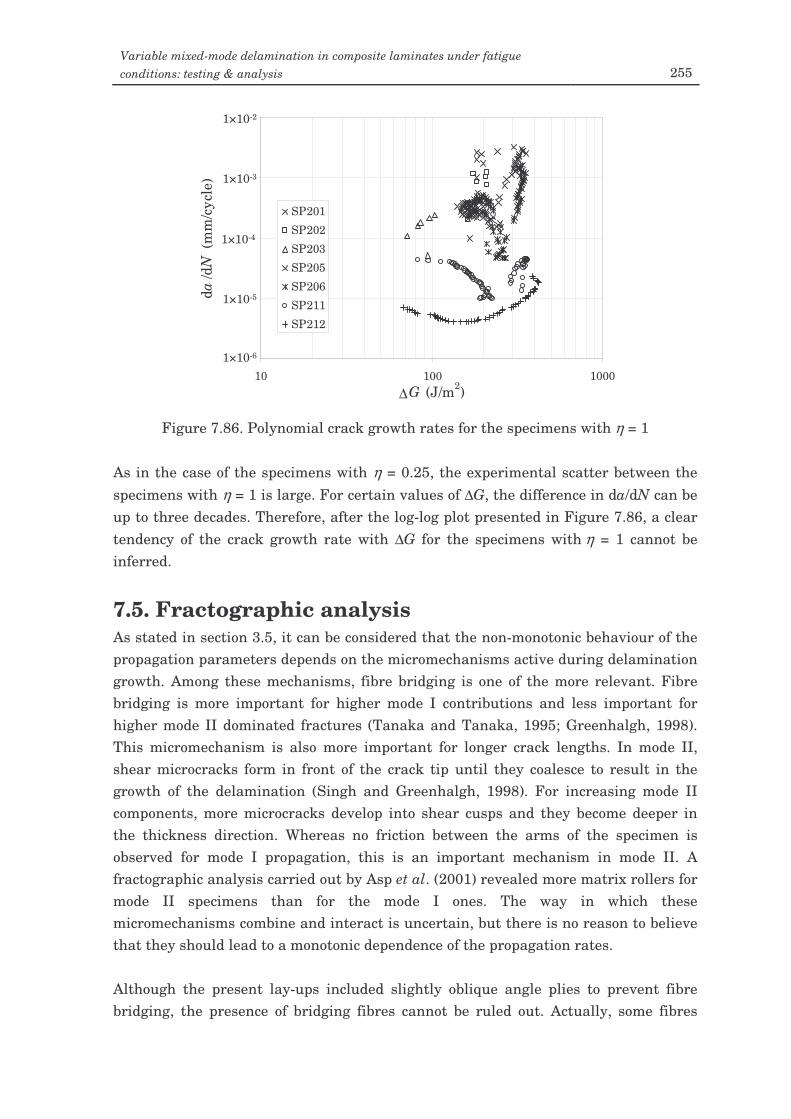
Variable mixed-mode delamination in composite laminates under fatigue conditions: testing & analysis 255
Figure 7.86. Polynomial crack growth rates for the specimens with η = 1
As in the case of the specimens with η = 0.25, the experimental scatter between the specimens with η = 1 is large. For certain values of ∆G, the difference in da/dN can be up to three decades. Therefore, after the log-log plot presented in Figure 7.86, a clear tendency of the crack growth rate with ∆G for the specimens with η = 1 cannot be inferred.
7.5. Fractographic analysis As stated in section 3.5, it can be considered that the non-monotonic behaviour of the propagation parameters depends on the micromechanisms active during delamination growth. Among these mechanisms, fibre bridging is one of the more relevant. Fibre bridging is more important for higher mode I contributions and less important for higher mode II dominated fractures (Tanaka and Tanaka, 1995; Greenhalgh, 1998). This micromechanism is also more important for longer crack lengths. In mode II, shear microcracks form in front of the crack tip until they coalesce to result in the growth of the delamination (Singh and Greenhalgh, 1998). For increasing mode II components, more microcracks develop into shear cusps and they become deeper in the thickness direction. Whereas no friction between the arms of the specimen is observed for mode I propagation, this is an important mechanism in mode II. A fractographic analysis carried out by Asp et al. (2001) revealed more matrix rollers for mode II specimens than for the mode I ones. The way in which these micromechanisms combine and interact is uncertain, but there is no reason to believe that they should lead to a monotonic dependence of the propagation rates. Although the present lay-ups included slightly oblique angle plies to prevent fibre bridging, the presence of bridging fibres cannot be ruled out. Actually, some fibres
1.E-06
1.E-05
1.E-04
1.E-03
1.E-02
10 100 1000∆G (J/m2)
da/d
N (m
m/c
ycle
)SP201
SP202
SP203
SP205
SP206
SP211
SP212
1×10⁻⁶
1×10⁻³
1×10⁻²
1×10⁻⁵
1×10⁻⁴
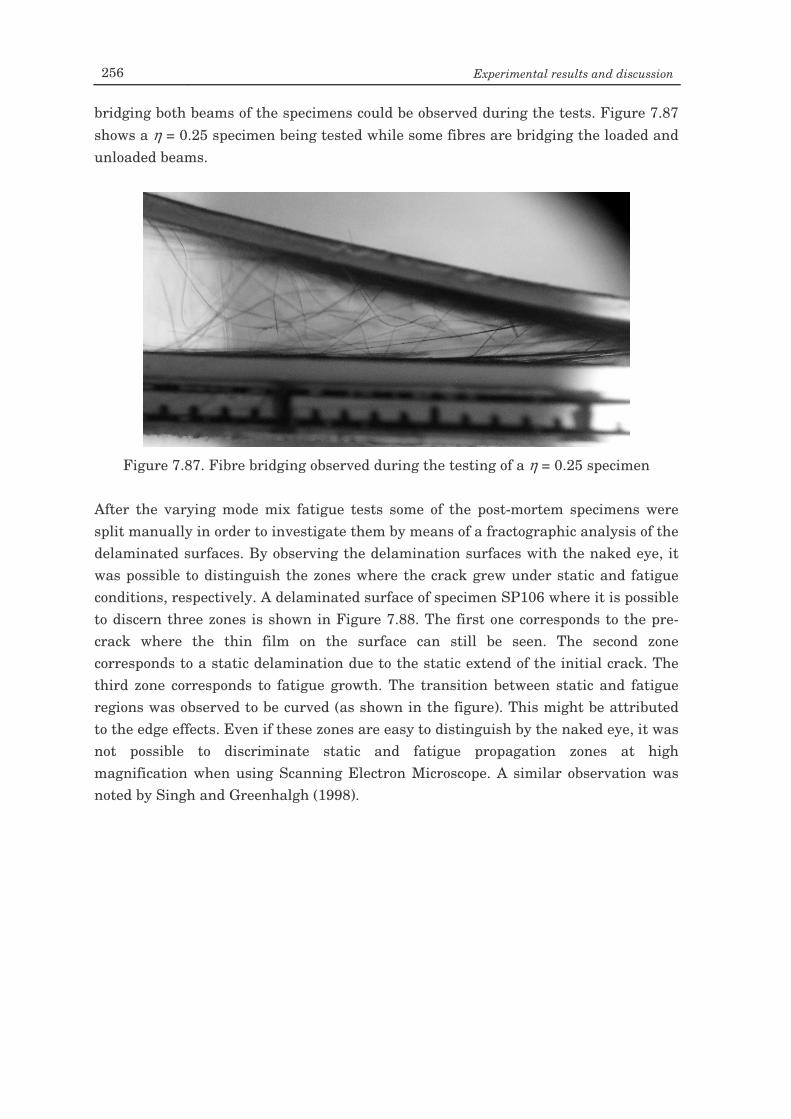
256 Experimental results and discussion
bridging both beams of the specimens could be observed during the tests. Figure 7.87 shows a η = 0.25 specimen being tested while some fibres are bridging the loaded and unloaded beams.
Figure 7.87. Fibre bridging observed during the testing of a η = 0.25 specimen
After the varying mode mix fatigue tests some of the post-mortem specimens were split manually in order to investigate them by means of a fractographic analysis of the delaminated surfaces. By observing the delamination surfaces with the naked eye, it was possible to distinguish the zones where the crack grew under static and fatigue conditions, respectively. A delaminated surface of specimen SP106 where it is possible to discern three zones is shown in Figure 7.88. The first one corresponds to the pre-crack where the thin film on the surface can still be seen. The second zone corresponds to a static delamination due to the static extend of the initial crack. The third zone corresponds to fatigue growth. The transition between static and fatigue regions was observed to be curved (as shown in the figure). This might be attributed to the edge effects. Even if these zones are easy to distinguish by the naked eye, it was not possible to discriminate static and fatigue propagation zones at high magnification when using Scanning Electron Microscope. A similar observation was noted by Singh and Greenhalgh (1998).
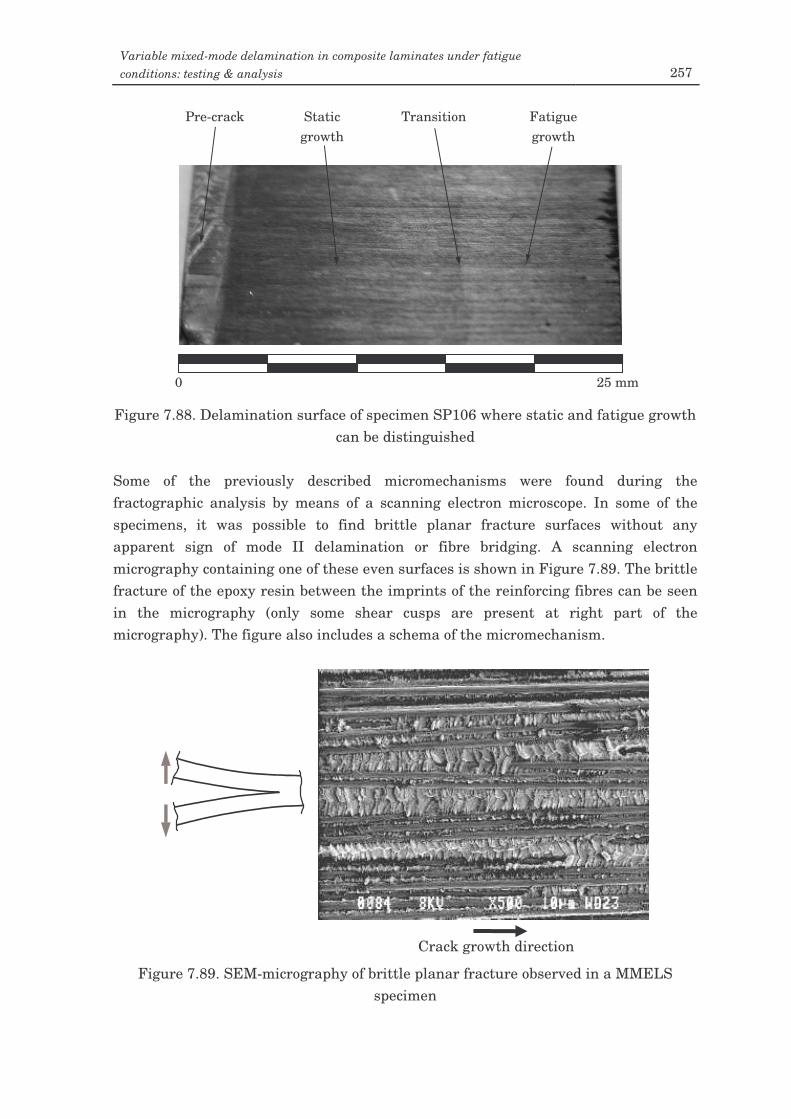
Variable mixed-mode delamination in composite laminates under fatigue conditions: testing & analysis 257
Figure 7.88. Delamination surface of specimen SP106 where static and fatigue growth
can be distinguished Some of the previously described micromechanisms were found during the fractographic analysis by means of a scanning electron microscope. In some of the specimens, it was possible to find brittle planar fracture surfaces without any apparent sign of mode II delamination or fibre bridging. A scanning electron micrography containing one of these even surfaces is shown in Figure 7.89. The brittle fracture of the epoxy resin between the imprints of the reinforcing fibres can be seen in the micrography (only some shear cusps are present at right part of the micrography). The figure also includes a schema of the micromechanism.
Figure 7.89. SEM-micrography of brittle planar fracture observed in a MMELS
specimen
25 mm 0
Pre-crack Static growth
Fatigue growth
Transition
Crack growth direction
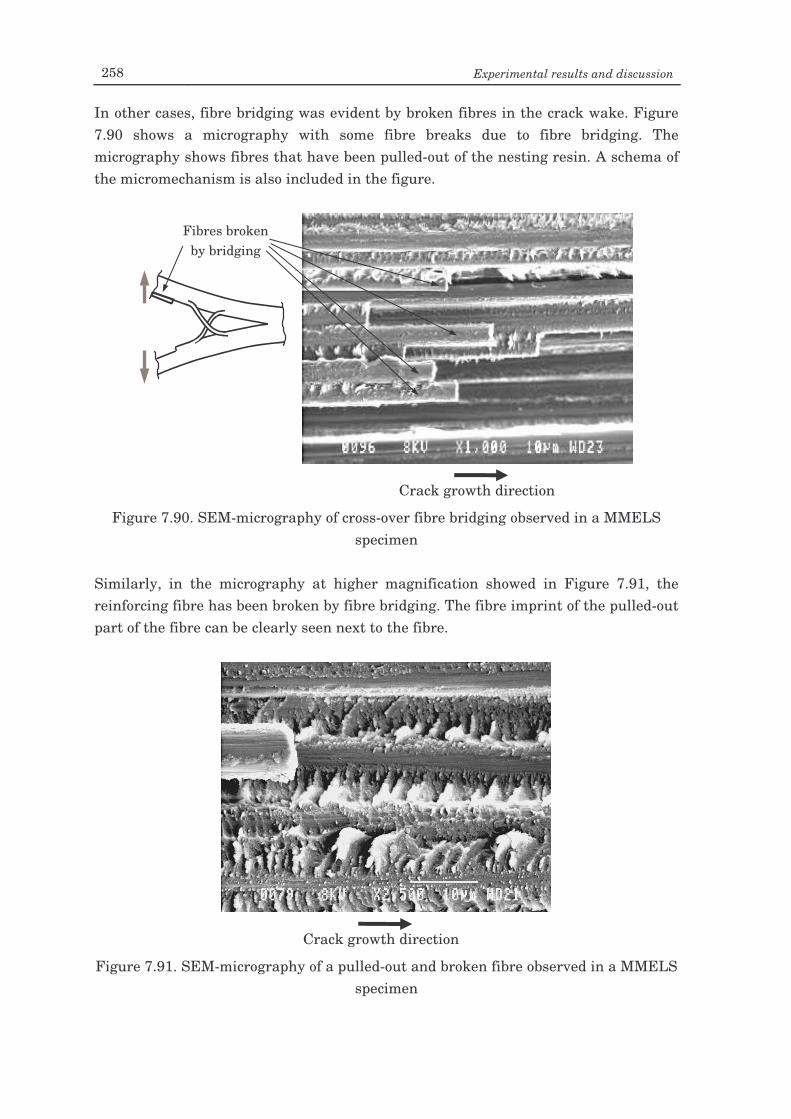
258 Experimental results and discussion
In other cases, fibre bridging was evident by broken fibres in the crack wake. Figure 7.90 shows a micrography with some fibre breaks due to fibre bridging. The micrography shows fibres that have been pulled-out of the nesting resin. A schema of the micromechanism is also included in the figure.
Figure 7.90. SEM-micrography of cross-over fibre bridging observed in a MMELS
specimen Similarly, in the micrography at higher magnification showed in Figure 7.91, the reinforcing fibre has been broken by fibre bridging. The fibre imprint of the pulled-out part of the fibre can be clearly seen next to the fibre.
Figure 7.91. SEM-micrography of a pulled-out and broken fibre observed in a MMELS
specimen
Crack growth direction
Fibres broken by bridging
Crack growth direction
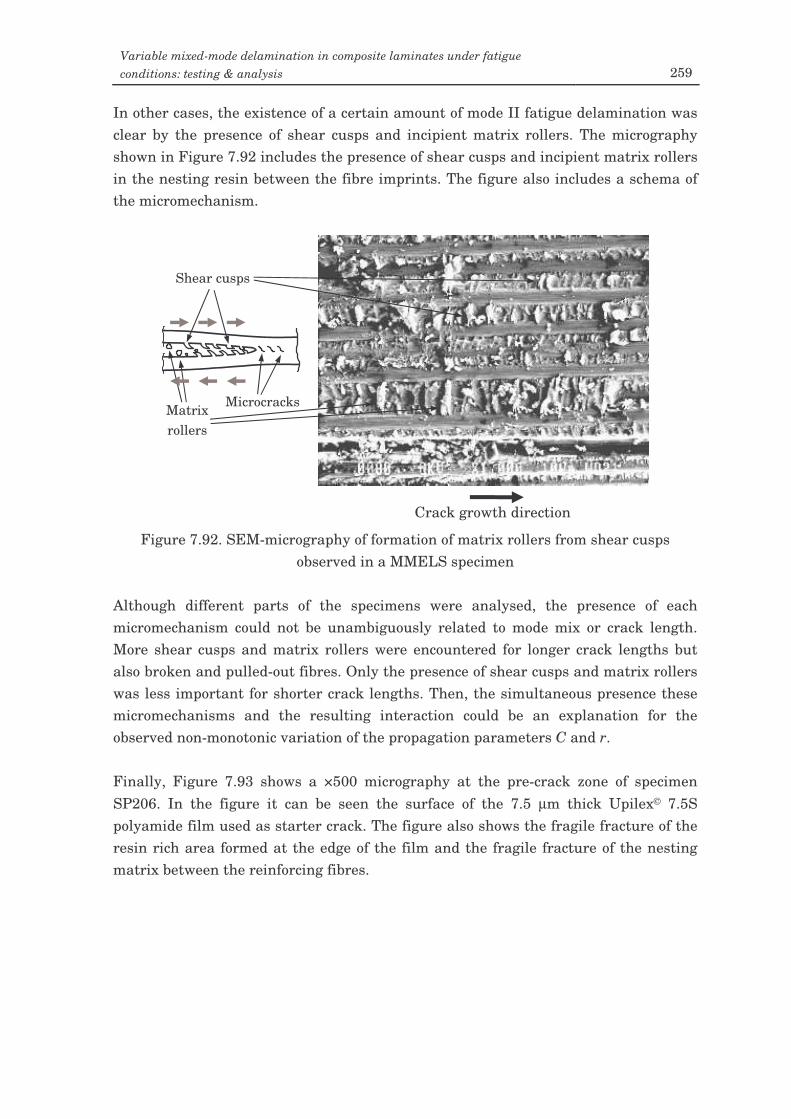
Variable mixed-mode delamination in composite laminates under fatigue conditions: testing & analysis 259
In other cases, the existence of a certain amount of mode II fatigue delamination was clear by the presence of shear cusps and incipient matrix rollers. The micrography shown in Figure 7.92 includes the presence of shear cusps and incipient matrix rollers in the nesting resin between the fibre imprints. The figure also includes a schema of the micromechanism.
Figure 7.92. SEM-micrography of formation of matrix rollers from shear cusps
observed in a MMELS specimen Although different parts of the specimens were analysed, the presence of each micromechanism could not be unambiguously related to mode mix or crack length. More shear cusps and matrix rollers were encountered for longer crack lengths but also broken and pulled-out fibres. Only the presence of shear cusps and matrix rollers was less important for shorter crack lengths. Then, the simultaneous presence these micromechanisms and the resulting interaction could be an explanation for the observed non-monotonic variation of the propagation parameters C and r. Finally, Figure 7.93 shows a ×500 micrography at the pre-crack zone of specimen SP206. In the figure it can be seen the surface of the 7.5 µm thick Upilex© 7.5S polyamide film used as starter crack. The figure also shows the fragile fracture of the resin rich area formed at the edge of the film and the fragile fracture of the nesting matrix between the reinforcing fibres.
Shear cusps
Crack growth direction
Matrix rollers
Microcracks
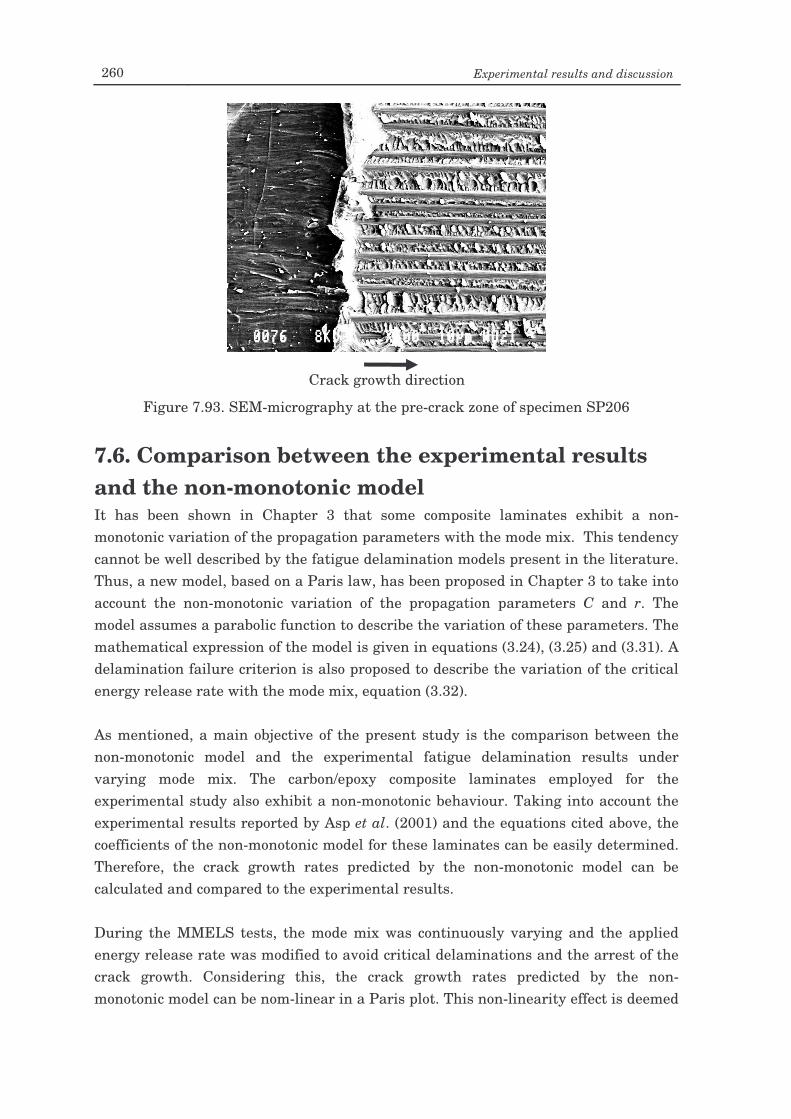
260 Experimental results and discussion
Figure 7.93. SEM-micrography at the pre-crack zone of specimen SP206
7.6. Comparison between the experimental results and the non-monotonic model It has been shown in Chapter 3 that some composite laminates exhibit a non-monotonic variation of the propagation parameters with the mode mix. This tendency cannot be well described by the fatigue delamination models present in the literature. Thus, a new model, based on a Paris law, has been proposed in Chapter 3 to take into account the non-monotonic variation of the propagation parameters C and r. The model assumes a parabolic function to describe the variation of these parameters. The mathematical expression of the model is given in equations (3.24), (3.25) and (3.31). A delamination failure criterion is also proposed to describe the variation of the critical energy release rate with the mode mix, equation (3.32). As mentioned, a main objective of the present study is the comparison between the non-monotonic model and the experimental fatigue delamination results under varying mode mix. The carbon/epoxy composite laminates employed for the experimental study also exhibit a non-monotonic behaviour. Taking into account the experimental results reported by Asp et al. (2001) and the equations cited above, the coefficients of the non-monotonic model for these laminates can be easily determined. Therefore, the crack growth rates predicted by the non-monotonic model can be calculated and compared to the experimental results. During the MMELS tests, the mode mix was continuously varying and the applied energy release rate was modified to avoid critical delaminations and the arrest of the crack growth. Considering this, the crack growth rates predicted by the non-monotonic model can be nom-linear in a Paris plot. This non-linearity effect is deemed
Crack growth direction
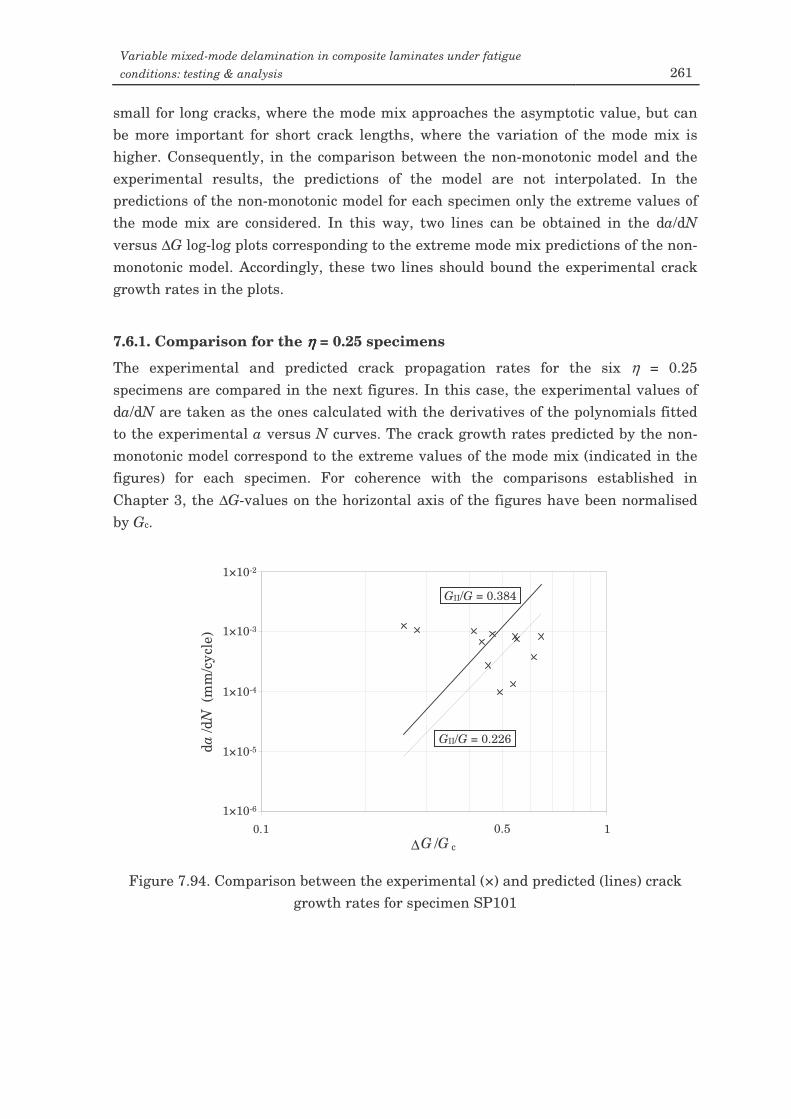
Variable mixed-mode delamination in composite laminates under fatigue conditions: testing & analysis 261
small for long cracks, where the mode mix approaches the asymptotic value, but can be more important for short crack lengths, where the variation of the mode mix is higher. Consequently, in the comparison between the non-monotonic model and the experimental results, the predictions of the model are not interpolated. In the predictions of the non-monotonic model for each specimen only the extreme values of the mode mix are considered. In this way, two lines can be obtained in the da/dN versus ∆G log-log plots corresponding to the extreme mode mix predictions of the non-monotonic model. Accordingly, these two lines should bound the experimental crack growth rates in the plots.
7.6.1. Comparison for the ηηηη = 0.25 specimens
The experimental and predicted crack propagation rates for the six η = 0.25 specimens are compared in the next figures. In this case, the experimental values of da/dN are taken as the ones calculated with the derivatives of the polynomials fitted to the experimental a versus N curves. The crack growth rates predicted by the non-monotonic model correspond to the extreme values of the mode mix (indicated in the figures) for each specimen. For coherence with the comparisons established in Chapter 3, the ∆G-values on the horizontal axis of the figures have been normalised by Gc.
Figure 7.94. Comparison between the experimental (×) and predicted (lines) crack
growth rates for specimen SP101
1.E-06
1.E-05
1.E-04
1.E-03
1.E-02
0.1 1∆G /G c
da/d
N (m
m/c
ycle
)
1×10⁻⁶
1×10⁻²
1×10⁻⁴
1×10⁻⁵
1×10⁻³
0.5
GII/G = 0.226
GII/G = 0.384
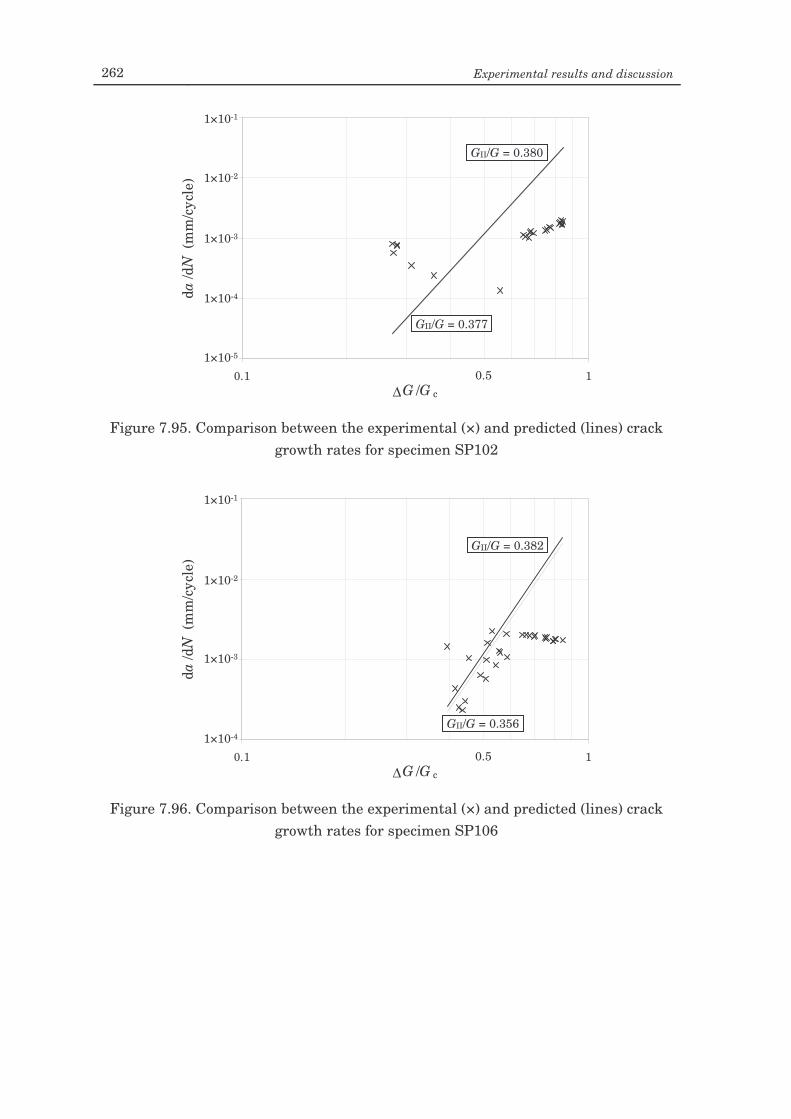
262 Experimental results and discussion
Figure 7.95. Comparison between the experimental (×) and predicted (lines) crack
growth rates for specimen SP102
Figure 7.96. Comparison between the experimental (×) and predicted (lines) crack
growth rates for specimen SP106
1.E-04
1.E-03
1.E-02
1.E-01
0.1 1∆G /G c
da/d
N (m
m/c
ycle
)
1×10⁻⁴
1×10⁻¹
1×10⁻³
1×10⁻²
0.5
GII/G = 0.356
GII/G = 0.382
1.E-05
1.E-04
1.E-03
1.E-02
1.E-01
0.1 1∆G /G c
da/d
N (m
m/c
ycle
)
1×10⁻⁵
1×10⁻¹
1×10⁻³
1×10⁻⁴
1×10⁻²
0.5
GII/G = 0.377
GII/G = 0.380
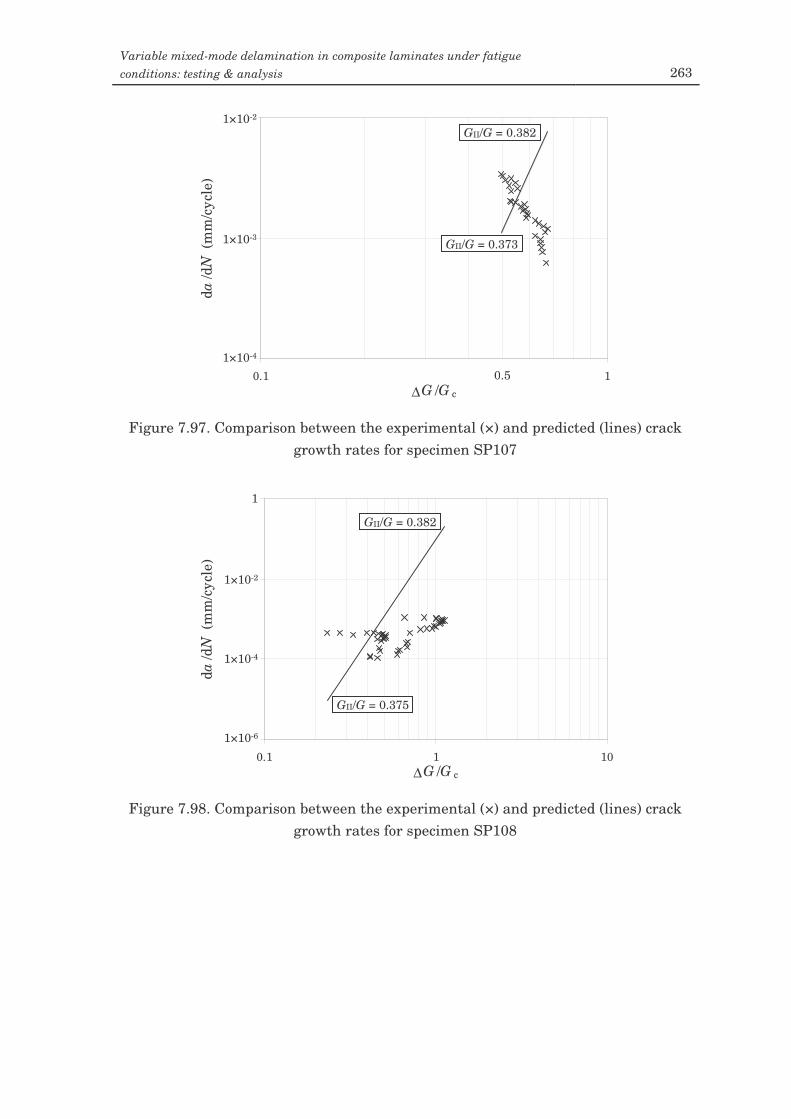
Variable mixed-mode delamination in composite laminates under fatigue conditions: testing & analysis 263
Figure 7.97. Comparison between the experimental (×) and predicted (lines) crack
growth rates for specimen SP107
Figure 7.98. Comparison between the experimental (×) and predicted (lines) crack
growth rates for specimen SP108
1.E-06
1.E-04
1.E-02
1.E+00
0.1 1 10∆G /G c
da/d
N (m
m/c
ycle
)
1
GII/G = 0.375
GII/G = 0.382
1×10⁻²
1×10⁻⁴
1×10⁻⁶
1.E-04
1.E-03
1.E-02
0.1 1∆G /G c
da/d
N (m
m/c
ycle
)
1×10⁻⁴
1×10⁻²
1×10⁻³
0.5
GII/G = 0.373
GII/G = 0.382
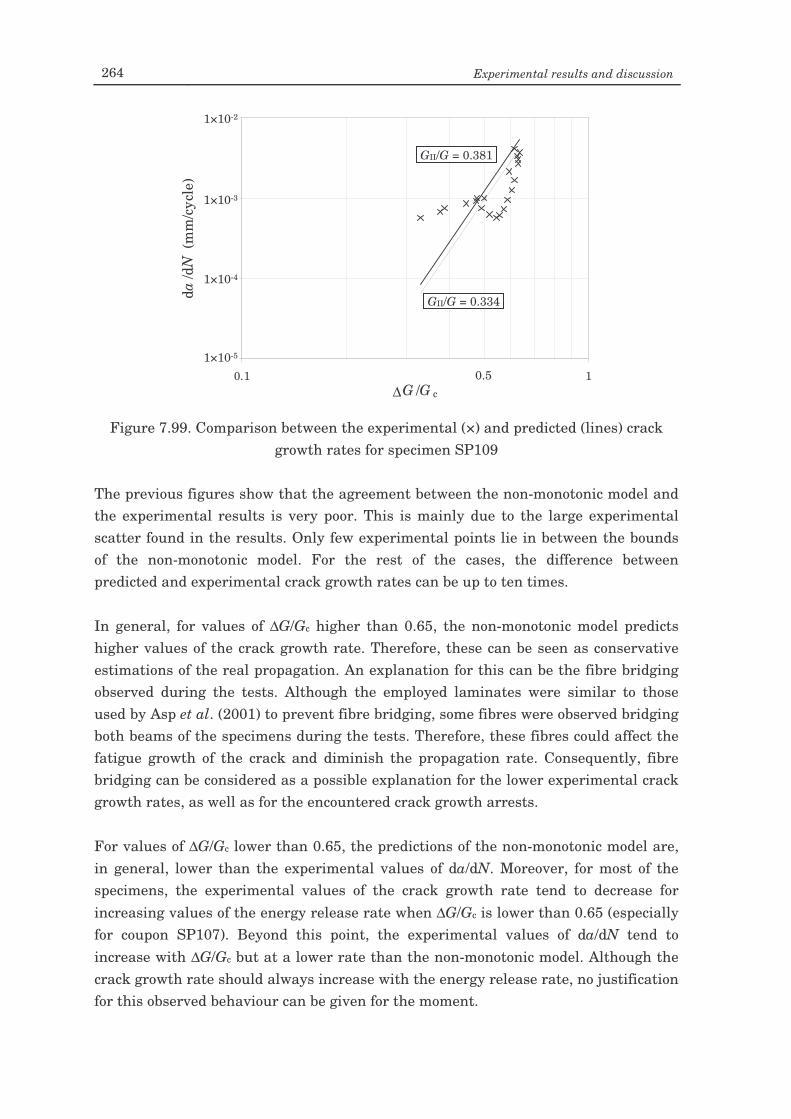
264 Experimental results and discussion
Figure 7.99. Comparison between the experimental (×) and predicted (lines) crack
growth rates for specimen SP109 The previous figures show that the agreement between the non-monotonic model and the experimental results is very poor. This is mainly due to the large experimental scatter found in the results. Only few experimental points lie in between the bounds of the non-monotonic model. For the rest of the cases, the difference between predicted and experimental crack growth rates can be up to ten times. In general, for values of ∆G/Gc higher than 0.65, the non-monotonic model predicts higher values of the crack growth rate. Therefore, these can be seen as conservative estimations of the real propagation. An explanation for this can be the fibre bridging observed during the tests. Although the employed laminates were similar to those used by Asp et al. (2001) to prevent fibre bridging, some fibres were observed bridging both beams of the specimens during the tests. Therefore, these fibres could affect the fatigue growth of the crack and diminish the propagation rate. Consequently, fibre bridging can be considered as a possible explanation for the lower experimental crack growth rates, as well as for the encountered crack growth arrests. For values of ∆G/Gc lower than 0.65, the predictions of the non-monotonic model are, in general, lower than the experimental values of da/dN. Moreover, for most of the specimens, the experimental values of the crack growth rate tend to decrease for increasing values of the energy release rate when ∆G/Gc is lower than 0.65 (especially for coupon SP107). Beyond this point, the experimental values of da/dN tend to increase with ∆G/Gc but at a lower rate than the non-monotonic model. Although the crack growth rate should always increase with the energy release rate, no justification for this observed behaviour can be given for the moment.
1.E-05
1.E-04
1.E-03
1.E-02
0.1 1∆G /G c
da/d
N (m
m/c
ycle
)
1×10⁻⁵
1×10⁻²
0.5
GII/G = 0.334
GII/G = 0.381
1×10⁻⁴
1×10⁻³
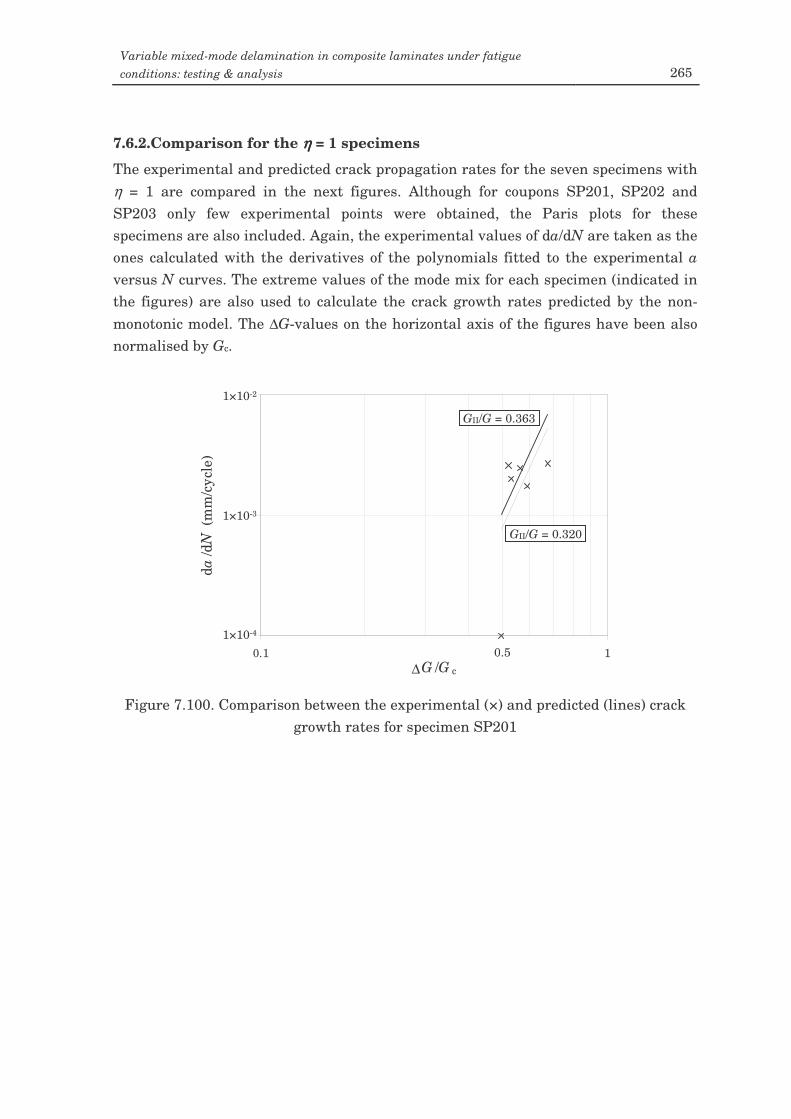
Variable mixed-mode delamination in composite laminates under fatigue conditions: testing & analysis 265
7.6.2.Comparison for the ηηηη = 1 specimens
The experimental and predicted crack propagation rates for the seven specimens with η = 1 are compared in the next figures. Although for coupons SP201, SP202 and SP203 only few experimental points were obtained, the Paris plots for these specimens are also included. Again, the experimental values of da/dN are taken as the ones calculated with the derivatives of the polynomials fitted to the experimental a versus N curves. The extreme values of the mode mix for each specimen (indicated in the figures) are also used to calculate the crack growth rates predicted by the non-monotonic model. The ∆G-values on the horizontal axis of the figures have been also normalised by Gc.
Figure 7.100. Comparison between the experimental (×) and predicted (lines) crack
growth rates for specimen SP201
1.E-04
1.E-03
1.E-02
0.1 1∆G /G c
da/d
N (m
m/c
ycle
)
1×10⁻⁴
1×10⁻²
0.5
GII/G = 0.320
GII/G = 0.363
1×10⁻³
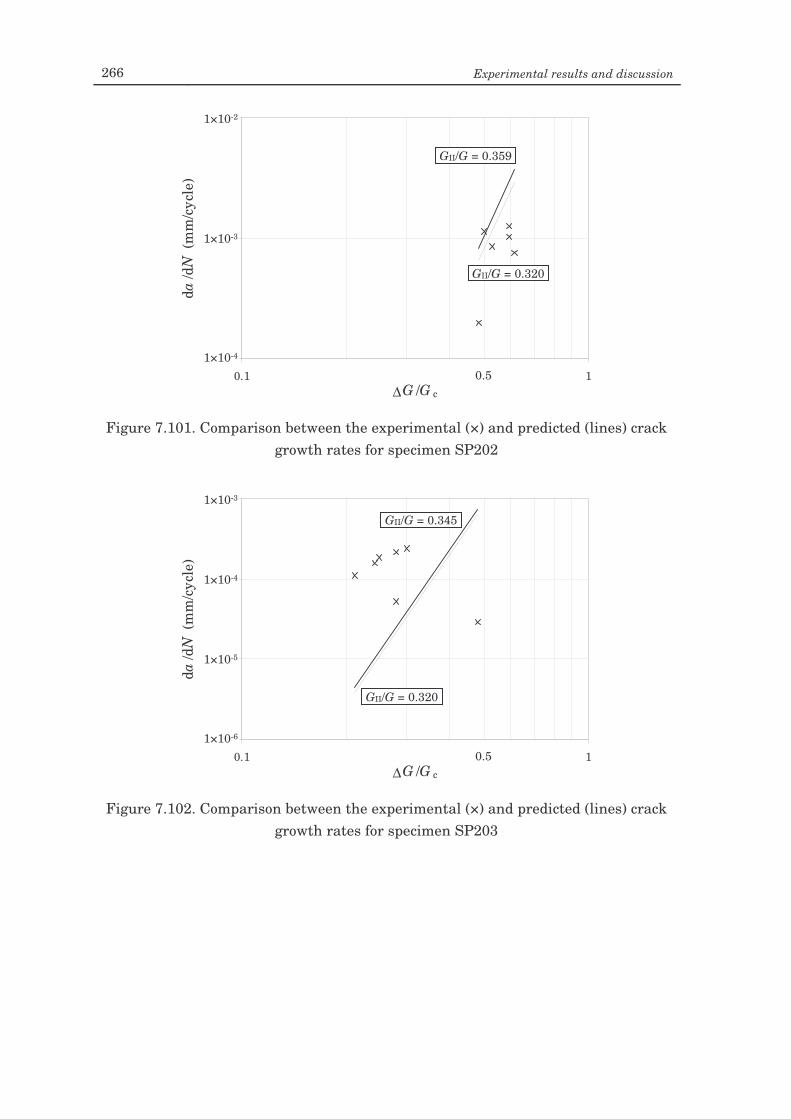
266 Experimental results and discussion
Figure 7.101. Comparison between the experimental (×) and predicted (lines) crack
growth rates for specimen SP202
Figure 7.102. Comparison between the experimental (×) and predicted (lines) crack
growth rates for specimen SP203
1.E-06
1.E-05
1.E-04
1.E-03
0.1 1∆G /G c
da/d
N (m
m/c
ycle
)
1×10⁻⁶
1×10⁻³
0.5
GII/G = 0.320
GII/G = 0.345
1×10⁻⁵
1×10⁻⁴
1.E-04
1.E-03
1.E-02
0.1 1∆G /G c
da/d
N (m
m/c
ycle
)
1×10⁻⁴
1×10⁻²
0.5
GII/G = 0.320
GII/G = 0.359
1×10⁻³
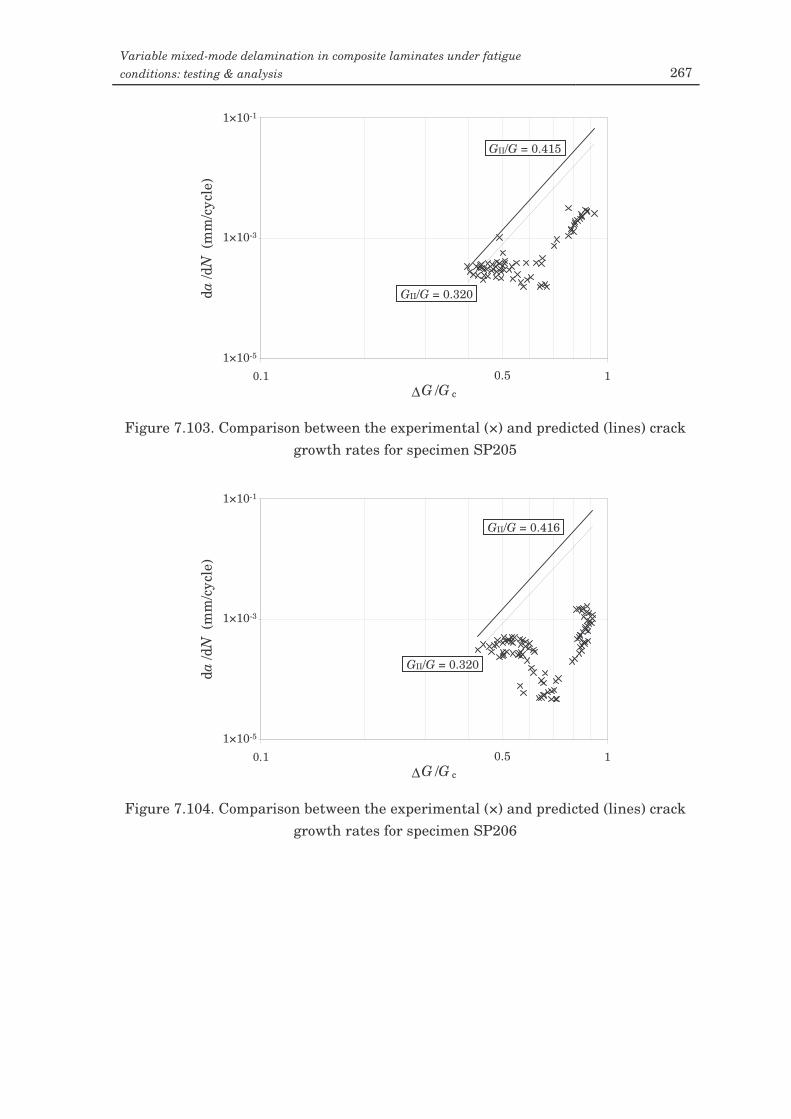
Variable mixed-mode delamination in composite laminates under fatigue conditions: testing & analysis 267
Figure 7.103. Comparison between the experimental (×) and predicted (lines) crack
growth rates for specimen SP205
Figure 7.104. Comparison between the experimental (×) and predicted (lines) crack
growth rates for specimen SP206
1.E-05
1.E-03
1.E-01
0.1 1∆G /G c
da/d
N (m
m/c
ycle
)
1×10⁻⁵
1×10⁻¹
0.5
GII/G = 0.320
GII/G = 0.416
1×10⁻³
1.E-05
1.E-03
1.E-01
0.1 1∆G /G c
da/d
N (m
m/c
ycle
)
1×10⁻⁵
1×10⁻¹
0.5
GII/G = 0.320
GII/G = 0.415
1×10⁻³
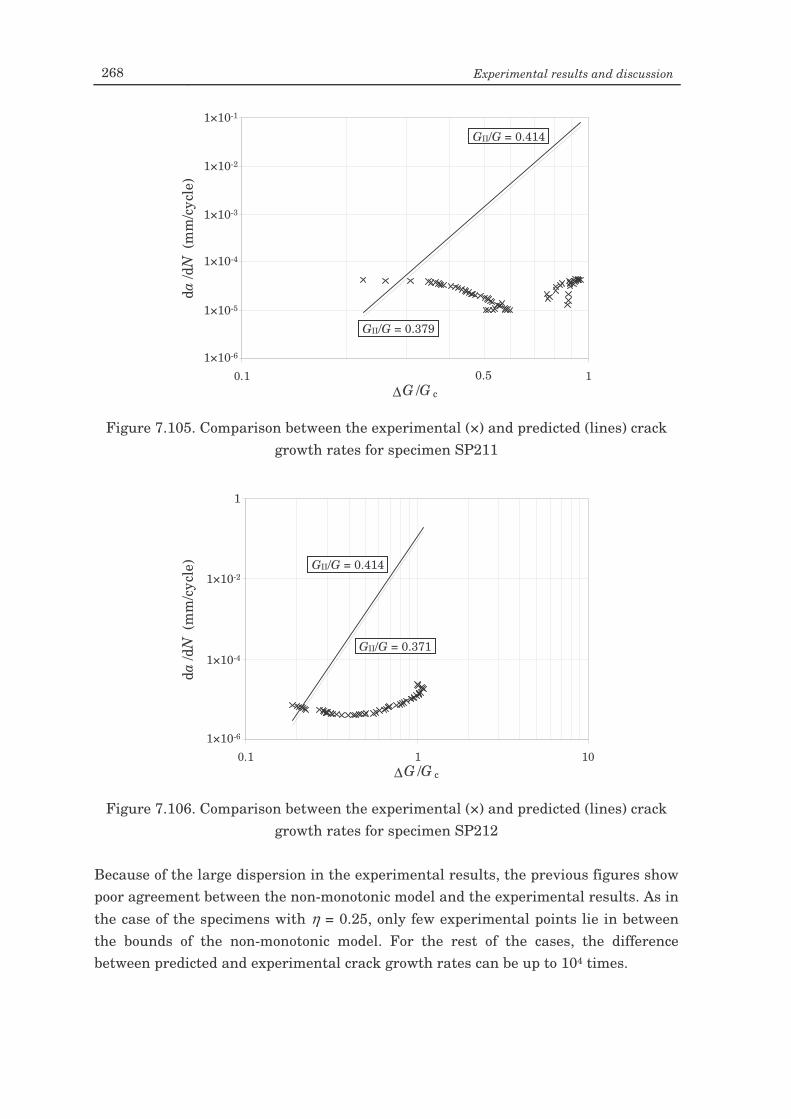
268 Experimental results and discussion
Figure 7.105. Comparison between the experimental (×) and predicted (lines) crack
growth rates for specimen SP211
Figure 7.106. Comparison between the experimental (×) and predicted (lines) crack
growth rates for specimen SP212 Because of the large dispersion in the experimental results, the previous figures show poor agreement between the non-monotonic model and the experimental results. As in the case of the specimens with η = 0.25, only few experimental points lie in between the bounds of the non-monotonic model. For the rest of the cases, the difference between predicted and experimental crack growth rates can be up to 104 times.
1.E-06
1.E-04
1.E-02
1.E+00
0.1 1 10∆G /G c
da/d
N (m
m/c
ycle
)
1×10⁻⁶
1
GII/G = 0.371
GII/G = 0.414 1×10⁻²
1×10⁻⁴
1.E-06
1.E-05
1.E-04
1.E-03
1.E-02
1.E-01
0.1 1∆G /G c
da/d
N (m
m/c
ycle
)
1×10⁻⁶
1×10⁻¹
0.5
GII/G = 0.379
GII/G = 0.414
1×10⁻³
1×10⁻²
1×10⁻⁴
1×10⁻⁵
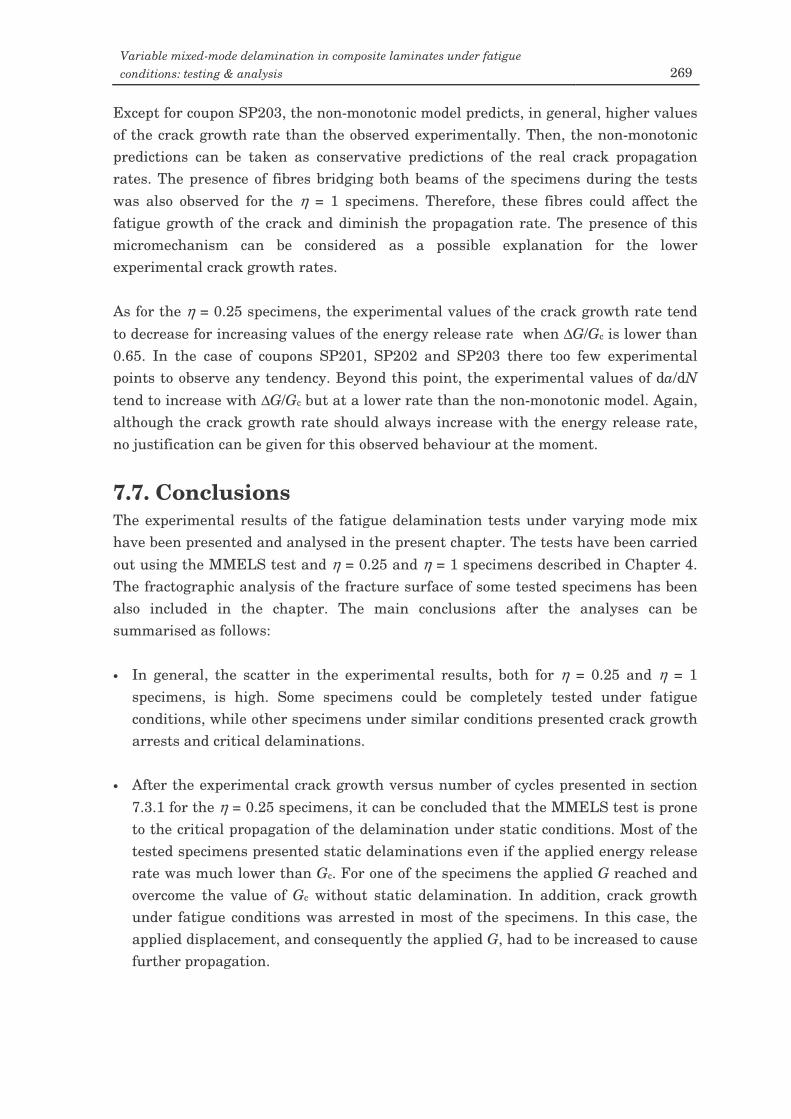
Variable mixed-mode delamination in composite laminates under fatigue conditions: testing & analysis 269
Except for coupon SP203, the non-monotonic model predicts, in general, higher values of the crack growth rate than the observed experimentally. Then, the non-monotonic predictions can be taken as conservative predictions of the real crack propagation rates. The presence of fibres bridging both beams of the specimens during the tests was also observed for the η = 1 specimens. Therefore, these fibres could affect the fatigue growth of the crack and diminish the propagation rate. The presence of this micromechanism can be considered as a possible explanation for the lower experimental crack growth rates. As for the η = 0.25 specimens, the experimental values of the crack growth rate tend to decrease for increasing values of the energy release rate when ∆G/Gc is lower than 0.65. In the case of coupons SP201, SP202 and SP203 there too few experimental points to observe any tendency. Beyond this point, the experimental values of da/dN tend to increase with ∆G/Gc but at a lower rate than the non-monotonic model. Again, although the crack growth rate should always increase with the energy release rate, no justification can be given for this observed behaviour at the moment.
7.7. Conclusions The experimental results of the fatigue delamination tests under varying mode mix have been presented and analysed in the present chapter. The tests have been carried out using the MMELS test and η = 0.25 and η = 1 specimens described in Chapter 4. The fractographic analysis of the fracture surface of some tested specimens has been also included in the chapter. The main conclusions after the analyses can be summarised as follows: • In general, the scatter in the experimental results, both for η = 0.25 and η = 1
specimens, is high. Some specimens could be completely tested under fatigue conditions, while other specimens under similar conditions presented crack growth arrests and critical delaminations.
• After the experimental crack growth versus number of cycles presented in section
7.3.1 for the η = 0.25 specimens, it can be concluded that the MMELS test is prone to the critical propagation of the delamination under static conditions. Most of the tested specimens presented static delaminations even if the applied energy release rate was much lower than Gc. For one of the specimens the applied G reached and overcome the value of Gc without static delamination. In addition, crack growth under fatigue conditions was arrested in most of the specimens. In this case, the applied displacement, and consequently the applied G, had to be increased to cause further propagation.
270 Experimental results and discussion
• The experimental crack growth versus number of cycles presented in section 7.3.2 for the η = 1 specimens also show that the MMELS test is prone to the critical propagation of the delamination. Although fewer specimens were affected by critical delaminations in this case, these specimens were completely delaminated. Again, critical delaminations appeared when the applied energy release rate was much lower than Gc. However, no static delamination was encountered when the critical value of the energy release rate was reached by the applied Gmax in one of the specimens. The crack growth under fatigue conditions was also arrested for some specimens with η = 1. Further propagation was achieved when the applied displacement, and consequently the applied Gmax, was increased.
• It has been shown that the compliance predicted in Chapter 6 by the VCCT is in
good agreement with the experimental variation of the compliance versus the crack length. In general, the experimental compliance is a bit higher due to the plays and compliances associated to the testing machine and test rig.
• Second- and third-degree polynomials have been adjusted to the experimental a
versus N data in order to reduce the effect of the experimental scatter. The fit between polynomials and experimental data is, in general, very good.
• The derivatives of the polynomials have been used to calculate the values of the
polynomial crack growth rates for each specimen. Although the scatter is reduced with respect to the experimental values of da/dN, the variability is still high for both thickness ratios. No general trend can be found to describe the results.
• Even though the crack growth rate is supposed to increase for increasing values of
the applied energy release rate, the da/dN versus ∆G log-log plots for certain specimens showed decreasing values of da/dN until a certain value of ∆G was achieved. Beyond this point, the value of da/dN increased with ∆G. This behaviour has been observed for different specimens of both thickness ratios. No justification can be given for this observed behaviour at the moment.
• The fractographic analyses carried out in some of the tested specimens revealed
brittle planar fracture, fibre bridging and formation of shear cusps and matrix rollers. The presence of these micromechanisms could not be exactly related to the mode mix or the crack length. This confirms the interaction between micromechanisms and can be seen as an explanation for the non-monotonic variation of the propagation parameters. The formation of a resin rich zone at the initial crack tip, next to the polyamide film, has been also observed.
Variable mixed-mode delamination in composite laminates under fatigue conditions: testing & analysis 271
• The predictions of the non-monotonic model proposed in Chapter 3 have been compared to the experimental crack growth rates of both specimen types, η = 0.25 and η = 1. Due to the high variability of the experimental results, the agreement between the predictions and the experimental data is poor.
• In general, for the specimens with η = 0.25 and values of ∆G/Gc higher than 0.65,
the crack growth rates predicted by the non-monotonic model are higher than those observed experimentally. Therefore, the non-monotonic predictions can be seen as conservative estimations of the real propagation. However, for values of ∆G/Gc lower than 0.65, the predictions of the non-monotonic model were, in general, lower than the experimental values of da/dN.
• Except for one specimen, the non-monotonic model predicted for the η = 1
specimens higher values of the crack growth rate than the observed experimentally. Therefore, the non-monotonic predictions can be seen also as conservative estimations of the real propagation for the specimens with η = 1.
• Although the employed laminates included slightly angled plies to avoid fibre
bridging, the presence of fibres bridging both beams of the specimens were observed during the tests. Even though this phenomenon was not extensive, fibre bridging can be a possible explanation for the lower experimental crack growth rates and the observed crack growth arrests.
• In general, and for both thickness ratios, the experimental values of the crack
growth rate decreased for values of ∆G/Gc lower than 0.65. Beyond this point, the value of da/dN increased with ∆G. The observed behaviour cannot be justified at the moment.

Chapter 8 Final remarks
8.1. Summary Delamination is generally accepted as the most harmful damage mechanism in composite laminates. Moreover, fatigue is responsible for the majority of failures of structural components. Therefore, the combination of both factors must be the object of thorough studies in order to gain a major comprehension on the behaviour of composite laminates. In this way, a better characterisation of material properties and behaviour can be achieved and structural composite parts designed in a more efficient way. Delamination represents a crack-like discontinuity between the plies of the laminate, interlaminar crack, which can propagate under the effect of static or fatigue loads. The interlaminar crack can grow under different modes of propagation. In a real component or structure, the propagation mode varies continuously with the delamination extent. Usually, the mode mix varies from a major component of mode I to a more important contribution of mode II. In the present work, the fatigue propagation of composite delaminations under continuously varying mode mix I/II has been investigated. Previously, an overview on micromechanical aspects of composite delaminations, a description of the more common delamination tests and a short review on fracture crack models have been included. The most relevant studies about fatigue delamination onset and propagation in composite laminates, as well as the effect of the stress ratio R on the propagation of the crack, have been presented and discussed. Different mixed-mode fatigue delamination models present in the literature have been analysed and compared. It has been shown that all these models assume a monotonic variation of the propagation parameters with the mode mix, which does not agree with experimental data present in the literature. A new model for the fatigue delamination of composite laminated structures has been proposed. The model assumes a non-monotonic
274 Final remarks
variation of the propagation parameters with the mode mix. A better agreement with the experimental data has been encountered for the proposed non-monotonic model. The mixed-mode end load split (MMELS) delamination test has been analysed in detail because in this test, the propagation mode of the interlaminar crack varies with the delamination extent. Two different approaches published in the literature have been taken into account: beam theory and orthotropic rescaling. The expressions for the MMELS test have been derived according to both approaches and compared. Important differences have been encountered between the predictions of both approaches. An alternative analysis of the MMELS has been carried out in the present study. This analysis has been based on the finite element method and the virtual crack closure technique. The obtained results have been compared to the predictions of the two theoretical approaches. It has been shown that the orthotropic rescaling approach is more accurate for modelling the MMELS test. To carry out the experimental fatigue delamination tests under varying mode mix, a MMELS test rig has been designed and built. The designed test rig does not introduce axial forces on the test specimen. Moreover, the specific length of the specimen remains constant. The designed load hinge introduces the external load centred with the neutral axis of the loaded beam of the specimen. The hinge is designed so it can be adjusted to specimens with different thicknesses. In this way, most of the non-linear effects can be neglected during the tests. The characteristics and preparation of the test specimens with two different thickness ratios has been also described. An analysis of the experimental results of the fatigue crack growth under varying mode mix tests has also been included in the present work. The results showed great variability and experimental scatter. Although the applied displacement was modified during the tests, critical static delaminations took place in most of the tested specimens. No general trend could be inferred from the obtained experimental results. The fractographic analysis of some of the delaminated fracture surfaces revealed the presence of fibre bridging, shear cusps, matrix rollers and brittle planar fracture. A comparison between the predictions of the proposed non-monotonic model and the experimental results of the fatigue crack growth under varying mode mix tests has been established. Due to the variability in the experimental results, very poor agreement has been found in the comparison.
8.2. Conclusions The more relevant conclusions of the present work can be summarised as follows: • The more relevant criteria for the mixed-mode fatigue propagation of interlaminar
cracks assume a monotonic variation of the propagation parameters with the mode
Variable mixed-mode delamination in composite laminates under fatigue conditions: testing & analysis 275
mix. This monotonic variation of the propagation parameters has been shown to be inappropriate to model the experimental response of different composite laminates, and, therefore, an improved model has been proposed.
• The proposed model, with a parabolic formulation for the variation of the
propagation parameters with the mode mix, can describe both monotonic and non-monotonic material behaviours. The agreement of the non-monotonic model with the experimental data is better than for the rest of the fatigue delamination models. Thus, improved predictions of fatigue crack growth of interlaminar cracks in composite laminates can be obtained with the non-monotonic model.
• The effect of the shear forces in the deduction of the beam theory expressions for
the MMELS depends on the thickness ratio and crack length. For the specimens considered in the present study, the effect of the shear forces is less than 2 % for crack lengths longer than 20 mm. Therefore, this effect can be neglected. In addition, the effect of the correction factors F and N can be neglected in the MMELS test provided that l1 = l2 = 0.
• Great differences exist between the predictions of beam theory and orthotropic
rescaling approaches for the MMELS test. The predicted values of the mode I and mode II energy release rate components present great differences when η 1. However, the values of G predicted by both approaches are very similar and independent of the thickness ratio η. The difference for the predicted variation of the mode mix, GII/G, also depends on the thickness ratio and can be as large as 52 times.
• Bao et al. (1992) affirmed that simple beam theory corresponds to an exact
asymptote for orthotropic rescaling when a >> h. However, it has been shown that there exist clear differences in the estimation of G, especially for the specimens with η 1. These differences are mainly due to the estimation of GI and GII.
• According to Bao et al. (1992), the MMELS test can be seen as a superposition of
the DCB and ELS tests. However, it has been proven that this assumption is incorrect for the orthotropic rescaling approach. The comparison of the DCB and ELS superposed expressions with those for the MMELS showed that there is no equivalence.
• After the results of the VCCT model for the MMELS test, it can be concluded that
the orthotropic rescaling is more accurate for modelling the MMELS test than beam theory. Actually, the obtained VCCT results are very similar to those predicted by the orthotropic rescaling for all the studied parameters and thickness
276 Final remarks
ratios considered. On the other hand, the beam theory predictions only are similar to the VCCT results when η = 1.
• The differences observed between the orthotropic rescaling predictions for the
compliance of the MMELS test and the VCCT results can be attributed to the clamped end of the specimen assumed in each approach. While in the orthotropic rescaling approach a completely clamped end of the specimen is assumed, in the VCCT model a clamped end similar to the proposed by the ESIS protocol (Davies, 1992) is considered. Thus, in the VCCT model the specimen is free to move in the horizontal direction and only the vertical displacement is restricted. Consequently, the compliance of the system predicted by the orthotropic rescaling approach tends to be lower than the calculated by the VCCT.
• After the fatigue crack growth under varying mode mix tests, the experimental
results show that the MMELS test is prone to the critical propagation of the delamination under static conditions. This tendency has been observed for the two thickness ratios analysed in this study, η = 0.25 and η = 1. Most of the specimens tested presented static delaminations even if the applied energy release rate was much lower than Gc. On the other hand, for some specimens the applied energy release rate was higher than the Gc-value and no static delamination appeared. Moreover, crack growth under fatigue conditions was arrested in most of the specimens. In this case, the applied displacement, and consequently the applied G, had to be increased to cause further propagation. Consequently, the variability in the experimental results of the fatigue crack propagation under varying mode mix was high and the possibility to infer meaningful conclusions scarce.
• The experimental variation of the compliance versus the crack length is in good
agreement with the compliance predicted by the VCCT. In general, the experimental compliance is a bit higher due to the plays and compliances associated to the testing machine and test rig.
• The Paris plots for each specimen show high variability for the two thickness ratios
considered. The agreement between experimental data and linear regression was very poor and no general trend could be inferred.
• The fractographic analysis of some of the tested specimens revealed brittle planar
fracture, fibre bridging and formation of shear cusps and matrix rollers. The presence of these micromechanisms could not be exactly related to the mode mix or the crack length, which confirms the interaction between micromechanisms and the non-monotonic variation of the propagation parameters. The formation of a resin rich zone at the initial crack tip, next to the polyamide film, has been also observed.
Variable mixed-mode delamination in composite laminates under fatigue conditions: testing & analysis 277
• Due to the high variability in the experimental results, the agreement between the
non-monotonic model predictions and the experimental data is low. In general, the crack growth rates predicted by the non-monotonic model are higher than the experimental ones. Even though the fibre bridging observed during the tests was not extensive, fibre bridging can be a possible explanation for the lower experimental crack growth rates and the observed crack growth arrests.
8.3. Suggestions for future investigations After the conclusions obtained in the present work, some suggestions for future investigations may be proposed. Some of them focus on the improvement of the results obtained in the present study, particularly the experimental fatigue delamination results under varying mode mix. Others can be regarded as complementary studies for a better comprehension of mixed-mode fatigue delamination in composite laminates. The proposed suggestions for future investigations can be summarised as follows: • The non-monotonic model proposed in Chapter 3 has only been compared to the
experimental fatigue delamination data of two different composite materials. Usually, this type of experimental data cannot be found in scientific publications. Therefore, it would be convenient to test different composite laminates at different mixed-mode ratios. In this way, it could be possible to observe if the non-monotonic variation of the propagation parameters is a common tendency. Moreover, the capabilities of the non-monotonic model could be extensively compared to those of the rest of the models for composite materials exhibiting monotonic and non-monotonic behaviours.
• After the fatigue delamination tests under varying mode mix, it has been found
that the crack growth rates for these specimens are lower that those predicted by the non-monotonic model. A possible explanation for the lower values of the crack growth rate is the presence of fibre bridging. In order to avoid the major effect of this phenomenon for some specimens, the use of exactly the same composite laminates is suggested for the constant and varying mixed-mode tests. In this way, the varying mode mix tests would be carried out with the same type of specimens employed for the characterisation of the composite laminate and obtaining the parameters of the non-monotonic model. Then, the effect of fibre bridging would be already taken into account in the parameters of the model and more accurate predictions would be achieved.
• During the analysis of the results of the fatigue delamination tests under varying
mode mix it has been found that most of the specimens presented critical static
278 Final remarks
delaminations and/or crack growth arrests. Both effects introduce experimental scatter and increase the variability in the results. A way to reduce the presence of crack growth arrests and static delaminations is the use o a control system during the tests. In this case, the use of a dG/da or dC/dN control loop can help by reducing the crack growth arrests and preventing critical static delaminations.
• Additional fatigue delamination tests under varying mode mix can be obtained by
using an alternative test method less prone to critical static delaminations. Thus, the variable mixed-mode test (VMM), described in Chapter 2, can be considered. An advantage of this test is the range of variation for the mode mix, from pure mode II to pure mode I. Other experimental tests may be also suitable.
• Quantitative studies on the stochastic nature of fatigue delamination can be
carried out. In this way, a stochastic model for fatigue delamination of composite laminates could be obtained. Consequently, the occurrence of fibre bridging, critical static delaminations and crack growth arrests could be modelled and quantitatively predicted.
• Both beam theory and orthotropic rescaling approaches are two-dimensional and
do not allow to investigate the distribution of the energy release rate across the specimen width and the effect of the specimen edges. The VCCT analysis carried out in the present study was also two-dimensional and, therefore, these effects were not taken into account. A 3-D VCCT analysis of the MMELS test can be carried out to consider the edge effect and to observe the distribution of G across the specimen width for different crack lengths and mixed-mode ratios. These distributions of G could then be compared to the curved shapes of the crack tip observed during the fractographic analysis.
Chapter 9 References
Abrate, S., 1991. Impact on laminated composite materials. Applied Mechanic Reviews 4 (4), pp. 155-190. Abrate, S., 1994. Impact on laminated composites: recent advances. Applied Mechanic Reviews 47 (11), pp. 517-544. Andersons, J., Hojo, M., Ochiai, S., 2001. Model of delamination propagation in brittle-matrix composites under cyclic loading. Journal of Reinforced Plastics and Composites 20 (5), pp. 431-450. Andersons, J., Hojo, M., Ochiai, S., 2004. Empirical model for stress ratio effect on fatigue delamination growth rate in composite laminates. International Journal of Fatigue 26 (6), pp. 597-604. Arcan, M., Hashin, Z., Voloshin, A., 1978. Method to produce uniform plane-stress states with applications to fiber-reinforced materials. Experimental Mechanics 18 (4), pp. 141-146. Armanios, E.A., Sriram, P., Badir, A.M., 1991. Fracture analysis of transverse crack-tip and free-edge delamination in laminated composites. Composite Materials: Fatigue and Fracture, ASTM STP 1110. (ed.) O'Brien, T.K. American Society for Testing and Materials, Philadelphia (USA), pp. 340-358. Asp, L.E., Sjögren, A., Greenhalgh, E.S., 2001. Delamination growth and thresholds in a carbon/epoxy composite under fatigue loading. Journal of Composites Technology and Research 23 (2), pp. 55-68. ASTM D 5528-01, 2003. Standard test method for mode I interlaminar fracture toughness of unidirectional fibre-reinforced polymer matrix composites. Annual Book of ASTM Standards, 15.03. Philadelphia (USA).
280 References
ASTM D 5528-94, 1997. Standard test method for mode I interlaminar fracture toughness of unidirectional fibre-reinforced polymer matrix composites. Annual Book of ASTM Standards, 15.03. Philadelphia (USA). ASTM D 6671-01, 2003. Standard test method ofr mixed mode I-mode II interlaminar fracture toughness of unidirectional fibre reinforced polymer matrix composites. Annual Book of ASTM Standards, 15.03. Philadelphia (USA). Atodaria, D.R., Putatunda, S.K., Mallick, P.K., 1999. Delamination growth behavior of a fabric reinforced laminated composite under mode I fatigue. Journal of Engineering Materials and Technology-Transactions of the Asme 121 (3), pp. 381-385. Bao, G., Ho, S., Suo, Z., Fan, B., 1992. The role of material orthotropy in fracture specimens for composites. International Journal of Solids and Structures 29 (9), pp. 1105-1116. Barbero, E.J., 1999. Introduction to composite materials design. Taylor and Francis, Philadelphia (USA). Barenblatt, G.I., 1962. Mathematical theory of equilibrium cracks in brittle fracture. Advances in Applied Mechanics 7, pp. 55-129. Bathias, C., Laksimi, A., 1985. Delamination threshold and loading effect in fibre glass epoxy composite. Delamination and Debonding of Materials, ASTM STP 876. (ed.) Johnson, W.S. American Society for Testing and Materials, Philadelphia (USA), pp. 217-237. Benzeggagh, M.L., Kenane, M., 1996. Measurement of mixed-mode delamination fracture toughness of unidirectional glass/epoxy composites with mixed-mode bending apparatus. Composites Science and Technology 56 (4), pp. 439-449. Berthelot, J.M., Le Corre, J.F., 2000. A model for transverse cracking and delamination in cross-ply laminates. Composites Science and Technology 60 (7), pp. 1055-1066. Bolotin, V.V., 1996. Delaminations in composite structures: Its origin, buckling, growth and stability. Composites Part B-Engineering 27 (2), pp. 129-145. Bolotin, V.V., 2001. Mechanics of delaminations in laminate composite structures. Mechanics of Composite Materials 37 (5-6), pp. 367-380.
Variable mixed-mode delamination in composite laminates under fatigue conditions: testing & analysis 281
Borg, R., Nilsson, L., Simonsson, K., 2001. Simulation of delamination in fiber composites with a discrete cohesive failure model. Composites Science and Technology 61 (5), pp. 667-677. Bradley, W.L., Cohen, R.N., 1985. Matrix deformation and fracture in graphite-reinforced epoxies. Delamination and Debonding of Materials, ASTM STP 876. (ed.) Johnson, W.S. American Society for Testing and Materials, Philadelphia (USA), pp. 389-410. Brandt, F., 1998. New load introduction concept for improved and simplified delamination beam testing. Experimental Techniques 22 (1), pp. 17-20. Broek, D., 1986. Elementary engineering fracture mechanics. Noordhoff International Publishing, Alphen aan den Rijn (The Nederlands). Bucinell, R.B., 1998. Development of a stochastic free edge delamination model for laminated composite materials subjected to constant amplitude fatigue loading. Journal of Composite Materials 32 (12), pp. 1138-1156. Bucinell, R.B., 1999. Application of a stochastic model for fatigue-induced delamination growth in graphite/epoxy laminates. Composite Materials: Fatigue and Fracture VII, ASTM STP 1330. (ed.) Bucinell, R.B. American Society for Testing and Materials, Philadelphia (USA), pp. 34-54. Caiazzo, A.A., Costanzo, F., 2001. Modeling the constitutive behavior of layered composites with evolving cracks. International Journal of Solids and Structures 38 (20), pp. 3469-3485. Camanho, P.P., Dávila, C.G., 2002. Mixed-mode decohesion finite elements for the simulation of delamination in composite materials. NASA-Technical Paper 211737, National Aeronautics and Space Agency, USA. Camanho, P.P., Davila, C.G., Ambur, D.R., 2001. Numerical simulation of delamination growth in composite materials. NASA-Technical Paper 211041, National Aeronautics and Space Agency, USA. Carlsson, L.A., Byron Pipes, R., 1997. Experimental characterisation of advanced composite materials. Technomic, Lancaster (USA). Carlsson, L.A., Gillespie, J.W., Pipes, R.B., 1986. On the analysis and design of the end notched flexure (ENF) specimen for mode-II testing. Journal of Composite Materials 20 (6), pp. 594-604.
282 References
Chan, W.S., 1992. Composite issues in rotor hub structure design. Composites Engineering 2 (5-7), pp. 321-328. Charalambides, M., Kinloch, A.J., Wang, Y., Williams, J.G., 1992. On the analysis of mixed-mode failure. International Journal of Fracture 54 (3), pp. 269-291. Compston, P., Jar, P.Y.B., 1999. The influence of fibre volume fraction on the mode I interlaminar fracture toughness of a glass-fibre/vinyl ester composite. Applied Composite Materials 6 (6), pp. 353-368. Corleto, C.R., Bradley, W.L., 1989. Mode II delamination fracture toughness of unidirectional graphite/epoxy composites. Composite Materials: Fatigue and Fracture II, ASTM STP 1012. (ed.) Lagace, P.A. American Society for Testing and Materials, Philadelphia (USA), pp. 201-221. Crasto, A.S., Kim, R.Y., 1997. Hygrothermal influence on the free-edge delamination of composites under compressive loading. Composite Materials: Fatigue and Fracture 6, ASTM STP 1285. (ed.) Armanios, E.A. American Society for Testing and Materials, Philadelphia (USA), pp. 381-393. Crossman, F.W., Wang, A.S.D., 1982. The dependence of transverse cracking and delamination on ply thickness in graphite epoxy laminates. Damage in Composite Materials, ASTM STP 775. (ed.) Reifsnider, K.L. American Society for Testing and Materials, Philadelphia (USA), pp. 118-139. Dahlen, C., Springer, G.S., 1994. Delamination growth in composites under cyclic loads. Journal of Composite Materials 28 (8), pp. 732-781. Davidson, B.D., Schapery, R.A., 1988. Effect of finite width on deflection and energy-release rate of an orthotropic double cantilever specimen. Journal of Composite Materials 22 (7), pp. 640-656. Davies, P., 1992. Protocols for interlaminar fracture testing of composites. Polymer and Composites Task Group. European Structural Integrity Society, Plouzané (France). Davies, P., 1996. Round robin analysis of G(Ic) interlaminar fracture test. Applied Composite Materials 3 (3), pp. 135-140.
Variable mixed-mode delamination in composite laminates under fatigue conditions: testing & analysis 283
Davies, P., Blackman, B.R.K., Brunner, A.J., 1998. Standard test methods for delamination resistance of composite materials: Current status. Applied Composite Materials 5 (6), pp. 345-364. Davies, P., Kausch, H.H., Williams, J.G., et al., 1992. Round-robin interlaminar fracture testing of carbon-fiber-reinforced epoxy and peek composites. Composites Science and Technology 43 (2), pp. 129-136. Davila, C.G., Camanho, P.P., de Moura, M.F., 2001. Mixed-mode decohesion elements for analyses of progressive delamination. Proceedings of the 42nd AIAA Structures, Structural Dynamics and Materials Conference, Seattle (USA). Devitt, D.F., Schapery, R.A., Bradley, W.L., 1980. A method for determining the mode I delamination fracture-toughness of elastic and viscoelastic composite-materials. Journal of Composite Materials 14 (OCT), pp. 270-285. Dharani, L.R., Tang, H., 1990. Micromechanics characterization of sublaminate damage. International Journal of Fracture 46 (2), pp. 123-140. Donaldson, S.L., 1985. Fracture-toughness testing of graphite epoxy and graphite peek composites. Composites 16 (2), pp. 103-111. Donaldson, S.L., 1988. Mode-III interlaminar fracture characterization of composite-materials. Composites Science and Technology 32 (3), pp. 225-249. Donaldson, S.L., Mall, S., 1989. Delamination growth in graphite epoxy composites subjected to cyclic mode-III loading. Journal of Reinforced Plastics and Composites 8 (1), pp. 91-103. El-Sayed, S., Sridharan, S., 2001. Predicting and tracking interlaminar crack growth in composites using a cohesive layer model. Composites Part B-Engineering 32 (6), pp. 545-553. El-Sayed, S., Sridharan, S., 2002a. Cohesive layer models for predicting delamination growth and crack kinking in sandwich structures. International Journal of Fracture 117 (1), pp. 63-84. El-Sayed, S., Sridharan, S., 2002b. Performance of a cohesive layer model in the prediction of interfacial crack growth in sandwich beams. Journal of Sandwich Structures & Materials 4 (1), pp. 31-48.
284 References
England, A.H., 1965. A crack between dissimilar media. Journal of Applied Mechanics 32 (2), pp. 400-402. Erdogan, F., 1965. Stress distribution in bonded dissimilar materials with cracks. Journal of Applied Mechanics 32 (2), pp. 403-410. Ewalds, H.L., Wanhill, R.J.H., 1984. Fracture mechanics. Edward Arnold Publishers Ltd., London (UK). Farshad, M., Flueler, P., 1998. Investigation of mode III fracture toughness using an anti-clastic plate bending method. Engineering Fracture Mechanics 60 (5-6), pp. 597-603. Fernlund, G., Lanting, H., Spelt, J.K., 1995. Mixed-mode-II mixed-mode-III fracture of adhesive joints. Journal of Composites Technology & Research 17 (4), pp. 317-330. Foye, R.L., Baker, D.J., 1970. Design of orthotropic laminates. Proceedings of the 11th AIAA Structures, Structural Dynamics and Materials Conference, Denver (USA). Gamstedt, E.K., Sjogren, B.A., 2002. An experimental investigation of the sequence effect in block amplitude loading of cross-ply composite laminates. International Journal of Fatigue 24 (2-4), pp. 437-446. Glaessgen, E.H., Raju, I.S., Poe, C.C., 2002. Analytical and experimental studies of the debonding of stitched and unstitched composite joints. Journal of Composite Materials 36 (23), pp. 2599-2622. Greenhalgh, E.S., 1998. Characterisation of mixed-mode delamination growth in carbon-fibre composites. PhD Thesis. Imperial College of Science, Technology and Medicine, London (UK). Greenhalgh, E., Asp, L., Singh, S., 1999. Delamination resistance, failure criteria and fracture morphology of 0º/0º, 0º/5º and 0º/90º ply interfaces in CFRP. 5th International Conference on Deformation and Fracture of Composites, London (UK). Greenhalgh, E., Singh, S., 1999. Investigation of the failure mechanisms for delamination growth from embedded defects. Proceedings of the 12th International Conference on Composite Materials, Paris (France). Gürdal, Z., Haftka, R.T., Hajela, P., 1999. Design and optimization of laminated composite materials. John Wiley & Sons, New York (USA).
Variable mixed-mode delamination in composite laminates under fatigue conditions: testing & analysis 285
Gustafson, C.G., Jilken, L., Gradin, A., 1985. Fatigue thresholds of delamination crack growth in orthotropic graphite/epoxy laminates. Delamination and Debonding of Materials, ASTM STP 876. (ed.) Johnson, W.S. American Society for Testing and Materials, Philadelphia (USA), pp. 200-216. Gustafson, C.G., Selden, R.B., 1985. Monitoring fatigue damage in CFRP using accoustic emission and radiographic techniques. Delamination and Debonding of Materials, ASTM STP 876. (ed.) Johnson, W.S. American Society for Testing and Materials, Philadelphia (USA), pp. 448-464. Gustafson, C.G., Hojo, M., 1987. Delamination fatigue crack-growth in unidirectional graphite epoxy laminates. Journal of Reinforced Plastics and Composites 6 (1), pp. 36-52. Hahn, H.T., 1983. A mixed-mode fracture criterion for composite materials. Composites Technology Review 5 , pp. 26-29. Hahn, H.T., Johannesson, T., 1983. A correlation between fracture energy and fracture morphology in mixed-mode fracture of composites. 4th International Conference on the Mechanical Behaviour of Materials, Stockholm (Sweden), pp. 431-438. Hashemi, S., Kinloch, A.J., Williams, J.G., 1987. Interlaminar fracture of composite materials. 6th International Conference on Composite Materials - 2nd European Conference on Composite Materials, London (UK), pp. 3.254-3.264. Hashemi, S., Kinloch, A.J., Williams, J.G., 1991. Mixed-mode fracture in fibre-polymer composite laminates. Composite Materials: Fatigue and Fracture, ASTM STP 1110. (ed.) O’Brien, T.K. American Society for Testing and Materials, Philadelphia (USA), pp. 143-168. Hashemi, S., Kinloch, A.J., Williams, J.G., 1990a. The analysis of interlaminar fracture in uniaxial fiber-polymer composites. Proceedings of the Royal Society of London Series A-Mathematical Physical and Engineering Sciences 427 (1872), pp. 173-199. Hashemi, S., Kinloch, A.J., Williams, J.G., 1990b. Mechanics and mechanisms of delamination in a poly(ether sulfone) fiber composite. Composites Science and Technology 37 (4), pp. 429-462.
286 References
Hayashi, T., 1967. Analytical study of interlaminar shear stresses in a laminate composite plate. Transactions of the Japan Society of Aeronautical and Space Sciences 10, pp. 43-48. Herakovich, C.T., Renieri, G.D., Brinson, H.F., 1976. Finite element analysis of mechanical and thermal edge effects in composite laminates. Army Symposium on Solid Mechanics, Composite Materials: The Influence of Mechanics of Failure on Design, Cape Cod (USA), pp. 237-248. Hojo, M., Matsuda, S., Ochiai, S., 1997. Delamination fatigue crack growth in CFRP laminates under mode I and II loadings -effect of mesoscopic structure on fracture mechanism-. Proceedings of the International Conference on Fatigue of Composites, Paris (France), pp. 15-26. Hojo, M., Matsuda, S., Fiedler, B., et al., 2002. Mode I and II delamination fatigue crack growth behavior of alumina fiber/epoxy laminates in liquid nitrogen. International Journal of Fatigue 24 (2-4), pp. 109-118. Hojo, M., Tanaka, K., Gustafson, C.G., Hayashi, R., 1987. Effect of stress ratio on near-threshold propagation of delamination fatigue cracks in unidirectional CFRP. Composites Science and Technology 29 (4), pp. 273-292. Hutchinson, J.W., Suo, Z., 1992. Mixed mode cracking in layered materials. Advances in Applied Mechanics, 29. (ed.) Hutchinson, J.W., Wu, T.Y. Academic Press Inc., Boston (USA), pp. 63-191. Hwang, W., Han, K.S., 1989. Interlaminar fracture-behavior and fiber bridging of glass-epoxy composite under mode I static and cyclic loadings. Journal of Composite Materials 23 (4), pp. 396-430. Ireman, T., Thesken, J.C., Greenhalgh, E., et al., 1996. Damage propagation in composite structural elements - Coupon experiments and analyses. Composite Structures 36 (3-4), pp. 209-220. Irwin, G.R., 1958. Fracture I. Handbuch der Physik, VI. (ed.) Flüge, S. Springer-Verlag, New York (USA), pp. 558-590. Jensen, H.M., Sheinman, I., 2001. Straight-sided, buckling-driven delamination of thin films at high stress levels. International Journal of Fracture 110 (4), pp. 371-385.
Variable mixed-mode delamination in composite laminates under fatigue conditions: testing & analysis 287
Kardomateas, G.A., Malik, B., 1997. Fatigue delamination growth under cyclic compression in glass/epoxy composite beam/plates. Polymer Composites 18 (2), pp. 169-178. Kardomateas, G.A., Pelegri, A.A., Malik, B., 1994. Growth of internal delaminations under cyclic compression in composite plates. Failure Mechanics in Advanced Polymeric Composites, 196. (ed.) Kardomateas, G.A., Rajapakse, Y.D.S. Applied Mechanics Division-ASME, New York (USA), pp. 13-29. Kardomateas, G.A., Pelegri, A.A., Malik, B., 1995. Growth of internal delaminations under cyclic compression in composite plates. Journal of the Mechanics and Physics of Solids 43 (6), pp. 847-868. Kashtalyan, M., Soutis, C., 1999. A study of matrix crack tip delaminations and their influence on composite laminate stiffness. Advanced Composites Letters 8 (4), pp. 149-155. Kashtalyan, M., Soutis, C., 2000. Stiffness degradation in cross-ply laminates damaged by transverse cracking and splitting. Composites Part A-Applied Science and Manufacturing 31 (4), pp. 335-351. Kashtalyan, M., Soutis, C., 2002. Analysis of local delaminations in composite laminates with angle-ply matrix cracks. International Journal of Solids and Structures 39 (6), pp. 1515-1537. Keary, P.E., Ilcewicz, L.B., Shaar, C., Trostle, J., 1985. Mode-I interlaminar fracture-toughness of composites using slender double cantilevered beam specimens. Journal of Composite Materials 19 (2), pp. 154-177. Kedward, K.T., 1995. Mechanical Design Handbook. (ed.) Rothbart, H.A., Harold, A. McGraw-Hill, New York (USA), pp. 15.01-15.29. Kenane, M., Benzeggagh, M.L., 1997. Mixed-mode delamination fracture toughness of unidirectional glass/epoxy composites under fatigue loading. Composites Science and Technology 57 (5), pp. 597-605. Kim, I.G., Kong, C.D., Uda, N., 2002. Generalized theoretical analysis method for free-edge delaminations in composite laminates. Journal of Materials Science 37 (9), pp. 1875-1880. Kim, K.S., Hong, C.S., 1986. Delamination growth in angle-ply laminated composites. Journal of Composite Materials 20 (5), pp. 423-438.
288 References
Kinloch, A.J., Wang, Y., Williams, J.G., Yayla, P., 1993. The mixed-mode delamination of fiber composite-materials. Composites Science and Technology 47 (3), pp. 225-237. Krueger, R., 2002. The virtual crack closure technique: history, approach and applications. NASA/CR-2002-211628, National Aeronautics and Space Agency, USA. Kusaka, T., Hojo, M., Mai, Y.W., et al., 1998. Rate dependence of mode I fracture behaviour in carbon-fibre/epoxy composite laminates. Composites Science and Technology 58 (3-4), pp. 591-602. Lee, S.M., 1986. A comparison of fracture-toughness of matrix controlled failure modes - Delamination and transverse cracking. Journal of Composite Materials 20 (2), pp. 185-196. Lekhnitskii, S.G., 1981. Theory of elasticity of an anisotropic body. Mir Publishers, Moscow (Russia). Li, S., Thouless, M.D., Waas, A.M., Schroeder, J.A., Zavattieri, P.D. Use of mode-I cohesive-zone models to describe the fracture of an adhesively-bonded polymer-matrix composite. Composites Science and Technology (In Press). Liao, W.C., Sun, C.T., 1996. The determination of mode III fracture toughness in thick composite laminates. Composites Science and Technology 56 (4), pp. 489-499. Mahadevan, S., Dey, A., Tryon, R., Wang, Y., Rousseau, C., 2001. Reliability analysis of rotorcraft composite structures. Journal of Aerospace Engineering 14 (4), pp. 140-146. Mahadevan, S., Liu, X., 2002. Probabilistic analysis of composite structure ultimate strength. AIAA Journal 40 (7), pp. 1408-1414. Mall, S., Yun, K.T., Kochhar, N.K., 1989. Characterisation of matrix toughness on cyclic delamination growth in graphite fibre composites. Composite Materials: Fatigue and Fracture II, ASTM STP 1012. (ed.) Lagace, P.A. American Society for Testing and Materials, Philadelphia (USA), pp. 296-310. Martin, R.H., 1991. Evaluation of the split cantilever beam for mode III melamination testing, Composite Materials: Fatigue and Fracture III, ASTM STP 1010. (ed.) O'Brien, T.K. American Society for Testing and Materials, Philadelphia (USA), pp. 243-266.
Variable mixed-mode delamination in composite laminates under fatigue conditions: testing & analysis 289
Martin, R.H., Murri, G.B., 1990. Characterization of mode I and mode II delamination growth and thresholds in AS4/PEEK composites. Composite Materials: Testing and Design, ASTM STP 1059. (ed.) O'Brien, T.K. American Society for Testing and Materials, Philadelphia (USA), pp. 251-270. Matsuda, S., Hojo, M., Ochiai, S., 1997. Mesoscopic fracture mechanism of mode II delamination fatigue crack propagation in interlayer-toughened CFRP. Jsme International Journal Series A-Solid Mechanics and Material Engineering 40 (4), pp. 423-429. Meziere, Y., Michel, L., Carronnier, D., 2000. Mixed-mode delamination failure criteria in carbon-fibre composites under quasi-static and cyclic loading. Fracture of Polymers, Composites and Adhesives. (ed.) Williams, J.G., Pavan, A. Elsevier, Amsterdam (The Netherlands), pp. 97-110. Muc, A., 2002. A fuzzy set approach to interlaminar cracks simulation problems. International Journal of Fatigue 24 (2-4), pp. 419-427. Muc, A., Gurba, W., 2001. Genetic algorithms and finite element analysis in optimization of composite structures. Composite Structures 54 (2-3), pp. 275-281. Muc, A., Kedziora, P., 2001. A fuzzy set analysis for a fracture and fatigue damage response of composite materials. Composite Structures 54 (2-3), pp. 283-287. Murri, G.B., Martin, R.H., 1993. Effect of initial delamination on mode I and mode II interlaminar fracture toughness and fatigue fracture threshold. Composite Materials: Fatigue and Fracture, ASTM STP 1156. (ed.) Stinchcomb, W.W., Ashbaugh, N.E. American Society for Testing and Materials, Philadelphia (USA), pp. 239-256. Nairn, J.A., Hu, S., 1992. The initiation and growth of delaminations induced by matrix microcracks in laminated composites. International Journal of Fracture 57 (1), pp. 1-24. Newaz, G.M., Mall, S., 1989. Relaxation-controlled cyclic delamination growth in advanced thermoset and thermoplastic composites at elevated-temperature. Journal of Composite Materials 23 (2), pp. 133-145. Nicholls, D.J., Gallagher, P.J., 1983. Determination of GIc in angle ply composites using a cantilever beam test method. Journal of Reinforced Plastics and Composites 2, pp. 2-17.
290 References
Nilsson, K.F., Asp, L.E., Sjogren, A., 2001. On transition of delamination growth behaviour for compression loaded composite panels. International Journal of Solids and Structures 38 (46-47), pp. 8407-8440. Obreimoff, I.W., 1930. The splitting strength of mica. Proceedings of the Royal Society of London A 127, pp. 290-297. O'Brien, T.K., 1982. Characterization of delamination onset and growth in a composite laminate. Damage in Composite Materials, ASTM STP 775. (ed.) Reifsnider, K.L. American Society for Testing and Materials, Philadelphia (USA), pp. 141-167. O'Brien, T.K., 1984. Mixed-mode strain-energy-release rate effects on edge delamination of composites. Effects of Defects in Composite Materials, ASTM STP 836. (ed.) Wilkins, D.J. American Society for Testing and Materials, Philadelphia (USA), pp. 125-142. O'Brien, T.K., 1985. Analysis of local delamination and their influence on composite laminate behaviour. Delamination and Debonding of Materials, ASTM STP 876. (ed.) Johnson, W.S. American Society for Testing and Materials, Philadelphia (USA), pp. 282-297. Obrien, T.K., 1988. Fatigue delamination behavior of peek thermoplastic composite laminates. Journal of Reinforced Plastics and Composites 7 (4), pp. 341-359. O'Brien, T.K., 1991. Local delamination in laminates with angle ply matrix cracks: Part II Delamination fracture analysis and fatigue characterization. NASA Technical Report 91-B-011, National Aeronautics and Space Agency, USA. O'Brien, T.K., Murri, G.B., Salpekar, S.A., 1989. Interlaminar shear fracture toughness and fatigue thresholds for composite materials. Composite Materials: Fatigue and Fracture II, ASTM STP 1012. (ed.) Lagace, P.A. American Society for Testing and Materials, Philadelphia (USA), pp. 222-250. Ogihara, S., Takeda, N., 1995. Interaction between transverse cracks and delamination during damage progress in CFRP cross-ply laminates. Composites Science and Technology 54 (4), pp. 395-404. Olsson, R., Thesken, J.C., Brandt, F., Jonsson, N., Nilsson, S., 1996. Investigations of delamination criticality and the transferability of growth criteria. Composite Structures 36 (3-4), pp. 221-247.
Variable mixed-mode delamination in composite laminates under fatigue conditions: testing & analysis 291
Pagano, N.J., Schoeppner, G.A., 2000. Delamination of polymer matrix composites: problems and assessment. Comprensive Composite Materials, 2. (ed.) Kelly, A., Zweben, C. Elsevier Science Ltd., Oxford (UK). Paris, P.C., Erdogan, F., 1963. Critical analysis of propagation laws. Journal of Basic Engineering 85, pp. 528-534. Paris, P.C., Gomez, M.P., Anderson, W.E., 1961. Rational analytical theory of fatigue. Trend in Engineering 13 (1), pp. 9-14. Pavier, M.J., Clarke, M.P., 1996. Finite element prediction of the post-impact compressive strength of fibre composites. Composite Structures 36 (1-2), pp. 141-153. Pipes, R.B., Pagano, N.J., 1970. Interlaminar stresses in composite laminates under uniform axial extension. Journal of Composite Materials 4 , pp. 538-548. Prel, Y.J., Davies, P., Benzeggagh, M.L., Charentenay, F.X., 1989. Mode I and mode II delamination of thermosetting and thermoplastic composites. Composite Materials: Fatigue and Fracture II, ASTM STP 1012. (ed.) Lagace, P.A. American Society for Testing and Materials, Philadelphia (USA), pp. 251-261. Puppo, A.H., Evensen, H.A., 1970. Interlaminar shear in laminated composites under generalized plane stress. Journal of Composite Materials 4, pp. 204-220. Purslow, D., 1986. Matrix fractography of fiber-reinforced epoxy composites. Composites 17 (4), pp. 289-303. Raju, I.S., 1987. Calculation of strain-energy release rates with higher-order and singular finite-elements. Engineering Fracture Mechanics 28 (3), pp. 251-274. Ramkumar, R.L., Whitcomb, J.D., 1985. Characterization of mode I and mixed-mode delamination growth in T300/5208 graphite/epoxy. Delamination and Debonding of Materials, ASTM STP 876. (ed.) Johnson, W.S. American Society for Testing and Materials, Philadelphia (USA), pp. 315-335. Rand, O., 2001. A multilevel analysis of solid laminated composite beams. International Journal of Solids and Structures 38 (22-23), pp. 4017-4043. Reeder, J.R., 1992. An evaluation of mixed-mode delamination failure criteria. NASA-Technical Paper 104210, National Aeronautics and Space Agency, USA.
292 References
Reeder, J.R., 2003. Refinements to the mixed-mode bending test for delamination toughness. Journal of Composites Technology & Research 25 (4), pp. 191-195. Reeder, J.R., Crews, J.H., 1990. Mixed-mode bending method for delamination testing. AIAA Journal 28 (7), pp. 1270-1276. Reeder, J.R., Crews, J.H., 1992. Redesign of the mixed-mode bending delamination test to reduce nonlinear effects. Journal of Composites Technology & Research 14 (1), pp. 12-19. Reifsnider, K.L., Case, S.W., 2002. Damage tolerance and durability of material systems. John Wiley & Sons, New York (USA). Rice, J.R., 1988. Elastic fracture-mechanics concepts for interfacial cracks. Journal of Applied Mechanics-Transactions of the Asme 55 (1), pp. 98-103. Richard, H.A., 1983. A loading device for the creation of mixed-mode in fracture-mechanics. International Journal of Fracture 22 (2), pp. R55-R58. Rikards, R., 2000. Interlaminar fracture behaviour of laminated composites. Computers & Structures 76 (1-3), pp. 11-18. Rikards, R., Buchholz, F.G., Wang, H., et al., 1998. Investigation of mixed mode I/II interlaminar fracture toughness of laminated composites by using a CTS type specimen. Engineering Fracture Mechanics 61 (3-4), pp. 325-342. Ripling, E.J., Santner, J.S., Crosley, P.B., 1983. Fracture-toughness of composite adherend adhesive joints under mixed mode-I and mode-III loading. Journal of Materials Science 18 (8), pp. 2274-2282. Robinson, P., Hodgkinson, J.M., 2000. Interlaminar fracture toughness. Mechanical Testing of Advanced Fibre Composites. (ed.) Hodgkinson, J.M. Woodhead Publishing, Cambridge (UK), pp. 170-210. Russell, A.J., Street, K.N., 1985. Moisture and temperature effects on the mixed-mode delamination fracture of unidirectional graphite/epoxy. Delamination and Debonding of Materials, ASTM STP 876. (ed.) Johnson, W.S. American Society for Testing and Materials, Philadelphia (USA), pp. 349-370. Russell, A.J., Street, K.N., 1987. The effect of matrix toughness on delamination: static and fatigue fracture under mode II shear loading of graphite fibre composites.
Variable mixed-mode delamination in composite laminates under fatigue conditions: testing & analysis 293
Toughened Composites, ASTM STP 937. (ed.) Johnston, N.J. American Society for Testing and Materials, Philadelphia (USA), pp. 275-294. Russell, A.J., Street, K.N., 1988. A constant DG test for measuring mode I interlaminar fatigue crack growth rates. Composite Materials: Testing and Design VIII, ASTM STP 972. (ed.) Whitcomb, J.D. American Society for Testing and Materials, Philadelphia (USA), pp. 259-277. Russell, A.J., Street, K.N., 1989. Predicting interlaminar fatigue crack growth rates in compressively loaded laminates. Composite Materials: Fatigue and Fracture II, ASTM STP 1012. (ed.) Lagace, P.A. American Society for Testing and Materials, Philadelphia (USA), pp. 162-178. Rybicki, E.F., 1971. Approximate 3-dimensional solutions for symmetric laminates under inplane loading. Journal of Composite Materials 5 (JUL), pp. 354-360. Rybicki, E.F., Hernandez, T.D., Deibler, J.E., Knight, R.C., Vinson, S.S., 1987. Mode-I and mixed-mode energy-release rate values for delamination of graphite epoxy test specimens. Journal of Composite Materials 21 (2), pp. 105-123. Rybicki, E.F., Kanninen, M.F., 1977. Finite-element calculation of stress intensity factors by a modified crack closure integral. Engineering Fracture Mechanics 9 (4), pp. 931-938. Salpekar, S.A., O'Brien, T.K., 1993. Analysis of matrix cracking and local delamination in (0/theta/-theta)s graphite-epoxy laminates under tensile load. Journal of Composites Technology & Research 15 (2), pp. 95-100. Salpekar, S.A., OBrien, T.K., Shivakumar, K.N., 1996. Analysis of local delaminations caused by angle ply matrix cracks. Journal of Composite Materials 30 (4), pp. 418-440. Salpekar, S.A., Raju, I.S., Obrien, T.K., 1988. Strain-energy release rate analysis of the end-notched flexure specimen using the finite-element method. Journal of Composites Technology & Research 10 (4), pp. 133-139. Schoeppner, G.A., Pagano, N.J., 1998. Stress fields and energy release rates in cross-ply laminates. International Journal of Solids and Structures 35 (11), pp. 1025-1055. Schon, J., 2000. A model of fatigue delamination in composites. Composites Science and Technology 60 (4), pp. 553-558. Schon, J., 2001. Model for predicting the load ratio for the shortest fatigue life. Composites Science and Technology 61 (8), pp. 1143-1149.
294 References
Schon, J., Nyman, T., Blom, A., Ansell, H., 2000. A numerical and experimental investigation of delamination behaviour in the DCB specimen. Composites Science and Technology 60 (2), pp. 173-184. Selvarathinam, A.S., Weitsman, Y.J., 1999. A shear-lag analysis of transverse cracking and delamination in cross-ply carbon-fibre/epoxy composites under dry, saturated and immersed fatigue conditions. Composites Science and Technology 59 (14), pp. 2115-2123. Sih, G.C., Paris, P.C., Irwin, G.R., 1965. On cracks in rectilinearly anisotropic bodies. International Journal of Fracture Mechanics 1 (3), pp. 189-203. Singh, S., Greenhalgh, E., 1998. Micromechanics of interlaminar fracture in carbon fibre reinforced plastics at multidirectional ply interfaces under static and cyclic loading. Plastics Rubber and Composites Processing and Applications 27 (5), pp. 220-226. Sjogren, A., Asp, L.E., 2002. Effects of temperature on delamination growth in a carbon/epoxy composite under fatigue loading. International Journal of Fatigue 24 (2-4), pp. 179-184. Sorensen, B.F., Jacobsen, T.K., 2000. Crack growth in composites - Applicability of R-curves and bridging laws. Plastics Rubber and Composites 29 (3), pp. 119-133. Suo, Z., 1990. Delamination specimens for orthotropic materials. Journal of Applied Mechanics 57 , pp. 627-634. Suo, Z.G., 1990. Singularities, interfaces and cracks in dissimilar anisotropic media. Proceedings of the Royal Society of London Series A-Mathematical Physical and Engineering Sciences 427 (1873), pp. 331-358. Suo, Z., Bao, G., Fan, B., Wang, T.C., 1991. Orthotropy rescaling and implications for fracture in composites. International Journal of Solids and Structures 28 (2), pp. 235-248. Takeda, N., Ogihara, S., 1994. Initiation and growth of delamination from the tips of transverse cracks in CFRP cross-ply laminates. Composites Science and Technology 52 (3), pp. 309-318. Tanaka, H., Tanaka, K., 1995. Mixed-mode growth of interlaminar cracks in carbon/epoxy laminates under cyclic loading. Proceedings of the 10th International Conference on Composite Materials, Whistler B.C. (Canada), pp. 181-189.
Variable mixed-mode delamination in composite laminates under fatigue conditions: testing & analysis 295
Tanaka, K., Tanaka, H., 1997. Stress-ratio effect on mode II propagation of interlaminar fatigue cracks in graphite/epoxy composites. Composite Materials: Fatigue and Fracture 6, ASTM STP 1285. (ed.) Armanios, E.A. American Society for Testing and Materials, Philadelphia (USA), pp. 126-142. Tandon, G.P., Pagano, N.J., Bechel, V.T., 1999. Analysis of the end-notched flexure specimen for mode II testing using variational methods. Proceedings of the 14th Annual Technical Conference of the American Society for Composites, Dayton (USA). Tang, S., 1976. Interlaminar stresses of uniformly loaded rectangular composite plates. Journal of Composite Materials 10 (JAN), pp. 69-78. Tay, T.E., Shen, F., 2002. Analysis of delamination growth in laminated composites with consideration for residual thermal stress effects. Journal of Composite Materials 36 (11), pp. 1299-1320. Trethewey, B.R., Gillespie, J.W., Carlsson, L.A., 1988. Mode-II cyclic delamination growth. Journal of Composite Materials 22 (5), pp. 459-483. Wang, A.S.D., Crossman, F.W., 1977. Some new results on edge effect in symmetric composite laminates. Journal of Composite Materials 11 (JAN), pp. 92-106. Wang, A.S., Slomiana, M., Bucinell, R.B., 1985. Delamination crack growth in composite laminates. Delamination and Debonding of Materials, ASTM STP 876. (ed.) Johnson, W.S. American Society for Testing and Materials, Philadelphia (USA), pp. 135-167. Wang, S.S., 1983. Fracture-mechanics for delamination problems in composite-materials. Journal of Composite Materials 17 (3), pp. 210-223. Wang, S.S., Choi, I., 1982. Boundary-layer effects in composite laminates: I Free-edge stress singularities. Journal of Applied Mechanics-Transactions of the Asme 49 (3), pp. 541-548. Wang, S.S., Choi, I., 1983. The interface crack between dissimilar anisotropic composite-materials. Journal of Applied Mechanics-Transactions of the Asme 50 (1), pp. 169-178. Wang, S.S., Wang, H.T., 1979. Interlaminar crack growth in fiber reinforced composites during fatigue. Journal of Engineering Materials and Technology-Transactions of the Asme 101 (1), pp. 34-41.
296 References
Wang, Y., Williams, J.G., 1992. Corrections for mode-II fracture-toughness specimens of composites materials. Composites Science and Technology 43 (3), pp. 251-256. Whitcomb, J.D., 1986. Parametric analytical study of instability-related delamination growth. Composites Science and Technology 25 (1), pp. 19-48. Whitney, J.M., Browning, C.E., Hoogstenden, W., 1982. A double cantilever beam test for characterizing mode I delamination of composite materials. Journal of Reinforced Plastics and Composites 1, pp. 297-313. Whitney, J.M., Nuismer, R.J., 1974. Stress fracture criteria for laminated composites containing stress-concentrations. Journal of Composite Materials 8 (JUL), pp. 253-265. Wiederhorn, S.M., Shorband, A.M., Moses, R.L., 1968. Critical analysis of theory of double cantilever method of measuring fracture-surface energies. Journal of Applied Physics 39 (3), pp. 1569-1572. Wilkins, D.J., Eisenmann, J.R., Camin, R.A., Margolis, W.S., Benson, R.A., 1982. Characterising delamination growth in graphite/epoxy. Damage in Composite Materials, ASTM STP 775. (ed.) Reifsnider, K.L. American Society for Testing and Materials, Philadelphia (USA), pp. 168-183. Williams, J.G., 1988. On the calculation of energy-release rates for cracked laminates. International Journal of Fracture 36 (2), pp. 101-119. Williams, J.G., 1989. The fracture-mechanics of delamination tests. Journal of Strain Analysis for Engineering Design 24 (4), pp. 207-214. Wu, E.M., Reuter, R.C., 1965. Crack extension in fibreglass reinforced plastics and a critical examination of the general fracture criterion. TAM Report 275, Texas AM, USA. Yan, X.Q., Du, S.Y., Wang, D., 1991. An engineering method of determining the delamination fracture toughness of composite laminates. Engineering Fracture Mechanics 39 (4), pp. 623-627. Zhang, J., Soutis, C., Fan, J., 1994a. Effects of matrix cracking and hygrothermal stresses on the strain-energy release rate for edge delamination in composite laminates. Composites 25 (1), pp. 27-35.

Variable mixed-mode delamination in composite laminates under fatigue conditions: testing & analysis 297
Zhang, J., Soutis, C., Fan, J., 1994b. Strain-energy release rate associated with local delamination in cracked composite laminates. Composites 25 (9), pp. 851-862. Zhang, J.Q., Fan, J.H., Herrmann, K.P., 1999. Delaminations induced by constrained transverse cracking in symmetric composite laminates. International Journal of Solids and Structures 36 (6), pp. 813-846.