Embed Size (px)
Citation preview
Modeling delamination migration: quasi-static and fatigue loading
S. T. Pinho, P.
BaizImperial College
London
B.Y. ChenImperial College London
National University of
Singapore
T. E. TayNational University
Singapore
J.G.
RatcliffeNASA Langley
N. V. De [email protected]
National Institute of Aerospace
https://ntrs.nasa.gov/search.jsp?R=20160006583 2018-07-02T03:13:11+00:00Z
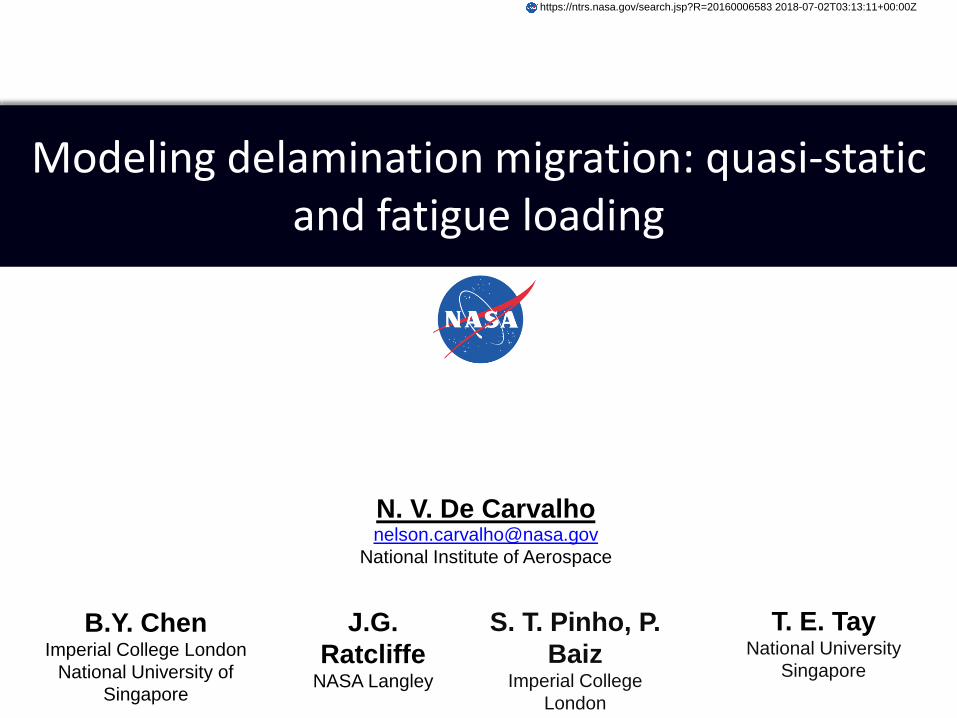
Motivation
2
Delamination
Matrix-crack
Impact
M. McElroy et al. A numerical and
experimental study of damage growth in
a composite laminate. in proceedings of
the ASC 29th Technical Conference,
San Diego, CA, USA, 2014.
Migration: The process by which a propagating delamination
relocates to a new ply interface via matrix cracking
Delamination
Matrix-crack
R. Krueger et al. Fatigue Life
Methodology for Bonded Composite
Skin/Stringer Configurations.
NASA/TM-2001-210842, 2001.
Skin-stringer pull off
Contents
3
Summary
2 Modeling approach
3 Validation
4
1 Experiments

Contents
4
Summary
2 Modeling approach
3 Validation
4
1 Experiments: delamination migration test
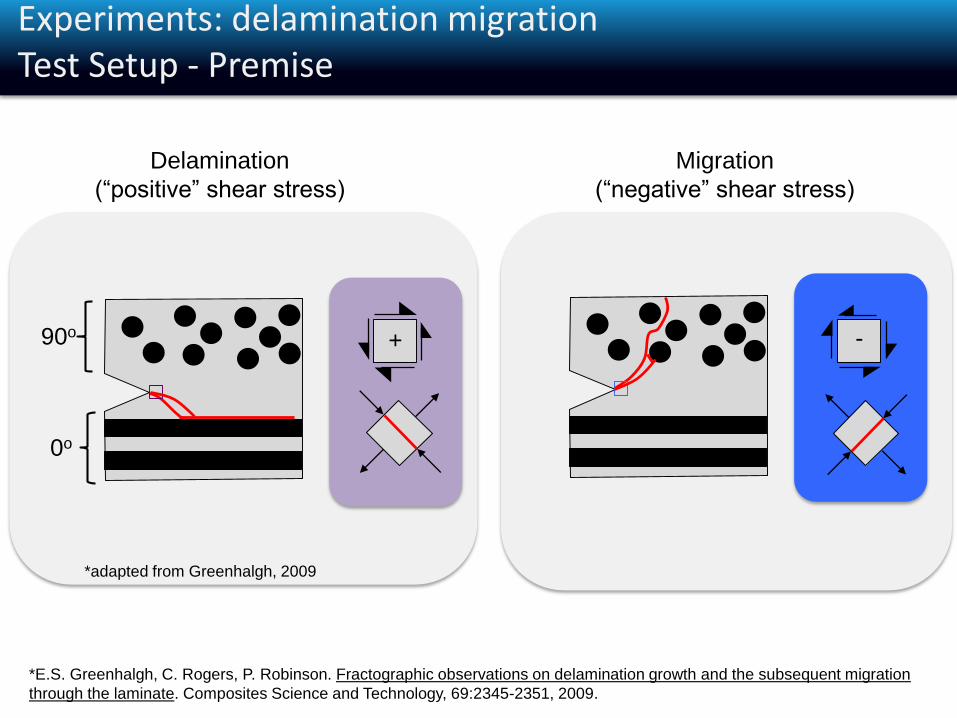
Experiments: delamination migrationTest Setup - Premise
Delamination
(“positive” shear stress)
+
Migration
(“negative” shear stress)
-90o
0o
*adapted from Greenhalgh, 2009
*E.S. Greenhalgh, C. Rogers, P. Robinson. Fractographic observations on delamination growth and the subsequent migration
through the laminate. Composites Science and Technology, 69:2345-2351, 2009.
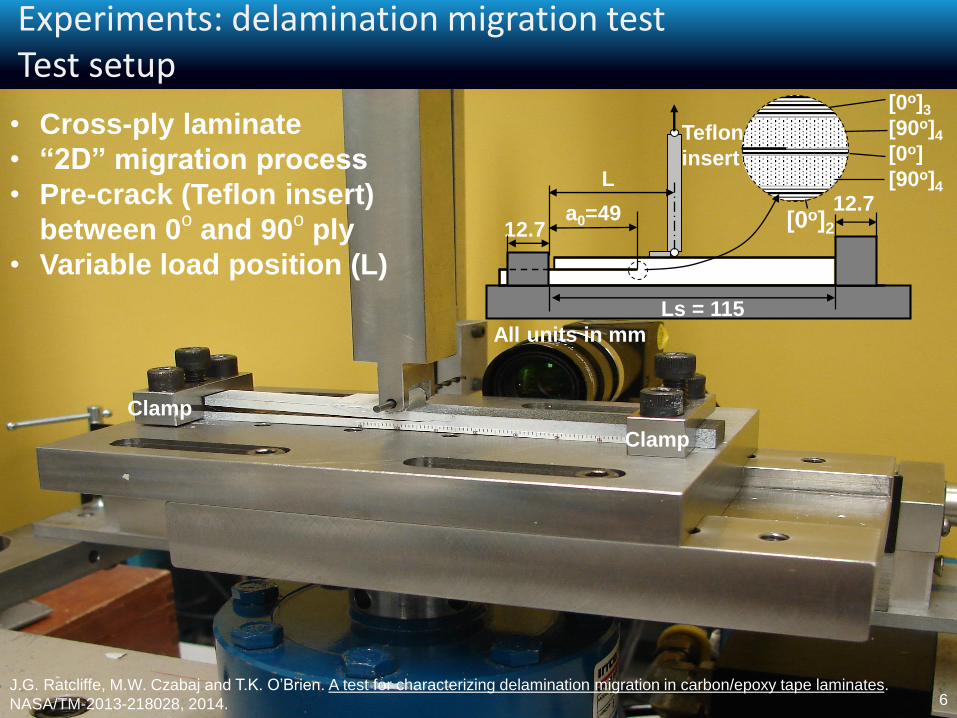
• Cross-ply laminate
• “2D” migration process
• Pre-crack (Teflon insert)
between 0o and 90o ply
• Variable load position (L)
All units in mm
12.7
Ls = 115
[0o]3
[90o]4
[0o]
[90o]4
Teflon
insert
a0=49
L12.7
Clamp
Clamp
[0o]2
6J.G. Ratcliffe, M.W. Czabaj and T.K. O’Brien. A test for characterizing delamination migration in carbon/epoxy tape laminates.
NASA/TM-2013-218028, 2014.
Experiments: delamination migration testTest setup
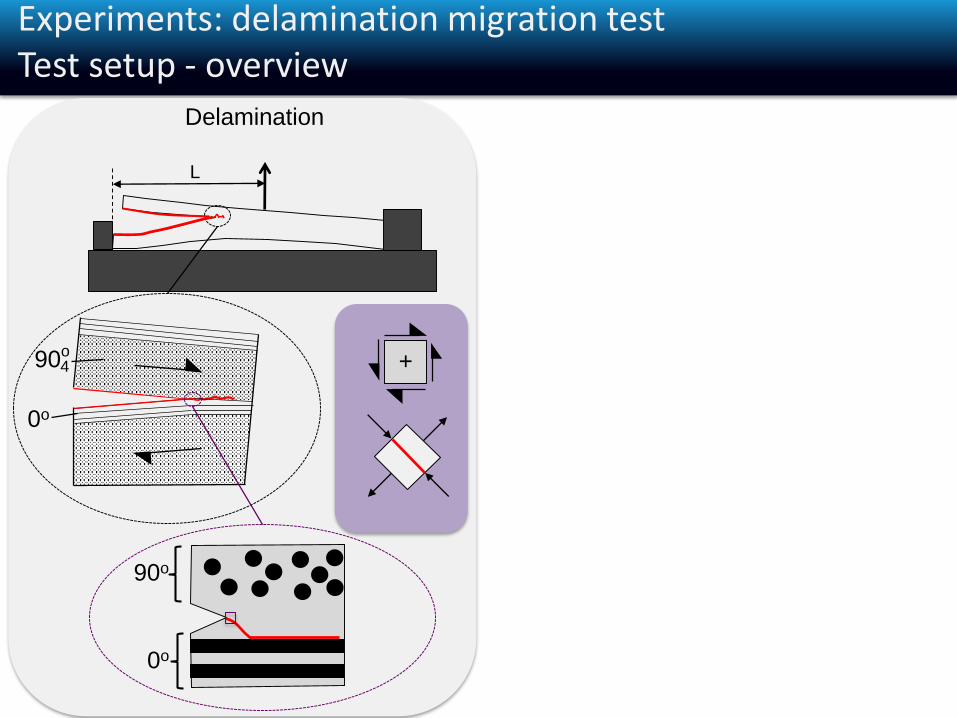
Experiments: delamination migration testTest setup - overview
L
Delamination
90o
0o
0o
90o4 +
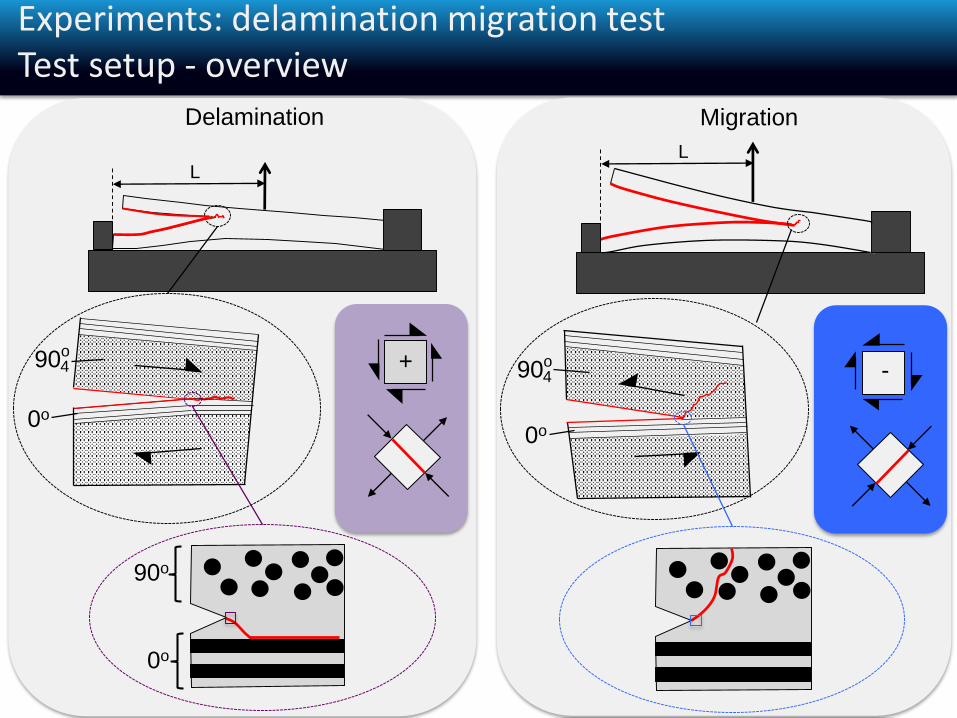
Experiments: delamination migration testTest setup - overview
Migration
L
-
0o
90o4
L
Delamination
90o
0o
0o
90o4 +
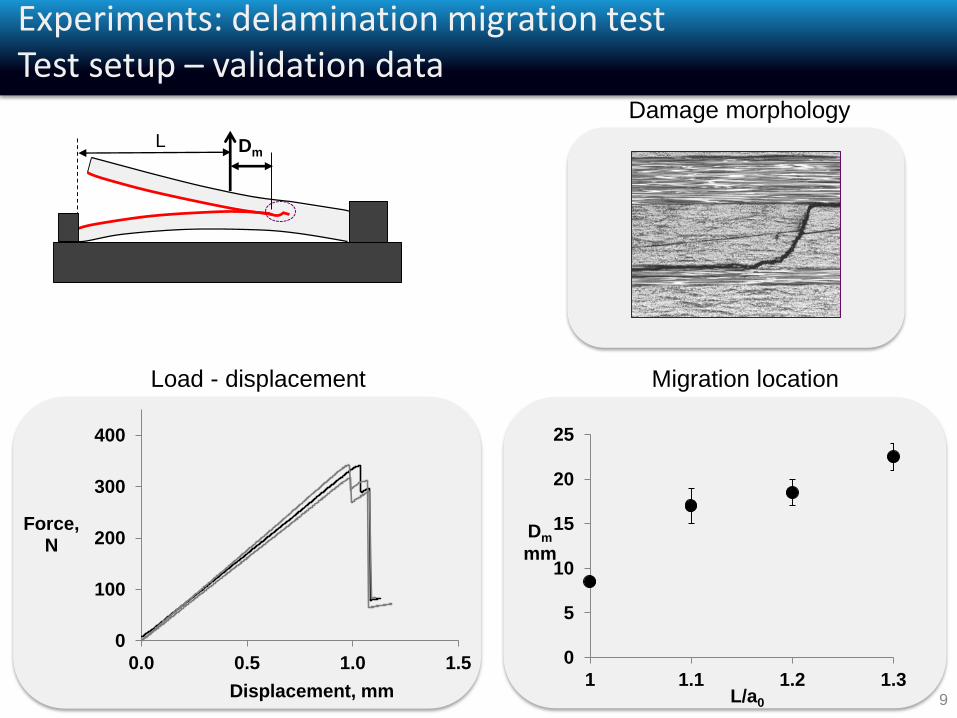
9
0
5
10
15
20
25
1 1.1 1.2 1.3
Dm
mm
L/a0
L
Experiments: delamination migration testTest setup – validation data
Load - displacement Migration location
Damage morphology
Dm
0
100
200
300
400
0.0 0.5 1.0 1.5
Force,N
Displacement, mm
Contents
10
Summary
2 Modeling approach: Floating Node Method (FNM) and
Virtual Crack Closure Technique (VCCT)
3 Validation
4
1 Experiments: delamination migration test
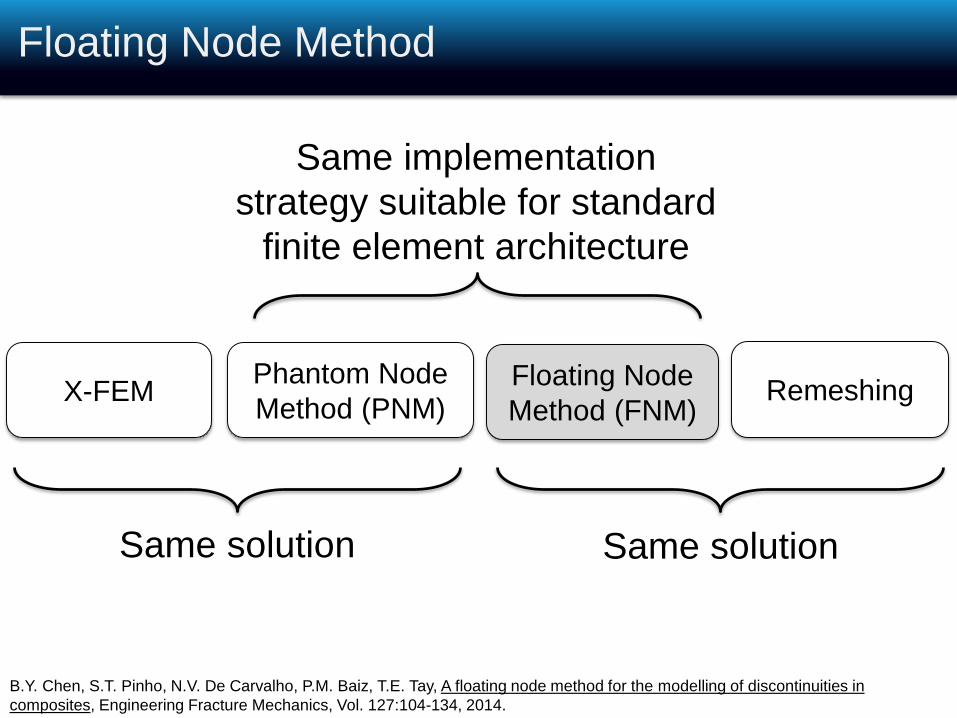
Floating Node Method
X-FEMPhantom Node
Method (PNM)Floating Node
Method (FNM)Remeshing
Same solution Same solution
Same implementation
strategy suitable for standard
finite element architecture
B.Y. Chen, S.T. Pinho, N.V. De Carvalho, P.M. Baiz, T.E. Tay, A floating node method for the modelling of discontinuities in
composites, Engineering Fracture Mechanics, Vol. 127:104-134, 2014.
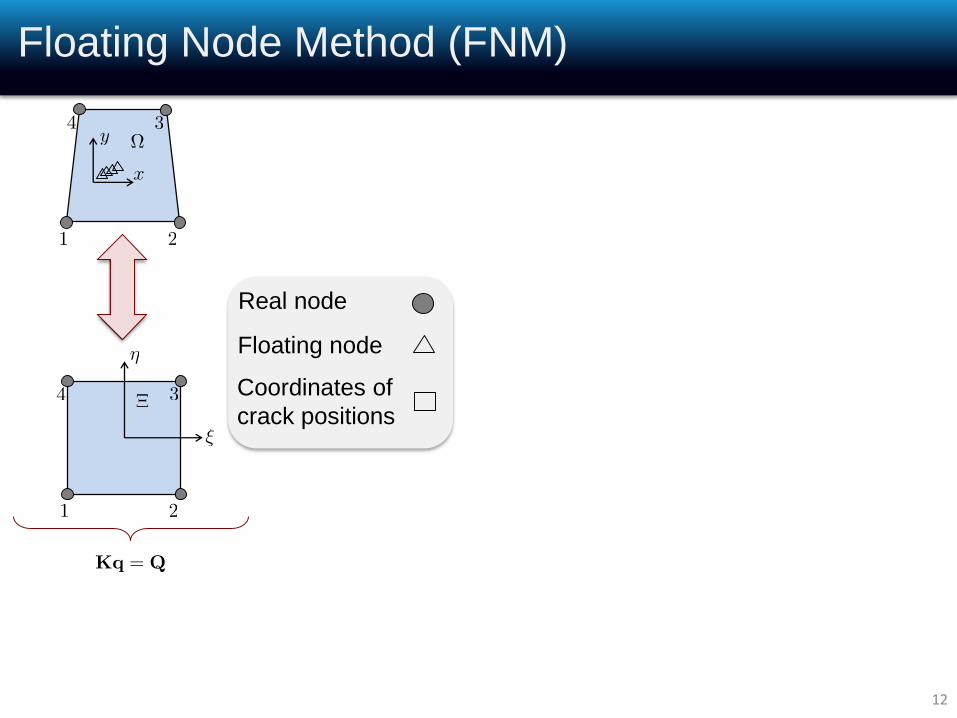
12
Real node
Floating node
Coordinates of
crack positions
Floating Node Method (FNM)
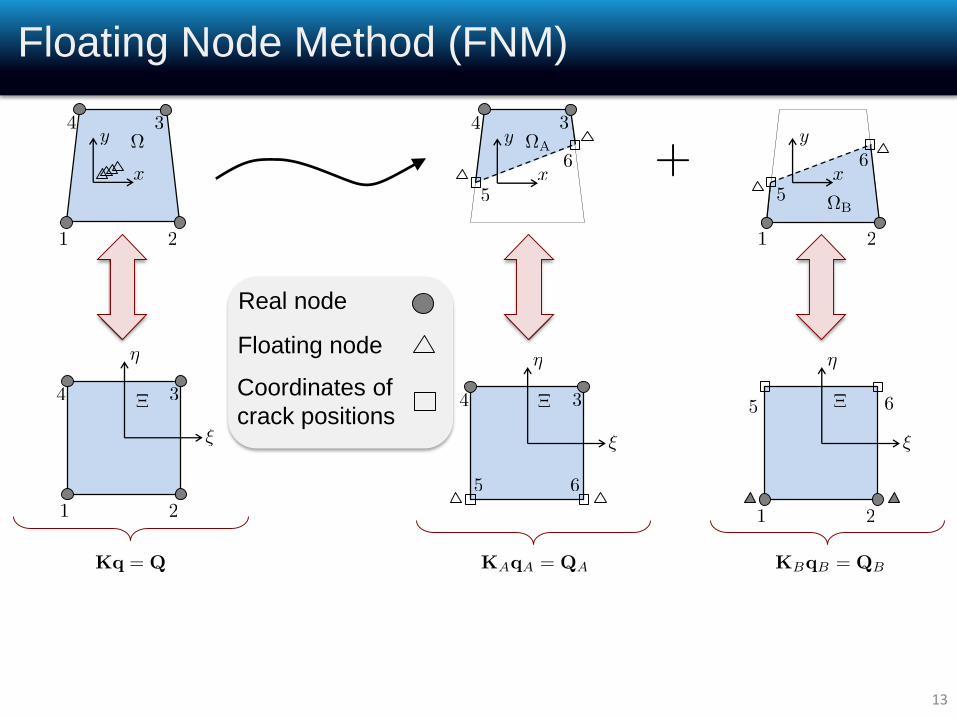
13
Floating Node Method (FNM)
Real node
Floating node
Coordinates of
crack positions
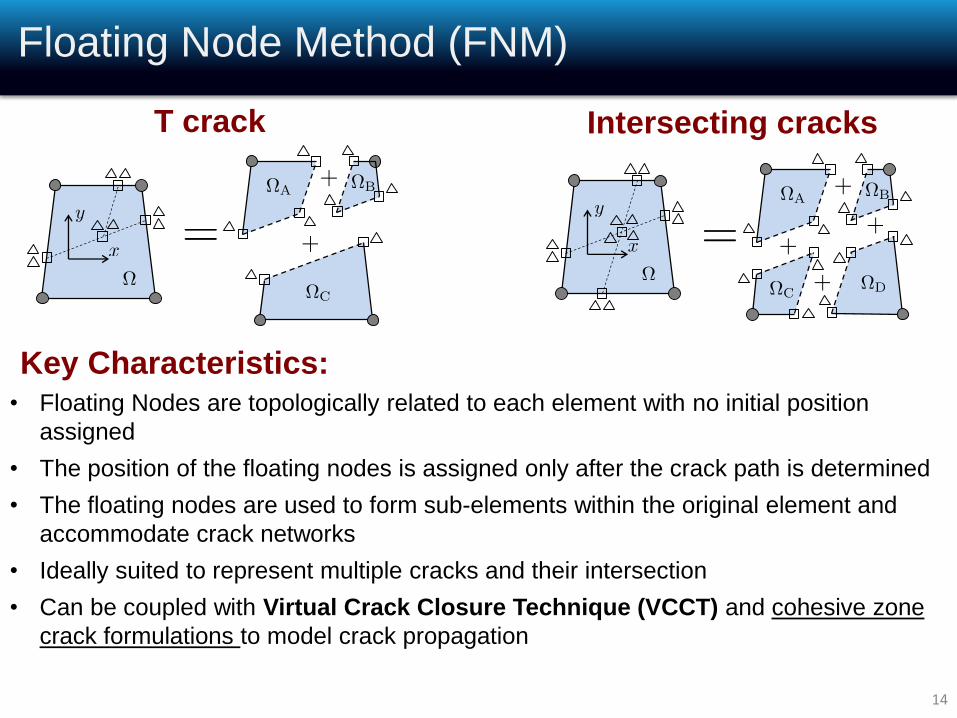
14
T crack Intersecting cracks
Floating Node Method (FNM)
• Floating Nodes are topologically related to each element with no initial position
assigned
• The position of the floating nodes is assigned only after the crack path is determined
• The floating nodes are used to form sub-elements within the original element and
accommodate crack networks
• Ideally suited to represent multiple cracks and their intersection
• Can be coupled with Virtual Crack Closure Technique (VCCT) and cohesive zone
crack formulations to model crack propagation
Key Characteristics:
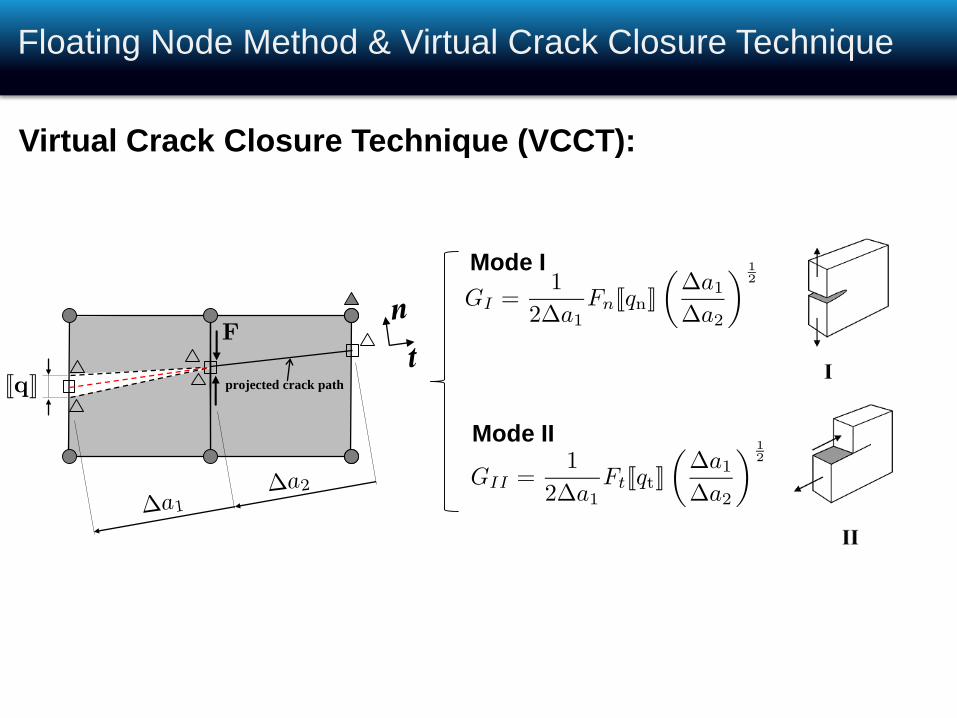
projected crack path
Mode I
Mode II
Floating Node Method & Virtual Crack Closure Technique
Virtual Crack Closure Technique (VCCT):
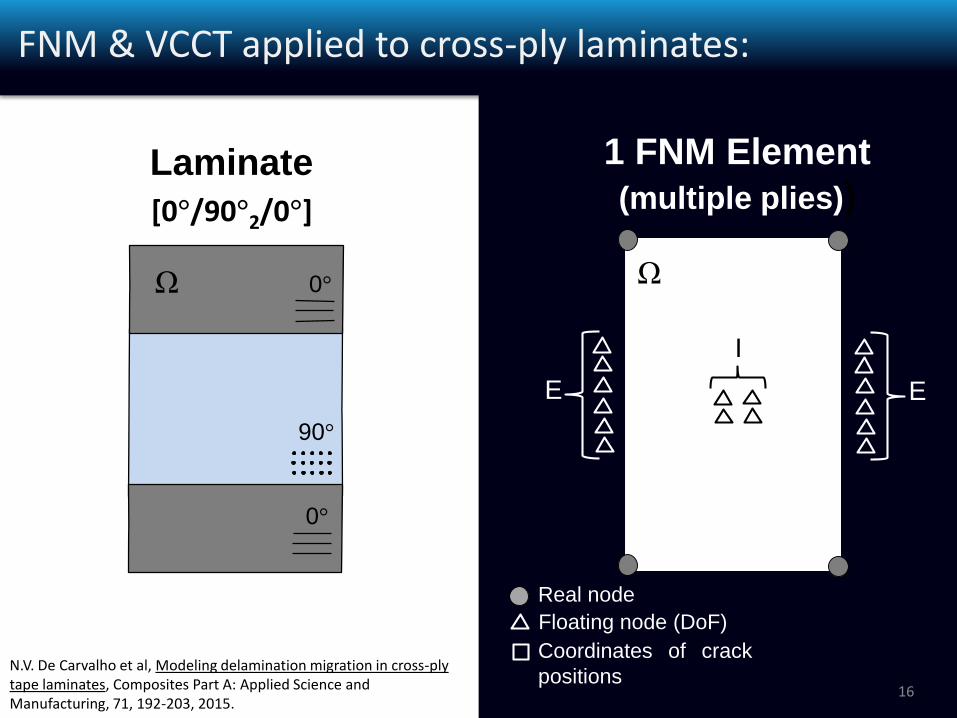
FNM & VCCT applied to cross-ply laminates:
1 FNM Element
(multiple plies))
16
EE
I
Ω
Real node
Floating node (DoF)
Coordinates of crack
positionsN.V. De Carvalho et al, Modeling delamination migration in cross-ply tape laminates, Composites Part A: Applied Science and Manufacturing, 71, 192-203, 2015.
Laminate
Ω
90°
0°
0°
[0°/90°2/0°]
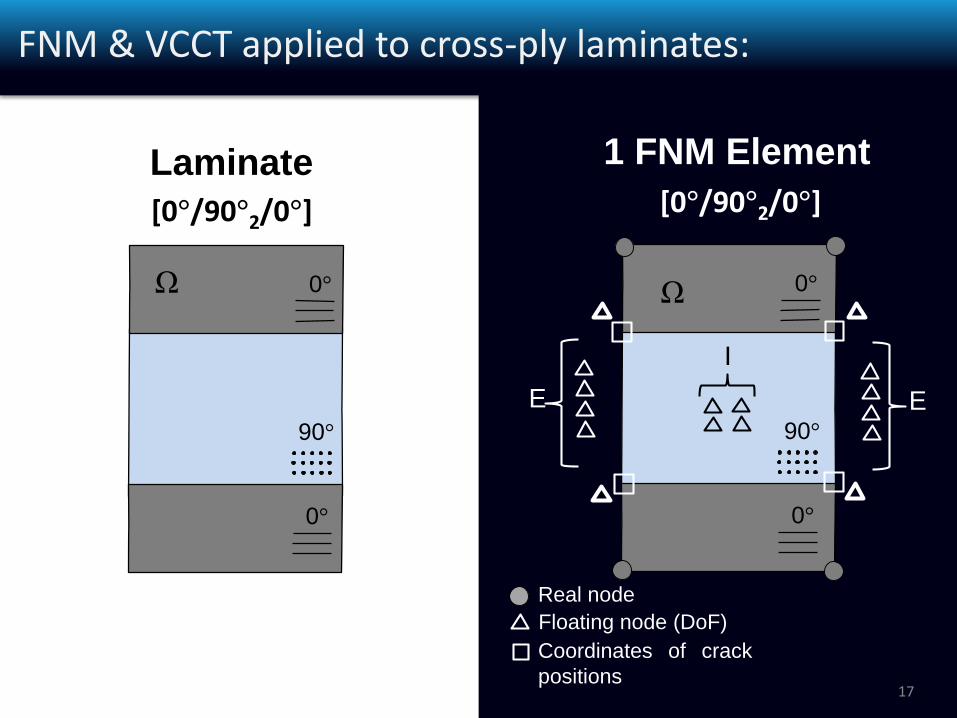
FNM & VCCT applied to cross-ply laminates:
17
Real node
Floating node (DoF)
Coordinates of crack
positions
Ω
EE
Laminate
Ω
[0°/90°2/0°]
I
90°
0°
0°
90°
0°
0°
[0°/90°2/0°]
1 FNM Element
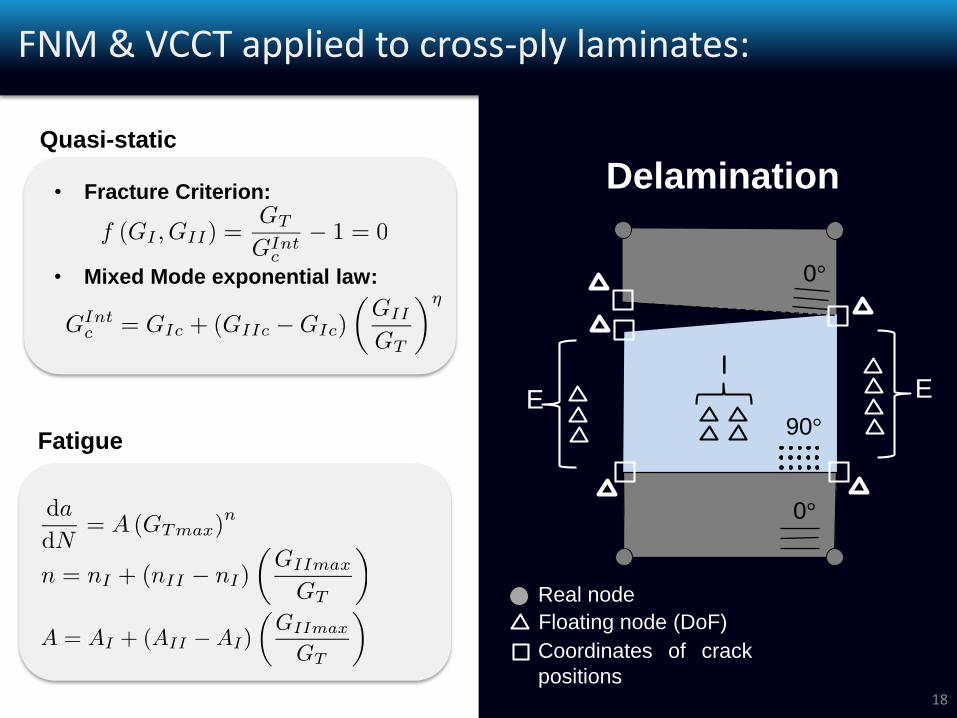
18
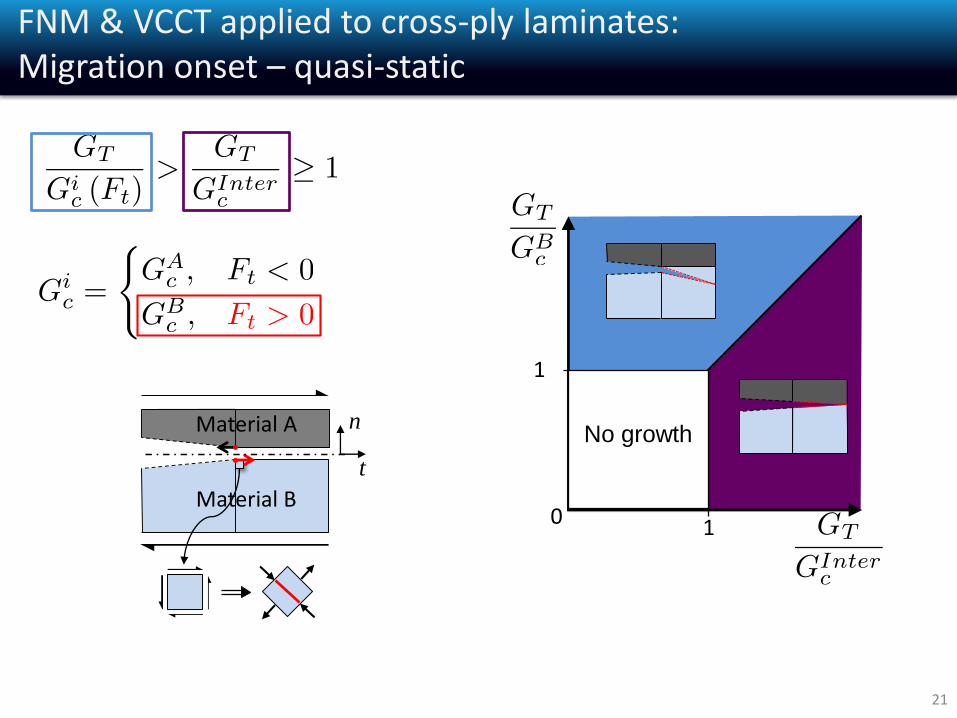
• Mixed Mode exponential law:
• Fracture Criterion:
Quasi-static
Fatigue
FNM & VCCT applied to cross-ply laminates:
0°
Delamination
E E
Real node
Floating node (DoF)
Coordinates of crack
positions
90°
0°
I
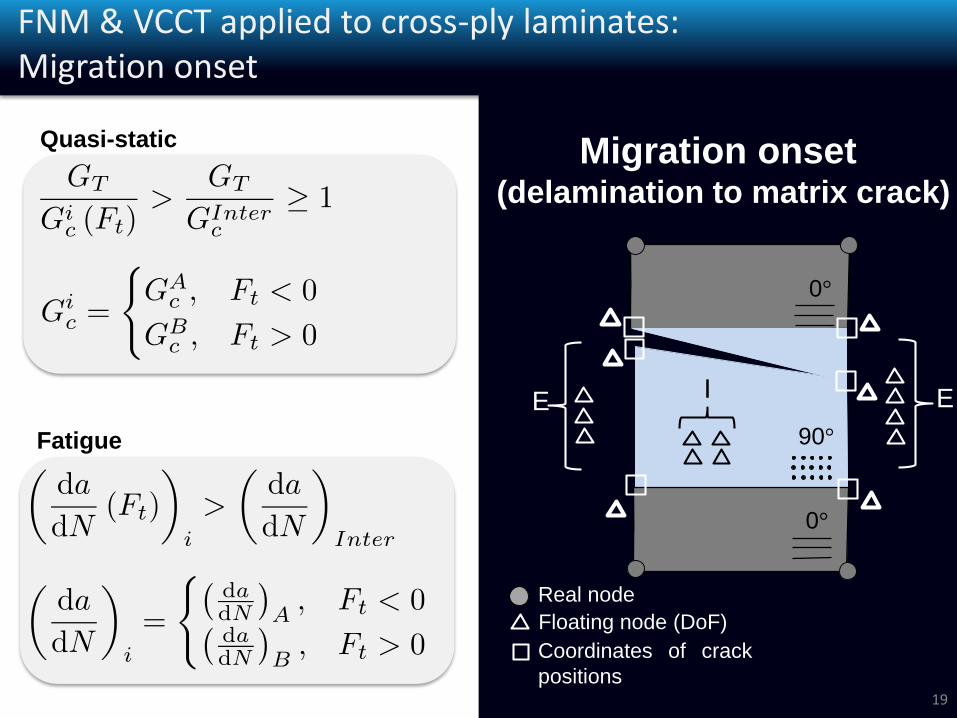
19
Migration onset (delamination to matrix crack)
FNM & VCCT applied to cross-ply laminates: Migration onset
E E
90°
0°
0°
Real node
Floating node (DoF)
Coordinates of crack
positions
I
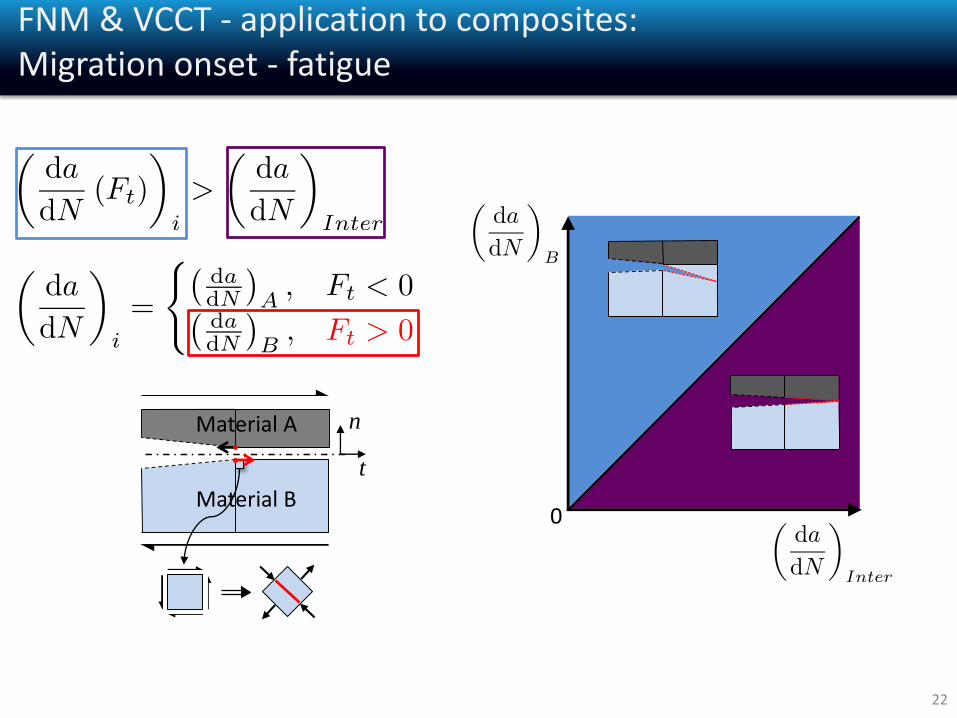
Quasi-static
Fatigue
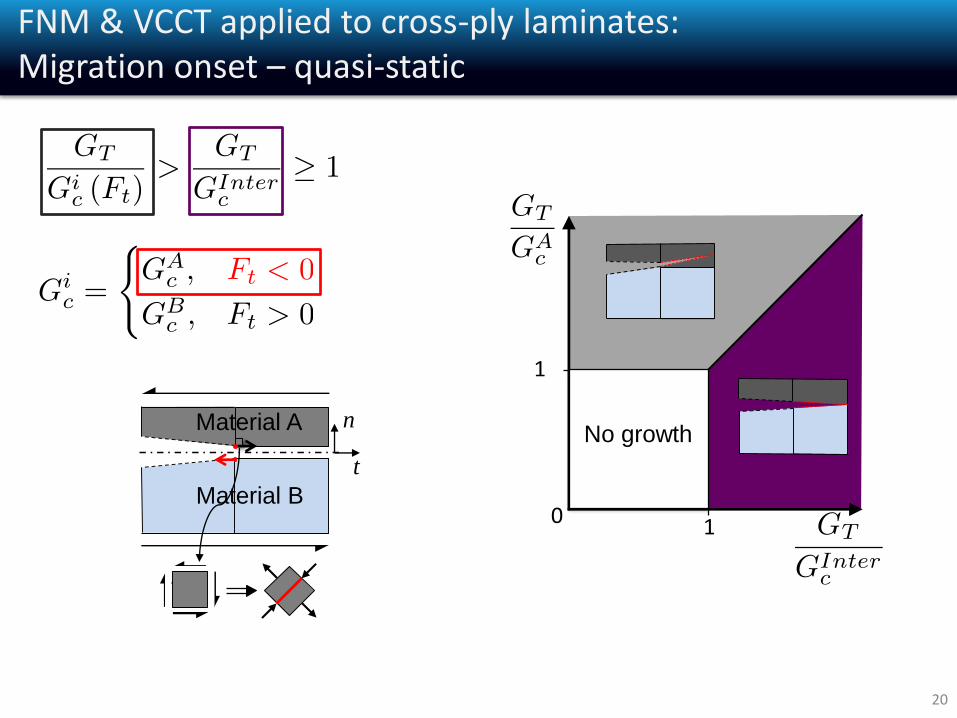
Material A
Material B
t
n
1
10
No growthNo growth
20
FNM & VCCT applied to cross-ply laminates: Migration onset – quasi-static
21
FNM & VCCT applied to cross-ply laminates: Migration onset – quasi-static
Material A
Material B
1
10
No growth
t
n
22
FNM & VCCT - application to composites: Migration onset - fatigue
t
nMaterial A
Material B0
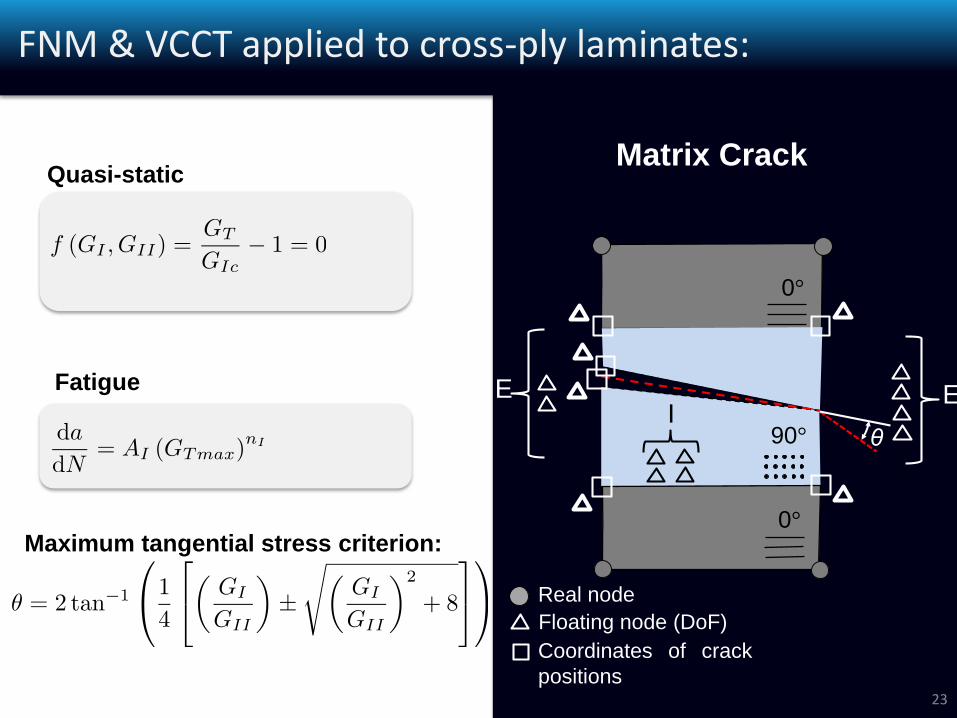
Matrix Crack
Maximum tangential stress criterion:
Quasi-static
Fatigue
23
FNM & VCCT applied to cross-ply laminates:
IE E
90°
0°
0°
θ
Real node
Floating node (DoF)
Coordinates of crack
positions
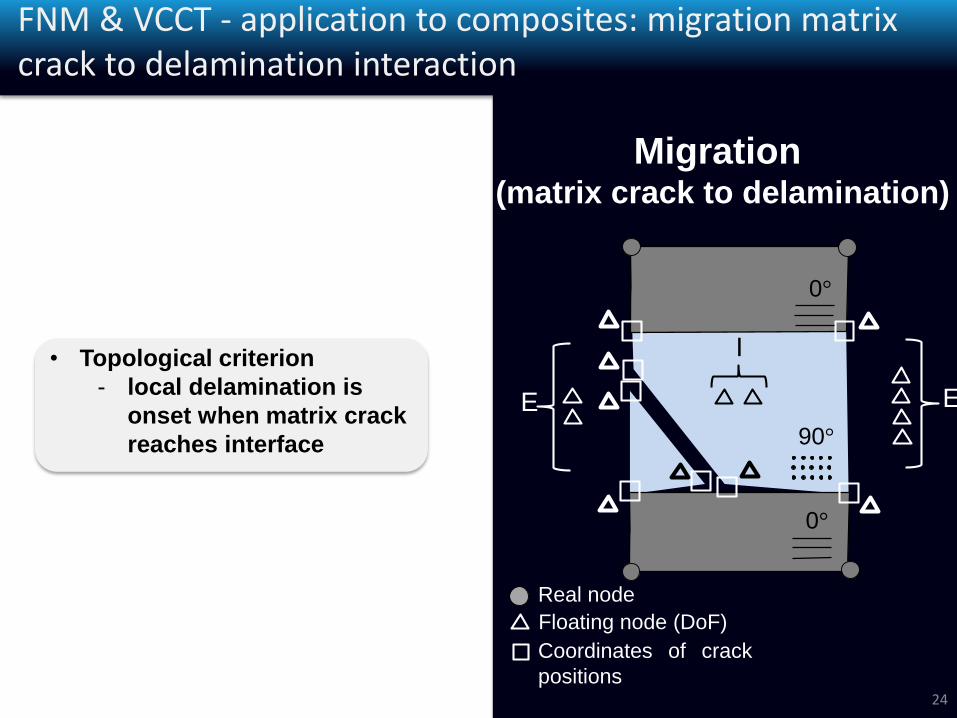
FNM & VCCT - application to composites: migration matrix crack to delamination interaction
24
• Topological criterion
- local delamination is
onset when matrix crack
reaches interface 90°
0°
0°
Real node
Floating node (DoF)
Coordinates of crack
positions
Migration (matrix crack to delamination)
I
E E
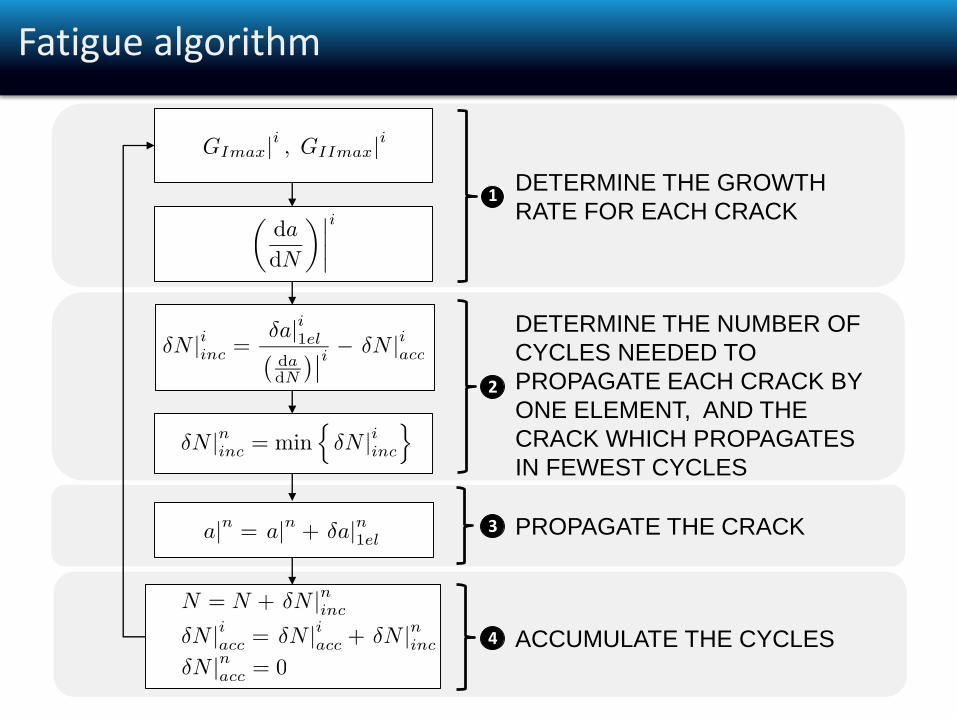
Fatigue algorithm
1
PROPAGATE THE CRACK
ACCUMULATE THE CYCLES
DETERMINE THE GROWTH
RATE FOR EACH CRACK
DETERMINE THE NUMBER OF
CYCLES NEEDED TO
PROPAGATE EACH CRACK BY
ONE ELEMENT, AND THE
CRACK WHICH PROPAGATES
IN FEWEST CYCLES
2
3
4
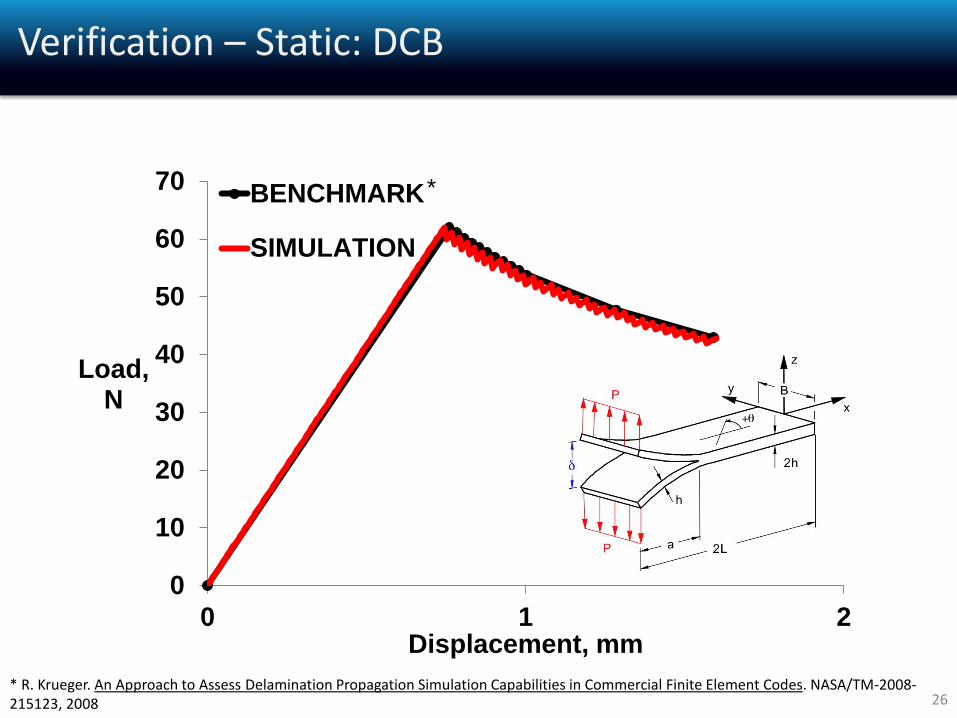
Verification – Static: DCB
26
0
10
20
30
40
50
60
70
0 1 2
Load,N
Displacement, mm
BENCHMARK
SIMULATION
* R. Krueger. An Approach to Assess Delamination Propagation Simulation Capabilities in Commercial Finite Element Codes. NASA/TM-2008-215123, 2008
*
30
31
32
33
34
35
36
37
1 100 10000 1000000
a, mm
N, Cycles
2D Benchmark
FNM - VCCT
27
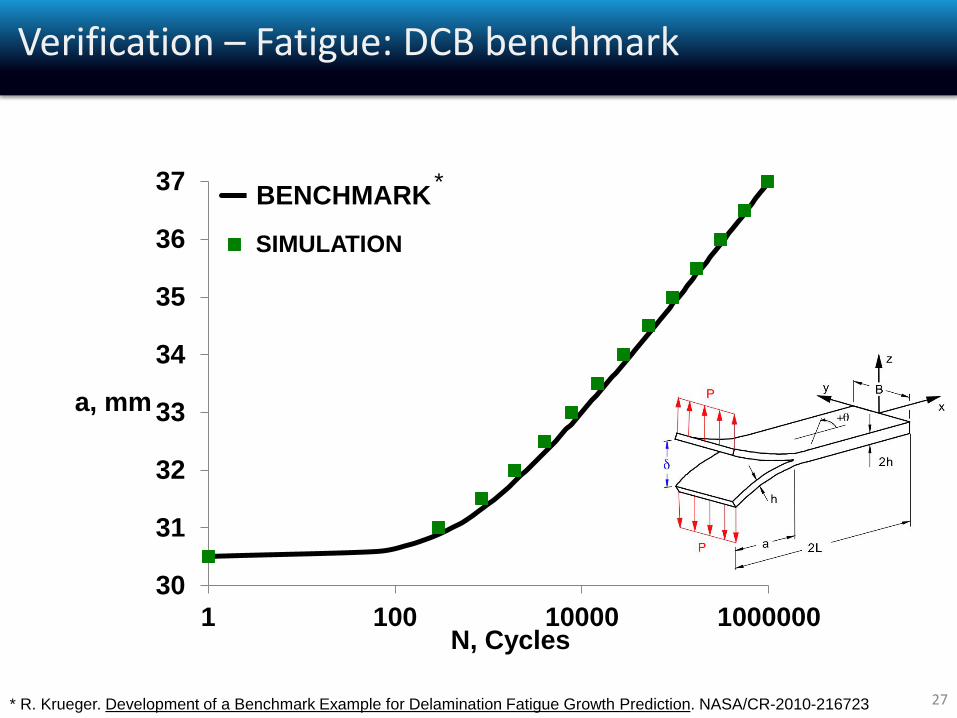
Verification – Fatigue: DCB benchmark
BENCHMARK
* R. Krueger. Development of a Benchmark Example for Delamination Fatigue Growth Prediction. NASA/CR-2010-216723
*
SIMULATION
Contents
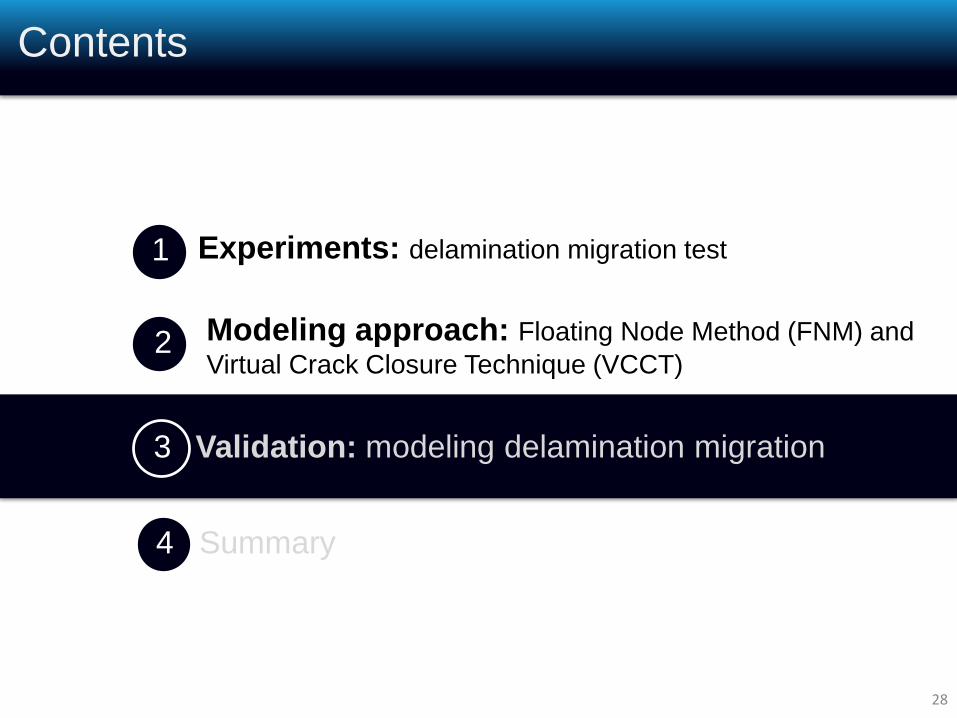
28
Summary
2 Modeling approach: Floating Node Method (FNM) and
Virtual Crack Closure Technique (VCCT)
3 Validation: modeling delamination migration
4
1 Experiments: delamination migration test
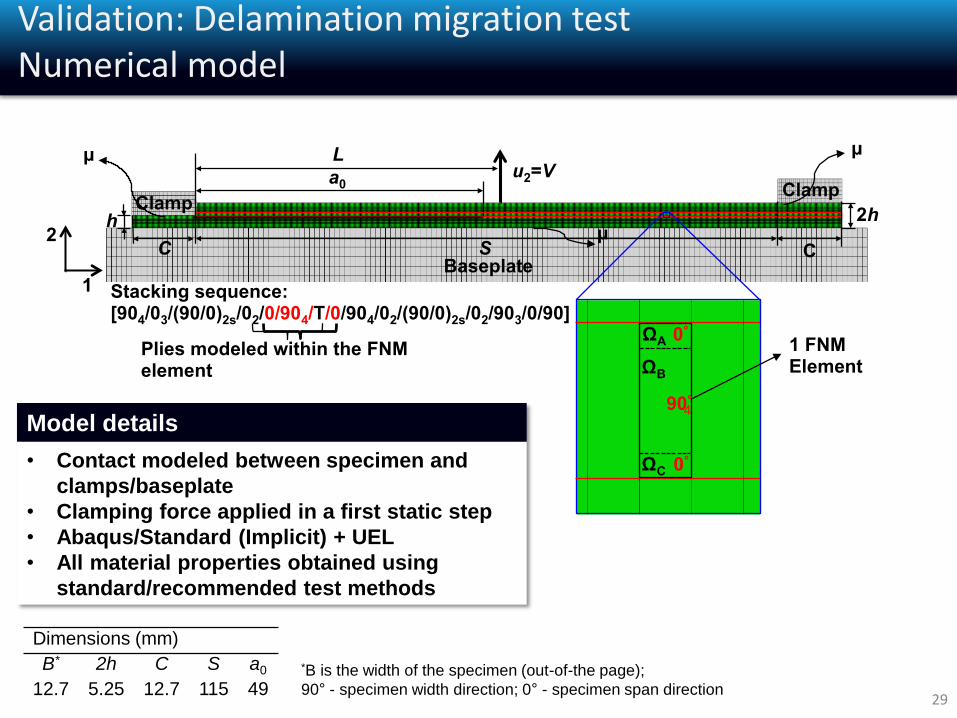
Validation: Delamination migration testNumerical model
29
Dimensions (mm)
B* 2h C S a0
12.7 5.25 12.7 115 49
*B is the width of the specimen (out-of-the page);
90° - specimen width direction; 0° - specimen span direction
Model details
• Contact modeled between specimen and
clamps/baseplate
• Clamping force applied in a first static step
• Abaqus/Standard (Implicit) + UEL
• All material properties obtained using
standard/recommended test methods
a0
Clamp Clamp
Baseplate
Stacking sequence: [904/03/(90/0)2s/02/0/904/T/0/904/02/(90/0)2s/02/903/0/90]
Plies modeled within the FNM element
L
1
2 C
µ µ
µ 2h
u2=V
h
C S
ΩA
ΩB
ΩC
0°
90°
0°
1 FNM Element
4
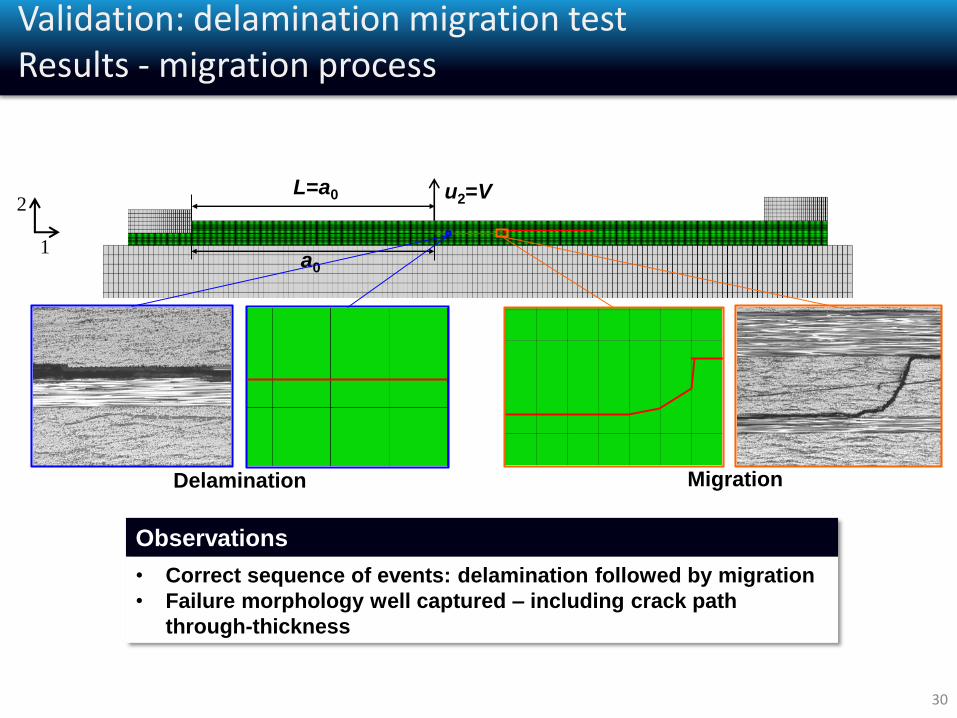
30
Delamination Migration
1a0
L=a0 u2=V2
Validation: delamination migration testResults - migration process
Observations
• Correct sequence of events: delamination followed by migration
• Failure morphology well captured – including crack path
through-thickness
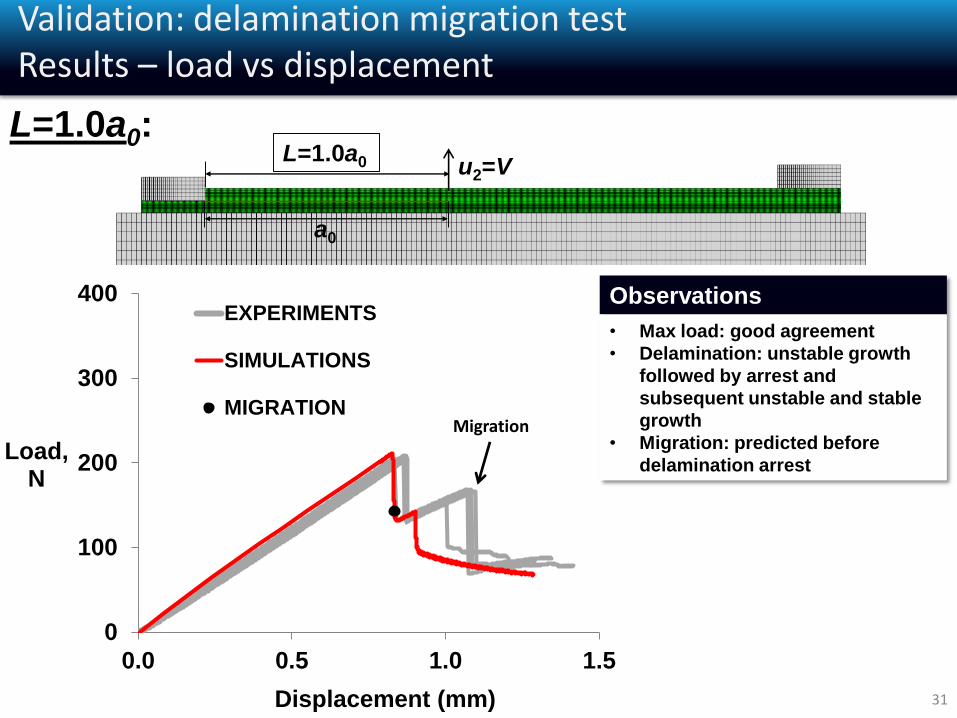
31
0
100
200
300
400
0.0 0.5 1.0 1.5
Load,N
Displacement (mm)
EXPERIMENTS
SIMULATIONS
MIGRATION
a0
L=1.0a0 u2=V
Migration
Validation: delamination migration testResults – load vs displacement
L=1.0a0:
Observations
• Max load: good agreement
• Delamination: unstable growth
followed by arrest and
subsequent unstable and stable
growth
• Migration: predicted before
delamination arrest
0
100
200
300
400
0.0 0.5 1.0 1.5
Load,N
Displacement, mm
EXPERIMENTS
SIMULATION
Migration
a0
u2=V
32
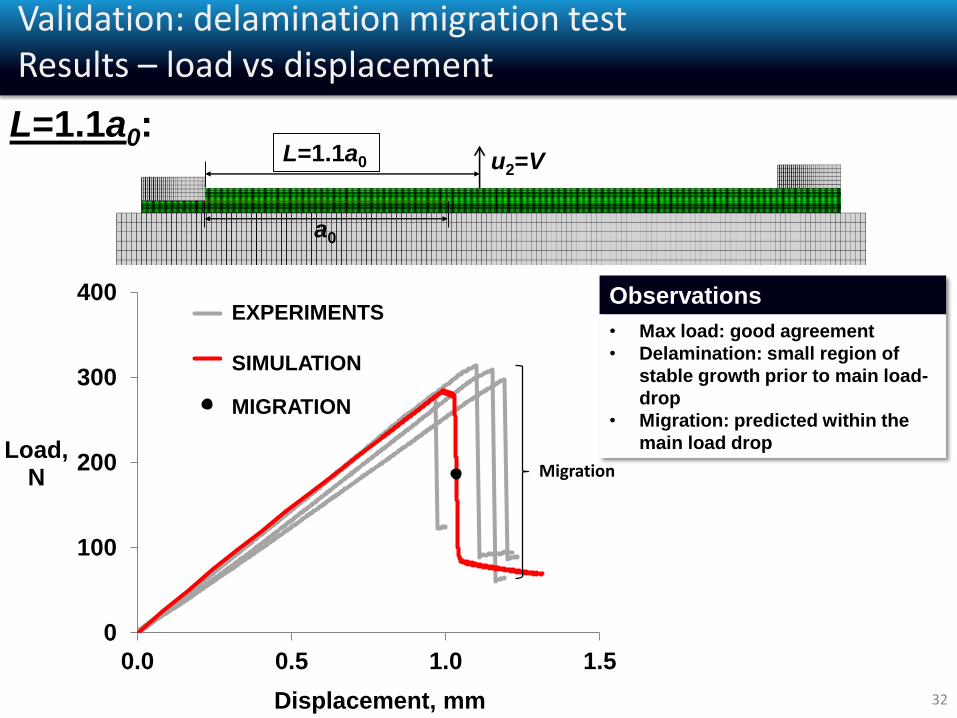
Validation: delamination migration testResults – load vs displacement
EXPERIMENTS
SIMULATION
MIGRATION
Observations
• Max load: good agreement
• Delamination: small region of
stable growth prior to main load-
drop
• Migration: predicted within the
main load drop
Migration
L=1.1a0:L=1.1a0
0
100
200
300
400
0.0 0.5 1.0 1.5
Load,N
Displacement, mm
EXPERIMENTS
SIMULATION
MIGRATION
Migration
33
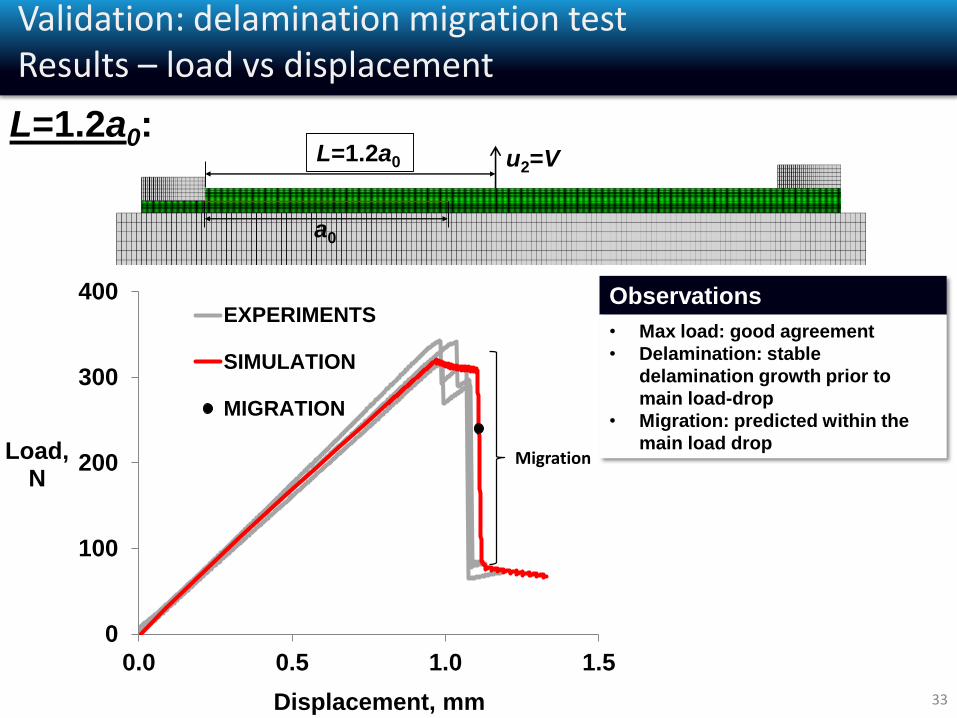
Validation: delamination migration testResults – load vs displacement
L=1.2a0:
a0
L=1.2a0 u2=V
Observations
• Max load: good agreement
• Delamination: stable
delamination growth prior to
main load-drop
• Migration: predicted within the
main load drop
0
100
200
300
400
0.0 0.5 1.0 1.5
Load,N
Displacement, mm
EXPERIMENTS
SIMULATION
MIGRATION
34
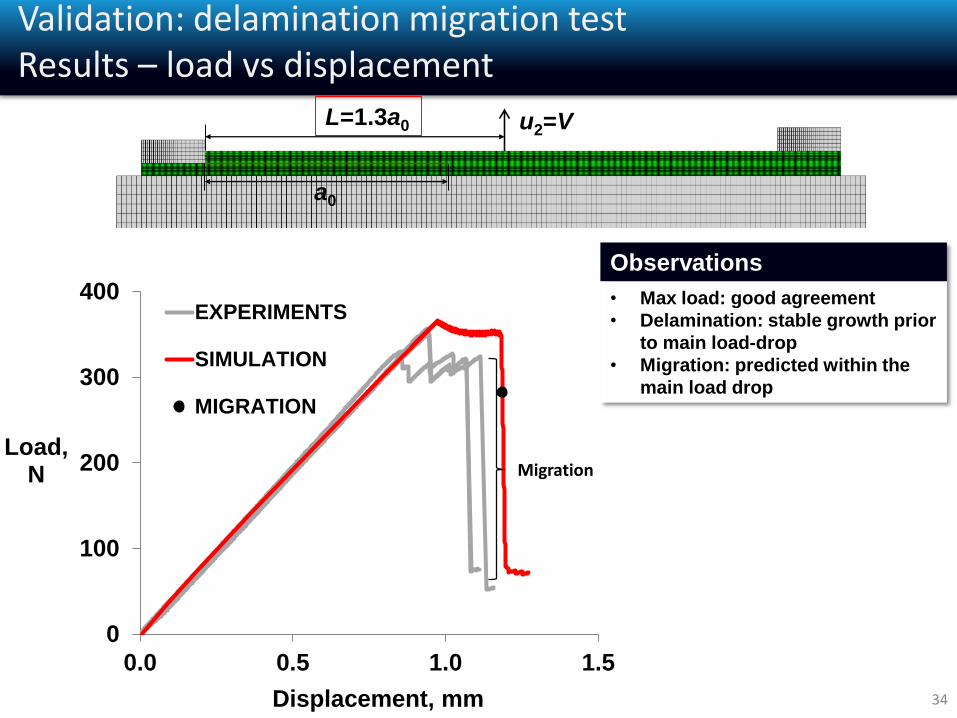
a0
u2=V
Observations
• Max load: good agreement
• Delamination: stable growth prior
to main load-drop
• Migration: predicted within the
main load drop
L=1.3a0
Validation: delamination migration testResults – load vs displacement
Migration
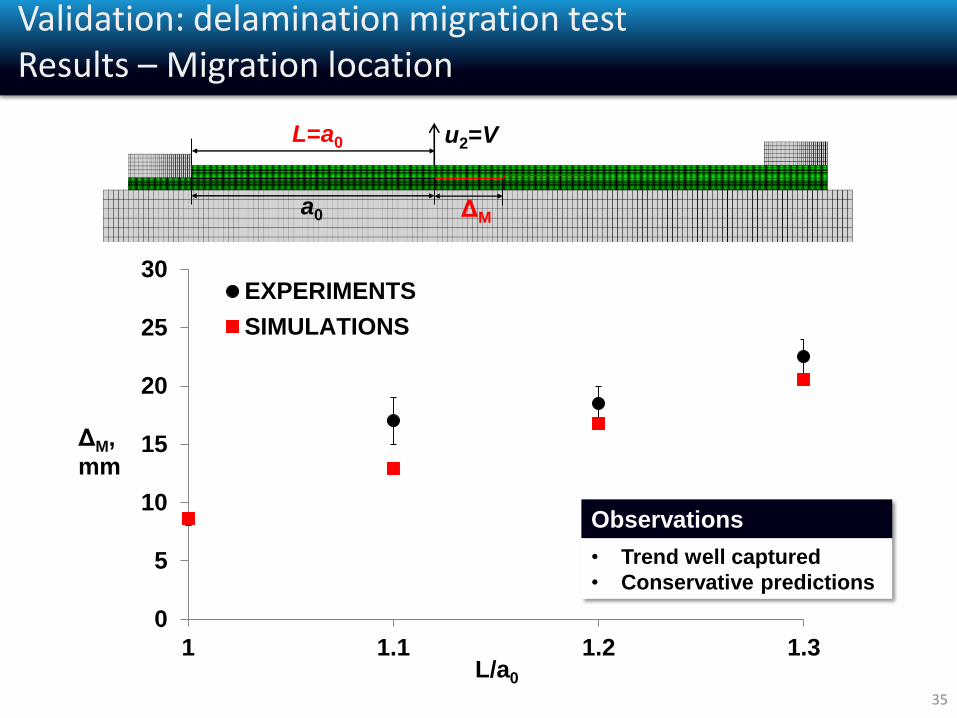
0
5
10
15
20
25
30
1 1.1 1.2 1.3
EXPERIMENTS
SIMULATIONS
L/a0
ΔM,
mm
35
a0
L=a0 u2=V
ΔM
Observations
• Trend well captured
• Conservative predictions
Validation: delamination migration testResults – Migration location
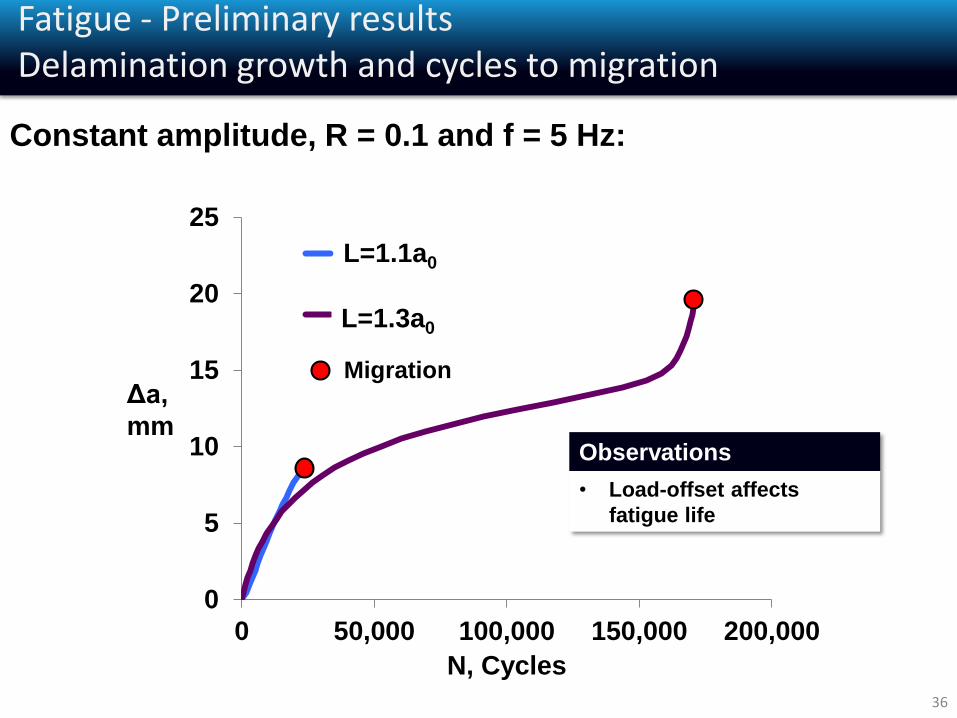
Fatigue - Preliminary resultsDelamination growth and cycles to migration
36
0
5
10
15
20
25
0 50,000 100,000 150,000 200,000
N, Cycles
Series1
Series2
L=1.1a0
L=1.3a0
Δa,
mm
Migration
Observations
• Load-offset affects
fatigue life
Constant amplitude, R = 0.1 and f = 5 Hz:
Contents
37
Summary
2 Modeling approach: Floating Node Method (FNM) and
Virtual Crack Closure Technique (VCCT)
3 Validation: modeling delamination migration
4
1 Experiments: delamination migration test
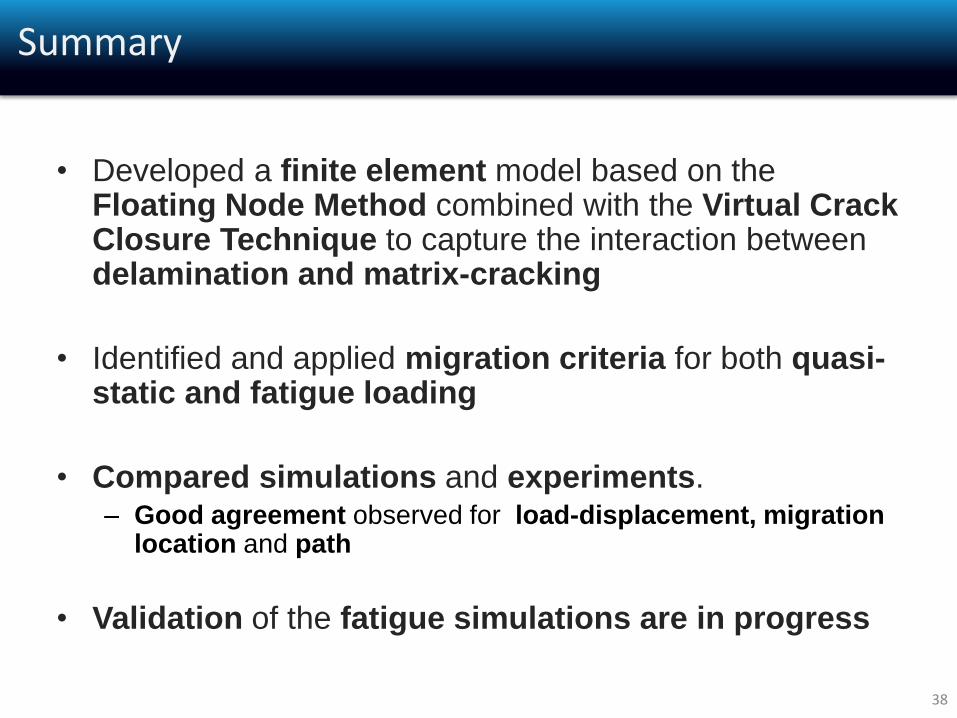
Summary
• Developed a finite element model based on the Floating Node Method combined with the Virtual Crack Closure Technique to capture the interaction between delamination and matrix-cracking
• Identified and applied migration criteria for both quasi-static and fatigue loading
• Compared simulations and experiments.– Good agreement observed for load-displacement, migration
location and path
• Validation of the fatigue simulations are in progress
38
N. V. De [email protected]
National Institute of Aerospace
Modeling delamination migration: quasi-static and fatigue loading
S. T. Pinho, P.
BaizImperial College
London
B.Y. ChenImperial College London
National University of
Singapore
T. E. TayNational University
Singapore
J.G.
RatcliffeNASA Langley
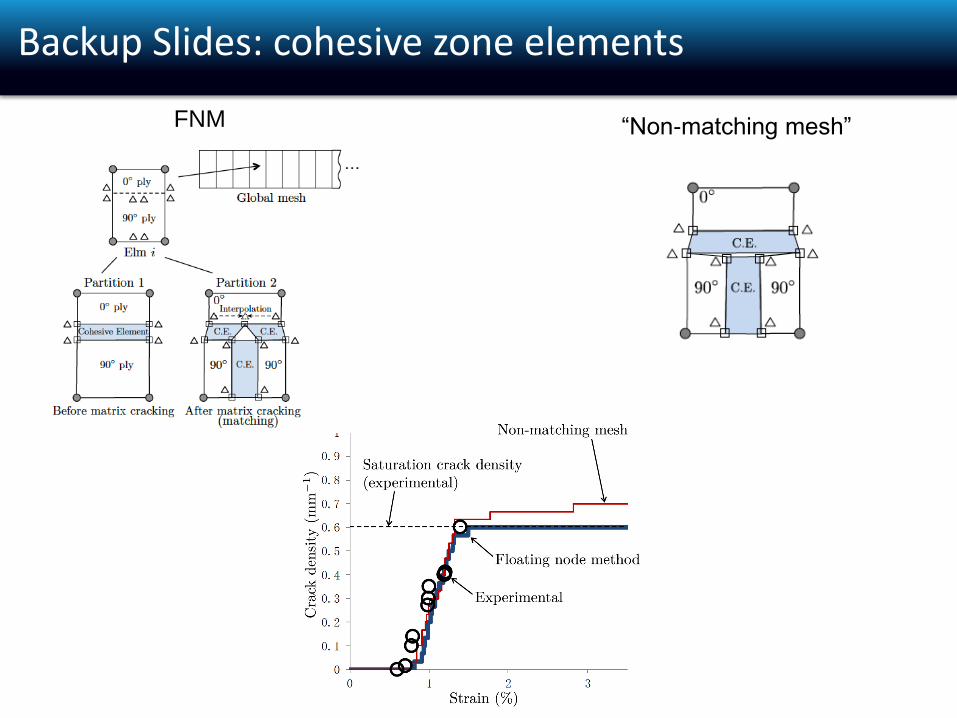
“Non-matching mesh”FNM
Backup Slides: cohesive zone elements
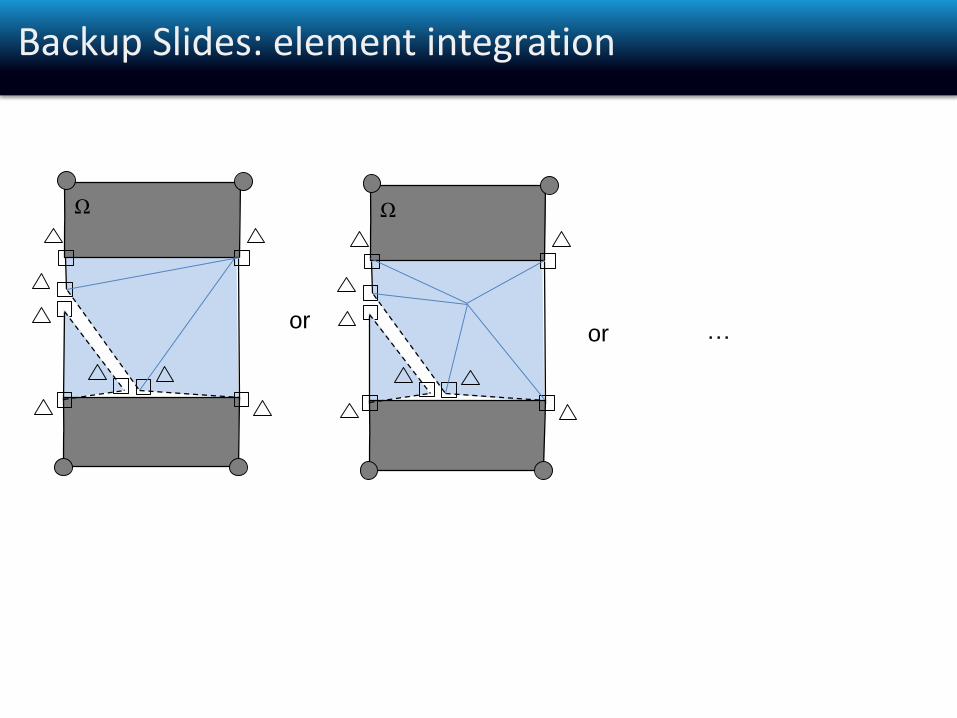
Ω Ω
…oror
Backup Slides: element integration
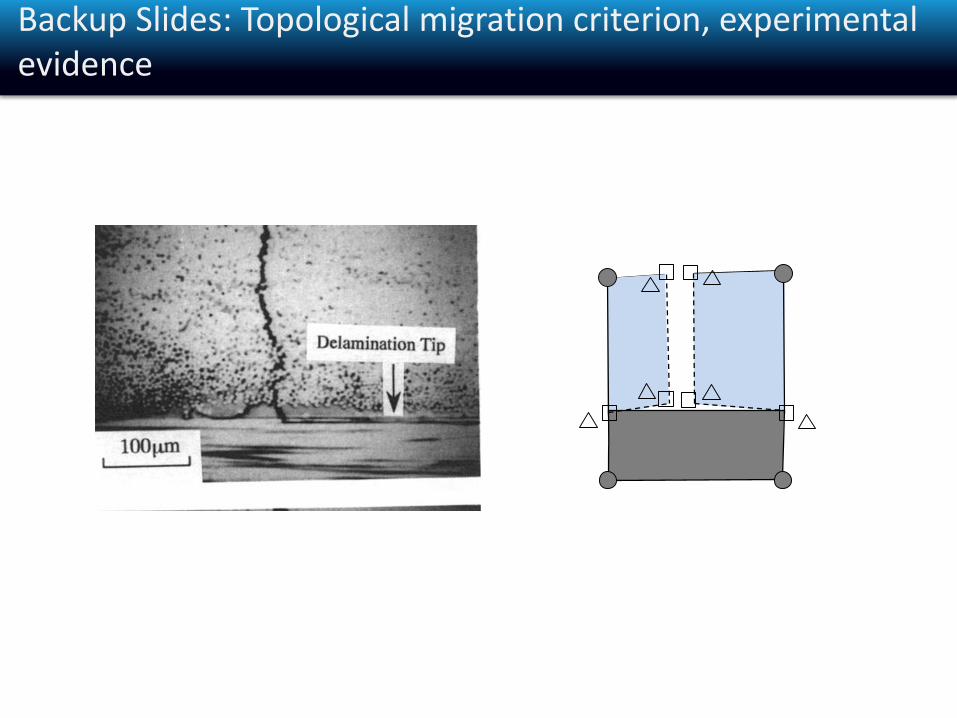
Backup Slides: Topological migration criterion, experimental evidence
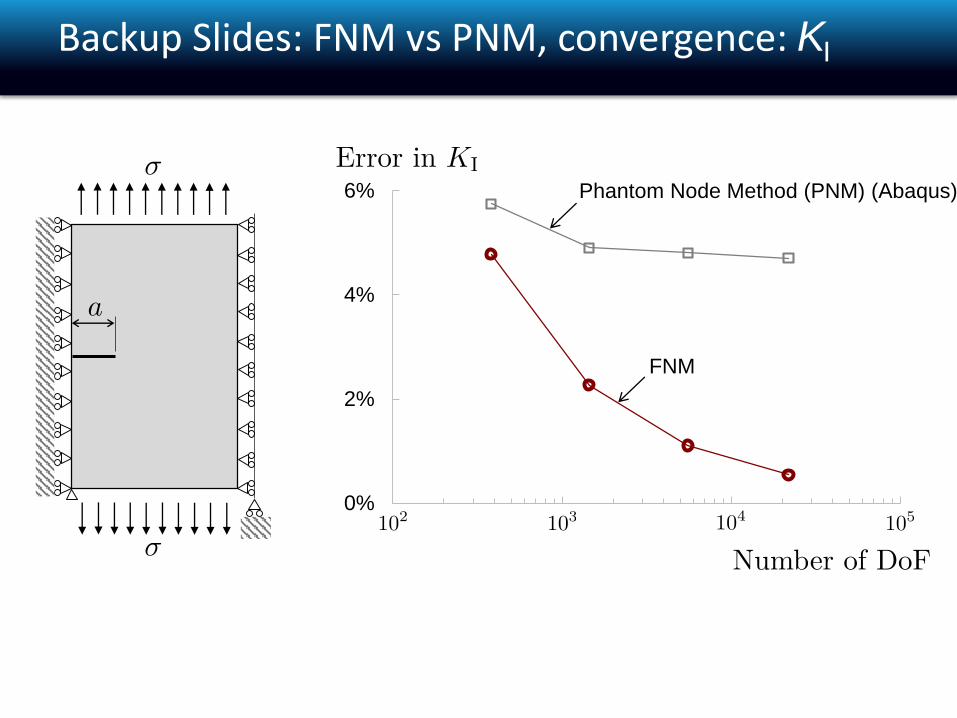
Backup Slides: FNM vs PNM, convergence: KI
0%
2%
4%
6%
1.E+02 1.E+03 1.E+04 1.E+05
Phantom Node Method (PNM) (Abaqus)
FNM
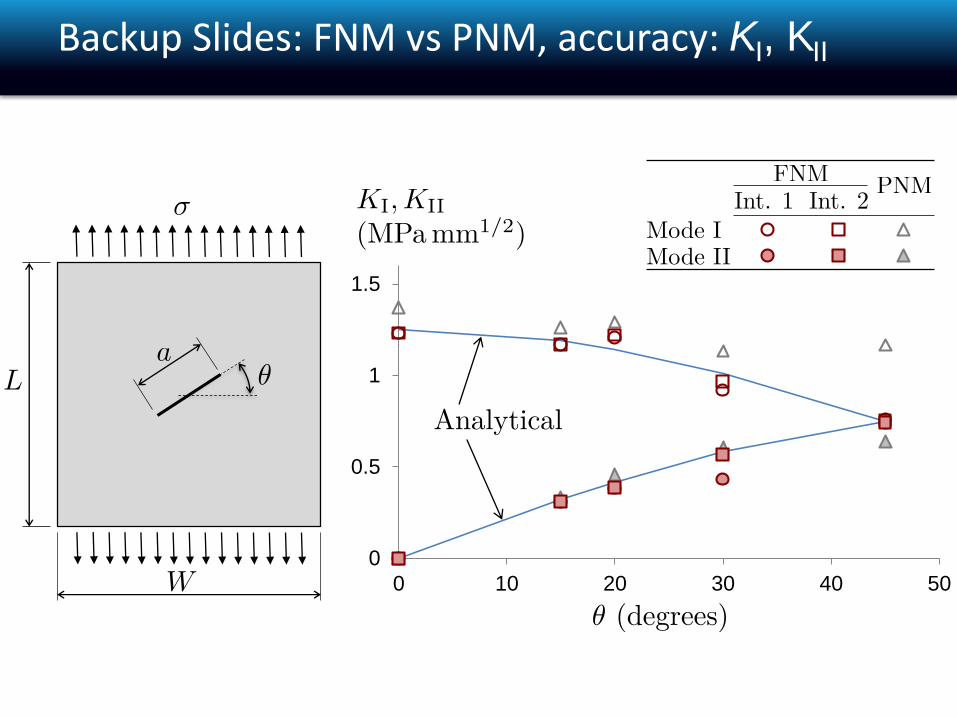
Backup Slides: FNM vs PNM, accuracy: KI, KII
0
0.5
1
1.5
0 10 20 30 40 50
45
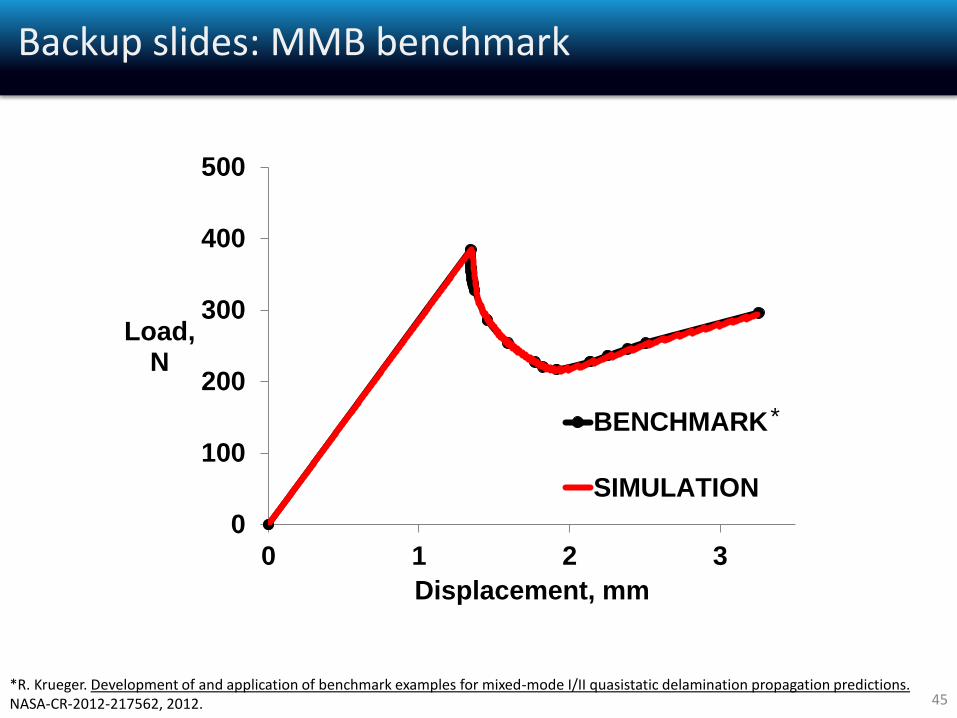
0
100
200
300
400
500
0 1 2 3
Load,N
Displacement, mm
BENCHMARK
SIMULATION
Backup slides: MMB benchmark
*R. Krueger. Development of and application of benchmark examples for mixed-mode I/II quasistatic delamination propagation predictions. NASA-CR-2012-217562, 2012.
*