Embed Size (px)
Citation preview
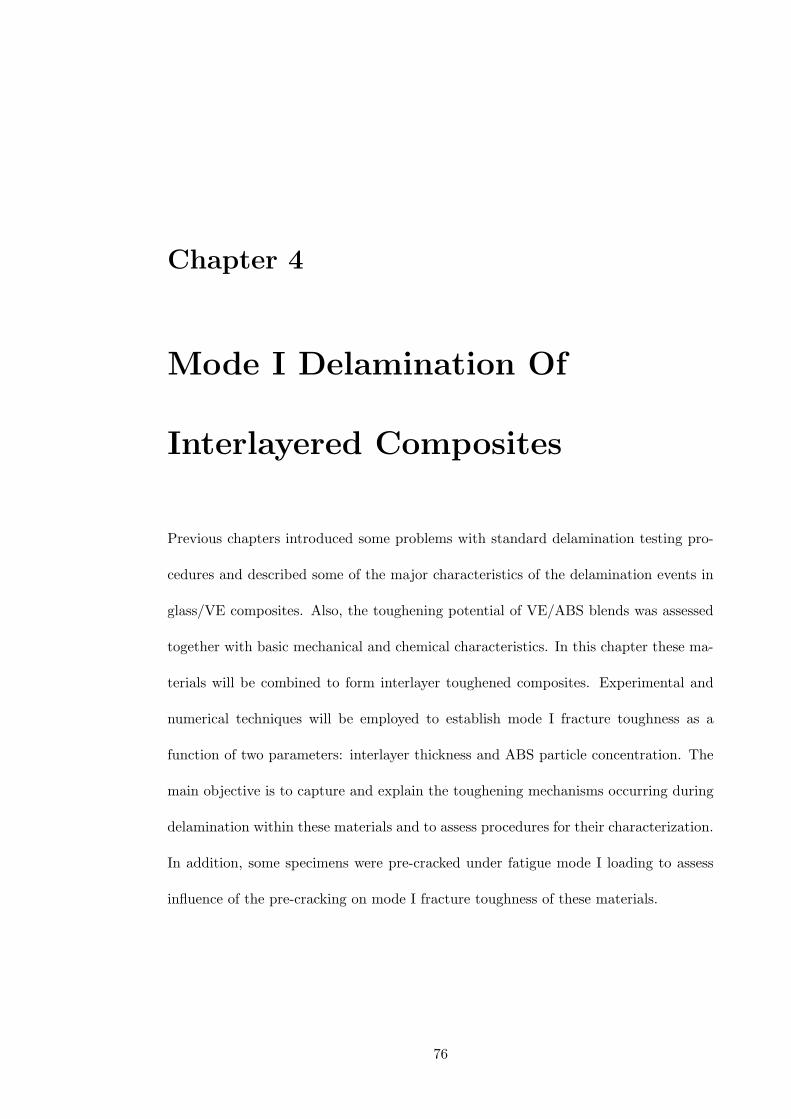
Chapter 4
Mode I Delamination Of
Interlayered Composites
Previous chapters introduced some problems with standard delamination testing pro-
cedures and described some of the major characteristics of the delamination events in
glass/VE composites. Also, the toughening potential of VE/ABS blends was assessed
together with basic mechanical and chemical characteristics. In this chapter these ma-
terials will be combined to form interlayer toughened composites. Experimental and
numerical techniques will be employed to establish mode I fracture toughness as a
function of two parameters: interlayer thickness and ABS particle concentration. The
main objective is to capture and explain the toughening mechanisms occurring during
delamination within these materials and to assess procedures for their characterization.
In addition, some specimens were pre-cracked under fatigue mode I loading to assess
influence of the pre-cracking on mode I fracture toughness of these materials.
76
MODE I DELAMINATION OF INTERLAYERED COMPOSITES 77
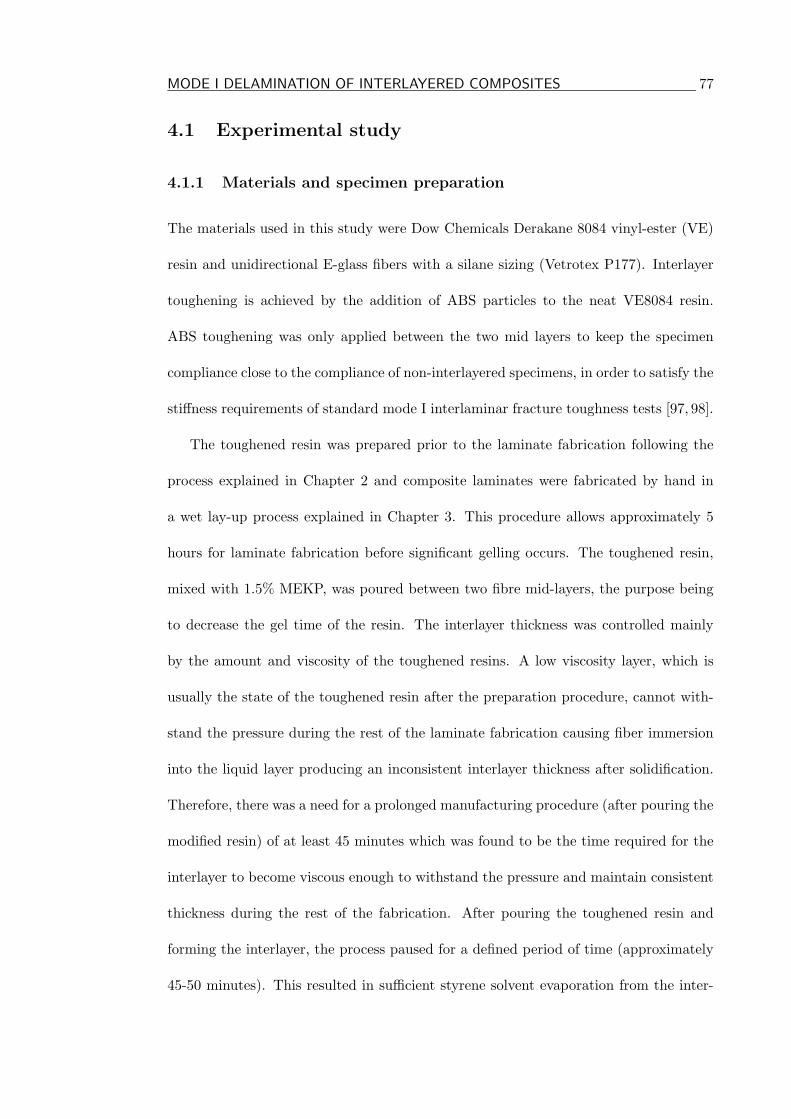
4.1 Experimental study
4.1.1 Materials and specimen preparation
The materials used in this study were Dow Chemicals Derakane 8084 vinyl-ester (VE)
resin and unidirectional E-glass fibers with a silane sizing (Vetrotex P177). Interlayer
toughening is achieved by the addition of ABS particles to the neat VE8084 resin.
ABS toughening was only applied between the two mid layers to keep the specimen
compliance close to the compliance of non-interlayered specimens, in order to satisfy the
stiffness requirements of standard mode I interlaminar fracture toughness tests [97, 98].
The toughened resin was prepared prior to the laminate fabrication following the
process explained in Chapter 2 and composite laminates were fabricated by hand in
a wet lay-up process explained in Chapter 3. This procedure allows approximately 5
hours for laminate fabrication before significant gelling occurs. The toughened resin,
mixed with 1.5% MEKP, was poured between two fibre mid-layers, the purpose being
to decrease the gel time of the resin. The interlayer thickness was controlled mainly
by the amount and viscosity of the toughened resins. A low viscosity layer, which is
usually the state of the toughened resin after the preparation procedure, cannot with-
stand the pressure during the rest of the laminate fabrication causing fiber immersion
into the liquid layer producing an inconsistent interlayer thickness after solidification.
Therefore, there was a need for a prolonged manufacturing procedure (after pouring the
modified resin) of at least 45 minutes which was found to be the time required for the
interlayer to become viscous enough to withstand the pressure and maintain consistent
thickness during the rest of the fabrication. After pouring the toughened resin and
forming the interlayer, the process paused for a defined period of time (approximately
45-50 minutes). This resulted in sufficient styrene solvent evaporation from the inter-
MODE I DELAMINATION OF INTERLAYERED COMPOSITES 78
layer, thus increasing its viscosity to the point where the rest of the process could be
continued without damaging its consistency. Following the above process, three groups
of laminates were made with interlayer thicknesses of 150-200, 250-300 and 450-500µm.
The interlayer thickness measurement procedure will be explained later. A piece of
aluminum film, 15µm thick and 57mm long, was inserted in the toughened interlayers
to simulate a starting defect. At the end of the lay up procedure, a caul plate was
placed on top of the laminate to ensure uniform thickness. After that, a vacuum bag
was applied so that the laminate cured under atmospheric pressure and room temper-
ature. After an initial room temperature cure in the vacuum bag, each laminate was
post-cured at 90◦C for 4 hours, to ensure uniform laminate properties.
This manufacturing procedure gave test laminates of thicknesses between 5.2 and
5.5mm, while the fiber volume fraction (Vf ) for each specimen was calculated using
Equation (3.1). Hence, the fiber volume fraction can be roughly estimated to be be-
tween 53% and 50%, as the formula does not take into account the existence of the
interlayers.
4.1.2 Testing procedures
Interlayer thickness and particle distribution measurements
Prior to the mode I and mode II testing of the composite specimens, interlayer thickness
and particle distribution measurements were conducted. For this purpose, three spec-
imens from each laminate were polished along the edges and ten optical micrographs,
in the form of digital images, were taken in front of the insert film tip covering a length
of approximately 10mm. This zone, being the crack initiation region, is believed to be
of the major importance during delamination testing [97]
For the interlayer thickness assessment, three measurements were taken from each
MODE I DELAMINATION OF INTERLAYERED COMPOSITES 79
image producing overall thirty measurements per specimen. Accordingly, three ranges
of interlayer thickness were identified: 150-200, 250-300 and 450-500µm, with a stan-
dard deviation of around 50µm. The limitations of the manufacturing procedure gave a
lower bound on the layer thickness of 150µm, which was the lowest possible level where
the interlayers could maintain their consistency in thickness during the manufacturing.
For the same reason, interlayer thicknesses were grouped within ranges of 50µm ranges,
since this was the accuracy level of the manufacturing process.
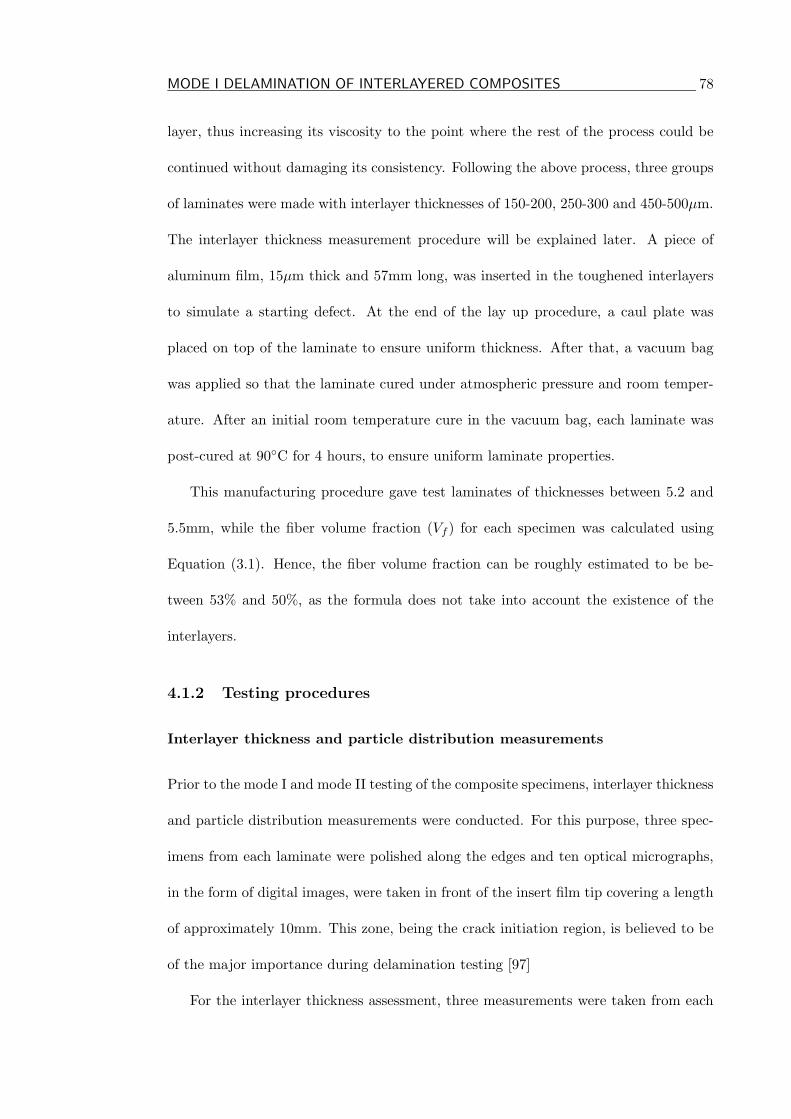
The same digital images were used to determine the particle concentration after
curing, by using image processing procedures that involved separation of the interlayer
areas from the original digital images and subsequent ’cleaning’ of such images produc-
ing the surface of the interlayers (white pixels) filled with the particles (black pixels), as
shown in Figure 4.1. The ’cleaning’ procedure was conducted using Adobe Photoshop.
Finally, the number of black pixels divided by total number of pixels (i.e. the whole
image area) gave an average percentage of the particles in the interlayer or an average
areal particle density.
Mode I DCB testing
For measuring mode I fracture toughness of the interlayered composite specimens the
standard Double Cantilever Beam (DCB) geometry was used together with the testing
procedure explained in Chapter 3. Some of the specimens were pre-cracked under mode
I fatigue loading until the pre-crack length was between 2 and 5mm.
MODE I DELAMINATION OF INTERLAYERED COMPOSITES 80
Figure 4.1: Initial digital image of the layer and image ready for the analysis of the particledensity after the cleaning procedure
4.1.3 Results and discussion
Particle distribution measurements
It was found in Chapter 2 that an actual ABS content, quoted as a percentage added
by weight or volume, does not accurately represent the actual particle concentration
in the interlayers after cure due to butadiene dissolution. Therefore, digital images
taken by the optical microscope were used to determine the particle distribution and
particle concentration inside the interlayers more accurately. The results are shown in
Figure 4.2.
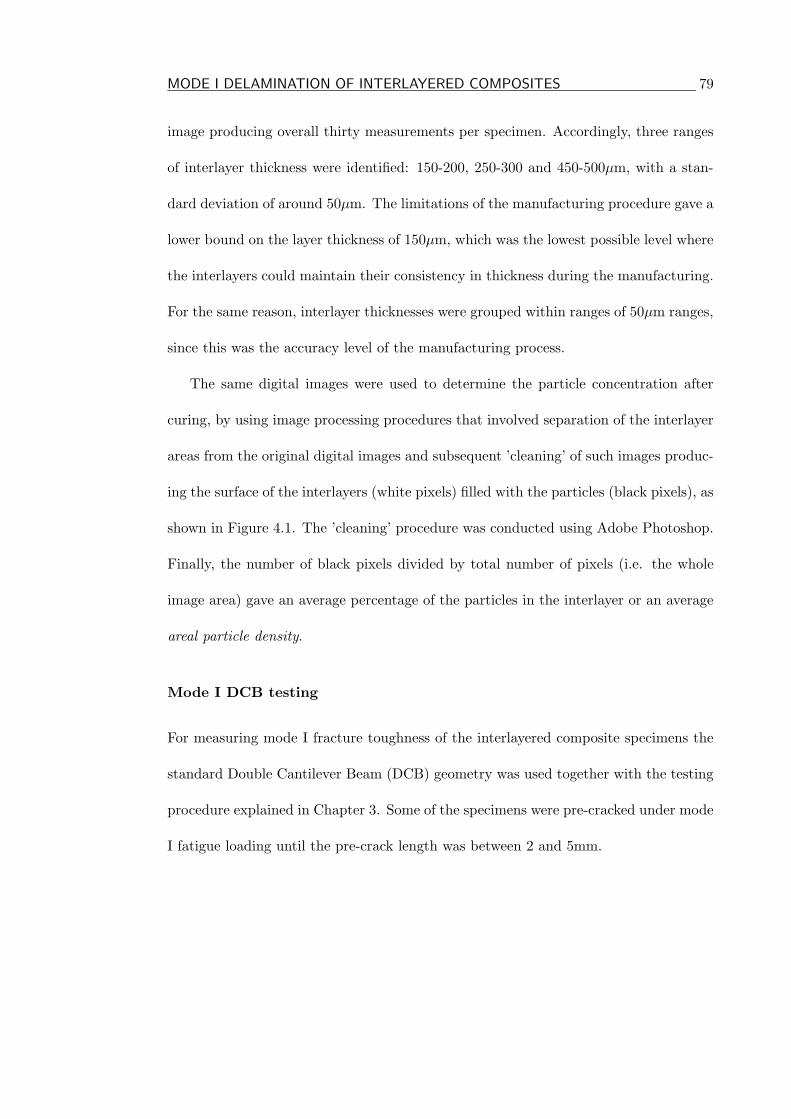
Without any chemical reactions between the constituents, a linear trend between
the ABS weight percentage and areal particle density should occur. However Figure 4.2
indicates that there is a change in the initial linear trend after the 7% of ABS addition,
supporting the existence of butadiene saturation point in this region. After this point
there is clearly more particles visible in the interlayers as a consequence of the cessation
MODE I DELAMINATION OF INTERLAYERED COMPOSITES 81
0
5
10
15
20
25
30
0 2 4 6 8 10 12 14 16
ABS [phr]
AB
Sar
eal
den
sity
[%]
projection
of the initial trend
saturation point
Figure 4.2: Weight ABS% as a function of the measured areal particle density - change ofthe initial slope is visible at the 7 wt.% of ABS, defining the saturation point
of the butadiene transition from the ABS into the VE.
These results highlighted the importance of the areal particle density over the weight
content. Therefore, in the following text instead of 3.5, 7, 11 and 15 weight % of ABS,
5, 10, 20 and 27 areal % will be used, respectively, as a more accurate representation
of the ABS particle content in the interlayers.
Mode I DCB testing
The results in Chapter 2 obtained from the tensile and fracture toughness testing of the
VE/ABS blends indicated that they had significant toughening potential. However, it
is known that good resin-to-interlayered-composite toughness transfer predominantly
depends on the interlayer thickness [107]. Also, the calculated particle areal density was
expected to influence the mode I composite’s fracture toughness in a similar fashion to
that obtained for the bulk material.
MODE I DELAMINATION OF INTERLAYERED COMPOSITES 82
As shown by Compston and Jar [108], neat VE 8084 is a viscoelastic polymer that
usually exhibits a decrease in fracture toughness with increasing strain rate. This is
important since the mode I fracture toughness tests for neat plastics and composites
are conducted on different cross-head speeds, 10mm/min and 1-2mm/min, respectively,
as required by the associated testing standards. At the same time it was noticed [108]
that rubber modification of the VE 8084 diminishes its strain rate sensitivity. Hence, it
can be assumed that VE/ABS blends with low rubber content would have a strain rate
sensitivity similar to that of the neat VE, while an eventual drop in the VE strain rate
sensitivity would occur after the defined butadiene saturation point, when the volume
of the added rubber is significantly higher than below this point. This conclusion will
be used to explain some of the results in the following text.
Particle influence on crack stability
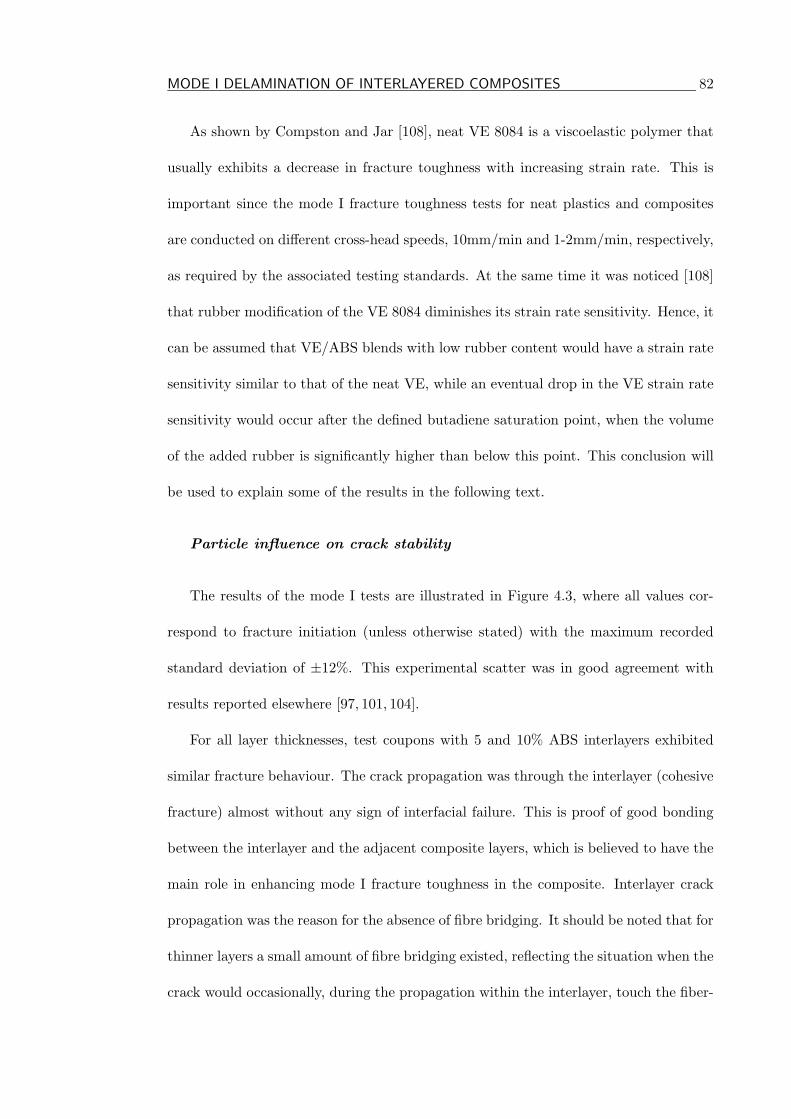
The results of the mode I tests are illustrated in Figure 4.3, where all values cor-
respond to fracture initiation (unless otherwise stated) with the maximum recorded
standard deviation of ±12%. This experimental scatter was in good agreement with
results reported elsewhere [97, 101, 104].
For all layer thicknesses, test coupons with 5 and 10% ABS interlayers exhibited
similar fracture behaviour. The crack propagation was through the interlayer (cohesive
fracture) almost without any sign of interfacial failure. This is proof of good bonding
between the interlayer and the adjacent composite layers, which is believed to have the
main role in enhancing mode I fracture toughness in the composite. Interlayer crack
propagation was the reason for the absence of fibre bridging. It should be noted that for
thinner layers a small amount of fibre bridging existed, reflecting the situation when the
crack would occasionally, during the propagation within the interlayer, touch the fiber-
MODE I DELAMINATION OF INTERLAYERED COMPOSITES 83
0
200
400
600
800
1000
1200
0 5 10 15 20 25 30
ABS areal density [%]
GIc
[J/m
2]
150-200
250-300
450-500
propagation values
layer thickness [�m]
Figure 4.3: Mode I fracture toughness as a function of ABS % and layer thickness
interlayer interface. Fibre bridging in non-interlayered unidirectional fiber composites
serves mainly as a crack-speed-decreasing mechanism, causing slow and stable crack
propagation. Accordingly, its absence in the tested interlayered composites produced
unstable crack growth and the stick-slip fracture behaviour, where the crack was only
occasionally arrested by ABS particles and forced to propagate in the stable fashion
between two unstable jumps. Also, it was observed that crack instability was more
significant in the 5% than in the 10% ABS interlayers. The latter exhibited more
prolonged zones of the stable propagation than those found in specimens with 5% ABS
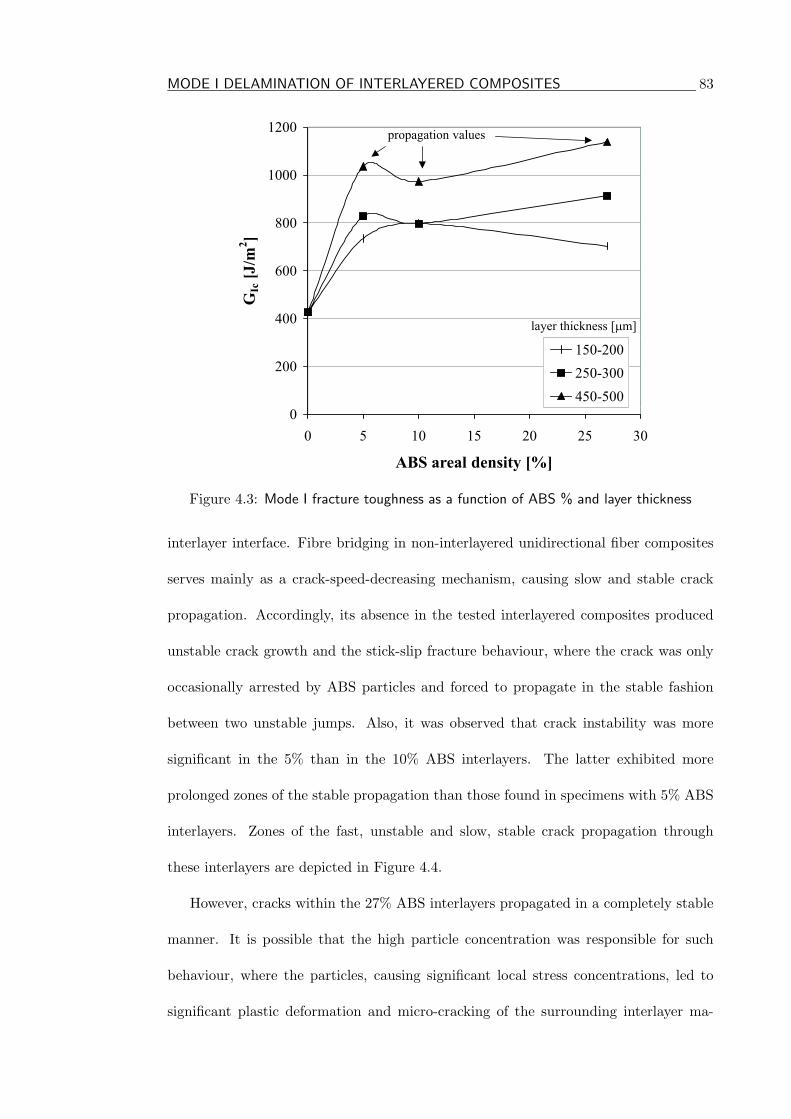
interlayers. Zones of the fast, unstable and slow, stable crack propagation through
these interlayers are depicted in Figure 4.4.
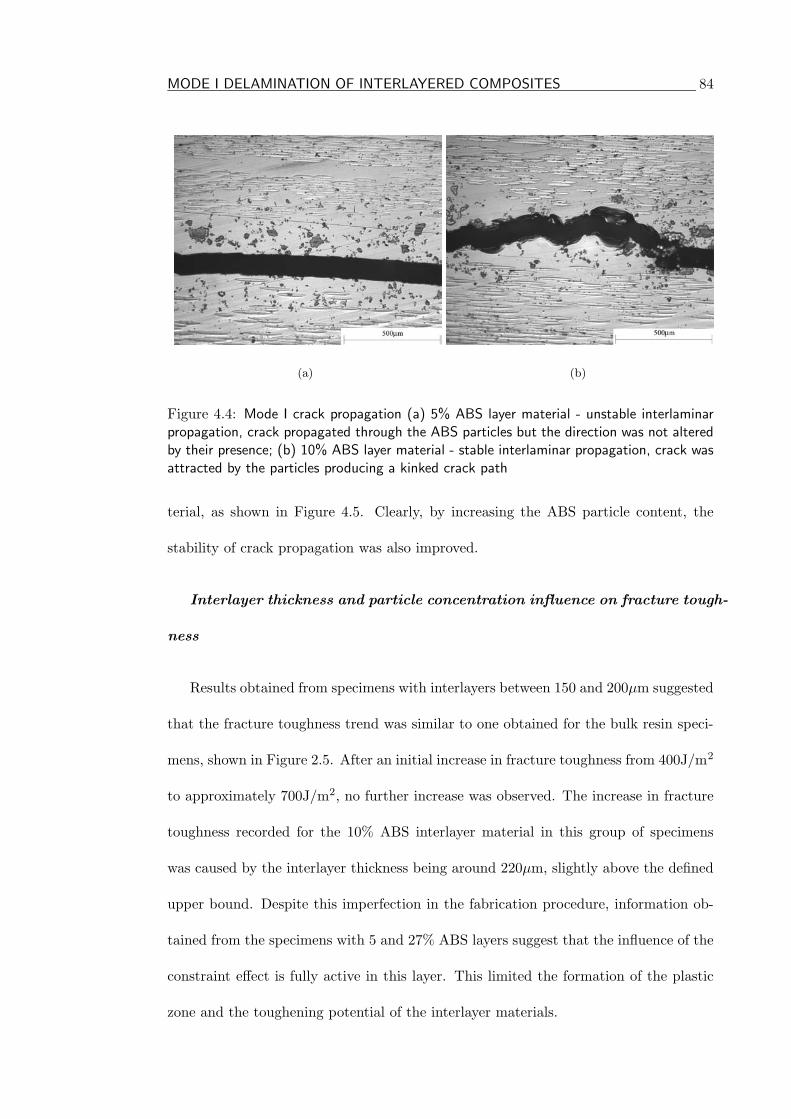
However, cracks within the 27% ABS interlayers propagated in a completely stable
manner. It is possible that the high particle concentration was responsible for such
behaviour, where the particles, causing significant local stress concentrations, led to
significant plastic deformation and micro-cracking of the surrounding interlayer ma-
MODE I DELAMINATION OF INTERLAYERED COMPOSITES 84
(a) (b)
Figure 4.4: Mode I crack propagation (a) 5% ABS layer material - unstable interlaminarpropagation, crack propagated through the ABS particles but the direction was not alteredby their presence; (b) 10% ABS layer material - stable interlaminar propagation, crack wasattracted by the particles producing a kinked crack path
terial, as shown in Figure 4.5. Clearly, by increasing the ABS particle content, the
stability of crack propagation was also improved.
Interlayer thickness and particle concentration influence on fracture tough-
ness
Results obtained from specimens with interlayers between 150 and 200µm suggested
that the fracture toughness trend was similar to one obtained for the bulk resin speci-
mens, shown in Figure 2.5. After an initial increase in fracture toughness from 400J/m2
to approximately 700J/m2, no further increase was observed. The increase in fracture
toughness recorded for the 10% ABS interlayer material in this group of specimens
was caused by the interlayer thickness being around 220µm, slightly above the defined
upper bound. Despite this imperfection in the fabrication procedure, information ob-
tained from the specimens with 5 and 27% ABS layers suggest that the influence of the
constraint effect is fully active in this layer. This limited the formation of the plastic
zone and the toughening potential of the interlayer materials.
MODE I DELAMINATION OF INTERLAYERED COMPOSITES 85
Figure 4.5: Mode I fracture of the 27% ABS layer 500µm thick - high particle concentrationcaused severe damage of the layer material by producing secondary cracking
The specimens containing interlayers of between 250 and 300µm exhibited an in-
crease in toughness for all particle concentrations. This illustrated that the constraint
effect was weakened by increasing the volume of the material that can undergo plastic
deformation. This group of specimens exhibited a fracture toughness trend similar to
that established for the bulk resin materials. However, 5 and 10% ABS layer materials
exceeded their bulk material toughness due to a possible strain rate sensitivity, while
the 27% ABS layer remained at a level of 20% below the bulk material toughness. The
latter could be governed by two things: firstly by the presumed strain rate insensitivity
of this high rubber content VE/ABS blend and secondly, by the constraint effect.
For specimens with interlayer thicknesses between 450 and 500µm, full development
of the plastic zone was expected, diminishing the constraint effect influence and eventu-
ally, matching the fracture toughness of the bulk material (in the case of the 27% ABS
interlayer). Initially, the data reduction for this specimen set was conducted using the
fracture toughness initiation values (as suggested by the ASTM standard [97]). The
MODE I DELAMINATION OF INTERLAYERED COMPOSITES 86
5 and 10% ABS interlayers gave the maximum fracture toughness for this interlayer
thickness of around 1000J/m2. However specimens containing 27% ABS resulted in the
same fracture toughness as for the previous interlayer thickness, of around 900J/m2,
while the propagation value of GIc was almost identical to the expected bulk mate-
rial toughness of 1200J/m2. This non-negligible difference between the initiation and
propagation values was not present with the lower ABS content specimens. They had
almost identical fracture toughness values for any crack length due to the absence of the
fibre bridging at this level of the interlayer thickness. However, even with some fiber
bridging observed within the thinnest interlayers, the difference between initiation and
propagation toughness was not as large as for the 500µm - 27% ABS interlayer. Fig-
ure 4.5 depicts the crack propagation through this interlayer, illustrating how this high
ABS particle content invoked extensive multi-cracking and significant crack bifurcation
in the crack propagation zone. This produced a multi-crack configuration where the
whole area of the interlayer underwent irreversible deformation, absorbing a significant
amount of fracture energy. However, in the initiation zone, due to the film insert, only
a single crack can exist, resulting eventually in lower fracture toughness values due to
the single plastic zone around the insert tip. Also, preparation of the neat resin (SENB)
specimens involved tapping of the razor blade to produce the required pre-crack. This
procedure, however carefully conducted, could cause severe crack blunting through the
microcracking due to the high particle concentration. A consequence of this could be
a multi-crack configuration in the SENB specimen, similar to those found in the crack
propagation zones in the DCB specimens. Hence, the propagation values were chosen
to represent the fracture toughness trend of the 500µm layers, being completely free
from the film insert influence on the fracture toughness.
MODE I DELAMINATION OF INTERLAYERED COMPOSITES 87
Scanning electron microscopy
Fracture surfaces of several specimens were also examined using a SEM to provide
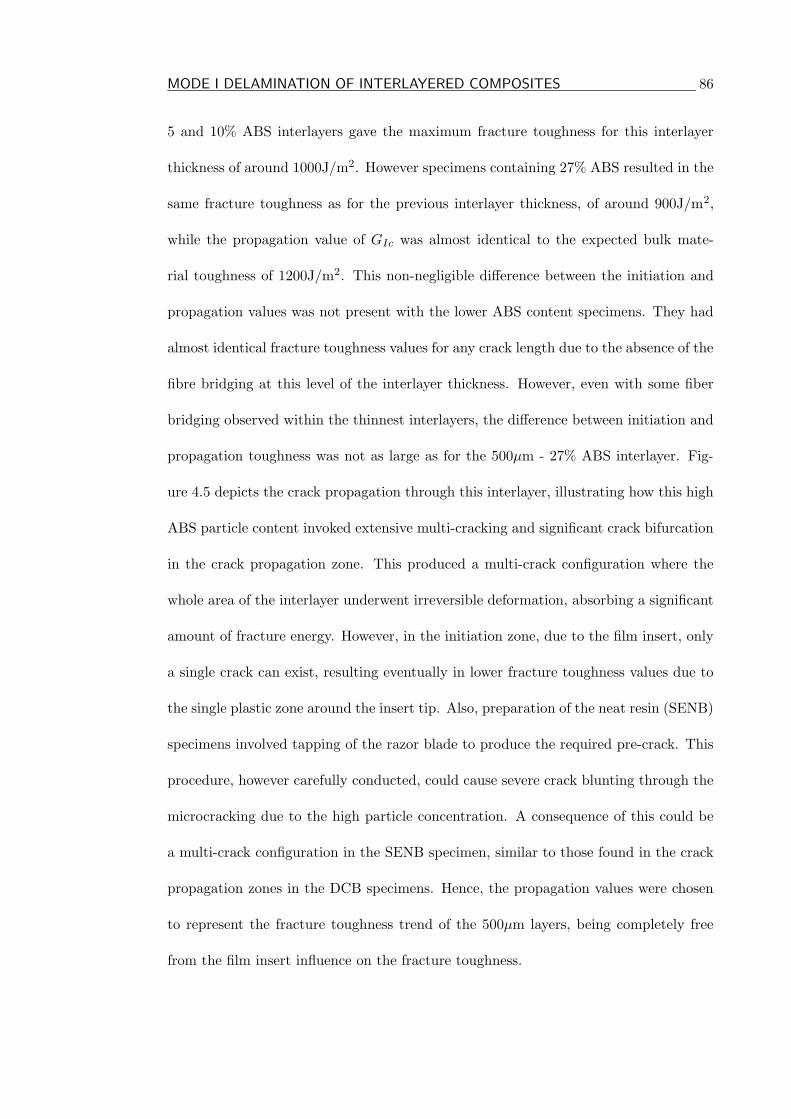
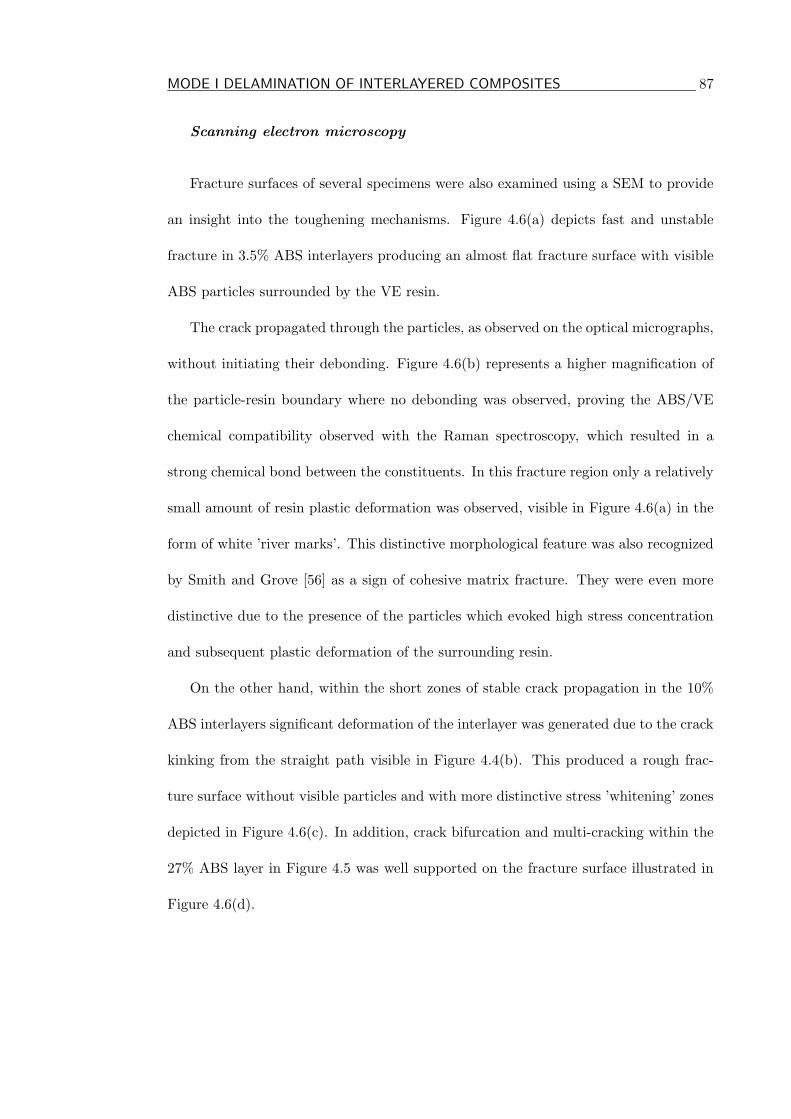
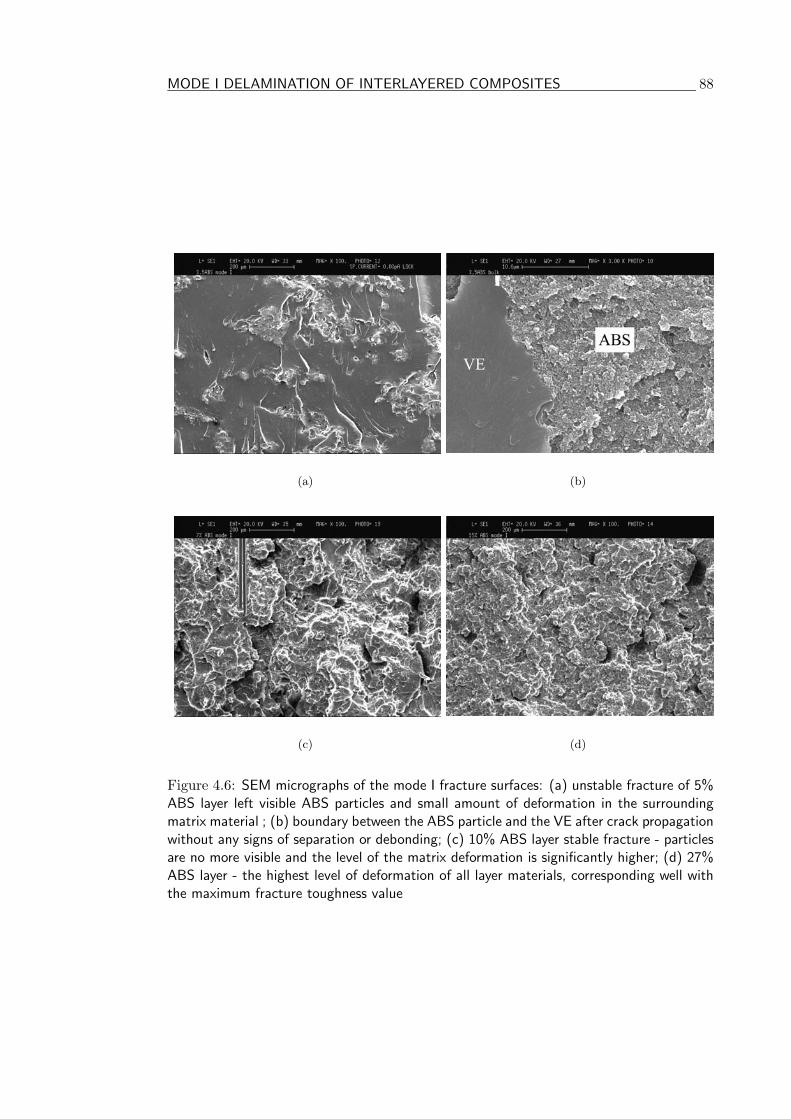
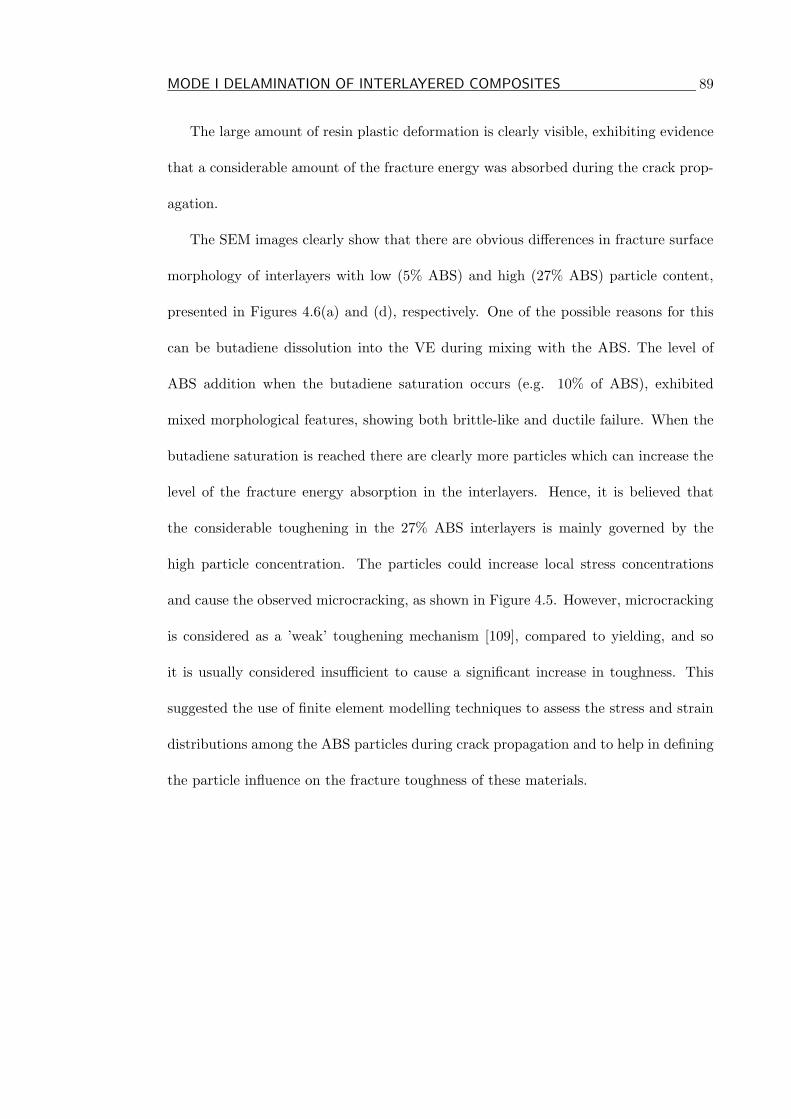
an insight into the toughening mechanisms. Figure 4.6(a) depicts fast and unstable
fracture in 3.5% ABS interlayers producing an almost flat fracture surface with visible
ABS particles surrounded by the VE resin.
The crack propagated through the particles, as observed on the optical micrographs,
without initiating their debonding. Figure 4.6(b) represents a higher magnification of
the particle-resin boundary where no debonding was observed, proving the ABS/VE
chemical compatibility observed with the Raman spectroscopy, which resulted in a
strong chemical bond between the constituents. In this fracture region only a relatively
small amount of resin plastic deformation was observed, visible in Figure 4.6(a) in the
form of white ’river marks’. This distinctive morphological feature was also recognized
by Smith and Grove [56] as a sign of cohesive matrix fracture. They were even more
distinctive due to the presence of the particles which evoked high stress concentration
and subsequent plastic deformation of the surrounding resin.
On the other hand, within the short zones of stable crack propagation in the 10%
ABS interlayers significant deformation of the interlayer was generated due to the crack
kinking from the straight path visible in Figure 4.4(b). This produced a rough frac-
ture surface without visible particles and with more distinctive stress ’whitening’ zones
depicted in Figure 4.6(c). In addition, crack bifurcation and multi-cracking within the
27% ABS layer in Figure 4.5 was well supported on the fracture surface illustrated in
Figure 4.6(d).
MODE I DELAMINATION OF INTERLAYERED COMPOSITES 88
(a) (b)
(c) (d)
Figure 4.6: SEM micrographs of the mode I fracture surfaces: (a) unstable fracture of 5%ABS layer left visible ABS particles and small amount of deformation in the surroundingmatrix material ; (b) boundary between the ABS particle and the VE after crack propagationwithout any signs of separation or debonding; (c) 10% ABS layer stable fracture - particlesare no more visible and the level of the matrix deformation is significantly higher; (d) 27%ABS layer - the highest level of deformation of all layer materials, corresponding well withthe maximum fracture toughness value
MODE I DELAMINATION OF INTERLAYERED COMPOSITES 89
The large amount of resin plastic deformation is clearly visible, exhibiting evidence
that a considerable amount of the fracture energy was absorbed during the crack prop-
agation.
The SEM images clearly show that there are obvious differences in fracture surface
morphology of interlayers with low (5% ABS) and high (27% ABS) particle content,
presented in Figures 4.6(a) and (d), respectively. One of the possible reasons for this
can be butadiene dissolution into the VE during mixing with the ABS. The level of
ABS addition when the butadiene saturation occurs (e.g. 10% of ABS), exhibited
mixed morphological features, showing both brittle-like and ductile failure. When the
butadiene saturation is reached there are clearly more particles which can increase the
level of the fracture energy absorption in the interlayers. Hence, it is believed that
the considerable toughening in the 27% ABS interlayers is mainly governed by the
high particle concentration. The particles could increase local stress concentrations
and cause the observed microcracking, as shown in Figure 4.5. However, microcracking
is considered as a ’weak’ toughening mechanism [109], compared to yielding, and so
it is usually considered insufficient to cause a significant increase in toughness. This
suggested the use of finite element modelling techniques to assess the stress and strain
distributions among the ABS particles during crack propagation and to help in defining
the particle influence on the fracture toughness of these materials.
MODE I DELAMINATION OF INTERLAYERED COMPOSITES 90
4.2 Finite element analysis of mode I delamination
Based on the experimental results, two types of FEA models were developed. The inter-
layers below the butadiene saturation point were modelled as homogeneous materials,
possessing properties of the VE/ABS blends with 5% and 10% of ABS. The 27% ABS
interlayer was modelled as a bi-phase material, a combination of matrix having the
properties of the VE/10% ABS blend and ABS particles, covering 27% of the interlayer
surface. All interlayers were modelled as elastic-plastic materials by using the Von-
Mises yielding criterion, while the remaining material was modelled as a linear-elastic
orthotropic material. According to the experiments, delamination occurred within in-
terlayers, being solely governed by their configuration and properties, whilst the rest
of the composite acted through the constraint effect. Crack/particle interactions were
examined by employing an elastic-plastic crack propagation FEA algorithm without
having a predefined crack path.
4.2.1 Assessment of the plastic zone shape and size
The main objective of this analysis is to obtain an insight into plastic zone formation
processes in front of the initial crack tip. The experiments proved that the constraint
effect imposed upon the plastic zone can significantly limit fracture toughness. Al-
though the constraint effect was recorded during the testing, its explicit influence on
the plastic zone could not be captured by the subsequent microscopic analysis. Also,
it remained unclear if or how ABS particles influence plastic zone development.
MODE I DELAMINATION OF INTERLAYERED COMPOSITES 91
Plastic zone development within 200 and 500µm interlayers below the bu-
tadiene saturation point
All FEA models were built to represent the geometry of the standard DCB specimen.
However, the region in front of the initial crack tip was 20mm long, instead of usual
70mm. This reduced the number of elements in the FEA models without influencing
the accuracy of the solution, since the region of interest in this analysis was limited
to the zone in vicinity of the crack tip. The initial crack was introduced as a gap of
20µm, having a semi-circular blunt tip and positioned in the mid plane of the specimen
(i.e. inside the interlayer). This realistically simulated the geometry of the aluminum
foil starter crack. This approach to modelling of the insert film insert served to obtain
more accurate stress distributions around the crack tip. Symmetry of the DCB spec-
imen geometry was used in the FEA models to further reduce the number of degrees
of freedom. Only half of the specimen was modelled with boundary conditions that
restrained vertical displacement along the symmetry line, while the end of the model
without the crack was fixed in both directions. Loading imposed upon the models was
gradually increased from 30 to 60N, which was the average load at the point of crack
initiation obtained from the experiments.
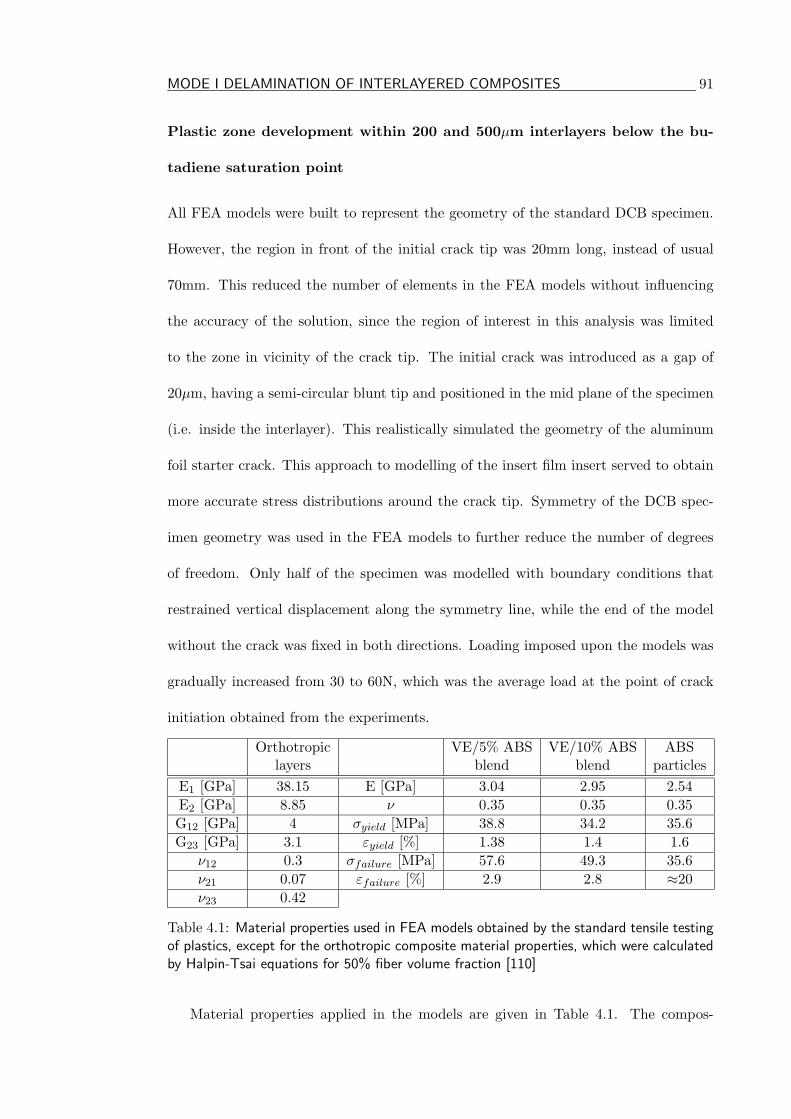
Orthotropic VE/5% ABS VE/10% ABS ABSlayers blend blend particles
E1 [GPa] 38.15 E [GPa] 3.04 2.95 2.54E2 [GPa] 8.85 ν 0.35 0.35 0.35G12 [GPa] 4 σyield [MPa] 38.8 34.2 35.6G23 [GPa] 3.1 εyield [%] 1.38 1.4 1.6
ν12 0.3 σfailure [MPa] 57.6 49.3 35.6ν21 0.07 εfailure [%] 2.9 2.8 ≈20ν23 0.42
Table 4.1: Material properties used in FEA models obtained by the standard tensile testingof plastics, except for the orthotropic composite material properties, which were calculatedby Halpin-Tsai equations for 50% fiber volume fraction [110]
Material properties applied in the models are given in Table 4.1. The compos-
MODE I DELAMINATION OF INTERLAYERED COMPOSITES 92
ite material properties, having 50% fiber volume fraction, were determined by using
Halpin-Tsai equations [110]. The properties of the VE/ABS blends, neat ABS and
VE were obtained from the tensile testing program. The modelled composite speci-
men contained a 200 or 500µm homogeneous elastic-plastic interlayer surrounded by
linear-elastic orthotropic vinyl-ester/glass composite plies. The interlayer properties
were modelled by the von Mises yielding criterion and strain-hardening properties of
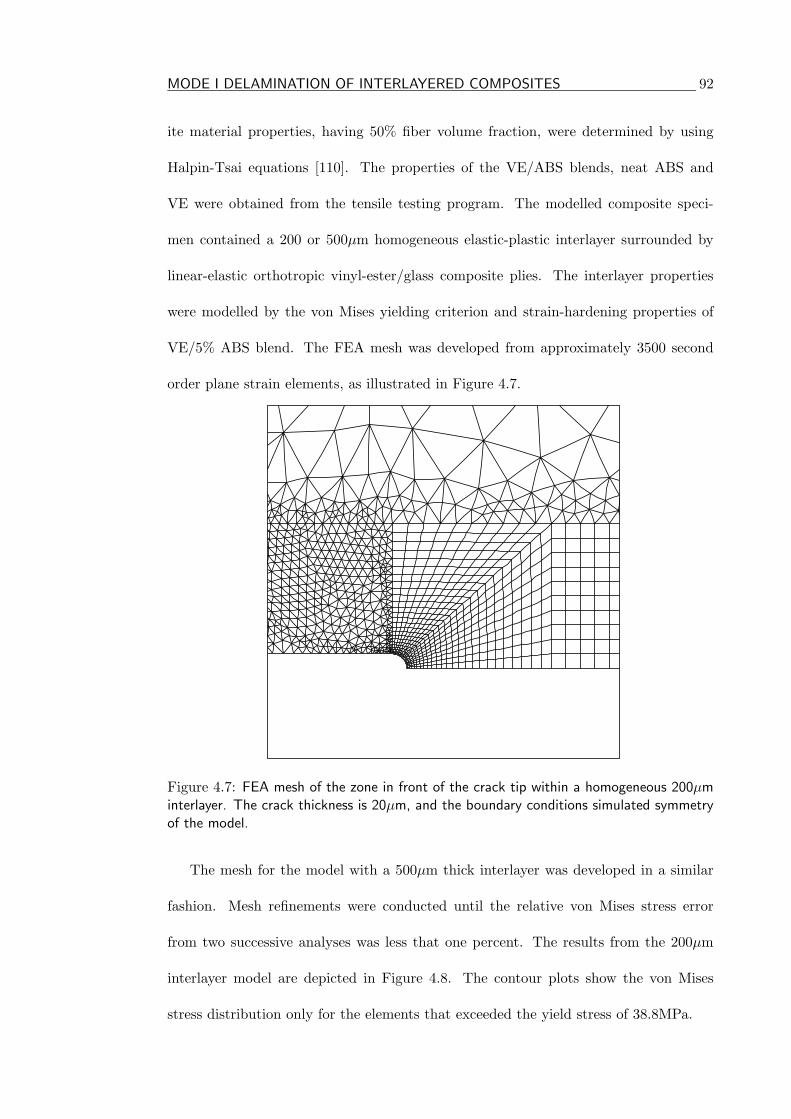
VE/5% ABS blend. The FEA mesh was developed from approximately 3500 second
order plane strain elements, as illustrated in Figure 4.7.
Figure 4.7: FEA mesh of the zone in front of the crack tip within a homogeneous 200µminterlayer. The crack thickness is 20µm, and the boundary conditions simulated symmetryof the model.
The mesh for the model with a 500µm thick interlayer was developed in a similar
fashion. Mesh refinements were conducted until the relative von Mises stress error
from two successive analyses was less that one percent. The results from the 200µm
interlayer model are depicted in Figure 4.8. The contour plots show the von Mises
stress distribution only for the elements that exceeded the yield stress of 38.8MPa.
MODE I DELAMINATION OF INTERLAYERED COMPOSITES 93
36.62
43.60
50.58
57.56
64.54
71.52
78.50
85.48
92.46
99.44
106.4
�vm[MPa]
(a) 30N
33.33
43.44
53.56
63.67
73.78
83.89
94.00
104.1
114.2
124.3
134.4
�vm[MPa]
(b) 40N
34.71
47.59
60.46
73.33
86.20
99.07
111.9
124.8
137.7
150.6
163.4
�vm[MPa]
(c) 50N
�vm[MPa]
33.61
49.56
65.51
81.45
97.40
113.3
129.3
145.2
161.2
177.1
193.1
(d) 60N
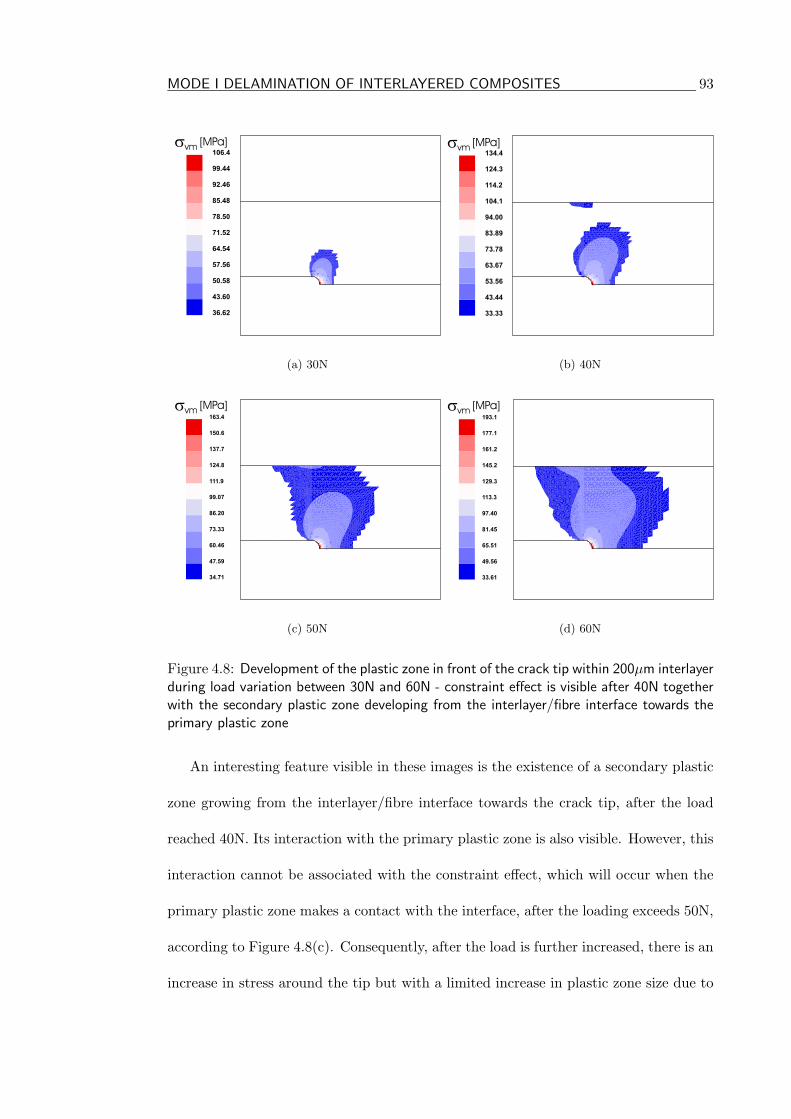
Figure 4.8: Development of the plastic zone in front of the crack tip within 200µm interlayerduring load variation between 30N and 60N - constraint effect is visible after 40N togetherwith the secondary plastic zone developing from the interlayer/fibre interface towards theprimary plastic zone
An interesting feature visible in these images is the existence of a secondary plastic
zone growing from the interlayer/fibre interface towards the crack tip, after the load
reached 40N. Its interaction with the primary plastic zone is also visible. However, this
interaction cannot be associated with the constraint effect, which will occur when the
primary plastic zone makes a contact with the interface, after the loading exceeds 50N,
according to Figure 4.8(c). Consequently, after the load is further increased, there is an
increase in stress around the tip but with a limited increase in plastic zone size due to
MODE I DELAMINATION OF INTERLAYERED COMPOSITES 94
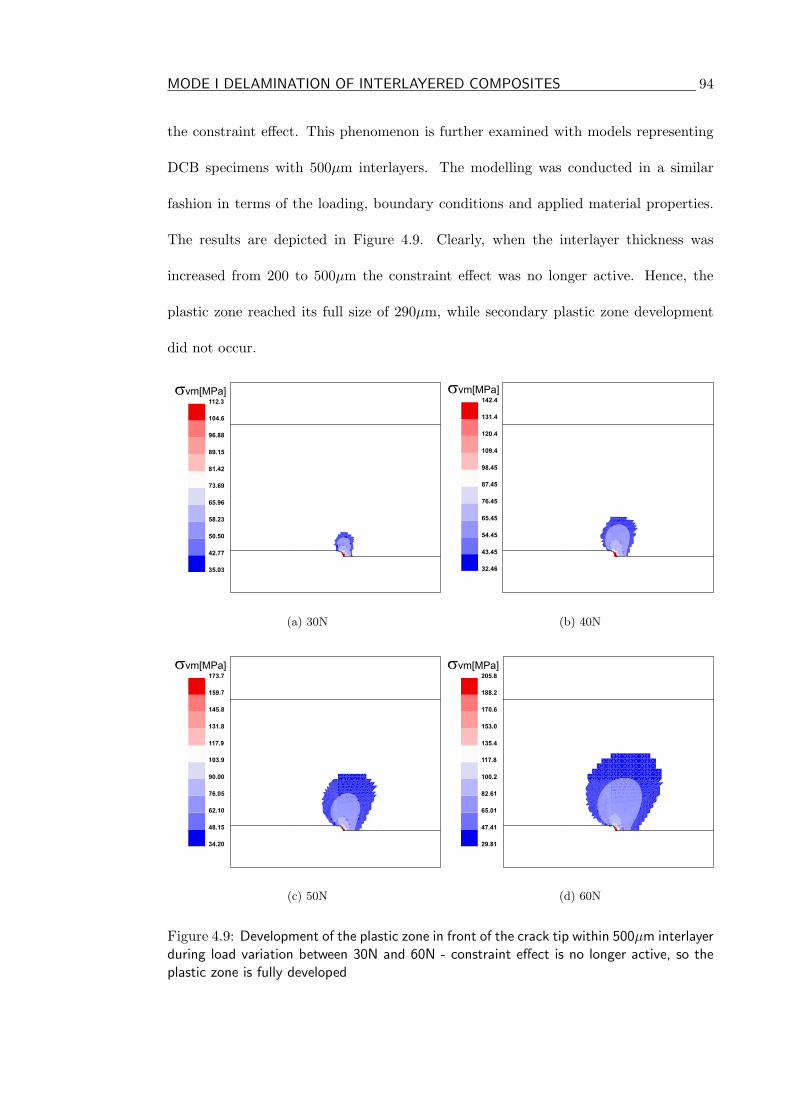
the constraint effect. This phenomenon is further examined with models representing
DCB specimens with 500µm interlayers. The modelling was conducted in a similar
fashion in terms of the loading, boundary conditions and applied material properties.
The results are depicted in Figure 4.9. Clearly, when the interlayer thickness was
increased from 200 to 500µm the constraint effect was no longer active. Hence, the
plastic zone reached its full size of 290µm, while secondary plastic zone development
did not occur.
35.03
42.77
50.50
58.23
65.96
73.69
81.42
89.15
96.88
104.6
112.3
�vm[MPa]
(a) 30N
�vm[MPa]
32.46
43.45
54.45
65.45
76.45
87.45
98.45
109.4
120.4
131.4
142.4
(b) 40N
�vm[MPa]
34.20
48.15
62.10
76.05
90.00
103.9
117.9
131.8
145.8
159.7
173.7
(c) 50N
�vm[MPa]
29.81
47.41
65.01
82.61
100.2
117.8
135.4
153.0
170.6
188.2
205.8
(d) 60N
Figure 4.9: Development of the plastic zone in front of the crack tip within 500µm interlayerduring load variation between 30N and 60N - constraint effect is no longer active, so theplastic zone is fully developed
MODE I DELAMINATION OF INTERLAYERED COMPOSITES 95
These results indicated that there are two possible zones for the delamination gr-
pwth: interlaminar and interfacial region. Although interfacial fracture was not dom-
inant failure mode observed in the tested interlayered composites, it occasionally ex-
isted in some of the thinnest interlayers. Also, some studies on interlayered composites
[41, 61] reported a negligible mode I toughening effect due to the interfacial failure of
the interlayer.
The FEA results presented in this section indicate that the stress distribution in
the zone close to the interface can be the driving force for interfacial failure. Clearly,
there is a high stress region close to the interface which causes the formation of the
secondary plastic zone. This is possibly due to the mismatch in properties of the
interlayer and composite layers. These high stresses can initiate interfacial failure
through interaction with the primary plastic zone. This possibility is obviously higher
within thinner interlayers, since the two plastic zones can overlap and cause local stress
and strain increase. When the interlayer thickness is sufficient, there is no interaction
between two plastic zones and majority of strain energy is accumulated around the
crack tip. Experimental results from the first section of this chapter strongly support
this conclusion.
Influence of the ABS particles on the plastic zone size and shape
The testing showed that ABS particles were influencing fracture toughness beyond
the butadiene saturation point (i.e. VE/10% ABS blend and beyond). However, the
experimental results could not define the mechanisms through which the particles were
involved in fracture events, and it remained unclear as to whether or not the particles
increased the yielding potential of the interlayer material, promoted microcracking or
possibly invoked both of these two mechanisms simultaneously. If the latter is the
MODE I DELAMINATION OF INTERLAYERED COMPOSITES 96
case then which of these two mechanisms is more dominant during fracture has to be
established.
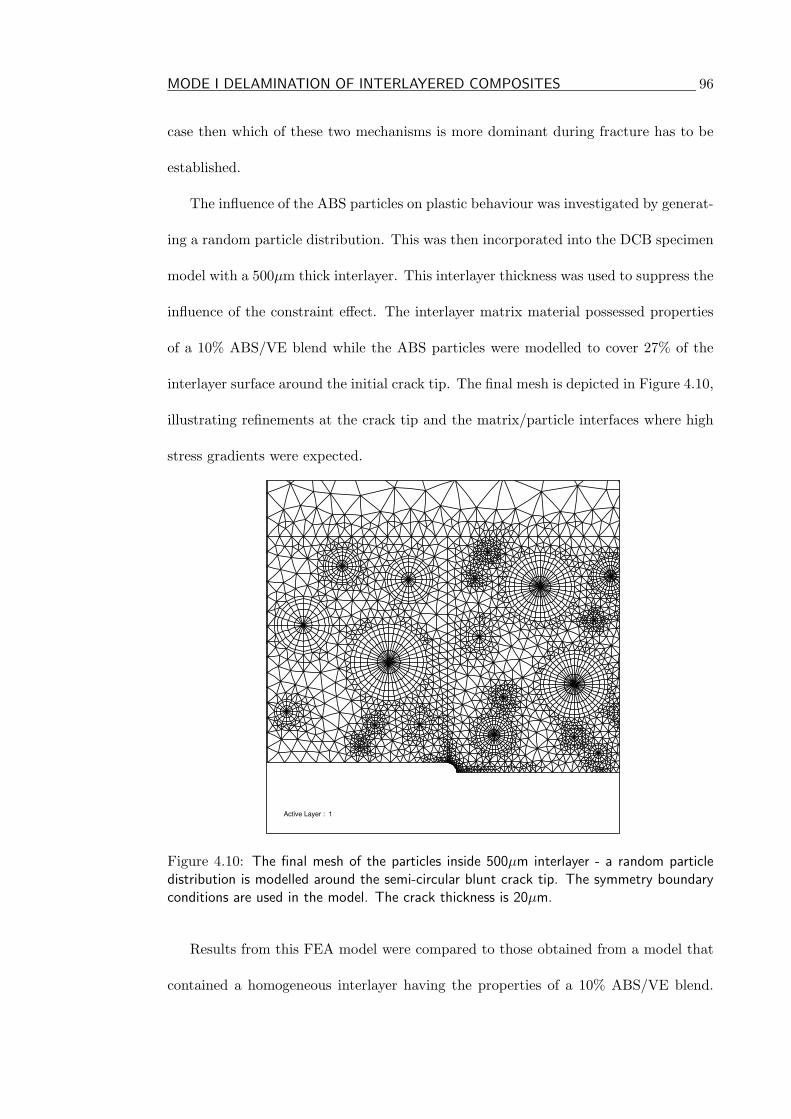
The influence of the ABS particles on plastic behaviour was investigated by generat-
ing a random particle distribution. This was then incorporated into the DCB specimen
model with a 500µm thick interlayer. This interlayer thickness was used to suppress the
influence of the constraint effect. The interlayer matrix material possessed properties
of a 10% ABS/VE blend while the ABS particles were modelled to cover 27% of the
interlayer surface around the initial crack tip. The final mesh is depicted in Figure 4.10,
illustrating refinements at the crack tip and the matrix/particle interfaces where high
stress gradients were expected.
Active Layer : 1
Figure 4.10: The final mesh of the particles inside 500µm interlayer - a random particledistribution is modelled around the semi-circular blunt crack tip. The symmetry boundaryconditions are used in the model. The crack thickness is 20µm.
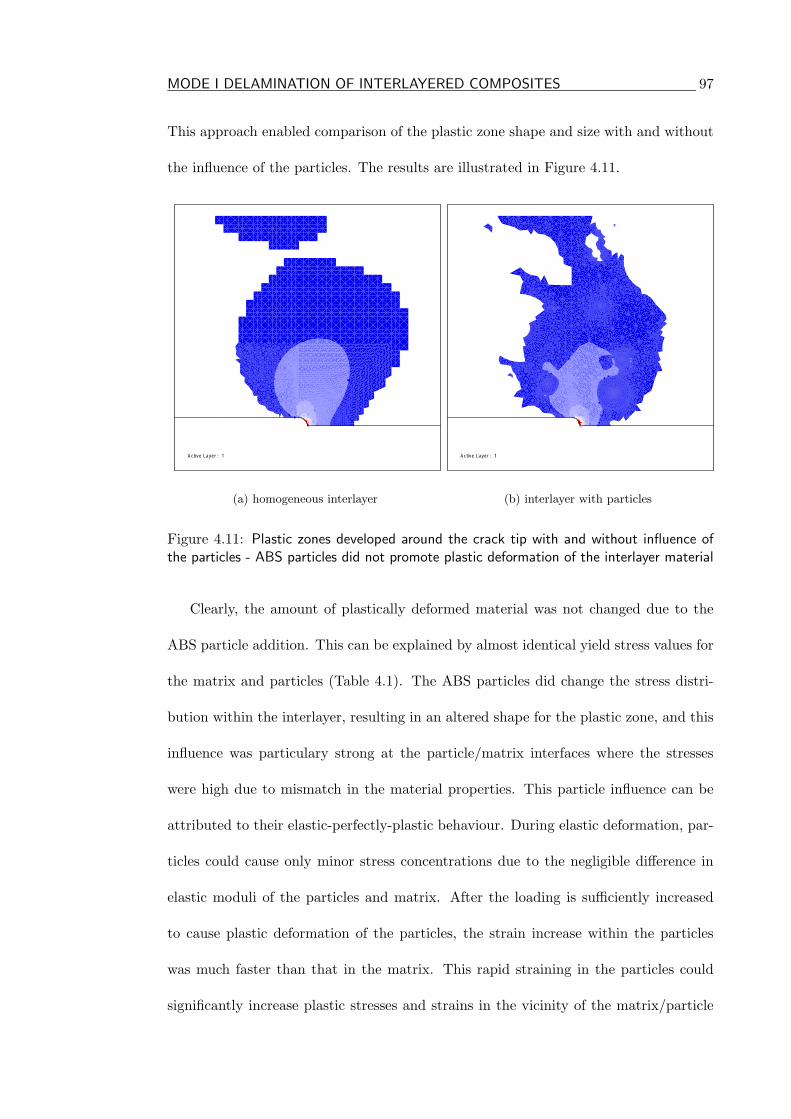
Results from this FEA model were compared to those obtained from a model that
contained a homogeneous interlayer having the properties of a 10% ABS/VE blend.
MODE I DELAMINATION OF INTERLAYERED COMPOSITES 97
This approach enabled comparison of the plastic zone shape and size with and without
the influence of the particles. The results are illustrated in Figure 4.11.
Active Layer : 1
(a) homogeneous interlayer
Active Layer : 1
(b) interlayer with particles
Figure 4.11: Plastic zones developed around the crack tip with and without influence ofthe particles - ABS particles did not promote plastic deformation of the interlayer material
Clearly, the amount of plastically deformed material was not changed due to the
ABS particle addition. This can be explained by almost identical yield stress values for
the matrix and particles (Table 4.1). The ABS particles did change the stress distri-
bution within the interlayer, resulting in an altered shape for the plastic zone, and this
influence was particulary strong at the particle/matrix interfaces where the stresses
were high due to mismatch in the material properties. This particle influence can be
attributed to their elastic-perfectly-plastic behaviour. During elastic deformation, par-
ticles could cause only minor stress concentrations due to the negligible difference in
elastic moduli of the particles and matrix. After the loading is sufficiently increased
to cause plastic deformation of the particles, the strain increase within the particles
was much faster than that in the matrix. This rapid straining in the particles could
significantly increase plastic stresses and strains in the vicinity of the matrix/particle
MODE I DELAMINATION OF INTERLAYERED COMPOSITES 98
interfaces. However, according to the experimental results, this local stress concentra-
tion was not strong enough to cause debonding of the particles. A possible scenario
of the interlayer failure under mode I loading would include microcracking of the ma-
trix and particles originated from the high stress/strain zones. The presented FEA
results contain some evidence to support this assumption but they do not include a
propagating crack, which is necessary due to changed stress distributions during crack
propagation and crack/particle interaction. Therefore, this fracture scenario will be
further explored in the following FEA analysis which will try to capture the proper
stress distribution and obtain enough evidence to explain interlayer failure.
4.2.2 Crack propagation and interaction with particles
FEA models developed for this purpose utilized linear-elastic and elastic-plastic crack
propagation algorithms. In both cases the crack is developed by automatic node sepa-
ration within the original mesh and generation of a rosette of triangular second order
elements around the crack tip. The nodal separation, usually named ’unzipping’, was
conducted in order to satisfy fracture and crack direction criteria. The former defines
when a new crack will be opened, while the latter defines where it will propagate. The
main difference between elastic and elastic-plastic case is in the definition of the crack
tip elements. For the linear-elastic stress field the crack tip elements are in the form
of second order elements with mid-side nodes at the quarter points [65]. The shape
functions developed for such an element lead to exact simulation of the 1/√
r stress
singularity at the crack tip. For the elastic-plastic simulation the singular elements do
not exist and therefore, the crack tip elements are normal second order elements. Obvi-
ously, this approach cannot accurately simulate the stress field near the crack tip but it
can be used for predicting the direction of crack propagation by using proper fracture
MODE I DELAMINATION OF INTERLAYERED COMPOSITES 99
and crack direction criteria. The crack growth algorithms for elastic and elastic-plastic
analysis are identical except in the variable mapping stage. The mapping transfers
necessary analysis variables to the new mesh after initializing a crack propagation step.
For the elastic analysis only displacements have to be mapped, while the elastic-plastic
analysis requires mapping of the complete plastic history. More details about the crack
growth models used in this study are presented in Appendix B.
Linear-elastic crack/particle interaction
Linear-elastic crack particle interaction has been well documented [83–86]. A major aim
of most of these studies was to establish various variables that can influence fracture
toughness during this fracture event, and it was found that the strongest influence
comes from the difference in Young’s modulus between the matrix (Em) and a spherical
particle (Ep). Other examined variables, like size, shape and position of the particle
were found to have only a minor influence on the critical stress intensity factor KIc.
The aim of this part of the FEA study was to examine the interaction between a
crack and an ABS particle in a linear-elastic stress field. For this purpose a spherical
particle was embedded within a model of the single-edge-notched-bend (SENB) spec-
imen used for measuring mode I fracture toughness of neat plastics, and the model
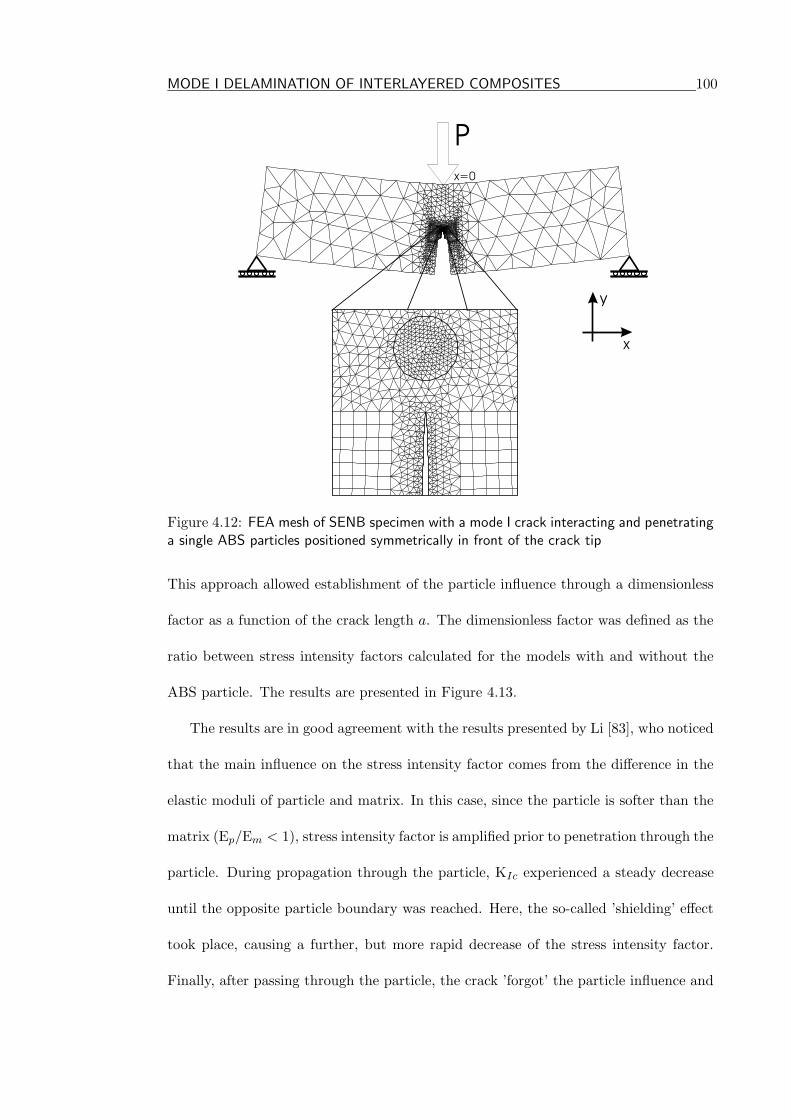
configuration was depicted in Figure 4.12.
The particle had a radius of 50µm and it was positioned in front of the crack tip at
the distance of 50µm. The model contained 5126 plane strain second order elements
and it was constrained in order to simulate the three-point-bend SENB test fixture, as
illustrated in Figure 4.12. The crack was driven through the particle and the critical
stress intensity factor KIc was recorded during the analysis, while the results were
compared to those obtained from a homogeneous SENB model (i.e. without a particle).
MODE I DELAMINATION OF INTERLAYERED COMPOSITES 100
P
x=0
x
y
Figure 4.12: FEA mesh of SENB specimen with a mode I crack interacting and penetratinga single ABS particles positioned symmetrically in front of the crack tip
This approach allowed establishment of the particle influence through a dimensionless
factor as a function of the crack length a. The dimensionless factor was defined as the
ratio between stress intensity factors calculated for the models with and without the
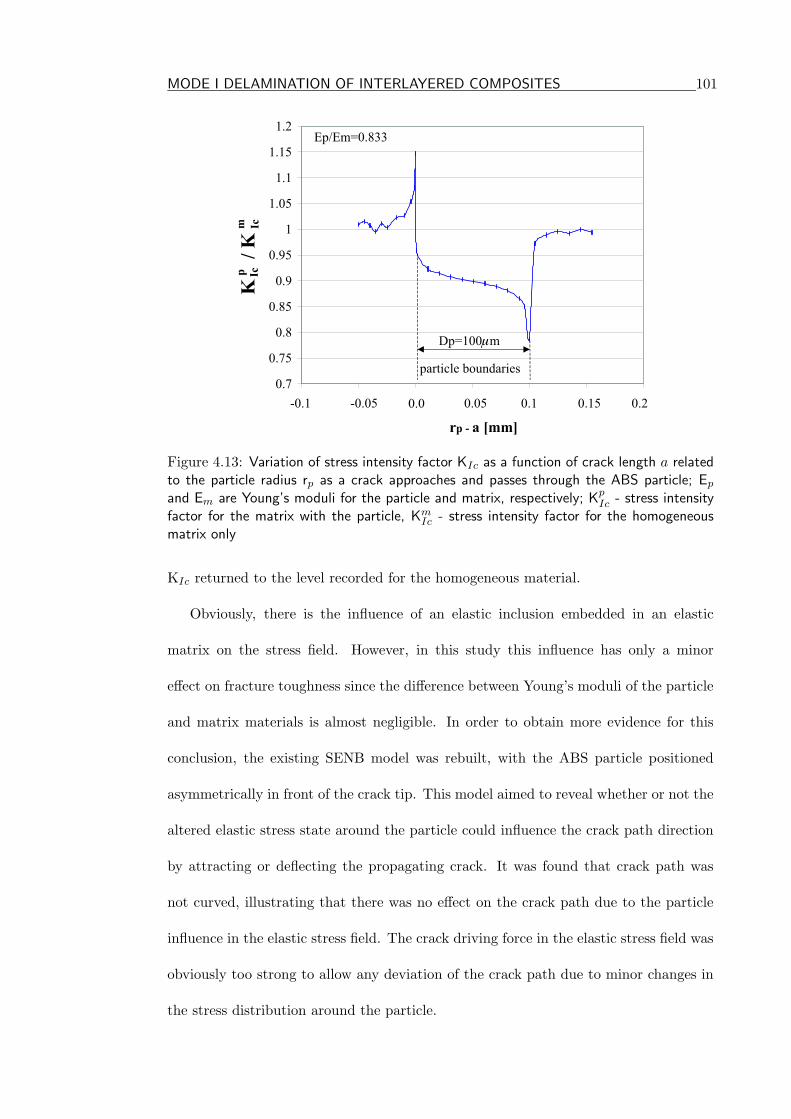
ABS particle. The results are presented in Figure 4.13.
The results are in good agreement with the results presented by Li [83], who noticed
that the main influence on the stress intensity factor comes from the difference in the
elastic moduli of particle and matrix. In this case, since the particle is softer than the
matrix (Ep/Em < 1), stress intensity factor is amplified prior to penetration through the
particle. During propagation through the particle, KIc experienced a steady decrease
until the opposite particle boundary was reached. Here, the so-called ’shielding’ effect
took place, causing a further, but more rapid decrease of the stress intensity factor.
Finally, after passing through the particle, the crack ’forgot’ the particle influence and
MODE I DELAMINATION OF INTERLAYERED COMPOSITES 101
0.7
0.75
0.8
0.85
0.9
0.95
1
1.05
1.1
1.15
1.2
-0.1 -0.05 0.0 0.05 0.1 0.15 0.2
r a [mm]p -
particle boundaries
Dp=100�m
Ep/Em=0.833
IcpK
Icm/
K
Figure 4.13: Variation of stress intensity factor KIc as a function of crack length a relatedto the particle radius rp as a crack approaches and passes through the ABS particle; Ep
and Em are Young’s moduli for the particle and matrix, respectively; KpIc - stress intensity
factor for the matrix with the particle, KmIc - stress intensity factor for the homogeneous
matrix only
KIc returned to the level recorded for the homogeneous material.
Obviously, there is the influence of an elastic inclusion embedded in an elastic
matrix on the stress field. However, in this study this influence has only a minor
effect on fracture toughness since the difference between Young’s moduli of the particle
and matrix materials is almost negligible. In order to obtain more evidence for this
conclusion, the existing SENB model was rebuilt, with the ABS particle positioned
asymmetrically in front of the crack tip. This model aimed to reveal whether or not the
altered elastic stress state around the particle could influence the crack path direction
by attracting or deflecting the propagating crack. It was found that crack path was
not curved, illustrating that there was no effect on the crack path due to the particle
influence in the elastic stress field. The crack driving force in the elastic stress field was
obviously too strong to allow any deviation of the crack path due to minor changes in
the stress distribution around the particle.
MODE I DELAMINATION OF INTERLAYERED COMPOSITES 102
Assessment of the critical CTOD
Since the linear-elastic analysis did not provide an acceptable explanation for some of
the experimentally observed toughening effects that existed due to the ABS particle
presence, an elastic-plastic crack propagation analysis was undertaken. The two main
parameters required for the analysis were a fracture criterion and a crack growth di-
rection criterion. The FEA code used for this purpose, Franc 2DL [74], employs the
σθ−max crack growth direction criterion, known also as the maximum tensile stress frac-
ture criterion. This criterion predicts the crack growth direction to be perpendicular to
the direction of the maximum tensile stress. This fracture criterion was proven to be
the most appropriate for brittle and semi-brittle materials, hence making it suitable for
applications involving thermosetting polymers. The fracture criterion used in the FEA
code was the crack tip opening displacement (CTOD) criterion, that predicts the devel-
opment of the new crack surface. Although the CTOD criterion is well established as
a fracture criterion, its experimental assessment is not always an easy task. Therefore,
for the purpose of this study, the critical CTOD for the matrix material (i.e. VE/10%
ABS blend) was assessed by using an elastic-plastic FE analysis.
A homogeneous SENB specimen model (i.e. without any particles) was used con-
taining a sharp crack in order to simulate the pre-crack required by the test standard.
The configuration of the model was the same as the one presented in Figure 4.12, where
the crack was introduced as a gap between the elements ending with a zero-radius tip
surrounded by a rosette of 2µm triangular second order plane strain elements. The crit-
ical CTOD was measured 20µm behind the sharp crack tip when the modelled SENB
specimen was loaded to the force level required for fracture initiation. The experi-
mental procedure defined crack initiation to occur at the first non-linear point of the
load-displacement curve recorded during the test, which was found to be 140N. Under
MODE I DELAMINATION OF INTERLAYERED COMPOSITES 103
this level of loading, the vertical displacement at the loading point obtained from the
FEA model was found to be 0.3057mm. This was in agreement with the displacement of
0.31mm obtained from the experiments. Subsequently, the value of the critical CTOD
for this material was established to be 8.22µm. This value was taken as a constant
in the following crack propagation analysis for the crack initiation and all subsequent
crack growth steps. It was assumed that this approximation would not significantly
influence the results of the analysis.
Elastic-plastic crack propagation: influence of the particles on the crack
direction
Since the FEA modelling of elastic-plastic crack propagation is a computationally de-
manding procedure, minimization of the number of degrees of freedom was important.
The main parameter that can influence the quality of the mesh and eventually the
number of degrees of freedom is the crack tip element size. A mesh refinement study
was conducted until the the relative error from two successive refinements, for the de-
sired stress or strain variable, reaches a pre-defined value. This procedure applied to
plane stress states always yields the optimum crack tip element size, while for the plane
strain condition, stresses and strains never reach a plateau, regardless of the crack tip
mesh refinement level. The reason for this singularity-like behaviour can be explained
by differences between these two stress states. Plane stress is a biaxial stress state,
while plane strain is a triaxial stress state. The von Mises yield surface is a tube in
principle stress space that extends to infinity centered on the mean stress. For plane
stress, with one of the principle stresses equal to zero, the yield surface is projected
from three-dimensional space on to the σ1–σ2 stress space. The projected surface for
plane stress is an ellipse, so the maximum stress is bounded, while for plane strain
MODE I DELAMINATION OF INTERLAYERED COMPOSITES 104
this is not the case. The yield surface always limits the effective (von Mises) stress for
plasticity problems, but individual stress components can be quite large because of the
stress triaxiality [46, 111].
Therefore, the problem of finding the optimum crack-tip element size had to be
solved by another approach. Since an important objective of this study was to accu-
rately predict the crack path, assessment of a mesh refinement level which can obtain
a ’smooth’ stress transition between the crack-tip elements was of major importance.
The crack direction criterion uses this stress distribution to determine the angle of the
next crack extension by searching for the zero shear stress angle, around the crack
tip. This direction corresponds to the direction of the crack developed under the max-
imum tensile stress. Obviously, the level of stress around the crack tip does not have
a predominant influence on the direction criterion, it is the continuity of the stress
distribution which influences the determination of the crack propagation angle in each
step. For the interlayer matrix material used in this study it was found that the crack-
tip element size of 2-2.5µm gave a satisfactory stress distribution, and therefore it was
chosen as the optimum element size in all elastic-plastic crack propagation analysis.
The initial models were developed to simulate interaction between a single ABS
particle and a crack that approaches the particles out of its symmetry line. Boundary
conditions applied to these models simulated mode I (tensile) loading. A small section
of 200x200µm contained a single particle and a crack positioned 6.667µm below the
particle. Two of these models were developed, with the particle having a radius of
20 and 40µm, respectively. The average mesh size in the model was approximately
6µm while the crack tip elements were 2µm. The matrix material was a VE/10% ABS
blend while the particle possessed the properties of the neat ABS. The lower side of the
models was constrained in the X and Y directions, and tensile traction was applied to
MODE I DELAMINATION OF INTERLAYERED COMPOSITES 105
the upper side of the models while the crack-mouth side of the models was constrained
in the X direction (parallel with the crack). The latter boundary condition was applied
to suppress bending of the model during crack propagation due to the stiffness loss.
The main objective of these models was to investigate the possible influence of the
particle size on the crack path development through an elastic-plastic stress field, and
the results obtained from these models are presented in Figure 4.14.
ACTIVE LAYER : 1
(a) rp=20µm
ACTIVE LAYER : 1
(b) rp=40µm
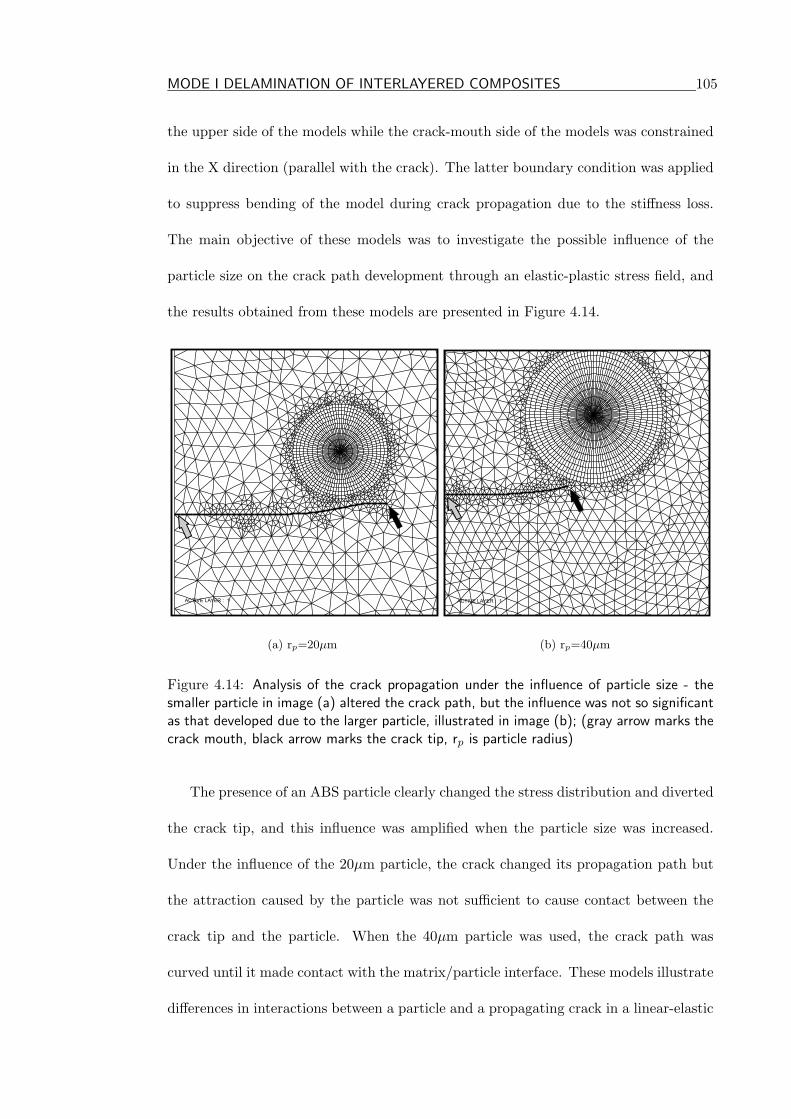
Figure 4.14: Analysis of the crack propagation under the influence of particle size - thesmaller particle in image (a) altered the crack path, but the influence was not so significantas that developed due to the larger particle, illustrated in image (b); (gray arrow marks thecrack mouth, black arrow marks the crack tip, rp is particle radius)
The presence of an ABS particle clearly changed the stress distribution and diverted
the crack tip, and this influence was amplified when the particle size was increased.
Under the influence of the 20µm particle, the crack changed its propagation path but
the attraction caused by the particle was not sufficient to cause contact between the
crack tip and the particle. When the 40µm particle was used, the crack path was
curved until it made contact with the matrix/particle interface. These models illustrate
differences in interactions between a particle and a propagating crack in a linear-elastic
MODE I DELAMINATION OF INTERLAYERED COMPOSITES 106
and elastic-plastic stress field. A possible reason for these differences can be associated
with the elastic-perfectly plastic properties of ABS. When plasticity is involved in the
FE analysis, properties of the matrix and the particles are significantly different. The
matrix possesses strain-hardening properties and an ultimate tensile strain of 2.8%,
while ABS, after passing the yield point, is subjected to rapid straining due to its elastic-
perfectly plastic behaviour. This causes the failure strain of ABS to be approximately
20%. The strain build-up in ABS particles during interaction with a crack can produce
high stresses in the vicinity of the interface and thus change the stress distribution
around the crack tip when it approaches this zone.
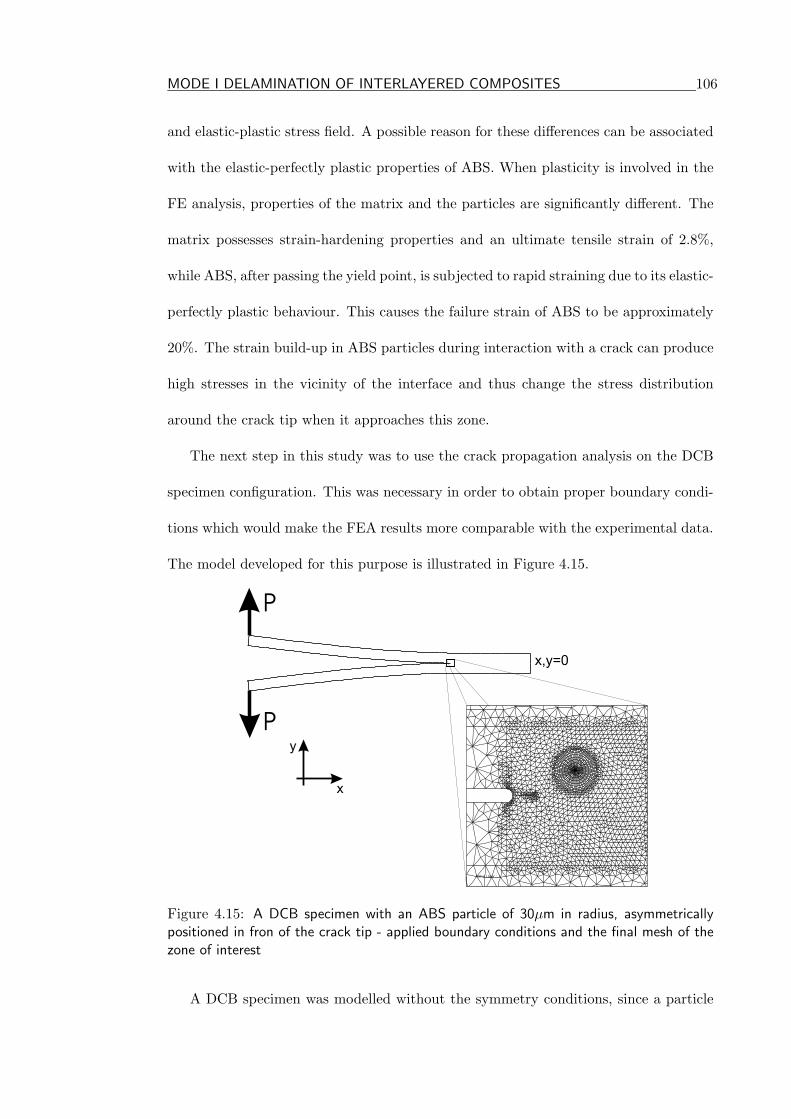
The next step in this study was to use the crack propagation analysis on the DCB
specimen configuration. This was necessary in order to obtain proper boundary condi-
tions which would make the FEA results more comparable with the experimental data.
The model developed for this purpose is illustrated in Figure 4.15.
Active Layer : 1
P
P
x,y=0
x
y
Figure 4.15: A DCB specimen with an ABS particle of 30µm in radius, asymmetricallypositioned in fron of the crack tip - applied boundary conditions and the final mesh of thezone of interest
A DCB specimen was modelled without the symmetry conditions, since a particle
MODE I DELAMINATION OF INTERLAYERED COMPOSITES 107
was positioned asymmetrically in front of the initial crack tip. The crack was initiated
manually to a length of 20µm and followed by automatic crack propagation, conducted
in 12 steps. The average mesh size was identical to that used in the previous tensile
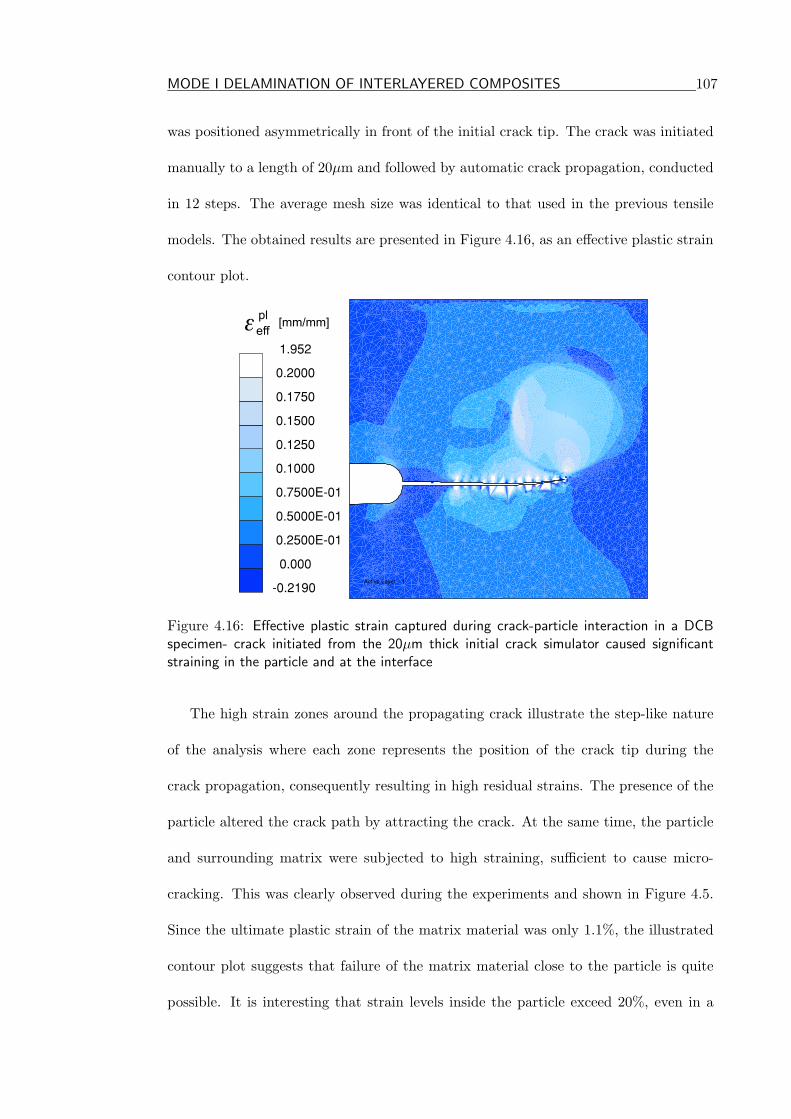
models. The obtained results are presented in Figure 4.16, as an effective plastic strain
contour plot.
Active Layer : 1
-0.2190
0.000
0.2500E-01
0.5000E-01
0.7500E-01
0.1000
0.1250
0.1500
0.1750
0.2000
1.952
�eff
pl[mm/mm]
Figure 4.16: Effective plastic strain captured during crack-particle interaction in a DCBspecimen- crack initiated from the 20µm thick initial crack simulator caused significantstraining in the particle and at the interface
The high strain zones around the propagating crack illustrate the step-like nature
of the analysis where each zone represents the position of the crack tip during the
crack propagation, consequently resulting in high residual strains. The presence of the
particle altered the crack path by attracting the crack. At the same time, the particle
and surrounding matrix were subjected to high straining, sufficient to cause micro-
cracking. This was clearly observed during the experiments and shown in Figure 4.5.
Since the ultimate plastic strain of the matrix material was only 1.1%, the illustrated
contour plot suggests that failure of the matrix material close to the particle is quite
possible. It is interesting that strain levels inside the particle exceed 20%, even in a
MODE I DELAMINATION OF INTERLAYERED COMPOSITES 108
zone not directly in the contact with the particle tip. Obviously, failure of the particle
is also possible, making the strain distribution in the whole region around the crack
favorable for the development of secondary cracks.
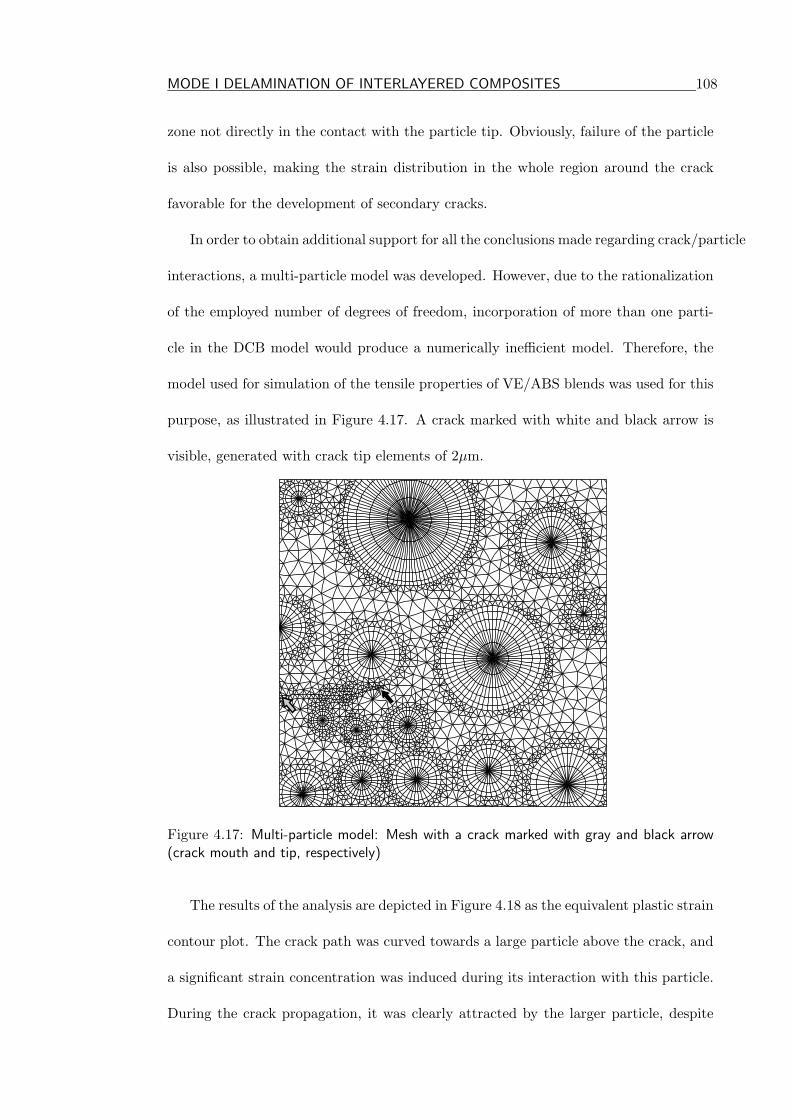
In order to obtain additional support for all the conclusions made regarding crack/particle
interactions, a multi-particle model was developed. However, due to the rationalization
of the employed number of degrees of freedom, incorporation of more than one parti-
cle in the DCB model would produce a numerically inefficient model. Therefore, the
model used for simulation of the tensile properties of VE/ABS blends was used for this
purpose, as illustrated in Figure 4.17. A crack marked with white and black arrow is
visible, generated with crack tip elements of 2µm.
Active Layer : 1
Figure 4.17: Multi-particle model: Mesh with a crack marked with gray and black arrow(crack mouth and tip, respectively)
The results of the analysis are depicted in Figure 4.18 as the equivalent plastic strain
contour plot. The crack path was curved towards a large particle above the crack, and
a significant strain concentration was induced during its interaction with this particle.
During the crack propagation, it was clearly attracted by the larger particle, despite
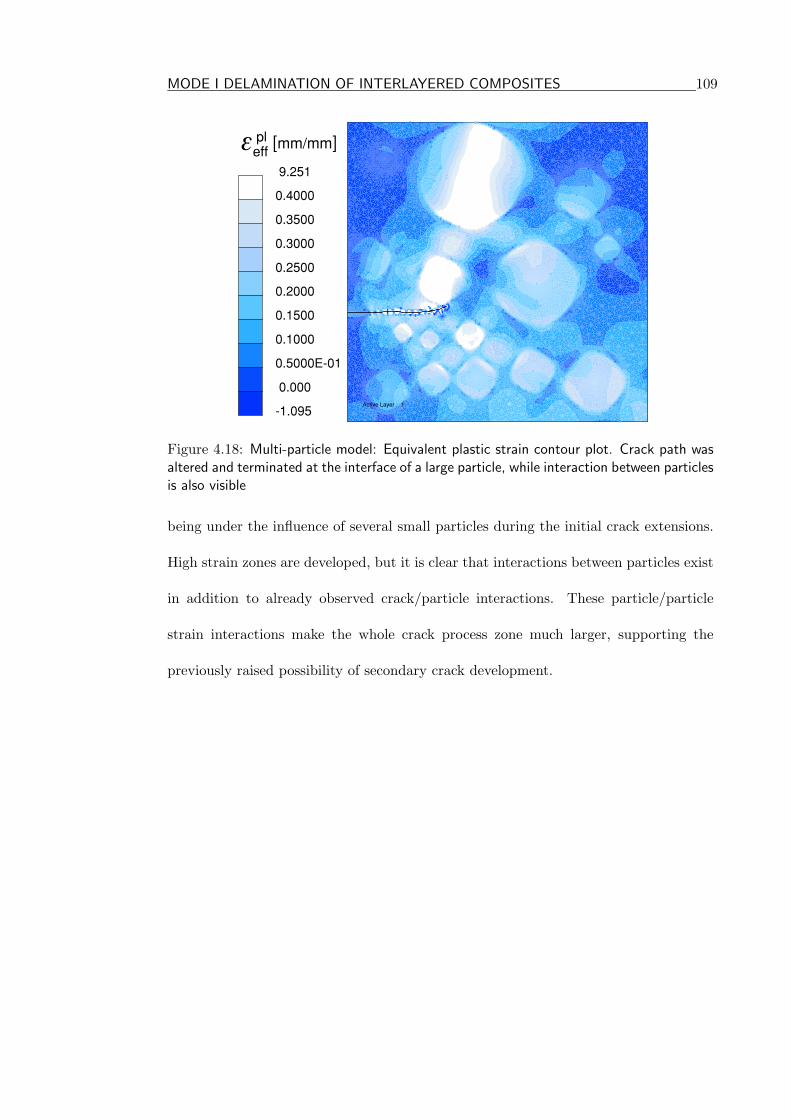
MODE I DELAMINATION OF INTERLAYERED COMPOSITES 109
Active Layer : 1
-1.095
0.000
0.5000E-01
0.1000
0.1500
0.2000
0.2500
0.3000
0.3500
0.4000
9.251
�effpl [ ]mm/mm
Figure 4.18: Multi-particle model: Equivalent plastic strain contour plot. Crack path wasaltered and terminated at the interface of a large particle, while interaction between particlesis also visible
being under the influence of several small particles during the initial crack extensions.
High strain zones are developed, but it is clear that interactions between particles exist
in addition to already observed crack/particle interactions. These particle/particle
strain interactions make the whole crack process zone much larger, supporting the
previously raised possibility of secondary crack development.
MODE I DELAMINATION OF INTERLAYERED COMPOSITES 110
4.3 Preliminary study on influence of fatigue pre-cracking
For the testing of interlayer-toughened composites, the standard procedures for non-
interlayered composites have been used despite the fact that the introduction of tough
interlayers in the interlaminar zone can change fracture behaviour of the test coupons.
Also, the adoption of the test standards for unidirectional composites invoked the same
concern regarding the applicability of pre-cracking. When used in interlayer toughened
composites the non-adhesive crack starter film does not cause any fibre disturbance,
because it is positioned inside the interlaminar region which is usually much thicker
than in unidirectional fibre composites. If fatigue or static loading was introduced
to generate a pre-crack, fibre bridging should not occur at the tip of the pre-crack.
Thus, fracture behaviour of the test specimens is merely governed by the fracture of
the interlayer itself. This section will address some of these issues, by using two groups
of specimens with 27% ABS interlayers of approximately 250 and 500µm in thickness.
The delmination of the toughened specimens, with or without the pre-crack, was
stable although no fibre bridging existed. The specimens fractured by exhibiting ex-
tensive resin whitening in front of the crack tip, indicating plastic deformation of the
toughened resin possibly caused by the presence of the ABS particles. The crack
propagated through the interlaminar layer without any signs of interfacial failure. It is
therefore clear that pre-cracking this type of composite would not introduce fibre bridg-
ing at the tip of pre-crack to increase the measured toughness for crack initiation. On
the other hand, pre-cracking can lower the initiation fracture toughness predominantly
due to the introduction of a sharper crack tip than that of aluminium foil insert, as
illustrated in Figure 4.19(a). The mode I results for pre-cracked specimens with 250µm
thick interlayers shown in Table 4.2, reflect this conclusion. Also, mode I initiation and
propagation toughness values obtained from unpre-cracked specimens are similar due
MODE I DELAMINATION OF INTERLAYERED COMPOSITES 111
to the absence of the fibre bridging.
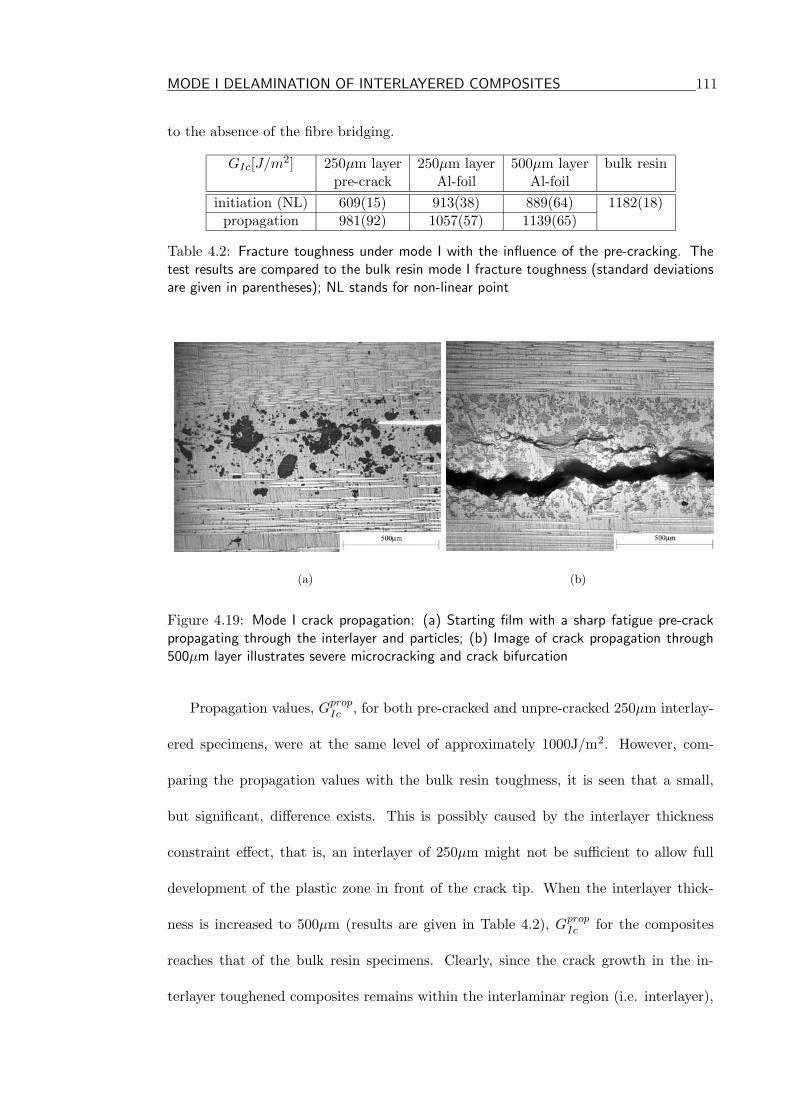
GIc[J/m2] 250µm layer 250µm layer 500µm layer bulk resinpre-crack Al-foil Al-foil
initiation (NL) 609(15) 913(38) 889(64) 1182(18)propagation 981(92) 1057(57) 1139(65)
Table 4.2: Fracture toughness under mode I with the influence of the pre-cracking. Thetest results are compared to the bulk resin mode I fracture toughness (standard deviationsare given in parentheses); NL stands for non-linear point
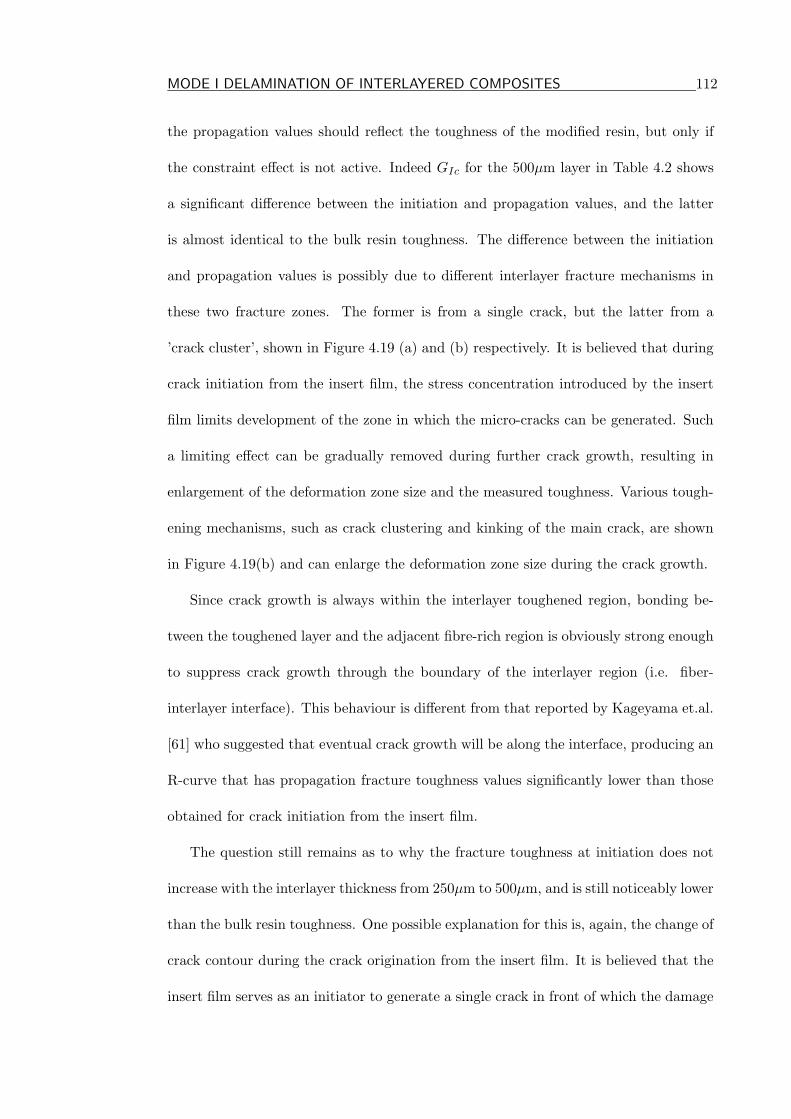
(a) (b)
Figure 4.19: Mode I crack propagation: (a) Starting film with a sharp fatigue pre-crackpropagating through the interlayer and particles; (b) Image of crack propagation through500µm layer illustrates severe microcracking and crack bifurcation
Propagation values, GpropIc , for both pre-cracked and unpre-cracked 250µm interlay-
ered specimens, were at the same level of approximately 1000J/m2. However, com-
paring the propagation values with the bulk resin toughness, it is seen that a small,
but significant, difference exists. This is possibly caused by the interlayer thickness
constraint effect, that is, an interlayer of 250µm might not be sufficient to allow full
development of the plastic zone in front of the crack tip. When the interlayer thick-
ness is increased to 500µm (results are given in Table 4.2), GpropIc for the composites
reaches that of the bulk resin specimens. Clearly, since the crack growth in the in-
terlayer toughened composites remains within the interlaminar region (i.e. interlayer),
MODE I DELAMINATION OF INTERLAYERED COMPOSITES 112
the propagation values should reflect the toughness of the modified resin, but only if
the constraint effect is not active. Indeed GIc for the 500µm layer in Table 4.2 shows
a significant difference between the initiation and propagation values, and the latter
is almost identical to the bulk resin toughness. The difference between the initiation
and propagation values is possibly due to different interlayer fracture mechanisms in
these two fracture zones. The former is from a single crack, but the latter from a
’crack cluster’, shown in Figure 4.19 (a) and (b) respectively. It is believed that during
crack initiation from the insert film, the stress concentration introduced by the insert
film limits development of the zone in which the micro-cracks can be generated. Such
a limiting effect can be gradually removed during further crack growth, resulting in
enlargement of the deformation zone size and the measured toughness. Various tough-
ening mechanisms, such as crack clustering and kinking of the main crack, are shown
in Figure 4.19(b) and can enlarge the deformation zone size during the crack growth.
Since crack growth is always within the interlayer toughened region, bonding be-
tween the toughened layer and the adjacent fibre-rich region is obviously strong enough
to suppress crack growth through the boundary of the interlayer region (i.e. fiber-
interlayer interface). This behaviour is different from that reported by Kageyama et.al.
[61] who suggested that eventual crack growth will be along the interface, producing an
R-curve that has propagation fracture toughness values significantly lower than those
obtained for crack initiation from the insert film.
The question still remains as to why the fracture toughness at initiation does not
increase with the interlayer thickness from 250µm to 500µm, and is still noticeably lower
than the bulk resin toughness. One possible explanation for this is, again, the change of
crack contour during the crack origination from the insert film. It is believed that the
insert film serves as an initiator to generate a single crack in front of which the damage
MODE I DELAMINATION OF INTERLAYERED COMPOSITES 113
zone size is smaller than 250µm. After the crack grows for a certain length, crack
kinking and bifurcation that are caused by the ABS particles, lead to the formation of
a ’crack cluster’ and a damage zone size that can be larger than 250µm. Therefore,
increase of the interlaminar thickness to 500µm only increases the GpropIc , not Gini
Ic which
is measured before the significant crack clustering occurs.
The composite system studied here must have strong bonding between the tough-
ened layer and the adjacent fibre-rich laminae to avoid crack growth along the fiber-
interlayer interface. The fact that crack growth is always within the interlaminar region
allows us to use a pre-crack for the toughness measurement, in order to simulate a nat-
ural crack that exists in the composite used in service. This provides a more realistic
delamination resistance evaluation than that from the test coupon using an insert film
as the starting defect. However, pre-cracking is time consuming and gives low con-
sistency in pre-crack quality. Also, standardization of the pre-cracking procedure is
needed to improve the consistency of the pre-crack quality – essential in reducing ex-
perimental scatter. This can be achieved by standardizing amplitude and frequency of
the fatigue process.
Introduction of the interlayers altered the fracture behaviour of the composite. Fiber
bridging was completely excluded from the fracture event but, at the same time, par-
ticles present in the interlayers caused complicated effects that influenced the fracture
behaviour.
Although standard delamination testing procedures can be used for testing of in-
terlayered composites, it is hard to reliably define a single fracture toughness value
which can represent their toughness. Both initiation and propagation values must be
recorded during the tests and correlated against the observed fracture processes in
order to properly establish the material’s toughness. Also, while pre-cracking of the
MODE I DELAMINATION OF INTERLAYERED COMPOSITES 114
interlayered specimens will usually produce the most conservative fracture toughness
values, this procedure is clearly not necessary when the testing objective is to compare
the toughness of different interlayered composites. If fatigue pre-cracking is under-
taken, it must be carried out carefully since variations in the frequency and amplitude
of the fatiguing process can influence the size of the plastic zone around the crack and
consequently the fracture toughness. Based on the above conclusions, pre-cracking of
interlayered composites was not undertaken in this study.
MODE I DELAMINATION OF INTERLAYERED COMPOSITES 115
4.4 Analysis and summary of the results
Information collected from the micrographs and test data established yielding and
microcracking as the two most dominant toughening mechanisms. These toughening
mechanisms influenced toughness by acting through two main variables: interlayer
thickness and particle distribution.
The primary toughening effect, as reported elsewhere [54], was yielding of the inter-
layer material, and its strong influence was governed merely by the physical existence
of the interlayer. In non-interlayered composites small inter-fibre distances often con-
strain development of the plastic zone and yielding in front of the crack tip. Therefore,
constraining the plastic zone development can directly influence the material’s tough-
ness. It has been proven that an interlayer, even without any toughening agent, being
of the same material as the composite’s matrix, can increase the material’s toughness
[48].
Secondary factors that can significantly influence the increase in toughness come
from the toughening potential of the layer material. This influence can be directly cor-
related to the distribution and concentration of the toughening agent, and the particle
influence can be fully recognized only when the constraint effect is not active, allowing
the full formation of the plastic zone. For this optimum interlayer thickness, the frac-
ture toughness trend, obtained as a function of particle content, will follow the trend
obtained from the fracture toughness testing of the neat VE/ABS blends. Obviously,
this is correct only if the bonding between interlayer and the rest of the composite is
sufficiently strong.
The original VE-8084 resin was enriched with butadiene by the manufacturer in
order to improve its toughness. Also, the Raman Spectroscopy study revealed the bu-
tadiene transition from ABS towards VE for low levels of ABS addition. This leads
MODE I DELAMINATION OF INTERLAYERED COMPOSITES 116
to the conclusion that the toughness improvement recorded for these blends (i.e. 5
and 10% ABS) is a consequence of further VE modification with butadiene. However,
no change in fracture toughness was seen between 5 and 10% ABS addition, and only
changed for blends beyond VE/10% ABS blend. This blend was found to be a transi-
tion in all measured mechanical properties of the blends. In addition, the correlation
between the added weight content and areal density of ABS had a change of slope at
this point also. These findings suggested that VE/10% ABS blend is a transitional
blend, where the saturation in the VE modification with butadiene occurs. There are
two major consequences of this event: the ABS particles in the interlayers are more
evident and there is a steep increase in fracture toughness after this point.
As a consequence of this chemical modification, there was a change in the frac-
ture behaviour of the composite specimens containing interlayers with more than 10%
ABS particles. Fracture became completely stable, compared to the completely unsta-
ble, brittle-like, fracture for interlayers below the transition point. The micrographs
revealed several fracture events that could influence the toughness increase after the bu-
tadiene saturation. A severe microcracking was evident, accompanied by crack kinking,
possibly caused by ’attraction’ between the propagating crack and some large particles.
However, experiments could not give evidence of possible yielding of the interlayer
material promoted by the particle presence. Also, it was not clear which one of the
observed toughening mechanisms was dominant in causing the toughness increase. The
employed FEA models shed some light on these problems. The most important finding
from the numerical studies was that the ABS particles did not contribute to yielding of
the interlayer material. However, they did influence stress and strain distributions, and
this influence became even more emphasized when a crack was introduced in between
particles. The crack propagation FEA study proved that during crack/particle inter-
MODE I DELAMINATION OF INTERLAYERED COMPOSITES 117
action severe straining of the matrix and particles can be produced, indicating that
the development of secondary cracking is possible. This is due to the elastic-perfectly
plastic properties of ABS. After the yield stress is reached in the ABS particles, they
are subjected to a rapid strain increase that can easily cause particle cracking or de-
velopment of matrix cracks in zones where the particle-particle interaction is strong.
Therefore, despite being weak yielding promoters, the ABS particles can significantly
increase the crack-tip process zone size through development of various microcracks
and secondary cracks that can significantly blunt the main crack, decrease its speed
and increase the interlayer and composite toughness.
Finally, while interlayer microcracking is clearly a possible toughening mechanism,
it is not clear whether this offers sufficient explanation for the significant toughness
increase, like that observed for the VE/27% ABS blend. Additional evidence might
be found in the fact that after butadiene saturation is reached, more ABS particles
are present in the interlayer, while the experimental results showed that cracks always
propagated through the ABS particles without causing any particle debonding from
the matrix. ABS itself is an extremely tough material with high failure strain and
its cracking triggers toughening mechanisms that can absorb large amounts of frac-
ture energy, like rubber particle cavitation and consequently promoted shear yielding.
Therefore, if there is an increase in ABS particle numbers in the interlayer, the crack
will be involved in more interactions with them, propagating predominantly through
the ABS phase. Clearly, this fracture scenario can produce an interlayer toughness
much closer to the toughness of the bulk ABS. In addition to the microcracking and
crack kinking, this explains the toughness increase obtained by using the VE/27% ABS
blend for interlayers.
It should be noted that the toughness obtained with the VE/27% ABS blend in-
MODE I DELAMINATION OF INTERLAYERED COMPOSITES 118
terlayer is probably the maximum fracture toughness that can be produced with this
material combination. The reason for this can be found in the blend’s viscosity level,
which is very high, making its handling during the manufacturing procedure very com-
plicated. Also, there is the potential of a usually undesirable phase inversion if more
ABS particles are added into the VE. This would produce ABS as a matrix with a VE
particulate phase, probably resulting in poor toughness improvement.