Embed Size (px)
Citation preview
Research Article
Journal of Phonetics 68 (2018) 1–14
Contents lists available at ScienceDirect
Journal of Phonetics
journal homepage: www.elsevier .com/locate /Phonet ics
Variability of articulator positions and formants across nine English vowels
D.H. Whalen a,b,c,*, Wei-Rong Chen a, Mark K. Tiede a, Hosung Nam a,d
aHaskins Laboratories, United StatesbCity University of New York, United StatescYale University, United StatesdKorea University, South Korea
a r t i c l e i n f o
Article history:Received 23 December 2016Received in revised form 22 December 2017Accepted 31 January 2018Available online 23 February 2018
Keywords:VariabilityArticulationAcousticsVowelsX-ray microbeamEnglish
a b s t r a c t
Speech, though communicative, is quite variable both in articulation and acoustics, and it has often been claimed
that articulation is more variable. Here we compared variability in articulation and acoustics for 32 speakers in the
X-ray microbeam database (XRMB; Westbury, 1994). Variability in tongue, lip and jaw positions for nine English
vowels (/u, ʊ, æ, ɑ, ʌ, ɔ, e, ɪ, i/) was compared to that of the corresponding formant values. The domains were made
comparable by creating three-dimensional spaces for each: the first three principal components from an analysis
of a 14-dimensional space for articulation, and an F1xF2xF3 space for acoustics. More variability occurred in the
articulation than the acoustics for half of the speakers, while the reverse was true for the other half. Individual
tokens were further from the articulatory median than the acoustic median for 40–60% of tokens across speakers.
A separate analysis of three non-low front vowels (/e, ɪ, i/, for which the XRMB system provides the most direct
articulatory evidence) did not differ from the omnibus analysis. Speakers tended to be either more or less variable
consistently across vowels. Across speakers, there was a positive correlation between articulatory and acoustic
variability, both for all vowels and for just the three non-low front vowels. Although the XRMB is an incomplete rep-
resentation of articulation, it nonetheless provides data for direct comparisons between articulatory and acoustic
variability that have not been reported previously. The results indicate that articulation is not more variable than
acoustics, that speakers had relatively consistent variability across vowels, and that articulatory and acoustic vari-
ability were related for the vowels themselves.
� 2018 Elsevier Ltd. All rights reserved.
1939
1. Introduction
Speakers of a language show a great deal of variability intheir realization of the distinctive elements of their sound sys-tems. How that variability is related to the underlying goalsthemselves has been a topic of much debate in the phoneticsliterature. The goals of speech production have variously beendescribed as articulatory (e.g., Browman & Goldstein, 1992),acoustic (e.g. Guenther et al., 1999), or some combination ofthe two (e.g., Ladefoged, DeClerk, Lindau, & Papçun, 1972).The present paper examines vowels that, due to the fact thatthey can be sustained in a fairly stable way, are often takenas supporting evidence for acoustic accounts (Schwartz,Basirat, Ménard, & Sato, 2012). In particular, the proposition
that acoustic variability is less than articulatory variability forvowels (Johnson, Ladefoged, & Lindau, 1993; Ladefogedet al., 1972) is tested for a large number of speakers in theWisconsin X-ray Microbeam Database (XRMB; Westbury,1994).
Variability must be sufficiently constrained for the effectivetransmission of linguistic messages. Articulatory accountssuch as Articulatory Phonology (e.g., Browman & Goldstein,1986, 1995; Goldstein & Fowler, 2003) posit that constrictionsof the vocal tract, or gestures, are the units of phonology andthat their acoustic consequences are immediately perceptibleby listeners (Goldstein & Fowler, 2003). Gestures do not spec-ify exact tongue shape, and they typically have acoustic con-sequences that are expected to convey the presence andnature of the gesture, and those gestures that cannot be recov-ered perceptually from the acoustics are unlikely to becomestable phonological units. The synergies among articulatorsthat allow a gesture to achieve its goal even if individual
* Corresponding author at: Haskins Laboratories, 300 George Street, Suite 900, NewHaven, CT 06511, United States. Tel.: +1 203 865 6163.
E-mail addresses: [email protected] (D.H. Whalen), [email protected] (W.-R. Chen), [email protected] (M.K. Tiede), [email protected](H. Nam).
https://doi.org/10.1016/j.wocn.2018.01.0030095-4470/� 2018 Elsevier Ltd. All rights reserved.

articulators are perturbed are part of the Task Dynamicsapproach used to model the implementation of the gesturesfrom Articulatory Phonology (Saltzman & Munhall, 1989).
Acoustic accounts claim that some critical features of thesound signal are the targets for phonological units, and thatthere are many articulatory configurations that can lead toeach acoustic target (e.g., Atal, Chang, Mathews, & Tukey,1978; Diehl & Kluender, 1989; Guenther, Hampson, &Johnson, 1998; Lindblom, 1990; Stevens, 2002). The exis-tence of articulatory trade-offs that maintain a fairly constantacoustic output, such as lowering the larynx to compensatefor retracted lips (Riordan, 1977) or a tube changing the sizeof the lip constriction (Savariaux, Perrier, & Orliaguet, 1995)have been taken as evidence that only an acoustic targetcan be implemented. Further evidence for possible acoustictargets is found in online compensations for altered acousticfeedback (e.g., Houde & Jordan, 1998; Munhall, MacDonald,Byrne, & Johnsrude, 2009). While these accounts do not offeran explanation for such results as the perceptibility of silent-center vowels (e.g., Strange, Verbrugge, Shankweiler, &Edman, 1976), the overall dynamic specification of vowels(e.g., Noiray, Iskarous, & Whalen, 2014), or, to a certain extent,the normalization for vocal tract length that is apparent in per-ception (Traunmüller, 1984), they do provide a strong chal-lenge to articulatory accounts.
Acoustic accounts have also taken reports that there is insome contexts more variability in articulation than in acousticsas important support. This is especially true for English /r/ (e.g.,Guenther et al., 1999), where various tongue shapes result innearly identical acoustic patterns. (It is less clear that the con-strictions differ, however.) Compensation for some articulationshave been proposed for vowels, in service of acoustic targets(Perkell, Matthies, Svirsky, & Jordan, 1995; Savariaux et al.,1995).
An extension of the argument that the goals of speech areacoustic is that articulatory variability should be greater thanacoustic. This was explored by Johnson et al. (1993), whostudied tongue positions for five speakers of American Englishvia the X-ray microbeam system (Kiritani, Itoh, & Fujimura,1975). They found that their speakers had different locationsof the tongue for different vowels, even though differences inanatomy did not seem to account for the differences. Theythen assumed that the acoustic target had to be the goal, eventhough they did not measure the acoustics to see if, in fact, thesame goal was reached. It has since been taken as a generalconclusion that articulation is more variable than acoustics(Bouchard et al., 2016; Flory, 2015, p. 206; Lee, 2014;Magnuson & Nusbaum, 2007; Niebuhr & Michaud, 2015;Yunusova, Weismer, & Lindstrom, 2011) (see also Maeda,1991).
One of the kinds of variability that was pointed out byJohnson et al. (1993) was the inconsistency across talkers ofthe height of the tongue for /ɪ/ vs. /e/. Even though the canon-ical description of /ɪ/ is that it has a higher position than that of/e/, some speakers have an inverse relationship. For example,in Ladefoged et al. (1972), two of six speakers reversed thatheight, but it was assumed that the acoustics nonethelesswere in a typical pattern. In our own work (Noiray et al.,2014), we found that, indeed, three of seven speakers hadthe inverted articulatory relationship for /ɪ/ and /e/, with the
tongue being higher for the nominally lower vowel, /e/. How-ever, the pattern of their formants was reversed as well.Dynamic changes (even in the nominally monophthongal /ɪ/)in the formants made each of these vowels easily perceivedas the intended category. This form of variability points outthe risks involved in analyzing only a single point in vowels.
In many cases, increases in variability are taken asdecreases in motor control (see, e.g., discussion in Davids,Bennett, & Newell, 2006). Applications of nonlinear dynamictheory make that connection less clear, as will be elaboratedon in the Discussion. However, when it comes to making thecomparisons objectively, many difficult issues arise. Theacoustics at any time point reflect the state of all the articula-tors and the resulting transfer function, while articulatory mea-surements are typically sparse and limited. The scales of thetwo systems are incommensurate, and they account for differ-ent amounts of the vocal tract resonances.
We have focused on variability within a speaker, eventhough variability across speakers is also extensive. Differ-ences between speakers have been attributed to various fac-tors, ranging from different weighting of elements of tongueshape (Harshman, Ladefoged, & Goldstein, 1977) to differ-ences in use of particular timing intervals (Shaw & Gafos,2015). Variability within a speaker can only be measured ifthe relevant aspects of articulation are quantified, and thesemay include compensatory relations between portions of thevocal tract in the same way that the acoustics might containtradeoffs between, say, F2 and F3. The relative completenessof MRI images might allow us to quantify the entire vocal tractat some point, but the current state of data reduction is focusedon finding the most plausible linguistic gestures(Ramanarayanan, Van Segbroeck, & Narayanan, 2016).Despite these difficulties, we propose a way of comparing vari-ability across domains for three articulators: the tongue, thelips and the jaw.
The present study examined a range of speakers and con-texts found in the XRMB database. We took advantage of theavailability of simultaneous articulatory and acoustic data.Johnson et al. (1993) examined tongue position for 6–18tokens of up to 11 English vowels for their 5 speakers acrossthree consonantal contexts; they did not analyze the acoustics.Here, we examined 32 speakers and 24,897 tokens for 9 vow-els, /u, ʊ, æ, ɑ, ʌ, ɔ, e, ɪ, i/. We examined both articulatory andacoustic variability. There are many challenges to equating thevariability in these two domains. Some will be addressed in thedescription of our method, while the remainder will be taken upin the General Discussion.
2. Method
2.1. Speakers and measurements
The data were taken from the publicly accessible XRMBdatabase (Westbury, 1994), which comprises syllables, wordsand sentences spoken by 57 speakers of American English.Their productions were recorded with midsagittally placed goldpellets whose three-dimensional movements were convertedinto a two-dimensional representation (posterior ? anterior inx-axis, inferior ? superior in y-axis). Pellets were tracked witha rasterized focused X-ray sweep that followed these pellets
2 D.H. Whalen et al. / Journal of Phonetics 68 (2018) 1–14
glued to various articulators. These included four points on thetongue (T1 one cm posterior to the tongue apex; T4 at the ton-gue dorsum, �five cm posterior from T1; T2 and T3 placedroughly equidistantly between T1 and T4), upper lip (UL), lowerlip (LL), and lower incisor (to track the mandible; coded as‘MANi’ in the database but renamed as ‘JAW’ in this paper).After inspecting the quality of the data, we selected the datafrom 32 speakers (17 females) in the database for further anal-ysis; we excluded speakers with missing channels and obvi-ous erroneous data (e.g., many tracks going above thepalate). Articulatory and acoustic values were extracted fromall the speech tasks (regardless of the context) that containthe nine monophthong vowels (/u, ʊ, æ, ɑ, ʌ, ɔ, e, ɪ, i/) with pri-mary stress (e.g., /e/ in ‘special’), identified by the text-to-phoneinterpreter in the P2FA forced aligner (Yuan & Liberman,2008). One limitation of XRMB is that it lacks tracking of theback part of vocal tract which contains some information of crit-ical oral constrictions for back vowels (possibly for /æ/ too).Therefore, we carried out a separate analysis for the non-lowfront vowels /e, ɪ, i/, which are most likely to have the criticalconstrictions in the front part of the vocal tract, thus providingmore direct articulatory evidence.
For the temporal landmark for extracting values for vowels,the center of the vocalic segment, often stable enough to becalled a “steady state,” is the best available as it minimizescoarticulation with flanking consonants. The temporal midpointof the vocalic segment is often used for acoustic analyses,while articulation is often taken as attainment of the articulatorytarget, a gestural plateau ranging between a set percentage(usually 20%) of peak velocity before and after the maximalconstriction (see Gafos, 2002; Shaw & Gafos, 2015). Wechose the acoustic midpoint, but we also compared that withthe points that would be selected by articulatory criteria. Foreach sample, articulatory velocity was defined as the gradientof six-dimensional articulatory movements constructed by T2,T3 and T4 by using MVIEW (Tiede, 2009) and calculated thetemporal distance between the acoustic midpoint and the artic-ulatory target. The results were that 80.2% of the sampleshave identifiable articulatory targets centered around theacoustic midpoint. (Note that in the other 19.8% of the cases,there would be no usable articulatory definition due to continu-ous movement of the articulators.) 43.1% of the samples havethe acoustic midpoint within the articulatory target plateau(whose median duration was 34.3 ms). The median (acrossall samples) of the absolute differences between the acousticmidpoints and the articulatory targets was 5.4 ms (90% quantile = 51.5 ms), which is less than one acoustic analysis win-dow (25 ms) for formant estimation. Therefore, because theacoustic and articulatory landmarks in this corpus were fairlyconsistent and because 19.8% of the samples do not haveidentifiable articulatory targets, we chose to extract values forboth articulation and acoustics at the acoustic midpoint of thevocalic segment.1
We focused on flesh-points of the tongue as well as lip andjaw positions, so each sample consisted of 14 articulatory val-ues (T1x, T1y, T2x, T2y, T3x, T3y, T4x, T4y, ULx, ULy, LLx,LLy, JAWx, JAWy in mm) and three acoustic values (F1, F2and F3 in mels). The formant frequencies were estimated byBurg LPC method and tracked by Viterbi algorithm in PRAAT(Version 6.0.13; Boersma & Weenink, 2009). To reflect theeffect of acoustic variability in human perception, formant fre-quencies were converted to mel scale (Stevens, Volkmann,& Newman, 1937). Due to missing values and outlier exclu-sion, the number of samples per vowel is not consistent acrossspeakers, but the large sample size was assumed to compen-sate for this. The total number of samples was 30,141 and5244 of them were identified as outliers, leaving us 24,897effective samples. The average number of samples, numberand rate of exclusions per speaker for each vowel are summa-rized in Table 1. Details of outlier identification are provided inSection 2.3.
2.2. Data processing and normalization
In order to compare the variabilities in both articulatory andacoustic domains, the data must be normalized into a spacethat makes them comparable. The 14 dimensional articulatoryspace, including lingual, lip and jaw articulators, was convertedto three dimensions by using the first three components of aprincipal component analysis (described in detail below). Foreach speaker in each domain, the normalization of vowelspace takes two steps: (1) Centering (set the origin to the cen-ter of the space) and (2) rescaling (rescale the data by theaverage distance of each data point to the center). The acous-tic data of speaker JW24 is shown as an example in Fig. 1 todemonstrate the concept of normalization and the calculationof variability in the acoustic domain. (The actual normalizationwas performed across multiple dimensions for the articulatoryand acoustic spaces, but Fig. 1 shows only two dimensionsfor illustration.) The first step was to define the center of thevowel space of this speaker. Simply averaging all the datafor one speaker as the grand mean can be biased by unbal-anced vowel inventory and/or unbalanced coarticulatory con-texts. Therefore, in order to minimize these biases, wesubset the data of the four corner vowels in English /i ɑ u æ/from the full dataset, and restricted the occurrences of thosevowels to be only immediately following (1) a placeless seg-ment /h ə/, (2) a labial segment /b p f v/, or (3) a silence, andalso excluded those followed by /r/ or a nasal. Then, the center
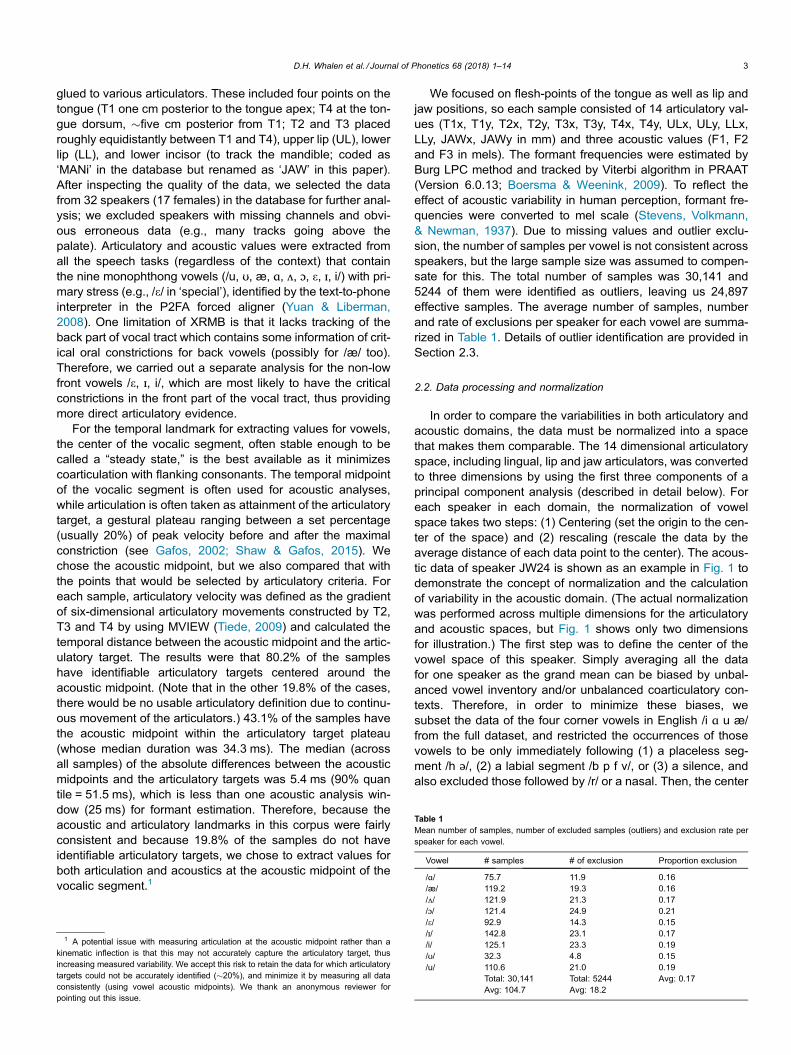
Table 1Mean number of samples, number of excluded samples (outliers) and exclusion rate perspeaker for each vowel.
Vowel # samples # of exclusion Proportion exclusion
/ɑ/ 75.7 11.9 0.16/æ/ 119.2 19.3 0.16/ʌ/ 121.9 21.3 0.17/ɔ/ 121.4 24.9 0.21/e/ 92.9 14.3 0.15/ɪ/ 142.8 23.1 0.17/i/ 125.1 23.3 0.19/ʊ/ 32.3 4.8 0.15/u/ 110.6 21.0 0.19
Total: 30,141Avg: 104.7
Total: 5244Avg: 18.2
Avg: 0.17
1 A potential issue with measuring articulation at the acoustic midpoint rather than akinematic inflection is that this may not accurately capture the articulatory target, thusincreasing measured variability. We accept this risk to retain the data for which articulatorytargets could not be accurately identified (�20%), and minimize it by measuring all dataconsistently (using vowel acoustic midpoints). We thank an anonymous reviewer forpointing out this issue.
D.H. Whalen et al. / Journal of Phonetics 68 (2018) 1–14 3
of the vowel space is defined as the grand mean of the fourmedians for /i ɑ u æ/ in this restricted subset, as indicated bythe thick ‘X’ in Fig. 1a. In the second step we calculated themedian distance (in the F1xF2xF3 space in this example) fromall vowel tokens to the grand mean as the unit length for thisspace (shown in Fig. 1b). A normalized acoustic space(Fig. 1c) was constructed by subtracting the grand mean fromall the acoustic data and dividing the data by the unit length(229 mels in this example) defined in step 2.
Then, we computed the Euclidean distance from each tokenof each vowel to the median of this vowel, as shown with thedotted vectors in Fig. 1d for the vowel /æ/. The length of onevector in Fig. 1d is the normalized variability of one sampleof this vowel, and the average variability of this vowel is themean length of all vectors for this vowel. Thus vowel categorytargets in general are one unit from the grand mean, whilemost individual values depart from their categorical targetsby much less than one, since vowel instances are closer totheir respective targets than to the center of vowel space. Notethat our measure of variability is the absolute distance from thecategory target in multidimensional space; this measure is sim-ilar to the median absolute deviation (MAD) in one-dimensionalspace, which has been proved to be more robust to the distri-bution of the data than standard deviation (Hampel, 1974).
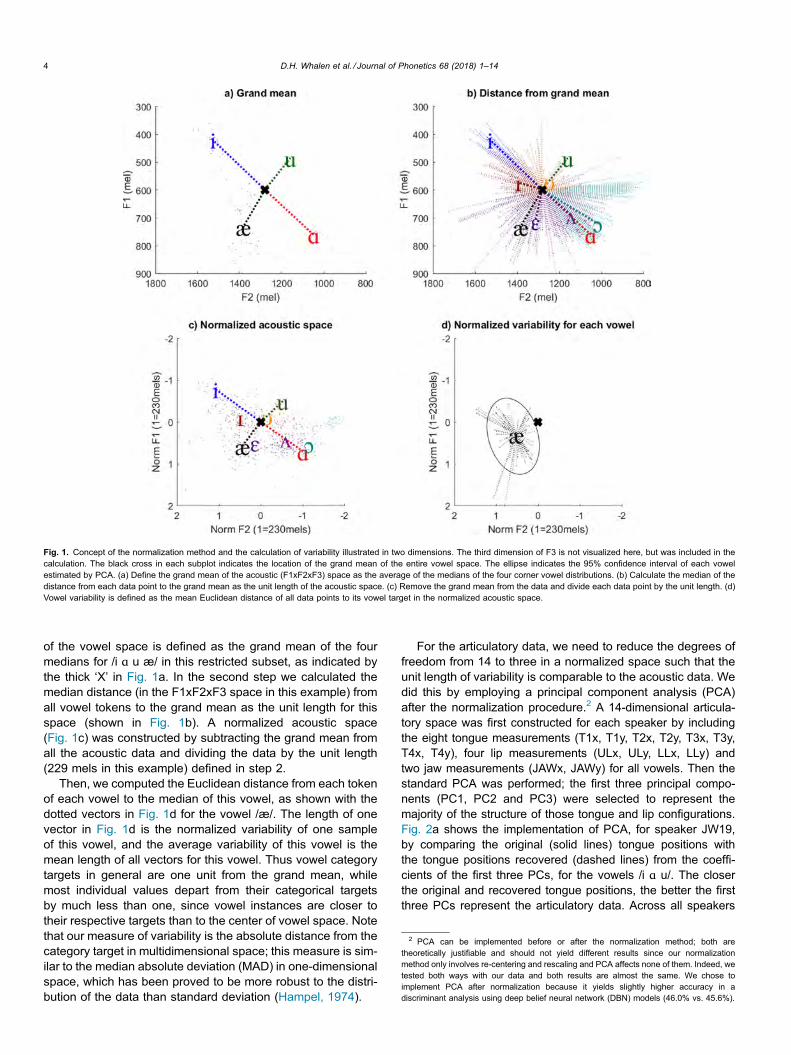
For the articulatory data, we need to reduce the degrees offreedom from 14 to three in a normalized space such that theunit length of variability is comparable to the acoustic data. Wedid this by employing a principal component analysis (PCA)after the normalization procedure.2 A 14-dimensional articula-tory space was first constructed for each speaker by includingthe eight tongue measurements (T1x, T1y, T2x, T2y, T3x, T3y,T4x, T4y), four lip measurements (ULx, ULy, LLx, LLy) andtwo jaw measurements (JAWx, JAWy) for all vowels. Then thestandard PCA was performed; the first three principal compo-nents (PC1, PC2 and PC3) were selected to represent themajority of the structure of those tongue and lip configurations.Fig. 2a shows the implementation of PCA, for speaker JW19,by comparing the original (solid lines) tongue positions withthe tongue positions recovered (dashed lines) from the coeffi-cients of the first three PCs, for the vowels /i ɑ u/. The closerthe original and recovered tongue positions, the better the firstthree PCs represent the articulatory data. Across all speakers
Fig. 1. Concept of the normalization method and the calculation of variability illustrated in two dimensions. The third dimension of F3 is not visualized here, but was included in thecalculation. The black cross in each subplot indicates the location of the grand mean of the entire vowel space. The ellipse indicates the 95% confidence interval of each vowelestimated by PCA. (a) Define the grand mean of the acoustic (F1xF2xF3) space as the average of the medians of the four corner vowel distributions. (b) Calculate the median of thedistance from each data point to the grand mean as the unit length of the acoustic space. (c) Remove the grand mean from the data and divide each data point by the unit length. (d)Vowel variability is defined as the mean Euclidean distance of all data points to its vowel target in the normalized acoustic space.
2 PCA can be implemented before or after the normalization method; both aretheoretically justifiable and should not yield different results since our normalizationmethod only involves re-centering and rescaling and PCA affects none of them. Indeed, wetested both ways with our data and both results are almost the same. We chose toimplement PCA after normalization because it yields slightly higher accuracy in adiscriminant analysis using deep belief neural network (DBN) models (46.0% vs. 45.6%).
4 D.H. Whalen et al. / Journal of Phonetics 68 (2018) 1–14
the mean error (absolute distance) between the original andrecovered tongue positions was 0.84 mm (SD = 0.17 mm). Thisis larger than the static RMS error in the XRMB system (0.15mm; Westbury, 1994, p. 71), but it is equivalent to the size ofthe pellets themselves, and the tracking error for moving pelletsis unknown. Thus these measures are approximately as accu-rate as they can be with this approach. The mean varianceexplained by the first three principal components was 88.9%(SD = 2.7%). Fig. 2b visualizes the ranges of ±2 SDs of PC1 (cir-cle lines), PC2 (triangle lines) and PC3 (diamond lines) forspeaker JW19. The results were similar to those of Parallel Fac-tor Analysis (PARAFAC) analysis of tongue shape in Harshmanet al. (1977) and Hoole and Mooshammer (2002) in that, roughlyspeaking, PC1 accounts for the upper-front to lower-back ton-gue movements and jaw opening, whereas PC2 accounts forthe upper-back to lower-front tongue movements and lip/jawopening as well as lip protrusion, and PC3 tracks complemen-tary raising of the tongue tip with lowering of the root.
After the articulatory space is normalized and reduced tothree dimensions, the resulting normalized acoustic and artic-ulatory spaces are on the same scale and comparable.
2.3. Outlier identification: The elbow method
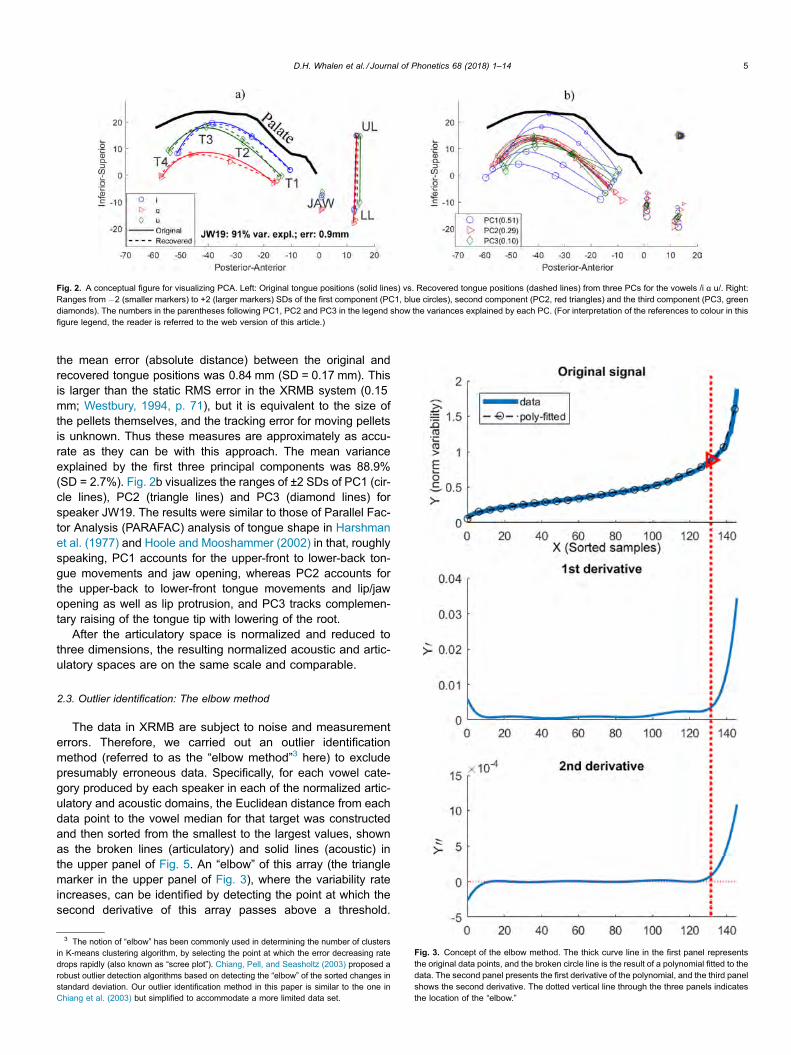
The data in XRMB are subject to noise and measurementerrors. Therefore, we carried out an outlier identificationmethod (referred to as the “elbow method”3 here) to excludepresumably erroneous data. Specifically, for each vowel cate-gory produced by each speaker in each of the normalized artic-ulatory and acoustic domains, the Euclidean distance from eachdata point to the vowel median for that target was constructedand then sorted from the smallest to the largest values, shownas the broken lines (articulatory) and solid lines (acoustic) inthe upper panel of Fig. 5. An “elbow” of this array (the trianglemarker in the upper panel of Fig. 3), where the variability rateincreases, can be identified by detecting the point at which thesecond derivative of this array passes above a threshold.
Fig. 2. A conceptual figure for visualizing PCA. Left: Original tongue positions (solid lines) vs. Recovered tongue positions (dashed lines) from three PCs for the vowels /i ɑ u/. Right:Ranges from �2 (smaller markers) to +2 (larger markers) SDs of the first component (PC1, blue circles), second component (PC2, red triangles) and the third component (PC3, greendiamonds). The numbers in the parentheses following PC1, PC2 and PC3 in the legend show the variances explained by each PC. (For interpretation of the references to colour in thisfigure legend, the reader is referred to the web version of this article.)
Fig. 3. Concept of the elbow method. The thick curve line in the first panel representsthe original data points, and the broken circle line is the result of a polynomial fitted to thedata. The second panel presents the first derivative of the polynomial, and the third panelshows the second derivative. The dotted vertical line through the three panels indicatesthe location of the “elbow.”
3 The notion of “elbow” has been commonly used in determining the number of clustersin K-means clustering algorithm, by selecting the point at which the error decreasing ratedrops rapidly (also known as “scree plot”). Chiang, Pell, and Seasholtz (2003) proposed arobust outlier detection algorithms based on detecting the “elbow” of the sorted changes instandard deviation. Our outlier identification method in this paper is similar to the one inChiang et al. (2003) but simplified to accommodate a more limited data set.
D.H. Whalen et al. / Journal of Phonetics 68 (2018) 1–14 5
Fig. 3 demonstrates the elbow method in this study. First we fit apolynomial (the broken circle line in Fig. 3) through the data-points (the thick curved line) and then differentiated the polyno-mial twice, as the second panel (first derivative) and the thirdpanel (second derivative) in Fig. 3. A threshold above zero(the cross point of the dotted vertical line and the curve line inthe third panel in Fig. 3) for the second derivative was deter-mined heuristically, and the projection of the point onto the orig-inal data was defined as the ideal elbow (the triangle marker inthe first panel) in this study. The elbow method was applied toboth the acoustic and the articulatory distances. Any token thatwas extreme on either scale was excluded from further analysis.
Recall that our normalization method rescales within-vowelvariability by the magnitude of the entire vowel space. Anyinstance of a vowel with variability of more than one unit onthe normalized scale suggests greater within-vowel variabilitythan across-vowel variability, which is less probable than theconverse. The exclusion rates are comparable among vowelsand speakers. The average exclusion rate was 17.4% acrossvowels and speakers; of the 17.4%, 9.9% were outliers inthe articulatory domain, 9.6% in the acoustic domain, 2% inboth. The very small amount of overlap of outliers in bothdomains indicates that the outliers identified by our elbowmethod were mostly attributed to measurement errors, not pro-duction errors; if most of the exclusions were due to extremearticulations, we might be able to assume that the acousticcompensation was sufficient to allow the correct vowel to beindicated. The fact that both acoustic and articulatory datawere excluded suggests that only measurement errors wereinvolved.
2.4. Statistical analysis
We carried out three statistical analyses: (1) between-speaker correlations of variability between vowels, (2) correla-tion of variability between the acoustic and articulatorydomains, (3) linear mixed modeling of variability predicted bydomain and by vowel.
For the correlation between acoustic and articulatory vari-abilities, multiple Pearson correlation coefficients were calcu-lated by pairing the variabilities of all the five vowels for 32speakers in the acoustic domain with those in the articulatorydomain. We controlled the false discovery rate (FDR) of themultiple tests of null hypotheses by the Benjamini–Hochbergmethod (Benjamini & Hochberg, 1995) and set the significancelevel at FDR q = .05.
The linear mixed models were computed in R (R CoreTeam, 2015), using the lmer (Bates, Maechler, Bolker, &Walker, 2013) and lmerTest (Kuznetsova, Brockhoff, &Christensen, 2016) packages. Candidate models were chosenusing log-likelihood comparisons. The selected mixed-effectsmodel predicted variability as the dependent variable, fromfixed effects of domain (two levels: articulatory and acoustic)and vowel (nine levels: /u, ʊ, æ, ɑ, ʌ, ɔ, e, ɪ, i/) and their inter-action, with random effects of speaker and by-speaker randomslopes for the effect of vowel. The effect of Gender contributedno improvement to the model and was thus excluded duringmodel selection. We also reported the marginal R2 (varianceexplained by fixed effects) and conditional R2 (varianceexplained by fixed effects and random effects) (Nakagawa &
Schielzeth, 2013) as an indication of the sizes of effects andthe goodness of fit of the selected model, using the piece-wiseSEM package (Lefcheck, 2016). For a more intuitive read-ing in what follows, we renamed the marginal R2 as ‘R2-fixed’and defined an ‘R2-random’ as the difference between condi-tional R2 and marginal R2. We further carried out multiple posthoc comparisons (the p-values were adjusted by Tukey HSDmethod) between vowels separately in each of the twodomains, by using the multcomp package (Hothorn, Bretz, &Westfall, 2008) in R.
3. Results
3.1. Variability compared between articulatory and acoustic domains
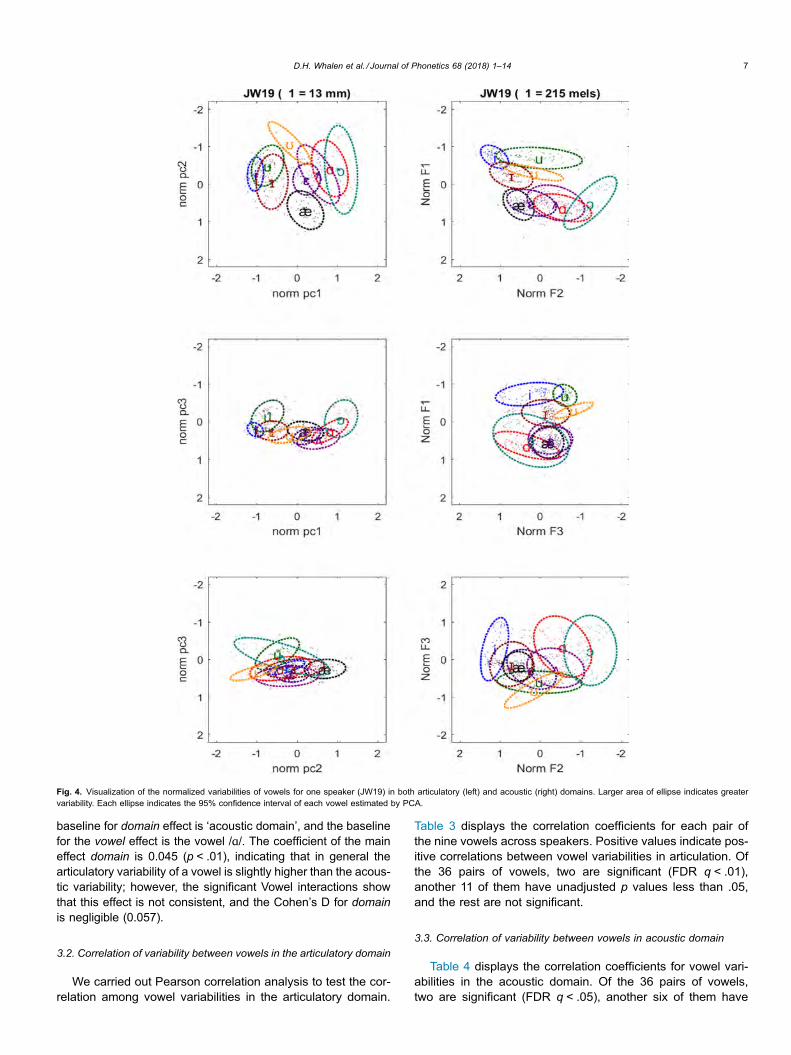
Fig. 4 visualizes the normalized variabilities in both articula-tory (left panels) and acoustic (right panels) domains; the firsttwo dimensions (PC1 and PC2 for articulatory domain; F1and F2 for acoustic domain) are plotted in the upper panels,and the first and third dimensions (PC1 and PC3 for articula-tory domain; F1 and F3 for acoustic domain) in the lower pan-els. Each ellipse in Fig. 4 indicates the 95% confidenceinterval, estimated by PCA, of each vowel target. Theseellipses were used only for visualization but not for any ofthe statistical analyses. As described in Section 2.2, the nor-malized variability for a given vowel was calculated by averag-ing the distance of each sample (data point) of the vowel to thevowel median, which is roughly proportional to the area of theellipse of each vowel in Fig. 4.
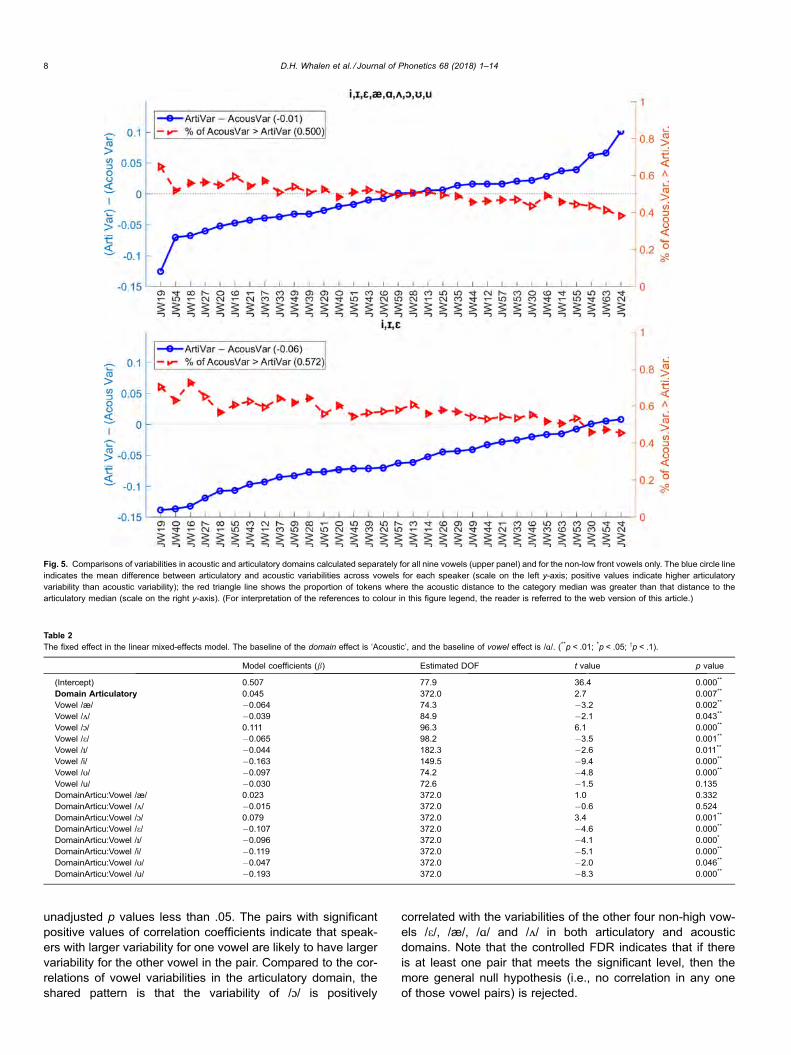
We further measured the average difference between artic-ulatory and acoustic variabilities across all vowels for eachspeaker, for all nine vowels (upper panel in Fig. 5) and fornon-low front vowels only (lower panel in Fig. 5). The lines withcircles in both panels of Fig. 5 show the mean articulatory vari-ability minus the mean acoustic variability (positive values indi-cate larger articulatory variability than acoustic variability) foreach speaker (scale on the left y-axis); the triangle lines showthe percentage of tokens where the acoustic variability isgreater than articulatory variability for each speaker (scale onthe right y-axis). In the analysis of all nine vowels (upper panelin Fig. 5), half of the speakers show lower articulatory variabil-ity (than acoustic variability) and half the reverse. On the otherhand, in the analysis of the non-low front vowels only (lowerpanel in Fig. 5), most speakers show lower articulatory variabil-ities. The mean difference in variability was �0.01 (units innormalized space) for the nine-vowel analysis and �0.06 fornon-low front vowels. The mean percentage of tokens withgreater acoustic than articulatory distances to category medianwas 50% for all nine vowels and 57% for the non-low front vow-els. In short, when the comparison of articulatory and acousticvariability is made across all nine vowels, there is no indicationof contrast between articulatory and acoustic variabilities.However, when the same analysis is performed for the threenon-low front vowels only, there is a trend that acoustic vari-ability is larger than articulatory variability.
Table 2 summarizes the results of the linear mixed-effectsmodel that includes domain and vowel as well as their interac-tion as fixed effects, and speaker as a random intercept as wellas by-speaker random slopes for the effect of vowel.4 The
4 lmer model syntax: Variability � Domain + Vowel + Domain:Vowel + (Vowel|Speaker).
6 D.H. Whalen et al. / Journal of Phonetics 68 (2018) 1–14
baseline for domain effect is ‘acoustic domain’, and the baselinefor the vowel effect is the vowel /ɑ/. The coefficient of the maineffect domain is 0.045 (p < .01), indicating that in general thearticulatory variability of a vowel is slightly higher than the acous-tic variability; however, the significant Vowel interactions showthat this effect is not consistent, and the Cohen’s D for domainis negligible (0.057).
3.2. Correlation of variability between vowels in the articulatory domain
We carried out Pearson correlation analysis to test the cor-relation among vowel variabilities in the articulatory domain.
Table 3 displays the correlation coefficients for each pair ofthe nine vowels across speakers. Positive values indicate pos-itive correlations between vowel variabilities in articulation. Ofthe 36 pairs of vowels, two are significant (FDR q < .01),another 11 of them have unadjusted p values less than .05,and the rest are not significant.
3.3. Correlation of variability between vowels in acoustic domain
Table 4 displays the correlation coefficients for vowel vari-abilities in the acoustic domain. Of the 36 pairs of vowels,two are significant (FDR q < .05), another six of them have
Fig. 4. Visualization of the normalized variabilities of vowels for one speaker (JW19) in both articulatory (left) and acoustic (right) domains. Larger area of ellipse indicates greatervariability. Each ellipse indicates the 95% confidence interval of each vowel estimated by PCA.
D.H. Whalen et al. / Journal of Phonetics 68 (2018) 1–14 7
unadjusted p values less than .05. The pairs with significantpositive values of correlation coefficients indicate that speak-ers with larger variability for one vowel are likely to have largervariability for the other vowel in the pair. Compared to the cor-relations of vowel variabilities in the articulatory domain, theshared pattern is that the variability of /ɔ/ is positively
correlated with the variabilities of the other four non-high vow-els /e/, /æ/, /ɑ/ and /ʌ/ in both articulatory and acousticdomains. Note that the controlled FDR indicates that if thereis at least one pair that meets the significant level, then themore general null hypothesis (i.e., no correlation in any oneof those vowel pairs) is rejected.
Fig. 5. Comparisons of variabilities in acoustic and articulatory domains calculated separately for all nine vowels (upper panel) and for the non-low front vowels only. The blue circle lineindicates the mean difference between articulatory and acoustic variabilities across vowels for each speaker (scale on the left y-axis; positive values indicate higher articulatoryvariability than acoustic variability); the red triangle line shows the proportion of tokens where the acoustic distance to the category median was greater than that distance to thearticulatory median (scale on the right y-axis). (For interpretation of the references to colour in this figure legend, the reader is referred to the web version of this article.)
Table 2The fixed effect in the linear mixed-effects model. The baseline of the domain effect is ‘Acoustic’, and the baseline of vowel effect is /ɑ/. (**p < .01; *p < .05; yp < .1).
Model coefficients (b) Estimated DOF t value p value
(Intercept) 0.507 77.9 36.4 0.000**
Domain Articulatory 0.045 372.0 2.7 0.007**
Vowel /æ/ �0.064 74.3 �3.2 0.002**
Vowel /ʌ/ �0.039 84.9 �2.1 0.043**
Vowel /ɔ/ 0.111 96.3 6.1 0.000**
Vowel /e/ �0.065 98.2 �3.5 0.001**
Vowel /ɪ/ �0.044 182.3 �2.6 0.011**
Vowel /i/ �0.163 149.5 �9.4 0.000**
Vowel /ʊ/ �0.097 74.2 �4.8 0.000**
Vowel /u/ �0.030 72.6 �1.5 0.135DomainArticu:Vowel /æ/ 0.023 372.0 1.0 0.332DomainArticu:Vowel /ʌ/ �0.015 372.0 �0.6 0.524DomainArticu:Vowel /ɔ/ 0.079 372.0 3.4 0.001**
DomainArticu:Vowel /e/ �0.107 372.0 �4.6 0.000**
DomainArticu:Vowel /ɪ/ �0.096 372.0 �4.1 0.000*
DomainArticu:Vowel /i/ �0.119 372.0 �5.1 0.000**
DomainArticu:Vowel /ʊ/ �0.047 372.0 �2.0 0.046**
DomainArticu:Vowel /u/ �0.193 372.0 �8.3 0.000**
8 D.H. Whalen et al. / Journal of Phonetics 68 (2018) 1–14
3.4. Correlation between articulatory and acoustic variabilities
To further explore the correlation between articulatory andacoustic variabilities, we carried out Pearson correlation anal-yses separately for each vowel as well as the correlationacross all nine vowels. Table 5 shows the correlation coeffi-cients separately for each vowel. Positive values indicate thatgreater vowel variability in articulation is accompanied bygreater vowel variability in acoustics. The results show thatthere are positive correlations between articulatory and acous-tic variabilities for eight of the nine vowels; five (/i ɪ æ ʊ u/) ofthem are significant with respect to the FDR level. The vowel/ɑ/ shows no correlation between articulatory and acousticvariability.
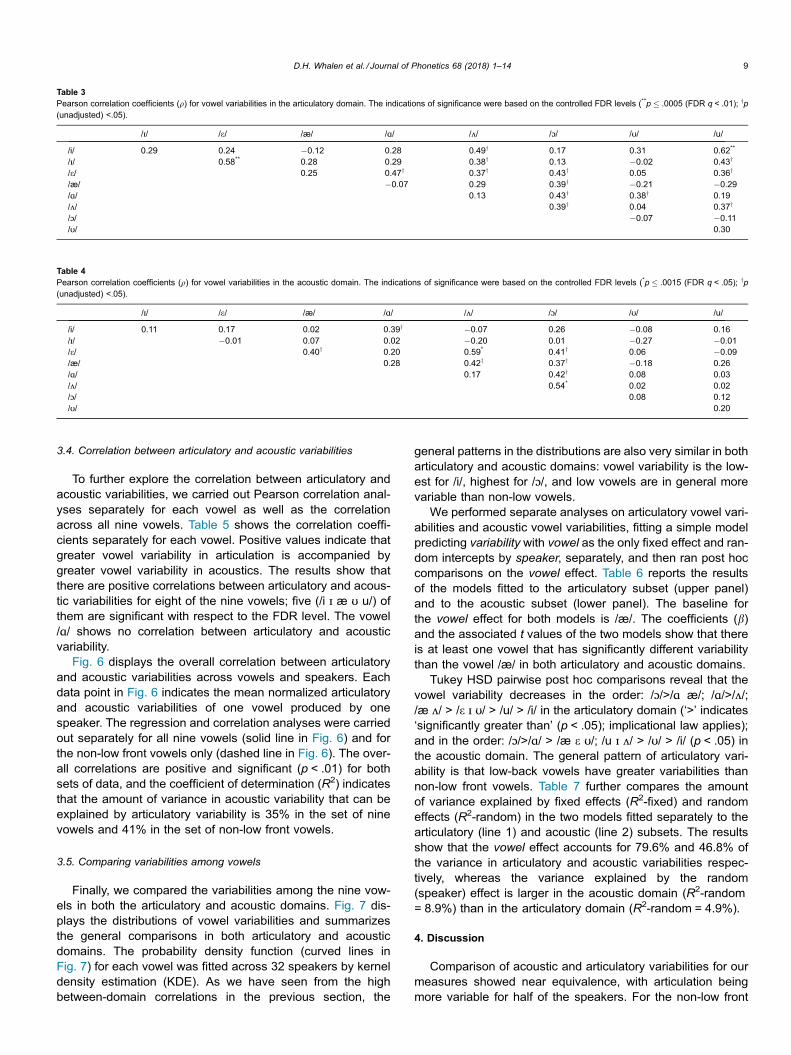
Fig. 6 displays the overall correlation between articulatoryand acoustic variabilities across vowels and speakers. Eachdata point in Fig. 6 indicates the mean normalized articulatoryand acoustic variabilities of one vowel produced by onespeaker. The regression and correlation analyses were carriedout separately for all nine vowels (solid line in Fig. 6) and forthe non-low front vowels only (dashed line in Fig. 6). The over-all correlations are positive and significant (p < .01) for bothsets of data, and the coefficient of determination (R2) indicatesthat the amount of variance in acoustic variability that can beexplained by articulatory variability is 35% in the set of ninevowels and 41% in the set of non-low front vowels.
3.5. Comparing variabilities among vowels
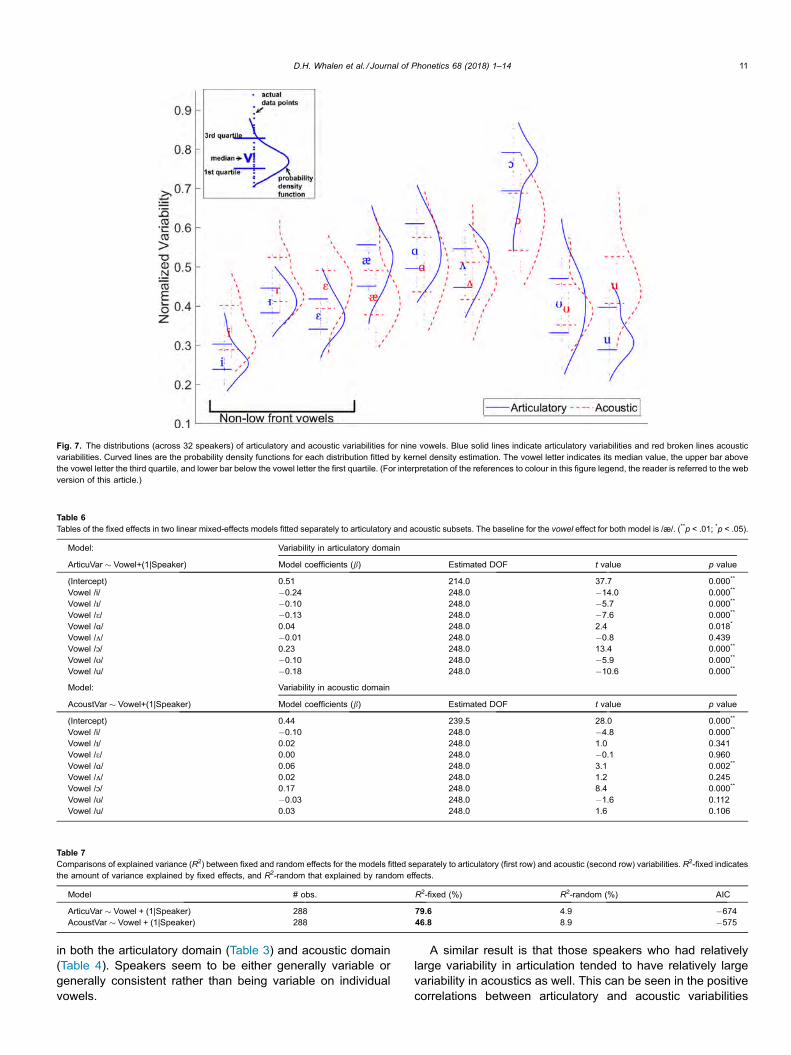
Finally, we compared the variabilities among the nine vow-els in both the articulatory and acoustic domains. Fig. 7 dis-plays the distributions of vowel variabilities and summarizesthe general comparisons in both articulatory and acousticdomains. The probability density function (curved lines inFig. 7) for each vowel was fitted across 32 speakers by kerneldensity estimation (KDE). As we have seen from the highbetween-domain correlations in the previous section, the
general patterns in the distributions are also very similar in botharticulatory and acoustic domains: vowel variability is the low-est for /i/, highest for /ɔ/, and low vowels are in general morevariable than non-low vowels.
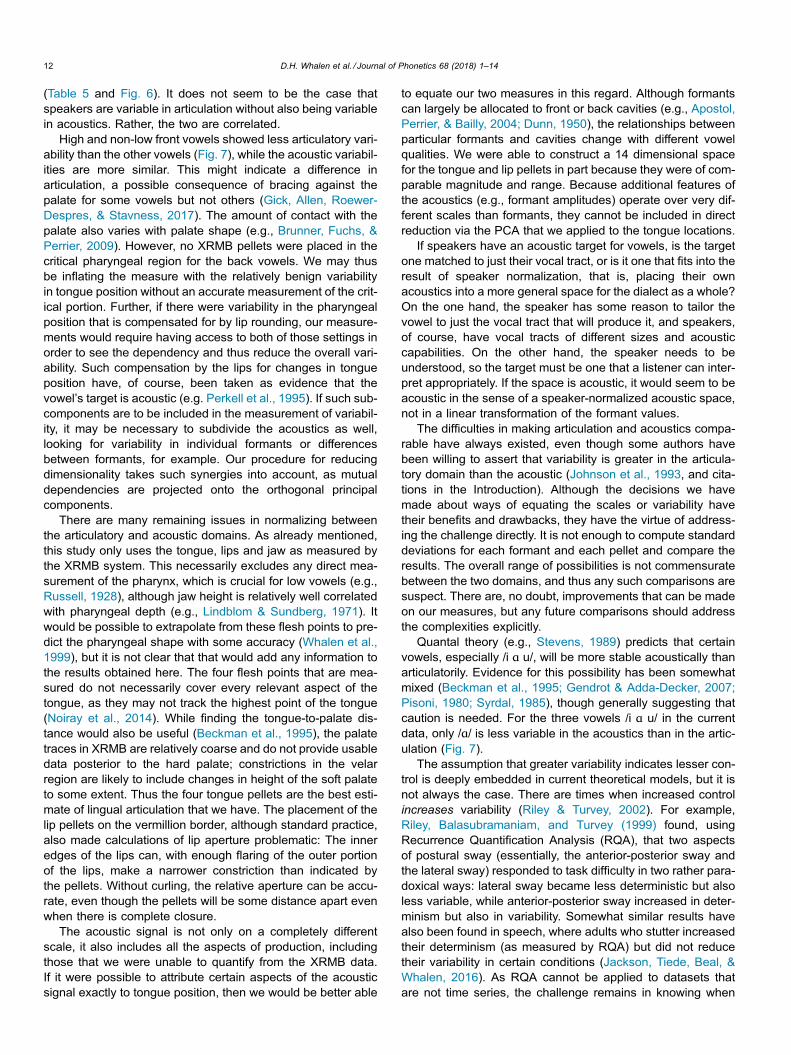
We performed separate analyses on articulatory vowel vari-abilities and acoustic vowel variabilities, fitting a simple modelpredicting variability with vowel as the only fixed effect and ran-dom intercepts by speaker, separately, and then ran post hoccomparisons on the vowel effect. Table 6 reports the resultsof the models fitted to the articulatory subset (upper panel)and to the acoustic subset (lower panel). The baseline forthe vowel effect for both models is /æ/. The coefficients (b)and the associated t values of the two models show that thereis at least one vowel that has significantly different variabilitythan the vowel /æ/ in both articulatory and acoustic domains.
Tukey HSD pairwise post hoc comparisons reveal that thevowel variability decreases in the order: /ɔ/>/ɑ æ/; /ɑ/>/ʌ/;/æ ʌ/ > /e ɪ ʊ/ > /u/ > /i/ in the articulatory domain (‘>’ indicates‘significantly greater than’ (p < .05); implicational law applies);and in the order: /ɔ/>/ɑ/ > /æ e ʊ/; /u ɪ ʌ/ > /ʊ/ > /i/ (p < .05) inthe acoustic domain. The general pattern of articulatory vari-ability is that low-back vowels have greater variabilities thannon-low front vowels. Table 7 further compares the amountof variance explained by fixed effects (R2-fixed) and randomeffects (R2-random) in the two models fitted separately to thearticulatory (line 1) and acoustic (line 2) subsets. The resultsshow that the vowel effect accounts for 79.6% and 46.8% ofthe variance in articulatory and acoustic variabilities respec-tively, whereas the variance explained by the random(speaker) effect is larger in the acoustic domain (R2-random= 8.9%) than in the articulatory domain (R2-random = 4.9%).
4. Discussion
Comparison of acoustic and articulatory variabilities for ourmeasures showed near equivalence, with articulation beingmore variable for half of the speakers. For the non-low front
Table 3Pearson correlation coefficients (q) for vowel variabilities in the articulatory domain. The indications of significance were based on the controlled FDR levels (**p � .0005 (FDR q < .01); yp(unadjusted) <.05).
/ɪ/ /e/ /æ/ /ɑ/ /ʌ/ /ɔ/ /ʊ/ /u/
/i/ 0.29 0.24 �0.12 0.28 0.49y 0.17 0.31 0.62**
/ɪ/ 0.58** 0.28 0.29 0.38y 0.13 �0.02 0.43y
/e/ 0.25 0.47y 0.37y 0.43y 0.05 0.36y
/æ/ �0.07 0.29 0.39y �0.21 �0.29/ɑ/ 0.13 0.43y 0.38y 0.19/ʌ/ 0.39y 0.04 0.37y
/ɔ/ �0.07 �0.11/ʊ/ 0.30
Table 4Pearson correlation coefficients (q) for vowel variabilities in the acoustic domain. The indications of significance were based on the controlled FDR levels (*p � .0015 (FDR q < .05); yp(unadjusted) <.05).
/ɪ/ /e/ /æ/ /ɑ/ /ʌ/ /ɔ/ /ʊ/ /u/
/i/ 0.11 0.17 0.02 0.39y �0.07 0.26 �0.08 0.16/ɪ/ �0.01 0.07 0.02 �0.20 0.01 �0.27 �0.01/e/ 0.40y 0.20 0.59* 0.41y 0.06 �0.09/æ/ 0.28 0.42y 0.37y �0.18 0.26/ɑ/ 0.17 0.42y 0.08 0.03/ʌ/ 0.54* 0.02 0.02/ɔ/ 0.08 0.12/ʊ/ 0.20
D.H. Whalen et al. / Journal of Phonetics 68 (2018) 1–14 9
vowels, articulation was less variable than acoustics. Theseresults held despite intrinsic differences in the information pro-vided by our measures for the two domains. The acoustic sig-nal includes the contributions of all the articulators, includingside-cavity zeroes, nasal tract coupling, and, most importantly,the posterior and parasagittal tongue beyond the range of theXRMB pellets. Thus aspects of the articulation that might havebeen important for the acoustic output were not necessarilymeasured here. However, the predictability of pharyngealshape from anterior portions of the tongue for English(Whalen, Kang, Magen, Fulbright, & Gore, 1999) appears tohave allowed for adequate predictions. On the other hand, itis possible that articulatory variability, such as height of thevelum (and, more importantly, amount of nasal coupling) isaccurately represented as variable in the acoustic signal butmissing from our measurements. Further exploration of this
issue, perhaps using real-time MRI (e.g., Narayanan et al.,2014), is warranted.
Articulation was coded in the experiment via flesh points inthe speaker’s physiological range. It may be that locating con-strictions directly rather than indirectly via tongue and lip pelletpositions (as done here) would capture the production morecogently, but the measurement system of the XRMB databasewas not sufficient to support such a description. Even withsuch a description, it is possible that our PCA analysis of thearticulation might collapse compensatory postures or tradingrelations (Perkell et al., 1995; Savariaux et al., 1995), obscur-ing some of the articulatory variability that acoustic theoriespredict. It is a challenge left to future analyses to devise a moreglobal assessment of articulatory variability.
Those speakers who had larger variability in one voweltended to have larger variability in the other vowels as well.This can be seen in the positive between-vowel correlations
Table 5Pearson correlation between articulatory and acoustic variabilities separately for each vowel. The indications of significance were based on the controlled FDR levels (*p � .027 (FDR q< .05); yp (unadjusted) <.05).
/i/ /ɪ/ /e/ /æ/ /ɑ/ /ʌ/ /ɔ/ /ʊ/ /u/
q 0.47* 0.39* 0.36y 0.49* �0.1 0.19 0.24 0.45* 0.43*
Unadjusted p .01 .03 .04 .01 .65 .29 .19 .01 .02FDR Adjusted q .03 .05 .06 .03 .65 .33 .25 .03 .03
Fig. 6. Scatter plot of acoustic variability against articulatory variability across speakers and vowels. Each dot represents the mean articulatory and acoustic variabilities of one vowelproduced by one speaker. Non-low front vowels are circled. The solid line is the regression line drawn through all nine vowels, and the dashed line through the non-low front vowelsonly.
10 D.H. Whalen et al. / Journal of Phonetics 68 (2018) 1–14
in both the articulatory domain (Table 3) and acoustic domain(Table 4). Speakers seem to be either generally variable orgenerally consistent rather than being variable on individualvowels.
A similar result is that those speakers who had relativelylarge variability in articulation tended to have relatively largevariability in acoustics as well. This can be seen in the positivecorrelations between articulatory and acoustic variabilities
Fig. 7. The distributions (across 32 speakers) of articulatory and acoustic variabilities for nine vowels. Blue solid lines indicate articulatory variabilities and red broken lines acousticvariabilities. Curved lines are the probability density functions for each distribution fitted by kernel density estimation. The vowel letter indicates its median value, the upper bar abovethe vowel letter the third quartile, and lower bar below the vowel letter the first quartile. (For interpretation of the references to colour in this figure legend, the reader is referred to the webversion of this article.)
Table 6Tables of the fixed effects in two linear mixed-effects models fitted separately to articulatory and acoustic subsets. The baseline for the vowel effect for both model is /æ/. (**p < .01; *p < .05).
Model: Variability in articulatory domain
ArticuVar � Vowel+(1|Speaker) Model coefficients (b) Estimated DOF t value p value
(Intercept) 0.51 214.0 37.7 0.000**
Vowel /i/ �0.24 248.0 �14.0 0.000**
Vowel /ɪ/ �0.10 248.0 �5.7 0.000**
Vowel /e/ �0.13 248.0 �7.6 0.000**
Vowel /ɑ/ 0.04 248.0 2.4 0.018*
Vowel /ʌ/ �0.01 248.0 �0.8 0.439Vowel /ɔ/ 0.23 248.0 13.4 0.000**
Vowel /ʊ/ �0.10 248.0 �5.9 0.000**
Vowel /u/ �0.18 248.0 �10.6 0.000**
Model: Variability in acoustic domain
AcoustVar � Vowel+(1|Speaker) Model coefficients (b) Estimated DOF t value p value
(Intercept) 0.44 239.5 28.0 0.000**
Vowel /i/ �0.10 248.0 �4.8 0.000**
Vowel /ɪ/ 0.02 248.0 1.0 0.341Vowel /e/ 0.00 248.0 �0.1 0.960Vowel /ɑ/ 0.06 248.0 3.1 0.002**
Vowel /ʌ/ 0.02 248.0 1.2 0.245Vowel /ɔ/ 0.17 248.0 8.4 0.000**
Vowel /ʊ/ �0.03 248.0 �1.6 0.112Vowel /u/ 0.03 248.0 1.6 0.106
Table 7Comparisons of explained variance (R2) between fixed and random effects for the models fitted separately to articulatory (first row) and acoustic (second row) variabilities. R2-fixed indicatesthe amount of variance explained by fixed effects, and R2-random that explained by random effects.
Model # obs. R2-fixed (%) R2-random (%) AIC
ArticuVar � Vowel + (1|Speaker) 288 79.6 4.9 �674AcoustVar � Vowel + (1|Speaker) 288 46.8 8.9 �575
D.H. Whalen et al. / Journal of Phonetics 68 (2018) 1–14 11
(Table 5 and Fig. 6). It does not seem to be the case thatspeakers are variable in articulation without also being variablein acoustics. Rather, the two are correlated.
High and non-low front vowels showed less articulatory vari-ability than the other vowels (Fig. 7), while the acoustic variabil-ities are more similar. This might indicate a difference inarticulation, a possible consequence of bracing against thepalate for some vowels but not others (Gick, Allen, Roewer-Despres, & Stavness, 2017). The amount of contact with thepalate also varies with palate shape (e.g., Brunner, Fuchs, &Perrier, 2009). However, no XRMB pellets were placed in thecritical pharyngeal region for the back vowels. We may thusbe inflating the measure with the relatively benign variabilityin tongue position without an accurate measurement of the crit-ical portion. Further, if there were variability in the pharyngealposition that is compensated for by lip rounding, our measure-ments would require having access to both of those settings inorder to see the dependency and thus reduce the overall vari-ability. Such compensation by the lips for changes in tongueposition have, of course, been taken as evidence that thevowel’s target is acoustic (e.g. Perkell et al., 1995). If such sub-components are to be included in the measurement of variabil-ity, it may be necessary to subdivide the acoustics as well,looking for variability in individual formants or differencesbetween formants, for example. Our procedure for reducingdimensionality takes such synergies into account, as mutualdependencies are projected onto the orthogonal principalcomponents.
There are many remaining issues in normalizing betweenthe articulatory and acoustic domains. As already mentioned,this study only uses the tongue, lips and jaw as measured bythe XRMB system. This necessarily excludes any direct mea-surement of the pharynx, which is crucial for low vowels (e.g.,Russell, 1928), although jaw height is relatively well correlatedwith pharyngeal depth (e.g., Lindblom & Sundberg, 1971). Itwould be possible to extrapolate from these flesh points to pre-dict the pharyngeal shape with some accuracy (Whalen et al.,1999), but it is not clear that that would add any information tothe results obtained here. The four flesh points that are mea-sured do not necessarily cover every relevant aspect of thetongue, as they may not track the highest point of the tongue(Noiray et al., 2014). While finding the tongue-to-palate dis-tance would also be useful (Beckman et al., 1995), the palatetraces in XRMB are relatively coarse and do not provide usabledata posterior to the hard palate; constrictions in the velarregion are likely to include changes in height of the soft palateto some extent. Thus the four tongue pellets are the best esti-mate of lingual articulation that we have. The placement of thelip pellets on the vermillion border, although standard practice,also made calculations of lip aperture problematic: The inneredges of the lips can, with enough flaring of the outer portionof the lips, make a narrower constriction than indicated bythe pellets. Without curling, the relative aperture can be accu-rate, even though the pellets will be some distance apart evenwhen there is complete closure.
The acoustic signal is not only on a completely differentscale, it also includes all the aspects of production, includingthose that we were unable to quantify from the XRMB data.If it were possible to attribute certain aspects of the acousticsignal exactly to tongue position, then we would be better able
to equate our two measures in this regard. Although formantscan largely be allocated to front or back cavities (e.g., Apostol,Perrier, & Bailly, 2004; Dunn, 1950), the relationships betweenparticular formants and cavities change with different vowelqualities. We were able to construct a 14 dimensional spacefor the tongue and lip pellets in part because they were of com-parable magnitude and range. Because additional features ofthe acoustics (e.g., formant amplitudes) operate over very dif-ferent scales than formants, they cannot be included in directreduction via the PCA that we applied to the tongue locations.
If speakers have an acoustic target for vowels, is the targetone matched to just their vocal tract, or is it one that fits into theresult of speaker normalization, that is, placing their ownacoustics into a more general space for the dialect as a whole?On the one hand, the speaker has some reason to tailor thevowel to just the vocal tract that will produce it, and speakers,of course, have vocal tracts of different sizes and acousticcapabilities. On the other hand, the speaker needs to beunderstood, so the target must be one that a listener can inter-pret appropriately. If the space is acoustic, it would seem to beacoustic in the sense of a speaker-normalized acoustic space,not in a linear transformation of the formant values.
The difficulties in making articulation and acoustics compa-rable have always existed, even though some authors havebeen willing to assert that variability is greater in the articula-tory domain than the acoustic (Johnson et al., 1993, and cita-tions in the Introduction). Although the decisions we havemade about ways of equating the scales or variability havetheir benefits and drawbacks, they have the virtue of address-ing the challenge directly. It is not enough to compute standarddeviations for each formant and each pellet and compare theresults. The overall range of possibilities is not commensuratebetween the two domains, and thus any such comparisons aresuspect. There are, no doubt, improvements that can be madeon our measures, but any future comparisons should addressthe complexities explicitly.
Quantal theory (e.g., Stevens, 1989) predicts that certainvowels, especially /i ɑ u/, will be more stable acoustically thanarticulatorily. Evidence for this possibility has been somewhatmixed (Beckman et al., 1995; Gendrot & Adda-Decker, 2007;Pisoni, 1980; Syrdal, 1985), though generally suggesting thatcaution is needed. For the three vowels /i ɑ u/ in the currentdata, only /ɑ/ is less variable in the acoustics than in the artic-ulation (Fig. 7).
The assumption that greater variability indicates lesser con-trol is deeply embedded in current theoretical models, but it isnot always the case. There are times when increased controlincreases variability (Riley & Turvey, 2002). For example,Riley, Balasubramaniam, and Turvey (1999) found, usingRecurrence Quantification Analysis (RQA), that two aspectsof postural sway (essentially, the anterior-posterior sway andthe lateral sway) responded to task difficulty in two rather para-doxical ways: lateral sway became less deterministic but alsoless variable, while anterior-posterior sway increased in deter-minism but also in variability. Somewhat similar results havealso been found in speech, where adults who stutter increasedtheir determinism (as measured by RQA) but did not reducetheir variability in certain conditions (Jackson, Tiede, Beal, &Whalen, 2016). As RQA cannot be applied to datasets thatare not time series, the challenge remains in knowing when
12 D.H. Whalen et al. / Journal of Phonetics 68 (2018) 1–14
to attribute variability in vowel targets to lack of control andwhen, instead, to an excess of control. However, RQA analysisholds promise for analyzing the trajectories that vowels takerather than measuring single points along that trajectory, asdone here and in many other studies. It remains to be deter-mined whether the examples of increased control leading toincreased variability are unusual or indicate that variabilityshould always be analyzed more fully. For the present, we willcontinue to assume that increased variability correlates withlesser control. The current results indicate that variability inthe production domain is not counteracted, in general, in theacoustic domain as assumed by, e.g., Johnson et al. (1993).Such an outcome does not contradict the ability of speakersto compensate for perturbations, but it demonstrates, for afairly large number of speakers in sentential context, that thecontrol parameters we might expect for the two domains aresimilar if not, indeed, exactly the same.
5. Conclusion
Vowels in running speech of 32 American English speakerswere found to be approximately equal in production variability(as measured on principal components derived from positionsof the jaw, lips and flesh points on the anterior portion of thetongue) and in acoustics (measured by the first three for-mants). The principal components capture basic synergies oflinguistic gestures (see Fig. 2). Because the articulators mea-sured here are not the only ones affecting acoustic output,the contribution of unmeasured aspects (pharyngeal shape,nasal coupling, etc.) are inferred from redundancy in the artic-ulators that were measured. A speaker’s degree of variability inproduction for one vowel correlated significantly with theirdegree of variability in other vowels; that is, more variablespeakers tended to be more variable for all vowels measured.The same correlation was also observed for acoustic variabil-ity. The results are consistent with theories that take articula-tion and acoustics as intimately linked and equally importantin conveying information via speech.
Acknowledgments
This work was funded by NIH grant DC-002717 to Haskins Labora-tories. We thank Eric S. Jackson, Jason Shaw, Phil Hoole, MarijaTabain and two anonymous reviewers for helpful comments. Audi-ences at the University of Western Sydney, LaTrobe University, Mac-quarie University, the DYMO workshop at the University of Colognealso provided feedback. Dani Byrd provided the impetus for majorimprovements in the experiment, as well as editorial comments. Noneof them bears responsibility for the final product.
Appendix A. Supplementary data
Supplementary data associated with this article can befound, in the online version, at https://doi.org/10.1016/j.wocn.2018.01.003.
References
Apostol, L., Perrier, P., & Bailly, G. (2004). A model of acoustic interspeaker variabilitybased on the concept of formant–cavity affiliation. Journal of the Acoustical Societyof America, 115, 337–351.
Atal, B. S., Chang, J. J., Mathews, M. V., & Tukey, J. W. (1978). Inversion of articulatory-to-acoustic transformation in the vocal tract by a computer-sorting technique.Journal of the Acoustical Society of America, 65, 1535–1555.
Bates, D., Maechler, M., Bolker, B., & Walker, S. (2013). lme4: Linear mixed-effectsmodels using Eigen and S4 (R Core Team). Retrieved from.
Beckman, M. E., Jung, T.-P., Lee, S., De Jong, K., Krishnamurthy, A. K., Ahalt, S. C.,et al. (1995). Variability in the production of quantal vowels revisited. Journal of theAcoustical Society of America, 97, 471–490.
Benjamini, Y., & Hochberg, Y. (1995). Controlling the false discovery rate: a practical andpowerful approach to multiple testing. Journal of the Royal Statistical Society SeriesB (Methodological), 57, 289–300.
Boersma, P., & Weenink, D. (2009). Praat: doing phonetics by computer [Computerprogram]. Retrieved from: http://www.praat.org/.
Bouchard, K. E., Conant, D. F., Anumanchipalli, G. K., Dichter, B., Chaisanguanthum, K.S., Johnson, K., et al. (2016). High-resolution, non-invasive imaging of upper vocaltract articulators compatible with human brain recordings. PLoS ONE, 11,e0151327.
Browman, C. P., & Goldstein, L. M. (1995). Dynamics and articulatory phonology. In R. F.Port & T. V. Gelder (Eds.), Mind as motion (pp. 175–193). Cambridge, MA: MITPress.
Browman, C. P., & Goldstein, L. M. (1986). Towards an articulatory phonology.
Phonology Yearbook, 3, 219–252.Browman, C. P., & Goldstein, L. M. (1992). Articulatory phonology: An overview.
Phonetica, 49, 155–180.Brunner, J., Fuchs, S., & Perrier, P. (2009). On the relationship between palate shape
and articulatory behavior. Journal of the Acoustical Society of America, 125,3936–3949.
Chiang, L. H., Pell, R. J., & Seasholtz, M. B. (2003). Exploring process data with the useof robust outlier detection algorithms. Journal of Process Control, 13, 437–449.
Davids, K., Bennett, S., & Newell, K. M. (2006). Movement system variability: HumanKinetics.
Diehl, R. L., & Kluender, K. R. (1989). On the objects of speech perception. EcologicalPsychology, 1, 121–144.
Dunn, H. K. (1950). The calculation of vowel resonances, and an electrical vocal tract.Journal of the Acoustical Society of America, 22, 740–753.
Flory, Y. (2015). The impact of head and body postures on the acoustic speech signal(Unpublished Ph.D. dissertation). University of Cambridge.
Gafos, A. (2002). A grammar of gestural coordination. Natural Language and Linguistic
Theory, 20, 269–337.Gendrot, C., & Adda-Decker, M. (2007). Impact of duration and vowel inventory size on
formant values of oral vowels: an automated formant analysis from eight languages.In Proceedings of the 16th international congress of phonetic sciences (pp. 1417–1420). Germany: Institute of Phonetics, Saarland University Saarbrüken.
Gick, B., Allen, B., Roewer-Despres, F., & Stavness, I. (2017). Speaking tongues areactively braced. Journal of Speech, Language and Hearing Research, 60, 494–506.
Goldstein, L. M., & Fowler, C. A. (2003). Articulatory phonology: A phonology for publiclanguage use. In N. Schiller & A. Meyer (Eds.), Phonetics and phonology inlanguage comprehension and production: Differences and similarities(pp. 159–207). Berlin: Mouton de Gruyter.
Guenther, F. H., Espy-Wilson, C. Y., Boyce, S. E., Matthies, M. L., Zandipour, M., &Perkell, J. S. (1999). Articulatory tradeoffs reduce acoustic variability duringAmerican English /r/ production. Journal of the Acoustical Society of America,105, 2854–2865.
Guenther, F. H., Hampson, M., & Johnson, D. (1998). A theoretical investigation ofreference frames for the planning of speech movements. Psychological Review,105, 611–633.
Hampel, F. R. (1974). The influence curve and its role in robust estimation. Journal of theAmerican Statistical Association, 69, 383–393.
Harshman, R., Ladefoged, P., & Goldstein, L. (1977). Factor analysis of tongue shapes.Journal of the Acoustical Society of America, 62, 693–707.
Hoole, P., & Mooshammer, C. M. (2002). Articulatory analysis of the German vowelsystem. In H. P. Auer, P. Gilles, & H. Spiekermann (Eds.), Silbenschnitt undTonakzente (pp. 129–152). Tübingen: Niemeyer.
Hothorn, T., Bretz, F., & Westfall, P. H. (2008). Simultaneous inference in generalparametric models. Biometrical Journal, 50, 346–363.
Houde, J. F., & Jordan, M. I. (1998). Sensorimotor adaptation in speech production.Science, 279, 1213–1216.
Jackson, E. S., Tiede, M. K., Beal, D. S., & Whalen, D. H. (2016). The impact of social-cognitive stress on speech variability, determinism, and stability in adults who doand do not stutter. Journal of Speech, Language, and Hearing Research, 59,1295–1314.
Johnson, K., Ladefoged, P., & Lindau, M. (1993). Individual differences in vowelproduction. Journal of the Acoustical Society of America, 94, 701–714.
Kiritani, S., Itoh, K., & Fujimura, O. (1975). Tongue-pellet tracking by a computer-controlled X-ray microbeam system. Journal of the Acoustical Society of America,57, 1516–1520.
Kuznetsova, A., Brockhoff, P. B., & Christensen, R. H. B. (2016). lmerTest: tests in linearmixed effects models. R package version 2.0-32. Retrieved from: https://cran.r-project.org/package=lmerTest.
Ladefoged, P., DeClerk, J., Lindau, M., & Papçun, G. J. (1972). An auditory-motor theoryof speech production. UCLA Working Papers in Phonetics, 22, 48–75.
Lee, H. N. (2014). A grammar of Baba Malay with sociophonetic considerations
(Unpublished Ph.D. dissertation). Honolulu: University of Hawaii at Manoa.Lefcheck, J. S. (2016). PiecewiseSEM: Piecewise structural equation modelling in r for
ecology, evolution, and systematics. Methods in Ecology and Evolution, 7, 573–579.
D.H. Whalen et al. / Journal of Phonetics 68 (2018) 1–14 13
Lindblom, B. E. (1990). Explaining phonetic variation: A sketch of the H&H theory. In W.J. Hardcastle & A. Marchal (Eds.), Speech production and speech modeling(pp. 403–439). Dordrecht: Kluwer Academic Publishers.
Lindblom, B. E., & Sundberg, J. (1971). Acoustical consequences of lip, tongue, jaw, andlarynx movement. Journal of the Acoustical Society of America, 50, 1166–1179.
Maeda, S. (1991). On articulatory and acoustic variabilities. Journal of Phonetics, 19,321–331.
Magnuson, J. S., & Nusbaum, H. C. (2007). Acoustic differences, listener expectations,and the perceptual accommodation of talker variability. Journal of ExperimentalPsychology: Human Perception and Performance, 33, 391–409.
Munhall, K. G., MacDonald, E. N., Byrne, S. K., & Johnsrude, I. S. (2009). Talkers altervowel production in response to real-time formant perturbation even when instructednot to compensate. Journal of the Acoustical Society of America, 125, 384–390.
Nakagawa, S., & Schielzeth, H. (2013). A general and simple method for obtaining R2
from generalized linear mixed-effects models. Methods in Ecology and Evolution, 4,133–142.
Narayanan, S., Toutios, A., Ramanarayanan, V., Lammert, A., Kim, J., Lee, S., et al.(2014). Real-time magnetic resonance imaging and electromagnetic articulographydatabase for speech production research (TC). Journal of the Acoustical Society ofAmerica, 136, 1307–1311.
Niebuhr, O., & Michaud, A. (2015). Speech data acquisition: the underestimatedchallenge. KALIPHO – Kieler Arbeiten zur Linguistik und Phonetik, 3, 1–42.
Noiray, A., Iskarous, K., & Whalen, D. H. (2014). Variability in English vowels iscomparable in articulation and acoustics. Laboratory Phonology, 5, 271–288.
Perkell, J. S., Matthies, M. L., Svirsky, M. A., & Jordan, M. I. (1995). Goal-based speechmotor control: A theoretical framework and some preliminary data. Journal ofPhonetics, 23, 23–35.
Pisoni, D. B. (1980). Variability of vowel formant frequencies and the Quantal Theory ofSpeech: A first report. Phonetica, 37, 285–305.
R Core Team (2015). R: A language and environment for statistical computing Retrievedfrom https://www.r-project.org/.
Ramanarayanan, V., Van Segbroeck, M., & Narayanan, S. S. (2016). Directly data-derived articulatory gesture-like representations retain discriminatory informationabout phone categories. Computer Speech and Language, 36, 330–346.
Riley, M. A., Balasubramaniam, R., & Turvey, M. T. (1999). Recurrence quantificationanalysis of postural fluctuations. Gait and Posture, 9, 65–78.
Riley, M. A., & Turvey, M. T. (2002). Variability and determinism in motor behavior.Journal of Motor Behavior, 34, 99–125.
Riordan, C. J. (1977). Control of vocal-tract length in speech. Journal of the AcousticalSociety of America, 62, 998–1002.
Russell, G. O. (1928). The vowel: Its physiological mechanism as shown by X-ray.Columbus, OH: Ohio State University Press.
Saltzman, E., & Munhall, K. G. (1989). A dynamical approach to gestural patterning inspeech production. Ecological Psychology, 1, 333–382.
Savariaux, C., Perrier, P., & Orliaguet, J. P. (1995). Compensation strategies for theperturbation of the rounded vowel [u] using a lip tube: A study of the control space inspeech production. Journal of the Acoustical Society of America, 98, 2466–2474.
Schwartz, J.-L., Basirat, A., Ménard, L., & Sato, M. (2012). The Perception-for-Action-Control Theory (PACT): A perceptuo-motor theory of speech perception. Journal ofNeurolinguistics, 25, 336–354.
Shaw, J. A., & Gafos, A. I. (2015). Stochastic time models of syllable structure. PLoSONE, 10, e0124714. e0124714.
Stevens, K. N. (1989). On the quantal nature of speech. Journal of Phonetics, 17, 3–45.Stevens, K. N. (2002). Toward a model for lexical access based on acoustic landmarks
and distinctive features. Journal of the Acoustical Society of America, 111,1872–1891.
Stevens, S. S., Volkmann, J., & Newman, E. B. (1937). A scale for the measurement ofthe psychological magnitude pitch. Journal of the Acoustical Society of America, 8,185–190.
Strange, W., Verbrugge, R. R., Shankweiler, D. P., & Edman, T. R. (1976). Consonantenvironment specifies vowel identity. Journal of the Acoustical Society of America,60, 213–224.
Syrdal, A. K. (1985). Aspects of a model of the auditory representation of AmericanEnglish vowels. Speech Communication, 4, 121–135.
Tiede, M. K. (2009). MVIEW: software for visualization and analysis of concurrentlyrecorded movement data. Retrieved from.
Traunmüller, H. (1984). Articulatory and perceptual factors controlling the age- and sex-conditioned variability in formant frequencies of vowels. Speech Communication, 3,49–61.
Westbury, J. R. (1994). X-ray microbeam speech production database user’s handbook.Madison, WI: Waisman Center, University of Wisconsin.
Whalen, D. H., Kang, A. M., Magen, H. S., Fulbright, R. K., & Gore, J. C. (1999).Predicting pharynx shape from tongue position during vowel production. Journal ofSpeech, Language and Hearing Research, 42, 592–603.
Yuan, J., & Liberman, M. Y. (2008). Speaker identification on the SCOTUS corpus. TheJournal of the Acoustical Society of America, 123, 3878.
Yunusova, Y., Weismer, G. G., & Lindstrom, M. J. (2011). Classifications of vocalicsegments from articulatory kinematics: Healthy controls and speakers withdysarthria. Journal of Speech, Language, and Hearing Research, 54, 1302–1311.
14 D.H. Whalen et al. / Journal of Phonetics 68 (2018) 1–14
![SP07 cs294 lecture 9 -- acoustic models.ppt [Read-Only]klein/cs294-7... · bab: closure of lips lowers all formants: so rapid increase in all formants at beginning of "bab” dad:](https://img.pdfslide.us/doc/110x75/5eca77b592704d49e73367d2/sp07-cs294-lecture-9-acoustic-read-only-kleincs294-7-bab-closure-of.jpg)