Embed Size (px)
Citation preview
The Relative Amplitude of Vowel Formants for Vowels in Asymmetrical
Consonant Contexts
A Senior Honors Thesis
Presented in Partial Fulfillment of the Requirements for Graduation with Distinction in
Speech and Hearing Science in the Undergraduate Colleges of The Ohio State University
BY
Heather A. Hunyady
The Ohio State University
May 2006
Project Advisor: Dr. Robert Allen Fox, Department of Speech and Hearing Science
ABSTRACT
The objective of this research is to characterize the role of the relative intensity of
speech segments in the auditory processing of vowels and consonants within larger
prosodic domains such as words. This project focuses on vowels and investigates the
relative amplitude of vowel formants as a possible cue when listeners make phonemic
and sub phonemic distinctions. The specific goal of this project is to examine the acoustic
pattern of the relative amplitude of formants in the production of selected co-articulated
vowels. A follow up study will examine the auditory effect of formant level variations on
listeners' decision about vowel quality and the intelligibility of words. This honors thesis
project supplements a much larger acoustic study, which is a partial replication and
extension of an early study by House and Fairbanks (1953) examining vowel intensity in
different consonant contexts.
The present research question is how the distribution of intensity across vowel
spectra in asymmetric consonant contexts (CIVC2 where CI # C2) differs from that in
symmetrical contexts (CIVC I where C1 = C ]). Recordings of vowels in both symmetrical
and asymmetrical contexts were obtained from adult Midwestern American English
speakers who participated in the larger study. The acoustic data obtained includes
measurements of the vowel duration, vowel intensity peak (rms), relative location of the
rms intensity peak, overall vowel intensity, and the relative amplitude of formants 1-4.
This overall research project aims to provide comprehensive analysis of vowel intensity

and its role in the processing of the speech signal. It is expected that the internal
distribution of intensity will differ among the vowels, depending on the frequency of the
formants. However, whether and how this distribution changes in the different
consonantal contexts is the question that will be addressed.
ACKNOWLEDGMENTS
I would sincerely like to thank Dr. Robert Fox and Dr. Ewa Jacewicz for the opportunity
to participate in this wonderful developmental experience. Thank you to The Ohio State
University Speech and Hearing Science Department for use of the SPA labs arid
equipment. Special thanks to the College of Social and Behavioral Science for endorsing
the project and granting a scholarship award. I would also like to acknowledge Dr. Jan
Weisenburger and project advisor Dr. Robert Fox for their assistance, guidance, and
encouragement throughout the project. I am grateful to Chiung-Yun Chang for data
processing assistance.
TABLE OF CONTENTS
Abstract. . ... ... . Pag. . . . . . . . . . . . . . . . . . . . . . . . . . . . . . . . . . . . . . . . . . . . . . . . . . . . . . . . . . . . . . . . . . . . . . . . . . . . . . . . . . . . eii
Acknowledgements .iv
Table of Contents.. ...v
List of Tables.. '"'''''''''''''''''''''''''''''''''''''''''''''''''''''''''''''''''''''''''''''' ...vi
List of Figures vii
Chapters:
1. Introduction and Background... """"""""""""""'" "" 1
2. Methods. . . . . . . . . . . . . . . . . . . . . . . . . . . . . . . . . . . . . . . . . . . . . . . . . . . . . . . . . . . . . . . . . . . . . . . . . . . . . . . . . 6
3. Discussion and Results ...10
References """"""""""""""""""""""""""""""" .28
v
LIST OF TABLES
Table Page
2.1 V owels and selected consonant contexts used in this study. . . . . . . . . . . . . . . . . . . . . . . .7
3.1 Vowel duration means (ms) for male/female ...11
3.2 Location ofrms (ms) from vowel onset for male/female ...15
3.3 Front vowel FOand Fl-F4 for male/female 20
3.4 Back vowel FOand F 1-F4 for male/female.. .. . .. .. .. .. .. .. .. . .. .. .. .. .. .. .. .. .. ...22
Vi
LIST OF FIGURES
Figure
3.1
3.2
3.3
3.4
3.5
3.6
3.7
3.8
Page
Mean vowel duration for male/female speakers... .12
Mean intensity of rms peak for male/female speakers ..14
Mean location ofrms peak for male/female speakers 16
Mean overall rms amplitude for male/female speakers .18
FI-F4 for female front vowels... ,. ...24
FI-F4 for female back vowels ..25
FI-F4 for male front vowels .26
FI-F4 for male back vowels... .27
Vll
CHAPTER 1
INTRODUCTION AND BACKGROUND
The relationship between the acoustic (i.e., spectral) characteristics of vowels and
their perceived phonetic quality is quite complex. Over the past 50 years a great deal of
effort has been put forth in attempting to examine and better understand the fundamental
frequency, formant frequencies, and duration of vowels. The most identifiable acoustic
characteristic of a vowel is its formant frequency patterns. The landmark acoustic
perception study of Peterson and Barney (1952) measured formant frequencies FI-F3,
formant amplitudes, and the fundamental frequency of ten American English vowels in
Ih_dl contexts spoken by 33 men, 28 women, and 15 children. The Ih_dl tokens were then
presented to listeners for identification, showing the relationship between formant
patterns and vowel identification.
Hillenbrand, Getty, Clark, and Wheeler (1995) conducted a replication of
Peterson and Barney (1952) having 45 men, 48 women, and 46 children produce the
American English vowels Ii, I, E, e, re, a, ~, U, u AIin Ih- dl syllables. They then
measured vowel duration, fundamental frequency, and frequencies of formants FI-F4
using LPC analysis at a maximally steady (sinusoidal) point. The formant frequencies of
a vowel vary because of vocal tract configuration, changes in vocal tract shape, which is
a non-uniform acoustic tube closed at one end. This produces different vowel quality or
resonance quality, as well as the context in which they are spoken. These studies
1
identified the role that vowel duration and formant frequencies have in producing
different vowels. However little information has been compiled regarding relative vowel
intensity, specificlly vowel amplitude variation in naturally occurring speech.
In another study, Hillenbrand, Clark, and Nearey (2001) looked at vowel
identification and spectral patterns when varying consonant environments. Eight
American English vowels (Ii, I, £, re, Q, U, u AI), seven initial consonants
(/h, b, d, g, p, t, k/), and six final consonants (lb, d, g, p, t, k/) were recorded in CIVCt
(C,VCI where C1 = C\) and C\V C2 (C1VC2 where CI -t C2)contexts rather than the
standard Ih_dl environment for six men and six women. Shifts in FI-F3 (measured every
5 ms during production) occurred in rounded vowels in alveolar environments. In C\VCI
contexts voiced stops in both initial and final positions may lengthen the vowel by 20
40ms. Their study on the effects of consonant environment on vowels also found that the
initial consonant impacts the vowel place of articulation.
Consonant context greatly impacts the distinguishing vowel features, which
House and Fairbanks defined in their 1953 study analyzing CIVCI (CIVCI where CI =
CI) contexts. House and Fairbanks (1953) reported measurements of duration,
fundamental frequency (FO),and relative power (amplitude) for six American English
vowels Ii, e, re, Q,a, 0, ul. The vowels were produced in symmetrical stressed Consonant
Vowel Consonant (CtVC\) syllables with twelve consonants
Ip, t, k, b, d, g, f, v, s, Z, ill, nl differing in voicing, manner, and place of articulation.
Each syllable was prefixed by unstressed [h~],which resulted in a disyllabic stimulus
2
token stressed on the second target syllable. Ten male speakers were carefully selected
from a larger pool of students enrolled in elementary speech courses for the duration,
fundamental frequency, and intensity data. The stimuli were spoken in random order into
the microphone mounted on a boom stand, approximately 12 inches from the speaker's
mouth. The intensity measurements were made at the maximum level of each syllable as
read from a sound level meter. The measurements were converted to relative power to
normalize the data across speakers due to the differences in individual loudness levels.
Based on the relative power means averaged across all consonant contexts, the
vowels fell in two groups: those greater in power such as 10,e, uI and those lesser in
power such as Ii, ae, a/. The differences due to the manner of articulation showed that
vowels in the fricative contexts (If, v, z, s/) were more intense than in the stop contexts
(lp, t, k, b, d, g/). Finally, the data was inconclusive regarding the effects of consonantal
place of articulation. As a general tendency, vowels in the velar contexts (Ik, g/) were
lesser in power than those in the alveolar contexts (I t, d, s, n, z/), which were greater in
power than vowels in the labial contexts (lp, b, f, vi) (Jacewicz & Fox in preparation for
publication).
This benchmark study however, had limitations with regard to vowel intensity,
which will be addressed in a portion of the current investigation. This is part of a larger
three-year acoustic study replicating and extending the earlier work on vowel intensity by
House & Fairbanks (1953). The extension of the House and Fairbanks' study involves
examination of intensity distribution across the vowel spectrum. The goal is to establish
3
whether and how vowel intensity is distributed over the first four formants and if this
distribution varies with consonantal context. Only selected sets of C1VCz contexts were
examined because of the desire to represent real word situations. There are limited sets of
configurations, which produce real English words. This study looks at overall rms
amplitude, amplitude of rms peak along with its relative location in the vowel and
frequency measurements for the first four formants. The vowel amplitude results focus on
the comparison of intensity variations for vowels in selected symmetrical vs. asymmetrical
consonant contexts, which has not yet been thoroughly examined. The following question
is raised: If a vowel shows significant variation in distribution of energy across the
spectrum as a function of context, which consonants impact the vowel most?
This research aims to provide comprehensive analysis of vowel intensity and
subsequently its role in the processing of speech signal. It is expected that the internal
distribution of intensity will differ among the vowels, depending on the frequency of the
formants. However, whether and how this distribution changes in different vowel contexts
is an empirical question. There is an indication from past research that particular parts of
the vowel spectra will be affected differently as a function of different contexts (e.g.,
Miller, 1953; Fant, 1956; Lindqvist, J. and Pauli, 1968; Ainsworth, 1972; 1981; Aaltonen,
1985). The present research will make it possible to examine the acoustic relevance of
these changes to vowel processing and the intelligibility of words. It needs to be mentioned
that formant frequencies are generally assumed to be the principal determinants of vowel
quality. Other cues such as vowel duration, fundamental frequency, relative overall
4
intensity, and even the amplitude of the formants have been considered as secondary
factors in preserving vowel identity.
However, it has been demonstrated that duration is of significant importance in
vowel processing and identification (see Ainsworth 1972, 1981;Mermelstein, 1978;
Gottfried and Beddor, 1988; Whalen, 1989). In addition support for the role of fundamental
frequency in vowel identification has also been found (e.g., Nearey, 1989; Whalen and
Levitt, 1995; Katz and Assmann, 2001). In contrast, little is known about the influence of
relative intensity. Surprisingly, both overall amplitude and amplitude of formants have not
been explored systematically since early work in vowel perception.
The acoustic project data will provide critical information about how the changes in
relative formant amplitudes resulting from asymmetrical consonant contexts affect
intelligibility of words. Intelligibility is a property of speech communication involving
meaning. Distortion of the intensity relations due to manipulations in the amplitudes of
formants for vowels in contexts may influence listeners' interpretation of minimally
contrastive words such as beat and bit. The data from the project will be used in preparing
subsequent perception experiments planned for the larger study, involving manipulations in
formant amplitudes using speech synthesis.
5
CHAPTER 2
METHODS
Participants:
This project utilizes the recordings of twenty speakers (ten men and ten women)
of Midwestern American English with no known history of speech disorders. The
participant recordings were made during the first stage of the larger study. Age of the
speakers ranged between 16 and 36 years (mean 23.5, s1.dev. 4.39). Fourteen speakers
were born and raised in Ohio, four in Michigan, and two in Wisconsin. The speakers were
phonetically untrained and were either high school or university students enrolled in a
variety of majors at The Ohio State University. The recorded corpus of data consists of
syllables spoken in symmetrical C]VC] and asymmetrical C]V C2contexts. I have analyzed
a subset of the recorded data from all twenty speakers in four selected asymmetrical
contexts.
Test Stimuli:
Eight American English vowels were selected: Ii, I, E,re, a, J, u, ul. The selected
consonant set consisted often oral consonants Ip, t, k, b, d, g, f, v, s, zl as in House and
Fairbanks (1953). The C]VC2tokens were produced as monosyllables, without the prefix
[h;;>],in a stressed position located in a short sentence "It's a... ... .". Like House and
6
Fairbanks (1953) the syllable with the target vowel was stressed and was preceded by an
unstressed and reduced syllable. This modification was introduced merely for practical
reasons as the phonetically untrained speakers found it difficult to read a nonsense word
with the [hg] prefix. Three sets of minimal pairs for front vowels were used 'beat, bit, bet,
bat,' 'feed, fid, fed, fad,' 'seat, sit, set, sat'. The minimal pairs for back vowels include
'cooed, could, cawed, cod', 'fuit, foot, fought, fot', 'suit, soot, sought, sot'. Minimal pair
being defined as two words with the same number of phonemes in which the phonemes
only differ by one phoneme. Some nonsense words were included due to the limitation of
using real words from the lexicon.
Acoustic analysis:
In this thesis, only selected contexts were chosen form the entire set of minimal
pairs shown in Table 2.1.
Table 2.1. Vowels and selected consonant contexts used in this study.
i I E ae u u a b t b t b t b t b b b b b b b b t t t t t t t t t t t t t t t t s s s s s s s s s s s s s s s s
s t s t s t s t s t s t f f f f f f - f f
f t f t
7
Vowel Duration
Vowel duration for this study represents the measured length of time in
milliseconds from the time of vowel onset to vowel offset. For measurement purposes
vowel onset is defined at the point where the sinusoidal shape of the waveform becomes
apparent. Vowel offset is defined as the point where the periodicity of the vowel waveform
ceases.
Intensity of rms Peak
The intensity of the rms peak, which is the point of greatest acoustic power
centered over a 20 ms window, was isolated using a computer program written in Matlab
(by, Dr. Robert Fox). I determined vowel onsets and offsets from the waveform utilizing
Adobe Audition speech analysis software
Location ofrms Peak
Peak location is a measure of the location of the center of the rms peak relative to
the vowel's onset. Usually, rms peak is located before temporal vowel midpoint but its
precise location may vary with consonant context of the vowel.
Overall Amplitude
Overall amplitude is the average rms amplitude of the vowel. Both rms peak
location and overall amplitude have been determined by output from another Matlab
program written for this project. My measurements of vowel onsets and offsets served as
input for this Matlab program.
8
Formant Frequencies
Amplitude and frequency of the first four formant curves were analyzed using the
speech analysis program TF32 and a separate program in Matlab to determine
measurements for each formant in a vowel. The measurements made for each acoustic
characteristic parameter have been entered in Excel spreadsheets, converted to SPSS data
files, and mean values were then obtained.
9
CHAPTER 3
DISSCUSSION AND RESULTS
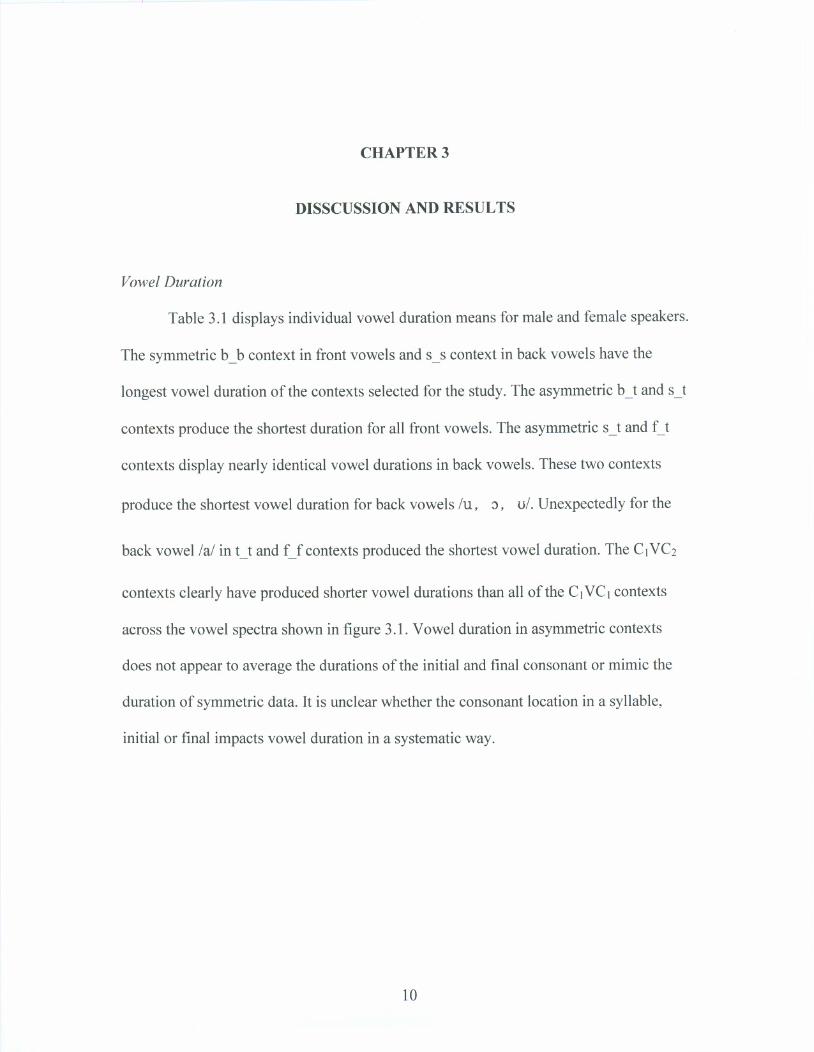
Vowel Duration
Table 3.1 displays individual vowel duration means for male and female speakers.
The symmetric b_b context in front vowels and s_s context in back vowels have the
longest vowel duration of the contexts selected for the study. The asymmetric b_t and s_t
contexts produce the shortest duration for all front vowels. The asymmetric s_t and Ct
contexts display nearly identical vowel durations in back vowels. These two contexts
produce the shortest vowel duration for back vowels /u, :), u/. Unexpectedly for the
back vowel/a/ in t_t and Cf contexts produced the shortest vowel duration. The CIVC2
contexts clearly have produced shorter vowel durations than all of the CIVCI contexts
across the vowel spectra shown in figure 3.1. Vowel duration in asymmetric contexts
does not appear to average the durations of the initial and final consonant or mimic the
duration of symmetric data. It is unclear whether the consonant location in a syllable,
initial or final impacts vowel duration in a systematic way.
10
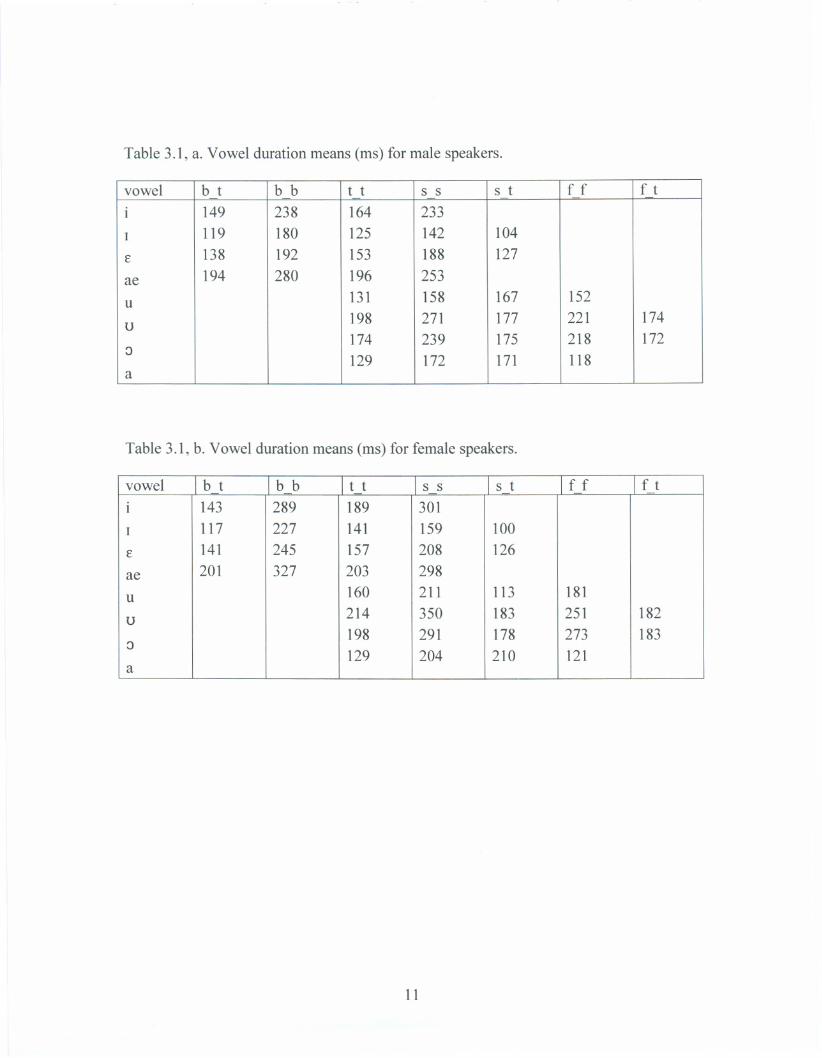
Table 3.1, a. Vowel duration means (ms) for male speakers.
vowel b t b b t t s s s t f f f t
1 149 238 164 233
1 119 180 125 142 104
€ 138 192 153 188 127 194 280 196 253ae
131 158 167 152u 198 271 177 221 174 u 174 239 175 218 172
3 129 172 171 118
a
Table 3.1, b. Vowel duration means (ms) for female speakers.
vowel b t b b It t s s 1st f f 1ft 1 143 289 189 301
I 117 227 141 159 100
€ 141 245 157 208 126 201 327 203 298ae
160 211 113 181u 214 350 183 251 182u 198 291 178 273 183
3 129 204 210 121
a
11
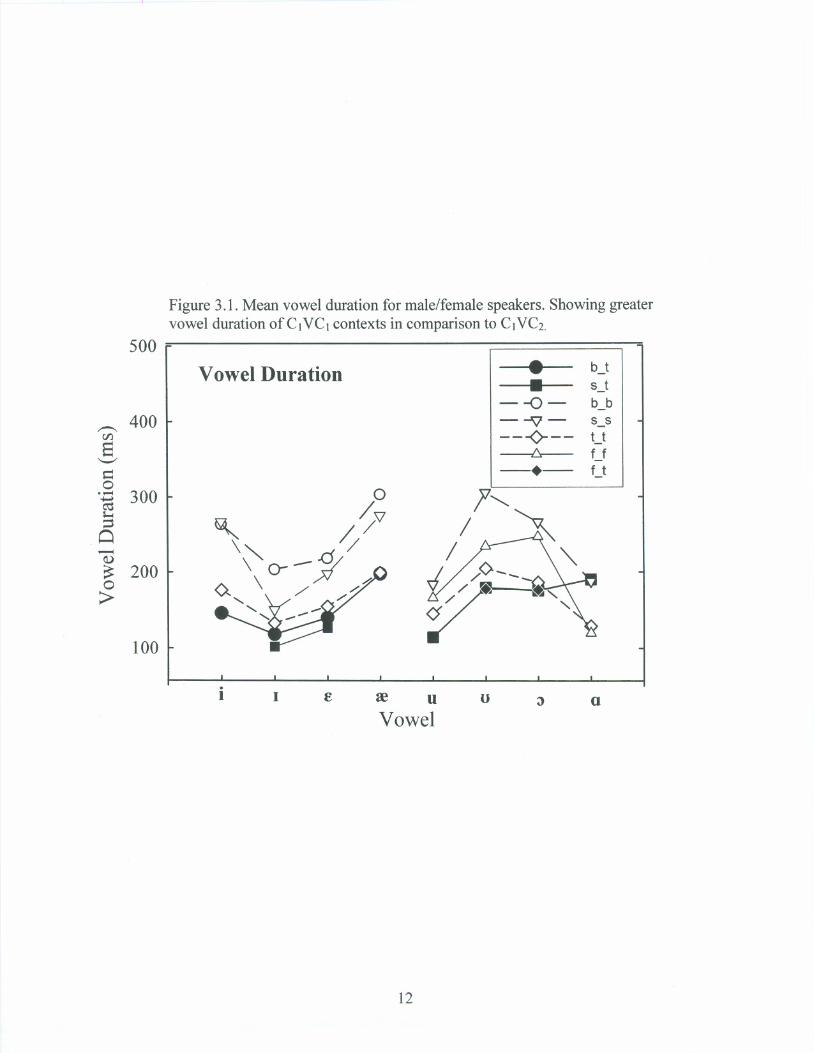
Figure 3.1. Mean vowel duration for male/female speakers. Showing greater vowel duration ofC\VC\ contexts in comparison to C\VC2.
500
Vowel Duration . b_t . s_t - -{) - b_b
~ 400 --s::::;- s_s V'1 ---0--- t_tS --b-- f f '-"
c -+- Ct .-0~ 300 ;....
-0;::3
!U
~ 200 0>
100
i I E re u u J a Vowel
12
Intensity of rms Peak
Intensity peaks were strongest for asymmetrical contexts except for the vowels
Ii, u, u/. In the s_t context the rms peak for lu, ul had the least amount of power but then
became the more powerful with the vowels la, J/. The mean rms intensity peak data
shown in figure 3.2 closely resembles the overall amplitude displayed in figure 3.4.
Similar to the House and Fairbanks (1953) results, vowels in fricative contexts (If, s/)
were more intense than in stop contexts (lb, t/). However when Ibl and ItI are used to
generate an asymmetric context the rms peak intensity has the greatest amplitude of the
front vowels.
13
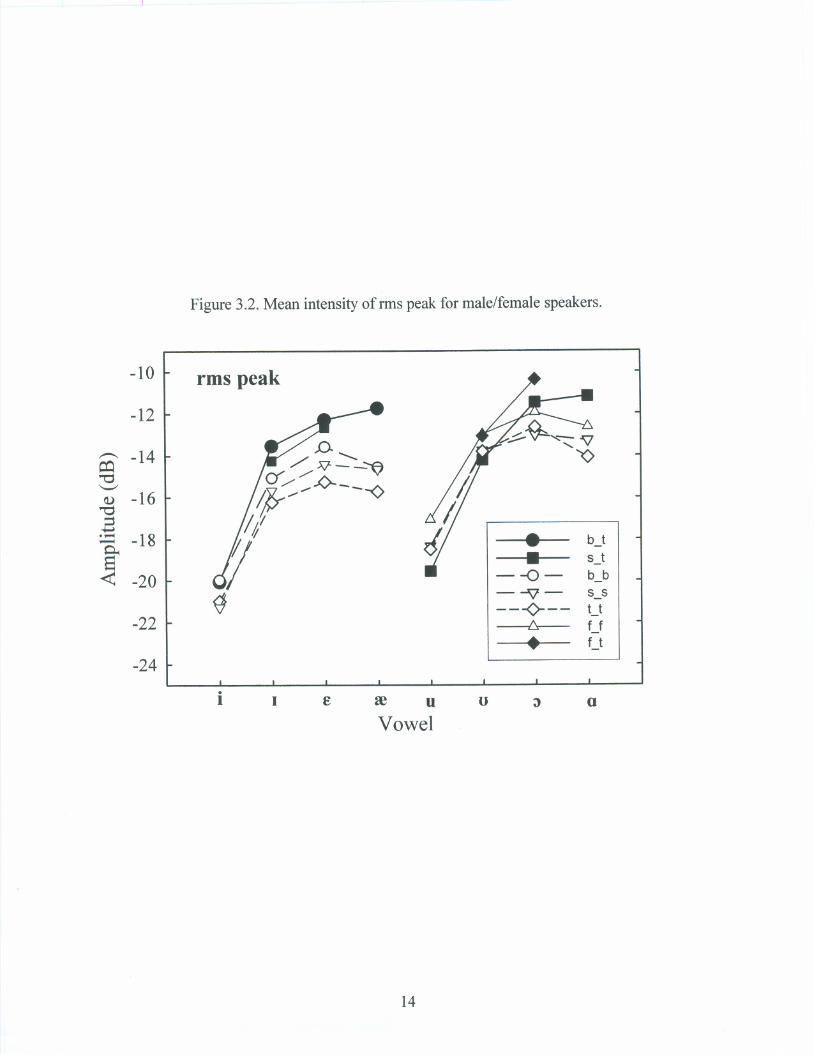
Figure 3.2. Mean intensity ofnns peak for male/female speakers.
-10 rms peak
-12
-14 / J)..
.........
~~,~ '0 '\l
~ "'0 '-" 0"//Z---'(7
Q) -16 /~// ---0"'0
E yf";.::: -18 . b_t
s_t~ . < -20 ~ --0- b_b
- ~ - s_s(j ---0--- U
-22 -t::r-- Cf . Ct
-24
i I £ re u u ~ a Vowel
14
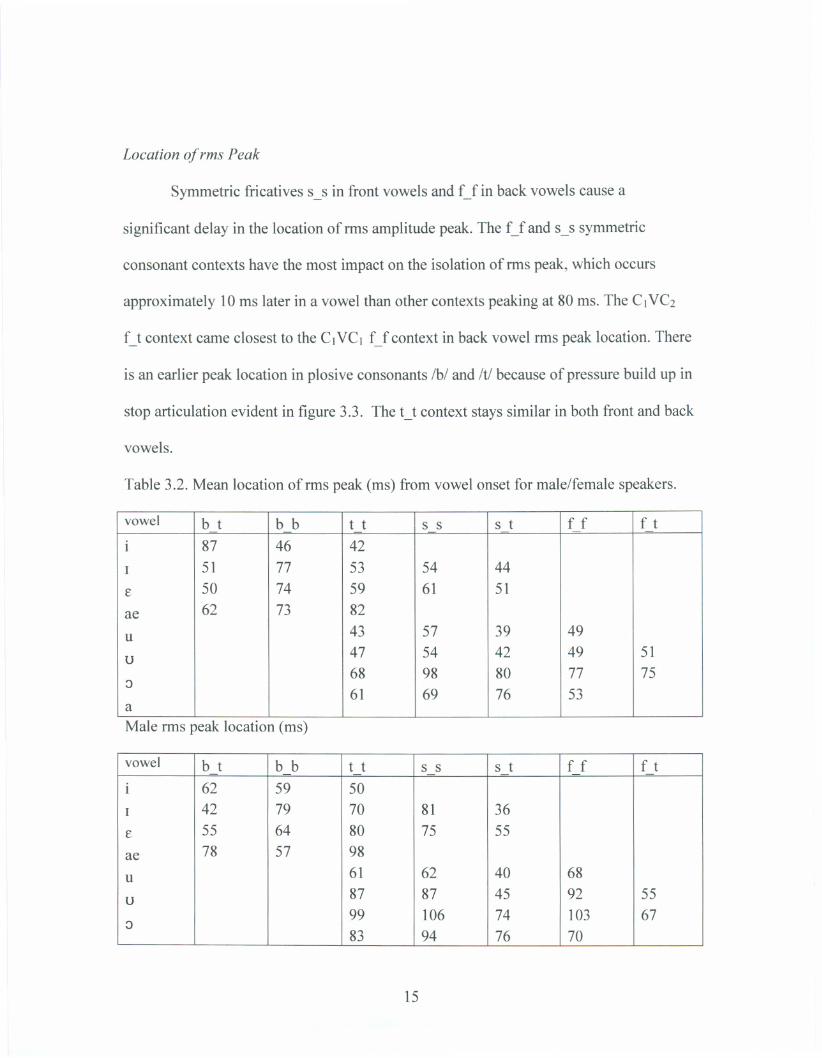
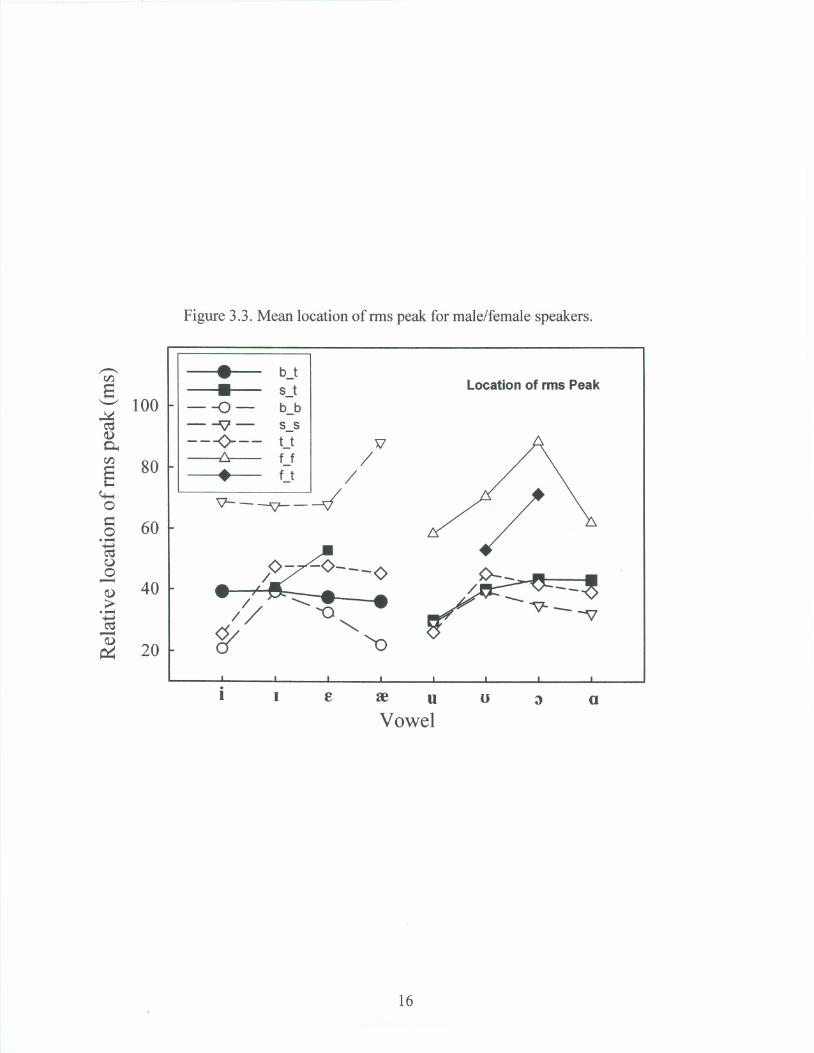
Location of rms Peak
Symmetric fricatives s_s in front vowels and Cfin back vowels cause a
significant delay in the location of rms amplitude peak. The Cf and s- s symmetric
consonant contexts have the most impact on the isolation of rms peak, which occurs
approximately 10 ms later in a vowel than other contexts peaking at 80 ms. The CtVC2
Ct context came closest to the CIVCt Cfcontext in back vowel rms peak location. There
is an earlier peak location in plosive consonants /b/ and /t! because of pressure build up in
stop articulation evident in figure 3.3. The t_t context stays similar in both front and back
vowels.
Table 3.2. Mean location ofrms peak (ms) from vowel onset for male/female speakers.
vowel b t b b t t s s s t f f f t
i 87 46 42
I 51 77 53 54 44
E 50 74 59 61 51
ae 62 73 82
u 43 57 39 49
u 47 54 42 49 51
:J 68 61
98 69
80 76
77 53
75
a
Male rms peak location (ms)
vowel b t b b t t s s s t f f f t
I 62 59 50
I 42 79 70 81 36
E 55 64 80 75 55
ae 78 57 98
u 61 62 40 68
u 87 87 45 92 55
:J 99 106 74 103 67 83 94 76 70
15
----
Figure 3.3. Mean location ofrms peak for male/female speakers.
(/') 8 b_t s . s_t Locationof rms Peak
'-' 100 --0- b_b --v- s_s
(])0.(/') t:r- Cf /e
80 --~--. UCt /
>JI
0 '7-- -'V-- -4 .-00 60
u 0 -.-
(]);>
40 8/ /~---<> 8
- // '0, (])
20 ~ '0
i I I:: re u u J a
Vowe!
16
Overall Amplitude
Comparing the amplitude of different contexts and how overall intensity changes
from one context to another is done in figure 3.4. Generally, overall rms amplitude is
higher for asymmetric contexts (Ct, s_t) in back vowels. There is a significant dB
increase for specific back vowels with fricative consonants such as; /6t! which is the
most intense at -13 dB. Unusually the b- b context had a very high overall amplitude,
greater than the asymmetric contexts, possibly due to a plosive on both sides of the
vowel. The overall rms amplitude figure 3.4 is nearly identical to the data displayed in
the rms peak amplitude figure 3.2.
17
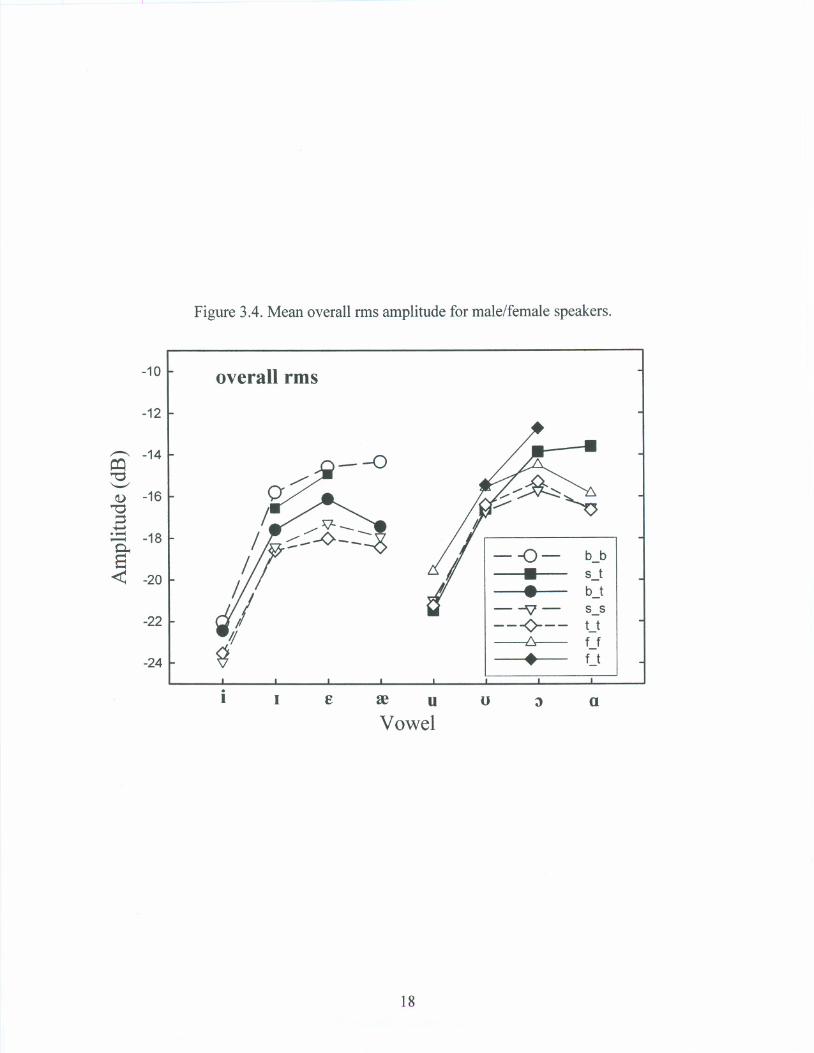
Figure 3.4. Mean overall rms amplitude for male/female speakers.
-10 overall rms
-12
~ -14 c:o '"0'-' Q) -16
'"0 ;:j ....... :.::: -18
~ - -0- b_b.<C -20 5_t . b_t --v- 5_5
-22 ---0--- U ~ff
-24 . f_t
i I e re u u ;) a Vowel
18
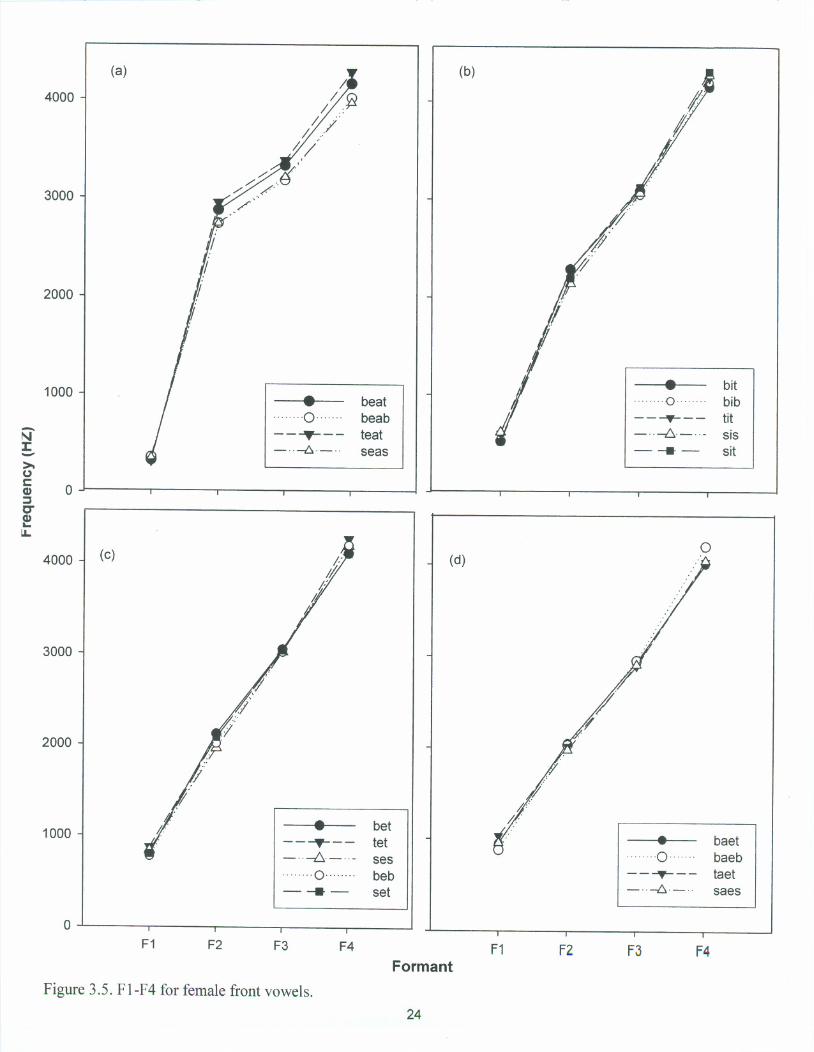
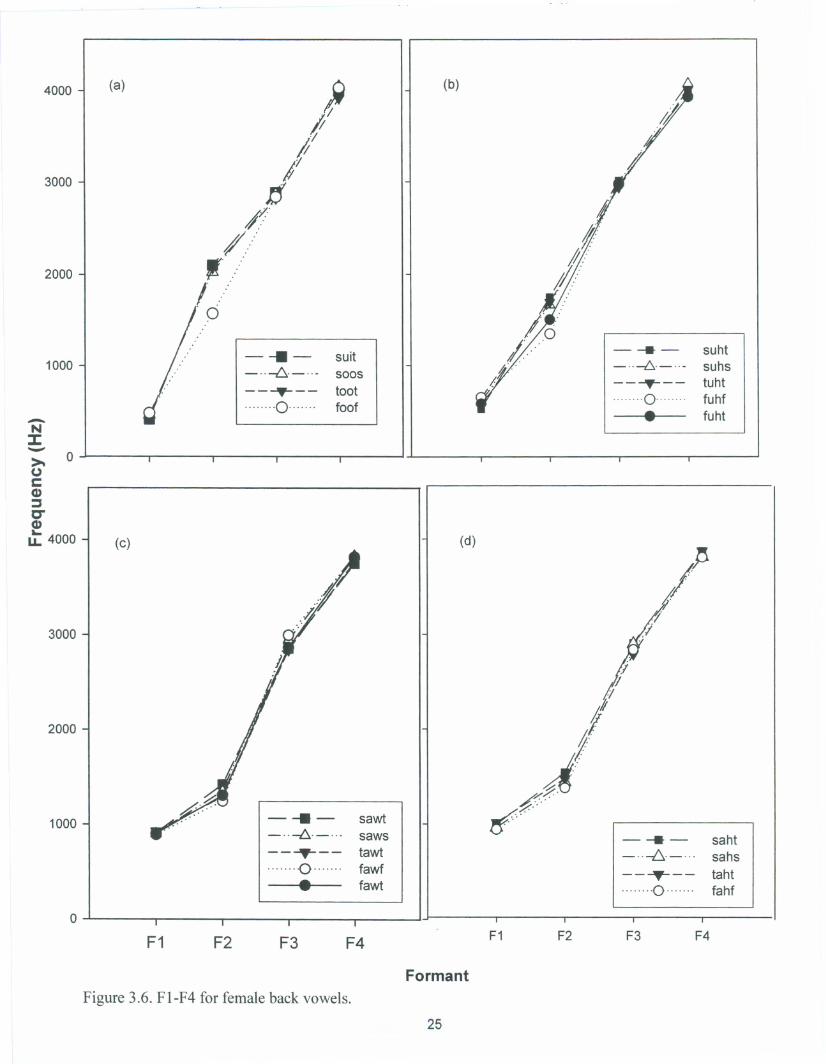
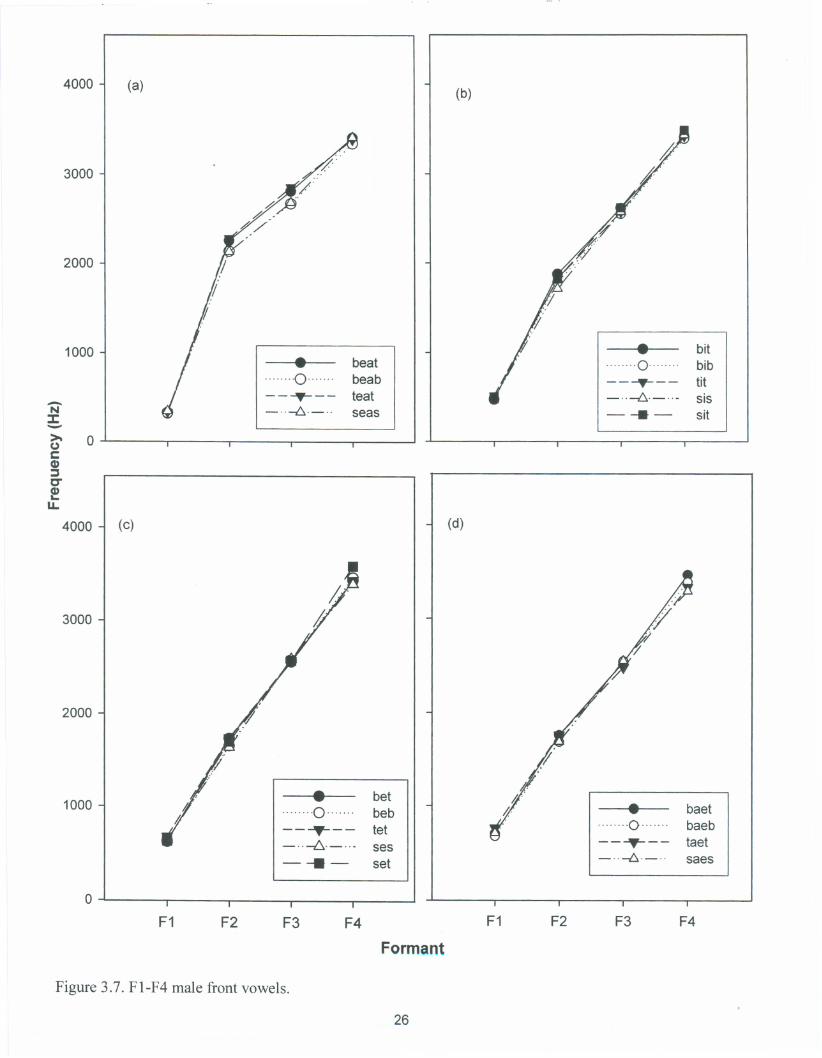
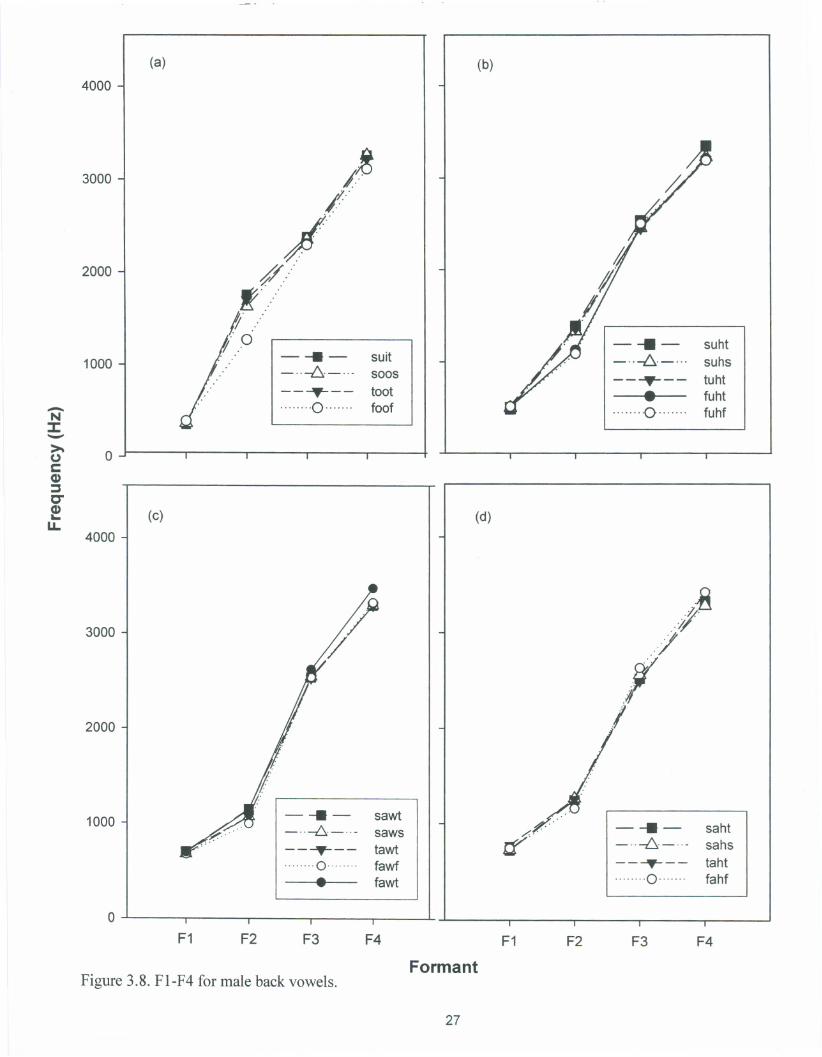
Formant Frequencies
The specific format frequency data is listed in Table 3.3 for front vowels and
Table 3.4 for back vowels. Figures 3.5-3.8 show how formant frequencies are impacted
by the vowel context. Male and female formant frequencies for the front vowels (IE,rei)
were similar in all consonant contexts. Formants were most affected by consonant
context in the back vowels Iu/ and la/. The fricative IfI significantly lowered the F2
frequency in the Cf context evident in figures 3.6(a) and 3.8(a). The Cf and Ct contexts
of the vowellAlin figure 3.6(b) and 3.8(b) both had lower second formant frequencies.
There is a clear distinction between symmetric and asymmetric contexts in F2-F4 for the
vowel iii. The expected result of internal intensity distribution varying among vowels
because of formant variation was accurate.
19
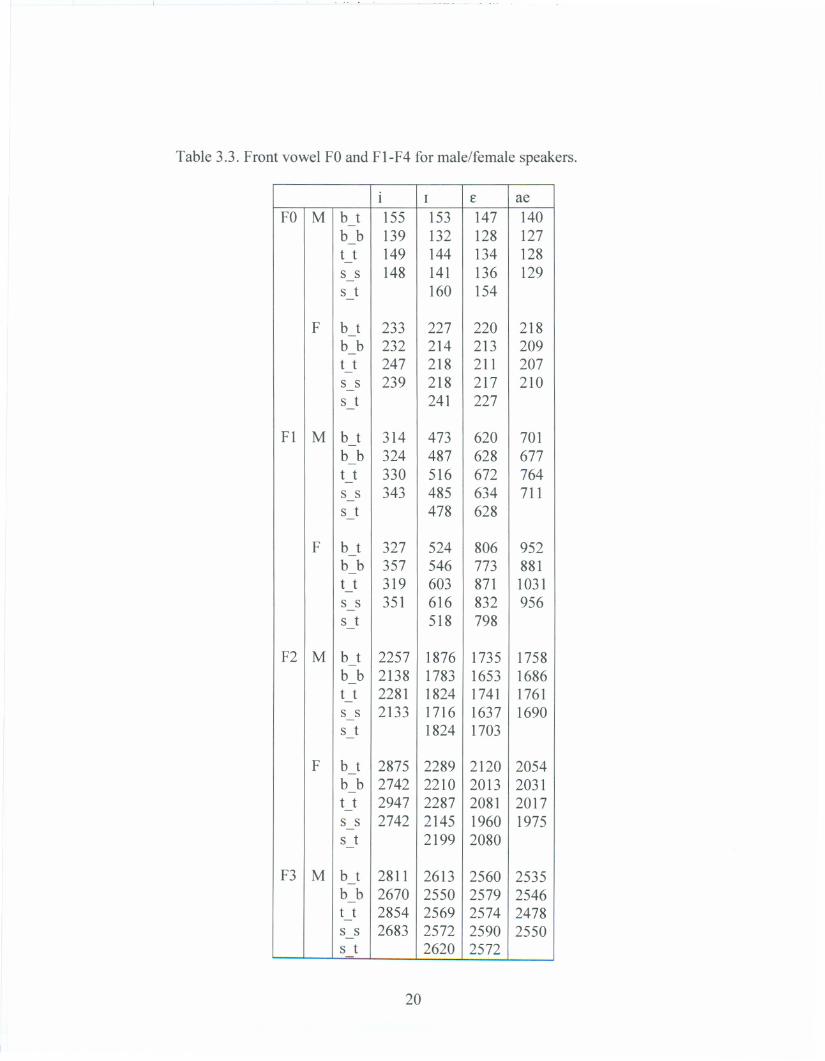
Table 3.3. Front vowel FOand FI-F4 for male/female speakers.
i I € ae FO M b t 155 153 147 140
b b 139 132 128 127 t t 149 144 134 128 s s 148 141 136 129 s t 160 154
F b t 233 227 220 218 b b 232 214 213 209 t t 247 218 211 207 s s 239 218 217 210 s t 241 227
Fl M b t 314 473 620 701 b b 324 487 628 677 t t 330 516 672 764 s s 343 485 634 711 s t 478 628
F b t 327 524 806 952 b b 357 546 773 881 t t 319 603 871 1031 s s 351 616 832 956 s t 518 798
F2 M b t 2257 1876 1735 1758 b b 2138 1783 1653 1686 t t 2281 1824 1741 1761 s s 2133 1716 1637 1690 s t 1824 1703
F b t 2875 2289 2120 2054 b b 2742 2210 2013 2031 t t 2947 2287 2081 2017 s s 2742 2145 1960 1975 s t 2199 2080
F3 M b t 2811 2613 2560 2535 b b 2670 2550 2579 2546 t t 2854 2569 2574 2478 s s 2683 2572 2590 2550 s t 2620 2572
20
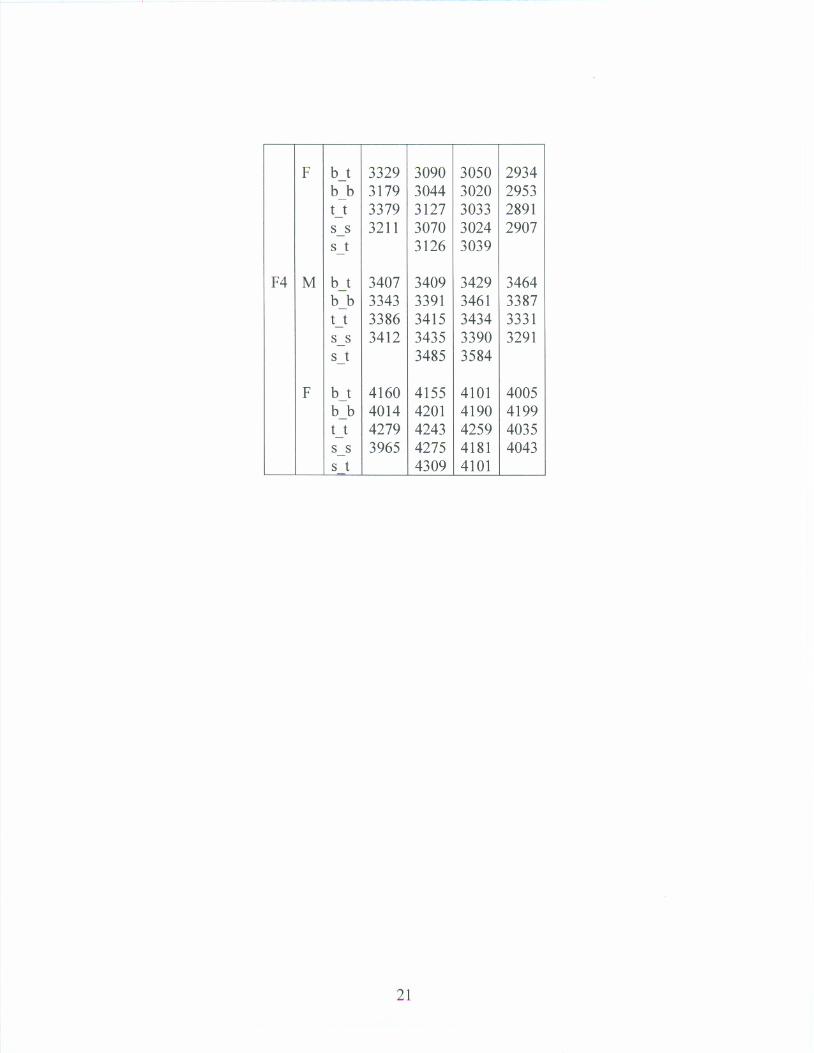
F b t 3329 3090 3050 2934 b b 3179 3044 3020 2953 t t 3379 3127 3033 2891 s s 3211 3070 3024 2907 s t 3126 3039
F4 M b t 3407 3409 3429 3464 b b 3343 3391 3461 3387 t t 3386 3415 3434 3331 s s 3412 3435 3390 3291 s t 3485 3584
F b t 4160 4155 4101 4005 b b 4014 4201 4190 4199 t t 4279 4243 4259 4035 s s 3965 4275 4181 4043 s t 4309 4101
21
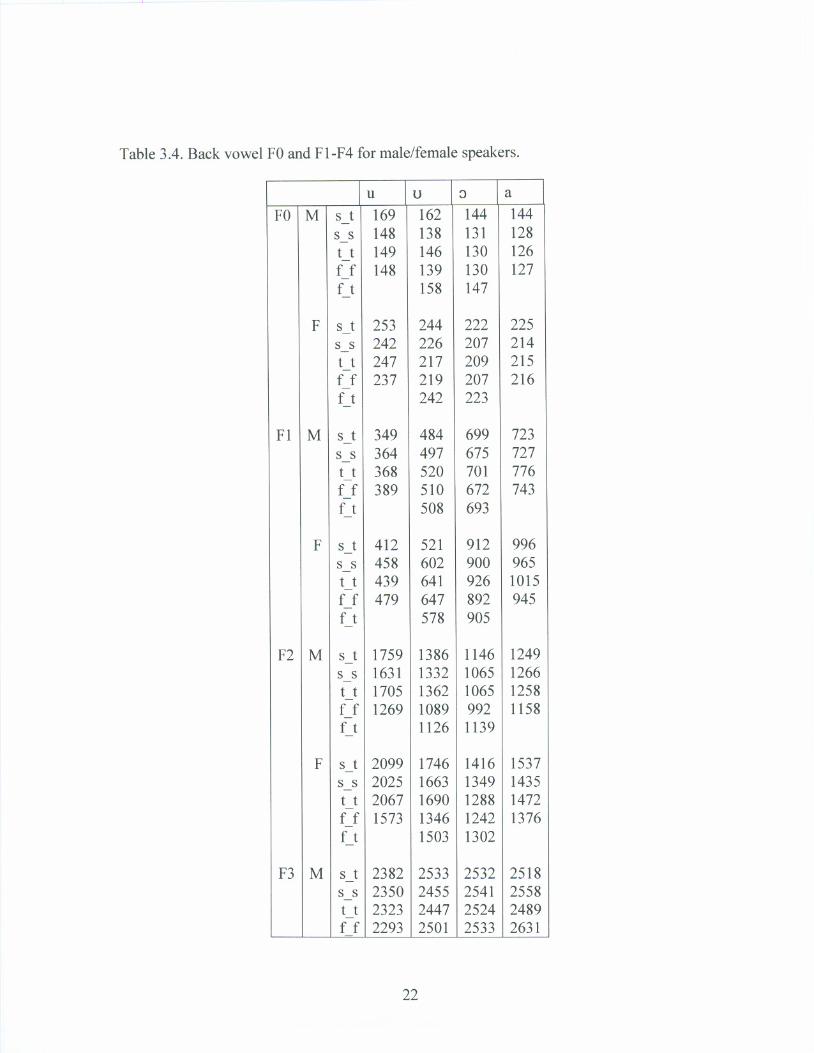
Table 3.4. Back vowel FOand FI-F4 for male/female speakers.
u u ::> a
FO M s t 169 162 144 144 s s 148 138 131 128 t t 149 146 130 126 f f 148 139 130 127 f t 158 147
F s t 253 244 222 225 s s 242 226 207 214 t t 247 217 209 215 f f 237 219 207 216 f t 242 223
Fl M s t 349 484 699 723 s s 364 497 675 727 t t 368 520 701 776 f f 389 510 672 743 f t 508 693
F s t 412 521 912 996 s s 458 602 900 965 t t 439 641 926 1015 f f 479 647 892 945 f t 578 905
F2 M s t 1759 1386 1146 1249 s s 1631 1332 1065 1266 t t 1705 1362 1065 1258 f f 1269 1089 992 1158 f t 1126 1139
F s t 2099 1746 1416 1537 s s 2025 1663 1349 1435 t t 2067 1690 1288 1472 f f 1573 1346 1242 1376 f t 1503 1302
F3 M s t 2382 2533 2532 2518 s s 2350 2455 2541 2558 t t 2323 2447 2524 2489 f f 2293 2501 2533 2631
22
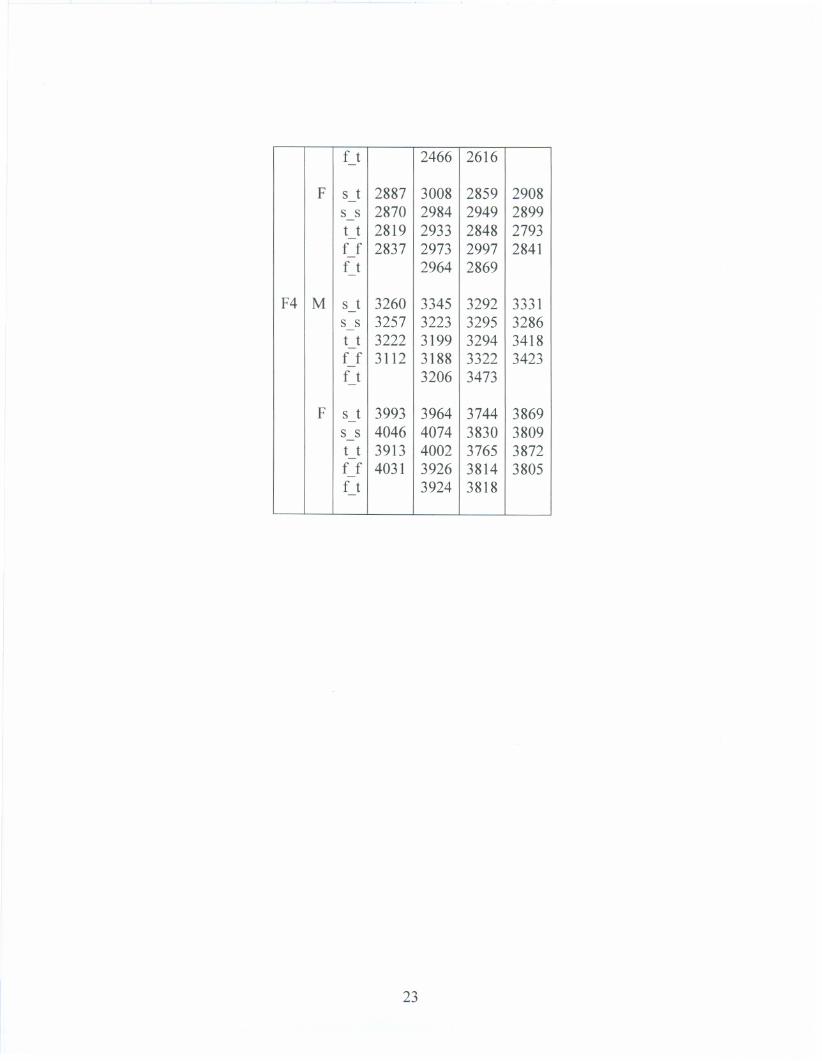
f t 2466 2616
F s t 2887 3008 2859 2908 s s 2870 2984 2949 2899 t t 2819 2933 2848 2793 f f 2837 2973 2997 2841 f t 2964 2869
F4 M s t 3260 3345 3292 3331 s s 3257 3223 3295 3286 t t 3222 3199 3294 3418 f f 3112 3188 3322 3423 f t 3206 3473
F s t 3993 3964 3744 3869 s s 4046 4074 3830 3809 t t 3913 4002 3765 3872 f f 4031 3926 3814 3805 f t 3924 3818
23
4000
(a) (b)
3000
2000
1/
1000
-NJ:- _..~
---0
beat beab teat seas
. 0
--~-- ..-1::::..- .. ---8
bit bib tit sis sit
t:Q) 0:J C"
LL
4000 J (c) !-; ;#
Ii II
~
(d) 0
3000
2000
1000 I/'
t/l
-
. /:::" 0
-8 -
bet tet ses beb set
f /.
---0
---T--_..~_..
baet baeb taet saes
0 F1 F2 F3 F4 F1 F2 F3 F4
Formant
Figure 3.5. FI-F4 for female front vowels. 24
4000 (a) (b)
;/I ;'1
3000
2000
;'/
If /1'
//': I:::
! 'p
1000
-NJ: -
- -II -l::
--~-.0
suit soos toot foof
- -/::::
--~-0 .
-- suht suhs tuht fuhffuht
~ 0 (,) C CD ::::J tr CD ...
u.. 4000 (c) (d)
/ 3000
2000
r; 1/
'lII
~J 1000 - -
/) ---T--"",,,0,,,,,,, .
sawt saws tawt fawffawt
,r~:" -_..~ --~-
0
-- - saht sahs taht fahf
0
F1 F2 F3 F4 F1 F2 F3 F4
Formant
Figure 3.6. FI-F4 for female back vowels.
25
4000 (a) (b)
3000
2000
1000 . beat . 0
bit bib
- 0 ---T--
beab teat
---T--_..~._m
tit sis
N:I:- _..~ seas - -- - sit >U C
0
CD :J 0" ~
LL
4000 (c) (d)
3000 ~ ~
'7
2000
.,f
1000 . .. -0. ...... ---T--
bet beb tet
/ .h'
1/ . 0
baet baeb
_.. -/::;:..- ... ses --~- taet - - set _..~ saes
0
F1 F2 F3 F4 F1 F2 F3 F4
Formant
Figure 3.7.FI-F4 male front vowels.
26
4000
(a) (b)
3000 ,$
2000 ;tit
fJ:::
-N:I:-
1000 - -_..~ --~-
0
IJ!/ f.9 suit
5005
toot foof
--8-.. -1::1. --~-
. ",,,,,0,,,,,,,
suht suhs tuhtfuht fuhf
CJ C G) := 0"
LL
0
4000 I (c) (d)
3000
(/ ~ .;~s
2000
f/~ .I
1000 -_..~ --~-""",,0
.
- sawt saws tawt fawf
fawt
,/.;" .
rr" -_..~ --~-
..0
- saht sahs taht fahf
0
F1 F2 F3
Figure 3.8. FI-F4 for male back vowels.
F4
Formant F1 F2 F3 F4
27
References
Aaltonen, O. (1985). The effects of relative amplitude levels of F2 and F3 on the
categorization of synthetic vowels. Journal of Phonetics, 13, 1-9.
Answorth, W. A. (1972). Duration as a cue in the recognition of synthetic vowels.
Journal of the Acoustical Society of America, 51, 648-651.
Answorth, W. A. (1981). Duration as a factor in the recognition of synthetic vowels.
Journal of Phonetics, 9, 333-342.
Fant, C.G. (1956). On the predictability of formant levels and spectrum envelops from
formant frequencies. In M. Halle, H. G. Lunt, H. McLean, & C. H. Van
Schooneveld (Eds.), For Roman Jakobson: Essays on the occasion ofhis sixtieth
birthday (pp. 109-120).The Hague: Mouton & Co.
Gottfried, T. L. & Beddor, P. S. (1988). Perception of temporal and spectral information
in French vowels. Language and Speech, 31, 57-75.
Hillenbrand, J. M.; Getty, L. A.; Clark M. J.; Wheeler K. (1995). Acoustic characteristics
of American English vowels. Journal of the Acoustical Society of America, 97,
3099-3111.
Hillenbrand, J. M.; Clark, M. J.; Nearey, T. M. (2001). Effects of consonantal
environment on vowel formant patterns. Journal of the Acoustical Society of
America, 109, 748-763.
House, A. & Fairbanks, G. (1953). The influence of consonant environment upon the
secondary acoustical characteristic of vowels. Journal of the Acoustical Society of
America, 22,105-113.
28
Katz, W. F & Assmann, P. F. (2001). Identification of children's and adults' vowels:
intrinsic fundamental frequency, fundamental frequency dynamics, and presence
of voicing. Journal of Phonetics, 29, 23-51.
Lindqvist, 1. & Pauli, S. (1968). The role of relative spectrum levels in vowel perception.
Speech Transmission Laboratory Quarterly Progress Status Report (STL-QPSR
2/3): 19-35.
Mermelstein, P. (1978). On the relationship between vowel and consonant identification
when cued by the same acoustic information. Perception and Psychophysics, 23,
331-336.
Miller, R. L. (1953). Auditory tests with synthetic vowels. Journal of the Acoustical
Society of America, 25, 114-121.
Nearey, T. M. (1989). Static, dynamic and relational properties in vowel perception.
Journal of the Acoustical Society of America, 85, 2088-2113.
Peterson G. E. & Barney, H. L. (1952). Control methods used in a study of the vowels.
Journal of the Acoustical Society of America, 24, 175-184.
Stevens, K. N., & House, A. S. (1963). Perurbation of vowel articulations by consonantal
context: An acoustical study. Journal of Speech and Hearing Research, 6, 111
128.
Whalen, D. H. (1989). Vowel and consonant judgments are not independent when cued
by the same information. Perception and Psychophysics, 46, 284-292.
Whalen, D. H. & Levitt, A.G. (1995). The universality of intrinsic FOof vowels, Journal ..
of Phonetics, 23, 349-366.
29


![SP07 cs294 lecture 9 -- acoustic models.ppt [Read-Only]klein/cs294-7... · bab: closure of lips lowers all formants: so rapid increase in all formants at beginning of "bab” dad:](https://img.pdfslide.us/doc/110x75/5eca77b592704d49e73367d2/sp07-cs294-lecture-9-acoustic-read-only-kleincs294-7-bab-closure-of.jpg)