Embed Size (px)
Citation preview
Vanguard Institutional Target
Retirement Funds
Vanguard Institutional Target Retirement 2040 Fund
Vanguard Institutional Target Retirement 2045 Fund
Vanguard Institutional Target Retirement 2050 Fund
Vanguard Institutional Target Retirement 2055 Fund
Vanguard Institutional Target Retirement 2060 Fund
Vanguard Institutional Target Retirement 2065 Fund
Semiannual Report | March 31, 2018
Contents
Please note: The opinions expressed in this report are just that—informed opinions. They should not be considered promisesor advice. Also, please keep in mind that the information and opinions cover the period through the date on the front of thisreport. Of course, the risks of investing in your fund are spelled out in the prospectus.
See the Glossary for definitions of investment terms used in this report.About the cover: Nautical images have been part of Vanguard’s rich heritage since its start in 1975. For anincoming ship, a lighthouse offers a beacon and safe path to shore. You can similarly depend on Vanguard to putyou first––and light the way––as you strive to meet your financial goals. Our client focus and low costs,stemming from our unique ownership structure, assure that your interests are paramount.
Vanguard’s Principles for Investing Success
We want to give you the best chance of investment success. Theseprinciples, grounded in Vanguard’s research and experience, can put you onthe right path.
Goals. Create clear, appropriate investment goals.
Balance. Develop a suitable asset allocation using broadly diversified funds.
Cost. Minimize cost.
Discipline. Maintain perspective and long-term discipline.
A single theme unites these principles: Focus on the things you can control.We believe there is no wiser course for any investor.
Your Fund’s Performance at a Glance. . . . . . . . . . . . . . . . . . 1
CEO’s Perspective. . . . . . . . . . . . . . . . . . . . . . . . . . . . . . . . . 3
Results of Proxy Voting. . . . . . . . . . . . . . . . . . . . . . . . . . . . . 5
Institutional Target Retirement 2040 Fund. . . . . . . . . . . . . . .7
Institutional Target Retirement 2045 Fund. . . . . . . . . . . . . .17
Institutional Target Retirement 2050 Fund. . . . . . . . . . . . . .27
Institutional Target Retirement 2055 Fund. . . . . . . . . . . . . .37
Institutional Target Retirement 2060 Fund. . . . . . . . . . . . . .47
Institutional Target Retirement 2065 Fund. . . . . . . . . . . . . .57
About Your Fund’s Expenses. . . . . . . . . . . . . . . . . . . . . . . . 68
Trustees Approve Advisory Arrangements. . . . . . . . . . . . . .70
Glossary. . . . . . . . . . . . . . . . . . . . . . . . . . . . . . . . . . . . . . . . 72
Your Fund’s Performance at a Glance
1
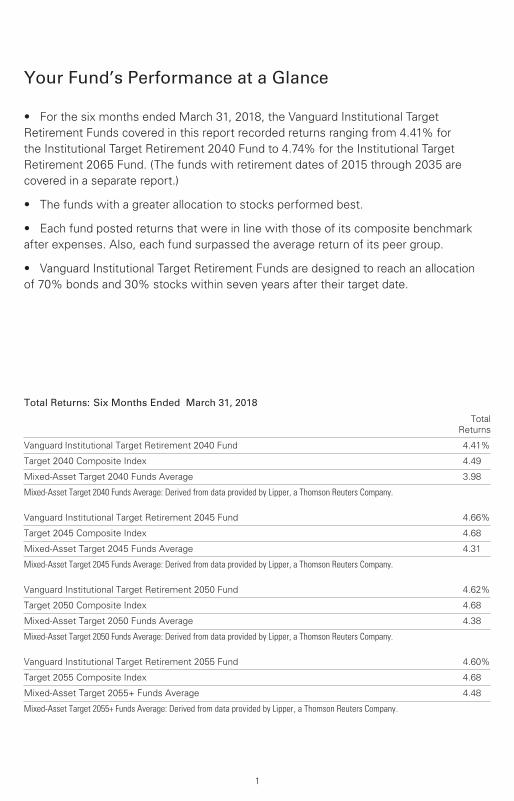
Total Returns: Six Months Ended March 31, 2018
TotalReturns
Vanguard Institutional Target Retirement 2040 Fund 4.41%
Target 2040 Composite Index 4.49
Mixed-Asset Target 2040 Funds Average 3.98
Mixed-Asset Target 2040 Funds Average: Derived from data provided by Lipper, a Thomson Reuters Company.
Vanguard Institutional Target Retirement 2045 Fund 4.66%
Target 2045 Composite Index 4.68
Mixed-Asset Target 2045 Funds Average 4.31
Mixed-Asset Target 2045 Funds Average: Derived from data provided by Lipper, a Thomson Reuters Company.
Vanguard Institutional Target Retirement 2050 Fund 4.62%
Target 2050 Composite Index 4.68
Mixed-Asset Target 2050 Funds Average 4.38
Mixed-Asset Target 2050 Funds Average: Derived from data provided by Lipper, a Thomson Reuters Company.
Vanguard Institutional Target Retirement 2055 Fund 4.60%
Target 2055 Composite Index 4.68
Mixed-Asset Target 2055+ Funds Average 4.48
Mixed-Asset Target 2055+ Funds Average: Derived from data provided by Lipper, a Thomson Reuters Company.
• For the six months ended March 31, 2018, the Vanguard Institutional Target Retirement Funds covered in this report recorded returns ranging from 4.41% for the Institutional Target Retirement 2040 Fund to 4.74% for the Institutional Target Retirement 2065 Fund. (The funds with retirement dates of 2015 through 2035 are covered in a separate report.)
• The funds with a greater allocation to stocks performed best.
• Each fund posted returns that were in line with those of its composite benchmark after expenses. Also, each fund surpassed the average return of its peer group.
• Vanguard Institutional Target Retirement Funds are designed to reach an allocation of 70% bonds and 30% stocks within seven years after their target date.
2
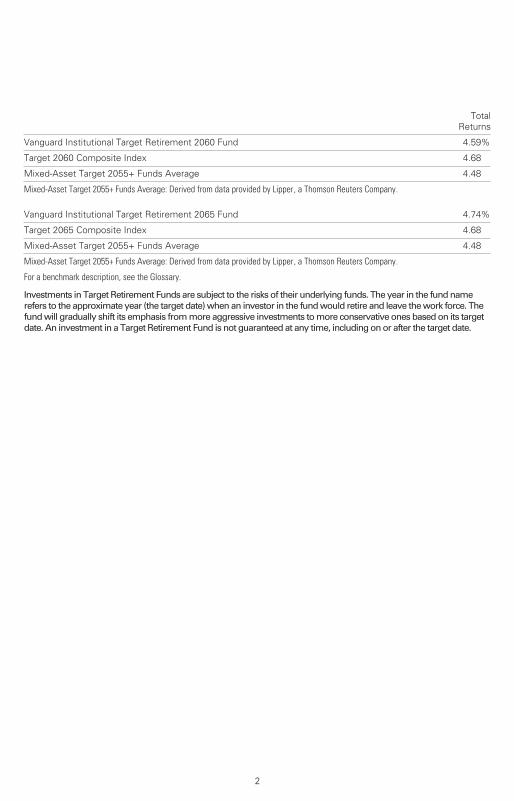
TotalReturns
Vanguard Institutional Target Retirement 2060 Fund 4.59%
Target 2060 Composite Index 4.68
Mixed-Asset Target 2055+ Funds Average 4.48
Mixed-Asset Target 2055+ Funds Average: Derived from data provided by Lipper, a Thomson Reuters Company.
Vanguard Institutional Target Retirement 2065 Fund 4.74%
Target 2065 Composite Index 4.68
Mixed-Asset Target 2055+ Funds Average 4.48
Mixed-Asset Target 2055+ Funds Average: Derived from data provided by Lipper, a Thomson Reuters Company.
For a benchmark description, see the Glossary.
Investments in Target Retirement Funds are subject to the risks of their underlying funds. The year in the fund name refers to the approximate year (the target date) when an investor in the fund would retire and leave the work force. The fund will gradually shift its emphasis from more aggressive investments to more conservative ones based on its target date. An investment in a Target Retirement Fund is not guaranteed at any time, including on or after the target date.

Dear Shareholder,
I feel extremely fortunate to have the chance to lead a company filled with people who come to work every day passionate about Vanguard’s core purpose: to take a stand for all investors, to treat them fairly, and to give them the best chance for investment success.
When I joined Vanguard in 1991, I found a mission-driven team focused on improving lives—helping people retire more comfortably, put their children through college, and achieve financial security. I also found a company with purpose in an industry ripe for improvement.
It was clear, even early in my career, that the cards were stacked against most investors. Hidden fees, performance-chasing, and poor advice were relentlessly eroding investors’ dreams.
We knew Vanguard could be different and, as a result, could make a real difference. We have lowered the costs of investing for our shareholders significantly. And we’re proud of the performance of our funds.
Vanguard is built for Vanguard investors—we focus solely on you, our fund shareholders. Everything we do is designed to give our clients the best chance for investment success. In my role as CEO, I’ll keep this priority
CEO’s Perspective
Tim Buckley
President and Chief Executive Officer
3
front and center. We’re proud of what
we’ve achieved, but we’re even more
excited about what’s to come.
Steady, time-tested guidance
Our guidance for investors, as always, is
to stay the course, tune out the hyperbolic
headlines, and focus on your goals and
what you can control, such as costs and
how much you save. This time-tested
advice has served our clients well over
the decades.
Regardless of how the markets perform
in the short term, I’m incredibly optimistic
about the future for our investors. We
have a dedicated team serving you,
and we will never stop striving to make
Vanguard the best place for you to
invest through our high-quality funds
and services, advice and guidance
to help you meet your financial goals,
and an experience that makes you
feel good about entrusting us with
your hard-earned savings.
Thank you for your continued loyalty.
Sincerely,
Mortimer J. Buckley
President and Chief Executive Officer
April 13, 2018
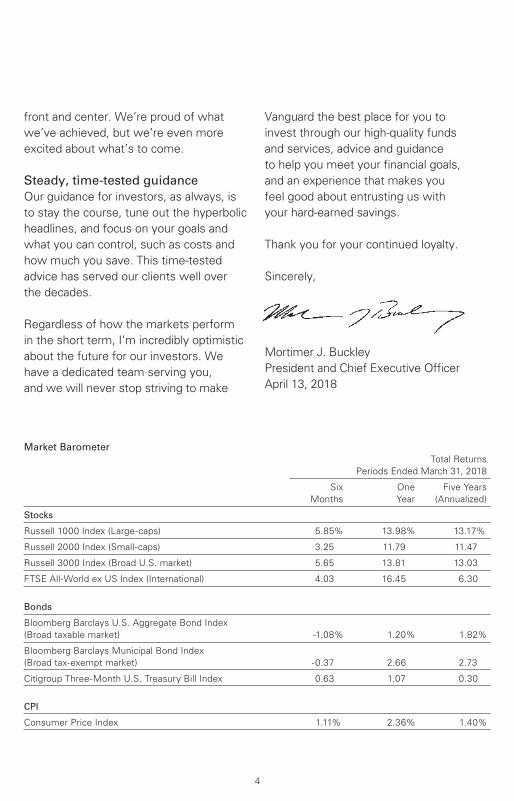
Market Barometer
Total Returns
Periods Ended March 31, 2018
Six One Five Years
Months Year (Annualized)
Stocks
Russell 1000 Index (Large-caps) 5.85% 13.98% 13.17%
Russell 2000 Index (Small-caps) 3.25 11.79 11.47
Russell 3000 Index (Broad U.S. market) 5.65 13.81 13.03
FTSE All-World ex US Index (International) 4.03 16.45 6.30
Bonds
Bloomberg Barclays U.S. Aggregate Bond Index
(Broad taxable market) -1.08% 1.20% 1.82%
Bloomberg Barclays Municipal Bond Index
(Broad tax-exempt market) -0.37 2.66 2.73
Citigroup Three-Month U.S. Treasury Bill Index 0.63 1.07 0.30
CPI
Consumer Price Index 1.11% 2.36% 1.40%
4
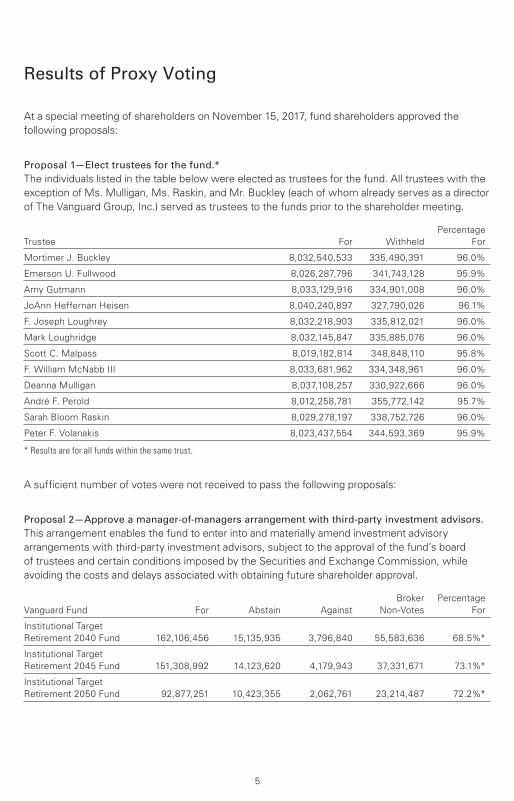
Results of Proxy Voting
At a special meeting of shareholders on November 15, 2017, fund shareholders approved the
following proposals:
Proposal 1—Elect trustees for the fund.*
The individuals listed in the table below were elected as trustees for the fund. All trustees with the
exception of Ms. Mulligan, Ms. Raskin, and Mr. Buckley (each of whom already serves as a director
of The Vanguard Group, Inc.) served as trustees to the funds prior to the shareholder meeting.
Percentage
Trustee For Withheld For
Mortimer J. Buckley 8,032,540,533 335,490,391 96.0%
Emerson U. Fullwood 8,026,287,796 341,743,128 95.9%
Amy Gutmann 8,033,129,916 334,901,008 96.0%
JoAnn Heffernan Heisen 8,040,240,897 327,790,026 96.1%
F. Joseph Loughrey 8,032,218,903 335,812,021 96.0%
Mark Loughridge 8,032,145,847 335,885,076 96.0%
Scott C. Malpass 8,019,182,814 348,848,110 95.8%
F. William McNabb III 8,033,681,962 334,348,961 96.0%
Deanna Mulligan 8,037,108,257 330,922,666 96.0%
André F. Perold 8,012,258,781 355,772,142 95.7%
Sarah Bloom Raskin 8,029,278,197 338,752,726 96.0%
Peter F. Volanakis 8,023,437,554 344,593,369 95.9%
* Results are for all funds within the same trust.
A sufficient number of votes were not received to pass the following proposals:
Proposal 2—Approve a manager-of-managers arrangement with third-party investment advisors.
This arrangement enables the fund to enter into and materially amend investment advisory
arrangements with third-party investment advisors, subject to the approval of the fund’s board
of trustees and certain conditions imposed by the Securities and Exchange Commission, while
avoiding the costs and delays associated with obtaining future shareholder approval.
Broker Percentage
Vanguard Fund For Abstain Against Non-Votes For
Institutional Target
Retirement 2040 Fund 162,106,456 15,135,935 3,796,840 55,583,636 68.5%*
Institutional Target
Retirement 2045 Fund 151,308,992 14,123,620 4,179,943 37,331,671 73.1%*
Institutional Target
Retirement 2050 Fund 92,877,251 10,423,355 2,062,761 23,214,487 72.2%*
5
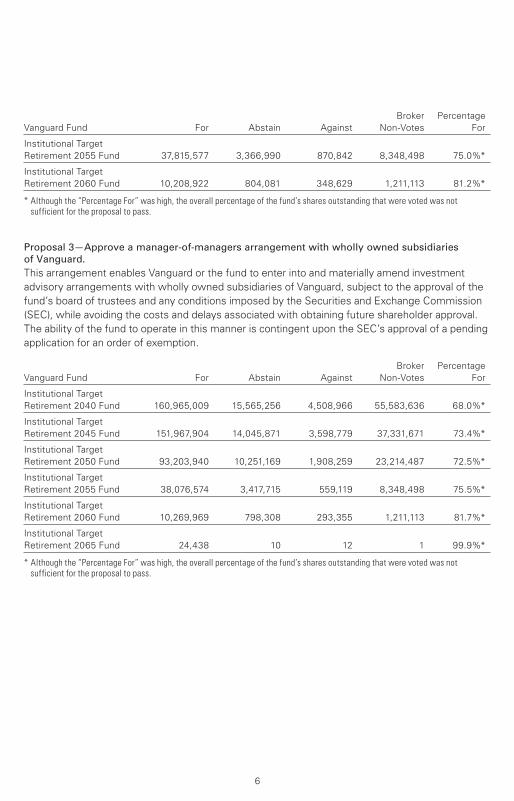
Broker Percentage
Vanguard Fund For Abstain Against Non-Votes For
Institutional Target
Retirement 2055 Fund 37,815,577 3,366,990 870,842 8,348,498 75.0%*
Institutional Target
Retirement 2060 Fund 10,208,922 804,081 348,629 1,211,113 81.2%*
* Although the “Percentage For” was high, the overall percentage of the fund’s shares outstanding that were voted was not sufficient for the proposal to pass.
Proposal 3—Approve a manager-of-managers arrangement with wholly owned subsidiaries
of Vanguard.
This arrangement enables Vanguard or the fund to enter into and materially amend investment
advisory arrangements with wholly owned subsidiaries of Vanguard, subject to the approval of the
fund’s board of trustees and any conditions imposed by the Securities and Exchange Commission
(SEC), while avoiding the costs and delays associated with obtaining future shareholder approval.
The ability of the fund to operate in this manner is contingent upon the SEC’s approval of a pending
application for an order of exemption.
Broker Percentage
Vanguard Fund For Abstain Against Non-Votes For
Institutional Target
Retirement 2040 Fund 160,965,009 15,565,256 4,508,966 55,583,636 68.0%*
Institutional Target
Retirement 2045 Fund 151,967,904 14,045,871 3,598,779 37,331,671 73.4%*
Institutional Target
Retirement 2050 Fund 93,203,940 10,251,169 1,908,259 23,214,487 72.5%*
Institutional Target
Retirement 2055 Fund 38,076,574 3,417,715 559,119 8,348,498 75.5%*
Institutional Target
Retirement 2060 Fund 10,269,969 798,308 293,355 1,211,113 81.7%*
Institutional Target
Retirement 2065 Fund 24,438 10 12 1 99.9%*
* Although the “Percentage For” was high, the overall percentage of the fund’s shares outstanding that were voted was not sufficient for the proposal to pass.
6
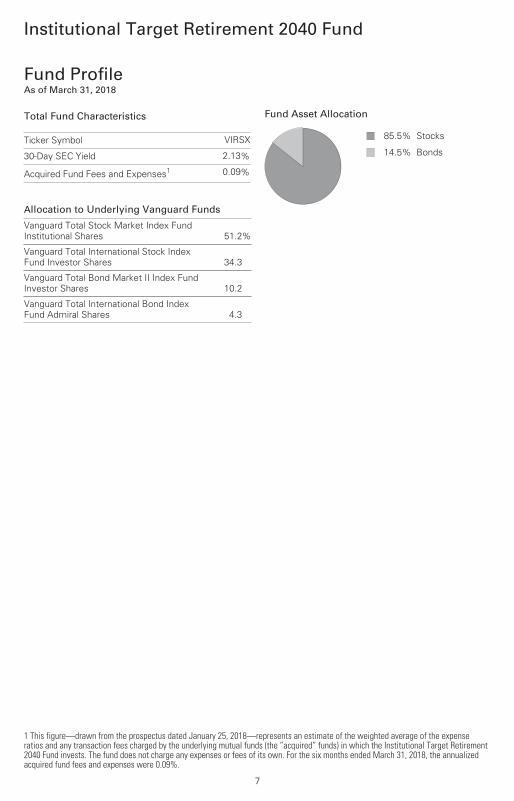
Institutional Target Retirement 2040 Fund
Fund ProfileAs of March 31, 2018
1 This figure—drawn from the prospectus dated January 25, 2018—represents an estimate of the weighted average of the expenseratios and any transaction fees charged by the underlying mutual funds (the ”acquired” funds) in which the Institutional Target Retirement2040 Fund invests. The fund does not charge any expenses or fees of its own. For the six months ended March 31, 2018, the annualizedacquired fund fees and expenses were 0.09%.
7
Allocation to Underlying Vanguard Funds
Vanguard Total Stock Market Index Fund
Institutional Shares 51.2%
Vanguard Total International Stock Index
Fund Investor Shares 34.3
Vanguard Total Bond Market II Index Fund
Investor Shares 10.2
Vanguard Total International Bond Index
Fund Admiral Shares 4.3
Total Fund Characteristics
Ticker Symbol VIRSX
30-Day SEC Yield 2.13%
Acquired Fund Fees and Expenses1 0.09%
Fund Asset Allocation
85.5% Stocks
14.5% Bonds
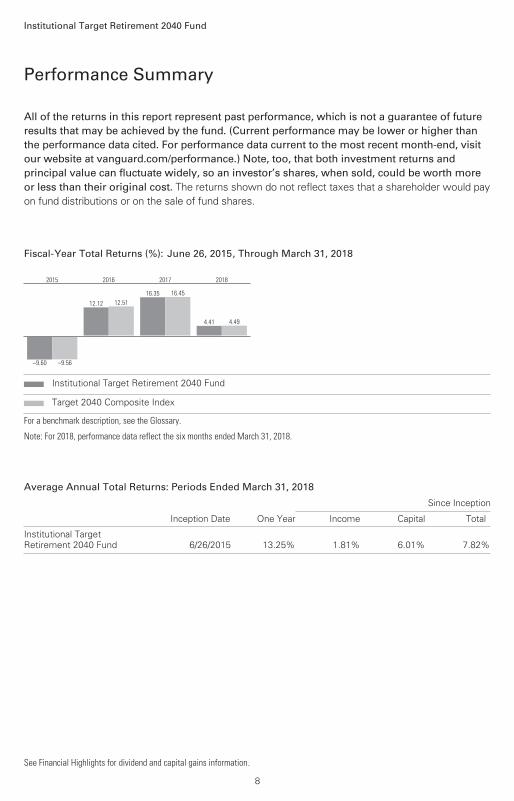
All of the returns in this report represent past performance, which is not a guarantee of future results that may be achieved by the fund. (Current performance may be lower or higher thanthe performance data cited. For performance data current to the most recent month-end, visitour website at vanguard.com/performance.) Note, too, that both investment returns and principal value can fluctuate widely, so an investor’s shares, when sold, could be worth more or less than their original cost. The returns shown do not reflect taxes that a shareholder would pay
on fund distributions or on the sale of fund shares.
Performance Summary
Institutional Target Retirement 2040 Fund
See Financial Highlights for dividend and capital gains information.
8
Fiscal-Year Total Returns (%): June 26, 2015, Through March 31, 2018
–9.60 –9.56
2015
12.12 12.51
2016
16.35 16.45
2017
4.41 4.49
2018
Institutional Target Retirement 2040 Fund
Target 2040 Composite Index
For a benchmark description, see the Glossary.
Note: For 2018, performance data reflect the six months ended March 31, 2018.
Average Annual Total Returns: Periods Ended March 31, 2018
Since Inception
Inception Date One Year Income Capital Total
Institutional Target
Retirement 2040 Fund 6/26/2015 13.25% 1.81% 6.01% 7.82%
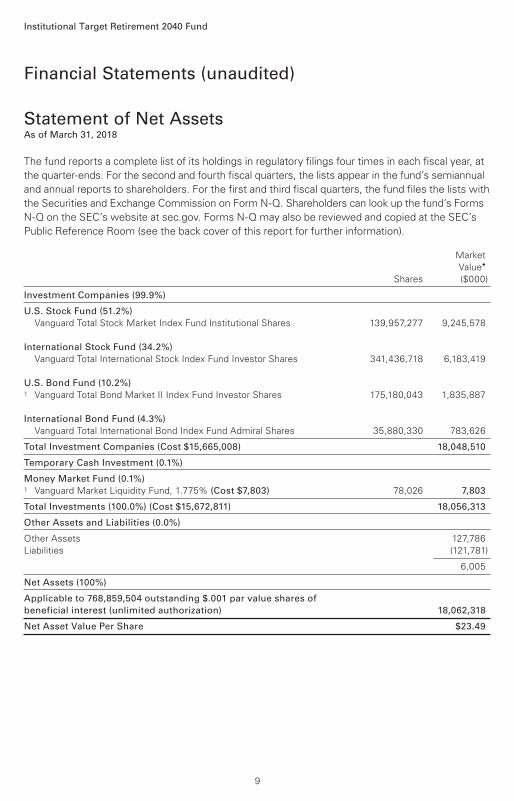
Investment Companies (99.9%)
U.S. Stock Fund (51.2%)
Vanguard Total Stock Market Index Fund Institutional Shares 139,957,277 9,245,578
International Stock Fund (34.2%)
Vanguard Total International Stock Index Fund Investor Shares 341,436,718 6,183,419
U.S. Bond Fund (10.2%) 1 Vanguard Total Bond Market II Index Fund Investor Shares 175,180,043 1,835,887
International Bond Fund (4.3%)
Vanguard Total International Bond Index Fund Admiral Shares 35,880,330 783,626
Total Investment Companies (Cost $15,665,008) 18,048,510
Temporary Cash Investment (0.1%)
Money Market Fund (0.1%)1 Vanguard Market Liquidity Fund, 1.775% (Cost $7,803) 78,026 7,803
Total Investments (100.0%) (Cost $15,672,811) 18,056,313
Other Assets and Liabilities (0.0%)
Other Assets 127,786
Liabilities (121,781)
6,005
Net Assets (100%)
Applicable to 768,859,504 outstanding $.001 par value shares of
beneficial interest (unlimited authorization) 18,062,318
Net Asset Value Per Share $23.49
Market
Value•
Shares ($000)
Institutional Target Retirement 2040 Fund
Statement of Net AssetsAs of March 31, 2018
Financial Statements (unaudited)
The fund reports a complete list of its holdings in regulatory filings four times in each fiscal year, at
the quarter-ends. For the second and fourth fiscal quarters, the lists appear in the fund’s semiannual
and annual reports to shareholders. For the first and third fiscal quarters, the fund files the lists with
the Securities and Exchange Commission on Form N-Q. Shareholders can look up the fund’s Forms
N-Q on the SEC’s website at sec.gov. Forms N-Q may also be reviewed and copied at the SEC’s
Public Reference Room (see the back cover of this report for further information).
9
Institutional Target Retirement 2040 Fund
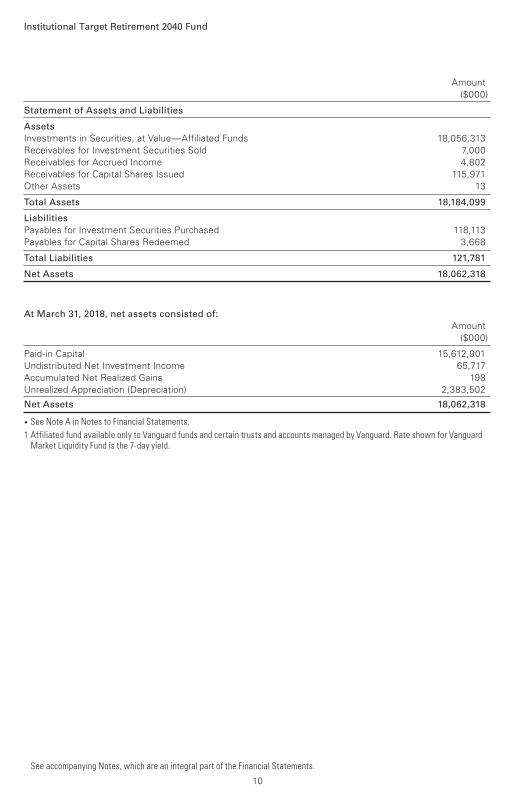
Statement of Assets and Liabilities
Assets
Investments in Securities, at Value—Affiliated Funds 18,056,313
Receivables for Investment Securities Sold 7,000
Receivables for Accrued Income 4,802
Receivables for Capital Shares Issued 115,971
Other Assets 13
Total Assets 18,184,099
Liabilities
Payables for Investment Securities Purchased 118,113
Payables for Capital Shares Redeemed 3,668
Total Liabilities 121,781
Net Assets 18,062,318
At March 31, 2018, net assets consisted of:
Amount
($000)
Paid-in Capital 15,612,901
Undistributed Net Investment Income 65,717
Accumulated Net Realized Gains 198
Unrealized Appreciation (Depreciation) 2,383,502
Net Assets 18,062,318
• See Note A in Notes to Financial Statements.
1 Affiliated fund available only to Vanguard funds and certain trusts and accounts managed by Vanguard. Rate shown for Vanguard Market Liquidity Fund is the 7-day yield.
Amount
($000)
See accompanying Notes, which are an integral part of the Financial Statements.
10

Six Months Ended
March 31, 2018
($000)
Investment Income
Income
Income Distributions Received from Affiliated Funds 178,914
Net Investment Income—Note B 178,914
Realized Net Gain (Loss)
Capital Gain Distributions Received from Affiliated Funds 346
Affiliated Funds Sold (79)
Realized Net Gain (Loss) 267
Change in Unrealized Appreciation (Depreciation) from Affiliated Funds 456,837
Net Increase (Decrease) in Net Assets Resulting from Operations 636,018
Statement of Operations
Institutional Target Retirement 2040 Fund
See accompanying Notes, which are an integral part of the Financial Statements.
11

Statement of Changes in Net Assets
Institutional Target Retirement 2040 Fund
See accompanying Notes, which are an integral part of the Financial Statements.
Six Months Ended Year Ended
March 31, September 30,
2018 2017
($000) ($000)
Increase (Decrease) in Net Assets
Operations
Net Investment Income 178,914 269,126
Realized Net Gain (Loss) 267 2,675
Change in Unrealized Appreciation (Depreciation) 456,837 1,540,042
Net Increase (Decrease) in Net Assets Resulting from Operations 636,018 1,811,843
Distributions
Net Investment Income (310,516) (185,811)
Realized Capital Gain1 (2,059) (1,229)
Total Distributions (312,575) (187,040)
Capital Share Transactions
Issued 3,172,715 5,265,281
Issued in Lieu of Cash Distributions 307,832 185,271
Redeemed (604,186) (937,018)
Net Increase (Decrease) from Capital Share Transactions 2,876,361 4,513,534
Total Increase (Decrease) 3,199,804 6,138,337
Net Assets
Beginning of Period 14,862,514 8,724,177
End of Period2 18,062,318 14,862,514
1 Includes fiscal 2018 and 2017 short-term gain distributions totaling $1,716,000 and $709,000, respectively. Short-term gain distributions are treated as ordinary income dividends for tax purposes.
2 Net Assets—End of Period includes undistributed (overdistributed) net investment income of $65,717,000 and $197,319,000.
12
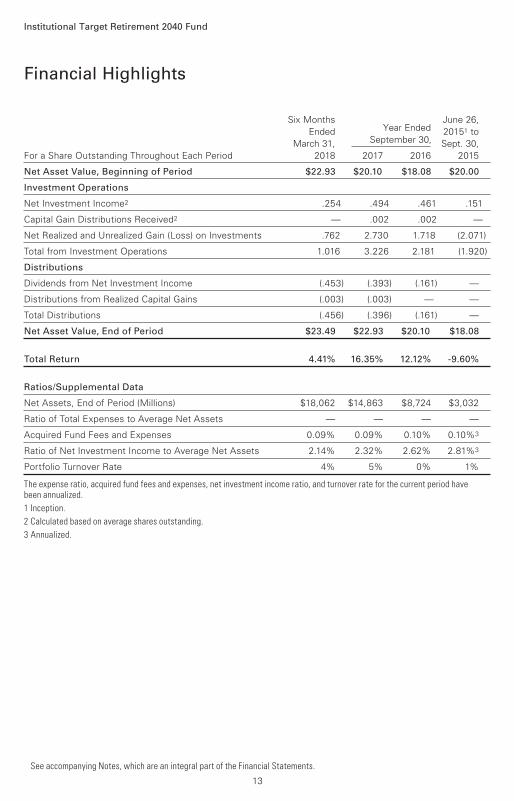
Six Months June 26,
Ended Year Ended 20151 to
March 31, September 30, Sept. 30,
For a Share Outstanding Throughout Each Period 2018 2017 2016 2015
Net Asset Value, Beginning of Period $22.93 $20.10 $18.08 $20.00
Investment Operations
Net Investment Income2 .254 .494 .461 .151
Capital Gain Distributions Received2 — .002 .002 —
Net Realized and Unrealized Gain (Loss) on Investments .762 2.730 1.718 (2.071)
Total from Investment Operations 1.016 3.226 2.181 (1.920)
Distributions
Dividends from Net Investment Income (.453) (.393) (.161) —
Distributions from Realized Capital Gains (.003) (.003) — —
Total Distributions (.456) (.396) (.161) —
Net Asset Value, End of Period $23.49 $22.93 $20.10 $18.08
Total Return 4.41% 16.35% 12.12% -9.60%
Ratios/Supplemental Data
Net Assets, End of Period (Millions) $18,062 $14,863 $8,724 $3,032
Ratio of Total Expenses to Average Net Assets — — — —
Acquired Fund Fees and Expenses 0.09% 0.09% 0.10% 0.10%3
Ratio of Net Investment Income to Average Net Assets 2.14% 2.32% 2.62% 2.81%3
Portfolio Turnover Rate 4% 5% 0% 1%
The expense ratio, acquired fund fees and expenses, net investment income ratio, and turnover rate for the current period have been annualized.
1 Inception.
2 Calculated based on average shares outstanding.
3 Annualized.
Financial Highlights
See accompanying Notes, which are an integral part of the Financial Statements.
Institutional Target Retirement 2040 Fund
13

Notes to Financial Statements
Institutional Target Retirement 2040 Fund
Vanguard Institutional Target Retirement 2040 Fund is registered under the Investment Company
Act of 1940 as an open-end investment company, or mutual fund. The fund follows a balanced
investment strategy by investing in selected Vanguard funds to achieve its targeted allocation of
assets to U.S. and international stocks, and U.S. and international bonds. Financial statements and
other information about each underlying fund are available on vanguard.com.
A. The following significant accounting policies conform to generally accepted accounting principles
for U.S. investment companies. The fund consistently follows such policies in preparing its financial
statements.
1. Security Valuation: Investments are valued at the net asset value of each underlying Vanguard
fund determined as of the close of the New York Stock Exchange (generally 4 p.m., Eastern time)
on the valuation date.
2. Federal Income Taxes: The fund intends to continue to qualify as a regulated investment
company and distribute all of its taxable income. Management has analyzed the fund’s tax positions
taken for all open federal income tax years (September 30, 2015–2017), and for the period ended
March 31, 2018, and has concluded that no provision for federal income tax is required in the fund’s
financial statements.
3. Distributions: Distributions to shareholders are recorded on the ex-dividend date.
4. Credit Facility: The fund and certain other funds managed by The Vanguard Group (“Vanguard”)
participate in a $3.1 billion committed credit facility provided by a syndicate of lenders pursuant to
a credit agreement that may be renewed annually; each fund is individually liable for its borrowings,
if any, under the credit facility. Borrowings may be utilized for temporary and emergency purposes,
and are subject to the fund’s regulatory and contractual borrowing restrictions. The participating
funds are charged administrative fees and an annual commitment fee of 0.10% of the undrawn
amount of the facility; these fees are allocated to the funds based on a method approved by the
fund’s board of trustees and borne by the funds in which the fund invests (see Note B). Any
borrowings under this facility bear interest at a rate based upon the higher of the one-month
London Interbank Offered Rate, federal funds effective rate, or overnight bank funding rate
plus an agreed-upon spread.
The fund had no borrowings outstanding at March 31, 2018, or at any time during the period
then ended.
5. Other: Income and capital gain distributions received are recorded on the ex-dividend date.
Security transactions are accounted for on the date securities are bought or sold. Costs used
to determine realized gains (losses) on the sale of investment securities are those of the specific
securities sold.
B. In accordance with the terms of a Funds’ Service Agreement (the “FSA”) between Vanguard
and the fund, Vanguard furnishes to the fund investment advisory, corporate management,
administrative, marketing, and distribution services at Vanguard’s cost of operations (as defined
by the FSA). These costs of operations are allocated to the fund based on methods and guidelines
approved by the board of trustees. The FSA provides that expenses otherwise allocable to
Vanguard funds-of-funds may be reduced or eliminated to the extent of savings realized by the
underlying Vanguard funds by virtue of being part of a fund-of-funds. Accordingly, all expenses for
services provided by Vanguard to the fund and all other expenses incurred by the fund during the
14

Institutional Target Retirement 2040 Fund
period ended March 31, 2018, were borne by the underlying Vanguard funds in which the fund
invests. The fund’s trustees and officers are also trustees and officers, respectively, of the
underlying Vanguard funds, as well as directors and employees, respectively, of Vanguard.
C. Various inputs may be used to determine the value of the fund’s investments. These inputs are
summarized in three broad levels for financial statement purposes. The inputs or methodologies
used to value securities are not necessarily an indication of the risk associated with investing in
those securities.
Level 1—Quoted prices in active markets for identical securities.
Level 2—Other significant observable inputs (including quoted prices for similar securities, interest
rates, prepayment speeds, credit risk, etc.).
Level 3—Significant unobservable inputs (including the fund’s own assumptions used to determine
the fair value of investments). Any investments valued with significant unobservable inputs are
noted on the Statement of Net Assets.
At March 31, 2018, 100% of the market value of the fund’s investments was determined based on
Level 1 inputs.
D. Distributions are determined on a tax basis and may differ from net investment income and
realized capital gains for financial reporting purposes. Differences may be permanent or temporary.
Permanent differences are reclassified among capital accounts in the financial statements to reflect
their tax character. Temporary differences arise when certain items of income, expense, gain, or
loss are recognized in different periods for financial statement and tax purposes. These differences
will reverse at some time in the future. Differences in classification may also result from the
treatment of short-term gains as ordinary income for tax purposes. The fund’s tax-basis capital
gains and losses are determined only at the end of each fiscal year.
At March 31, 2018, the cost of investment securities for tax purposes was $15,672,811,000. Net
unrealized appreciation of investment securities for tax purposes was $2,383,502,000, consisting
of unrealized gains of $2,426,161,000 on securities that had risen in value since their purchase and
$42,659,000 in unrealized losses on securities that had fallen in value since their purchase.
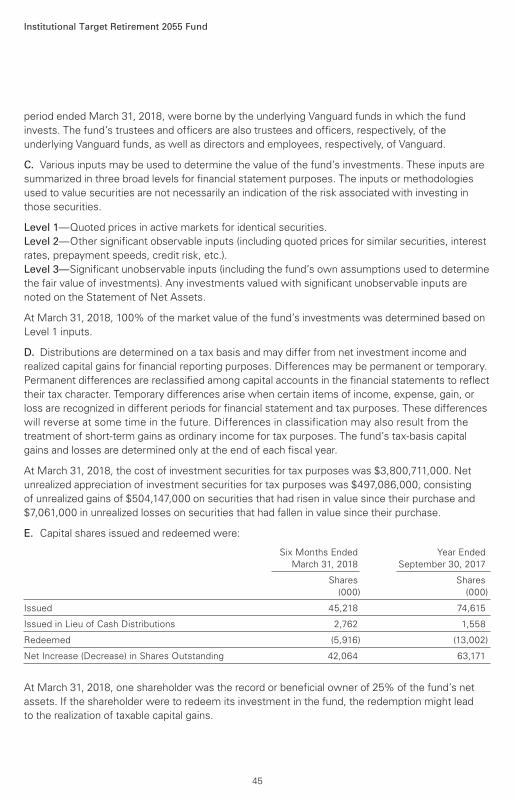
E. Capital shares issued and redeemed were:
Six Months Ended Year Ended
March 31, 2018 September 30, 2017
Shares Shares
(000) (000)
Issued 133,020 248,613
Issued in Lieu of Cash Distributions 13,000 9,301
Redeemed (25,305) (43,745)
Net Increase (Decrease) in Shares Outstanding 120,715 214,169
At March 31, 2018, one shareholder was the record or beneficial owner of 31% of the fund’s net
assets. If the shareholder were to redeem its investment in the fund, the redemption might lead
to the realization of taxable capital gains.
15

Institutional Target Retirement 2040 Fund
F. Transactions during the period in affiliated underlying Vanguard funds were as follows:
Current Period Transactions
Sept. 30, Proceeds Realized March 31,
2017 from Net Change in Capital Gain 2018
Market Purchases Securities Gain Unrealized Distributions Market
Value at Cost Sold (Loss) App. (Dep.) Income Received Value
($000) ($000) ($000) ($000) ($000) ($000) ($000) ($000)
Vanguard Market
Liquidity Fund 2,675 NA1 NA1 — — 27 — 7,803
Vanguard Total
Bond Market II
Index Fund 1,452,659 583,105 155,812 (745) (43,320) 20,712 346 1,835,887
Vanguard Total
International
Bond Index Fund 585,456 195,536 — — 2,634 11,577 — 783,626
Vanguard Total
International
Stock Index Fund 5,044,829 1,028,112 38,209 264 148,423 67,436 — 6,183,419
Vanguard Total
Stock Market
Index Fund 7,780,246 1,224,634 108,804 402 349,100 79,162 — 9,245,578
Total 14,865,865 3,031,387 302,825 (79) 456,837 178,914 346 18,056,313
1 Not applicable—purchases and sales are for temporary cash investment purposes.
G. Management has determined that no material events or transactions occurred subsequent to
March 31, 2018, that would require recognition or disclosure in these financial statements.
16

Institutional Target Retirement 2045 Fund
Fund ProfileAs of March 31, 2018
1 This figure—drawn from the prospectus dated January 25, 2018—represents an estimate of the weighted average of the expenseratios and any transaction fees charged by the underlying mutual funds (the ”acquired” funds) in which the Institutional Target Retirement2045 Fund invests. The fund does not charge any expenses or fees of its own. For the six months ended March 31, 2018, the annualizedacquired fund fees and expenses were 0.09%.
17
Allocation to Underlying Vanguard Funds
Vanguard Total Stock Market Index Fund
Institutional Shares 53.7%
Vanguard Total International Stock Index
Fund Investor Shares 36.0
Vanguard Total Bond Market II Index Fund
Investor Shares 7.3
Vanguard Total International Bond Index
Fund Admiral Shares 3.0
Total Fund Characteristics
Ticker Symbol VITLX
30-Day SEC Yield 2.13%
Acquired Fund Fees and Expenses1 0.09%
Fund Asset Allocation
89.7% Stocks
10.3% Bonds
All of the returns in this report represent past performance, which is not a guarantee of future results that may be achieved by the fund. (Current performance may be lower or higher thanthe performance data cited. For performance data current to the most recent month-end, visitour website at vanguard.com/performance.) Note, too, that both investment returns and principal value can fluctuate widely, so an investor’s shares, when sold, could be worth more or less than their original cost. The returns shown do not reflect taxes that a shareholder would pay
on fund distributions or on the sale of fund shares.
Performance Summary
Institutional Target Retirement 2045 Fund
See Financial Highlights for dividend and capital gains information.
18
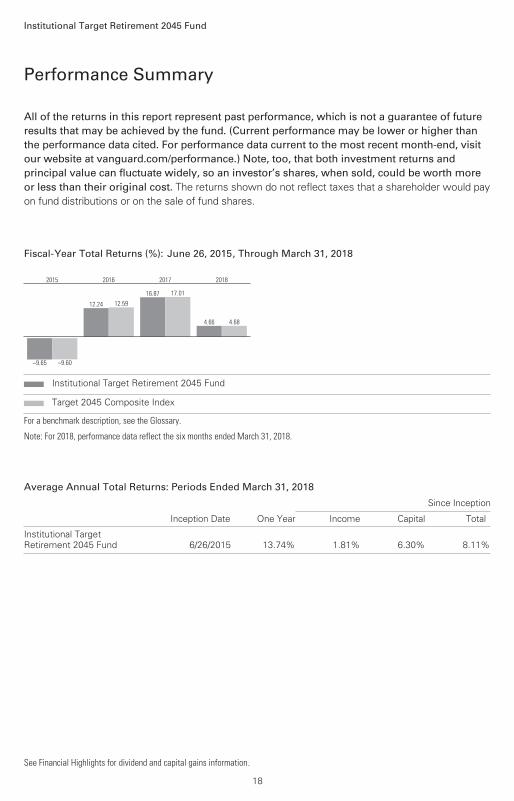
Fiscal-Year Total Returns (%): June 26, 2015, Through March 31, 2018
–9.65 –9.60
2015
12.24 12.59
2016
16.87 17.01
2017
4.66 4.68
2018
Institutional Target Retirement 2045 Fund
Target 2045 Composite Index
For a benchmark description, see the Glossary.
Note: For 2018, performance data reflect the six months ended March 31, 2018.
Average Annual Total Returns: Periods Ended March 31, 2018
Since Inception
Inception Date One Year Income Capital Total
Institutional Target
Retirement 2045 Fund 6/26/2015 13.74% 1.81% 6.30% 8.11%

Investment Companies (99.9%)
U.S. Stock Fund (53.7%)
Vanguard Total Stock Market Index Fund Institutional Shares 120,602,456 7,966,998
International Stock Fund (35.9%)
Vanguard Total International Stock Index Fund Investor Shares 294,630,589 5,335,760
U.S. Bond Fund (7.3%) 1 Vanguard Total Bond Market II Index Fund Investor Shares 102,668,758 1,075,969
International Bond Fund (3.0%)
Vanguard Total International Bond Index Fund Admiral Shares 20,417,927 445,927
Total Investment Companies (Cost $12,831,785) 14,824,654
Temporary Cash Investment (0.0%)
Money Market Fund (0.0%)1 Vanguard Market Liquidity Fund, 1.775% (Cost $4,974) 49,739 4,974
Total Investments (99.9%) (Cost $12,836,759) 14,829,628
Other Assets and Liabilities (0.1%)
Other Assets 92,815
Liabilities (78,028)
14,787
Net Assets (100%)
Applicable to 627,255,920 outstanding $.001 par value shares of
beneficial interest (unlimited authorization) 14,844,415
Net Asset Value Per Share $23.67
Market
Value•
Shares ($000)
Institutional Target Retirement 2045 Fund
Statement of Net AssetsAs of March 31, 2018
Financial Statements (unaudited)
The fund reports a complete list of its holdings in regulatory filings four times in each fiscal year, at
the quarter-ends. For the second and fourth fiscal quarters, the lists appear in the fund’s semiannual
and annual reports to shareholders. For the first and third fiscal quarters, the fund files the lists with
the Securities and Exchange Commission on Form N-Q. Shareholders can look up the fund’s Forms
N-Q on the SEC’s website at sec.gov. Forms N-Q may also be reviewed and copied at the SEC’s
Public Reference Room (see the back cover of this report for further information).
19
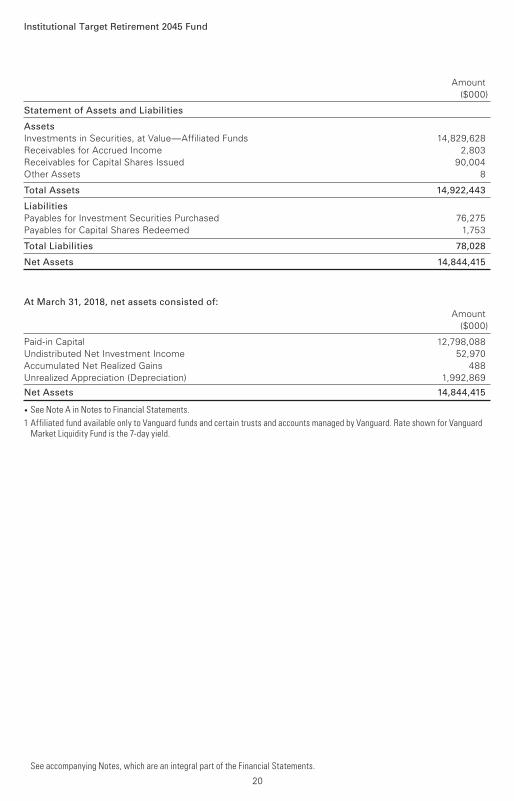
Institutional Target Retirement 2045 Fund
Statement of Assets and Liabilities
Assets
Investments in Securities, at Value—Affiliated Funds 14,829,628 Receivables for Accrued Income 2,803 Receivables for Capital Shares Issued 90,004 Other Assets 8
Total Assets 14,922,443
Liabilities
Payables for Investment Securities Purchased 76,275 Payables for Capital Shares Redeemed 1,753
Total Liabilities 78,028
Net Assets 14,844,415
At March 31, 2018, net assets consisted of:
Amount ($000)
Paid-in Capital 12,798,088Undistributed Net Investment Income 52,970Accumulated Net Realized Gains 488Unrealized Appreciation (Depreciation) 1,992,869
Net Assets 14,844,415
• See Note A in Notes to Financial Statements.
1 Affiliated fund available only to Vanguard funds and certain trusts and accounts managed by Vanguard. Rate shown for Vanguard Market Liquidity Fund is the 7-day yield.
Amount ($000)
See accompanying Notes, which are an integral part of the Financial Statements.
20

Six Months Ended March 31, 2018
($000)
Investment Income
Income
Income Distributions Received from Affiliated Funds 144,441
Net Investment Income—Note B 144,441
Realized Net Gain (Loss)
Capital Gain Distributions Received from Affiliated Funds 205
Affiliated Funds Sold 321
Realized Net Gain (Loss) 526
Change in Unrealized Appreciation (Depreciation) from Affiliated Funds 389,902
Net Increase (Decrease) in Net Assets Resulting from Operations 534,869
Statement of Operations
Institutional Target Retirement 2045 Fund
See accompanying Notes, which are an integral part of the Financial Statements.
21

Statement of Changes in Net Assets
Institutional Target Retirement 2045 Fund
See accompanying Notes, which are an integral part of the Financial Statements.
Six Months Ended Year Ended
March 31, September 30,
2018 2017
($000) ($000)
Increase (Decrease) in Net Assets
Operations
Net Investment Income 144,441 219,189
Realized Net Gain (Loss) 526 2,638
Change in Unrealized Appreciation (Depreciation) 389,902 1,297,074
Net Increase (Decrease) in Net Assets Resulting from Operations 534,869 1,518,901
Distributions
Net Investment Income (252,433) (147,574)
Realized Capital Gain1 (2,112) (873)
Total Distributions (254,545) (148,447)
Capital Share Transactions
Issued 2,717,382 4,325,560
Issued in Lieu of Cash Distributions 251,301 146,968
Redeemed (458,329) (778,614)
Net Increase (Decrease) from Capital Share Transactions 2,510,354 3,693,914
Total Increase (Decrease) 2,790,678 5,064,368
Net Assets
Beginning of Period 12,053,737 6,989,369
End of Period2 14,844,415 12,053,737
1 Includes fiscal 2018 and 2017 short-term gain distributions totaling $1,946,000 and $493,000, respectively. Short-term gain distributions are treated as ordinary income dividends for tax purposes.
2 Net Assets—End of Period includes undistributed (overdistributed) net investment income of $52,970,000 and $160,962,000.
22

Six Months June 26,
Ended Year Ended 20151 to
March 31, September 30, Sept. 30,
For a Share Outstanding Throughout Each Period 2018 2017 2016 2015
Net Asset Value, Beginning of Period $23.05 $20.11 $18.07 $20.00
Investment Operations
Net Investment Income2 .253 .497 .464 .149
Capital Gain Distributions Received2 — .001 .002 —
Net Realized and Unrealized Gain (Loss) on Investments .825 2.833 1.736 (2.079)
Total from Investment Operations 1.078 3.331 2.202 (1.930)
Distributions
Dividends from Net Investment Income (.454) (.389) (.162) —
Distributions from Realized Capital Gains (.004) (.002) — —
Total Distributions (.458) (.391) (.162) —
Net Asset Value, End of Period $23.67 $23.05 $20.11 $18.07
Total Return 4.66% 16.87% 12.24% -9.65%
Ratios/Supplemental Data
Net Assets, End of Period (Millions) $14,844 $12,054 $6,989 $2,317
Ratio of Total Expenses to Average Net Assets — — — —
Acquired Fund Fees and Expenses 0.09% 0.09% 0.10% 0.10%3
Ratio of Net Investment Income to Average Net Assets 2.12% 2.33% 2.42% 2.79%3
Portfolio Turnover Rate 2% 5% 1% 0%
The expense ratio, acquired fund fees and expenses, net investment income ratio, and turnover rate for the current period have been annualized.
1 Inception.
2 Calculated based on average shares outstanding.
3 Annualized.
Financial Highlights
See accompanying Notes, which are an integral part of the Financial Statements.
Institutional Target Retirement 2045 Fund
23
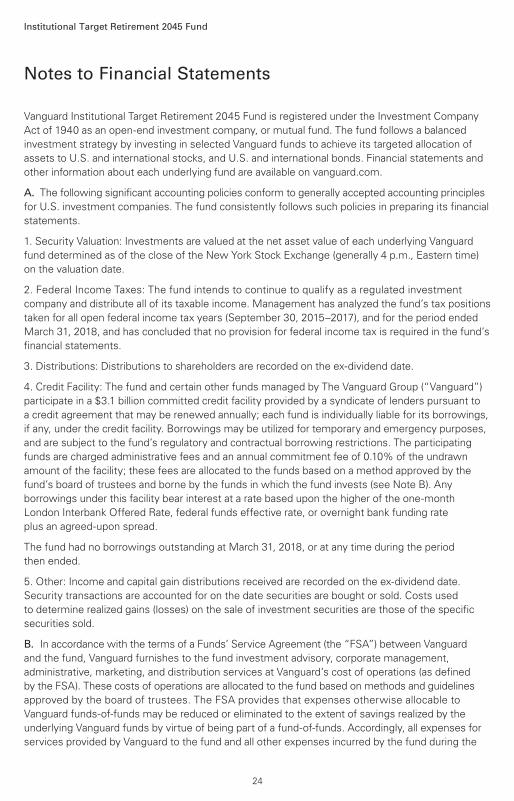
Notes to Financial Statements
Institutional Target Retirement 2045 Fund
Vanguard Institutional Target Retirement 2045 Fund is registered under the Investment Company
Act of 1940 as an open-end investment company, or mutual fund. The fund follows a balanced
investment strategy by investing in selected Vanguard funds to achieve its targeted allocation of
assets to U.S. and international stocks, and U.S. and international bonds. Financial statements and
other information about each underlying fund are available on vanguard.com.
A. The following significant accounting policies conform to generally accepted accounting principles
for U.S. investment companies. The fund consistently follows such policies in preparing its financial
statements.
1. Security Valuation: Investments are valued at the net asset value of each underlying Vanguard
fund determined as of the close of the New York Stock Exchange (generally 4 p.m., Eastern time)
on the valuation date.
2. Federal Income Taxes: The fund intends to continue to qualify as a regulated investment
company and distribute all of its taxable income. Management has analyzed the fund’s tax positions
taken for all open federal income tax years (September 30, 2015–2017), and for the period ended
March 31, 2018, and has concluded that no provision for federal income tax is required in the fund’s
financial statements.
3. Distributions: Distributions to shareholders are recorded on the ex-dividend date.
4. Credit Facility: The fund and certain other funds managed by The Vanguard Group (“Vanguard”)
participate in a $3.1 billion committed credit facility provided by a syndicate of lenders pursuant to
a credit agreement that may be renewed annually; each fund is individually liable for its borrowings,
if any, under the credit facility. Borrowings may be utilized for temporary and emergency purposes,
and are subject to the fund’s regulatory and contractual borrowing restrictions. The participating
funds are charged administrative fees and an annual commitment fee of 0.10% of the undrawn
amount of the facility; these fees are allocated to the funds based on a method approved by the
fund’s board of trustees and borne by the funds in which the fund invests (see Note B). Any
borrowings under this facility bear interest at a rate based upon the higher of the one-month
London Interbank Offered Rate, federal funds effective rate, or overnight bank funding rate
plus an agreed-upon spread.
The fund had no borrowings outstanding at March 31, 2018, or at any time during the period
then ended.
5. Other: Income and capital gain distributions received are recorded on the ex-dividend date.
Security transactions are accounted for on the date securities are bought or sold. Costs used
to determine realized gains (losses) on the sale of investment securities are those of the specific
securities sold.
B. In accordance with the terms of a Funds’ Service Agreement (the “FSA”) between Vanguard
and the fund, Vanguard furnishes to the fund investment advisory, corporate management,
administrative, marketing, and distribution services at Vanguard’s cost of operations (as defined
by the FSA). These costs of operations are allocated to the fund based on methods and guidelines
approved by the board of trustees. The FSA provides that expenses otherwise allocable to
Vanguard funds-of-funds may be reduced or eliminated to the extent of savings realized by the
underlying Vanguard funds by virtue of being part of a fund-of-funds. Accordingly, all expenses for
services provided by Vanguard to the fund and all other expenses incurred by the fund during the
24

Institutional Target Retirement 2045 Fund
period ended March 31, 2018, were borne by the underlying Vanguard funds in which the fund
invests. The fund’s trustees and officers are also trustees and officers, respectively, of the
underlying Vanguard funds, as well as directors and employees, respectively, of Vanguard.
C. Various inputs may be used to determine the value of the fund’s investments. These inputs are
summarized in three broad levels for financial statement purposes. The inputs or methodologies
used to value securities are not necessarily an indication of the risk associated with investing in
those securities.
Level 1—Quoted prices in active markets for identical securities.
Level 2—Other significant observable inputs (including quoted prices for similar securities, interest
rates, prepayment speeds, credit risk, etc.).
Level 3—Significant unobservable inputs (including the fund’s own assumptions used to determine
the fair value of investments). Any investments valued with significant unobservable inputs are
noted on the Statement of Net Assets.
At March 31, 2018, 100% of the market value of the fund’s investments was determined based on
Level 1 inputs.
D. Distributions are determined on a tax basis and may differ from net investment income and
realized capital gains for financial reporting purposes. Differences may be permanent or temporary.
Permanent differences are reclassified among capital accounts in the financial statements to reflect
their tax character. Temporary differences arise when certain items of income, expense, gain, or
loss are recognized in different periods for financial statement and tax purposes. These differences
will reverse at some time in the future. Differences in classification may also result from the
treatment of short-term gains as ordinary income for tax purposes. The fund’s tax-basis capital
gains and losses are determined only at the end of each fiscal year.
At March 31, 2018, the cost of investment securities for tax purposes was $12,836,759,000. Net
unrealized appreciation of investment securities for tax purposes was $1,992,869,000, consisting
of unrealized gains of $2,017,879,000 on securities that had risen in value since their purchase and
$25,010,000 in unrealized losses on securities that had fallen in value since their purchase.
E. Capital shares issued and redeemed were:
Six Months Ended Year Ended
March 31, 2018 September 30, 2017
Shares Shares
(000) (000)
Issued 112,961 203,890
Issued in Lieu of Cash Distributions 10,532 7,367
Redeemed (19,075) (35,984)
Net Increase (Decrease) in Shares Outstanding 104,418 175,273
At March 31, 2018, one shareholder was the record or beneficial owner of 28% of the fund’s net
assets. If the shareholder were to redeem its investment in the fund, the redemption might lead
to the realization of taxable capital gains.
25
Institutional Target Retirement 2045 Fund
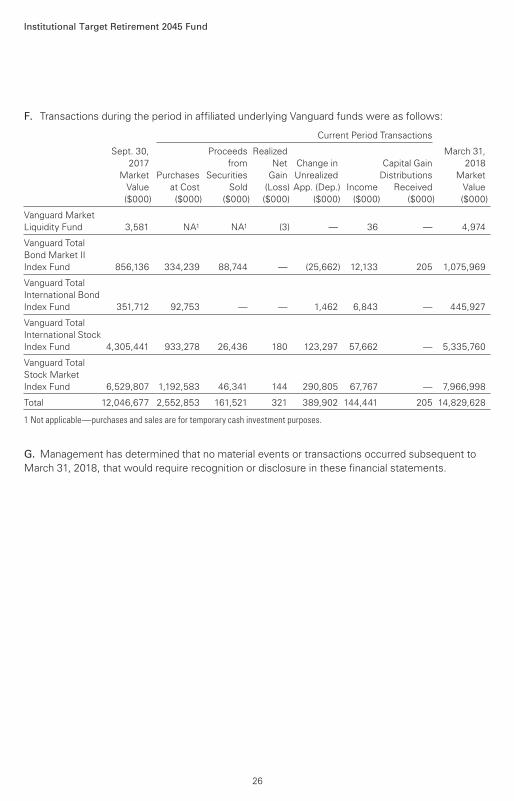
F. Transactions during the period in affiliated underlying Vanguard funds were as follows:
Current Period Transactions
Sept. 30, Proceeds Realized March 31,
2017 from Net Change in Capital Gain 2018
Market Purchases Securities Gain Unrealized Distributions Market
Value at Cost Sold (Loss) App. (Dep.) Income Received Value
($000) ($000) ($000) ($000) ($000) ($000) ($000) ($000)
Vanguard Market
Liquidity Fund 3,581 NA1 NA1 (3) — 36 — 4,974
Vanguard Total
Bond Market II
Index Fund 856,136 334,239 88,744 — (25,662) 12,133 205 1,075,969
Vanguard Total
International Bond
Index Fund 351,712 92,753 — — 1,462 6,843 — 445,927
Vanguard Total
International Stock
Index Fund 4,305,441 933,278 26,436 180 123,297 57,662 — 5,335,760
Vanguard Total
Stock Market
Index Fund 6,529,807 1,192,583 46,341 144 290,805 67,767 — 7,966,998
Total 12,046,677 2,552,853 161,521 321 389,902 144,441 205 14,829,628
1 Not applicable—purchases and sales are for temporary cash investment purposes.
G. Management has determined that no material events or transactions occurred subsequent to
March 31, 2018, that would require recognition or disclosure in these financial statements.
26

Institutional Target Retirement 2050 Fund
Fund ProfileAs of March 31, 2018
1 This figure—drawn from the prospectus dated January 25, 2018—represents an estimate of the weighted average of the expenseratios and any transaction fees charged by the underlying mutual funds (the ”acquired” funds) in which the Institutional Target Retirement2050 Fund invests. The fund does not charge any expenses or fees of its own. For the six months ended March 31, 2018, the annualizedacquired fund fees and expenses were 0.09%.
27
Allocation to Underlying Vanguard Funds
Vanguard Total Stock Market Index Fund
Institutional Shares 53.9%
Vanguard Total International Stock Index
Fund Investor Shares 35.9
Vanguard Total Bond Market II Index Fund
Investor Shares 7.2
Vanguard Total International Bond Index
Fund Admiral Shares 3.0
Total Fund Characteristics
Ticker Symbol VTRLX
30-Day SEC Yield 2.13%
Acquired Fund Fees and Expenses1 0.09%
Fund Asset Allocation
89.8% Stocks
10.2% Bonds
All of the returns in this report represent past performance, which is not a guarantee of future results that may be achieved by the fund. (Current performance may be lower or higher thanthe performance data cited. For performance data current to the most recent month-end, visitour website at vanguard.com/performance.) Note, too, that both investment returns and principal value can fluctuate widely, so an investor’s shares, when sold, could be worth more or less than their original cost. The returns shown do not reflect taxes that a shareholder would pay
on fund distributions or on the sale of fund shares.
Performance Summary
Institutional Target Retirement 2050 Fund
See Financial Highlights for dividend and capital gains information.
28
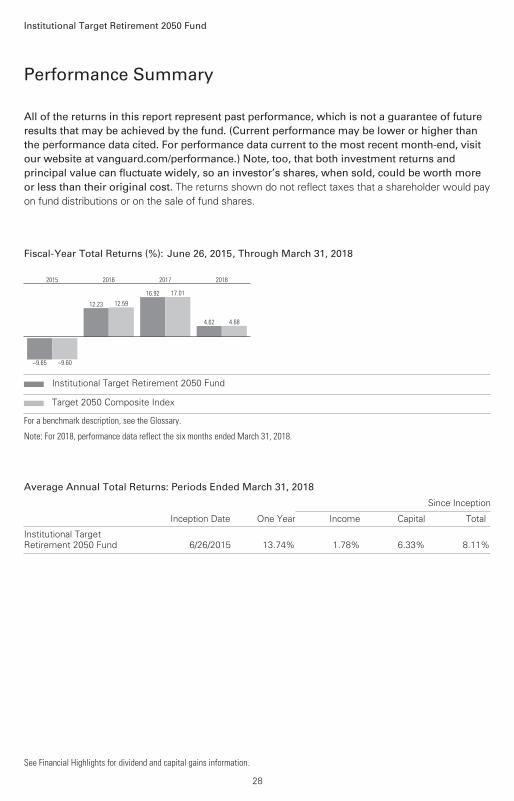
Fiscal-Year Total Returns (%): June 26, 2015, Through March 31, 2018
–9.65 –9.60
2015
12.23 12.59
2016
16.92 17.01
2017
4.62 4.68
2018
Institutional Target Retirement 2050 Fund
Target 2050 Composite Index
For a benchmark description, see the Glossary.
Note: For 2018, performance data reflect the six months ended March 31, 2018.
Average Annual Total Returns: Periods Ended March 31, 2018
Since Inception
Inception Date One Year Income Capital Total
Institutional Target
Retirement 2050 Fund 6/26/2015 13.74% 1.78% 6.33% 8.11%

Investment Companies (99.8%)
U.S. Stock Fund (53.8%)
Vanguard Total Stock Market Index Fund Institutional Shares 82,793,612 5,469,346
International Stock Fund (35.8%)
Vanguard Total International Stock Index Fund Investor Shares 201,323,581 3,645,970
U.S. Bond Fund (7.2%) 1 Vanguard Total Bond Market II Index Fund Investor Shares 70,035,265 733,969
International Bond Fund (3.0%)
Vanguard Total International Bond Index Fund Admiral Shares 13,955,945 304,798
Total Investment Companies (Cost $8,872,758) 10,154,083
Temporary Cash Investment (0.0%)
Money Market Fund (0.0%)1 Vanguard Market Liquidity Fund, 1.775% (Cost $2,958) 29,579 2,958
Total Investments (99.8%) (Cost $8,875,716) 10,157,041
Other Assets and Liabilities (0.2%)
Other Assets 83,305
Liabilities (66,096)
17,209
Net Assets (100%)
Applicable to 429,512,051 outstanding $.001 par value shares of
beneficial interest (unlimited authorization) 10,174,250
Net Asset Value Per Share $23.69
Market
Value•
Shares ($000)
Institutional Target Retirement 2050 Fund
Statement of Net AssetsAs of March 31, 2018
Financial Statements (unaudited)
The fund reports a complete list of its holdings in regulatory filings four times in each fiscal year, at
the quarter-ends. For the second and fourth fiscal quarters, the lists appear in the fund’s semiannual
and annual reports to shareholders. For the first and third fiscal quarters, the fund files the lists with
the Securities and Exchange Commission on Form N-Q. Shareholders can look up the fund’s Forms
N-Q on the SEC’s website at sec.gov. Forms N-Q may also be reviewed and copied at the SEC’s
Public Reference Room (see the back cover of this report for further information).
29
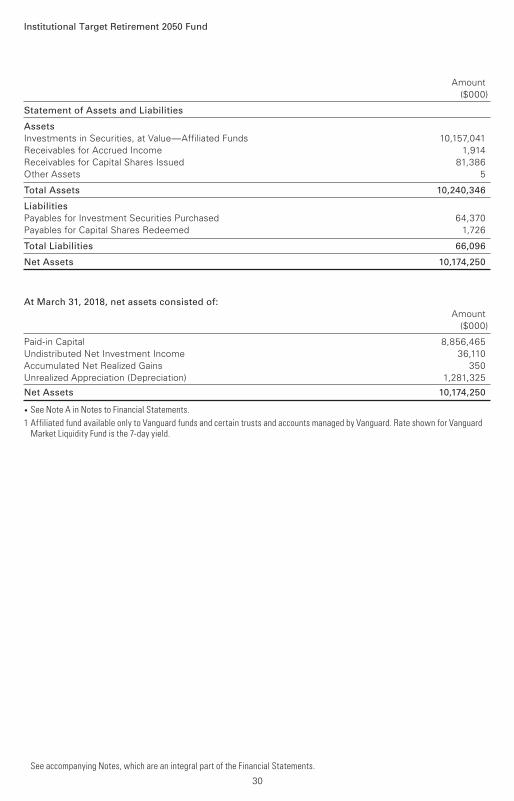
Institutional Target Retirement 2050 Fund
Statement of Assets and Liabilities
Assets
Investments in Securities, at Value—Affiliated Funds 10,157,041
Receivables for Accrued Income 1,914
Receivables for Capital Shares Issued 81,386
Other Assets 5
Total Assets 10,240,346
Liabilities
Payables for Investment Securities Purchased 64,370
Payables for Capital Shares Redeemed 1,726
Total Liabilities 66,096
Net Assets 10,174,250
At March 31, 2018, net assets consisted of:
Amount
($000)
Paid-in Capital 8,856,465
Undistributed Net Investment Income 36,110
Accumulated Net Realized Gains 350
Unrealized Appreciation (Depreciation) 1,281,325
Net Assets 10,174,250
• See Note A in Notes to Financial Statements.
1 Affiliated fund available only to Vanguard funds and certain trusts and accounts managed by Vanguard. Rate shown for Vanguard Market Liquidity Fund is the 7-day yield.
Amount
($000)
See accompanying Notes, which are an integral part of the Financial Statements.
30

Six Months Ended
March 31, 2018
($000)
Investment Income
Income
Income Distributions Received from Affiliated Funds 97,217
Net Investment Income—Note B 97,217
Realized Net Gain (Loss)
Capital Gain Distributions Received from Affiliated Funds 137
Affiliated Funds Sold 457
Realized Net Gain (Loss) 594
Change in Unrealized Appreciation (Depreciation) from Affiliated Funds 250,821
Net Increase (Decrease) in Net Assets Resulting from Operations 348,632
Statement of Operations
Institutional Target Retirement 2050 Fund
See accompanying Notes, which are an integral part of the Financial Statements.
31

Statement of Changes in Net Assets
Institutional Target Retirement 2050 Fund
See accompanying Notes, which are an integral part of the Financial Statements.
Six Months Ended Year Ended
March 31, September 30,
2018 2017
($000) ($000)
Increase (Decrease) in Net Assets
Operations
Net Investment Income 97,217 141,810
Realized Net Gain (Loss) 594 1,886
Change in Unrealized Appreciation (Depreciation) 250,821 838,364
Net Increase (Decrease) in Net Assets Resulting from Operations 348,632 982,060
Distributions
Net Investment Income (165,211) (90,785)
Realized Capital Gain1 (1,818) (502)
Total Distributions (167,029) (91,287)
Capital Share Transactions
Issued 2,219,278 3,268,759
Issued in Lieu of Cash Distributions 164,754 90,205
Redeemed (341,608) (628,910)
Net Increase (Decrease) from Capital Share Transactions 2,042,424 2,730,054
Total Increase (Decrease) 2,224,027 3,620,827
Net Assets
Beginning of Period 7,950,223 4,329,396
End of Period2 10,174,250 7,950,223
1 Includes fiscal 2018 and 2017 short-term gain distributions totaling $1,707,000 and $287,000, respectively. Short-term gain distributions are treated as ordinary income dividends for tax purposes.
2 Net Assets—End of Period includes undistributed (overdistributed) net investment income of $36,110,000 and $104,104,000.
32

Six Months June 26,
Ended Year Ended 20151 to
March 31, September 30, Sept. 30,
For a Share Outstanding Throughout Each Period 2018 2017 2016 2015
Net Asset Value, Beginning of Period $23.07 $20.11 $18.07 $20.00
Investment Operations
Net Investment Income2 .253 .503 .466 .149
Capital Gain Distributions Received2 — .001 .002 —
Net Realized and Unrealized Gain (Loss) on Investments .817 2.838 1.732 (2.079)
Total from Investment Operations 1.070 3.342 2.200 (1.930)
Distributions
Dividends from Net Investment Income (.445) (.380) (.160) —
Distributions from Realized Capital Gains (.005) (.002) — —
Total Distributions (.450) (.382) (.160) —
Net Asset Value, End of Period $23.69 $23.07 $20.11 $18.07
Total Return 4.62% 16.92% 12.23% -9.65%
Ratios/Supplemental Data
Net Assets, End of Period (Millions) $10,174 $7,950 $4,329 $1,259
Ratio of Total Expenses to Average Net Assets — — — —
Acquired Fund Fees and Expenses 0.09% 0.09% 0.10% 0.10%3
Ratio of Net Investment Income to Average Net Assets 2.12% 2.34% 2.43% 2.81%3
Portfolio Turnover Rate 2% 5% 1% 1%
The expense ratio, acquired fund fees and expenses, net investment income ratio, and turnover rate for the current period have been annualized.
1 Inception.
2 Calculated based on average shares outstanding.
3 Annualized.
Financial Highlights
See accompanying Notes, which are an integral part of the Financial Statements.
Institutional Target Retirement 2050 Fund
33
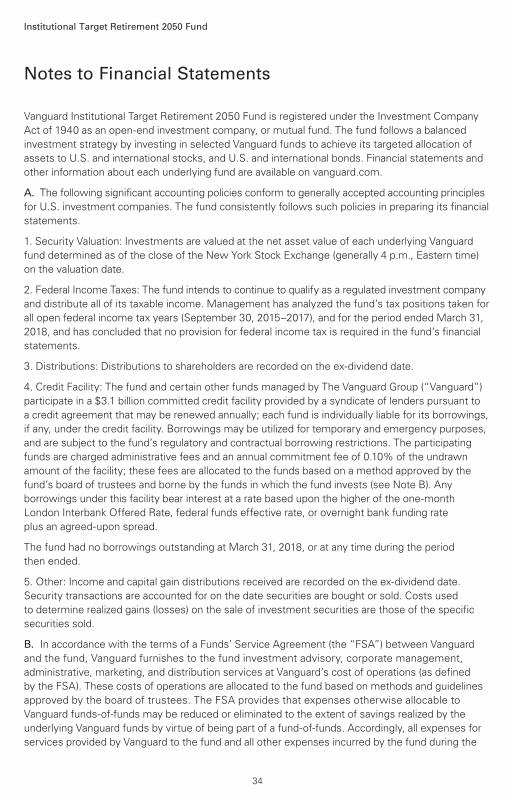
Notes to Financial Statements
Institutional Target Retirement 2050 Fund
Vanguard Institutional Target Retirement 2050 Fund is registered under the Investment Company
Act of 1940 as an open-end investment company, or mutual fund. The fund follows a balanced
investment strategy by investing in selected Vanguard funds to achieve its targeted allocation of
assets to U.S. and international stocks, and U.S. and international bonds. Financial statements and
other information about each underlying fund are available on vanguard.com.
A. The following significant accounting policies conform to generally accepted accounting principles
for U.S. investment companies. The fund consistently follows such policies in preparing its financial
statements.
1. Security Valuation: Investments are valued at the net asset value of each underlying Vanguard
fund determined as of the close of the New York Stock Exchange (generally 4 p.m., Eastern time)
on the valuation date.
2. Federal Income Taxes: The fund intends to continue to qualify as a regulated investment company
and distribute all of its taxable income. Management has analyzed the fund’s tax positions taken for
all open federal income tax years (September 30, 2015–2017), and for the period ended March 31,
2018, and has concluded that no provision for federal income tax is required in the fund’s financial
statements.
3. Distributions: Distributions to shareholders are recorded on the ex-dividend date.
4. Credit Facility: The fund and certain other funds managed by The Vanguard Group (“Vanguard”)
participate in a $3.1 billion committed credit facility provided by a syndicate of lenders pursuant to
a credit agreement that may be renewed annually; each fund is individually liable for its borrowings,
if any, under the credit facility. Borrowings may be utilized for temporary and emergency purposes,
and are subject to the fund’s regulatory and contractual borrowing restrictions. The participating
funds are charged administrative fees and an annual commitment fee of 0.10% of the undrawn
amount of the facility; these fees are allocated to the funds based on a method approved by the
fund’s board of trustees and borne by the funds in which the fund invests (see Note B). Any
borrowings under this facility bear interest at a rate based upon the higher of the one-month
London Interbank Offered Rate, federal funds effective rate, or overnight bank funding rate
plus an agreed-upon spread.
The fund had no borrowings outstanding at March 31, 2018, or at any time during the period
then ended.
5. Other: Income and capital gain distributions received are recorded on the ex-dividend date.
Security transactions are accounted for on the date securities are bought or sold. Costs used
to determine realized gains (losses) on the sale of investment securities are those of the specific
securities sold.
B. In accordance with the terms of a Funds’ Service Agreement (the “FSA”) between Vanguard
and the fund, Vanguard furnishes to the fund investment advisory, corporate management,
administrative, marketing, and distribution services at Vanguard’s cost of operations (as defined
by the FSA). These costs of operations are allocated to the fund based on methods and guidelines
approved by the board of trustees. The FSA provides that expenses otherwise allocable to
Vanguard funds-of-funds may be reduced or eliminated to the extent of savings realized by the
underlying Vanguard funds by virtue of being part of a fund-of-funds. Accordingly, all expenses for
services provided by Vanguard to the fund and all other expenses incurred by the fund during the
34
Institutional Target Retirement 2050 Fund
period ended March 31, 2018, were borne by the underlying Vanguard funds in which the fund
invests. The fund’s trustees and officers are also trustees and officers, respectively, of the
underlying Vanguard funds, as well as directors and employees, respectively, of Vanguard.
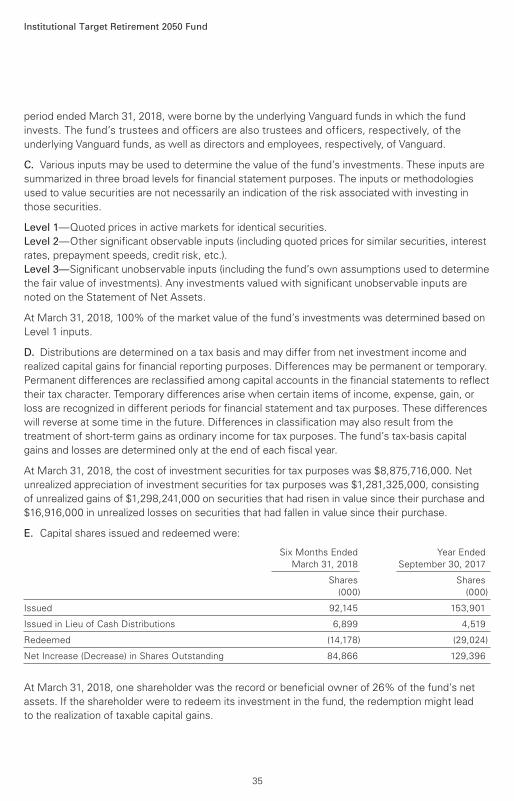
C. Various inputs may be used to determine the value of the fund’s investments. These inputs are
summarized in three broad levels for financial statement purposes. The inputs or methodologies
used to value securities are not necessarily an indication of the risk associated with investing in
those securities.
Level 1—Quoted prices in active markets for identical securities.
Level 2—Other significant observable inputs (including quoted prices for similar securities, interest
rates, prepayment speeds, credit risk, etc.).
Level 3—Significant unobservable inputs (including the fund’s own assumptions used to determine
the fair value of investments). Any investments valued with significant unobservable inputs are
noted on the Statement of Net Assets.
At March 31, 2018, 100% of the market value of the fund’s investments was determined based on
Level 1 inputs.
D. Distributions are determined on a tax basis and may differ from net investment income and
realized capital gains for financial reporting purposes. Differences may be permanent or temporary.
Permanent differences are reclassified among capital accounts in the financial statements to reflect
their tax character. Temporary differences arise when certain items of income, expense, gain, or
loss are recognized in different periods for financial statement and tax purposes. These differences
will reverse at some time in the future. Differences in classification may also result from the
treatment of short-term gains as ordinary income for tax purposes. The fund’s tax-basis capital
gains and losses are determined only at the end of each fiscal year.
At March 31, 2018, the cost of investment securities for tax purposes was $8,875,716,000. Net
unrealized appreciation of investment securities for tax purposes was $1,281,325,000, consisting
of unrealized gains of $1,298,241,000 on securities that had risen in value since their purchase and
$16,916,000 in unrealized losses on securities that had fallen in value since their purchase.
E. Capital shares issued and redeemed were:
Six Months Ended Year Ended
March 31, 2018 September 30, 2017
Shares Shares
(000) (000)
Issued 92,145 153,901
Issued in Lieu of Cash Distributions 6,899 4,519
Redeemed (14,178) (29,024)
Net Increase (Decrease) in Shares Outstanding 84,866 129,396
At March 31, 2018, one shareholder was the record or beneficial owner of 26% of the fund’s net
assets. If the shareholder were to redeem its investment in the fund, the redemption might lead
to the realization of taxable capital gains.
35

Institutional Target Retirement 2050 Fund
F. Transactions during the period in affiliated underlying Vanguard funds were as follows:
Current Period Transactions
Sept. 30, Proceeds Realized March 31,
2017 from Net Change in Capital Gain 2018
Market Purchases Securities Gain Unrealized Distributions Market
Value at Cost Sold (Loss) App. (Dep.) Income Received Value
($000) ($000) ($000) ($000) ($000) ($000) ($000) ($000)
Vanguard Market
Liquidity Fund 2,047 NA1 NA1 (2) — 32 — 2,958
Vanguard Total
Bond Market II
Index Fund 559,679 258,828 67,339 241 (17,440) 8,150 137 733,969
Vanguard Total
International Bond
Index Fund 231,846 71,928 — — 1,024 4,554 — 304,798
Vanguard Total
International Stock
Index Fund 2,840,923 746,109 20,138 123 78,953 38,725 — 3,645,970
Vanguard Total
Stock Market
Index Fund 4,310,066 998,104 27,203 95 188,284 45,756 — 5,469,346
Total 7,944,561 2,074,969 114,680 457 250,821 97,217 137 10,157,041
1 Not applicable—purchases and sales are for temporary cash investment purposes.
G. Management has determined that no material events or transactions occurred subsequent to
March 31, 2018, that would require recognition or disclosure in these financial statements.
36

Institutional Target Retirement 2055 Fund
Fund ProfileAs of March 31, 2018
1 This figure—drawn from the prospectus dated January 25, 2018—represents an estimate of the weighted average of the expenseratios and any transaction fees charged by the underlying mutual funds (the ”acquired” funds) in which the Institutional Target Retirement2055 Fund invests. The fund does not charge any expenses or fees of its own. For the six months ended March 31, 2018, the annualizedacquired fund fees and expenses were 0.09%.
37
Allocation to Underlying Vanguard Funds
Vanguard Total Stock Market Index Fund
Institutional Shares 54.1%
Vanguard Total International Stock Index
Fund Investor Shares 35.7
Vanguard Total Bond Market II Index Fund
Investor Shares 7.2
Vanguard Total International Bond Index
Fund Admiral Shares 3.0
Total Fund Characteristics
Ticker Symbol VIVLX
30-Day SEC Yield 2.13%
Acquired Fund Fees and Expenses1 0.09%
Fund Asset Allocation
89.8% Stocks
10.2% Bonds

All of the returns in this report represent past performance, which is not a guarantee of future results that may be achieved by the fund. (Current performance may be lower or higher thanthe performance data cited. For performance data current to the most recent month-end, visitour website at vanguard.com/performance.) Note, too, that both investment returns and principal value can fluctuate widely, so an investor’s shares, when sold, could be worth more or less than their original cost. The returns shown do not reflect taxes that a shareholder would pay
on fund distributions or on the sale of fund shares.
Performance Summary
Institutional Target Retirement 2055 Fund
See Financial Highlights for dividend and capital gains information.
38
Fiscal-Year Total Returns (%): June 26, 2015, Through March 31, 2018
–9.60 –9.60
2015
12.16 12.59
2016
16.95 17.01
2017
4.60 4.68
2018
Institutional Target Retirement 2055 Fund
Target 2055 Composite Index
For a benchmark description, see the Glossary.
Note: For 2018, performance data reflect the six months ended March 31, 2018.
Average Annual Total Returns: Periods Ended March 31, 2018
Since Inception
Inception Date One Year Income Capital Total
Institutional Target
Retirement 2055 Fund 6/26/2015 13.71% 1.71% 6.40% 8.11%

Investment Companies (99.9%)
U.S. Stock Fund (54.1%)
Vanguard Total Stock Market Index Fund Institutional Shares 35,210,767 2,326,023
International Stock Fund (35.6%)
Vanguard Total International Stock Index Fund Investor Shares 84,598,982 1,532,088
U.S. Bond Fund (7.2%) 1 Vanguard Total Bond Market II Index Fund Investor Shares 29,303,624 307,102
International Bond Fund (3.0%)
Vanguard Total International Bond Index Fund Admiral Shares 5,866,870 128,133
Total Investment Companies (Cost $3,796,260) 4,293,346
Temporary Cash Investment (0.1%)
Money Market Fund (0.1%)1 Vanguard Market Liquidity Fund, 1.775% (Cost $4,451) 44,514 4,451
Total Investments (100.0%) (Cost $3,800,711) 4,297,797
Other Assets and Liabilities (0.0%)
Other Assets 44,996
Liabilities (43,689)
1,307
Net Assets (100%)
Applicable to 181,160,077 outstanding $.001 par value shares of
beneficial interest (unlimited authorization) 4,299,104
Net Asset Value Per Share $23.73
Market
Value•
Shares ($000)
Institutional Target Retirement 2055 Fund
Statement of Net AssetsAs of March 31, 2018
Financial Statements (unaudited)
The fund reports a complete list of its holdings in regulatory filings four times in each fiscal year, at
the quarter-ends. For the second and fourth fiscal quarters, the lists appear in the fund’s semiannual
and annual reports to shareholders. For the first and third fiscal quarters, the fund files the lists with
the Securities and Exchange Commission on Form N-Q. Shareholders can look up the fund’s Forms
N-Q on the SEC’s website at sec.gov. Forms N-Q may also be reviewed and copied at the SEC’s
Public Reference Room (see the back cover of this report for further information).
39
Institutional Target Retirement 2055 Fund
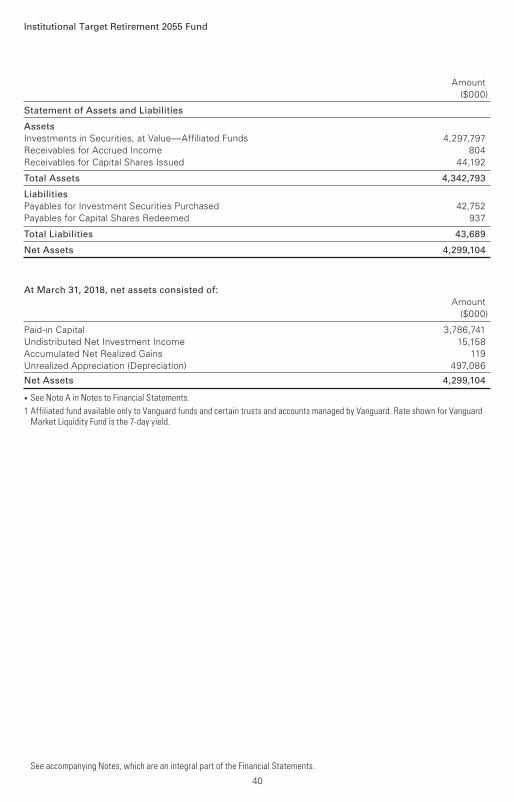
Statement of Assets and Liabilities
Assets
Investments in Securities, at Value—Affiliated Funds 4,297,797
Receivables for Accrued Income 804
Receivables for Capital Shares Issued 44,192
Total Assets 4,342,793
Liabilities
Payables for Investment Securities Purchased 42,752
Payables for Capital Shares Redeemed 937
Total Liabilities 43,689
Net Assets 4,299,104
At March 31, 2018, net assets consisted of:
Amount
($000)
Paid-in Capital 3,786,741
Undistributed Net Investment Income 15,158
Accumulated Net Realized Gains 119
Unrealized Appreciation (Depreciation) 497,086
Net Assets 4,299,104
• See Note A in Notes to Financial Statements.
1 Affiliated fund available only to Vanguard funds and certain trusts and accounts managed by Vanguard. Rate shown for Vanguard Market Liquidity Fund is the 7-day yield.
Amount
($000)
See accompanying Notes, which are an integral part of the Financial Statements.
40
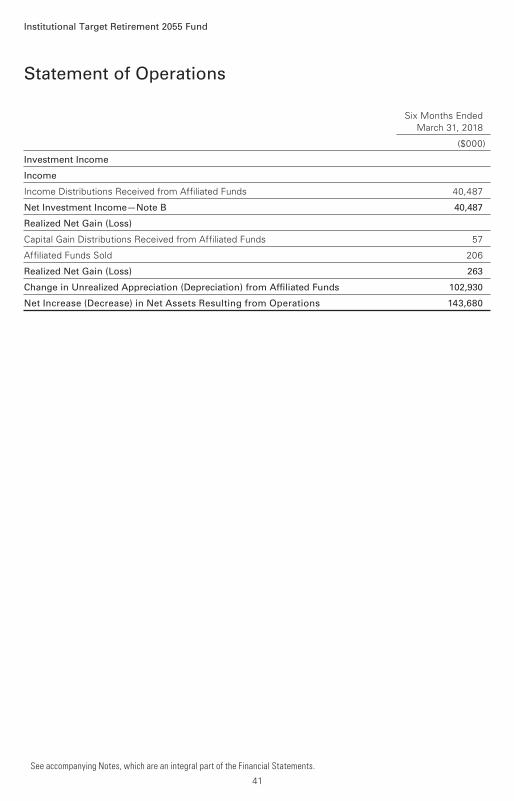
Six Months Ended
March 31, 2018
($000)
Investment Income
Income
Income Distributions Received from Affiliated Funds 40,487
Net Investment Income—Note B 40,487
Realized Net Gain (Loss)
Capital Gain Distributions Received from Affiliated Funds 57
Affiliated Funds Sold 206
Realized Net Gain (Loss) 263
Change in Unrealized Appreciation (Depreciation) from Affiliated Funds 102,930
Net Increase (Decrease) in Net Assets Resulting from Operations 143,680
Statement of Operations
Institutional Target Retirement 2055 Fund
See accompanying Notes, which are an integral part of the Financial Statements.
41
Statement of Changes in Net Assets
Institutional Target Retirement 2055 Fund
See accompanying Notes, which are an integral part of the Financial Statements.
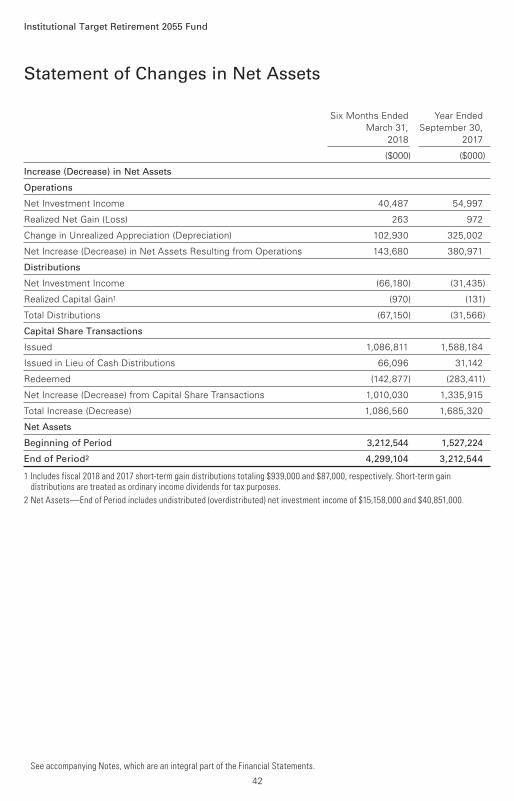
Six Months Ended Year Ended
March 31, September 30,
2018 2017
($000) ($000)
Increase (Decrease) in Net Assets
Operations
Net Investment Income 40,487 54,997
Realized Net Gain (Loss) 263 972
Change in Unrealized Appreciation (Depreciation) 102,930 325,002
Net Increase (Decrease) in Net Assets Resulting from Operations 143,680 380,971
Distributions
Net Investment Income (66,180) (31,435)
Realized Capital Gain1 (970) (131)
Total Distributions (67,150) (31,566)
Capital Share Transactions
Issued 1,086,811 1,588,184
Issued in Lieu of Cash Distributions 66,096 31,142
Redeemed (142,877) (283,411)
Net Increase (Decrease) from Capital Share Transactions 1,010,030 1,335,915
Total Increase (Decrease) 1,086,560 1,685,320
Net Assets
Beginning of Period 3,212,544 1,527,224
End of Period2 4,299,104 3,212,544
1 Includes fiscal 2018 and 2017 short-term gain distributions totaling $939,000 and $87,000, respectively. Short-term gain distributions are treated as ordinary income dividends for tax purposes.
2 Net Assets—End of Period includes undistributed (overdistributed) net investment income of $15,158,000 and $40,851,000.
42
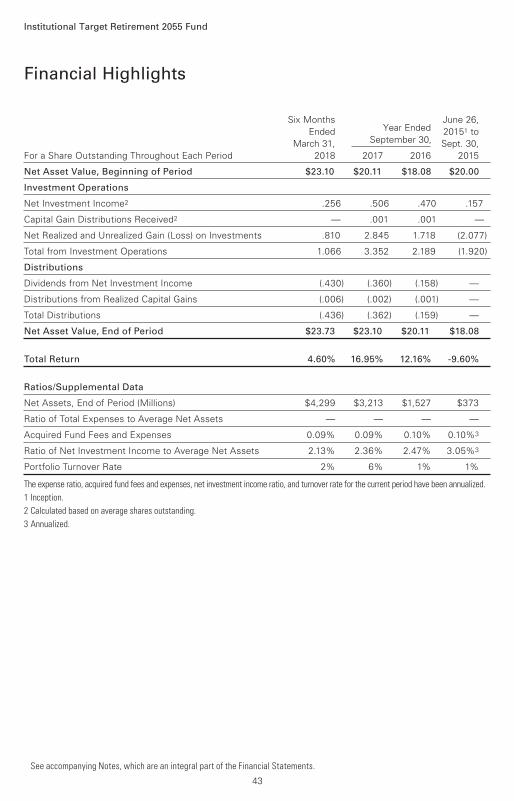
Six Months June 26,
Ended Year Ended 20151 to
March 31, September 30, Sept. 30,
For a Share Outstanding Throughout Each Period 2018 2017 2016 2015
Net Asset Value, Beginning of Period $23.10 $20.11 $18.08 $20.00
Investment Operations
Net Investment Income2 .256 .506 .470 .157
Capital Gain Distributions Received2 — .001 .001 —
Net Realized and Unrealized Gain (Loss) on Investments .810 2.845 1.718 (2.077)
Total from Investment Operations 1.066 3.352 2.189 (1.920)
Distributions
Dividends from Net Investment Income (.430) (.360) (.158) —
Distributions from Realized Capital Gains (.006) (.002) (.001) —
Total Distributions (.436) (.362) (.159) —
Net Asset Value, End of Period $23.73 $23.10 $20.11 $18.08
Total Return 4.60% 16.95% 12.16% -9.60%
Ratios/Supplemental Data
Net Assets, End of Period (Millions) $4,299 $3,213 $1,527 $373
Ratio of Total Expenses to Average Net Assets — — — —
Acquired Fund Fees and Expenses 0.09% 0.09% 0.10% 0.10%3
Ratio of Net Investment Income to Average Net Assets 2.13% 2.36% 2.47% 3.05%3
Portfolio Turnover Rate 2% 6% 1% 1%
The expense ratio, acquired fund fees and expenses, net investment income ratio, and turnover rate for the current period have been annualized.
1 Inception.
2 Calculated based on average shares outstanding.
3 Annualized.
Financial Highlights
See accompanying Notes, which are an integral part of the Financial Statements.
Institutional Target Retirement 2055 Fund
43

Notes to Financial Statements
Institutional Target Retirement 2055 Fund
Vanguard Institutional Target Retirement 2055 Fund is registered under the Investment Company
Act of 1940 as an open-end investment company, or mutual fund. The fund follows a balanced
investment strategy by investing in selected Vanguard funds to achieve its targeted allocation of
assets to U.S. and international stocks, and U.S. and international bonds. Financial statements
and other information about each underlying fund are available on vanguard.com.
A. The following significant accounting policies conform to generally accepted accounting principles
for U.S. investment companies. The fund consistently follows such policies in preparing its financial
statements.
1. Security Valuation: Investments are valued at the net asset value of each underlying Vanguard
fund determined as of the close of the New York Stock Exchange (generally 4 p.m., Eastern time)
on the valuation date.
2. Federal Income Taxes: The fund intends to continue to qualify as a regulated investment
company and distribute all of its taxable income. Management has analyzed the fund’s tax positions
taken for all open federal income tax years (September 30, 2015–2017), and for the period ended
March 31, 2018, and has concluded that no provision for federal income tax is required in the fund’s
financial statements.
3. Distributions: Distributions to shareholders are recorded on the ex-dividend date.
4. Credit Facility: The fund and certain other funds managed by The Vanguard Group (“Vanguard”)
participate in a $3.1 billion committed credit facility provided by a syndicate of lenders pursuant to
a credit agreement that may be renewed annually; each fund is individually liable for its borrowings,
if any, under the credit facility. Borrowings may be utilized for temporary and emergency purposes,
and are subject to the fund’s regulatory and contractual borrowing restrictions. The participating
funds are charged administrative fees and an annual commitment fee of 0.10% of the undrawn
amount of the facility; these fees are allocated to the funds based on a method approved by the
fund’s board of trustees and borne by the funds in which the fund invests (see Note B). Any
borrowings under this facility bear interest at a rate based upon the higher of the one-month
London Interbank Offered Rate, federal funds effective rate, or overnight bank funding rate
plus an agreed-upon spread.
The fund had no borrowings outstanding at March 31, 2018, or at any time during the period
then ended.
5. Other: Income and capital gain distributions received are recorded on the ex-dividend date.
Security transactions are accounted for on the date securities are bought or sold. Costs used
to determine realized gains (losses) on the sale of investment securities are those of the specific
securities sold.
B. In accordance with the terms of a Funds’ Service Agreement (the “FSA”) between Vanguard
and the fund, Vanguard furnishes to the fund investment advisory, corporate management,
administrative, marketing, and distribution services at Vanguard’s cost of operations (as defined
by the FSA). These costs of operations are allocated to the fund based on methods and guidelines
approved by the board of trustees. The FSA provides that expenses otherwise allocable to
Vanguard funds-of-funds may be reduced or eliminated to the extent of savings realized by the
underlying Vanguard funds by virtue of being part of a fund-of-funds. Accordingly, all expenses for
services provided by Vanguard to the fund and all other expenses incurred by the fund during the
44
Institutional Target Retirement 2055 Fund
period ended March 31, 2018, were borne by the underlying Vanguard funds in which the fund
invests. The fund’s trustees and officers are also trustees and officers, respectively, of the
underlying Vanguard funds, as well as directors and employees, respectively, of Vanguard.
C. Various inputs may be used to determine the value of the fund’s investments. These inputs are
summarized in three broad levels for financial statement purposes. The inputs or methodologies
used to value securities are not necessarily an indication of the risk associated with investing in
those securities.
Level 1—Quoted prices in active markets for identical securities.
Level 2—Other significant observable inputs (including quoted prices for similar securities, interest
rates, prepayment speeds, credit risk, etc.).
Level 3—Significant unobservable inputs (including the fund’s own assumptions used to determine
the fair value of investments). Any investments valued with significant unobservable inputs are
noted on the Statement of Net Assets.
At March 31, 2018, 100% of the market value of the fund’s investments was determined based on
Level 1 inputs.
D. Distributions are determined on a tax basis and may differ from net investment income and
realized capital gains for financial reporting purposes. Differences may be permanent or temporary.
Permanent differences are reclassified among capital accounts in the financial statements to reflect
their tax character. Temporary differences arise when certain items of income, expense, gain, or
loss are recognized in different periods for financial statement and tax purposes. These differences
will reverse at some time in the future. Differences in classification may also result from the
treatment of short-term gains as ordinary income for tax purposes. The fund’s tax-basis capital
gains and losses are determined only at the end of each fiscal year.
At March 31, 2018, the cost of investment securities for tax purposes was $3,800,711,000. Net
unrealized appreciation of investment securities for tax purposes was $497,086,000, consisting
of unrealized gains of $504,147,000 on securities that had risen in value since their purchase and
$7,061,000 in unrealized losses on securities that had fallen in value since their purchase.
E. Capital shares issued and redeemed were:
Six Months Ended Year Ended
March 31, 2018 September 30, 2017
Shares Shares
(000) (000)
Issued 45,218 74,615
Issued in Lieu of Cash Distributions 2,762 1,558
Redeemed (5,916) (13,002)
Net Increase (Decrease) in Shares Outstanding 42,064 63,171
At March 31, 2018, one shareholder was the record or beneficial owner of 25% of the fund’s net
assets. If the shareholder were to redeem its investment in the fund, the redemption might lead
to the realization of taxable capital gains.
45

Institutional Target Retirement 2055 Fund
F. Transactions during the period in affiliated underlying Vanguard funds were as follows:
Current Period Transactions
Sept. 30, Proceeds Realized March 31,
2017 from Net Change in Capital Gain 2018
Market Purchases Securities Gain Unrealized Distributions Market
Value at Cost Sold (Loss) App. (Dep.) Income Received Value
($000) ($000) ($000) ($000) ($000) ($000) ($000) ($000)
Vanguard Market
Liquidity Fund 2,132 NA1 NA1 — — 18 — 4,451
Vanguard Total
Bond Market II
Index Fund 225,447 111,818 23,054 154 (7,263) 3,377 57 307,102
Vanguard Total
International Bond
Index Fund 93,488 34,225 — — 420 1,880 — 128,133
Vanguard Total
International Stock
Index Fund 1,145,876 364,002 10,579 46 32,743 16,116 — 1,532,088
Vanguard Total
Stock Market
Index Fund 1,742,584 519,345 12,942 6 77,030 19,096 — 2,326,023
Total 3,209,527 1,029,390 46,575 206 102,930 40,487 57 4,297,797
1 Not applicable—purchases and sales are for temporary cash investment purposes.
G. Management has determined that no material events or transactions occurred subsequent to
March 31, 2018, that would require recognition or disclosure in these financial statements.
46

Institutional Target Retirement 2060 Fund
Fund ProfileAs of March 31, 2018
1 This figure—drawn from the prospectus dated January 25, 2018—represents an estimate of the weighted average of the expenseratios and any transaction fees charged by the underlying mutual funds (the ”acquired” funds) in which the Institutional Target Retirement2060 Fund invests. The fund does not charge any expenses or fees of its own. For the six months ended March 31, 2018, the annualizedacquired fund fees and expenses were 0.09%.
47
Allocation to Underlying Vanguard Funds
Vanguard Total Stock Market Index Fund
Institutional Shares 54.2%
Vanguard Total International Stock Index
Fund Investor Shares 35.8
Vanguard Total Bond Market II Index Fund
Investor Shares 7.0
Vanguard Total International Bond Index
Fund Admiral Shares 3.0
Total Fund Characteristics
Ticker Symbol VILVX
30-Day SEC Yield 2.13%
Acquired Fund Fees and Expenses1 0.09%
Fund Asset Allocation
90.0% Stocks
10.0% Bonds
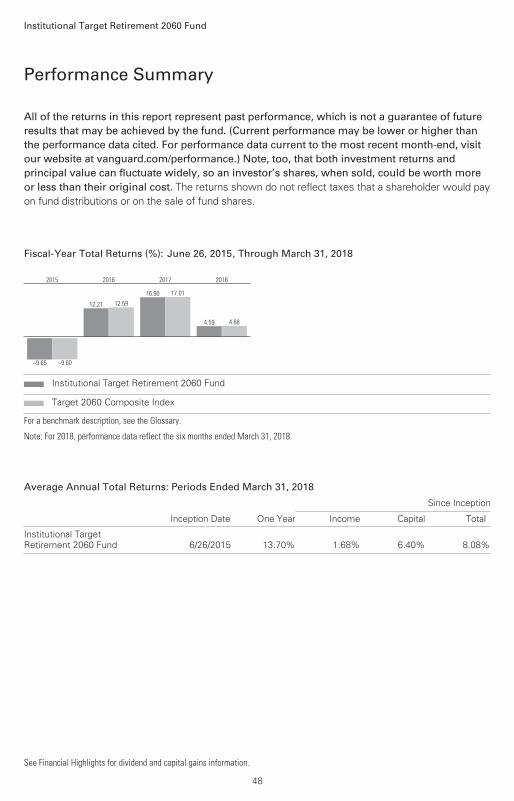
All of the returns in this report represent past performance, which is not a guarantee of future results that may be achieved by the fund. (Current performance may be lower or higher thanthe performance data cited. For performance data current to the most recent month-end, visitour website at vanguard.com/performance.) Note, too, that both investment returns and principal value can fluctuate widely, so an investor’s shares, when sold, could be worth more or less than their original cost. The returns shown do not reflect taxes that a shareholder would pay
on fund distributions or on the sale of fund shares.
Performance Summary
Institutional Target Retirement 2060 Fund
See Financial Highlights for dividend and capital gains information.
48
Fiscal-Year Total Returns (%): June 26, 2015, Through March 31, 2018
–9.65 –9.60
2015
12.21 12.59
2016
16.90 17.01
2017
4.59 4.68
2018
Institutional Target Retirement 2060 Fund
Target 2060 Composite Index
For a benchmark description, see the Glossary.
Note: For 2018, performance data reflect the six months ended March 31, 2018.
Average Annual Total Returns: Periods Ended March 31, 2018
Since Inception
Inception Date One Year Income Capital Total
Institutional Target
Retirement 2060 Fund 6/26/2015 13.70% 1.68% 6.40% 8.08%

Investment Companies (99.8%)
U.S. Stock Fund (54.1%)
Vanguard Total Stock Market Index Fund Institutional Shares 9,585,208 633,199
International Stock Fund (35.7%)
Vanguard Total International Stock Index Fund Investor Shares 23,053,161 417,493
U.S. Bond Fund (7.0%) 1 Vanguard Total Bond Market II Index Fund Investor Shares 7,786,331 81,601
International Bond Fund (3.0%)
Vanguard Total International Bond Index Fund Admiral Shares 1,596,134 34,859
Total Investment Companies (Cost $1,052,307) 1,167,152
Temporary Cash Investment (0.2%)
Money Market Fund (0.2%)1 Vanguard Market Liquidity Fund, 1.775% (Cost $2,142) 21,423 2,142
Total Investments (100.0%) (Cost $1,054,449) 1,169,294
Other Assets and Liabilities (0.0%)
Other Assets 12,113
Liabilities (11,969)
144
Net Assets (100%)
Applicable to 49,280,913 outstanding $.001 par value shares of
beneficial interest (unlimited authorization) 1,169,438
Net Asset Value Per Share $23.73
Market
Value•
Shares ($000)
Institutional Target Retirement 2060 Fund
Statement of Net AssetsAs of March 31, 2018
Financial Statements (unaudited)
The fund reports a complete list of its holdings in regulatory filings four times in each fiscal year, at
the quarter-ends. For the second and fourth fiscal quarters, the lists appear in the fund’s semiannual
and annual reports to shareholders. For the first and third fiscal quarters, the fund files the lists with
the Securities and Exchange Commission on Form N-Q. Shareholders can look up the fund’s Forms
N-Q on the SEC’s website at sec.gov. Forms N-Q may also be reviewed and copied at the SEC’s
Public Reference Room (see the back cover of this report for further information).
49

Institutional Target Retirement 2060 Fund
Statement of Assets and Liabilities
Assets
Investments in Securities, at Value—Affiliated Funds 1,169,294 Receivables for Accrued Income 217 Receivables for Capital Shares Issued 11,896
Total Assets 1,181,407
Liabilities
Payables for Investment Securities Purchased 11,557 Payables for Capital Shares Redeemed 412
Total Liabilities 11,969
Net Assets 1,169,438
At March 31, 2018, net assets consisted of:
Amount ($000)
Paid-in Capital 1,050,434Undistributed Net Investment Income 4,102Accumulated Net Realized Gains 57Unrealized Appreciation (Depreciation) 114,845
Net Assets 1,169,438
• See Note A in Notes to Financial Statements.
1 Affiliated fund available only to Vanguard funds and certain trusts and accounts managed by Vanguard. Rate shown for Vanguard Market Liquidity Fund is the 7-day yield.
Amount ($000)
See accompanying Notes, which are an integral part of the Financial Statements.
50

Six Months Ended March 31, 2018
($000)
Investment Income
Income
Income Distributions Received from Affiliated Funds 10,663
Net Investment Income—Note B 10,663
Realized Net Gain (Loss)
Capital Gain Distributions Received from Affiliated Funds 15
Affiliated Funds Sold 92
Realized Net Gain (Loss) 107
Change in Unrealized Appreciation (Depreciation) from Affiliated Funds 24,035
Net Increase (Decrease) in Net Assets Resulting from Operations 34,805
Statement of Operations
Institutional Target Retirement 2060 Fund
See accompanying Notes, which are an integral part of the Financial Statements.
51
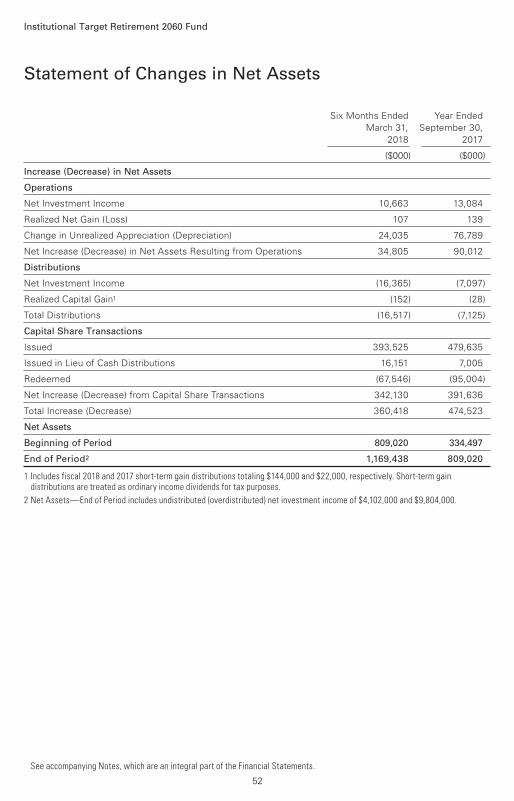
Statement of Changes in Net Assets
Institutional Target Retirement 2060 Fund
See accompanying Notes, which are an integral part of the Financial Statements.
Six Months Ended Year Ended
March 31, September 30,
2018 2017
($000) ($000)
Increase (Decrease) in Net Assets
Operations
Net Investment Income 10,663 13,084
Realized Net Gain (Loss) 107 139
Change in Unrealized Appreciation (Depreciation) 24,035 76,789
Net Increase (Decrease) in Net Assets Resulting from Operations 34,805 90,012
Distributions
Net Investment Income (16,365) (7,097)
Realized Capital Gain1 (152) (28)
Total Distributions (16,517) (7,125)
Capital Share Transactions
Issued 393,525 479,635
Issued in Lieu of Cash Distributions 16,151 7,005
Redeemed (67,546) (95,004)
Net Increase (Decrease) from Capital Share Transactions 342,130 391,636
Total Increase (Decrease) 360,418 474,523
Net Assets
Beginning of Period 809,020 334,497
End of Period2 1,169,438 809,020
1 Includes fiscal 2018 and 2017 short-term gain distributions totaling $144,000 and $22,000, respectively. Short-term gain distributions are treated as ordinary income dividends for tax purposes.
2 Net Assets—End of Period includes undistributed (overdistributed) net investment income of $4,102,000 and $9,804,000.
52

Six Months June 26,
Ended Year Ended 20151 to
March 31, September 30, Sept. 30,
For a Share Outstanding Throughout Each Period 2018 2017 2016 2015
Net Asset Value, Beginning of Period $23.08 $20.10 $18.07 $20.00
Investment Operations
Net Investment Income2 .257 .511 .466 .135
Capital Gain Distributions Received2 — .001 .001 —
Net Realized and Unrealized Gain (Loss) on Investments .806 2.828 1.729 (2.065)
Total from Investment Operations 1.063 3.340 2.196 (1.930)
Distributions
Dividends from Net Investment Income (.409) (.359) (.165) —
Distributions from Realized Capital Gains (.004) (.001) (.001) —
Total Distributions (.413) (.360) (.166) —
Net Asset Value, End of Period $23.73 $23.08 $20.10 $18.07
Total Return 4.59% 16.90% 12.21% -9.65%
Ratios/Supplemental Data
Net Assets, End of Period (Millions) $1,169 $809 $334 $95
Ratio of Total Expenses to Average Net Assets — — — —
Acquired Fund Fees and Expenses 0.09% 0.09% 0.10% 0.10%3
Ratio of Net Investment Income to Average Net Assets 2.15% 2.38% 2.45% 2.53%3
Portfolio Turnover Rate 4% 7% 4% 4%
The expense ratio, acquired fund fees and expenses, net investment income ratio, and turnover rate for the current period have been annualized.
1 Inception.
2 Calculated based on average shares outstanding.
3 Annualized.
Financial Highlights
See accompanying Notes, which are an integral part of the Financial Statements.
Institutional Target Retirement 2060 Fund
53

Notes to Financial Statements
Institutional Target Retirement 2060 Fund
Vanguard Institutional Target Retirement 2060 Fund is registered under the Investment Company
Act of 1940 as an open-end investment company, or mutual fund. The fund follows a balanced
investment strategy by investing in selected Vanguard funds to achieve its targeted allocation
of assets to U.S. and international stocks, and U.S. and international bonds. Financial statements
and other information about each underlying fund are available on vanguard.com.
A. The following significant accounting policies conform to generally accepted accounting principles
for U.S. investment companies. The fund consistently follows such policies in preparing its financial
statements.
1. Security Valuation: Investments are valued at the net asset value of each underlying Vanguard
fund determined as of the close of the New York Stock Exchange (generally 4 p.m., Eastern time)
on the valuation date.
2. Federal Income Taxes: The fund intends to continue to qualify as a regulated investment
company and distribute all of its taxable income. Management has analyzed the fund’s tax positions
taken for all open federal income tax years (September 30, 2015–2017), and for the period ended
March 31, 2018, and has concluded that no provision for federal income tax is required in the fund’s
financial statements.
3. Distributions: Distributions to shareholders are recorded on the ex-dividend date.
4. Credit Facility: The fund and certain other funds managed by The Vanguard Group (“Vanguard”)
participate in a $3.1 billion committed credit facility provided by a syndicate of lenders pursuant to
a credit agreement that may be renewed annually; each fund is individually liable for its borrowings,
if any, under the credit facility. Borrowings may be utilized for temporary and emergency purposes,
and are subject to the fund’s regulatory and contractual borrowing restrictions. The participating
funds are charged administrative fees and an annual commitment fee of 0.10% of the undrawn
amount of the facility; these fees are allocated to the funds based on a method approved by the
fund’s board of trustees and borne by the funds in which the fund invests (see Note B). Any
borrowings under this facility bear interest at a rate based upon the higher of the one-month
London Interbank Offered Rate, federal funds effective rate, or overnight bank funding rate
plus an agreed-upon spread.
The fund had no borrowings outstanding at March 31, 2018, or at any time during the period
then ended.
5. Other: Income and capital gain distributions received are recorded on the ex-dividend date.
Security transactions are accounted for on the date securities are bought or sold. Costs used
to determine realized gains (losses) on the sale of investment securities are those of the specific
securities sold.
B. In accordance with the terms of a Funds’ Service Agreement (the “FSA”) between Vanguard
and the fund, Vanguard furnishes to the fund investment advisory, corporate management,
administrative, marketing, and distribution services at Vanguard’s cost of operations (as defined
by the FSA). These costs of operations are allocated to the fund based on methods and guidelines
approved by the board of trustees. The FSA provides that expenses otherwise allocable to
Vanguard funds-of-funds may be reduced or eliminated to the extent of savings realized by the
underlying Vanguard funds by virtue of being part of a fund-of-funds. Accordingly, all expenses for
services provided by Vanguard to the fund and all other expenses incurred by the fund during the
54
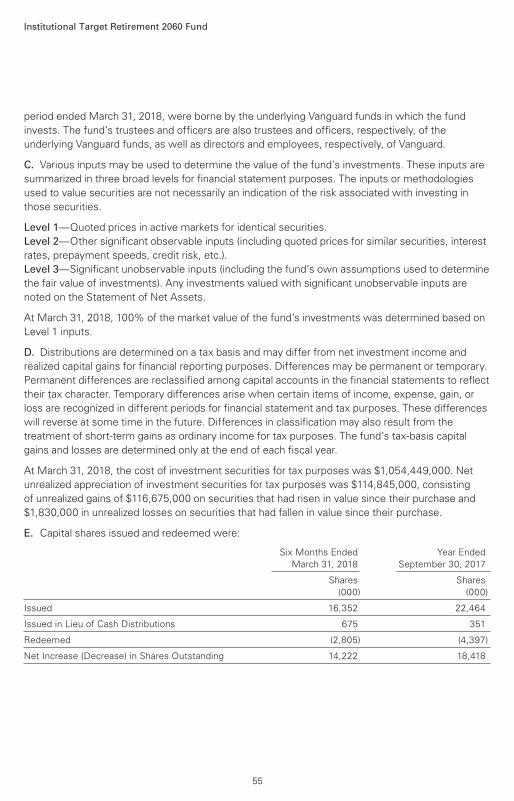
Institutional Target Retirement 2060 Fund
period ended March 31, 2018, were borne by the underlying Vanguard funds in which the fund
invests. The fund’s trustees and officers are also trustees and officers, respectively, of the
underlying Vanguard funds, as well as directors and employees, respectively, of Vanguard.
C. Various inputs may be used to determine the value of the fund’s investments. These inputs are
summarized in three broad levels for financial statement purposes. The inputs or methodologies
used to value securities are not necessarily an indication of the risk associated with investing in
those securities.
Level 1—Quoted prices in active markets for identical securities.
Level 2—Other significant observable inputs (including quoted prices for similar securities, interest
rates, prepayment speeds, credit risk, etc.).
Level 3—Significant unobservable inputs (including the fund’s own assumptions used to determine
the fair value of investments). Any investments valued with significant unobservable inputs are
noted on the Statement of Net Assets.
At March 31, 2018, 100% of the market value of the fund’s investments was determined based on
Level 1 inputs.
D. Distributions are determined on a tax basis and may differ from net investment income and
realized capital gains for financial reporting purposes. Differences may be permanent or temporary.
Permanent differences are reclassified among capital accounts in the financial statements to reflect
their tax character. Temporary differences arise when certain items of income, expense, gain, or
loss are recognized in different periods for financial statement and tax purposes. These differences
will reverse at some time in the future. Differences in classification may also result from the
treatment of short-term gains as ordinary income for tax purposes. The fund’s tax-basis capital
gains and losses are determined only at the end of each fiscal year.
At March 31, 2018, the cost of investment securities for tax purposes was $1,054,449,000. Net
unrealized appreciation of investment securities for tax purposes was $114,845,000, consisting
of unrealized gains of $116,675,000 on securities that had risen in value since their purchase and
$1,830,000 in unrealized losses on securities that had fallen in value since their purchase.
E. Capital shares issued and redeemed were:
Six Months Ended Year Ended
March 31, 2018 September 30, 2017
Shares Shares
(000) (000)
Issued 16,352 22,464
Issued in Lieu of Cash Distributions 675 351
Redeemed (2,805) (4,397)
Net Increase (Decrease) in Shares Outstanding 14,222 18,418
55
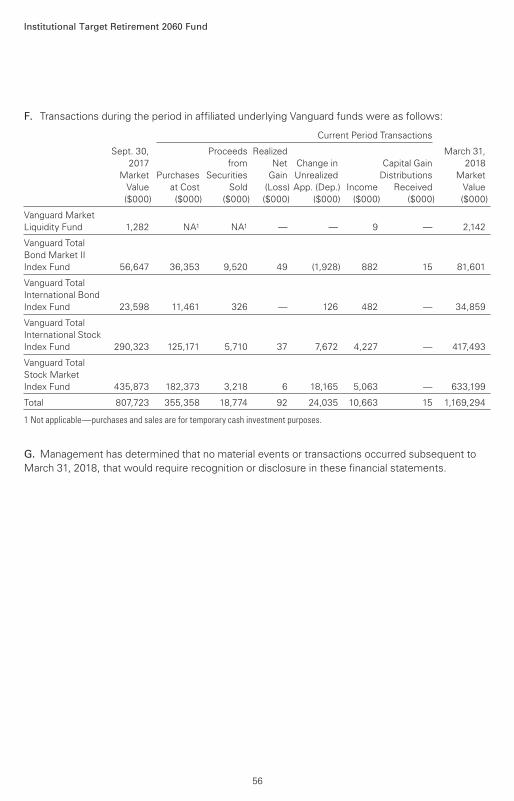
Institutional Target Retirement 2060 Fund
F. Transactions during the period in affiliated underlying Vanguard funds were as follows:
Current Period Transactions
Sept. 30, Proceeds Realized March 31,
2017 from Net Change in Capital Gain 2018
Market Purchases Securities Gain Unrealized Distributions Market
Value at Cost Sold (Loss) App. (Dep.) Income Received Value
($000) ($000) ($000) ($000) ($000) ($000) ($000) ($000)
Vanguard Market
Liquidity Fund 1,282 NA1 NA1 — — 9 — 2,142
Vanguard Total
Bond Market II
Index Fund 56,647 36,353 9,520 49 (1,928) 882 15 81,601
Vanguard Total
International Bond
Index Fund 23,598 11,461 326 — 126 482 — 34,859
Vanguard Total
International Stock
Index Fund 290,323 125,171 5,710 37 7,672 4,227 — 417,493
Vanguard Total
Stock Market
Index Fund 435,873 182,373 3,218 6 18,165 5,063 — 633,199
Total 807,723 355,358 18,774 92 24,035 10,663 15 1,169,294
1 Not applicable—purchases and sales are for temporary cash investment purposes.
G. Management has determined that no material events or transactions occurred subsequent to
March 31, 2018, that would require recognition or disclosure in these financial statements.
56
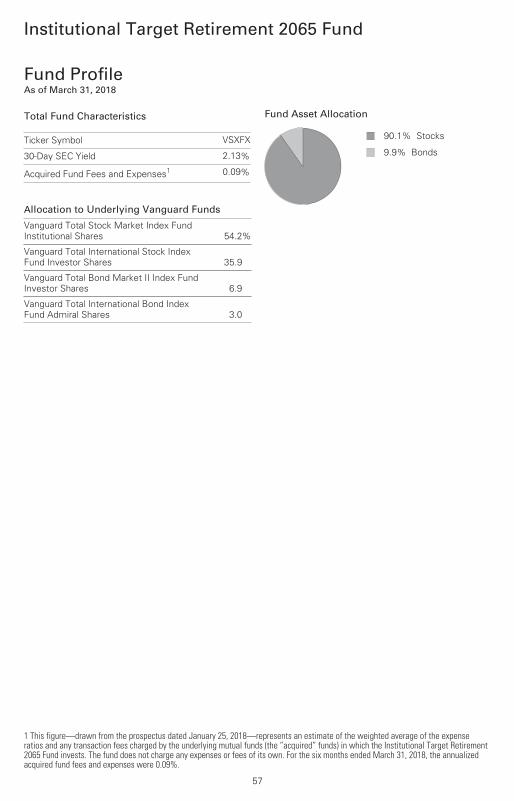
Institutional Target Retirement 2065 Fund
Fund ProfileAs of March 31, 2018
1 This figure—drawn from the prospectus dated January 25, 2018—represents an estimate of the weighted average of the expenseratios and any transaction fees charged by the underlying mutual funds (the ”acquired” funds) in which the Institutional Target Retirement2065 Fund invests. The fund does not charge any expenses or fees of its own. For the six months ended March 31, 2018, the annualizedacquired fund fees and expenses were 0.09%.
57
Allocation to Underlying Vanguard Funds
Vanguard Total Stock Market Index FundInstitutional Shares 54.2%
Vanguard Total International Stock IndexFund Investor Shares 35.9
Vanguard Total Bond Market II Index FundInvestor Shares 6.9
Vanguard Total International Bond IndexFund Admiral Shares 3.0
Total Fund Characteristics
Ticker Symbol VSXFX
30-Day SEC Yield 2.13%
Acquired Fund Fees and Expenses1 0.09%
Fund Asset Allocation
90.1% Stocks
9.9% Bonds
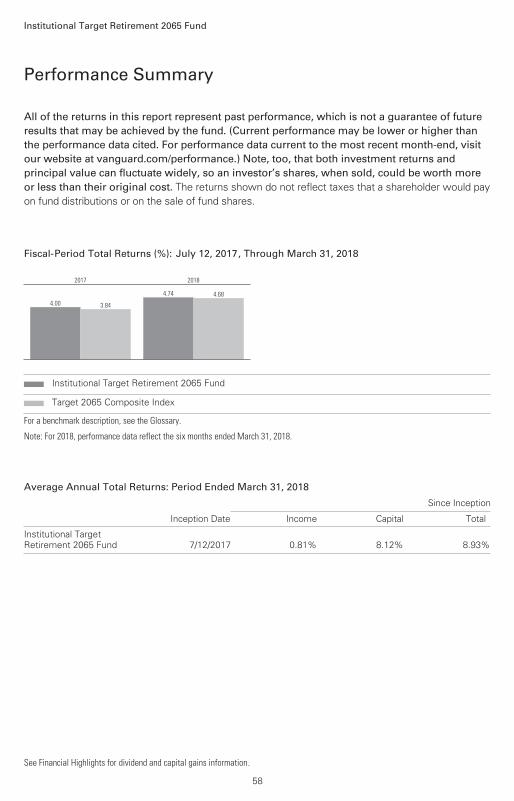
All of the returns in this report represent past performance, which is not a guarantee of future results that may be achieved by the fund. (Current performance may be lower or higher thanthe performance data cited. For performance data current to the most recent month-end, visitour website at vanguard.com/performance.) Note, too, that both investment returns and principal value can fluctuate widely, so an investor’s shares, when sold, could be worth more or less than their original cost. The returns shown do not reflect taxes that a shareholder would payon fund distributions or on the sale of fund shares.
Performance Summary
Institutional Target Retirement 2065 Fund
See Financial Highlights for dividend and capital gains information.
58
Fiscal-Period Total Returns (%): July 12, 2017, Through March 31, 2018
4.00 3.84
2017
4.74 4.68
2018
Institutional Target Retirement 2065 Fund
Target 2065 Composite Index
For a benchmark description, see the Glossary.
Note: For 2018, performance data reflect the six months ended March 31, 2018.
Average Annual Total Returns: Period Ended March 31, 2018
Since Inception
Inception Date Income Capital Total
Institutional TargetRetirement 2065 Fund 7/12/2017 0.81% 8.12% 8.93%
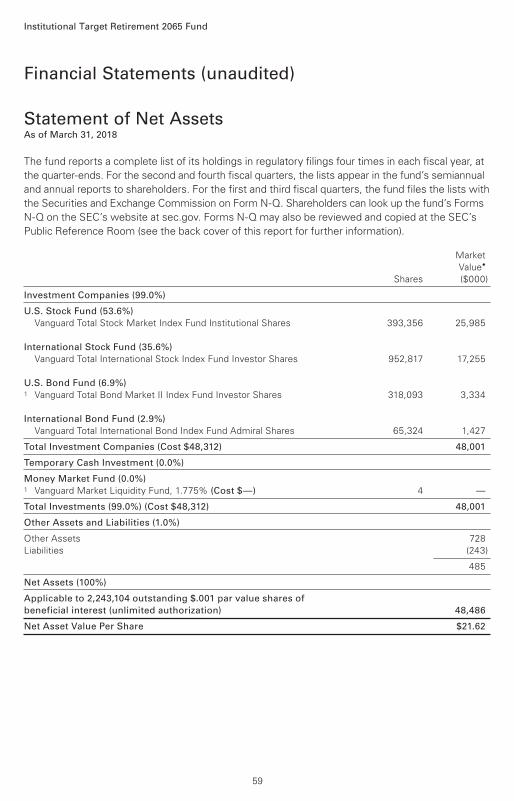
Investment Companies (99.0%)
U.S. Stock Fund (53.6%)
Vanguard Total Stock Market Index Fund Institutional Shares 393,356 25,985
International Stock Fund (35.6%)
Vanguard Total International Stock Index Fund Investor Shares 952,817 17,255
U.S. Bond Fund (6.9%) 1 Vanguard Total Bond Market II Index Fund Investor Shares 318,093 3,334
International Bond Fund (2.9%)
Vanguard Total International Bond Index Fund Admiral Shares 65,324 1,427
Total Investment Companies (Cost $48,312) 48,001
Temporary Cash Investment (0.0%)
Money Market Fund (0.0%)1 Vanguard Market Liquidity Fund, 1.775% (Cost $—) 4 —
Total Investments (99.0%) (Cost $48,312) 48,001
Other Assets and Liabilities (1.0%)
Other Assets 728
Liabilities (243)
485
Net Assets (100%)
Applicable to 2,243,104 outstanding $.001 par value shares of
beneficial interest (unlimited authorization) 48,486
Net Asset Value Per Share $21.62
Market
Value•
Shares ($000)
Institutional Target Retirement 2065 Fund
Statement of Net AssetsAs of March 31, 2018
Financial Statements (unaudited)
The fund reports a complete list of its holdings in regulatory filings four times in each fiscal year, at
the quarter-ends. For the second and fourth fiscal quarters, the lists appear in the fund’s semiannual
and annual reports to shareholders. For the first and third fiscal quarters, the fund files the lists with
the Securities and Exchange Commission on Form N-Q. Shareholders can look up the fund’s Forms
N-Q on the SEC’s website at sec.gov. Forms N-Q may also be reviewed and copied at the SEC’s
Public Reference Room (see the back cover of this report for further information).
59
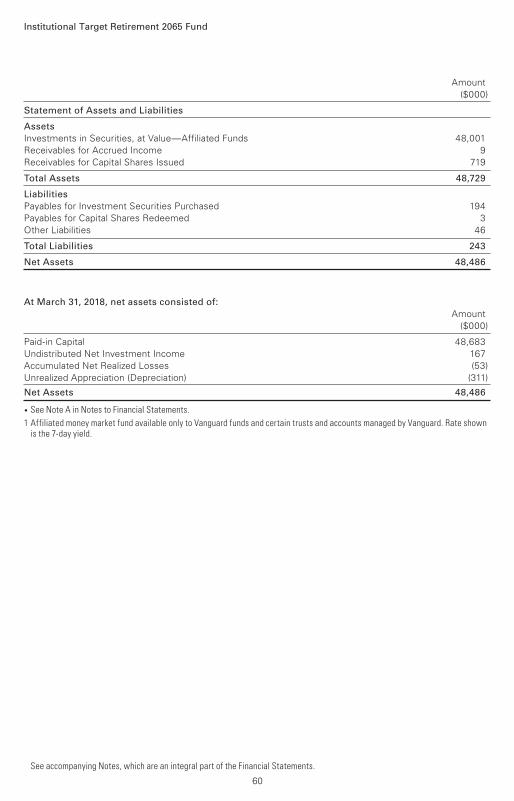
Institutional Target Retirement 2065 Fund
Statement of Assets and Liabilities
Assets
Investments in Securities, at Value—Affiliated Funds 48,001 Receivables for Accrued Income 9 Receivables for Capital Shares Issued 719
Total Assets 48,729
Liabilities
Payables for Investment Securities Purchased 194 Payables for Capital Shares Redeemed 3 Other Liabilities 46
Total Liabilities 243
Net Assets 48,486
At March 31, 2018, net assets consisted of:
Amount ($000)
Paid-in Capital 48,683Undistributed Net Investment Income 167Accumulated Net Realized Losses (53)Unrealized Appreciation (Depreciation) (311)
Net Assets 48,486
• See Note A in Notes to Financial Statements.
1 Affiliated money market fund available only to Vanguard funds and certain trusts and accounts managed by Vanguard. Rate shown is the 7-day yield.
Amount ($000)
See accompanying Notes, which are an integral part of the Financial Statements.
60
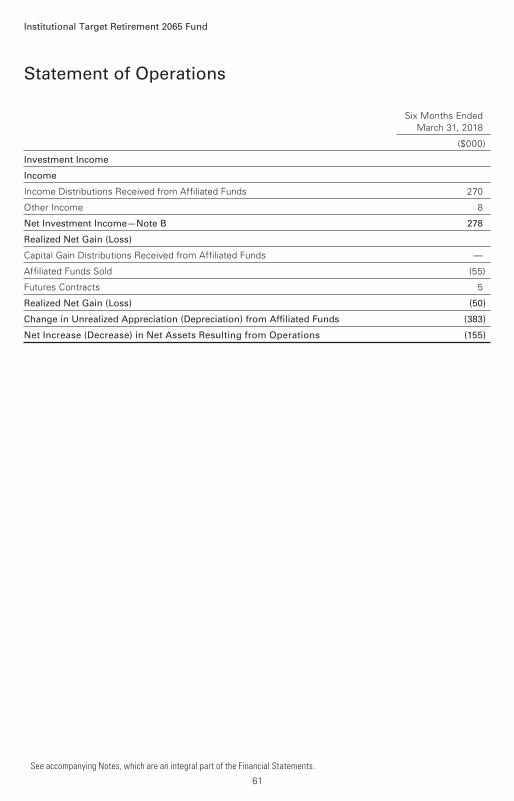
Six Months Ended March 31, 2018
($000)
Investment Income
Income
Income Distributions Received from Affiliated Funds 270
Other Income 8
Net Investment Income—Note B 278
Realized Net Gain (Loss)
Capital Gain Distributions Received from Affiliated Funds —
Affiliated Funds Sold (55)
Futures Contracts 5
Realized Net Gain (Loss) (50)
Change in Unrealized Appreciation (Depreciation) from Affiliated Funds (383)
Net Increase (Decrease) in Net Assets Resulting from Operations (155)
Statement of Operations
Institutional Target Retirement 2065 Fund
See accompanying Notes, which are an integral part of the Financial Statements.
61
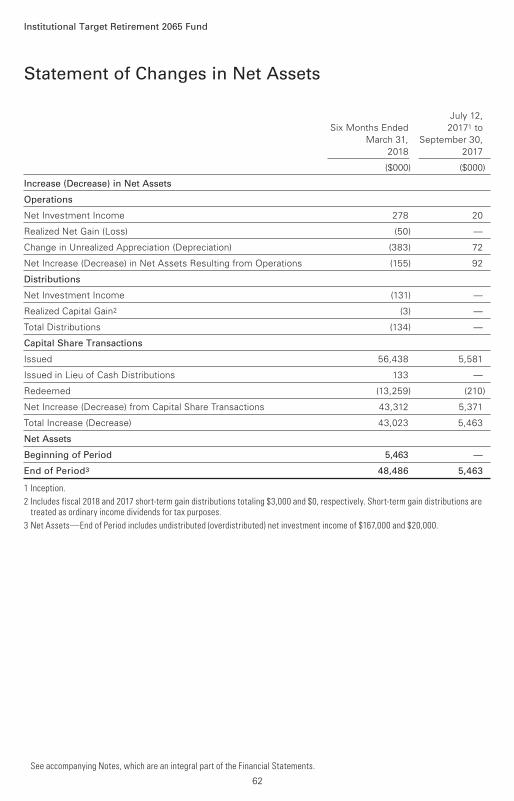
Statement of Changes in Net Assets
Institutional Target Retirement 2065 Fund
See accompanying Notes, which are an integral part of the Financial Statements.
July 12,
Six Months Ended 20171 to
March 31, September 30,
2018 2017
($000) ($000)
Increase (Decrease) in Net Assets
Operations
Net Investment Income 278 20
Realized Net Gain (Loss) (50) —
Change in Unrealized Appreciation (Depreciation) (383) 72
Net Increase (Decrease) in Net Assets Resulting from Operations (155) 92
Distributions
Net Investment Income (131) —
Realized Capital Gain2 (3) —
Total Distributions (134) —
Capital Share Transactions
Issued 56,438 5,581
Issued in Lieu of Cash Distributions 133 —
Redeemed (13,259) (210)
Net Increase (Decrease) from Capital Share Transactions 43,312 5,371
Total Increase (Decrease) 43,023 5,463
Net Assets
Beginning of Period 5,463 —
End of Period3 48,486 5,463
1 Inception.
2 Includes fiscal 2018 and 2017 short-term gain distributions totaling $3,000 and $0, respectively. Short-term gain distributions are treated as ordinary income dividends for tax purposes.
3 Net Assets—End of Period includes undistributed (overdistributed) net investment income of $167,000 and $20,000.
62
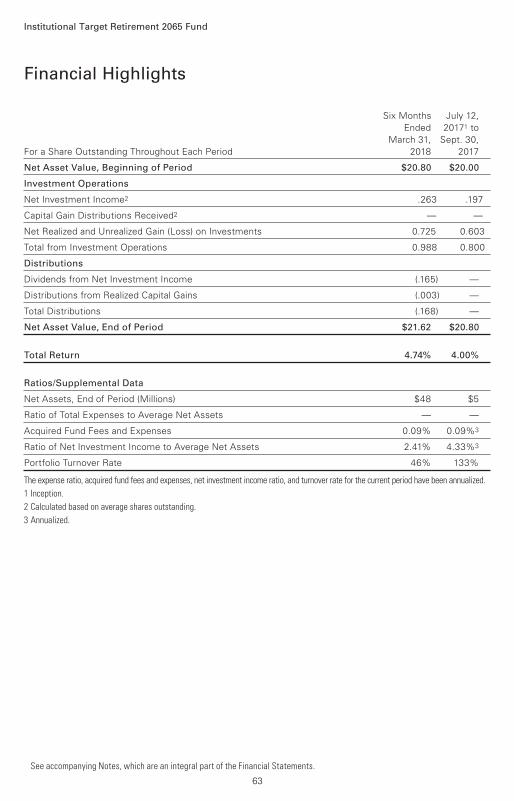
Six Months July 12,
Ended 20171 to
March 31, Sept. 30,
For a Share Outstanding Throughout Each Period 2018 2017
Net Asset Value, Beginning of Period $20.80 $20.00
Investment Operations
Net Investment Income2 .263 .197
Capital Gain Distributions Received2 — —
Net Realized and Unrealized Gain (Loss) on Investments 0.725 0.603
Total from Investment Operations 0.988 0.800
Distributions
Dividends from Net Investment Income (.165) —
Distributions from Realized Capital Gains (.003) —
Total Distributions (.168) —
Net Asset Value, End of Period $21.62 $20.80
Total Return 4.74% 4.00%
Ratios/Supplemental Data
Net Assets, End of Period (Millions) $48 $5
Ratio of Total Expenses to Average Net Assets — —
Acquired Fund Fees and Expenses 0.09% 0.09%3
Ratio of Net Investment Income to Average Net Assets 2.41% 4.33%3
Portfolio Turnover Rate 46% 133%
The expense ratio, acquired fund fees and expenses, net investment income ratio, and turnover rate for the current period have been annualized.
1 Inception.
2 Calculated based on average shares outstanding.
3 Annualized.
Financial Highlights
See accompanying Notes, which are an integral part of the Financial Statements.
Institutional Target Retirement 2065 Fund
63
Notes to Financial Statements
Institutional Target Retirement 2065 Fund
Vanguard Institutional Target Retirement 2065 Fund is registered under the Investment Company
Act of 1940 as an open-end investment company, or mutual fund. The fund follows a balanced
investment strategy by investing in selected Vanguard funds to achieve its targeted allocation
of assets to U.S. and international stocks, and U.S. and international bonds. Financial statements
and other information about each underlying fund are available on vanguard.com.
A. The following significant accounting policies conform to generally accepted accounting principles
for U.S. investment companies. The fund consistently follows such policies in preparing its financial
statements.
1. Security Valuation: Investments are valued at the net asset value of each underlying Vanguard
fund determined as of the close of the New York Stock Exchange (generally 4 p.m., Eastern time)
on the valuation date.
2. Futures Contracts: The fund uses stock and bond futures contracts to a limited extent, with the
objectives of maintaining full exposure to the market and maintaining its target asset allocation.
The primary risks associated with the use of futures contracts are imperfect correlation between
changes in market values of investments held by the fund and the prices of futures contracts,
and the possibility of an illiquid market. Counterparty risk involving futures is mitigated because
a regulated clearinghouse is the counterparty instead of the clearing broker. To further mitigate
counterparty risk, the fund trades futures contracts on an exchange, monitors the financial strength
of its clearing brokers and clearinghouse, and has entered into clearing agreements with its clearing
brokers. The clearinghouse imposes initial margin requirements to secure the fund’s performance
and requires daily settlement of variation margin representing changes in the market value of
each contract.
Futures contracts are valued at their quoted daily settlement prices. The notional amounts of
the contracts are not recorded in the Statement of Net Assets. Fluctuations in the value of the
contracts are recorded in the Statement of Assets and Liabilities as an asset (liability) and in the
Statement of Operations as unrealized appreciation (depreciation) until the contracts are closed,
when they are recorded as realized futures gains (losses).
During the six months ended March 31, 2018, the fund’s average investments in long and short
futures contracts each represented 0% of net assets, based on the average of the notional
amounts at each quarter-end during the period. The fund had no open futures contracts at
March 31, 2018.
3. Federal Income Taxes: The fund intends to continue to qualify as a regulated investment
company and distribute all of its taxable income. Management has analyzed the fund’s tax positions
taken for its open federal income tax year ended September 30, 2017, and for the period ended
March 31, 2018, and has concluded that no provision for federal income tax is required in the fund’s
financial statements.
4. Distributions: Distributions to shareholders are recorded on the ex-dividend date.
5. Other: Income and capital gain distributions received are recorded on the ex-dividend date.
Security transactions are accounted for on the date securities are bought or sold. Costs used to
determine realized gains (losses) on the sale of investment securities are those of the specific
securities sold.
64
Institutional Target Retirement 2065 Fund
B. In accordance with the terms of a Funds’ Service Agreement (the “FSA”) between Vanguard
and the fund, Vanguard furnishes to the fund investment advisory, corporate management,
administrative, marketing, and distribution services at Vanguard’s cost of operations (as defined by
the FSA). These costs of operations are allocated to the fund based on methods and guidelines
approved by the board of trustees. The FSA provides that expenses otherwise allocable to
Vanguard funds-of-funds may be reduced or eliminated to the extent of savings realized by the
underlying Vanguard funds by virtue of being part of a fund-of-funds. Accordingly, all expenses for
services provided by Vanguard to the fund and all other expenses incurred by the fund during the
period ended March 31, 2018, were borne by the underlying Vanguard funds in which the fund
invests. The fund’s trustees and officers are also trustees and officers, respectively, of the
underlying Vanguard funds, as well as directors and employees, respectively, of Vanguard.
C. Various inputs may be used to determine the value of the fund’s investments. These inputs are
summarized in three broad levels for financial statement purposes. The inputs or methodologies
used to value securities are not necessarily an indication of the risk associated with investing in
those securities.
Level 1—Quoted prices in active markets for identical securities.
Level 2—Other significant observable inputs (including quoted prices for similar securities, interest
rates, prepayment speeds, credit risk, etc.).
Level 3—Significant unobservable inputs (including the fund’s own assumptions used to determine
the fair value of investments). Any investments valued with significant unobservable inputs are
noted on the Statement of Net Assets.
At March 31, 2018, 100% of the market value of the fund’s investments was determined based on
Level 1 inputs.
D. Distributions are determined on a tax basis and may differ from net investment income and
realized capital gains for financial reporting purposes. Differences may be permanent or temporary.
Permanent differences are reclassified among capital accounts in the financial statements to reflect
their tax character. Temporary differences arise when certain items of income, expense, gain, or
loss are recognized in different periods for financial statement and tax purposes. These differences
will reverse at some time in the future. Differences in classification may also result from the
treatment of short-term gains as ordinary income for tax purposes. The fund’s tax-basis capital
gains and losses are determined only at the end of each fiscal year.
At March 31, 2018, the cost of investment securities for tax purposes was $48,312,000. Net
unrealized depreciation of investment securities for tax purposes was $311,000, consisting of
unrealized gains of $10,000 on securities that had risen in value since their purchase and $321,000
in unrealized losses on securities that had fallen in value since their purchase.
65
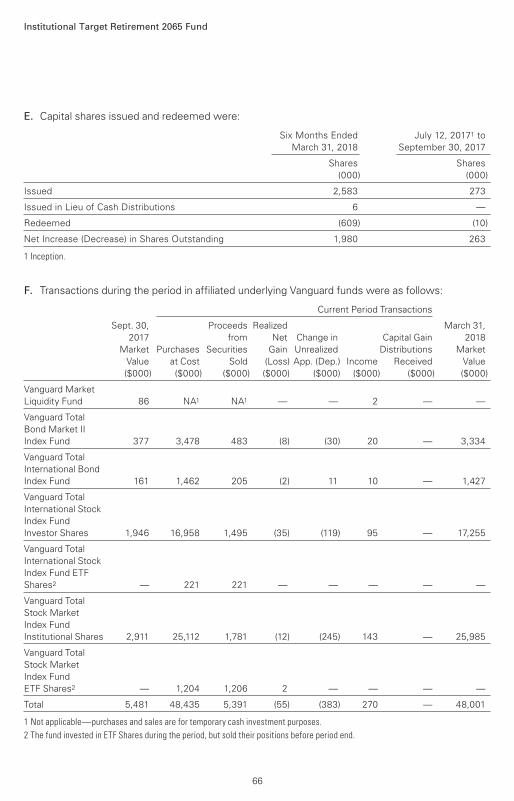
Institutional Target Retirement 2065 Fund
E. Capital shares issued and redeemed were:
Six Months Ended July 12, 20171 to
March 31, 2018 September 30, 2017
Shares Shares
(000) (000)
Issued 2,583 273
Issued in Lieu of Cash Distributions 6 —
Redeemed (609) (10)
Net Increase (Decrease) in Shares Outstanding 1,980 263
1 Inception.
F. Transactions during the period in affiliated underlying Vanguard funds were as follows:
Current Period Transactions
Sept. 30, Proceeds Realized March 31,
2017 from Net Change in Capital Gain 2018
Market Purchases Securities Gain Unrealized Distributions Market
Value at Cost Sold (Loss) App. (Dep.) Income Received Value
($000) ($000) ($000) ($000) ($000) ($000) ($000) ($000)
Vanguard Market
Liquidity Fund 86 NA1 NA1 — — 2 — —
Vanguard Total
Bond Market II
Index Fund 377 3,478 483 (8) (30) 20 — 3,334
Vanguard Total
International Bond
Index Fund 161 1,462 205 (2) 11 10 — 1,427
Vanguard Total
International Stock
Index Fund
Investor Shares 1,946 16,958 1,495 (35) (119) 95 — 17,255
Vanguard Total
International Stock
Index Fund ETF
Shares2 — 221 221 — — — — —
Vanguard Total
Stock Market
Index Fund
Institutional Shares 2,911 25,112 1,781 (12) (245) 143 — 25,985
Vanguard Total
Stock Market
Index Fund
ETF Shares2 — 1,204 1,206 2 — — — —
Total 5,481 48,435 5,391 (55) (383) 270 — 48,001
1 Not applicable—purchases and sales are for temporary cash investment purposes.
2 The fund invested in ETF Shares during the period, but sold their positions before period end.
66

Institutional Target Retirement 2065 Fund
G. Management has determined that no material events or transactions occurred subsequent to March 31, 2018, that would require recognition or disclosure in these financial statements.
67
About Your Fund’s Expenses
68
As a shareholder of the fund, you incur ongoing costs, which include costs for portfolio management, administrative services, and shareholder reports (like this one), among others. Operating expenses, which are deducted from a fund’s gross income, directly reduce the investment return of the fund.
A typical fund’s expenses are expressed as a percentage of its average net assets. The Institutional Target Retirement Funds have no direct expenses, but each fund bears its proportionate share of the costs for the underlying funds in which it invests. These indirect expenses make up the acquired fund fees and expenses, also expressed as a percentage of average net assets.
The following examples are intended to help you understand the ongoing cost (in dollars) of investing in your fund and to compare these costs with those of other mutual funds. The examples are based on an investment of $1,000 made at the beginning of the period shown and held for the entire period. The costs were calculated using the acquired fund fees and expenses for each Institutional Target Retirement Fund.
The accompanying table illustrates your fund’s costs in two ways:
• Based on actual fund return. This section helps you to estimate the actual expenses that you paid over the period. The ”Ending Account Value“ shown is derived from the fund‘s actual return, and the third column shows the dollar amount that would have been paid by an investor who started with $1,000 in the fund. You may use the information here, together with the amount you invested, to estimate the expenses that you paid over the period.
To do so, simply divide your account value by $1,000 (for example, an $8,600 account value divided by $1,000 = 8.6), then multiply the result by the number given for your fund under the heading ”Expenses Paid During Period.“
• Based on hypothetical 5% yearly return. This section is intended to help you compare your fund‘s costs with those of other mutual funds. It assumes that the fund had a yearly return of 5% before expenses, but that the expense ratio is unchanged. In this case—because the return used is not the fund’s actual return—the results do not apply to your investment. The example is useful in making comparisons because the Securities and Exchange Commission requires all mutual funds to calculate expenses based on a 5% return. You can assess your fund’s costs by comparing this hypothetical example with the hypothetical examples that appear in shareholder reports of other funds.
Note that the expenses shown in the table are meant to highlight and help you compare ongoing costs only and do not reflect transaction costs incurred by the fund for buying and selling securities. Further, the expenses do not include any purchase, redemption, or account service fees described in the fund prospectus. If such fees were applied to your account, your costs would be higher. Your fund does not carry a “sales load.”
The calculations assume no shares were bought or sold during the period. Your actual costs may have been higher or lower, depending on the amount of your investment and the timing of any purchases or redemptions.
You can find more information about the fund’s expenses, including annual expense ratios, in the Financial Statements section of this report. For additional information on operating expenses and other shareholder costs, please refer to your fund’s current prospectus.
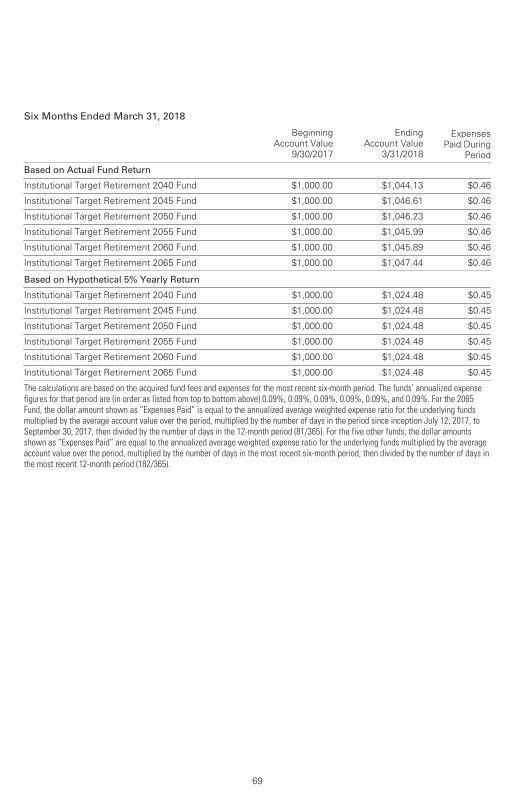
69
Six Months Ended March 31, 2018
BeginningAccount Value
9/30/2017
EndingAccount Value
3/31/2018
ExpensesPaid During
Period
Based on Actual Fund Return
Institutional Target Retirement 2040 Fund $1,000.00 $1,044.13 $0.46
Institutional Target Retirement 2045 Fund $1,000.00 $1,046.61 $0.46
Institutional Target Retirement 2050 Fund $1,000.00 $1,046.23 $0.46
Institutional Target Retirement 2055 Fund $1,000.00 $1,045.99 $0.46
Institutional Target Retirement 2060 Fund $1,000.00 $1,045.89 $0.46
Institutional Target Retirement 2065 Fund $1,000.00 $1,047.44 $0.46
Based on Hypothetical 5% Yearly Return
Institutional Target Retirement 2040 Fund $1,000.00 $1,024.48 $0.45
Institutional Target Retirement 2045 Fund $1,000.00 $1,024.48 $0.45
Institutional Target Retirement 2050 Fund $1,000.00 $1,024.48 $0.45
Institutional Target Retirement 2055 Fund $1,000.00 $1,024.48 $0.45
Institutional Target Retirement 2060 Fund $1,000.00 $1,024.48 $0.45
Institutional Target Retirement 2065 Fund $1,000.00 $1,024.48 $0.45
The calculations are based on the acquired fund fees and expenses for the most recent six-month period. The funds’ annualized expensefigures for that period are (in order as listed from top to bottom above) 0.09%, 0.09%, 0.09%, 0.09%, 0.09%, and 0.09%. For the 2065Fund, the dollar amount shown as ”Expenses Paid” is equal to the annualized average weighted expense ratio for the underlying fundsmultiplied by the average account value over the period, multiplied by the number of days in the period since inception July 12, 2017, toSeptember 30, 2017, then divided by the number of days in the 12-month period (81/365). For the five other funds, the dollar amountsshown as ”Expenses Paid” are equal to the annualized average weighted expense ratio for the underlying funds multiplied by the averageaccount value over the period, multiplied by the number of days in the most recent six-month period, then divided by the number of days inthe most recent 12-month period (182/365).
The board of trustees of Vanguard Institutional Target Retirement Funds has renewed each fund’s
investment advisory arrangement with The Vanguard Group, Inc. (Vanguard), through its Equity
Index Group. The board determined that continuing each fund’s internalized management structure
was in the best interests of the funds and their shareholders.
The board based its decision upon an evaluation of the advisor’s investment staff, portfolio
management process, and performance. This evaluation included information provided to the
board by Vanguard’s Portfolio Review Department, which is responsible for fund and advisor
oversight and product management. The Portfolio Review Department met regularly with the
advisor and made monthly presentations to the board during the fiscal year that directed the
board’s focus to relevant information and topics.
The board, or an investment committee made up of board members, also received information
throughout the year during advisor presentations. For each advisor presentation, the board was
provided with letters and reports that included information about, among other things, the advisory
firm and the advisor’s assessment of the investment environment, portfolio performance, and
portfolio characteristics.
In addition, the board received monthly reports, which included a Market and Economic Report,
a Fund Dashboard Monthly Summary, and a Fund Performance Report.
Prior to their meeting, the trustees were provided with a memo and materials that summarized the
information they received over the course of the year. They also considered the factors discussed
below, among others. However, no single factor determined whether the board approved the
arrangements. Rather, it was the totality of the circumstances that drove the board’s decision.
Nature, extent, and quality of services
The board reviewed the quality of the investment management services provided to the funds and
took into account the organizational depth and stability of the advisor. The board considered that
Vanguard has been managing investments for more than three decades. The Equity Index Group
adheres to a sound, disciplined investment management process; the team has considerable
experience, stability, and depth.
The board concluded that Vanguard’s experience, stability, depth, and performance, among other
factors, warranted continuation of the advisory arrangements.
Investment performance
The board considered the performance of each fund since its inception in 2015, including any
periods of outperformance or underperformance compared with a relevant benchmark index and
peer group. The board concluded that the performance was such that the advisory arrangements
should continue. Information about each fund’s most recent performance can be found in the
Performance Summary sections of this report.
Cost
The board concluded that the funds’ acquired fund fees and expenses were well below the
expense ratios charged by funds in their respective peer groups. The funds do not incur advisory
expenses directly; however, the board noted that each of the underlying funds in which the funds
invest has advisory expenses well below the relevant peer-group average. Information about the
funds’ acquired fund fees and expenses appears in the About Your Fund’s Expenses section of
this report as well as in the Financial Statements sections.
Trustees Approve Advisory Arrangements
70

The board did not conduct a profitability analysis of Vanguard because of Vanguard’s unique
“at-cost” structure. Unlike most other mutual fund management companies, Vanguard is owned
by the funds it oversees and produces “profits” only in the form of reduced expenses for fund
shareholders.
The benefit of economies of scale
The board concluded that Vanguard’s at-cost arrangements with the Institutional Target Retirement
Funds and their underlying funds ensure that the funds will realize economies of scale as the assets
of the underlying funds grow, with the cost to shareholders declining as assets increase.
The board will consider whether to renew the advisory arrangements again after a one-year period.
71
Glossary
72
30-Day SEC Yield. A fund’s 30-day SEC yield is derived using a formula specified by the U.S.Securities and Exchange Commission. Under the formula, data related to the fund’s securityholdings in the previous 30 days are used to calculate the fund’s hypothetical net income for thatperiod, which is then annualized and divided by the fund’s estimated average net assets over thecalculation period. For the purposes of this calculation, a security’s income is based on its currentmarket yield to maturity (for bonds), its actual income (for asset-backed securities), or itsprojected dividend yield (for stocks). Because the SEC yield represents hypothetical annualizedincome, it will differ—at times significantly—from the fund’s actual experience. As a result, thefund’s income distributions may be higher or lower than implied by the SEC yield.
Acquired Fund Fees and Expenses. Funds that invest in other Vanguard funds incur no directexpenses, but they do bear proportionate shares of the operating, administrative, and advisoryexpenses of the underlying funds, and they must pay any fees charged by those funds. The figurefor acquired fund fees and expenses represents a weighted average of these underlying costs. Acquired is a term that the Securities and Exchange Commission applies to any mutual fund whoseshares are owned by another fund.
Expense Ratio. A fund’s total annual operating expenses expressed as a percentage of the fund’saverage net assets. The expense ratio includes management and administrative expenses, butdoes not include the transaction costs of buying and selling portfolio securities.
Inception Date. The date on which the assets of a fund (or one of its share classes) are firstinvested in accordance with the fund’s investment objective. For funds with a subscription period,the inception date is the day after that period ends. Investment performance is measured fromthe inception date.
Benchmark Information
Target 2040 Composite Index: Derived by applying the fund’s target asset allocation to the results of the following benchmarks: for international stocks of developed markets, the MSCI EAFE Index through December 15, 2010, the MSCI ACWI ex USA IMI Index through June 2, 2013, and the FTSE Global All Cap ex US Index thereafter; for emerging-market stocks, the Select Emerging Markets Index through August 23, 2006, the MSCI Emerging Markets Index through December 15, 2010, the MSCI ACWI ex USA IMI Index through June 2, 2013, and the FTSE Global All Cap ex US Index thereafter; for U.S. bonds, the Bloomberg Barclays U.S. Aggregate Bond Index through December 31, 2009, and the Bloomberg Barclays U.S. Aggregate Float Adjusted Index thereafter; for international bonds, the Bloomberg Barclays Global Aggregate ex-USD Float Adjusted RIC Capped Index beginning June 3, 2013; and for U.S. stocks, the MSCI US Broad Market Index through June 2, 2013, and the CRSP US Total Market Index thereafter. International stock benchmark returns are adjusted for withholding taxes.
73
Target 2045 Composite Index: Derived by applying the fund’s target asset allocation to the results of the following benchmarks: for international stocks of developed markets, the MSCI EAFE Index through December 15, 2010, the MSCI ACWI ex USA IMI Index through June 2, 2013, and the FTSE Global All Cap ex US Index thereafter; for emerging-market stocks, the Select Emerging Markets Index through August 23, 2006, the MSCI Emerging Markets Index through December 15, 2010, the MSCI ACWI ex USA IMI Index through June 2, 2013, and the FTSE Global All Cap ex US Index thereafter; for U.S. bonds, the Bloomberg Barclays U.S. Aggregate Bond Index through December 31, 2009, and the Bloomberg Barclays U.S. Aggregate Float Adjusted Index thereafter; for international bonds, the Bloomberg Barclays Global Aggregate ex-USD Float Adjusted RIC Capped Index beginning June 3, 2013; and for U.S. stocks, the Dow Jones U.S. Total Stock Market Index (formerly known as the Dow Jones Wilshire 5000 Index) through April 22, 2005, the MSCI US Broad Market Index through June 2, 2013, and the CRSP US Total Market Index thereafter. International stock benchmark returns are adjusted for withholding taxes.
Target 2050 Composite Index: Derived by applying the fund’s target asset allocation to the results of the following benchmarks: for international stocks of developed markets, the MSCI EAFE Index through December 15, 2010, the MSCI ACWI ex USA IMI Index through June 2, 2013, and the FTSE Global All Cap ex US Index thereafter; for emerging-market stocks, the Select Emerging Markets Index through August 23, 2006, the MSCI Emerging Markets Index through December 15, 2010, the MSCI ACWI ex USA IMI Index through June 2, 2013, and the FTSE Global All Cap ex US Index thereafter; for U.S. bonds, the Bloomberg Barclays U.S. Aggregate Bond Index through December 31, 2009, and the Bloomberg Barclays U.S. Aggregate Float Adjusted Index thereafter; for international bonds, the Bloomberg Barclays Global Aggregate ex-USD Float Adjusted RIC Capped Index beginning June 3, 2013; and for U.S. stocks, the MSCI US Broad Market Index through June 2, 2013, and the CRSP US Total Market Index thereafter. International stock benchmark returns are adjusted for withholding taxes.
Target 2055 Composite Index: Derived by applying the fund’s target asset allocation to the results of the following benchmarks: for international stocks of developed markets, the MSCI EAFE Index through December 15, 2010, the MSCI ACWI ex USA IMI Index through June 2, 2013, and the FTSE Global All Cap ex US Index thereafter; for emerging-market stocks, the MSCI Emerging Markets Index through December 15, 2010, the MSCI ACWI ex USA IMI Index through June 2, 2013, and the FTSE Global All Cap ex US Index thereafter; for U.S. bonds, the Bloomberg Barclays U.S. Aggregate Float Adjusted Index; for international bonds, the Bloomberg Barclays Global Aggregate ex-USD Float Adjusted RIC Capped Index beginning June 3, 2013; and for U.S. stocks, the MSCI US Broad Market Index through June 2, 2013, and the CRSP US Total Market Index thereafter. International stock benchmark returns are adjusted for withholding taxes.
74
Target 2060 Composite Index: Derived by applying the fund’s target asset allocation to the results of the following benchmarks: for international stocks of developed markets, the MSCI ACWI ex USA IMI Index through June 2, 2013, and the FTSE Global All Cap ex US Index thereafter; for emerging-market stocks, the MSCI ACWI ex USA IMI Index through June 2, 2013, and the FTSE Global All Cap ex US Index thereafter; for U.S. bonds, the Bloomberg Barclays U.S. Aggregate Float Adjusted Index; for international bonds, the Bloomberg Barclays Global Aggregate ex-USD Float Adjusted RIC Capped Index beginning June 3, 2013; and for U.S. stocks, the MSCI US Broad Market Index through June 2, 2013, and the CRSP US Total Market Index thereafter. International stock benchmark returns are adjusted for withholding taxes.
Target 2065 Composite Index: Derived by applying the fund’s target asset allocation to the results of the following benchmarks: the FTSE Global All Cap ex US Index for international stocks, the Bloomberg Barclays U.S. Aggregate Float Adjusted Index for U.S. bonds, the Bloomberg Barclays Global Aggregate ex-USD Float Adjusted RIC Capped Index for international bonds, and the CRSP US Total Market Index for U.S. stocks. International stock benchmark returns are adjusted for withholding taxes.
BLOOMBERG is a trademark and service mark of Bloomberg Finance L.P. BARCLAYS is a trademark and service mark
of Barclays Bank Plc, used under license. Bloomberg Finance L.P. and its affiliates, including Bloomberg Index Services
Limited (BISL) (collectively, Bloomberg), or Bloomberg’s licensors, own all proprietary rights in the Bloomberg Barclays
U.S. Aggregate Bond Index, Bloomberg Barclays U.S. Aggregate Float Adjusted Index, and the Bloomberg Barclays Global
Aggregate ex-USD Float Adjusted RIC Capped Index (USD Hedged) (the Indices or Bloomberg Barclays Indices).
Neither Barclays Bank Plc, Barclays Capital Inc., or any affiliate (collectively Barclays) or Bloomberg is the issuer or
producer of the Institutional Target Retirement Funds (including the Total Bond Market II Index Fund and the Total
International Bond Index Fund) and neither Bloomberg nor Barclays has any responsibilities, obligations or duties to
investors in the Institutional Target Retirement Funds. The Indices are licensed for use by The Vanguard Group, Inc.
(Vanguard) as the sponsor of the Institutional Target Retirement Funds. Bloomberg and Barclays’ only relationship with
Vanguard in respect to the Indices is the licensing of the Indices, which is determined, composed and calculated by BISL,
or any successor thereto, without regard to the Issuer or the Institutional Target Retirement Funds or the owners of the
Institutional Target Retirement Funds.
Additionally, Vanguard may for itself execute transaction(s) with Barclays in or relating to the Indices in connection with
the Institutional Target Retirement Funds. Investors acquire the Institutional Target Retirement Funds from Vanguard and
investors neither acquire any interest in the Indices nor enter into any relationship of any kind whatsoever with Bloomberg
or Barclays upon making an investment in the Institutional Target Retirement Funds. The Institutional Target Retirement
Funds are not sponsored, endorsed, sold or promoted by Bloomberg or Barclays. Neither Bloomberg nor Barclays makes
any representation or warranty, express or implied regarding the advisability of investing in the Institutional Target
Retirement Funds or the advisability of investing in securities generally or the ability of the Indices to track corresponding
or relative market performance. Neither Bloomberg nor Barclays has passed on the legality or suitability of the Institutional
Target Retirement Funds with respect to any person or entity. Neither Bloomberg nor Barclays is responsible for and has
not participated in the determination of the timing of, prices at, or quantities of the Institutional Target Retirement Funds
to be issued. Neither Bloomberg nor Barclays has any obligation to take the needs of the Issuer or the owners of the
Institutional Target Retirement Funds or any other third party into consideration in determining, composing or calculating
the Indices. Neither Bloomberg nor Barclays has any obligation or liability in connection with administration, marketing or
trading of the Institutional Target Retirement Funds.
75
The licensing agreement between Bloomberg and Barclays is solely for the benefit of Bloomberg and Barclays and not
for the benefit of the owners of the Institutional Target Retirement Funds, investors or other third parties. In addition,
the licensing agreement between Vanguard and Bloomberg is solely for the benefit of Vanguard and Bloomberg and not
for the benefit of the owners of the Institutional Target Retirement Funds, investors or other third parties.
NEITHER BLOOMBERG NOR BARCLAYS SHALL HAVE ANY LIABILITY TO THE ISSUER, INVESTORS OR TO OTHER
THIRD PARTIES FOR THE QUALITY, ACCURACY AND/OR COMPLETENESS OF THE BLOOMBERG BARCLAYS INDICES
OR ANY DATA INCLUDED THEREIN OR FOR INTERRUPTIONS IN THE DELIVERY OF THE BLOOMBERG BARCLAYS INDICES.
NEITHER BLOOMBERG NOR BARCLAYS MAKES ANY WARRANTY, EXPRESS OR IMPLIED, AS TO RESULTS TO BE
OBTAINED BY THE ISSUER, THE INVESTORS OR ANY OTHER PERSON OR ENTITY FROM THE USE OF THE BLOOMBERG
BARCLAYS INDICES OR ANY DATA INCLUDED THEREIN. NEITHER BLOOMBERG NOR BARCLAYS MAKES ANY EXPRESS
OR IMPLIED WARRANTIES, AND EACH HEREBY EXPRESSLY DISCLAIMS ALL WARRANTIES OF MERCHANTABILITY
OR FITNESS FOR A PARTICULAR PURPOSE OR USE WITH RESPECT TO BLOOMBERG BARCLAYS INDICES OR ANY
DATA INCLUDED THEREIN. BLOOMBERG RESERVES THE RIGHT TO CHANGE THE METHODS OF CALCULATION OR
PUBLICATION, OR TO CEASE THE CALCULATION OR PUBLICATION OF THE BLOOMBERG BARCLAYS INDICES, AND
NEITHER BLOOMBERG NOR BARCLAYS SHALL BE LIABLE FOR ANY MISCALCULATION OF OR ANY INCORRECT,
DELAYED OR INTERRUPTED PUBLICATION WITH RESPECT TO ANY OF THE BLOOMBERG BARCLAYS INDICES.
NEITHER BLOOMBERG NOR BARCLAYS SHALL BE LIABLE FOR ANY DAMAGES, INCLUDING, WITHOUT LIMITATION,
ANY SPECIAL, INDIRECT OR CONSEQUENTIAL DAMAGES, OR ANY LOST PROFITS AND EVEN IF ADVISED OF THE
POSSIBiLITY OF SUCH, RESULTING FROM THE USE OF BLOOMBERG BARCLAYS INDICES OR ANY DATA INCLUDED
THEREIN OR WITH RESPECT TO THE INSTITUTIONAL TARGET RETIREMENT FUNDS.
None of the information supplied by Bloomberg or Barclays and used in this publication may be reproduced in any manner
without the prior written permission of both Bloomberg and Barclays Capital, the investment banking division of Barclays
Bank Plc. Barclays Bank Plc is registered in England No. 1026167. Registered office 1 Churchill Place London E14 5HP.
© 2018 Bloomberg. Used with Permission.
Source: Bloomberg Index Services Limited. Copyright 2018, Bloomberg. All rights reserved.
76
The People Who Govern Your Fund
The trustees of your mutual fund are there to see that the fund is operated and managed in your
best interests since, as a shareholder, you are a part owner of the fund. Your fund’s trustees also
serve on the board of directors of The Vanguard Group, Inc., which is owned by the Vanguard
funds and provides services to them on an at-cost basis.
A majority of Vanguard’s board members are independent, meaning that they have no affiliation
with Vanguard or the funds they oversee, apart from the sizable personal investments they have
made as private individuals. The independent board members have distinguished backgrounds
in business, academia, and public service. Each of the trustees and executive officers oversees
208 Vanguard funds.
Information for each trustee and executive officer of the fund appears below. The mailing address
of the trustees and officers is P.O. Box 876, Valley Forge, PA 19482. More information about the
trustees is in the Statement of Additional Information, which can be obtained, without charge,
by contacting Vanguard at 800-662-7447, or online at vanguard.com.
Interested Trustees1
F. William McNabb III
Born in 1957. Trustee since July 2009. Principal
occupation(s) during the past five years and
other experience: chairman of the board
(January 2010–present) of Vanguard and of each
of the investment companies served by Vanguard,
trustee (2009–present) of each of the investment
companies served by Vanguard, and director
(2008–present) of Vanguard. Chief executive officer
and president (2008–2017) of Vanguard and each
of the investment companies served by Vanguard,
managing director (1995–2008) of Vanguard,
and director (1997–2018) of Vanguard Marketing
Corporation. Director (2018–present) of
UnitedHealth Group.
Mortimer J. Buckley
Born in 1969. Trustee since January 2018. Principal
occupation(s) during the past five years and
other experience: chief executive officer
(January 2018–present) of Vanguard; chief executive
officer, president, and trustee (January 2018–present)
of each of the investment companies served by
Vanguard; president and director (2017–present) of
Vanguard; and president (February 2018–present) of
Vanguard Marketing Corporation. Chief investment
officer (2013–2017), managing director (2002–2017),
head of the Retail Investor Group (2006–2012), and
chief information officer (2001–2006) of Vanguard.
Chairman of the board (2011–2017) of the Children’s
Hospital of Philadelphia.
Independent Trustees
Emerson U. Fullwood
Born in 1948. Trustee since January 2008. Principal
occupation(s) during the past five years and other
experience: executive chief staff and marketing officer
for North America and corporate vice president (retired
2008) of Xerox Corporation (document management
products and services). Former president of the
Worldwide Channels Group, Latin America, and
Worldwide Customer Service and executive chief
staff officer of Developing Markets of Xerox. Executive
in residence and 2009–2010 Distinguished Minett
Professor at the Rochester Institute of Technology.
Lead director of SPX FLOW, Inc. (multi-industry
manufacturing). Director of the University of Rochester
Medical Center, the Monroe Community College
Foundation, the United Way of Rochester, North
Carolina A&T University, and Roberts Wesleyan
College. Trustee of the University of Rochester.
Amy Gutmann
Born in 1949. Trustee since June 2006. Principal
occupation(s) during the past five years and other
experience: president (2004–present) of the University
of Pennsylvania. Christopher H. Browne Distinguished
Professor of Political Science, School of Arts and
Sciences, and professor of communication, Annenberg
School for Communication, with secondary faculty
appointments in the Department of Philosophy, School
of Arts and Sciences, and at the Graduate School of
Education, University of Pennsylvania. Trustee of the
National Constitution Center.
1 Mr. McNabb and Mr. Buckley are considered “interested persons,” as defined in the Investment Company Act of 1940, because they are officers of the Vanguard funds.
JoAnn Heffernan Heisen
Born in 1950. Trustee since July 1998. Principal
occupation(s) during the past five years and other
experience: corporate vice president of Johnson &
Johnson (pharmaceuticals/medical devices/consumer
products) and member of its executive committee
(1997–2008). Chief global diversity officer (retired
2008), vice president and chief information officer
(1997–2006), controller (1995–1997), treasurer
(1991–1995), and assistant treasurer (1989–1991)
of Johnson & Johnson. Director of Skytop Lodge
Corporation (hotels) and the Robert Wood Johnson
Foundation. Member of the advisory board of the
Institute for Women’s Leadership at Rutgers University.
F. Joseph Loughrey
Born in 1949. Trustee since October 2009. Principal
occupation(s) during the past five years and other
experience: president and chief operating officer
(retired 2009) and vice chairman of the board
(2008–2009) of Cummins Inc. (industrial machinery).
Chairman of the board of Hillenbrand, Inc. (specialized
consumer services), Oxfam America, and the Lumina
Foundation for Education. Director of the V Foundation
for Cancer Research. Member of the advisory council
for the College of Arts and Letters and chair of the
advisory board to the Kellogg Institute for International
Studies, both at the University of Notre Dame.
Mark Loughridge
Born in 1953. Trustee since March 2012. Principal
occupation(s) during the past five years and other
experience: senior vice president and chief financial
officer (retired 2013) of IBM (information technology
services). Fiduciary member of IBM’s Retirement
Plan Committee (2004–2013), senior vice president
and general manager (2002–2004) of IBM Global
Financing, vice president and controller (1998–2002)
of IBM, and a variety of other prior management roles
at IBM. Member of the Council on Chicago Booth.
Scott C. Malpass
Born in 1962. Trustee since March 2012. Principal
occupation(s) during the past five years and other
experience: chief investment officer (1989–present)
and vice president (1996–present) of the University
of Notre Dame. Assistant professor of finance at the
Mendoza College of Business, University of Notre
Dame, and member of the Notre Dame 403(b)
Investment Committee. Chairman of the board of
TIFF Advisory Services, Inc. Member of the board
of Catholic Investment Services, Inc. (investment
advisors), the board of advisors for Spruceview
Capital Partners, and the board of superintendence
of the Institute for the Works of Religion.
Deanna Mulligan
Born in 1963. Trustee since January 2018. Principal
occupation(s) during the past five years and other
experience: president (2010–present) and chief
executive officer (2011–present) of The Guardian
Life Insurance Company of America. Chief operating
officer (2010–2011) and executive vice president
(2008–2010) of Individual Life and Disability of
The Guardian Life Insurance Company of America.
Member of the board of The Guardian Life Insurance
Company of America, the American Council of Life
Insurers, the Partnership for New York City (business
leadership), and the Committee Encouraging Corporate
Philanthropy. Trustee of the Economic Club of New
York and the Bruce Museum (arts and science).
Member of the Advisory Council for the Stanford
Graduate School of Business.
André F. Perold
Born in 1952. Trustee since December 2004. Principal
occupation(s) during the past five years and other
experience: George Gund Professor of Finance and
Banking, Emeritus at the Harvard Business School
(retired 2011). Chief investment officer and co-
managing partner of HighVista Strategies LLC
(private investment firm). Overseer of the Museum
of Fine Arts Boston.
Sarah Bloom Raskin
Born in 1961. Trustee since January 2018. Principal
occupation(s) during the past five years and other
experience: deputy secretary (2014–2017) of
the United States Department of the Treasury.
Governor (2010–2014) of the Federal Reserve Board.
Commissioner (2007–2010) of financial regulation
for the State of Maryland. Member of the board of
directors (2012–2014) of Neighborhood Reinvestment
Corporation. Director of i(x) Investments, LLC.
Peter F. Volanakis
Born in 1955. Trustee since July 2009. Principal
occupation(s) during the past five years and other
experience: president and chief operating officer
(retired 2010) of Corning Incorporated (communications
equipment) and director of Corning Incorporated
(2000–2010) and Dow Corning (2001–2010).
Director (2012) of SPX Corporation (multi-industry
manufacturing). Overseer of the Amos Tuck School
of Business Administration, Dartmouth College
(2001–2013). Chairman of the board of trustees of
Colby-Sawyer College. Member of the Board of
Hypertherm Inc. (industrial cutting systems, software,
and consumables).
Executive Officers
Glenn Booraem
Born in 1967. Principal occupation(s) during the past
five years and other experience: principal of Vanguard.
Investment stewardship officer (2017–present),
treasurer (2015–2017), controller (2010–2015),
and assistant controller (2001–2010) of each of
the investment companies served by Vanguard.
Christine M. Buchanan
Born in 1970. Principal occupation(s) during the past
five years and other experience: principal of Vanguard
and global head of Fund Administration at Vanguard.
Treasurer (2017–present) of each of the investment
companies served by Vanguard. Partner (2005–2017)
at KPMG LLP (audit, tax, and advisory services).
Brian Dvorak
Born in 1973. Principal occupation(s) during the past
five years and other experience: principal of Vanguard.
Chief compliance officer (2017–present) of Vanguard
and each of the investment companies served by
Vanguard. Assistant vice president (2017–present) of
Vanguard Marketing Corporation. Vice president and
director of Enterprise Risk Management (2011–2013)
at Oppenheimer Funds, Inc.
Thomas J. Higgins
Born in 1957. Principal occupation(s) during the past
five years and other experience: principal of Vanguard.
Chief financial officer (2008–present) and treasurer
(1998–2008) of each of the investment companies
served by Vanguard.
Peter Mahoney
Born in 1974. Principal occupation(s) during the past
five years and other experience: principal of Vanguard.
Controller (2015–present) of each of the investment
companies served by Vanguard. Head of International
Fund Services (2008–2014) at Vanguard.
Anne E. Robinson
Born in 1970. Principal occupation(s) during the
past five years and other experience: general
counsel (2016–present) of Vanguard. Secretary
(2016–present) of Vanguard and of each of the
investment companies served by Vanguard.
Managing director (2016–present) of Vanguard.
Director and senior vice president (2016–2018)
of Vanguard Marketing Corporation. Managing
director and general counsel of Global Cards and
Consumer Services (2014–2016) at Citigroup.
Counsel (2003–2014) at American Express.
Michael Rollings
Born in 1963. Principal occupation(s) during the
past five years and other experience: finance
director (2017–present) and treasurer (2017) of each
of the investment companies served by Vanguard.
Managing director (2016–present) of Vanguard. Chief
financial officer (2016–present) of Vanguard. Director
(2016–present) of Vanguard Marketing Corporation.
Executive vice president and chief financial officer
(2006–2016) of MassMutual Financial Group.
Vanguard Senior Management Team
Mortimer J. Buckley James M. Norris
Gregory Davis Thomas M. Rampulla
John James Karin A. Risi
Martha G. King Anne E. Robinson
John T. Marcante Michael Rollings
Chris D. McIsaac
Chairman Emeritus and Senior Advisor
John J. Brennan
Chairman, 1996–2009
Chief Executive Officer and President, 1996–2008
Founder
John C. Bogle
Chairman and Chief Executive Officer, 1974–1996
P.O. Box 2600Valley Forge, PA 19482-2600
Connect with Vanguard® > vanguard.com
Fund Information > 800-662-7447
Direct Investor Account Services > 800-662-2739
Institutional Investor Services > 800-523-1036
Text Telephone for PeopleWho Are Deaf or Hard of Hearing > 800-749-7273
This material may be used in conjunctionwith the offering of shares of any Vanguardfund only if preceded or accompanied bythe fund’s current prospectus.
All comparative mutual fund data are from Lipper, aThomson Reuters Company, or Morningstar, Inc., unlessotherwise noted.
You can obtain a free copy of Vanguard’s proxy votingguidelines by visiting vanguard.com/proxyreporting or bycalling Vanguard at 800-662-2739. The guidelines arealso available from the SEC’s website, sec.gov. Inaddition, you may obtain a free report on how your fundvoted the proxies for securities it owned during the 12months ended June 30. To get the report, visit eithervanguard.com/proxyreporting or sec.gov.
You can review and copy information about your fund atthe SEC’s Public Reference Room in Washington, D.C. Tofind out more about this public service, call the SEC at202-551-8090. Information about your fund is alsoavailable on the SEC’s website, and you can receivecopies of this information, for a fee, by sending arequest in either of two ways: via email addressed [email protected] or via regular mail addressed to thePublic Reference Section, Securities and ExchangeCommission, Washington, DC 20549-1520.
© 2018 The Vanguard Group, Inc.All rights reserved.Vanguard Marketing Corporation, Distributor.
Q6732B 052018