Embed Size (px)
Citation preview
Value for money in Health Spending
© OECD 2010
21
Chapter 1
How Much is Too Much? Value for Money in Health Spending
This chapter starts with a look at recent trends – focusing on the last decade and a
half – in health spending and its components. The main drivers behind health
expenditure growth are then discussed and, on the basis of this, possible future
spending pressure. The chapter then presents a brief assessment of the current
macroeconomic situation facing OECD countries, drawing on the latest projections
of countries’ fiscal positions and concludes with a discussion of recent evidence on
the degree of system inefficiency, suggesting that there is scope for addressing
sustainability, financial or economic, by improving the efficiency of resource use to
that of the best performers.
1. HOW MUCH IS TOO MUCH? VALUE FOR MONEY IN HEALTH SPENDING
VALUE FOR MONEY IN HEALTH SPENDING © OECD 201022
1. Introduction
OECD countries have made tremendous strides in improving population health over
recent decades. Life expectancy at birth has increased, rising on average by ten years
between 1960 and 2008. Gains at older ages have been even more dramatic. Today, a woman
aged 65 can expect to live a further 20 years, and a man an additional 17 years. Although
socio-economic inequalities in health status and access to care remain, reductions in child
mortality and gains in population health have continued to improve at a steady pace over
the past few decades (OECD, 2009a). Levels of morbidity have fallen and infant mortality is
now five times lower today than it was in 1960.
Part of these achievements can be put down to increased incomes and higher levels of
education. But a good portion has originated in the improvements in health care itself.
Technological change has brought better treatments and benefitted a wider section of the
population. For example, improvements in anaesthesia combined with non-invasive
surgery have meant that a greater number of older patients can be operated with less pain
and faster recovery than before. Even in the past few years, huge improvements have been
made in the treatment of stroke and other heart diseases, reducing mortality rates from
these diseases dramatically. Public health has also improved with higher levels of
immunisation which has limited the spread of communicable disease.
Health systems have also evolved such that almost all countries have some form of
public or private insurance covering the risk of ill health and high medical costs and access
to quality health care has also improved. Less developed OECD countries have progressed
in this area: Mexico and Turkey have increased insurance cover for the poorest groups of
the population. The historic health reforms in the United States pave the way towards
mandated health insurance for a wider share of the population. Improvements in medical-
practice standards have been accompanied by efforts to reduce the provision of
inappropriate services and address shortcomings in the quality of care.
OECD health systems are more effective, provide higher quality care, and have given
access to health care to a larger share of the population than ever before. However, these
achievements have not come cheaply. Countries have confronted steady increases in the
cost of health care spending over recent decades. Total health expenditure has now
reached 9% of GDP for the average OECD country with seven countries having a ratio of over
10% (the United States, France, Switzerland, Austria, Germany, Canada and Belgium),
compared with only three countries a half decade before. How much and what they
consume in terms of health care, as well as the rate of growth of health spending, varies
enormously between countries as do the health outcomes.
Looking to the future, OECD countries will continue to face upward pressures on
health spending from a number of factors including demographic change, advances in
medical care technology and the growing expectations from patients and the electorate at
large. Since the public purse finances the vast majority of health-related spending in most
1. HOW MUCH IS TOO MUCH? VALUE FOR MONEY IN HEALTH SPENDING
VALUE FOR MONEY IN HEALTH SPENDING © OECD 2010 23
countries, these increasing demands for health services need to be seen in the current
context of increasingly constrained public finances.
This, then, is the challenge for health systems. When those who pay for health look at
what they get for their money, can they be sure that they are getting value for their money?
Talking of “value for money” in health expenditure is sometimes taken as a coded way
of talking about “cuts” in spending. This is not what is meant in this publication. It is rather
used in the sense of whether the benefits of spending exceed the costs. Increased value for
money can come from reduced spending, it is true, but it can come equally from delivering
more of the things that we value in our health systems.
There are as many different frameworks for looking at the benefits or objectives of the
health system as there are analysts looking at the topic,1 but they are all in reality very similar.
The OECD analyses health care systems on the basis of four main pillars or objectives:
● The first pillar is whether health care systems provide widespread access to health care
services and adequate insurance against the cost of care for the population at large in an
equitable manner.
● The second pillar relates to whether the care provided is of high quality and whether
health care providers are responsive to patient/consumer needs.
● The third pillar considers whether the cost of the health care system can be sustained over
the longer haul given political constraints and choices imposed by the total government
financial resources and the other calls on the public purse such as education.
● The fourth pillar is whether care is provided in an efficient and effective manner.
The first two objectives concern how well health care systems are performing in terms
of health care supply and whether the provision of care services are of high quality and
adapted to patient needs. The third and fourth criteria consider whether resources are
adequate and being put to good use.
Furthermore, though not included in most listings of the objectives of the health
system, it is also true that health is a significant sector of the economy, and is one that is
usually under some form of public control. This means that the health system can
sometimes be used by governments as an instrument in wider economic policies. For
example, in the recent recession, spending on health has acted as an automatic stabiliser
to the economy, and has been a source of jobs growth when most other sectors have been
in decline.
The emphasis placed on health policy goals by individual governments can of course
vary in importance both over time and between countries for very good reasons. Countries
may legitimately have different priorities, reflecting their own societal preferences and
needs. Priorities may also change over time to respond to different economic circumstances,
health care needs, population expectations and advances in medicine. Indeed, the
strengthening of health systems through net increases in spending to benefit from the
opportunities brought by new technology and to tackle continuing unmet needs, while at the
same time seeking efficiency improvements, may be seen as an optimal dual approach.
Nonetheless, wide differences remain across countries in both the level of resources
allocated to health and in the efficiency and effectiveness with which they are used. There
are wide differences in health outcomes which appear little related to the level of resources
channelled into health care. Some countries probably are getting more “value for money”
from their health spending than others. In theory, spending money more wisely rather
1. HOW MUCH IS TOO MUCH? VALUE FOR MONEY IN HEALTH SPENDING
VALUE FOR MONEY IN HEALTH SPENDING © OECD 201024
than seeking to spend more overall would be the appropriate policy response for those
countries with low-performing health systems. But it is extremely hard to identify in just
what ways a country is spending inefficiently. Health systems are complex, there are
multiple objectives, and often information is inadequate.
If reallocating resources from low-performing sectors of the health system is hard,
then to meet new demands for health care will require new resources. But how should
policy makers decide whether such spending is justified? Judging how much public
resources should be spent on health care at a given point in time can depend on two
different measures of “sustainability” (Thomson et al., 2009):
● On the one hand, so long as the value produced by health care exceeds its opportunity
cost, that is the value that would have been gained by spending on other areas, then
growth in health spending can be said to be economically sustainable. Once this cost
becomes too high, and better gains would be achieved by spending elsewhere (either in
the private sector or for other components of public spending), then health spending
becomes economically unsustainable.
● Financial sustainability, on the other hand, becomes a problem when governments are
unable to finance the existing level of resources because of an inability or unwillingness
to generate sufficient revenues to pay for them, and when they cannot – or will not –
allow any further “crowding out” of other forms of government spending.
It follows that it is possible for health spending growth to be economically sustainable,
and yet not financially sustainable. However, it is necessary to acknowledge that in some
countries, achieving “value for money” is not enough to ensure the sustainability of the
system. When fiscal constraints are binding, health systems either have to find new
sources of finance – most of which have their own drawbacks – or else health spending
which produces benefits greater than their costs will have to be deferred. Some of the
problems currently facing countries are not because the health system is not spending
money wisely, but rather that they simply cannot raise enough money because of the
economic conditions. Many OECD countries may now find themselves in this situation.
This report does not attempt to cover all the issues that might be relevant in achieving
a high-performing health system. It does not consider the different forms of financing
health, or the appropriate role of competition in health system delivery, for example, in
detail. Rather, it looks at the most promising policy initiatives that countries are taking in
order to increase “value for money”.
This introductory chapter starts with a look at recent trends – focusing on the last
decade and a half – in health spending and its components. This discussion looks behind
the OECD average to try and tease out some common characteristics among groups of
countries. The main drivers behind health expenditure growth are then discussed and, on
the basis of this, possible future spending pressure. The chapter then presents a brief
assessment of the current macroeconomic situation facing OECD countries, drawing on
the latest projections of countries’ fiscal positions and concludes with a discussion of
recent evidence on the degree of system inefficiency, suggesting that there is scope for
addressing sustainability, financial or economic, by improving the efficiency of resource
use to that of the best performers.
Chapter 2 looks at the range of policy options and policy instruments which might
affect health care costs, health care benefits and/or the relationship between the two,
including both those designed to have short run effects and those that aim to change the
1. HOW MUCH IS TOO MUCH? VALUE FOR MONEY IN HEALTH SPENDING
VALUE FOR MONEY IN HEALTH SPENDING © OECD 2010 25
longer run path of spending through changes in the way health care systems are organised
and governed.
The remainder of the report looks in detail at which initiatives can deliver the same
care with reduced costs, or else produce more access to high quality health care services at
a reasonable cost, including:
● The role of systematic, rational decision making in deciding the benefit package, paying
for new technologies and applying evidence-based medicine (Chapter 3).
● The role of “pay for performance”, to reward providers who increase value for money by
providing better quality care and analyses (Chapter 4).
● Efforts to increase value for money in health spending by reducing the demand for care
through better co-ordination by health providers (Chapter 5).
● Policies that can be used to draw all the benefits from pharmaceutical spending (Chapter 6).
● Evidence on whether greater investment in health ICTs could increase access, reduce
costs and increase quality of health care (Chapter 7).
2. Health care spending: developments over recent decades
The growth of total health care spending
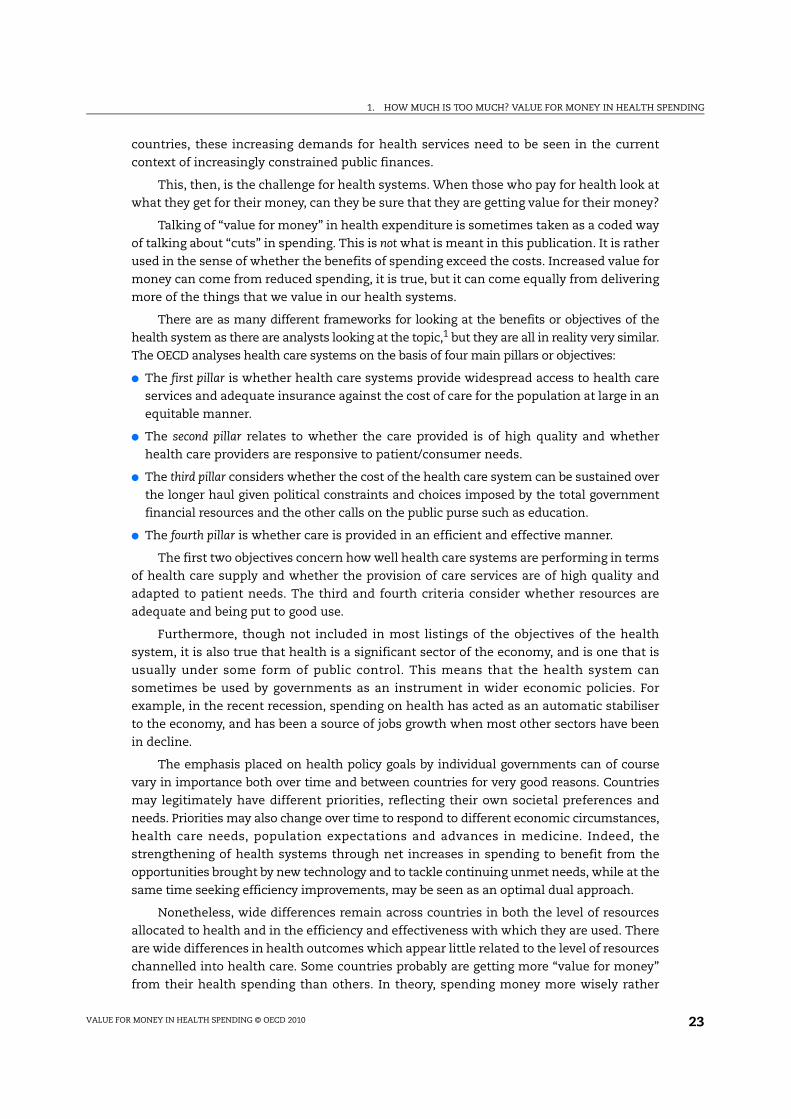
As noted in the preceding section, health spending has seen a near relentless rise over
recent decades and had reached 9% of GDP by 2008 (Figure 1.1). Looking over the preceding
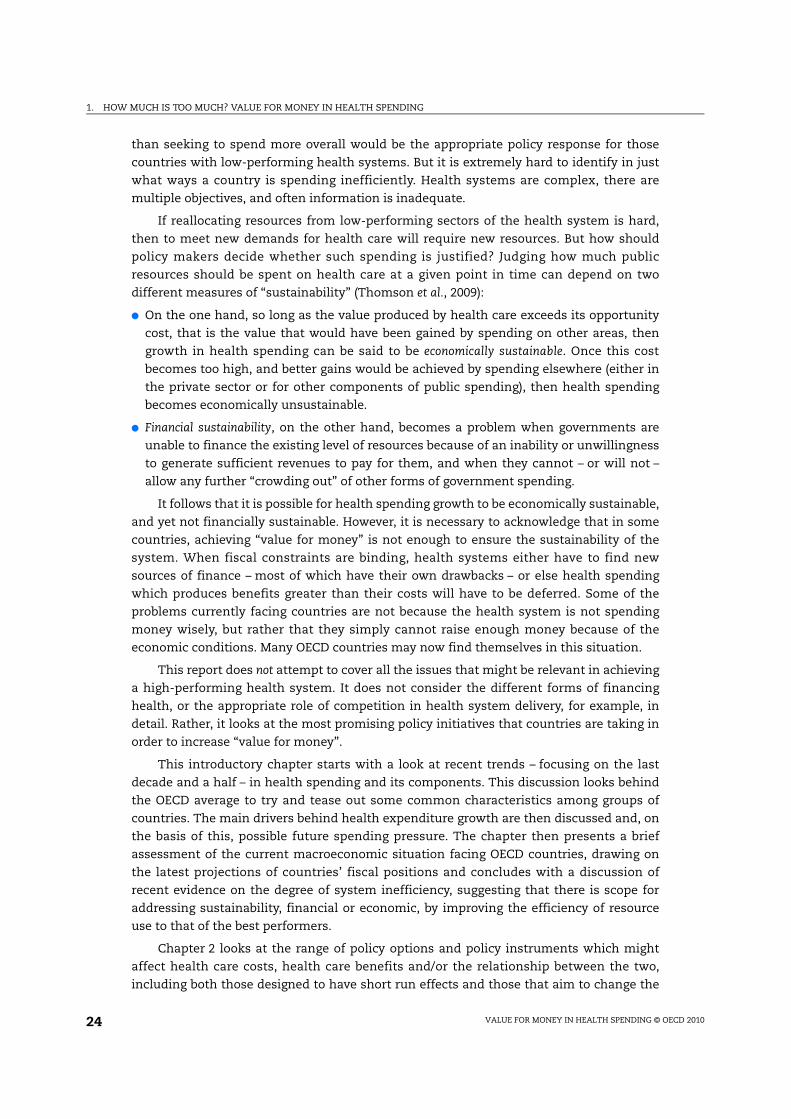
15 years, real per capita health spending grew at an annual growth rate of 3.9% for the
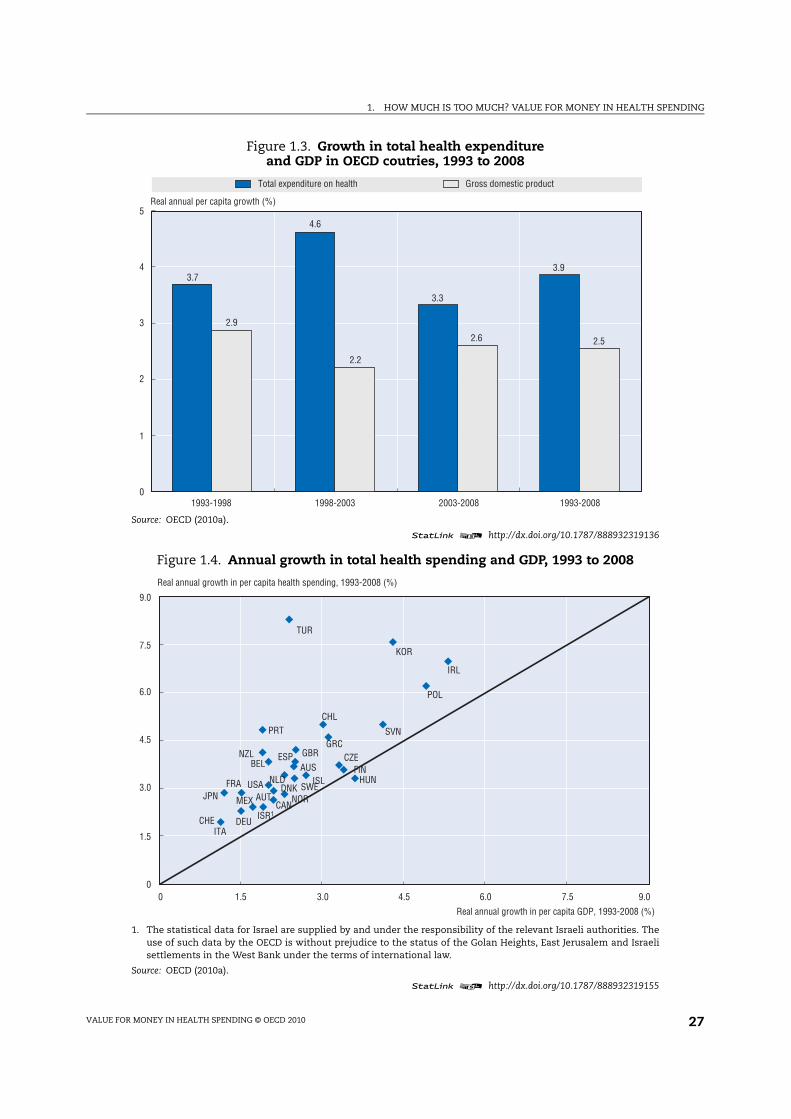
OECD average (Figure 1.2). This compares with annual growth in GDP of around 2.6%. While
the average rate of economic growth remained relatively stable throughout the period,
growth in health spending has been more variable (Figure 1.3). During the mid-1990s,
governments in some OECD countries applied cost-containment measures in response to
the acceleration in the rate of growth of health spending experienced at the beginning of
the decade. This resulted in health spending growth that was broadly comparable to
average GDP growth (Huber and Orosz, 2003). However this slowing proved only temporary.
Health spending began to rise rapidly again towards the end of the decade, reflecting
deliberate policies in a number of OECD countries to relieve the pressures arising from the
previous restrictive measures (e.g. in Canada, the United Kingdom and Ireland). The tighter
budgetary controls adopted in these countries had constrained both the capacity for care
and the level of activity. In the United States, a backlash against some of the more
restrictive forms of managed care in the 1990s led to some easing and a rapid increase in
costs at the same time (Colombo and Morgan, 2006).
Considerable country diversity
OECD countries vary enormously in how much they spend on health and the rate at
which health spending grows. Developments in the share of health care spending in GDP
depend on the growth rate of GDP as well as the growth rate of health care spending itself
(Figure 1.4). The combined effect indicates that there has been a degree of convergence
among OECD countries in the ratio of health care expenditure to GDP. Some clustering of
OECD countries based on their economic and several health spending growth patterns over
the period may be observed:
● A number of high income countries such as Canada and some Scandinavian countries
saw stable economic growth above 2% per year, but the growth in the predominantly
1. HOW MUCH IS TOO MUCH? VALUE FOR MONEY IN HEALTH SPENDING
VALUE FOR MONEY IN HEALTH SPENDING © OECD 201026
Figure 1.1. Average health spending as a share of gross domestic product (GDP) across OECD countries
Source: OECD (2010a).
statLink 2 http://dx.doi.org/10.1787/888932319098
5.2
6.66.9
7.8
9.0
0
2.5
5.0
7.5
10.0
1970 1980 1990 2000 2008
Share of GDP (%)
Public expenditure Private expenditure
Figure 1.2. Annual growth in per capita health expenditure, 1993 to 2008
1. The statistical data for Israel are supplied by and under the responsibility of the relevant Israeli authorities. Theuse of such data by the OECD is without prejudice to the status of the Golan Heights, East Jerusalem and Israelisettlements in the West Bank under the terms of international law.
Source: OECD (2010a).
statLink 2 http://dx.doi.org/10.1787/888932319117
8.3
7.6
7.0
6.2
5.0 5.04.8
4.64.2 4.1
3.9 3.8 3.8 3.7 3.73.5 3.4 3.4 3.3 3.3
3.12.9 2.9 2.8 2.8 2.8
2.62.4 2.4
2.2 2.1 2.1
0
1.5
3.0
4.5
6.0
7.5
9.0
Turk
ey
Korea
Irelan
d
Polan
dChi
le
Slove
nia
Portu
gal
Greec
e
Unite
d Kin
gdom
New Z
ealan
d
OEC
D
Belgiu
mSpa
in
Austra
lia
Czech
Rep
ublic
Finlan
d
Icela
nd
Nethe
rland
s
Hunga
ry
Sweden
Unite
d Sta
tes
Austri
a
Denm
ark
Fran
ce
Japa
n
Norway
Canad
a
Isra
el1
Mex
ico
Germ
any
Italy
Switzer
land
Real annual growth rate in health spending, 1993-2008 (%)
1. HOW MUCH IS TOO MUCH? VALUE FOR MONEY IN HEALTH SPENDING
VALUE FOR MONEY IN HEALTH SPENDING © OECD 2010 27
Figure 1.3. Growth in total health expenditureand GDP in OECD coutries, 1993 to 2008
Source: OECD (2010a).
statLink 2 http://dx.doi.org/10.1787/888932319136
Total expenditure on health Gross domestic product
3.7
4.6
3.3
3.9
2.9
2.2
2.6 2.5
0
1
2
3
4
5
1993-1998 1998-2003 2003-2008 1993-2008
Real annual per capita growth (%)
Figure 1.4. Annual growth in total health spending and GDP, 1993 to 2008
1. The statistical data for Israel are supplied by and under the responsibility of the relevant Israeli authorities. Theuse of such data by the OECD is without prejudice to the status of the Golan Heights, East Jerusalem and Israelisettlements in the West Bank under the terms of international law.
Source: OECD (2010a).
statLink 2 http://dx.doi.org/10.1787/888932319155
AUS
AUT
BEL
CAN
CHL
CZE
DNK
FIN
FRA
DEU
GRC
HUNISL
IRL
ISR1
ITA
JPN
KOR
MEX
NLD
NZL
NOR
POL
PRT SVN
ESP
SWE
CHE
TUR
GBR
USA
0
1.5
3.0
4.5
6.0
7.5
9.0
0 1.5 3.0 4.5 6.0 7.5 9.0
Real annual growth in per capita health spending, 1993-2008 (%)
Real annual growth in per capita GDP, 1993-2008 (%)
1. HOW MUCH IS TOO MUCH? VALUE FOR MONEY IN HEALTH SPENDING
VALUE FOR MONEY IN HEALTH SPENDING © OECD 201028
public-funded health systems was kept in check. In the case of Canada and Finland,
spending constraints by provincial and municipal governments respectively were linked
to the recessions of the early 1990s to address the growing public deficits. However, since
the late 1990s, spending on health has been well above that of GDP in both of these
countries.
● The United Kingdom and Australia – both with moderate to strong economic growth over
the period – saw health spending growth generally outpacing that of the economy. The
pressure for cost containment may have been less severe and in the case of the United
Kingdom, additional public resources allocated to health became a deliberate policy
towards the end of the 1990s.
● Low economic growth in Germany and Italy may have contributed to the constraining
of health spending and therefore limited any significant increases in the health
spending to GDP ratio. Per capita health spending increased, in real terms, by 2% per
year on average in both countries. On the other hand, other countries experiencing
low economic growth, such as Japan, France and Belgium still saw overall health
spending growth greatly exceed that of GDP resulting in an increasing health to GDP
ratio.
● Among some of the lower income countries of the OECD, relatively strong long-term
economic growth was more than matched by considerable increases in spending on
health. This was the case in Ireland, Korea, Poland and Turkey. Other countries such as
the Czech Republic and Slovenia also experienced relatively high economic growth, but
– contrary to the above – health spending growth, although high, did not significantly
outpace that of the overall economy resulting in only moderate increases in the health
to GDP ratio. In the case of Hungary, there was in fact a fall in the health spending to GDP
ratio over the period.
● Finally, countries such as Portugal (and to a lesser extent Mexico) experienced relatively
high growth in health spending, although economic development remained low. While
their relative economic position (in terms of GDP per capita compared with the rest of
the OECD) did not improve or indeed weakened, the resources devoted to the health care
system improved considerably.
Spending over time and catch-up
Focussing on growth of per capita health care spending, the very different patterns
between OECD countries described above have come as a result of various economic
and policy developments. Several mainly lower-income OECD countries made
deliberate policy choices to finance expansions and improvements in health systems to
bring their health systems up to OECD standards of care and access. Korea and Turkey,
for example, saw significant reforms to increase the health care coverage of the
population. There were also rapid increases in health spending in some of the eastern
European countries.
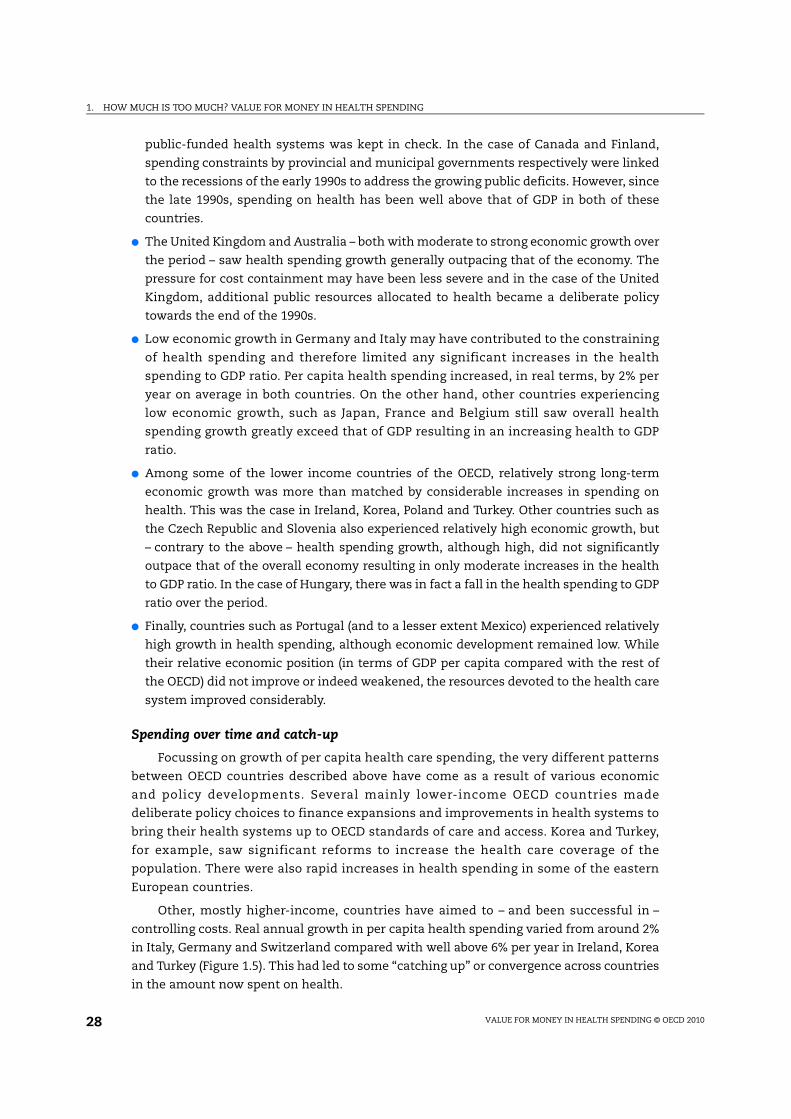
Other, mostly higher-income, countries have aimed to – and been successful in –
controlling costs. Real annual growth in per capita health spending varied from around 2%
in Italy, Germany and Switzerland compared with well above 6% per year in Ireland, Korea
and Turkey (Figure 1.5). This had led to some “catching up” or convergence across countries
in the amount now spent on health.
1. HOW MUCH IS TOO MUCH? VALUE FOR MONEY IN HEALTH SPENDING
VALUE FOR MONEY IN HEALTH SPENDING © OECD 2010 29
Figure 1.5. Per capita total spending on health in 1993 and annual growth in spending, 1993 to 2008
1. The statistical data for Israel are supplied by and under the responsibility of the relevant Israeli authorities. Theuse of such data by the OECD is without prejudice to the status of the Golan Heights, East Jerusalem and Israelisettlements in the West Bank under the terms of international law.
Source: OECD (2010a).
statLink 2 http://dx.doi.org/10.1787/888932319174
0
1.5
3.0
4.5
6.0
7.5
9.0
Real annual growth in per capita health spending, 1993-2008 (%)
AUS
AUT
BEL
CAN
CHL
CZE
DNK
FIN
FRA
DEU
GRC
HUNISL
IRL
ISR1
ITA
JPN
KOR
MEX
NLD
NZL
NOR
POL
PRT
SVN
ESPSWE
CHE
TUR
GBR
USA
0 500 1 000 1 500 2 000 2 500 3 000 3 500
Per capita health spending, 1993 (USD PPP)
Figure 1.6. Ratio of private to public health spending growth, 1993 to 2008
Source: OECD (2010a).
statLink 2 http://dx.doi.org/10.1787/888932319193
AUSAUT
CAN
CHL
CZE
DNK
FIN
FRA
DEU
GRC
HUN
ISLIRL ITA
JPNKORMEX
NZL
NORPOL
PRT
SVNESP
SWE
CHE
TURGBR
USA
0
1
2
3
4
5
20 40 60 80 100
Ratio of private to public health spending growth, 1993-2008
Public share of total health spending, 1993 (%)
1. HOW MUCH IS TOO MUCH? VALUE FOR MONEY IN HEALTH SPENDING
VALUE FOR MONEY IN HEALTH SPENDING © OECD 201030
The public share of total health spending has remained relatively stable on average
across OECD countries since the early 1990s. Nonetheless, there has also been a degree of
narrowing between countries in the relative importance of public and private financing of
health care (Figure 1.6). That is, those countries that had a relatively high public share of
health expenditure, and often more limited private insurance markets or cost-sharing
arrangements (such as in the Czech Republic, Poland and Hungary) at the beginning of the
1990s, saw more rapid growth in private expenditure subsequently. In contrast, countries
with a relatively low share of public health expenditure in the early 1990s tended to see
public spending on health as the main driver of overall growth in health spending. This, for
example, was the case in Korea, Portugal and Ireland, where, as we have seen, there were
deliberate policies to widen coverage or to invest heavily in health systems.2
3. Spending by type of health care services
The allocation of health spending across the different types of health services and
goods can be influenced by a wide range of factors, from the supply of resources and access
to new or high-cost technology, to the financial and institutional arrangements for health
care delivery, as well as clinical guidelines and the disease burden within a country. OECD
data are able to break down spending into components of individual health care (in-
patient, out-patient, pharmaceuticals, etc.) as well as those services benefiting the all or
parts of the community, such as public health and administration of health care.
In-patient care (i.e. predominantly provided in hospitals) and ambulatory care
together account for around 60% of health spending.3 With in-patient care highly labour
intensive and, therefore, expensive, high income countries with developed health systems
have sought to reduce the share of spending in hospitals by shifting to more day surgery,
out-patient or home-based care. Such services are an important innovation in health care
delivery, often being preferred, when possible, by patients to staying overnight in a
hospital. In the United States, elective interventions on a same day basis accounted for a
quarter of the growth in US health spending between 2003 and 2006, compared with just
4% of the growth in Canadian spending.4 Estimates of spending on same-day surgery
performed by independent physicians for 2003 and 2006 suggest that this has been the
fastest growing area of health care over this period (McKinsey Global Institute, 2008). In
France, spending on day care now accounts for around 11% of curative care spending. By
contrast, Germany, where day surgery in public hospitals was prohibited until the late
1990s (Castoro et al., 2007), reported only 2% of curative care expenditure as services of day
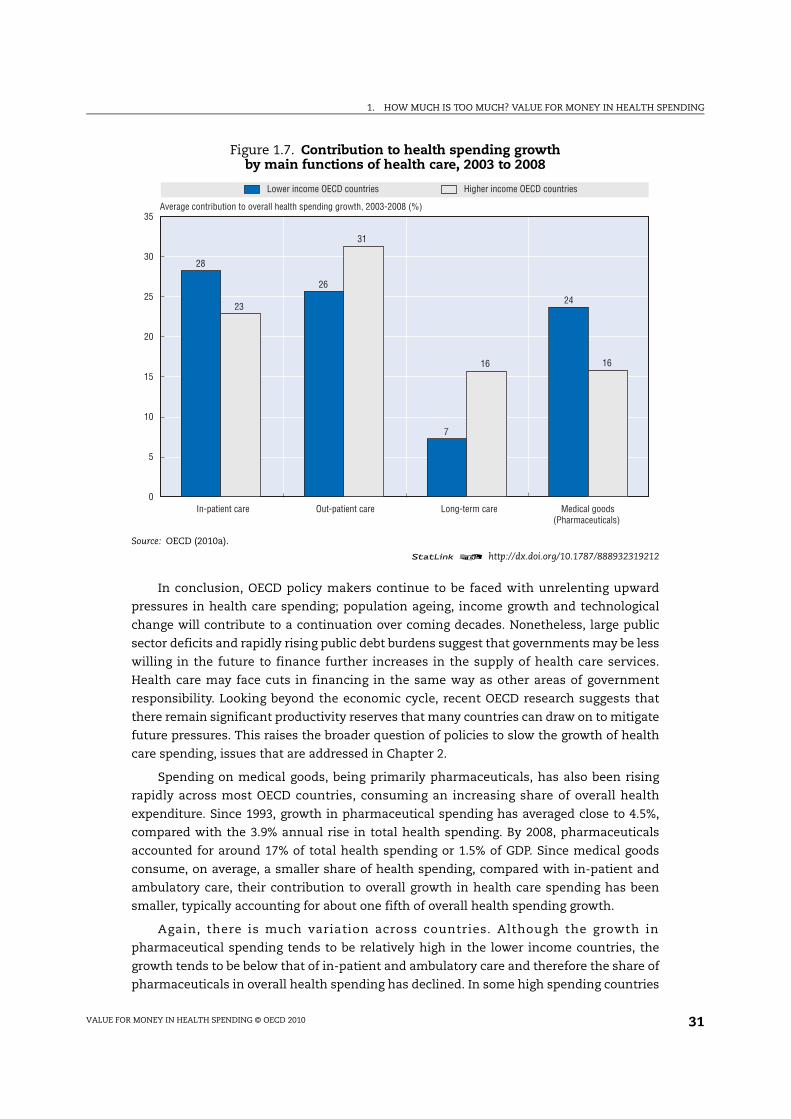
care.5 More generally, lower income countries seeking to invest in and expand their health
systems have generally seen the growth in hospital in-patient care outpace other areas of
spending such that it has been the main contributor to overall health expenditure growth
(Figure 1.7).
Spending on long-term care has increased significantly across OECD countries, as the
demand for care from ageing societies rises. Expenditure on long-term care, either in
institutions or in a home-based setting now accounts for more than 12% of total health
spending on average, and considerably more in countries where there is already a sizeable
elderly population. Both Germany and Japan, with more than 20% of the population over 65
by 2008, extended their range of social insurance schemes to cover the costs of long-term
care, in 1995/96 and 2000 respectively.
1. HOW MUCH IS TOO MUCH? VALUE FOR MONEY IN HEALTH SPENDING
VALUE FOR MONEY IN HEALTH SPENDING © OECD 2010 31
In conclusion, OECD policy makers continue to be faced with unrelenting upward
pressures in health care spending; population ageing, income growth and technological
change will contribute to a continuation over coming decades. Nonetheless, large public
sector deficits and rapidly rising public debt burdens suggest that governments may be less
willing in the future to finance further increases in the supply of health care services.
Health care may face cuts in financing in the same way as other areas of government
responsibility. Looking beyond the economic cycle, recent OECD research suggests that
there remain significant productivity reserves that many countries can draw on to mitigate
future pressures. This raises the broader question of policies to slow the growth of health
care spending, issues that are addressed in Chapter 2.
Spending on medical goods, being primarily pharmaceuticals, has also been rising
rapidly across most OECD countries, consuming an increasing share of overall health
expenditure. Since 1993, growth in pharmaceutical spending has averaged close to 4.5%,
compared with the 3.9% annual rise in total health spending. By 2008, pharmaceuticals
accounted for around 17% of total health spending or 1.5% of GDP. Since medical goods
consume, on average, a smaller share of health spending, compared with in-patient and
ambulatory care, their contribution to overall growth in health care spending has been
smaller, typically accounting for about one fifth of overall health spending growth.
Again, there is much variation across countries. Although the growth in
pharmaceutical spending tends to be relatively high in the lower income countries, the
growth tends to be below that of in-patient and ambulatory care and therefore the share of
pharmaceuticals in overall health spending has declined. In some high spending countries
Figure 1.7. Contribution to health spending growth by main functions of health care, 2003 to 2008
Source: OECD (2010a).
statLink 2 http://dx.doi.org/10.1787/888932319212
Lower income OECD countries Higher income OECD countries
28
26
7
2423
31
16 16
0
5
10
15
20
25
30
35
In-patient care Out-patient care Long-term care Medical goods(Pharmaceuticals)
Average contribution to overall health spending growth, 2003-2008 (%)
1. HOW MUCH IS TOO MUCH? VALUE FOR MONEY IN HEALTH SPENDING
VALUE FOR MONEY IN HEALTH SPENDING © OECD 201032
such as Canada, for example, medical goods have been the main driver of increasing health
expenditure, contributing almost one-third of overall growth. The United States, Austria
and France have also seen relatively high growth in pharmaceutical spending. This
contrasts to Japan and Germany, where tighter price regulation or moves to promote more
generic prescribing took greater effect.
4. The drivers of health care spending
A number of studies have attempted to identify the drivers of health spending growth
and quantify their respective impact (Newhouse, 1992; OECD, 2006; Dormont et al., 2006;
Smith et al., 2009).6 Among these determinants, ageing of the population, rising national
income, relative medical prices and technological progress have been given particular
attention. The roles of medical supply and “defensive medicine” were also considered,
especially in the United States, but found to be negligible. Most studies have used a growth
accounting framework (see Denison, 1962). Within this broad framework, Newhouse (1992)
estimates the contribution of known factors to health spending growth (1940-90) and
assumes that most of the unexplained residual is attributable to changes in health
technology. A more recent review of the earlier estimates using more recent data by
Newhouse and colleagues (Smith et al., 2009) indicates that between one quarter and one
half of the increase in health care spending could be attributed to technology.
According to the literature, the contribution of ageing to past health spending growth
appears modest. It ranges from 6.5% to 9% of the increase in total health care spending over
the period 1960 to 1990 but the results depend on estimation strategy, type of data, country
and period considered (OECD, 2006; Dormont et al., 2006; Smith et al., 2009).7 Income
changes are credited with having a higher contribution to health spending growth in all
studies, ranging from 28% to 58%, depending on data and hypotheses on income elasticity
of health expenditures (generally assessed as being between 0.6 and 1.08).
Medical price inflation is not always included in models because of measurement
problems. But Smith et al. (2009) estimate a contribution of medical prices to spending
growth to range between 5-18% on the basis of two alternative assumptions about
productivity gains in medical care. The contribution of technological progress is often
measured as the residual when respective contributions of other factors have been
estimated. Initial estimates by Newhouse (1992) attributed 50 to 75% of health expenditure
growth to changes in technology. More recent estimates on US data over 1960-2007 range
from 27.4 to 48.3% according to alternative working hypotheses (Smith et al., 2009).
Dormont et al. (2006), working on microdata, showed that “changes in medical practice” – for
a given level of morbidity – explained about a quarter of health spending growth in France
between 1992 and 2000.
Changing epidemiological patterns has also been put forward as a possible contributor to
rising health spending. Prevention of infectious diseases together with the possibilities of long-
term treatment of previously untreatable or badly treatable conditions has meant that chronic
illnesses account for an increasing share of health spending. However, when controlling for the
demographic effects and the quantity of services brought about through technology and
treatment practice, the effect overall is thought to be minimal. Indeed, projections of health
care spending in Australia between 2003 and 2033 showed that expected age standardised
disease rate change actually had a favourable effect in disease areas such as cardiovascular
disease and cancer, offset by dramatic increases in diabetes (AIHW, 2008).
1. HOW MUCH IS TOO MUCH? VALUE FOR MONEY IN HEALTH SPENDING
VALUE FOR MONEY IN HEALTH SPENDING © OECD 2010 33
5. Will financial sustainability be a problem in the future?
Public spending on health and long-term care amounted to, on average, some 7% of GDP
in 2007. As described above, it is not always enough to show that health spending gives good
value for money by delivering greater benefits than costs. If the fiscal situation is such that it
simply is not possible to raise sufficient funds to cover the spending, socially desirable
expenditures will have to be reduced. This section considers the long-term projections in
public spending, with the subsequent section considering the extent to which current fiscal
circumstances are putting more countries in this unfortunate position.
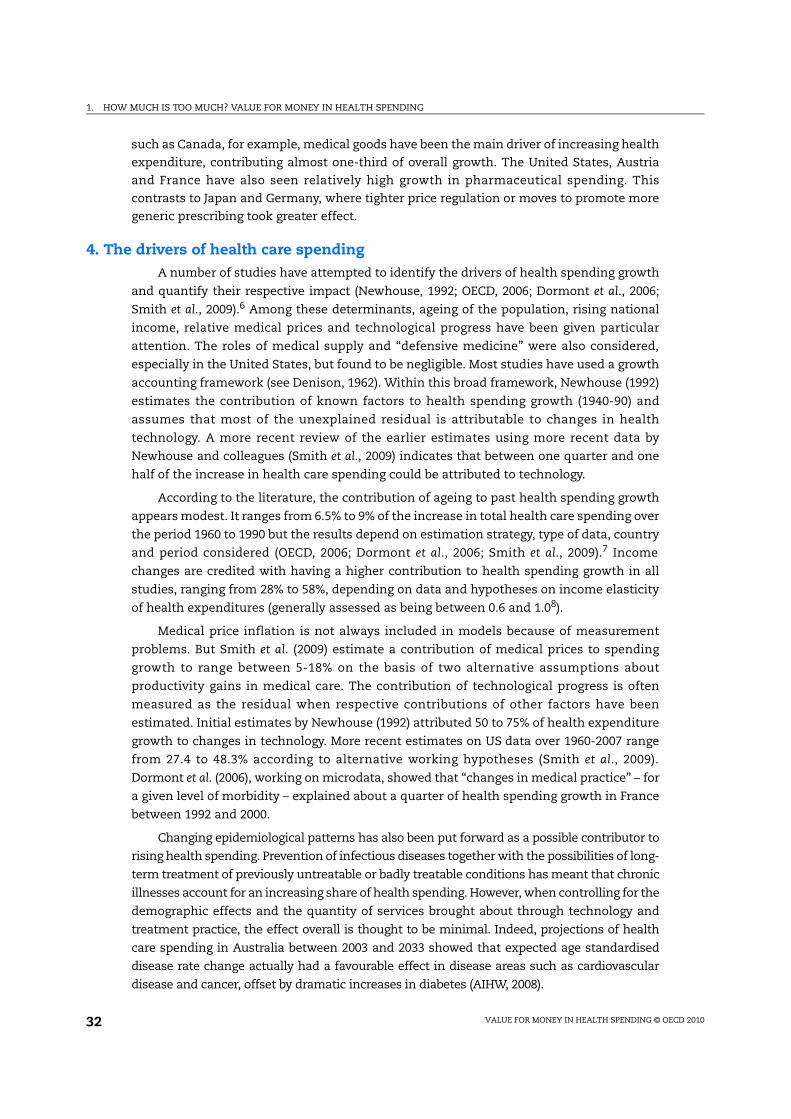
Most recent OECD projections provide some indication of likely trends for health and
long-term care. Projections are made for both of these components apart since the factors
driving the two components are somewhat different. The results suggest that public
expenditure on health and long-term care could rise to almost double current levels – from
close to 7% of GDP in 2005 to some 13% by 2050 – assuming that growth in the residual,
which are often referred to as technological change,9 remains unchanged throughout the
period (Figure 1.8). Alternatively, if governments were successful in reducing the size of the
“residual” by half over the projection period, public health and long-term care spending
would still increase by 3.5 percentage points of GDP to reach around 10% of GDP.
As discussed above, these increases come from several sources. As regards the
changing age structure of the population, a rising share of older age groups in the
population will put upward pressure on costs because health costs rise with age. However,
the average cost per individual in older age groups should fall over time for two reasons.
First, the projections assume lengthening of lifetimes, thereby putting off the high costs in
Figure 1.8. Projections of public health and long-term care spending, 2005-50
Source: OECD (2006).
statLink 2 http://dx.doi.org/10.1787/888932319231
Health care Long-term care
5.7
9.6
7.7
1.1
3.3
2.4
0
2
4
6
8
10
12
14
2005 2050 cost-pressure scenario 2050 cost-containment scenario
Public health and long-term care spending (% of GDP)
Total: 6.7
Total: 12.8
Total: 10.1
1. HOW MUCH IS TOO MUCH? VALUE FOR MONEY IN HEALTH SPENDING
VALUE FOR MONEY IN HEALTH SPENDING © OECD 201034
the period just prior to death into the future; and second, the effect of population ageing is
also reduced because it is assumed that the longer life spans will be healthy ones.
Ageing-related effects are stronger for long-term care. Dependency on long-term care
will tend to rise as the share of old people in the population increase. This effect is
mitigated somewhat by the likelihood that the share of dependents per older age group will
fall as longevity increases due to the assumption of “healthy ageing”. Additional effects
coming from non-demographic factors: expenditures are likely to be pushed up by a
possible “cost disease” effect, i.e. the relative price of long-term care increasing in line with
average productivity growth in the economy because the scope for productivity gains in
long-term care is more limited.
These average results hide striking differences across countries. In the cost-containment
scenario, a group of countries stands out with increases of health and long-term care
spending at or above 4 percentage points of GDP, over the period 2005-50. It includes rapidly
ageing countries (Italy, Japan, Spain), countries that will experience a dramatic change in their
population structure (Korea, Mexico, Slovak Republic), and countries with currently low
labour participation, which may face a substantial increase in the demand for formal long-
term care (Italy, Ireland, Spain). In contrast, Sweden which is in a mature phase of its ageing
process and already spends a relatively high share of GDP on health and long-term care, is in
the lowest range with an increase below 2 percentage points of GDP.
Despite uncertainties, sensitivity analysis suggests the results are fairly robust in
some key respects. For example, under the assumption of “healthy ageing”, changes in
longevity will have only a modest effect on spending. However, the projections for
spending on long-term care are sensitive to the future development of labour market
participation for the working-age population as higher participation reduces the capacity
for “informal” care. An alternative scenario, where participation rates in countries where
they are currently low converge towards levels in high-participation countries, has
spending on long-term care rising by an additional 1-2% of GDP on average, but much more
in some countries.
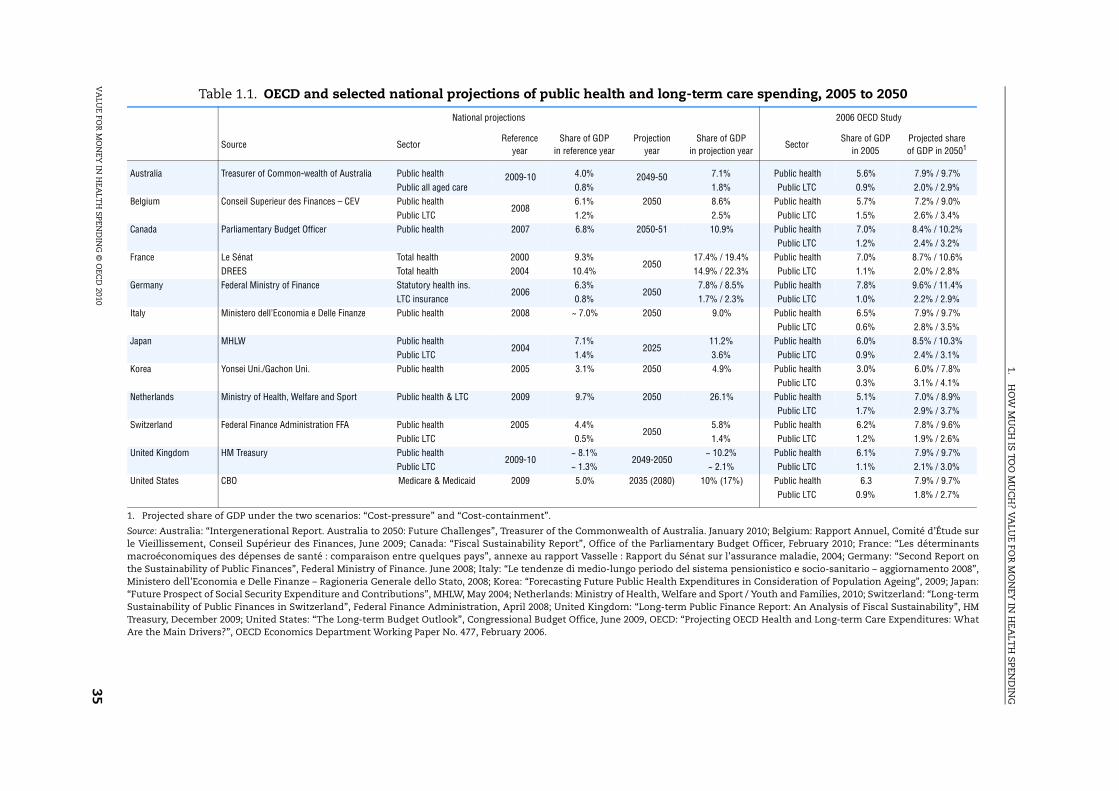
It is of interest to compare and contrast the results of this exercise with the many
national long-term projections of public spending.10 Table 1.1 provides the results from
recent national projections together with the results from the OECD study for a selection of
OECD countries. As with the OECD exercise, most of the models provide various scenarios
under different sets of assumptions. The projections contained in the table are principally
the base scenario, although, for example, Germany provides two forecasts based on relatively
favourable and unfavourable conditions with regard to sustainability. It should also be noted
that the aggregates of health and long-term care may differ from the OECD study in their
definition and starting point, and thus may not be directly comparable. The national
projections of spending can take into account differing assumptions of demographic, labour
force and productivity changes as well as different health and policy scenarios.
The national results emphasise the range of long-term projections with increases in
the health to GDP share of 2 percentage points or less in countries such as Germany, Italy,
Korea, Switzerland and the United Kingdom compared to significantly higher increases in
projections by France and the Netherlands. For the majority of countries, the projections
appear not too dissimilar to the projection range from the OECD study.
1.H
OW
MU
CH
IS TOO
MU
CH
? VA
LUE FO
R M
ON
EY IN
HEA
LTH
SPEND
ING
VA
LUE FO
R M
ON
EY IN
HEA
LTH
SPEND
ING
© O
ECD
20103
5
Table 1.1. OECD and selected national projections of public health and long-term care spending, 2005 to 2050
1. Projected share of GDP under the two scenarios: “Cost-pressure” and “Cost-containment”.
Source: Australia: “Intergenerational Report. Australia to 2050: Future Challenges”, Treasurer of the Commonwealth of Australia. January 2010; Belgium: Rapport Annuel, Comité d’Étude surle Vieillissement, Conseil Supérieur des Finances, June 2009; Canada: “Fiscal Sustainability Report”, Office of the Parliamentary Budget Officer, February 2010; France: “Les déterminantsmacroéconomiques des dépenses de santé : comparaison entre quelques pays”, annexe au rapport Vasselle : Rapport du Sénat sur l’assurance maladie, 2004; Germany: “Second Report onthe Sustainability of Public Finances”, Federal Ministry of Finance. June 2008; Italy: “Le tendenze di medio-lungo periodo del sistema pensionistico e socio-sanitario – aggiornamento 2008”,Ministero dell’Economia e Delle Finanze – Ragioneria Generale dello Stato, 2008; Korea: “Forecasting Future Public Health Expenditures in Consideration of Population Ageing”, 2009; Japan:“Future Prospect of Social Security Expenditure and Contributions”, MHLW, May 2004; Netherlands: Ministry of Health, Welfare and Sport / Youth and Families, 2010; Switzerland: “Long-termSustainability of Public Finances in Switzerland”, Federal Finance Administration, April 2008; United Kingdom: “Long-term Public Finance Report: An Analysis of Fiscal Sustainability”, HMTreasury, December 2009; United States: “The Long-term Budget Outlook”, Congressional Budget Office, June 2009, OECD: “Projecting OECD Health and Long-term Care Expenditures: WhatAre the Main Drivers?”, OECD Economics Department Working Paper No. 477, February 2006.
National projections 2006 OECD Study
Source SectorReference
year
Share of GDP
in reference year
Projection
year
Share of GDP
in projection yearSector
Share of GDP
in 2005
Projected share
of GDP in 20501
Australia Treasurer of Common-wealth of Australia Public health 2009-10 4.0% 2049-50 7.1% Public health 5.6% 7.9% / 9.7%
Public all aged care 0.8% 1.8% Public LTC 0.9% 2.0% / 2.9%
Belgium Conseil Superieur des Finances – CEV Public health2008
6.1% 2050 8.6% Public health 5.7% 7.2% / 9.0%
Public LTC 1.2% 2.5% Public LTC 1.5% 2.6% / 3.4%
Canada Parliamentary Budget Officer Public health 2007 6.8% 2050-51 10.9% Public health 7.0% 8.4% / 10.2%
Public LTC 1.2% 2.4% / 3.2%
France Le Sénat Total health 2000 9.3%2050
17.4% / 19.4% Public health 7.0% 8.7% / 10.6%
DREES Total health 2004 10.4% 14.9% / 22.3% Public LTC 1.1% 2.0% / 2.8%
Germany Federal Ministry of Finance Statutory health ins.2006
6.3%2050
7.8% / 8.5% Public health 7.8% 9.6% / 11.4%
LTC insurance 0.8% 1.7% / 2.3% Public LTC 1.0% 2.2% / 2.9%
Italy Ministero dell’Economia e Delle Finanze Public health 2008 ~ 7.0% 2050 9.0% Public health 6.5% 7.9% / 9.7%
Public LTC 0.6% 2.8% / 3.5%
Japan MHLW Public health2004
7.1%2025
11.2% Public health 6.0% 8.5% / 10.3%
Public LTC 1.4% 3.6% Public LTC 0.9% 2.4% / 3.1%
Korea Yonsei Uni./Gachon Uni. Public health 2005 3.1% 2050 4.9% Public health 3.0% 6.0% / 7.8%
Public LTC 0.3% 3.1% / 4.1%
Netherlands Ministry of Health, Welfare and Sport Public health & LTC 2009 9.7% 2050 26.1% Public health 5.1% 7.0% / 8.9%
Public LTC 1.7% 2.9% / 3.7%
Switzerland Federal Finance Administration FFA Public health 2005 4.4%2050
5.8% Public health 6.2% 7.8% / 9.6%
Public LTC 0.5% 1.4% Public LTC 1.2% 1.9% / 2.6%
United Kingdom HM Treasury Public health2009-10
~ 8.1%2049-2050
~ 10.2% Public health 6.1% 7.9% / 9.7%
Public LTC ~ 1.3% ~ 2.1% Public LTC 1.1% 2.1% / 3.0%
United States CBO Medicare & Medicaid 2009 5.0% 2035 (2080) 10% (17%) Public health 6.3 7.9% / 9.7%
Public LTC 0.9% 1.8% / 2.7%
1. HOW MUCH IS TOO MUCH? VALUE FOR MONEY IN HEALTH SPENDING
VALUE FOR MONEY IN HEALTH SPENDING © OECD 201036
6. Is fiscal sustainability a problem now?
In determining how future government policy will likely affect public spending on
health, it is important to recall the growing share of health in total government spending.
In the years leading up to the current downturn, government spending as a share of GDP
broadly declined, dropping from around 46% in 1995 to 41% in 2007 (see Joumard et al., 2010
for further details). This can be put down to total GDP rising faster than government
spending over the period rather than any contraction in total public expenditures (OECD,
2009b). In only two countries, Portugal and Korea, was there an increase in government
spending as a share of GDP. Over the same period, the proportion of public spending
allocated to health rose from around 12% to 16% of total government spending on average
– only in Hungary did the share remain unchanged.
Within this broad context, the current economic slowdown that started in 2008 differs
in nature from other recent recessions in that it has been global in both scale and timing.
Almost all OECD countries have been affected. The most recent OECD Economic Outlook
(No. 87, June 2010) recorded a decline of –3.3% in OECD GDP in 2009, with only sluggish
growth forecast for most countries through 2010.
Much of the recovery from recession through 2010 has been driven by the
unprecedented policy stimulus packages put in place by many OECD governments to
support the fragile economies rather than any renewed underlying induced consumer
demand. The result of such huge government measures together with the automatic
effects of a recession – largely on revenues – has meant that the fiscal position of most
OECD countries has deteriorated significantly with steep rises in government deficits in
2009. These deficits are estimated to remain close to 8% of GDP across the OECD in 2010,
with only modest improvement foreseen in 2011. The ratio of gross government debt to
GDP is expected to rise to 100% in 2011 for the OECD as a whole, up from just over 70% in
2007 prior to the financial crisis.
Such levels of government debt raise concerns about the budgetary environment and
financial sustainability, meaning that governments will need to carefully review
alternative strategies to start reducing the levels of government debt whilst not
undermining the stimulus driven recovery. Therefore, in the medium term, there are likely
to be increased pressures on public spending either through a mix of pushing through
long-planned reforms, increased efficiency measures or indeed spending cuts.
Lessons from past recessions suggest that a prolonged period of “belt tightening”
throughout the economy is likely with debt consolidation lasting some years after the
onset of recession, and continuing as the economy starts to grow again (McKinsey Global
Institute, 2010). Thus, the high government debt ratios of the current downturn could delay
the start of deleveraging leading to a rapid rise in the share of health in GDP in the first
couple of years, followed by a longer period of debt reduction.
Where will pressures for restraint in health care spending likely be the strongest?
Two sets of criteria can help identify where pressures for restraint of public health care
spending are likely to be the strongest:
● First, countries with high levels of debt and/or large overall public sector deficits are
likely to be more concerned about public spending and fiscal sustainability than
countries with low deficits and debt-to-GDP ratios.
1. HOW MUCH IS TOO MUCH? VALUE FOR MONEY IN HEALTH SPENDING
VALUE FOR MONEY IN HEALTH SPENDING © OECD 2010 37
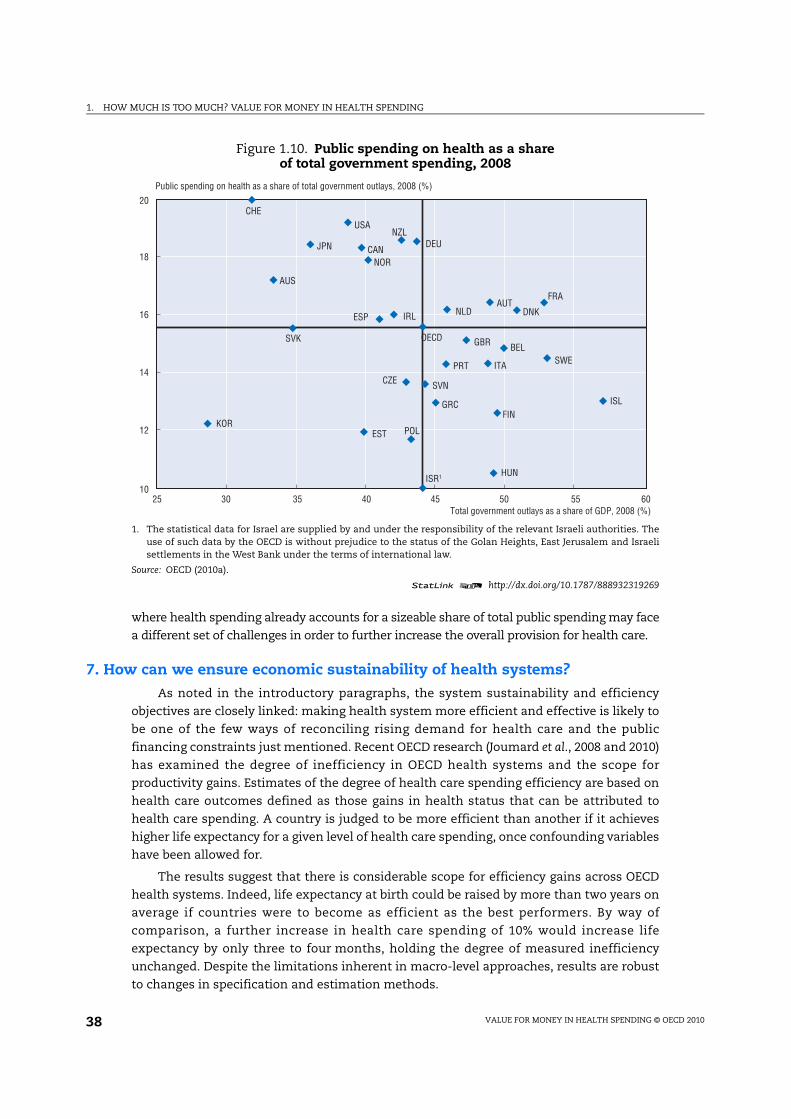
● Second, countries where spending on health care makes up a large portion of total
government spending and/or where general government spending makes up a large
share of GDP.
Recent events suggest that the first criteria set is probably of more immediate
importance as it concerns, as mentioned, problems of fiscal sustainability. Countries with
high levels of debt and large deficits (the top right hand quadrant) will face the greatest
difficulty in financing increased spending (Figure 1.10).
The second set is critical in judging the scope for further increases in public health
care spending on the basis of the economic sustainability criteria. Taking into account both
the overall level of public spending in the economy and the share allocated to health care
(on the assumption that it is harder to raise revenues in countries which already spend a
lot and that health is more likely to be affected by public expenditure constraints, the
greater the proportion of public expenditure which goes on health), a first approximation
may be to say that countries falling in the top right part of Figure 1.10 are going to be more
concerned about health expenditures than countries in the bottom left quadrant. This
assertion can be modified by many other factors, including attitudes towards taxation and
public spending, and the political priority that health has in public policy.
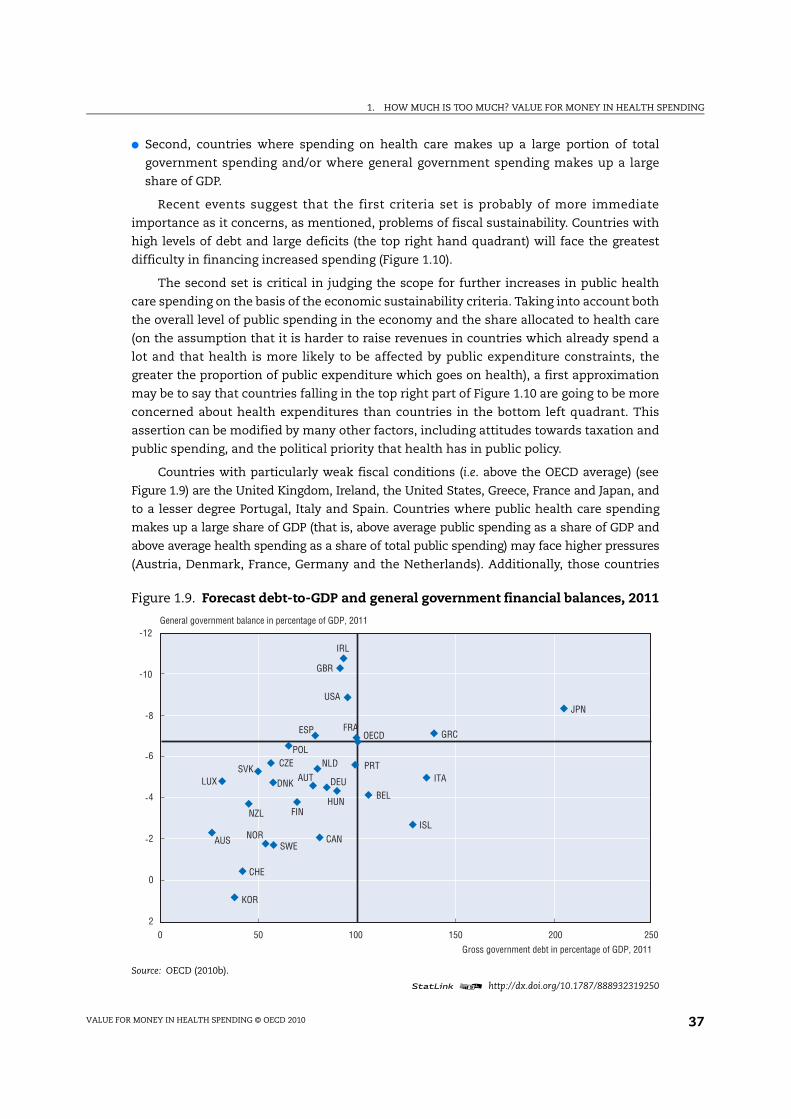
Countries with particularly weak fiscal conditions (i.e. above the OECD average) (see
Figure 1.9) are the United Kingdom, Ireland, the United States, Greece, France and Japan, and
to a lesser degree Portugal, Italy and Spain. Countries where public health care spending
makes up a large share of GDP (that is, above average public spending as a share of GDP and
above average health spending as a share of total public spending) may face higher pressures
(Austria, Denmark, France, Germany and the Netherlands). Additionally, those countries
Figure 1.9. Forecast debt-to-GDP and general government financial balances, 2011
Source: OECD (2010b).
statLink 2 http://dx.doi.org/10.1787/888932319250
AUS
AUT
BEL
CAN
CHE
CZE
DEUDNK
ESP
FIN
FRA
GBR
GRC
HUN
IRL
ISL
ITA
JPN
KOR
LUX
NLD
NOR
NZL
POL
PRTSVK
SWE
USA
OECD
-12
-10
-8
-6
-4
-2
0
2
0 50 100 150 200 250
General government balance in percentage of GDP, 2011
Gross government debt in percentage of GDP, 2011
1. HOW MUCH IS TOO MUCH? VALUE FOR MONEY IN HEALTH SPENDING
VALUE FOR MONEY IN HEALTH SPENDING © OECD 201038
where health spending already accounts for a sizeable share of total public spending may face
a different set of challenges in order to further increase the overall provision for health care.
7. How can we ensure economic sustainability of health systems?
As noted in the introductory paragraphs, the system sustainability and efficiency
objectives are closely linked: making health system more efficient and effective is likely to
be one of the few ways of reconciling rising demand for health care and the public
financing constraints just mentioned. Recent OECD research (Joumard et al., 2008 and 2010)
has examined the degree of inefficiency in OECD health systems and the scope for
productivity gains. Estimates of the degree of health care spending efficiency are based on
health care outcomes defined as those gains in health status that can be attributed to
health care spending. A country is judged to be more efficient than another if it achieves
higher life expectancy for a given level of health care spending, once confounding variables
have been allowed for.
The results suggest that there is considerable scope for efficiency gains across OECD
health systems. Indeed, life expectancy at birth could be raised by more than two years on
average if countries were to become as efficient as the best performers. By way of
comparison, a further increase in health care spending of 10% would increase life
expectancy by only three to four months, holding the degree of measured inefficiency
unchanged. Despite the limitations inherent in macro-level approaches, results are robust
to changes in specification and estimation methods.
Figure 1.10. Public spending on health as a share of total government spending, 2008
1. The statistical data for Israel are supplied by and under the responsibility of the relevant Israeli authorities. Theuse of such data by the OECD is without prejudice to the status of the Golan Heights, East Jerusalem and Israelisettlements in the West Bank under the terms of international law.
Source: OECD (2010a).
statLink 2 http://dx.doi.org/10.1787/888932319269
AUS
AUT
BEL
CAN
CZE
DNK
EST
FIN
FRA
DEU
GRC
HUN
ISL
IRL
ISR1
ITA
JPN
KOR
NLD
NZL
NOR
POL
PRT
SVK
SVN
ESP
SWE
CHE
GBR
USA
OECD
10
12
14
16
18
20
25 30 35 40 45 50 55 60
Public spending on health as a share of total government outlays, 2008 (%)
Total government outlays as a share of GDP, 2008 (%)
1. HOW MUCH IS TOO MUCH? VALUE FOR MONEY IN HEALTH SPENDING
VALUE FOR MONEY IN HEALTH SPENDING © OECD 2010 39
Correlations between overall system (outcome-based) efficiency estimates and
(output-based) efficiency indicators often used for hospitals (e.g. average length of stays
and occupancy rates for hospital acute care beds) are very low. This suggests that medical
outputs can be produced very efficiently in one sub-sector but still have only a limited
impact on the health status of the population. Alternatively such results may imply that
high performance in the in-patient care sector is offset by inefficiencies in other sub-
sectors of the health care system; and/or that co-ordination problems exist across sub-
sectors.
Further tests suggest that overall system efficiency for individual countries are better
correlated with quality of care indicators (such as avoidable admission rates in the in-
patient care sector). Those countries with high levels of productive efficiency tend to be
those with high quality of care, even though the quality of care indicators still does not
have wide country coverage.
Finally, the study examined whether higher measured levels of efficiency were related
to selected institutional arrangements. In this facet of the study, recent work by the OECD
Secretariat (Joumard et al., 2010) has served to identify institutional characteristics
attributable to individual countries and to identify groups of countries with similar
institutional arrangements and market or regulatory incentives (Paris et al., 2009).
The results suggest that no sub-group appears to have consistently better efficiency
outcomes. Indeed, within group differences appeared to be larger than across group
differences in a number of cases. It would thus appear that no single type of health care
system performs systematically better than another in improving the health status of the
population in a cost-effective manner. In practice, OECD countries rely on quite different
mixes of market and non-market regulation and need a range of policies to correct for the
market failures that plague all health care systems. Put another way, the key message for
policy makers is that it may be less the type of system that counts but rather how it is
managed.
8. Conclusions
Health systems are economically sustainable when the benefits of health spending
exceed their costs. But this is not necessarily enough to ensure the overall sustainability of
the system, as sometimes fiscal constraints can be binding. This chapter has shown that
health spending has gone up rapidly in many (but not all) OECD countries in recent years.
Does this mean that they have become economically unsustainable? Although the chapter
makes no attempt to assess the question in any systematic way, “probably not”, is the most
likely answer. Health systems are delivering real improvements in health, in many of the
main dimensions in which we judge health spending – access, quality, responsiveness, and
so on. As long as they continue to deliver such improvements, it will be economically
desirable to meet the future demand for more spending. But in the short term, the sharp
deterioration in the public finances means that fiscal sustainability is a problem in some
countries. Chapter 2 assesses the policy options available to countries to achieve value for
money in health systems in the future, but also what options are open to those countries
that need to control spending for fiscal reasons in the short term.
1. HOW MUCH IS TOO MUCH? VALUE FOR MONEY IN HEALTH SPENDING
VALUE FOR MONEY IN HEALTH SPENDING © OECD 201040
Notes
1. Several alternative frameworks have been developed to assess the performance of health systems,either by defining the level of achievement of a defined set of goals (effectiveness), or by measuringthe link between resources invested in health systems and the attainment of goals (efficiency)(WHO, 2000; Roberts et al., 2004). These frameworks propose different sets of goals or objectives, forthe health system itself, or for health policies but the all broadly reflect the same range of policyconcerns.
2. In practice, public and private spending are closely linked. For example, in countries with cost-sharing arrangements, an increase in public spending on health care will lead, pari passu to a risein private spending as well. To properly understand health spending trends over time and patternsbetween countries, it may be necessary to consider private and public components of expendituretogether. In other words, it can be misleading to treat “private” expenditure as somehowfundamentally different from public expenditure for purposes of broad cross country analysis.
3. It is worth noting that the average shares of spending going to ambulatory and in-patient hospitalcare respectively have remained broadly unchanged over the past decade, despite theabovementioned rise in ambulatory spending in some countries and the need to improveambulatory care for the growing numbers of the chronically ill (Hofmarcher et al., 2007).
4. However, this shift appears to reflect regulatory issues. Public spending in the United States islargely Medicare related and prices are tightly controlled. Thus it is in the interests of hospitals toshift patients to ambulatory care where there are no controls of the price of interventions andincreases in prices for private insurers appear to explain a significant part of this increase.
5. The relations between growth in health care costs and the structure of spending can be complex.While the shift from in-patient care to out-patient is expected to reduce average costs of treatmentthere is no clear relationship between the change in the share of health care spending on hospitalcare in total spending across countries between 1992 and 2007 and the real per capita growth intotal (and public) health care spending over the same period.
6. Data used are for the United States (Newhouse, 1992; and Smith et al., 2009) and for France(Dormont et al., 2006). The time period of the data underlying the estimates are: 1960-90 forNewhouse (1992); 1960 to 2007 for Smith et al. (2009); and 1992 and 2000 for Dormont et al. (2006).Over these periods there was relatively little population ageing.
7. For the studies focusing on the United States, this may reflect the fact that over much of the earlierperiod under study, the baby-boom generation led to a fall in the average age of the US population.
8. Smith et al. (2009) explain that the raw or unadjusted elasticity between real per capita healthspending and real per capita GDP is higher at between 1.4 and 1.7. However, this “expenditureelasticity” reflects not only a pure income effect but also other factors affecting health spendingwhich are correlated with real per capita GDP such as technology, insurance and medical prices. Amodel used to derive an estimate of pure income effect leads to a remaining (partial) expenditureelasticity of 1.0 for 1960-2007. Taking into account medical price inflation (supposed to be higherin rich countries) further lowers the income elasticity to the range of 0.6-0.9 depending on theassumption on medical price inflation.
9. See preceding section on drivers of health care spending. The two main scenarios are referred toas the cost pressure scenario and the cost-containment scenario.
10. The 2009 Ageing Report: Economic and Budgetary Projections for the EU-27 Member States (2008-2060)considered the demand-side effects of demographic change, health status and national income inprojecting public health expenditures. The consideration of technological change based onassumptions used in the OECD projections has a significant effect on the pure demographicscenario to produce projections not dissimilar from the OECD results.
Bibliography
AIHW (2008), “Australia’s Health 2008”, Australian Institute of Health and Welfare.
Castoro, C., L. Bertinato, U. Baccaglini, C.A. Drace and M. McKee (2007), “Policy Brief – Day Surgery:Making it Happen”, World Health Organisation on behalf of the European Observatory on HealthSystems and Policies, Copenhagen.
Colombo, F. and D. Morgan (2006), “Evolution of Health Expenditure in OECD Countries”, Revue françaisedes affaires sociales, April-September.
1. HOW MUCH IS TOO MUCH? VALUE FOR MONEY IN HEALTH SPENDING
VALUE FOR MONEY IN HEALTH SPENDING © OECD 2010 41
Congressional Budget Office (2009), The Long-term Budget Outlook, United States.
Conseil Supérieur des Finances (2009), “Comité d’Étude sur le Vieillissement”, Rapport Annuel,Belgium.
Denison, E.F. (1962), “The Sources of Economic Growth in the United States and the Alternatives BeforeUs”, Committee for Economic Development, New York.
Dormont B., Grignon M. and H. Huber (2006), “Health Expenditure Growth: Reassessing the Threat ofAgeing”, Health Economics, Vol. 15, pp. 947-963.
European Commission (2009), “2009 Ageing Report: Economic and Budgetary Projections for the EU-27Member States (2008-2060)”, Joint Report prepared by the European Commission (DG ECFIN) andthe Economic Policy Committee (AWG).
Federal Finance Administration (2008), “Long-term Sustainability of Public Finances in Switzerland”,Switzerland.
Federal Ministry of Finance (2008), “Second Report on the Sustainability of Public Finances”, Germany.
HM Treasury (2009), “Long-term Public Finance Report: An Analysis of Fiscal Sustainability”,United Kingdom.
Hofmarcher, M.M., H. Oxley et al. (2007), “Improved Health System Performance Through Better CareCoordination”, OECD Health Working Paper, No. 30, OECD Publishing, Paris.
Huber, M. and E. Orosz (2003), “Health Expenditure Trends in OECD Countries, 1990-2001”, Health CareFinancing Review, Vol. 25, pp. 1-22.
Joumard, I., C. André, C. Nicq and O. Chatal (2008), “Health Status Determinants: Lifestyle,Environment, Health Care Resources and Efficiency”, OECD Economics Department Working Paper,No. 627, OECD Publishing, Paris.
Joumard, I., C. André, C. Nicq and O. Chatal (2010), “Health Care Systems: Efficiency and Institutions”,OECD Economics Department Working Paper, No. 769, OECD Publishing, Paris.
McKinsey Global Institute (2008), “Accounting for the Cost of U.S. Health Care: A New Look at WhyAmericans Spend More”, MGI report.
McKinsey Global Institute (2010), “Debt and Deleveraging: The Global Credit Bubble and its EconomicConsequences”.
MHLW (2004), “Future Prospect of Social Security Expenditure and Contributions”, Japan.
Ministero dell’Economia e Delle Finanze (2008), “Le tendenze di medio-lungo periodo del sistemapensionistico e socio-sanitario – aggiornamento 2008”, Ragioneria Generale dello Stato, Italy.
Ministry of Health (2010), “Welfare and Sport/Youth and Families”, the Netherlands.
Newhouse, J.P. (1992), “Medical Care Costs: How Much Welfare Loss?”, Journal of Economic Perspectives,Vol. 6, pp. 3-21.
OECD (2006), “Projecting OECD Health and Long-term Care Expenditures: What Are the Main Drivers?”,OECD Economics Department Working Paper, No. 477, OECD Publishing, Paris.
OECD (2009a), Health at Glance – OECD Indicators, OECD Publishing, Paris.
OECD (2009b), Government at a Glance 2009, OECD Publishing, Paris.
OECD (2010a), OECD Health Data 2010 – Statistics and Indicators for 30 Countries, OECD Publishing, Paris.
OECD (2010b), OECD Economic Outlook, No. 87, OECD Publishing, Paris, June.
Office of the Parliamentary Budget Officer (2010), “Fiscal Sustainability Report”, Canada.
Paris, V., M. Devaux and L. Wei (2009), “Health Systems Institutional Characteristics: A Survey of29 OECD Countries”, OECD Health Working Paper, No. 50, OECD Publishing, Paris.
Rapport du Sénat sur l’assurance maladie (2004), “Les déterminants macroéconomiques des dépensesde santé : comparaison entre quelques pays”, annexe au rapport Vasselle, France.
Roberts, M. et al. (2004), Getting Health Reform Right: A Guide to Improving Performance and Equity, OxfordUniversity Press, New York.
Seong, M.K. (2009), “Forecasting Future Public Health Expenditures in Consideration of PopulationAgeing”, Korean Journal of Health Economics and Policy, Vol. 15 No. 2, pp. 1-20.
1. HOW MUCH IS TOO MUCH? VALUE FOR MONEY IN HEALTH SPENDING
VALUE FOR MONEY IN HEALTH SPENDING © OECD 201042
Smith, S., J. Newhouse and M. Freeland (2009), “Income, Insurance and Technology: Why Does HealthSpending Outpace Economic Growth?”, Health Affairs, pp. 1276-1284.
Thomson, S. et al. (2009), “Addressing Financial Sustainability in Health Systems”, Policy summary forthe Czech European Union Presidency Ministerial Conference on the Financial Sustainability ofHealth Systems in Europe, Copenhagen, WHO Regional Office for Europe on behalf of the EuropeanObservatory on Health Systems and Policies.
Treasurer of the Commonwealth of Australia (2010), “Intergenerational Report, Australia to 2050:Future Challenges”.
WHO (2000), The World Health Report 2000 – Health Systems: Improving Performance, World HealthOrganisation, Geneva.