Embed Size (px)
Citation preview

A snapshot
Section 5: Value for money: are we spending our dollars wisely?
115 Produced by the Strategy and Planning Unit
Section Page
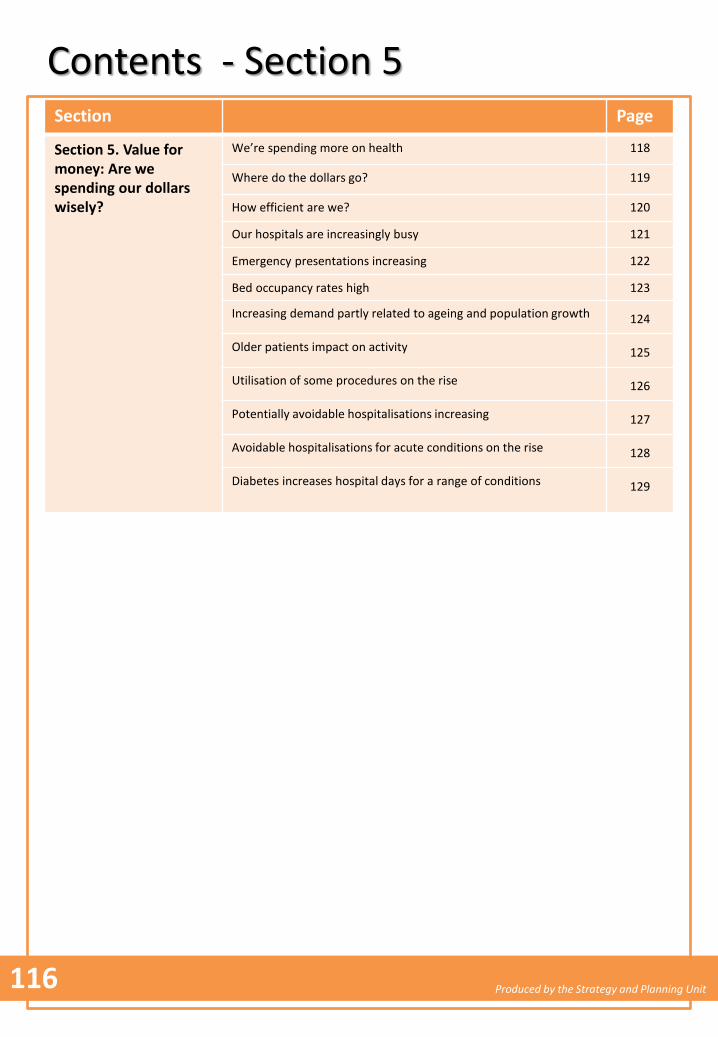
Section 5. Value for money: Are we spending our dollars wisely?
We’re spending more on health 118
Where do the dollars go? 119
How efficient are we? 120
Our hospitals are increasingly busy 121
Emergency presentations increasing 122
Bed occupancy rates high 123
Increasing demand partly related to ageing and population growth 124
Older patients impact on activity 125
Utilisation of some procedures on the rise 126
Potentially avoidable hospitalisations increasing 127
Avoidable hospitalisations for acute conditions on the rise 128
Diabetes increases hospital days for a range of conditions 129
Contents - Section 5
1161
Produced by the Strategy and Planning Unit
5. Value for money: are we spending our dollars wisely?
A c
ase
for
chan
ge?
02
Health expenditure is continuing to rise. Factors contributing to this rise including increasing rates of some chronic conditions and injuries (in particular diabetes and falls injuries); a growing and ageing population; continuing advances in medical treatment and technologies (which have increased life spans); and growing community expectations.
The shift in disease burden from acute to chronic and complex conditions, means that our system, which has historically focused on delivering acute inpatient care on an episodic basis, is struggling to meet the ever increasing demand. Bed occupancy rates are high and too many people are waiting in emergency departments for a bed. Meanwhile, many hospitalisations are avoidable, through improved and better coordinated prevention and care in the community.
Money used inefficiently is money that could have been used to deliver better services, improve people’s well-being and save lives. We have an opportunity to redesign our health system so that patients receive more timely care in the right setting, using the most appropriate interventions, and with that care clearly centred around the needs of patients and families. For people with chronic disease we need to ensure more coordinated and integrated care in the primary and ambulatory care setting.
Partnering with other agencies and service providers provides the opportunity for the District to build healthier communities through focusing efforts on coordinated and targeted primary prevention and early detection strategies.
117 Produced by the Strategy and Planning Unit
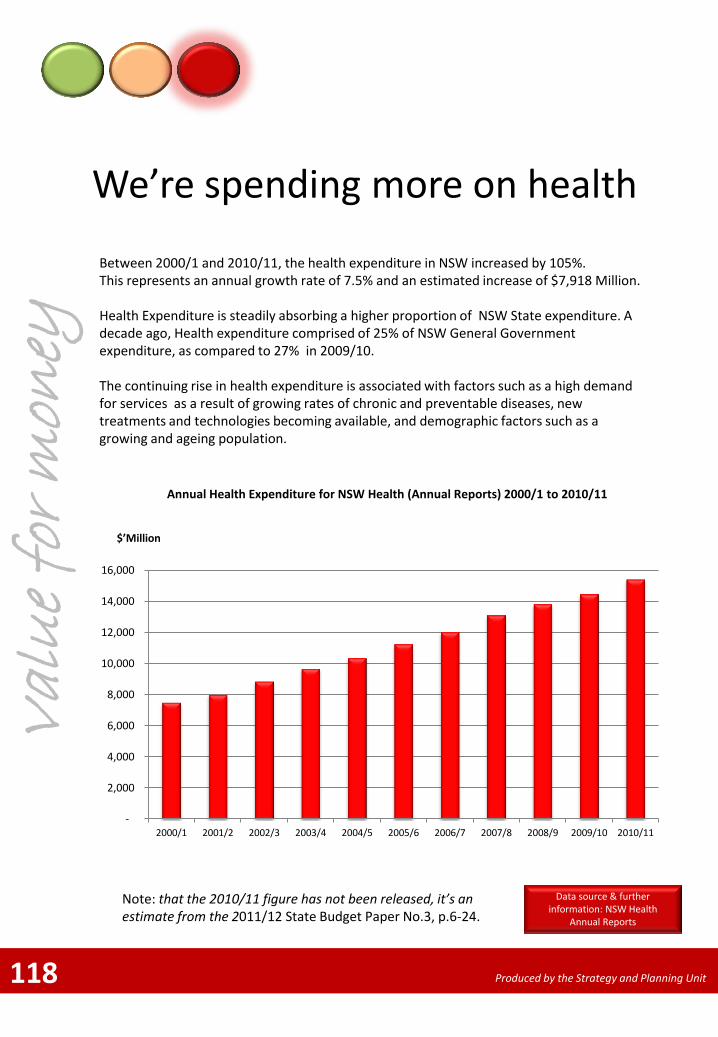
We’re spending more on health
Between 2000/1 and 2010/11, the health expenditure in NSW increased by 105%. This represents an annual growth rate of 7.5% and an estimated increase of $7,918 Million. Health Expenditure is steadily absorbing a higher proportion of NSW State expenditure. A decade ago, Health expenditure comprised of 25% of NSW General Government expenditure, as compared to 27% in 2009/10. The continuing rise in health expenditure is associated with factors such as a high demand for services as a result of growing rates of chronic and preventable diseases, new treatments and technologies becoming available, and demographic factors such as a growing and ageing population.
Val
ue
for
mon
ey
Annual Health Expenditure for NSW Health (Annual Reports) 2000/1 to 2010/11
14
$’Million
118
Data source & further information: NSW Health
Annual Reports
Produced by the Strategy and Planning Unit
Note: that the 2010/11 figure has not been released, it’s an estimate from the 2011/12 State Budget Paper No.3, p.6-24.
-
2,000
4,000
6,000
8,000
10,000
12,000
14,000
16,000
2000/1 2001/2 2002/3 2003/4 2004/5 2005/6 2006/7 2007/8 2008/9 2009/10 2010/11
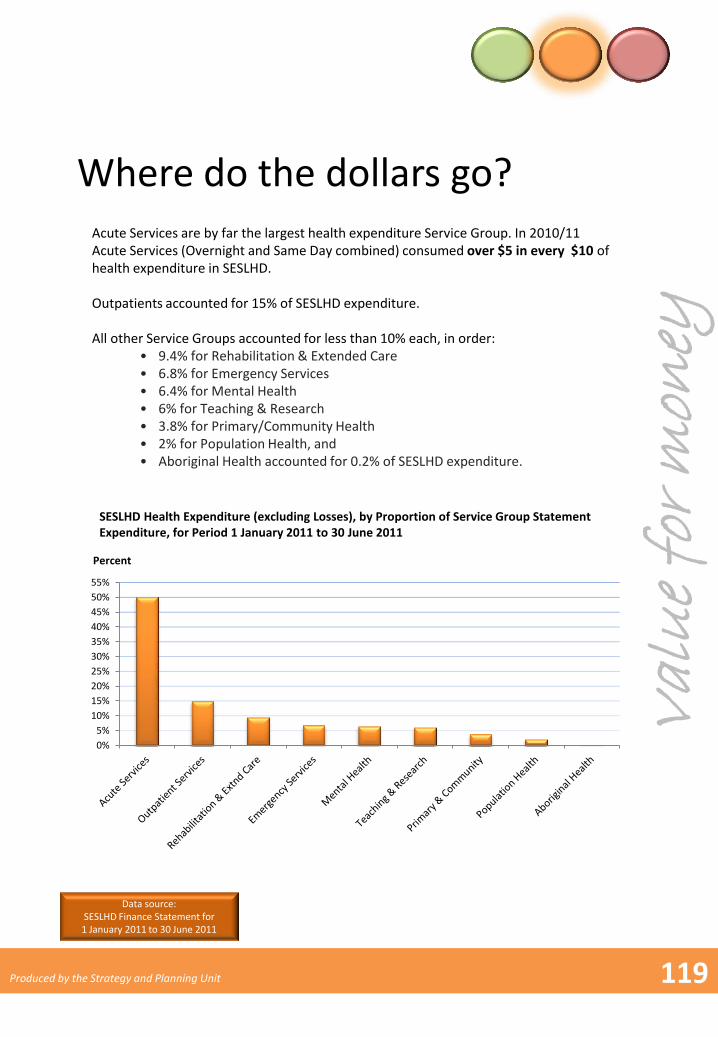
Where do the dollars go? Acute Services are by far the largest health expenditure Service Group. In 2010/11 Acute Services (Overnight and Same Day combined) consumed over $5 in every $10 of health expenditure in SESLHD. Outpatients accounted for 15% of SESLHD expenditure. All other Service Groups accounted for less than 10% each, in order:
• 9.4% for Rehabilitation & Extended Care • 6.8% for Emergency Services • 6.4% for Mental Health • 6% for Teaching & Research • 3.8% for Primary/Community Health • 2% for Population Health, and • Aboriginal Health accounted for 0.2% of SESLHD expenditure.
SESLHD Health Expenditure (excluding Losses), by Proportion of Service Group Statement Expenditure, for Period 1 January 2011 to 30 June 2011
Val
ue
for
mon
ey
119
Percent
Data source: SESLHD Finance Statement for 1 January 2011 to 30 June 2011
Produced by the Strategy and Planning Unit
0%
5%
10%
15%
20%
25%
30%
35%
40%
45%
50%
55%
How efficient are we?
Data source: SESLHD Health System Performance Report – August 2011
120
Val
ue
for
mon
ey
Produced by the Strategy and Planning Unit
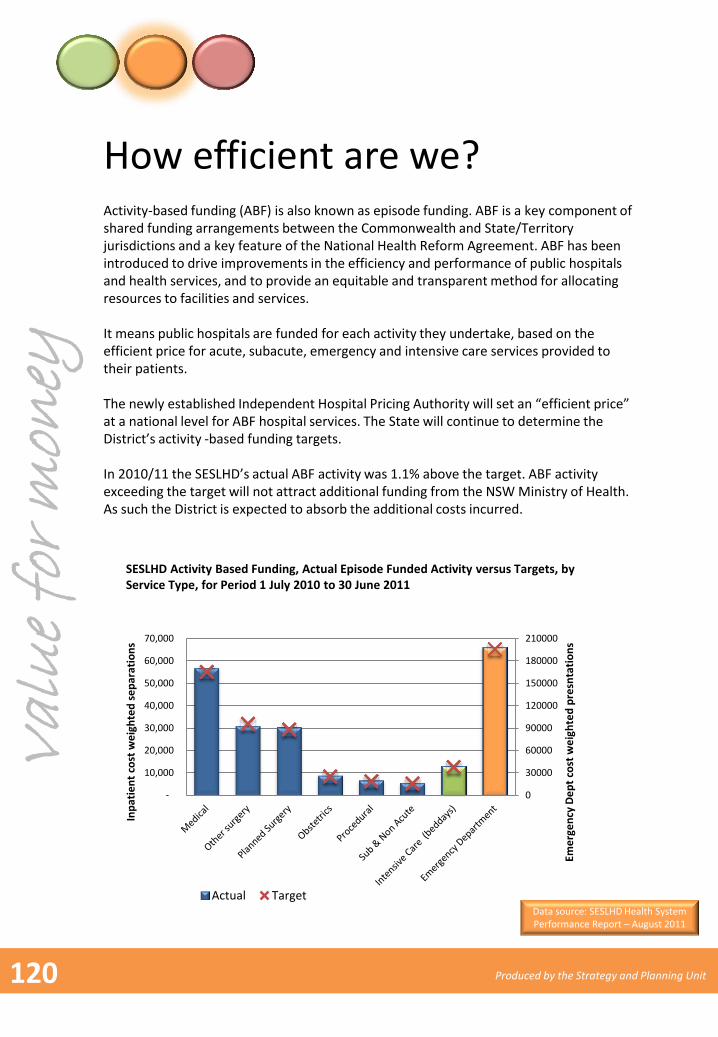
Activity-based funding (ABF) is also known as episode funding. ABF is a key component of shared funding arrangements between the Commonwealth and State/Territory jurisdictions and a key feature of the National Health Reform Agreement. ABF has been introduced to drive improvements in the efficiency and performance of public hospitals and health services, and to provide an equitable and transparent method for allocating resources to facilities and services. It means public hospitals are funded for each activity they undertake, based on the efficient price for acute, subacute, emergency and intensive care services provided to their patients. The newly established Independent Hospital Pricing Authority will set an “efficient price” at a national level for ABF hospital services. The State will continue to determine the District’s activity -based funding targets. In 2010/11 the SESLHD’s actual ABF activity was 1.1% above the target. ABF activity exceeding the target will not attract additional funding from the NSW Ministry of Health. As such the District is expected to absorb the additional costs incurred.
SESLHD Activity Based Funding, Actual Episode Funded Activity versus Targets, by Service Type, for Period 1 July 2010 to 30 June 2011
0
30000
60000
90000
120000
150000
180000
210000
-
10,000
20,000
30,000
40,000
50,000
60,000
70,000
Eme
rge
ncy
De
pt
cost
we
igh
ted
pre
snta
tio
ns
Inp
atie
nt
cost
we
igh
ted
se
par
atio
ns
Actual Target
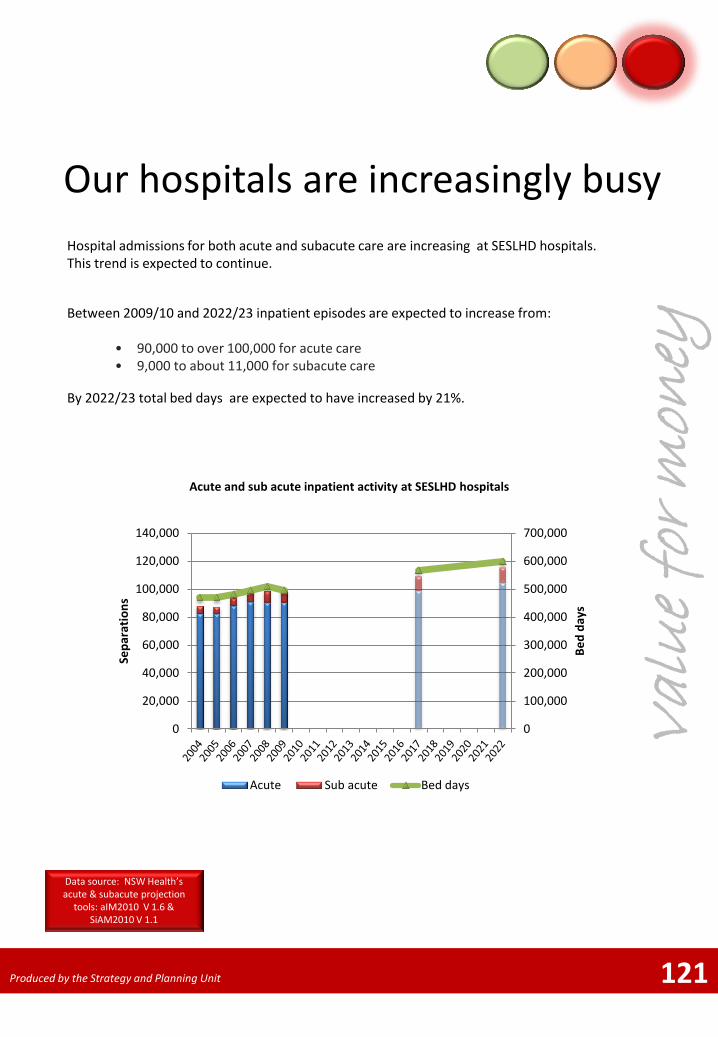
Our hospitals are increasingly busy
Hospital admissions for both acute and subacute care are increasing at SESLHD hospitals. This trend is expected to continue.
121
Acute and sub acute inpatient activity at SESLHD hospitals
Between 2009/10 and 2022/23 inpatient episodes are expected to increase from:
• 90,000 to over 100,000 for acute care • 9,000 to about 11,000 for subacute care
By 2022/23 total bed days are expected to have increased by 21%.
Val
ue
for
mon
ey
Data source: NSW Health’s acute & subacute projection
tools: aIM2010 V 1.6 & SiAM2010 V 1.1
0
100,000
200,000
300,000
400,000
500,000
600,000
700,000
0
20,000
40,000
60,000
80,000
100,000
120,000
140,000
Be
d d
ays
Se
par
atio
ns
Acute Sub acute Bed days
Produced by the Strategy and Planning Unit
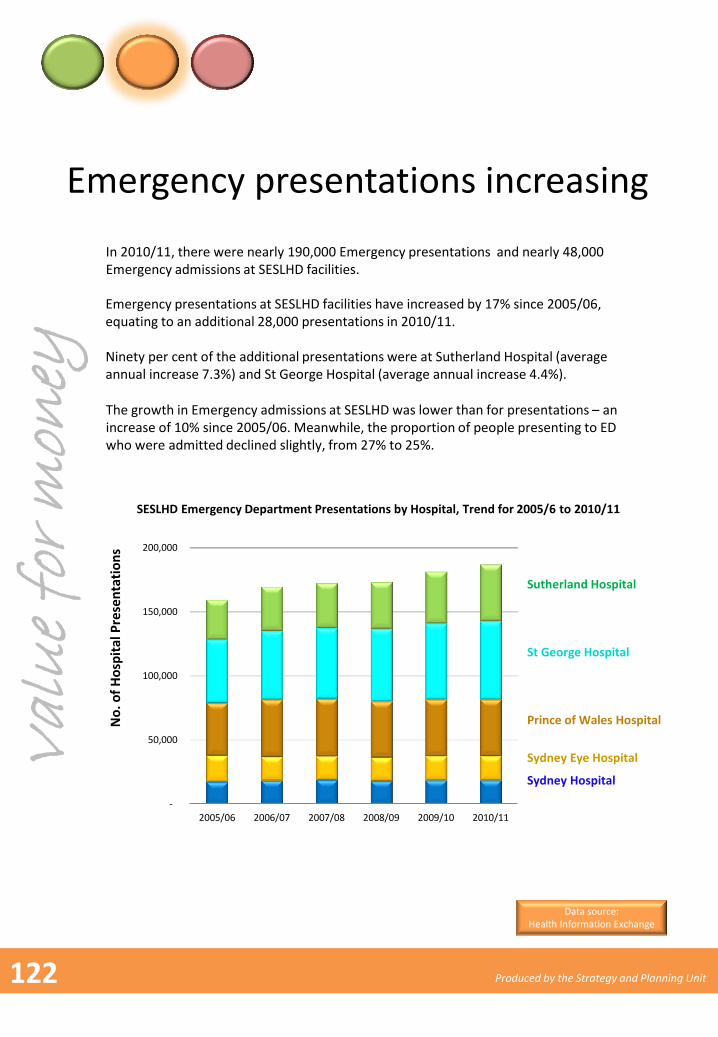
Emergency presentations increasing
13
Emergency presentations at SESLHD facilities have increased by 17% since 2005/06, equating to an additional 28,000 presentations in 2010/11. Ninety per cent of the additional presentations were at Sutherland Hospital (average annual increase 7.3%) and St George Hospital (average annual increase 4.4%).
No
. of
Ho
spit
al P
rese
nta
tio
ns
SESLHD Emergency Department Presentations by Hospital, Trend for 2005/6 to 2010/11
-
50,000
100,000
150,000
200,000
2005/06 2006/07 2007/08 2008/09 2009/10 2010/11
In 2010/11, there were nearly 190,000 Emergency presentations and nearly 48,000 Emergency admissions at SESLHD facilities.
The growth in Emergency admissions at SESLHD was lower than for presentations – an increase of 10% since 2005/06. Meanwhile, the proportion of people presenting to ED who were admitted declined slightly, from 27% to 25%.
Data source: Health Information Exchange
Val
ue
for
mon
ey
Sydney Hospital
Sydney Eye Hospital
Prince of Wales Hospital
St George Hospital
Sutherland Hospital
122 Produced by the Strategy and Planning Unit
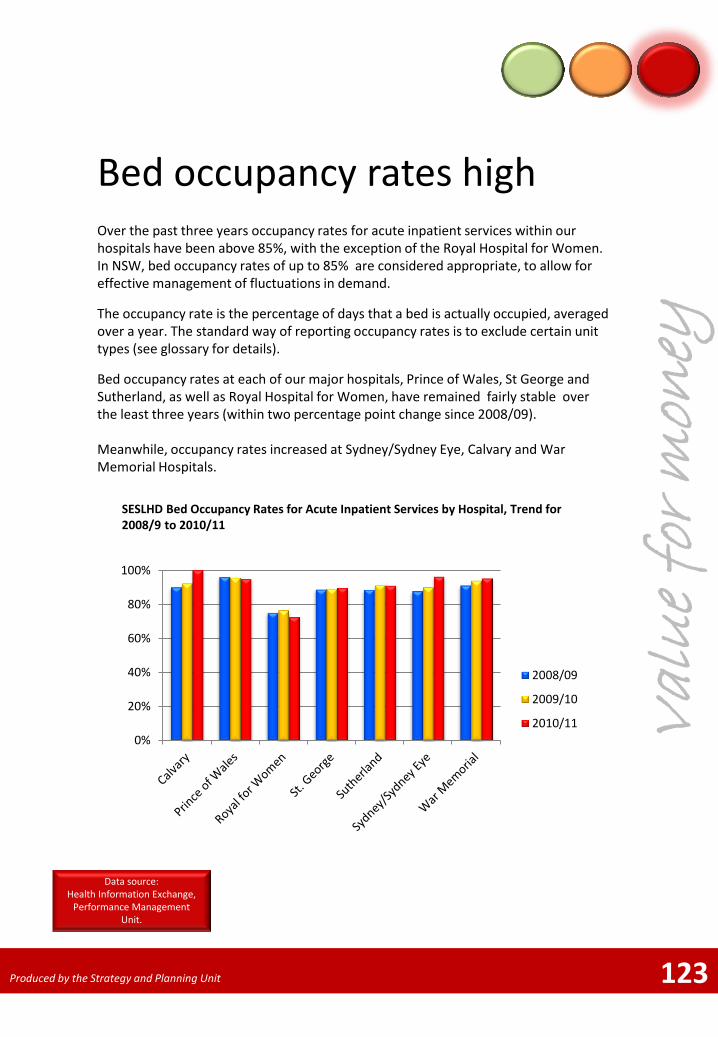
Bed occupancy rates high Over the past three years occupancy rates for acute inpatient services within our hospitals have been above 85%, with the exception of the Royal Hospital for Women. In NSW, bed occupancy rates of up to 85% are considered appropriate, to allow for effective management of fluctuations in demand.
The occupancy rate is the percentage of days that a bed is actually occupied, averaged over a year. The standard way of reporting occupancy rates is to exclude certain unit types (see glossary for details).
Bed occupancy rates at each of our major hospitals, Prince of Wales, St George and Sutherland, as well as Royal Hospital for Women, have remained fairly stable over the least three years (within two percentage point change since 2008/09). Meanwhile, occupancy rates increased at Sydney/Sydney Eye, Calvary and War Memorial Hospitals.
10
Val
ue
for
mon
ey
123
Data source: Health Information Exchange,
Performance Management Unit.
Produced by the Strategy and Planning Unit
0%
20%
40%
60%
80%
100%
2008/09
2009/10
2010/11
SESLHD Bed Occupancy Rates for Acute Inpatient Services by Hospital, Trend for 2008/9 to 2010/11
11
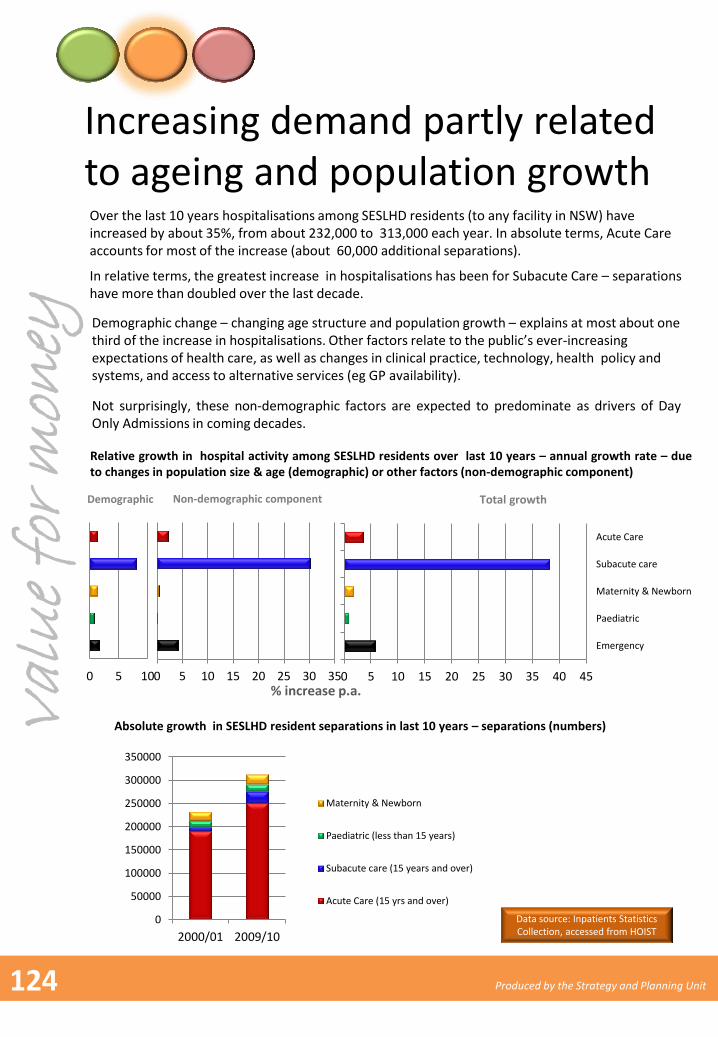
Increasing demand partly related to ageing and population growth Over the last 10 years hospitalisations among SESLHD residents (to any facility in NSW) have increased by about 35%, from about 232,000 to 313,000 each year. In absolute terms, Acute Care accounts for most of the increase (about 60,000 additional separations).
Relative growth in hospital activity among SESLHD residents over last 10 years – annual growth rate – due to changes in population size & age (demographic) or other factors (non-demographic component)
Data source: Inpatients Statistics Collection, accessed from HOIST
In relative terms, the greatest increase in hospitalisations has been for Subacute Care – separations have more than doubled over the last decade.
0 5 10
Demographic
0 5 10 15 20 25 30 35
Non-demographic component
0
50000
100000
150000
200000
250000
300000
350000
2000/01 2009/10
Maternity & Newborn
Paediatric (less than 15 years)
Subacute care (15 years and over)
Acute Care (15 yrs and over)
Absolute growth in SESLHD resident separations in last 10 years – separations (numbers)
% increase p.a. 0 5 10 15 20 25 30 35 40 45
Emergency
Paediatric
Maternity & Newborn
Subacute care
Acute Care
Total growth
Demographic change – changing age structure and population growth – explains at most about one third of the increase in hospitalisations. Other factors relate to the public’s ever-increasing expectations of health care, as well as changes in clinical practice, technology, health policy and systems, and access to alternative services (eg GP availability).
Not surprisingly, these non-demographic factors are expected to predominate as drivers of Day Only Admissions in coming decades.
Val
ue
for
mon
ey
124 Produced by the Strategy and Planning Unit
Older patients impact on activity
Val
ue
for
mon
ey
125
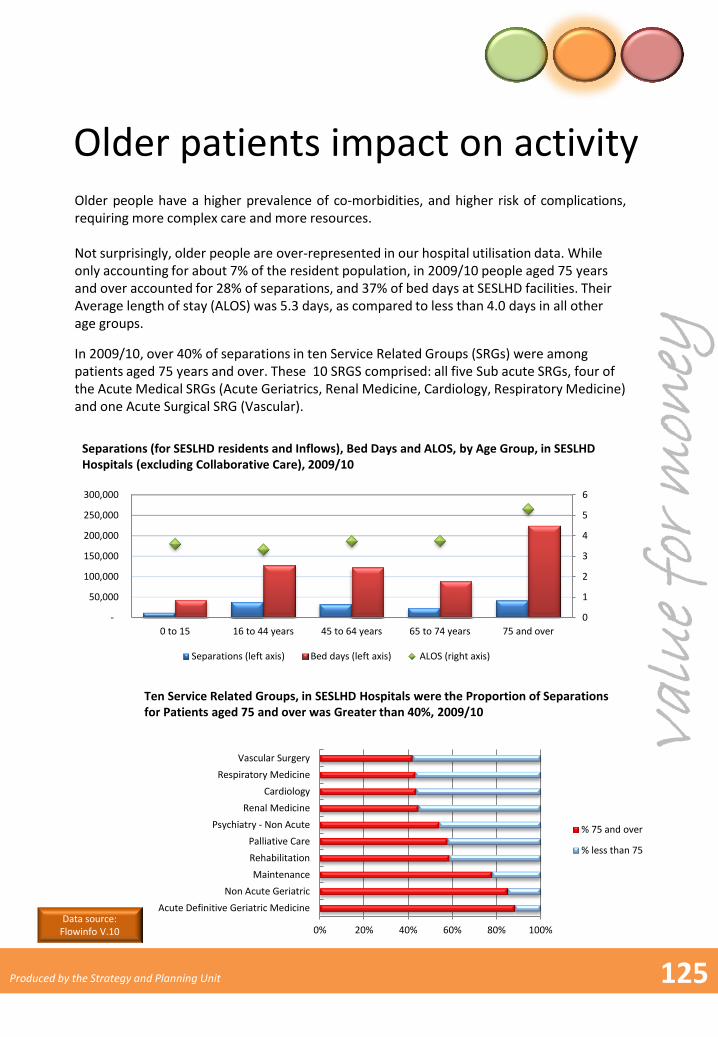
Older people have a higher prevalence of co-morbidities, and higher risk of complications, requiring more complex care and more resources. Not surprisingly, older people are over-represented in our hospital utilisation data. While only accounting for about 7% of the resident population, in 2009/10 people aged 75 years and over accounted for 28% of separations, and 37% of bed days at SESLHD facilities. Their Average length of stay (ALOS) was 5.3 days, as compared to less than 4.0 days in all other age groups.
In 2009/10, over 40% of separations in ten Service Related Groups (SRGs) were among patients aged 75 years and over. These 10 SRGS comprised: all five Sub acute SRGs, four of the Acute Medical SRGs (Acute Geriatrics, Renal Medicine, Cardiology, Respiratory Medicine) and one Acute Surgical SRG (Vascular).
0
1
2
3
4
5
6
-
50,000
100,000
150,000
200,000
250,000
300,000
0 to 15 16 to 44 years 45 to 64 years 65 to 74 years 75 and over
Separations (left axis) Bed days (left axis) ALOS (right axis)
Separations (for SESLHD residents and Inflows), Bed Days and ALOS, by Age Group, in SESLHD Hospitals (excluding Collaborative Care), 2009/10
Ten Service Related Groups, in SESLHD Hospitals were the Proportion of Separations for Patients aged 75 and over was Greater than 40%, 2009/10
0% 20% 40% 60% 80% 100%
Acute Definitive Geriatric Medicine
Non Acute Geriatric
Maintenance
Rehabilitation
Palliative Care
Psychiatry - Non Acute
Renal Medicine
Cardiology
Respiratory Medicine
Vascular Surgery
% 75 and over
% less than 75
Data source: Flowinfo V.10
Produced by the Strategy and Planning Unit
Utilisation of some procedures on the rise
10
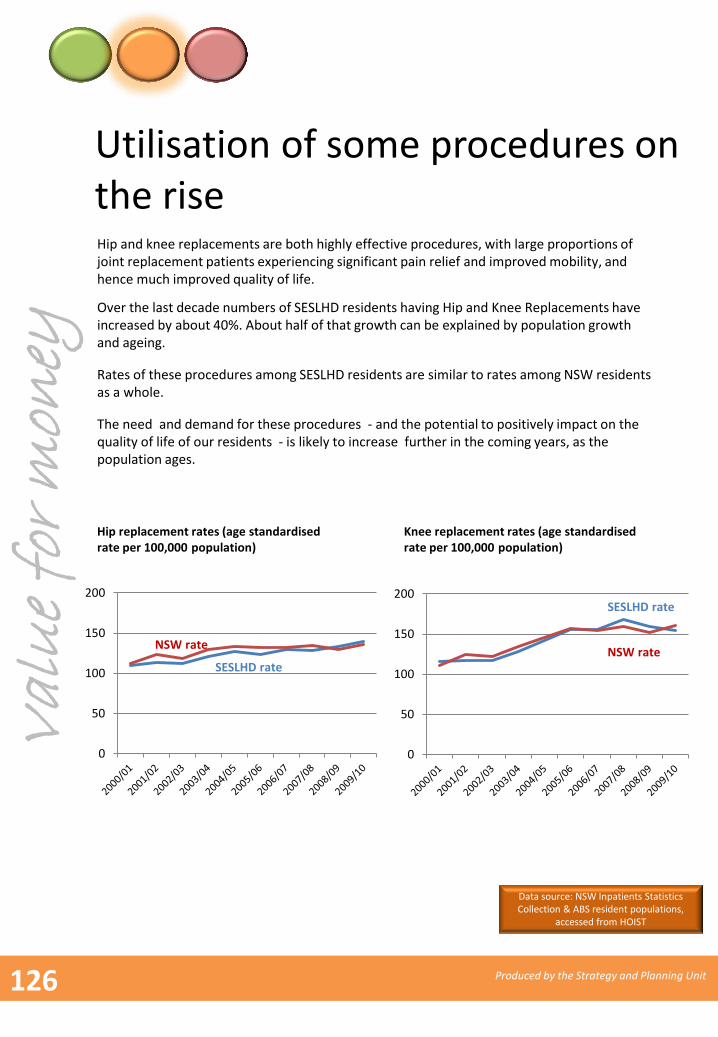
Over the last decade numbers of SESLHD residents having Hip and Knee Replacements have increased by about 40%. About half of that growth can be explained by population growth and ageing.
Hip replacement rates (age standardised rate per 100,000 population)
Rates of these procedures among SESLHD residents are similar to rates among NSW residents as a whole.
Knee replacement rates (age standardised rate per 100,000 population)
0
50
100
150
200
0
50
100
150
200SESLHD rate
NSW rate
Hip and knee replacements are both highly effective procedures, with large proportions of joint replacement patients experiencing significant pain relief and improved mobility, and hence much improved quality of life.
SESLHD rate
NSW rate
The need and demand for these procedures - and the potential to positively impact on the quality of life of our residents - is likely to increase further in the coming years, as the population ages.
Val
ue
for
mon
ey
Data source: NSW Inpatients Statistics Collection & ABS resident populations,
accessed from HOIST
126 Produced by the Strategy and Planning Unit
Potentially avoidable hospitalisations increasing
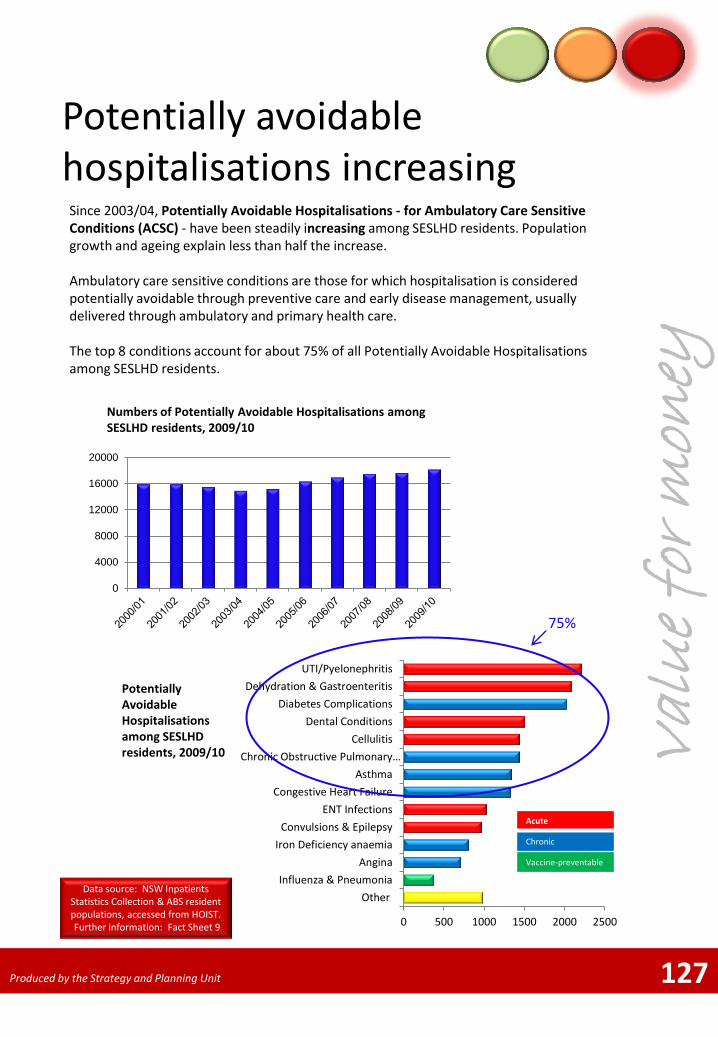
Since 2003/04, Potentially Avoidable Hospitalisations - for Ambulatory Care Sensitive Conditions (ACSC) - have been steadily increasing among SESLHD residents. Population growth and ageing explain less than half the increase. Ambulatory care sensitive conditions are those for which hospitalisation is considered potentially avoidable through preventive care and early disease management, usually delivered through ambulatory and primary health care. The top 8 conditions account for about 75% of all Potentially Avoidable Hospitalisations among SESLHD residents.
Numbers of Potentially Avoidable Hospitalisations among SESLHD residents, 2009/10
127
0
4000
8000
12000
16000
20000
Potentially Avoidable Hospitalisations among SESLHD residents, 2009/10
0 500 1000 1500 2000 2500
Other
Influenza & Pneumonia
Angina
Iron Deficiency anaemia
Convulsions & Epilepsy
ENT Infections
Congestive Heart Failure
Asthma
Chronic Obstructive Pulmonary…
Cellulitis
Dental Conditions
Diabetes Complications
Dehydration & Gastroenteritis
UTI/Pyelonephritis
75%
Acute
Chronic
Vaccine-preventable
Val
ue
for
mon
ey
Data source: NSW Inpatients Statistics Collection & ABS resident populations, accessed from HOIST. Further information: Fact Sheet 9
Produced by the Strategy and Planning Unit
Avoidable hospitalisations for acute conditions on the rise
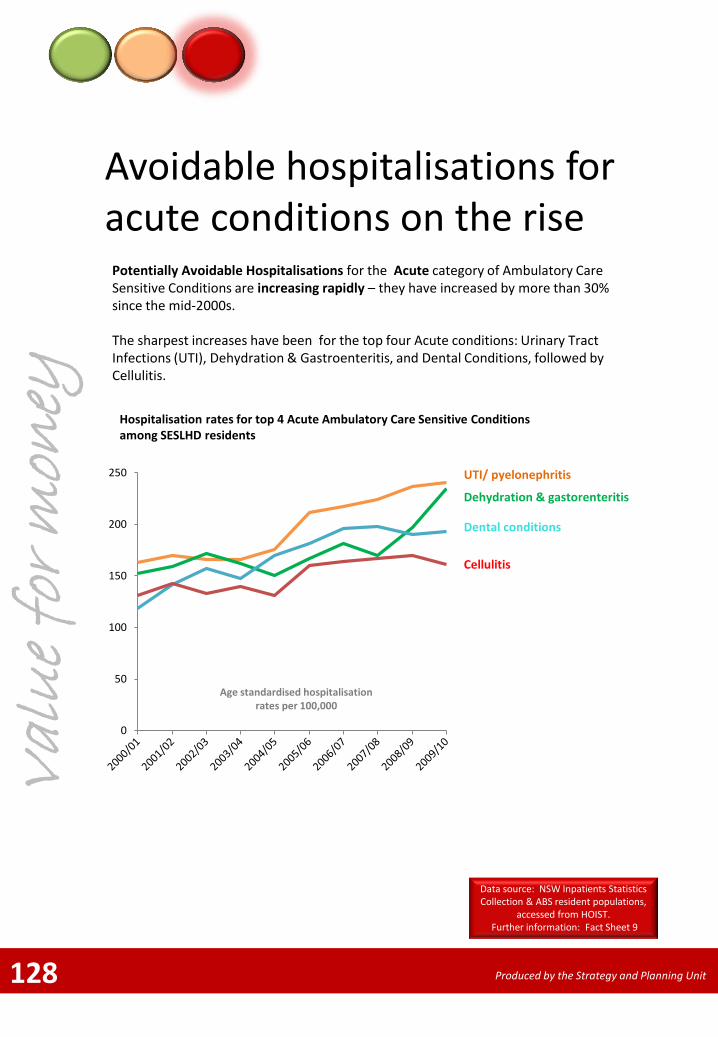
The sharpest increases have been for the top four Acute conditions: Urinary Tract Infections (UTI), Dehydration & Gastroenteritis, and Dental Conditions, followed by Cellulitis.
0
50
100
150
200
250
128
Potentially Avoidable Hospitalisations for the Acute category of Ambulatory Care Sensitive Conditions are increasing rapidly – they have increased by more than 30% since the mid-2000s.
Age standardised hospitalisation rates per 100,000
Hospitalisation rates for top 4 Acute Ambulatory Care Sensitive Conditions among SESLHD residents
UTI/ pyelonephritis
Dehydration & gastorenteritis
Dental conditions
Cellulitis
Val
ue
for
mon
ey
Data source: NSW Inpatients Statistics Collection & ABS resident populations,
accessed from HOIST. Further information: Fact Sheet 9
Produced by the Strategy and Planning Unit
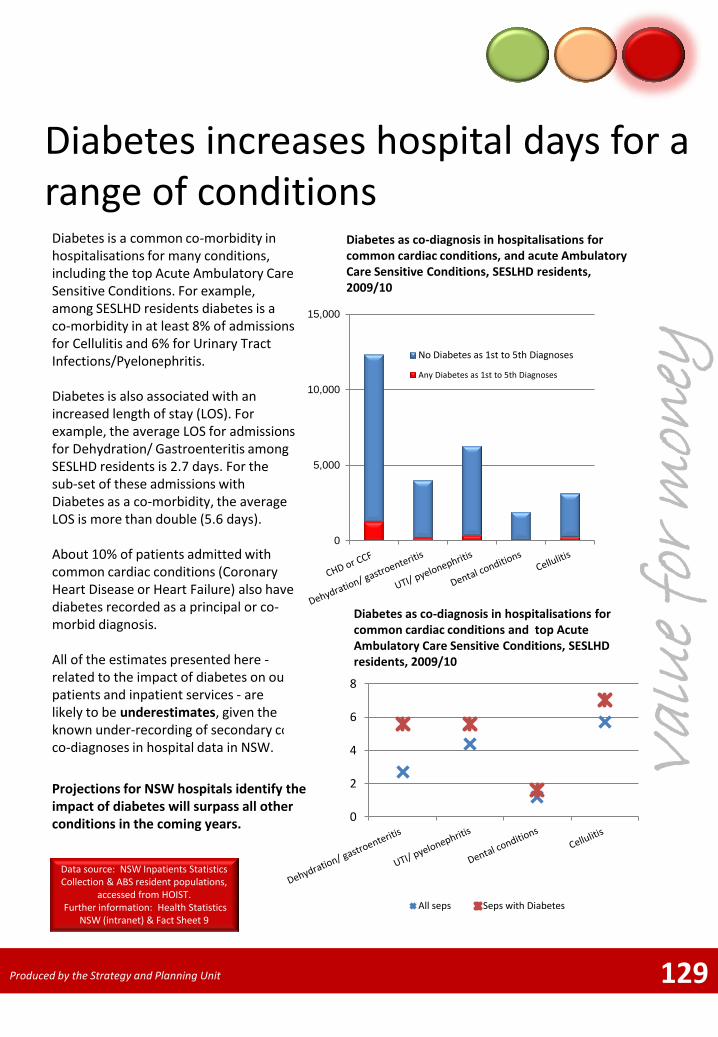
Diabetes increases hospital days for a range of conditions
Diabetes is a common co-morbidity in hospitalisations for many conditions, including the top Acute Ambulatory Care Sensitive Conditions. For example, among SESLHD residents diabetes is a co-morbidity in at least 8% of admissions for Cellulitis and 6% for Urinary Tract Infections/Pyelonephritis. Diabetes is also associated with an increased length of stay (LOS). For example, the average LOS for admissions for Dehydration/ Gastroenteritis among SESLHD residents is 2.7 days. For the sub-set of these admissions with Diabetes as a co-morbidity, the average LOS is more than double (5.6 days). About 10% of patients admitted with common cardiac conditions (Coronary Heart Disease or Heart Failure) also have diabetes recorded as a principal or co-morbid diagnosis. All of the estimates presented here - related to the impact of diabetes on our patients and inpatient services - are likely to be underestimates, given the known under-recording of secondary co co-diagnoses in hospital data in NSW.
129
Diabetes as co-diagnosis in hospitalisations for common cardiac conditions, and acute Ambulatory Care Sensitive Conditions, SESLHD residents, 2009/10
Val
ue
for
mon
ey
0
5,000
10,000
15,000
No Diabetes as 1st to 5th Diagnoses
Any Diabetes as 1st to 5th Diagnoses
0
2
4
6
8
All seps Seps with Diabetes
Diabetes as co-diagnosis in hospitalisations for common cardiac conditions and top Acute Ambulatory Care Sensitive Conditions, SESLHD residents, 2009/10
Projections for NSW hospitals identify the impact of diabetes will surpass all other conditions in the coming years.
Data source: NSW Inpatients Statistics Collection & ABS resident populations,
accessed from HOIST. Further information: Health Statistics
NSW (intranet) & Fact Sheet 9
Produced by the Strategy and Planning Unit
130 Produced by the Strategy and Planning Unit