Embed Size (px)
Citation preview
Value capture:options, challengesand opportunities forVictoriaTechnical AppendixAdvice to Infrastructure Victoria
October 2016

NOTICE
The results of Ernst & Young’s (“EY”) work, including the assumptions and qualifications made in preparing thereport, are set out in EY's report completed 11 October 2016 ("Report"). The Report should be read in its entiretyincluding the transmittal letter, the applicable scope of the work and any limitations. A reference to the Reportincludes any part of the Report. No further work has been undertaken by EY since the date of the Report to updateit.
EY has prepared the Report for the benefit of Infrastructure Victoria (“Client”) in accordance with our engagementagreement dated 6 June 2016 and has considered only the interests of the Client. EY has not been engaged toact, and has not acted, as advisor to any other party with respect to this report. Accordingly, EY makes norepresentations as to the appropriateness, accuracy or completeness of the Report for any other party's purposes.
EY has prepared this project analysis in conjunction with, and relying on information provided by the Client andother industry stakeholders. We do not imply, and it should not be construed that we have performed audit or duediligence procedures on any of the information provided to us. We have not independently verified, or accept anyresponsibility or liability for independently verifying, any such information nor do we make any representation asto the accuracy or completeness of the information. We accept no liability for any loss or damage, which mayresult from your reliance on any research, analyses or information so supplied.
This Report does not constitute or claim to represent a comprehensive cost-benefit analysis, and is only designedto provide an indicative and high level assessment of the potential value capture opportunities on a range ofdifferent scenarios. Further, it is important to note that the identification of economic impact and contribution isnot a precise science.
No reliance may be placed upon the Report or any of its contents by any recipient of the Report for any purposeand any party receiving a copy of the Report must make and rely on their own enquiries in relation to the issues towhich the Report relates, the contents of the Report and all matters arising from or relating to or in any wayconnected with the Report or its contents.
EY disclaims all responsibility to any other party for any loss or liability that the other party may suffer or incurarising from or relating to or in any way connected with the contents of the Report, the provision of the Report tothe other party or the reliance upon the Report by the other party.
No claim or demand or any actions or proceedings may be brought against EY arising from or connected with thecontents of the Report or the provision of the Report to any party. EY will be released and forever discharged fromany such claims, demands, actions or proceedings.
EY has consented to the Report being published electronically on the Infrastructure Victoria website forinformational purposes only. EY has not consented to distribution or disclosure beyond this. The materialcontained in the Report, including the EY logo, is copyright and copyright in the Report itself vests in InfrastructureVictoria. The Report, including the EY logo, cannot be altered without prior written permission from EY.
EY’s liability is limited by a scheme approved under Professional Standards Legislation.
Infrastructure VictoriaValue capture: options, challenges and opportunities for Victoria – Technical appendix EY ÷ i
Table of contents
Executive Summary ................................................................................................................. 1Value capture approach, infrastructure options and mechanism design .................................... 1Evaluation results ................................................................................................................ 2
1. Introduction .................................................................................................................. 41.1 Background ............................................................................................................. 41.2 Purpose of this report .............................................................................................. 4
2. Value capture funding mechanisms ................................................................................. 52.1 Value capture: A ‘beneficiary pays’ funding approach.................................................. 52.2 Overview of value capture mechanisms ..................................................................... 52.3 Value capture funding in Victoria’s current tax and planning system............................. 92.4 Funding vs financing .............................................................................................. 11
3. Approach to the analysis of value capture for selected future scenarios ........................... 133.1 Project and value capture mechanism selection ........................................................ 133.2 Approach to the quantitative analysis ...................................................................... 21
4. Melbourne Metro 2 ...................................................................................................... 244.1 Project description and inputs ................................................................................. 244.2 Background research ............................................................................................. 254.3 Benefits ................................................................................................................ 274.4 Mechanisms .......................................................................................................... 324.5 Modelling approach and other assumptions .............................................................. 344.6 Results and assessment.......................................................................................... 35
5. Outer Metropolitan Ring Road ....................................................................................... 395.1 Project description and inputs ................................................................................. 395.2 Background research ............................................................................................. 395.3 Benefits ................................................................................................................ 405.4 Mechanisms .......................................................................................................... 415.5 Approach and key assumptions ............................................................................... 425.6 Results and assessment.......................................................................................... 43
6. Rezoning of industrial land near a train station ............................................................... 456.1 Project description and inputs ................................................................................. 456.2 Background research ............................................................................................. 456.3 Benefits ................................................................................................................ 466.4 Mechanisms .......................................................................................................... 466.5 Approach and key assumptions ............................................................................... 466.6 Results and assessment.......................................................................................... 47
7. Public housing asset rationalisation and refurbishment ................................................... 487.1 Project description and inputs ................................................................................. 487.2 Benefits ................................................................................................................ 487.3 Mechanisms .......................................................................................................... 497.4 Approach and key assumptions ............................................................................... 497.5 Results and assessment.......................................................................................... 49
8. Major hospital redevelopment ....................................................................................... 518.1 Project description and inputs ................................................................................. 51
Infrastructure VictoriaValue capture: options, challenges and opportunities for Victoria – Technical appendix EY ÷ ii
8.2 Background research ............................................................................................. 518.3 Benefits ................................................................................................................ 518.4 Mechanisms .......................................................................................................... 528.5 Approach and key assumptions ............................................................................... 538.6 Results and assessment.......................................................................................... 53
9. Commitment to a new school in an urban growth area .................................................... 559.1 Project description and inputs ................................................................................. 559.2 Background research ............................................................................................. 559.3 Benefits ................................................................................................................ 559.4 Mechanisms .......................................................................................................... 569.5 Approach and key assumptions ............................................................................... 579.6 Results and assessment.......................................................................................... 57
Appendix 1. Australian and international case studies .............................................................. 59Victorian examples ............................................................................................................. 59Other Australian examples .................................................................................................. 62Examples in the United Kingdom.......................................................................................... 63Examples in the United States ............................................................................................. 67Other examples.................................................................................................................. 68
Appendix 2. Value capture funding in Victoria’s current tax and planning system ........................ 73
Bibliography ......................................................................................................................... 80
Infrastructure VictoriaValue capture: options, challenges and opportunities for Victoria – Technical appendix EY ÷ 1
Executive Summary
This study considered the strategic options to enhance the way value capture is used to supportchanges to the planning system and to fund infrastructure projects in Victoria, which includedassessing mechanisms to take a beneficiary pays approach to planning and development and toextend value capture so that a broader set of beneficiaries can make a more meaningful fundingcontribution.
Value capture approach, infrastructure options and mechanismdesignIn considering the role of value capture in funding high priority infrastructure projects, it wasdetermined that the application of value capture should be decided on a case-by-case basis acrossall infrastructure sectors when there is a clear nexus between planning changes and infrastructuredelivery with material value gains for landowners and developers.
An assortment of revenue mechanisms, including developer contributions (i.e. charges and otherdevelopment contributions), betterment levies and development rights and leases, were designedand assessed for case studies and scenarios based on options being considered by InfrastructureVictoria in its draft 30-year infrastructure strategy. The case studies and scenarios consideredinclude:
· Melbourne Metro 2 (public transport)
· Outer metropolitan ring road (road transport)
· Rezoning of industrial land near a train station (planning)
· Public housing asset rationalisation and refurbishment (housing)
· Major hospital redevelopment (health)
· Commitment to a new school in an urban growth area (education).
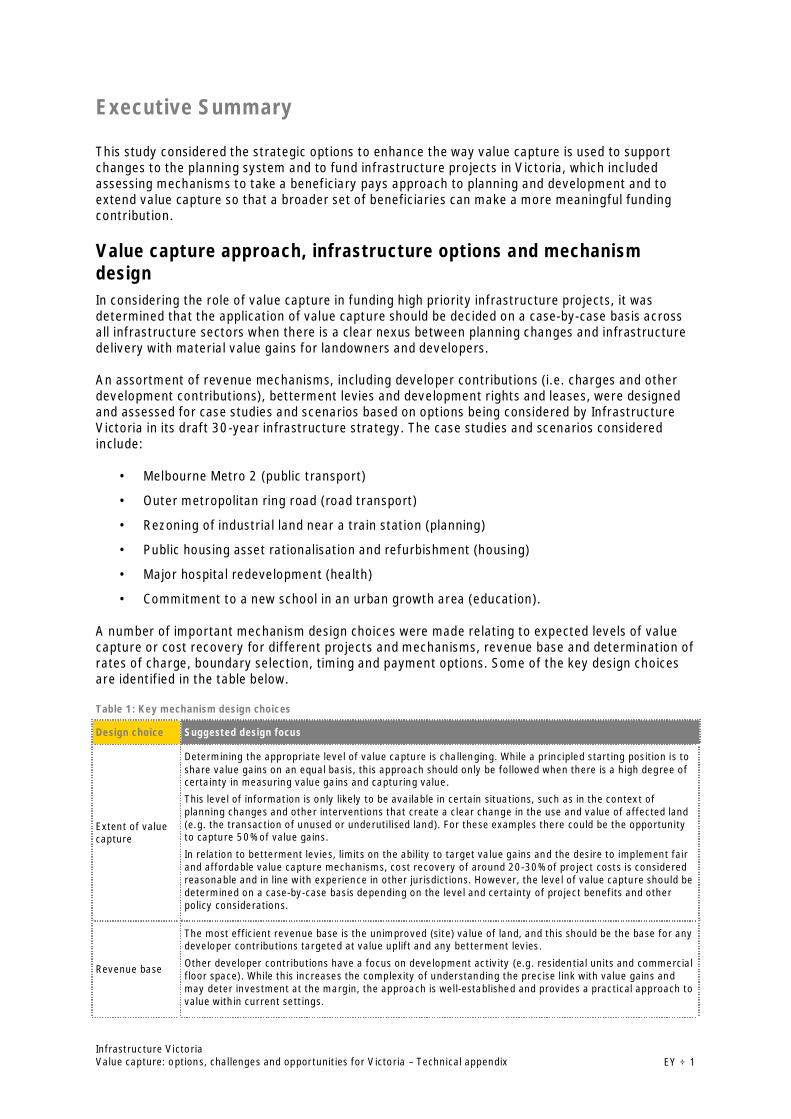
A number of important mechanism design choices were made relating to expected levels of valuecapture or cost recovery for different projects and mechanisms, revenue base and determination ofrates of charge, boundary selection, timing and payment options. Some of the key design choicesare identified in the table below.
Table 1: Key mechanism design choices
Design choice Suggested design focus
Extent of valuecapture
Determining the appropriate level of value capture is challenging. While a principled starting position is toshare value gains on an equal basis, this approach should only be followed when there is a high degree ofcertainty in measuring value gains and capturing value.This level of information is only likely to be available in certain situations, such as in the context ofplanning changes and other interventions that create a clear change in the use and value of affected land(e.g. the transaction of unused or underutilised land). For these examples there could be the opportunityto capture 50% of value gains.
In relation to betterment levies, limits on the ability to target value gains and the desire to implement fairand affordable value capture mechanisms, cost recovery of around 20-30% of project costs is consideredreasonable and in line with experience in other jurisdictions. However, the level of value capture should bedetermined on a case-by-case basis depending on the level and certainty of project benefits and otherpolicy considerations.
Revenue base
The most efficient revenue base is the unimproved (site) value of land, and this should be the base for anydeveloper contributions targeted at value uplift and any betterment levies.
Other developer contributions have a focus on development activity (e.g. residential units and commercialfloor space). While this increases the complexity of understanding the precise link with value gains andmay deter investment at the margin, the approach is well-established and provides a practical approach tovalue within current settings.
Infrastructure VictoriaValue capture: options, challenges and opportunities for Victoria – Technical appendix EY ÷ 2
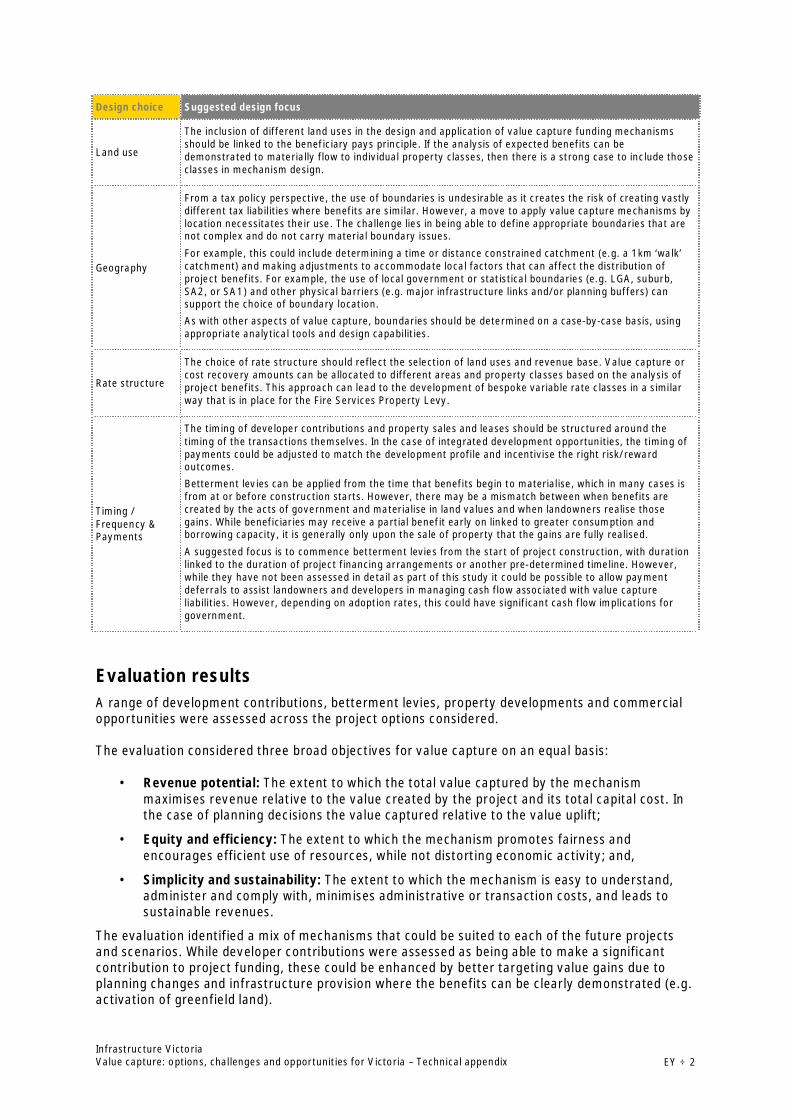
Design choice Suggested design focus
Land use
The inclusion of different land uses in the design and application of value capture funding mechanismsshould be linked to the beneficiary pays principle. If the analysis of expected benefits can bedemonstrated to materially flow to individual property classes, then there is a strong case to include thoseclasses in mechanism design.
Geography
From a tax policy perspective, the use of boundaries is undesirable as it creates the risk of creating vastlydifferent tax liabilities where benefits are similar. However, a move to apply value capture mechanisms bylocation necessitates their use. The challenge lies in being able to define appropriate boundaries that arenot complex and do not carry material boundary issues.
For example, this could include determining a time or distance constrained catchment (e.g. a 1km ‘walk’catchment) and making adjustments to accommodate local factors that can affect the distribution ofproject benefits. For example, the use of local government or statistical boundaries (e.g. LGA, suburb,SA2, or SA1) and other physical barriers (e.g. major infrastructure links and/or planning buffers) cansupport the choice of boundary location.As with other aspects of value capture, boundaries should be determined on a case-by-case basis, usingappropriate analytical tools and design capabilities.
Rate structure
The choice of rate structure should reflect the selection of land uses and revenue base. Value capture orcost recovery amounts can be allocated to different areas and property classes based on the analysis ofproject benefits. This approach can lead to the development of bespoke variable rate classes in a similarway that is in place for the Fire Services Property Levy.
Timing /Frequency &Payments
The timing of developer contributions and property sales and leases should be structured around thetiming of the transactions themselves. In the case of integrated development opportunities, the timing ofpayments could be adjusted to match the development profile and incentivise the right risk/rewardoutcomes.Betterment levies can be applied from the time that benefits begin to materialise, which in many cases isfrom at or before construction starts. However, there may be a mismatch between when benefits arecreated by the acts of government and materialise in land values and when landowners realise thosegains. While beneficiaries may receive a partial benefit early on linked to greater consumption andborrowing capacity, it is generally only upon the sale of property that the gains are fully realised.
A suggested focus is to commence betterment levies from the start of project construction, with durationlinked to the duration of project financing arrangements or another pre-determined timeline. However,while they have not been assessed in detail as part of this study it could be possible to allow paymentdeferrals to assist landowners and developers in managing cash flow associated with value captureliabilities. However, depending on adoption rates, this could have significant cash flow implications forgovernment.
Evaluation resultsA range of development contributions, betterment levies, property developments and commercialopportunities were assessed across the project options considered.
The evaluation considered three broad objectives for value capture on an equal basis:
· Revenue potential: The extent to which the total value captured by the mechanismmaximises revenue relative to the value created by the project and its total capital cost. Inthe case of planning decisions the value captured relative to the value uplift;
· Equity and efficiency: The extent to which the mechanism promotes fairness andencourages efficient use of resources, while not distorting economic activity; and,
· Simplicity and sustainability: The extent to which the mechanism is easy to understand,administer and comply with, minimises administrative or transaction costs, and leads tosustainable revenues.
The evaluation identified a mix of mechanisms that could be suited to each of the future projectsand scenarios. While developer contributions were assessed as being able to make a significantcontribution to project funding, these could be enhanced by better targeting value gains due toplanning changes and infrastructure provision where the benefits can be clearly demonstrated (e.g.activation of greenfield land).
Infrastructure VictoriaValue capture: options, challenges and opportunities for Victoria – Technical appendix EY ÷ 3
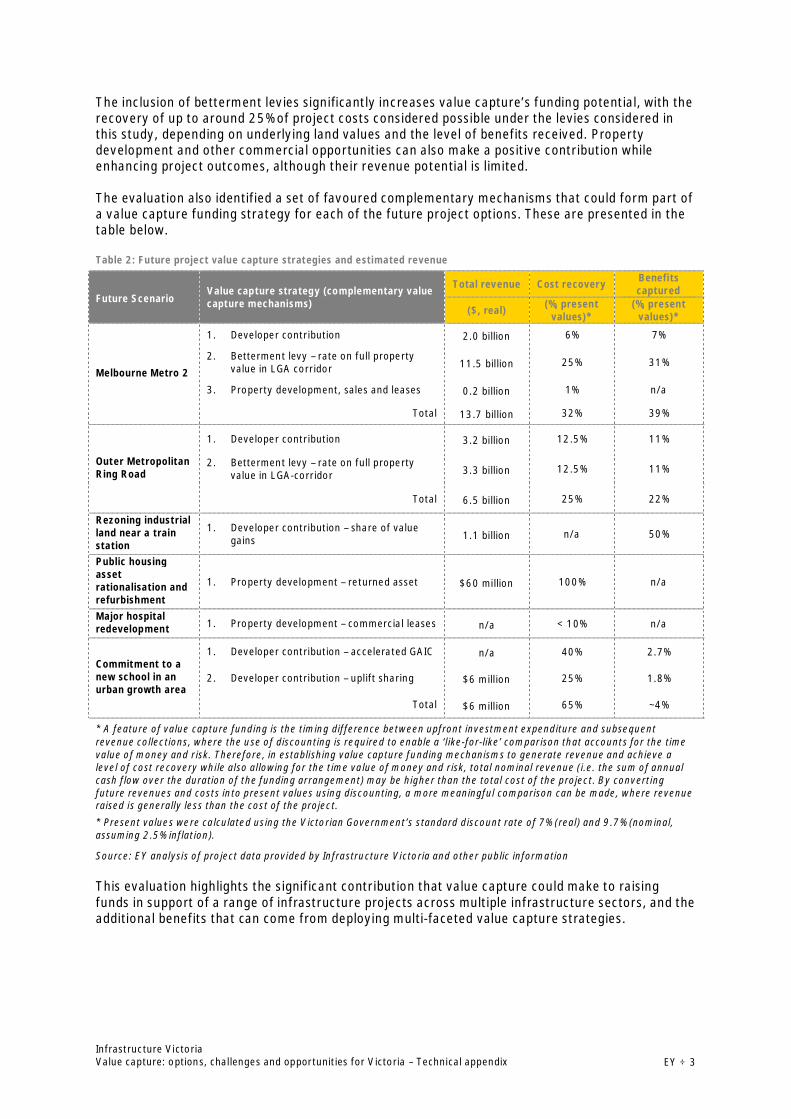
The inclusion of betterment levies significantly increases value capture’s funding potential, with therecovery of up to around 25% of project costs considered possible under the levies considered inthis study, depending on underlying land values and the level of benefits received. Propertydevelopment and other commercial opportunities can also make a positive contribution whileenhancing project outcomes, although their revenue potential is limited.
The evaluation also identified a set of favoured complementary mechanisms that could form part ofa value capture funding strategy for each of the future project options. These are presented in thetable below.
Table 2: Future project value capture strategies and estimated revenue
Future ScenarioValue capture strategy (complementary valuecapture mechanisms)
Total revenue Cost recovery Benefitscaptured
($, real) (%, presentvalues)*
(%, presentvalues)*
Melbourne Metro 2
1. Developer contribution 2.0 billion 6% 7%
2. Betterment levy – rate on full propertyvalue in LGA corridor 11.5 billion 25% 31%
3. Property development, sales and leases 0.2 billion 1% n/a
Total 13.7 billion 32% 39%
Outer MetropolitanRing Road
1. Developer contribution 3.2 billion 12.5% 11%
2. Betterment levy – rate on full propertyvalue in LGA-corridor 3.3 billion 12.5% 11%
Total 6.5 billion 25% 22%
Rezoning industrialland near a trainstation
1. Developer contribution – share of valuegains 1.1 billion n/a 50%
Public housingassetrationalisation andrefurbishment
1. Property development – returned asset $60 million 100% n/a
Major hospitalredevelopment 1. Property development – commercial leases n/a < 10% n/a
Commitment to anew school in anurban growth area
1. Developer contribution – accelerated GAIC n/a 40% 2.7%
2. Developer contribution – uplift sharing $6 million 25% 1.8%
Total $6 million 65% ~4%
* A feature of value capture funding is the timing difference between upfront investment expenditure and subsequentrevenue collections, where the use of discounting is required to enable a ‘like-for-like’ comparison that accounts for the timevalue of money and risk. Therefore, in establishing value capture funding mechanisms to generate revenue and achieve alevel of cost recovery while also allowing for the time value of money and risk, total nominal revenue (i.e. the sum of annualcash flow over the duration of the funding arrangement) may be higher than the total cost of the project. By convertingfuture revenues and costs into present values using discounting, a more meaningful comparison can be made, where revenueraised is generally less than the cost of the project.* Present values were calculated using the Victorian Government’s standard discount rate of 7% (real) and 9.7% (nominal,assuming 2.5% inflation).
Source: EY analysis of project data provided by Infrastructure Victoria and other public information
This evaluation highlights the significant contribution that value capture could make to raisingfunds in support of a range of infrastructure projects across multiple infrastructure sectors, and theadditional benefits that can come from deploying multi-faceted value capture strategies.
Infrastructure VictoriaValue capture: options, challenges and opportunities for Victoria – Technical appendix EY ÷ 4
1. Introduction
1.1 BackgroundInfrastructure Victoria (IV) has engaged EY to examine the strengths and weaknesses of the variousvalue capture funding options as applied in Victoria and elsewhere and in the context of futureinfrastructure project case studies or scenarios.
To undertake this project EY has reviewed literature on the value created by infrastructure and onapproaches used to capture this value, and has conducted modelling to illustrate the potential landvalue uplift created by a range of prospective Victorian investments, and the revenue potential andimpacts of various value capture mechanisms tailored to each future project case study.
The analysis and modelling of options, challenges and opportunities considers a range of sectors,not just transport and planning. While user charges are noted as a value capture fundingmechanism, EY understands user charges (such as transport network pricing) are the subject of aseparate analysis and discussion paper being undertaken by IV and are not covered here.
1.2 Purpose of this reportThe purpose of this report is to:
· Outline lessons learnt from the review of Victorian and other jurisdictions’ application ofvalue capture funding mechanisms
· Review the impact of infrastructure investment on property values in Victoria and otherjurisdictions to inform analysis and modelling of potential value capture funding options ormechanisms
· Analyse value capture funding options for a selection of future projects and scenarios
· Outline the approach, evaluation criteria, assumptions and modelling results for applyingvalue capture options and funding mechanisms for a selection of future projects andscenarios
· Assess value capture funding options and funding mechanisms in line with the evaluationcriteria.
Infrastructure VictoriaValue capture: options, challenges and opportunities for Victoria – Technical appendix EY ÷ 5
2. Value capture funding mechanisms
2.1 Value capture: A ‘beneficiary pays’ funding approach‘Value capture’ is an umbrella term, covering a range of revenue mechanisms with a common goal –that of funding projects from beneficiaries rather than from taxpayers in general. Value capturedoes not refer to any particular type of tax, levy, or other mechanism, but describes the spectrumof mechanisms that can be used to enact a funding model in which beneficiaries contribute morefunding towards projects they benefit from. This includes user pays mechanisms, developer chargesand contributions, targeted and broad-based betterment levies, property development rights, assetsales or leases, major beneficiary contributions, and other non-land taxes or levies.
The key distinction between a value capture funding approach and general revenue raising is thatvalue capture refers to targeted beneficiary funding, where there is a connection between benefitsreceived and funding contributions. As such, value capture is grounded in the beneficiary principleof taxation – that “people should pay tax broadly in accordance with the benefits they receive fromgovernment spending”.1
All infrastructure and services have a locational dimension, where the benefits that favour certainareas over others will eventually become capitalised into land values. A pragmatic focus oncapturing value created therefore focuses on property values and recouping project benefits at thepoint where they materialise as land value uplift.
While the focus has narrowed around land value capture there is no single or best practice policy orapproach for how value capture should be implemented. For instance, there is a threshold choicearound the role of value capture – whether as a cost recovery tool or as an approach to benefitcapture regardless of the cost of investment, with the latter approach also lending itself to valuecapture in the context of planning decisions that transfer significant value gains to privatelandowners.
There are also choices around mechanism design to meet the objectives of any value capturepolicy, involving important trade-offs in terms of beneficiary targeting, revenue potential,efficiency, fairness and simplicity.
Another way of understanding what a value capture funding model can achieve is to see it as‘closing the loop’ between a project, its beneficiaries, and its funding. A value capture fundingmodel prevents so much publicly-funded benefit leaking into land values. It thereby avoids therelative inequity and economic inefficiency of general taxation, and provides the opportunity tosupport infrastructure funding by either growing budget capacity or linking a new revenue sourcedirectly to a project through some form of revenue hypothecation, with the latter approachincreasing the transparency of funding and expenditure but reducing the flexibility to manage riskswithin the budget.
2.2 Overview of value capture mechanismsValue capture or beneficiary pays principles have been enacted across a wide range of jurisdictionsin numerous different ways. Many aspects of the local context have influenced how value capturehas been put into place – factors such as the legislative powers available to the jurisdiction, thestructure of broader tax systems, political influences and the power of vested interests, revenueneeds, the motivations driving policy, and numerous historical factors.
There are numerous variants but also some common features in the mechanisms used elsewhere.
1 Australia’s Future Tax System review, Consultation Paper, p33p
Infrastructure VictoriaValue capture: options, challenges and opportunities for Victoria – Technical appendix EY ÷ 6
For the task of assessing mechanisms suitable for the Victorian infrastructure context, it isimportant to set aside the specifics of the designs applying elsewhere to examine the essentialunderlying features of each mechanism.
Putting aside user charges there are five broad categories of value capture mechanisms, including:
· Developer contributions
· Land betterment levies
· Property development, asset sales, or leases
· Major beneficiary contributions
· Non-land mechanisms
The defining features of each of these categories, and some of the important variations of each, areoutlined below.
2.2.1 Developer contributions
Developer contributions (also referred to as developer charges or development contributions) arepayments made by property developers as a condition of development permission (or as a conditionof re-zoning preceding development). Payments are often directly linked to infrastructure costsresulting from development, i.e. a cost-recovery focus (as per the Development Contributions Plansystem). Sometimes they are not linked tightly to costs, or are explicitly designed with a benefit-capture focus (as in ACT’s Lease Variation Charges).
Developer contributions can take different forms, depending on the legislative instrument applied.However, the essential feature of developer contributions is that payments (in cash or voluntary‘works-in-kind’) are one-off and only apply to land undergoing development.
In Victoria the Planning and Environment Act 1987 allows for developer contributions to becollected through planning system when changes are made to planning schemes or through theprovision of planning and building permits. Specific mechanisms used in Victoria include DeveloperContributions Plans (DCPs), voluntary agreements (under section 173 of the Planning andEnvironment Act 1987) and the Growth Areas Infrastructure Charge (GAIC), which is a contributionscheme designed to help fund infrastructure in Melbourne's growth areas.
2.2.2 Land betterment levies
Land betterment levies are special taxes paid by all landowners (not just on land undergoingredevelopment) in a defined project or benefit area as a means of capturing a portion of land valuegains that accrue to properties because of a government investment or policy change.
Betterment levies can be one-off but are usually recurrent (e.g. annual) and set to recover aspecific value gain or share of infrastructure cost over the life of the mechanism.
Betterment levies involve a series of design choices that can have a significant bearing on theextent of value capture and other equity and efficiency considerations. For example, at a high level,three important variants are identified with different characteristics, including levies based on landor property value, levies set at a flat rate or area rate, and levies based on value uplift to moreclosely match land value gains.
In Victoria betterment levies were established to fund the Melbourne Underground Rail Loop, withcontributions sought through the City of Melbourne and the MMBW. However, pressures led to thephasing out of the charges and the cost of the project was ultimately funded by the Victorian StateGovernment (see case studies).
Infrastructure VictoriaValue capture: options, challenges and opportunities for Victoria – Technical appendix EY ÷ 7
In the Victorian context there are a range of state and local government mechanisms that could beused or strengthened as value capture mechanisms. At the state level this includes possible use orenhancement of land tax, stamp duty and Urban Renewal Authority mechanisms. At the localgovernment level this includes use or enhancement of council rating mechanisms.
2.2.3 Property development, asset sales, or leases
Sale of property development rights, sale of land, and leases can go hand-in-hand with thedevelopment of various forms of economic and social infrastructure. The aim of these approachesto value capture is to integrate and generate funding from commercial uses of government landand assets.
This can include the physical integration of commercial opportunities with the infrastructure beingdelivered and operated, or could include realising the gains from the sale of assets to fund otherinfrastructure and services.
The sale of development rights includes instances where space is created alongside or aboveinfrastructure, with common examples in the transport sector including ‘air rights’ above or next torail lines or stations (e.g. Southern Cross Station redevelopment, Burke Road level crossingremoval). Other sectors can also provide for these opportunities. For instance, the delivery andoperation of health and education facilities can involve the co-location of similar commercialbusinesses or sub-letting/selling land for alternative uses to create integrated community precincts.These opportunities can arise as new infrastructure is being planned, as well as through the re-modelling and refurbishment of existing assets, including where opportunities to rationalise andconsolidate assets may be available.
Other asset sales or leases, such as the planned lease of the Port of Melbourne, provide anothermeans of harnessing the value created through the commercial operation of state assets. Thesesales create a means of funding ongoing investment in infrastructure to meet growing industryneeds, as well as to raise revenue to recover the cost of these large legacy investments to raisefunds for other community infrastructure.
An essential feature is that these mechanisms are contract-based (not compulsory taxes) that aremost often triggered around the same time the infrastructure is being procured and delivered. Thisprovides a close timing match between possible funding and investment expenditure.
2.2.4 Major beneficiary contributions
Governments sometimes seek payments from major beneficiaries (e.g. airports, major employers,landowners) to secure and fund infrastructure, with payments generally negotiated between theGovernment the private parties.
For example, the funding of the Crossrail project in London includes major contributions from theCanary Wharf Group, Heathrow Airport, and Berkeley Homes. The contributions from the CanaryWharf Group include around £150m to part-fund the construction of a new Crossrail station atCanary Wharf, with the other £350m being provided by the government and a condition that theCanary Wharf Group will fund any additional costs incurred over the £500m fixed price limit given itis responsible for designing and building the new station. The owner of Heathrow Airport was tocontribute around £230m to the cost of the project, which will provide direct connections to theairport. However, this was reduced to around £70m by the airports regulator in recognition ofother capacity issues affecting the airport.2
2.2.5 Non-land mechanisms
It could be possible to impose levies on other (non-land) taxes as a form of value capture funding,with levies on payroll tax, motor vehicle registrations or fuel excises possible examples.
2 http://www.crossrail.co.uk/about-us/funding
Infrastructure VictoriaValue capture: options, challenges and opportunities for Victoria – Technical appendix EY ÷ 8
There are limited examples of these forms of tax levies being introduced as value capture funding inother jurisdictions, and it is questionable whether these mechanisms can be sufficiently targetedtoward capturing private value gains created by infrastructure projects.
However, one prominent example is the use of payroll tax levies to fund transport infrastructure inFrance, where the benefits of agglomeration in cities are used to justify the incidence of the levy onbusinesses subject to the tax. For example, this was used successfully in the funding of the RER railnetwork in Paris.3
2.2.6 Mechanisms summary
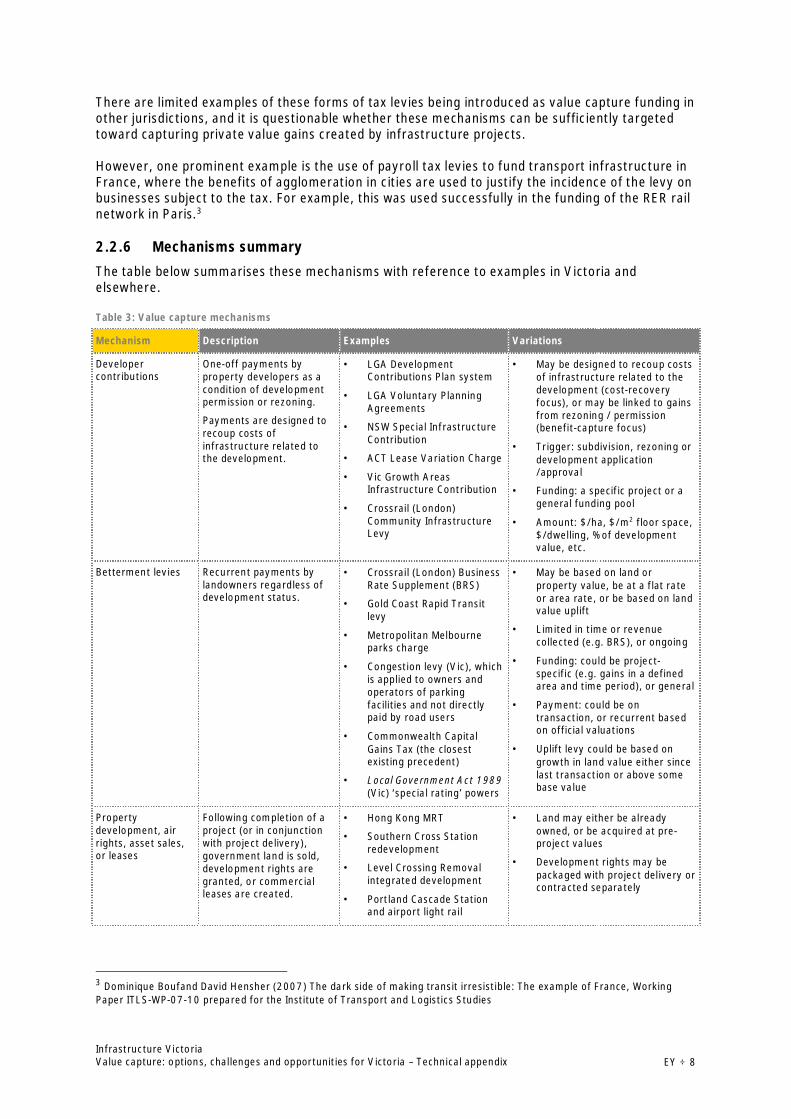
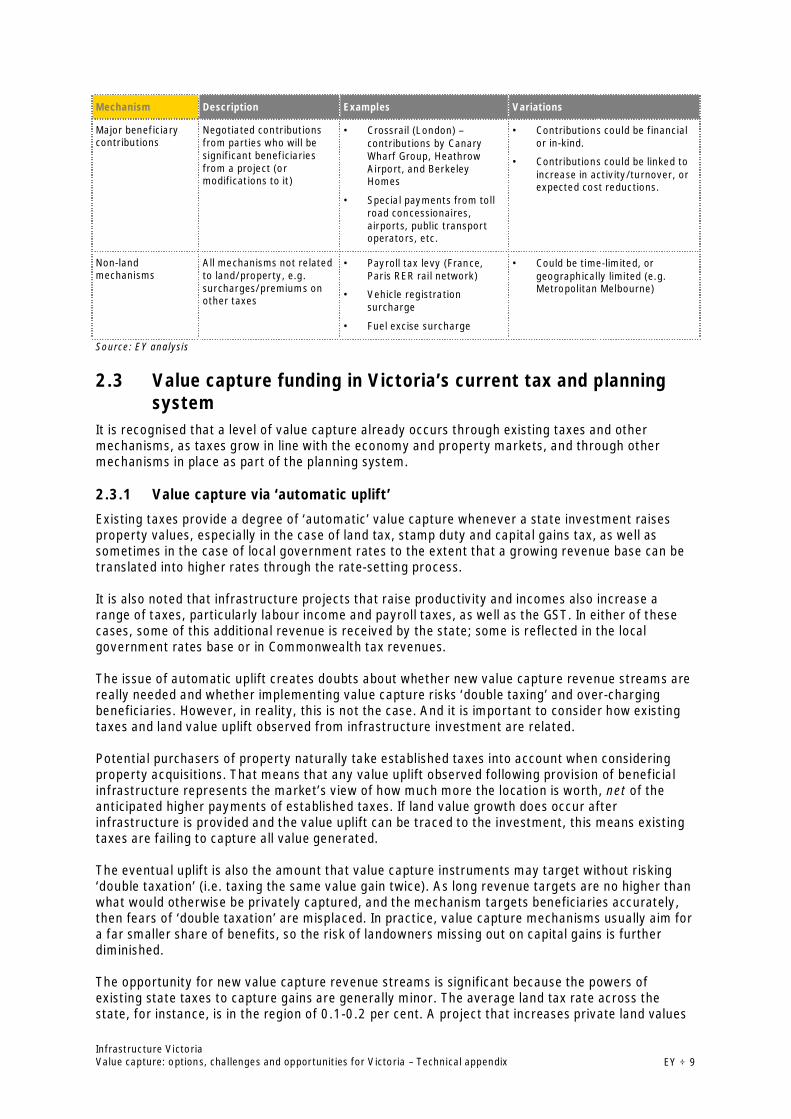
The table below summarises these mechanisms with reference to examples in Victoria andelsewhere.
Table 3: Value capture mechanisms
Mechanism Description Examples Variations
Developercontributions
One-off payments byproperty developers as acondition of developmentpermission or rezoning.
Payments are designed torecoup costs ofinfrastructure related tothe development.
· LGA DevelopmentContributions Plan system
· LGA Voluntary PlanningAgreements
· NSW Special InfrastructureContribution
· ACT Lease Variation Charge
· Vic Growth AreasInfrastructure Contribution
· Crossrail (London)Community InfrastructureLevy
· May be designed to recoup costsof infrastructure related to thedevelopment (cost-recoveryfocus), or may be linked to gainsfrom rezoning / permission(benefit-capture focus)
· Trigger: subdivision, rezoning ordevelopment application/approval
· Funding: a specific project or ageneral funding pool
· Amount: $/ha, $/m2 floor space,$/dwelling, % of developmentvalue, etc.
Betterment levies Recurrent payments bylandowners regardless ofdevelopment status.
· Crossrail (London) BusinessRate Supplement (BRS)
· Gold Coast Rapid Transitlevy
· Metropolitan Melbourneparks charge
· Congestion levy (Vic), whichis applied to owners andoperators of parkingfacilities and not directlypaid by road users
· Commonwealth CapitalGains Tax (the closestexisting precedent)
· Local Government Act 1989(Vic) ‘special rating’ powers
· May be based on land orproperty value, be at a flat rateor area rate, or be based on landvalue uplift
· Limited in time or revenuecollected (e.g. BRS), or ongoing
· Funding: could be project-specific (e.g. gains in a definedarea and time period), or general
· Payment: could be ontransaction, or recurrent basedon official valuations
· Uplift levy could be based ongrowth in land value either sincelast transaction or above somebase value
Propertydevelopment, airrights, asset sales,or leases
Following completion of aproject (or in conjunctionwith project delivery),government land is sold,development rights aregranted, or commercialleases are created.
· Hong Kong MRT
· Southern Cross Stationredevelopment
· Level Crossing Removalintegrated development
· Portland Cascade Stationand airport light rail
· Land may either be alreadyowned, or be acquired at pre-project values
· Development rights may bepackaged with project delivery orcontracted separately
3 Dominique Boufand David Hensher (2007) The dark side of making transit irresistible: The example of France, WorkingPaper ITLS-WP-07-10 prepared for the Institute of Transport and Logistics Studies
Infrastructure VictoriaValue capture: options, challenges and opportunities for Victoria – Technical appendix EY ÷ 9
Mechanism Description Examples Variations
Major beneficiarycontributions
Negotiated contributionsfrom parties who will besignificant beneficiariesfrom a project (ormodifications to it)
· Crossrail (London) –contributions by CanaryWharf Group, HeathrowAirport, and BerkeleyHomes
· Special payments from tollroad concessionaires,airports, public transportoperators, etc.
· Contributions could be financialor in-kind.
· Contributions could be linked toincrease in activity/turnover, orexpected cost reductions.
Non-landmechanisms
All mechanisms not relatedto land/property, e.g.surcharges/premiums onother taxes
· Payroll tax levy (France,Paris RER rail network)
· Vehicle registrationsurcharge
· Fuel excise surcharge
· Could be time-limited, orgeographically limited (e.g.Metropolitan Melbourne)
Source: EY analysis
2.3 Value capture funding in Victoria’s current tax and planningsystem
It is recognised that a level of value capture already occurs through existing taxes and othermechanisms, as taxes grow in line with the economy and property markets, and through othermechanisms in place as part of the planning system.
2.3.1 Value capture via ‘automatic uplift’
Existing taxes provide a degree of ‘automatic’ value capture whenever a state investment raisesproperty values, especially in the case of land tax, stamp duty and capital gains tax, as well assometimes in the case of local government rates to the extent that a growing revenue base can betranslated into higher rates through the rate-setting process.
It is also noted that infrastructure projects that raise productivity and incomes also increase arange of taxes, particularly labour income and payroll taxes, as well as the GST. In either of thesecases, some of this additional revenue is received by the state; some is reflected in the localgovernment rates base or in Commonwealth tax revenues.
The issue of automatic uplift creates doubts about whether new value capture revenue streams arereally needed and whether implementing value capture risks ‘double taxing’ and over-chargingbeneficiaries. However, in reality, this is not the case. And it is important to consider how existingtaxes and land value uplift observed from infrastructure investment are related.
Potential purchasers of property naturally take established taxes into account when consideringproperty acquisitions. That means that any value uplift observed following provision of beneficialinfrastructure represents the market’s view of how much more the location is worth, net of theanticipated higher payments of established taxes. If land value growth does occur afterinfrastructure is provided and the value uplift can be traced to the investment, this means existingtaxes are failing to capture all value generated.
The eventual uplift is also the amount that value capture instruments may target without risking‘double taxation’ (i.e. taxing the same value gain twice). As long revenue targets are no higher thanwhat would otherwise be privately captured, and the mechanism targets beneficiaries accurately,then fears of ‘double taxation’ are misplaced. In practice, value capture mechanisms usually aim fora far smaller share of benefits, so the risk of landowners missing out on capital gains is furtherdiminished.
The opportunity for new value capture revenue streams is significant because the powers ofexisting state taxes to capture gains are generally minor. The average land tax rate across thestate, for instance, is in the region of 0.1-0.2 per cent. A project that increases private land values

Infrastructure VictoriaValue capture: options, challenges and opportunities for Victoria – Technical appendix EY ÷ 10
will thus recoup only one or two-thousandths of that gain each year, or perhaps 4-5 per cent inpresent-value terms over all future years (although the proportions will be higher where projectbenefits are concentrated on taxable land).
There is also some uncertainty regarding the extent to which changes in property related taxes forindividual beneficiaries translate into an overall increase in tax collections. For example, changes inthe value of land and property developments in one location may be offset by reductions elsewhereif it reflects a redistribution of market demand instead of a general increase in the willingness topay for land. While there may be clear benefits for certain landowners that justifies the applicationof value capture at the local level, the potential for a redistribution of land values provides aconstraint on the ability for governments to automatically capture value from overall property taxcollections.
However, in the case of income, payroll taxes and the GST the situation is different. Infrastructureprojects that can be demonstrated to increase economic productivity do create permanentincreases in those taxes, with the primary beneficiary being the Federal Government as thecollector of personal and company income taxes. The extent of this automatic tax gain depends onthe nature of the project and its impact on productivity, with the analysis of the Melbourne Metroproject suggesting it could be in the range of 20-30% of project costs, with the majority following tothe Federal Government and not the State Government as funder of the project.4
2.3.2 Other mechanisms and recent reforms
There are a number of funding mechanisms that are available through the planning system thathave characteristics of value capture mechanisms, including Development Contribution Plans(DCPs) and related agreements, the Growth Areas Infrastructure Contribution (GAIC) and PlacesVictoria (Urban Renewal Authority) Charges.
Despite the availability of these mechanisms, limitations and revenue shortages still exist,particularly in the case of DCPs, and the complexity of the system is considered to place aconstraint on urban development.5 This is why the Victorian Government is reforming itsinfrastructure contributions system for developers in growth areas where the GAIC does not apply,and in Strategic Development Areas identified in Plan Melbourne. However, while these reformscould simplify the system of developer contributions, it is yet to be demonstrated the extent towhich they will address current funding problems.
The Victorian Government’s proposed new planning controls to guide development of Melbourne'scentral city are also of interest for value capture. However, instead of focusing on the creation ofnew sources of revenue, the measures are aimed at leveraging underlying land values to createpublic benefits through controls on building heights and separations, and the protection of publicspace from wind and overshadowing.6 And while the measures include floor area uplift bonuses(equivalent to 10% of the uplift in commercial value), which is a form of value capture, value gainsare shared between developers and the community by requiring developers to provide additionalpublic benefits as part of the development as opposed to funding major infrastructure works, withmeasures including the provision of public open space and laneways on site, office use and publicspace in the building, and social housing.
4 EY analysis of the Full Business Case for the Melbourne Metro project5 See Plan Melbourne 2015 Review, Report by the Ministerial Advisory Committee, June 2015, where it is observed thatdespite the considerable energy devoted to reforming Victoria’s system of developer charges and related mechanisms inrecent years, limitations and revenue shortages still exist. For example, the Ministerial Advisory Committee review of PlanMelbourne highlighted shortcomings affecting growth area councils like Wyndham, pointing out that DCPs will raise only$1.6 billion of the $2.4 billion needed to fund local roads, open space and other community infrastructure.6 These controls represent a significant shift away from the previous arrangements and can be expected to negativelyimpact on land values. See EY, Central City Built Form Review – Feasibility Review, January 2016
Infrastructure VictoriaValue capture: options, challenges and opportunities for Victoria – Technical appendix EY ÷ 11
2.4 Funding vs financingFunding and financing are terms which are often used interchangeably, but there is an importantdifference between the two. Funding is the income that is received over time used to meet the costsof a project. Value capture mechanisms which create new revenue sources for the state are, likeuser charges or general taxation, alternative funding approaches.
Financing, in contrast, refers to the set of arrangements put in place to provide capital to meet thecosts of the project as they are incurred, which usually means up front during construction.Financing costs (i.e. borrowing costs) are one of the costs that must be paid for by funding.
Some mechanisms referred to as ‘value capture’ also have a direct role in the financing of projects.The best known of these, the Tax Increment Financing (TIF) model, involves repayments of aproject loan from growth in tax revenues above a pre-project baseline; like other financingmechanisms (e.g. loans, public-private-partnerships or PPPs) this shifts the timing of the fundingtask and can also change risk allocation. In general terms, it allows a government jurisdiction totake revenues derived from increases in property values within a prescribed development area andhypothecate those ‘incremental’ tax revenues to fund the infrastructure and renewal projects thathave significantly contributed to this property appreciation.
The manner in which TIF is implemented is varied, and different jurisdictions have adopted differentmethodologies. The application of TIF mechanisms have been particularly widespread in the USover a number of decades, where they are typically administered at the local government levelthrough the operation of urban renewal areas or “TIF districts”. TIF schemes in the US are deployedto support the delivery of a range of community infrastructure assets and developmentopportunities, although there is mixed evidence about the benefits of TIF and its role in increasingproperty values in TIF districts.7
In the US, the Federal Government provides additional assistance through financing mechanismssuch as the Transport Infrastructure Finance and Innovation Act (TIFIA) program. TIFIA providesFederal credit assistance in the form of direct loans, loan guarantees and standby lines of credit tofinance surface transportation projects of national and regional significance. These loans must berepayable, in whole or in part, from tolls, user charges or other dedicated revenue sources such asspecial assessments and tax increment revenues from land sold and developed. The program hasprovided a mechanism by which project proponents have been able to develop beneficiary-paysfunding strategies for projects, and leverage the revenues to raise finance to meet constructioncost obligations.8
More recently, the Scottish Parliament has moved to support the application of TIF as a means offunding public sector investment infrastructure judged to be necessary to unlock regeneration in anarea, and which may otherwise be unaffordable to local authorities. The Parliament has agreed tosupport up to six pilot schemes to explore the utility of TIF and under the use of a “But-For” testthat specifies that the infrastructure required to unlock development in the area can only bedelivered through the creation of the TIF mechanism and would not otherwise be deliverable byfinance from the private sector and / or alternative public sector funding.9
Approaches to financing such as TIF can be efficient and equitable where the funding sourceunderpinning borrowings does not create a market distortion or disincentive to land developers,and is directly linked to wealth gains created by the project. There is also the potential for positiveor negative treatment by credit agencies, if the revenue stream can be clearly separated fromtraditional borrowing. There remain challenges, however. In particular, in developing a TIF modelfor each project, care must be had to avoid capturing natural, or background, taxation revenue.
7 Land Lines: January 2006, Volume 18, Number 1, “Tax Increment Financing – A Tool for Local Economic Development;Dye, Richard and David Merriman8 US Department of the Transportation, Federal Highway Administration (https://www.transportation.gov/tifia)9 http://www.gov.scot/Topics/Government/Finance/18232/TIF

Infrastructure VictoriaValue capture: options, challenges and opportunities for Victoria – Technical appendix EY ÷ 12
Studies show that this is often the case in the US, where poorly designed TIF schemes thateffectively hypothecate existing revenues to urban renewal projects can undermine the ability ofgovernments to fund service delivery and manage assets.
Although TIF has been promoted by various interest groups, it has not yet been adopted inAustralia. Ultimately, the development of a financing strategy for any project will be bespoke andlikely will be driven by the appetite and capacity of both government and private investors tofinance the project, and the nature, risks, quantum and profile of the funding options takenforward.
However as previously stated, the focus of this paper is on mechanisms that create new revenuestreams (or cost savings) for government, out of the uplift in value and economic activity arisingfrom infrastructure investment – i.e. value capture funding mechanisms. Value capture financingmechanisms associated with value capture funding sources are not examined further here.
Infrastructure VictoriaValue capture: options, challenges and opportunities for Victoria – Technical appendix EY ÷ 13
3. Approach to the analysis of value capture for selectedfuture scenarios
This section outlines the selection of future projects and scenarios for the analysis of value capturefunding options, value capture mechanism selection, and the approach to benefits and revenuemodelling.
3.1 Project and value capture mechanism selectionThe infrastructure options presented here are a selection of future projects and scenarios that arepresented in IV’s Draft 30-year strategy, having progressed through IV’s assessment process.
Given Infrastructure Victoria’s cross-sectoral perspective, the evaluation has looked at howdifferent value capture mechanisms might play a role in funding a diverse range of infrastructureasset classes. These examples are designed to be indicative and serve to give a sense of theopportunities and challenges of applying value capture to future projects and scenarios.
Modelling scenarios and projects in this paper does mean that Infrastructure Victoria endorses orrecommends a project. The modelling exercise for this research paper is illustrative only to helpdemonstrate the impact of value capture mechanism and their design. It is not definitive orsuggested for actual project application. Further work and detailed modelling based on detailedbusiness cases and project design on a case by case basis would be required to inform aninvestment decision.
3.1.1 Infrastructure projects
The following six project scenarios were selected from Infrastructure Victoria’s Draft 30-YearInfrastructure Strategy to model for illustrative purposes in this paper:
1. Melbourne Metro 2 (MM2): Construction of a heavy commuter rail connection betweenClifton Hill and Southern Cross Station, with a further connection from Southern CrossStation to Newport via Fishermans Bend.
2. Outer metropolitan ring road (OMR): Construction of the outer metropolitan ring road toimprove cross-Melbourne freight vehicle access and/or connections to the north and eastfrom key freight precincts in the west.
3. Rezoning of industrial land near a train station: Planning change to facilitate ‘highest andbest use’ development for an industrial precinct located along the Dandenong rail corridor.
4. Public housing asset rationalisation and refurbishment: Increasing and improving theasset base of an existing public housing estate through an alternative asset developmentmodel.
5. Major hospital redevelopment: Future redevelopment of inner Melbourne’s major hospitalfacilities to provide for increased demand due to state-wide population growth and alsofrom new inner city residential development.
6. Commitment to a new school in an urban growth area: Accelerating the funding decisionfor school infrastructure in Melbourne’s growth areas, bringing forward the delivery of theschool and providing certainty to the community.
3.1.2 Types of mechanisms appropriate in the Victorian context
The types of value capture mechanisms considered appropriate in the Victorian context include:
· Developer contributions
· Betterment levies
Infrastructure VictoriaValue capture: options, challenges and opportunities for Victoria – Technical appendix EY ÷ 14
· Property development, air rights, asset sales, or leases
· Major beneficiary contributions
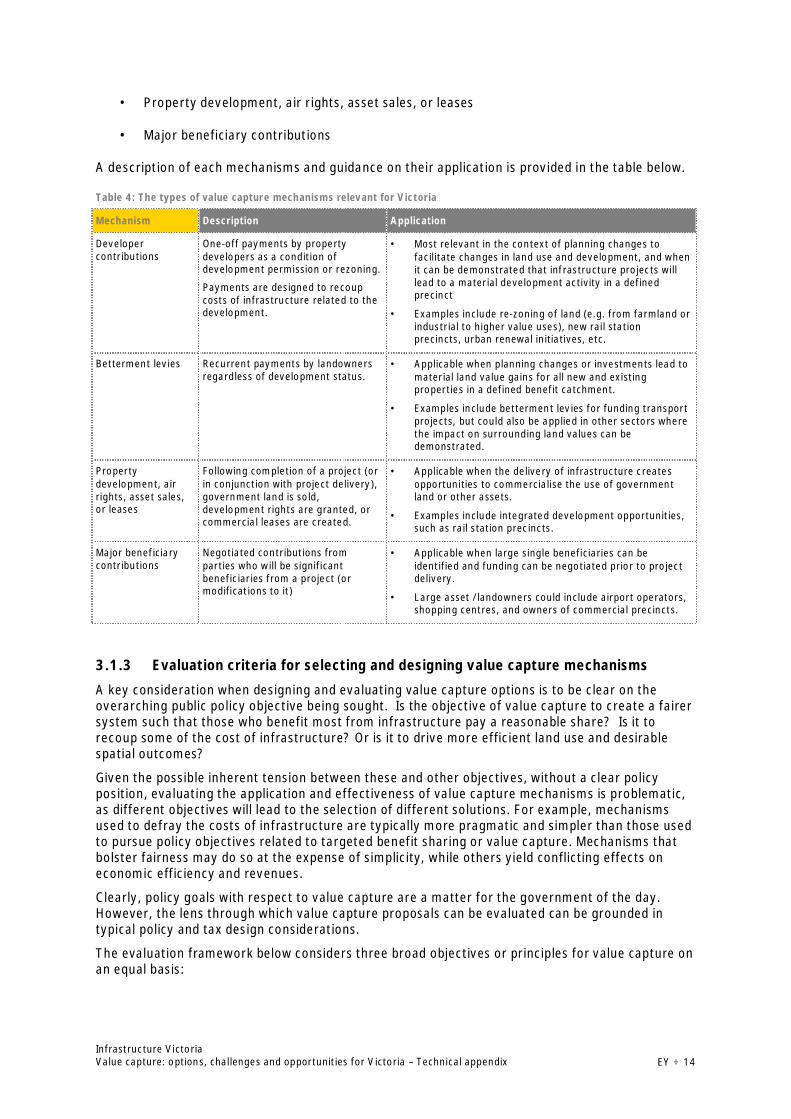
A description of each mechanisms and guidance on their application is provided in the table below.
Table 4: The types of value capture mechanisms relevant for Victoria
Mechanism Description Application
Developercontributions
One-off payments by propertydevelopers as a condition ofdevelopment permission or rezoning.
Payments are designed to recoupcosts of infrastructure related to thedevelopment.
· Most relevant in the context of planning changes tofacilitate changes in land use and development, and whenit can be demonstrated that infrastructure projects willlead to a material development activity in a definedprecinct
· Examples include re-zoning of land (e.g. from farmland orindustrial to higher value uses), new rail stationprecincts, urban renewal initiatives, etc.
Betterment levies Recurrent payments by landownersregardless of development status.
· Applicable when planning changes or investments lead tomaterial land value gains for all new and existingproperties in a defined benefit catchment.
· Examples include betterment levies for funding transportprojects, but could also be applied in other sectors wherethe impact on surrounding land values can bedemonstrated.
Propertydevelopment, airrights, asset sales,or leases
Following completion of a project (orin conjunction with project delivery),government land is sold,development rights are granted, orcommercial leases are created.
· Applicable when the delivery of infrastructure createsopportunities to commercialise the use of governmentland or other assets.
· Examples include integrated development opportunities,such as rail station precincts.
Major beneficiarycontributions
Negotiated contributions fromparties who will be significantbeneficiaries from a project (ormodifications to it)
· Applicable when large single beneficiaries can beidentified and funding can be negotiated prior to projectdelivery.
· Large asset /landowners could include airport operators,shopping centres, and owners of commercial precincts.
3.1.3 Evaluation criteria for selecting and designing value capture mechanisms
A key consideration when designing and evaluating value capture options is to be clear on theoverarching public policy objective being sought. Is the objective of value capture to create a fairersystem such that those who benefit most from infrastructure pay a reasonable share? Is it torecoup some of the cost of infrastructure? Or is it to drive more efficient land use and desirablespatial outcomes?
Given the possible inherent tension between these and other objectives, without a clear policyposition, evaluating the application and effectiveness of value capture mechanisms is problematic,as different objectives will lead to the selection of different solutions. For example, mechanismsused to defray the costs of infrastructure are typically more pragmatic and simpler than those usedto pursue policy objectives related to targeted benefit sharing or value capture. Mechanisms thatbolster fairness may do so at the expense of simplicity, while others yield conflicting effects oneconomic efficiency and revenues.
Clearly, policy goals with respect to value capture are a matter for the government of the day.However, the lens through which value capture proposals can be evaluated can be grounded intypical policy and tax design considerations.
The evaluation framework below considers three broad objectives or principles for value capture onan equal basis:
Infrastructure VictoriaValue capture: options, challenges and opportunities for Victoria – Technical appendix EY ÷ 15
· Revenue potential: The extent to which the total value captured by the mechanismmaximises revenue relative to the value created by the project and its total capital cost. Inthe case of planning decisions the value captured relative to the value uplift;
· Equity and efficiency: The extent to which the mechanism promotes fairness in the taxsystem and aligns infrastructure funding with project benefits, and encourages efficient useof resources, while not distorting economic activity; and,
· Simplicity and sustainability: The extent to which the mechanism is easy to understand,administer and comply with, minimises administrative or transaction costs, and leads tosustainable revenues.
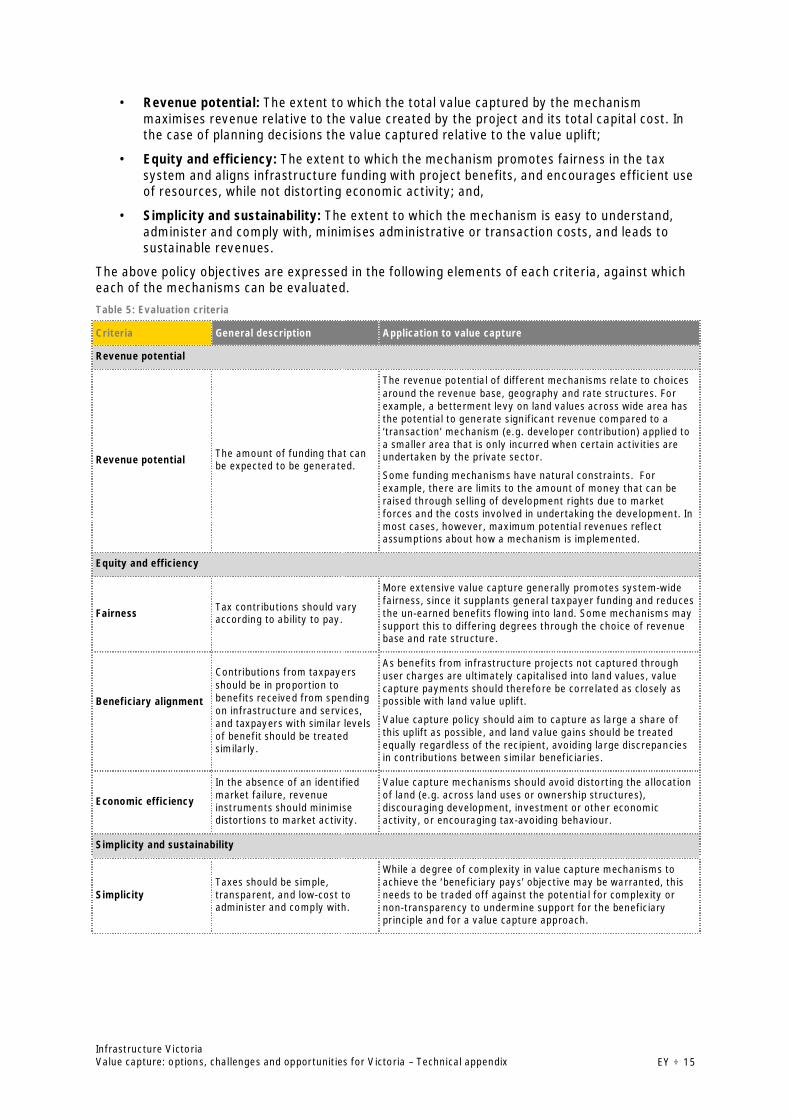
The above policy objectives are expressed in the following elements of each criteria, against whicheach of the mechanisms can be evaluated.Table 5: Evaluation criteria
Criteria General description Application to value capture
Revenue potential
Revenue potential The amount of funding that canbe expected to be generated.
The revenue potential of different mechanisms relate to choicesaround the revenue base, geography and rate structures. Forexample, a betterment levy on land values across wide area hasthe potential to generate significant revenue compared to a‘transaction’ mechanism (e.g. developer contribution) applied toa smaller area that is only incurred when certain activities areundertaken by the private sector.
Some funding mechanisms have natural constraints. Forexample, there are limits to the amount of money that can beraised through selling of development rights due to marketforces and the costs involved in undertaking the development. Inmost cases, however, maximum potential revenues reflectassumptions about how a mechanism is implemented.
Equity and efficiency
Fairness Tax contributions should varyaccording to ability to pay.
More extensive value capture generally promotes system-widefairness, since it supplants general taxpayer funding and reducesthe un-earned benefits flowing into land. Some mechanisms maysupport this to differing degrees through the choice of revenuebase and rate structure.
Beneficiary alignment
Contributions from taxpayersshould be in proportion tobenefits received from spendingon infrastructure and services,and taxpayers with similar levelsof benefit should be treatedsimilarly.
As benefits from infrastructure projects not captured throughuser charges are ultimately capitalised into land values, valuecapture payments should therefore be correlated as closely aspossible with land value uplift.
Value capture policy should aim to capture as large a share ofthis uplift as possible, and land value gains should be treatedequally regardless of the recipient, avoiding large discrepanciesin contributions between similar beneficiaries.
Economic efficiency
In the absence of an identifiedmarket failure, revenueinstruments should minimisedistortions to market activity.
Value capture mechanisms should avoid distorting the allocationof land (e.g. across land uses or ownership structures),discouraging development, investment or other economicactivity, or encouraging tax-avoiding behaviour.
Simplicity and sustainability
SimplicityTaxes should be simple,transparent, and low-cost toadminister and comply with.
While a degree of complexity in value capture mechanisms toachieve the ‘beneficiary pays’ objective may be warranted, thisneeds to be traded off against the potential for complexity ornon-transparency to undermine support for the beneficiaryprinciple and for a value capture approach.
Infrastructure VictoriaValue capture: options, challenges and opportunities for Victoria – Technical appendix EY ÷ 16
Criteria General description Application to value capture
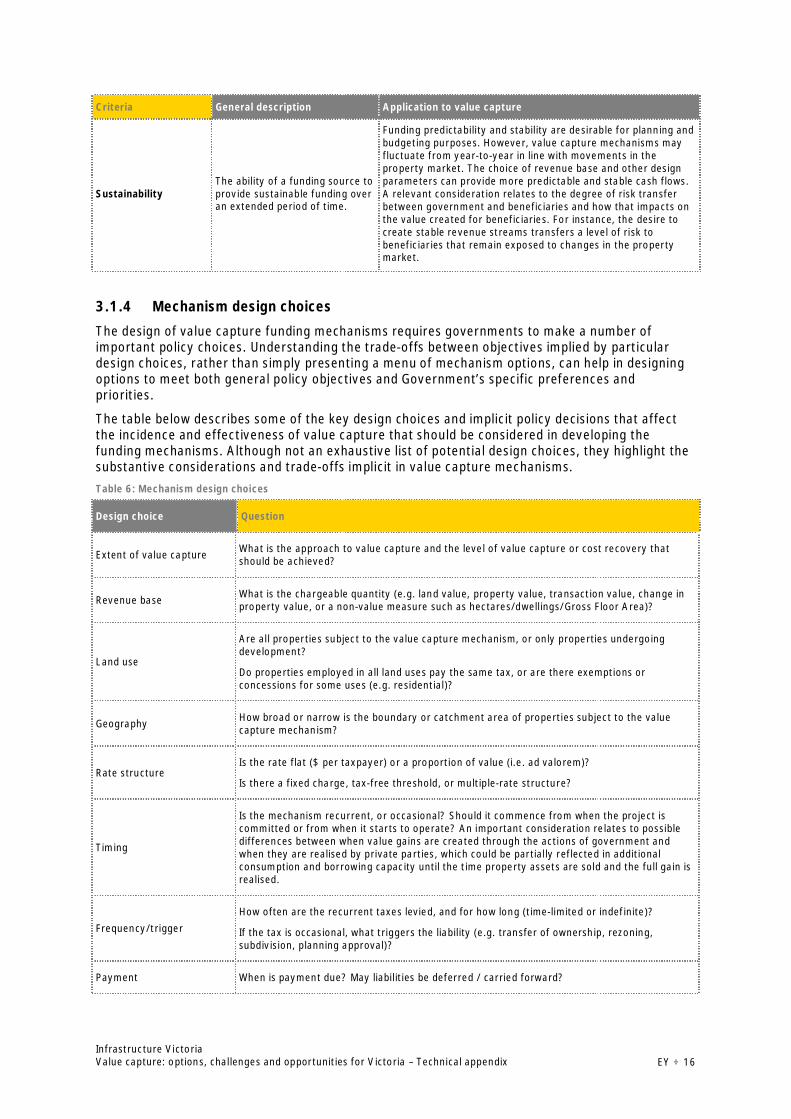
SustainabilityThe ability of a funding source toprovide sustainable funding overan extended period of time.
Funding predictability and stability are desirable for planning andbudgeting purposes. However, value capture mechanisms mayfluctuate from year-to-year in line with movements in theproperty market. The choice of revenue base and other designparameters can provide more predictable and stable cash flows.A relevant consideration relates to the degree of risk transferbetween government and beneficiaries and how that impacts onthe value created for beneficiaries. For instance, the desire tocreate stable revenue streams transfers a level of risk tobeneficiaries that remain exposed to changes in the propertymarket.
3.1.4 Mechanism design choices
The design of value capture funding mechanisms requires governments to make a number ofimportant policy choices. Understanding the trade-offs between objectives implied by particulardesign choices, rather than simply presenting a menu of mechanism options, can help in designingoptions to meet both general policy objectives and Government’s specific preferences andpriorities.
The table below describes some of the key design choices and implicit policy decisions that affectthe incidence and effectiveness of value capture that should be considered in developing thefunding mechanisms. Although not an exhaustive list of potential design choices, they highlight thesubstantive considerations and trade-offs implicit in value capture mechanisms.Table 6: Mechanism design choices
Design choice Question
Extent of value capture What is the approach to value capture and the level of value capture or cost recovery thatshould be achieved?
Revenue base What is the chargeable quantity (e.g. land value, property value, transaction value, change inproperty value, or a non-value measure such as hectares/dwellings/Gross Floor Area)?
Land use
Are all properties subject to the value capture mechanism, or only properties undergoingdevelopment?
Do properties employed in all land uses pay the same tax, or are there exemptions orconcessions for some uses (e.g. residential)?
Geography How broad or narrow is the boundary or catchment area of properties subject to the valuecapture mechanism?
Rate structureIs the rate flat ($ per taxpayer) or a proportion of value (i.e. ad valorem)?
Is there a fixed charge, tax-free threshold, or multiple-rate structure?
Timing
Is the mechanism recurrent, or occasional? Should it commence from when the project iscommitted or from when it starts to operate? An important consideration relates to possibledifferences between when value gains are created through the actions of government andwhen they are realised by private parties, which could be partially reflected in additionalconsumption and borrowing capacity until the time property assets are sold and the full gain isrealised.
Frequency/triggerHow often are the recurrent taxes levied, and for how long (time-limited or indefinite)?
If the tax is occasional, what triggers the liability (e.g. transfer of ownership, rezoning,subdivision, planning approval)?
Payment When is payment due? May liabilities be deferred / carried forward?
Infrastructure VictoriaValue capture: options, challenges and opportunities for Victoria – Technical appendix EY ÷ 17
Extent of value capture
Determining the appropriate level of value capture is a significant policy and design choice in thecontext of value gains attributed to infrastructure that are often difficult to estimate with certainty.For instance, realised value gains from investment and planning decisions will be dependent onfactors such as property market conditions, site characteristics and development feasibility,existing and future planning controls, and permissible development.
It is up to government to determine how much value it wishes to capture. A principled starting pointfor the development of any value capture strategy could involve exploring the possibility of sharingthe gains with beneficiaries on an equal basis, with the ability to achieve this level of value capturedependent on the information available to precisely target value gains for individual beneficiaries,and the assessment of fairness and efficiency and simplicity and sustainability of the mechanism.Starting with an assumption of equal sharing reflects the mid-point between capturing none or all ofthe gain created by the change in question.
However, this level of information is only likely to be available in certain situations, such as in thecontext of planning changes and other interventions that create a clear change in the use and valueof affected land. For these examples there could be the opportunity to capture 50% of value gains.
Examples of this include the betterment tax applied in Israel and recent value capture policiesapplied in NSW, where a number of councils are introducing policies for the use of planningagreements to capture a share of uplift in land value occurring as a result of planning decisions thatimprove the development potential of a site, through rezoning or change in development controls.
For instance, the Draft Woollahra Voluntary Planning Agreement Policy sets out the circumstancesunder which land value is to be captured and the method of calculating the contribution associatedwith land value capture.10
The policy defines value capture as a funding mechanism that captures, for the community’sbenefit, a share of the unearned land value increment accruing to developers as a consequence of:
· planning amendments that facilitate development, or the granting of or modification to adevelopment consent; or
· the approval of or a modification to a development consent that allows development to exceedthe otherwise permissible development controls.
The policy distinguishes land value capture from developer contributions on the basis that it is valuesharing between the Council (on behalf of the community) and developers, rather than on fundingthe costs of infrastructure. The monetary contribution of the value capture mechanism represents50% of the gain on the residual value of land that can be attributed to a change to a statutoryplanning control.
For most infrastructure projects, this level of information and certainty is unlikely to exist forestimating the benefits created. In these cases when developer contributions or betterment leviesare being considered, rather than targeting value gains with precision, there is a need to applymore approximate mechanisms, such as those that target underlying property values ordevelopment value. In these cases, there is a good reason to scale back the level of value captureand apply pre-determined (standard) rates like the GAIC or focus more on setting rates to enable alevel of infrastructure cost recovery (which provides a more tangible and practical revenue target).In this case, a betterment levy would be less concerned with capturing estimated uplifts and insteadbe set to recover an amount of revenue required to fund a portion of the project.
10 Woollahra Municipal Council (2016), Draft Woollahra Voluntary Planning Agreement Policy: Exhibition version of 8February 2016(http://www.woollahra.nsw.gov.au/__data/assets/pdf_file/0004/163543/1._Woollahra_Voluntary_Planning_Agreement_Policy_-_Exhibition_version_of_8_February_2016.pdf)
Infrastructure VictoriaValue capture: options, challenges and opportunities for Victoria – Technical appendix EY ÷ 18
As an example, the value capture funding model used for Melbourne’s City Loop sought to recover50% of the costs of the project via council rates on commercial properties in City of Melbourne(25%) and simple levies on residential properties across Melbourne collected by the MMBW (25%),which reflects a high level of cost recovery compared to other examples. Crossrail, for instance, isseeking to recover approximately 25% costs through the BRS, with the funding of Crossrail frombetterment levies focused on commercial properties only due to the challenges in accessing theresidential base in London for this sort of investment.11
Another example is the Gold Coast light rail project, with council contributing around $120m(~12%) to the project, largely funded by its fixed rate levy ($111 per property), which is a bluntvalue capture instrument.12
Many stakeholders consulted as part of this study were of the view that while value capture doesoffer potential as an additional funding source, it is unlikely that it will be able to make a significantcontribution to infrastructure costs. Most believe that value capture has a narrow funding scope,ranging from 5% to 20% of a project’s capital expenditure.
In considering value capture in the Victorian context, then the City Loop example demonstrates thepotential to apply mechanisms targeted at both business and residential properties. While it waspreviously noted that a 50% sharing of the value uplift would represent a reasonable mid-pointbetween sharing all or nothing of the gain, limits on the ability to target land value gains and thedesire to implement fair and affordable value capture mechanisms, suggest that a cost recoverytarget of around 20-30% of project costs is reasonable and in line with experience in otherjurisdictions. This level of cost recovery is supported by the analysis below for a number of options,although instances were also identified where different levels of cost recover or benefit sharing arejustified depending on the circumstances (e.g. OMR, linked to lower underlying property values andcapacity to pay in outer areas). Noting, however, that the level of value capture should bedetermined on a case-by-case basis depending on the level and certainty of project benefits andother policy considerations including social and equity impacts such as people’s ability to pay andthe reasonableness of the funding burden.
Ultimately mechanisms settings such as the portion of project costs or value uplift targeted will be amatter for government.
Revenue base
The choice of revenue base can have important implications for benefit capture and economicefficiency.
For example, in relation to a property based value capture mechanisms (i.e. betterment levies),there is a choice as to whether it could be levied on a land-value base (like land tax) or a CapitalImproved Value (CIV) base like council rates or the Fire Services Property Levy (FSPL). There arepros and cons to each. While a land base is preferable on efficiency grounds (i.e. as it cannot beavoided or reduced, a CIV levy would to some extent deter capital investment), a CIV base may besimpler to implement as it could be collected on the same base as rates and FSPL. As such, astarting position for this study is that betterment levies that target land values instead of CIV arepreferred.
For developer contributions (notwithstanding current regulatory settings) there are similar choices,with the potential to levy site values or other units of measure like per square metre of gross floorarea or numbers of residential units sold. The sale of assets and development rights also involve
11 One factor identified for why funding for Crossrail has not targeted residential beneficiaries is the challenges involved inaccessing the residential base in London for city-wide/national investments. A PWC study on the funding and financingoptions for Crossrail 2 highlighted the difficulties encountered when seeking to raise funds through councils, with therebeing notable objections when funding was sought for the 2012 Olympic Games:PWC, Crossrail 2 Funding and Financing Study, 2014, https://www.pwc.co.uk/capital-projects-infrastructure/assets/crossrail-2-funding-and-financing-study.pdf12 Gold Coast City Council (2014) Revenue Statement and Resolution of Rates and Charges, 2014-15 and Gold Coast CityCouncil (2014) Annual Plan 2014-15

Infrastructure VictoriaValue capture: options, challenges and opportunities for Victoria – Technical appendix EY ÷ 19
further possibilities, including direct or staged sales, or the use of more complex arrangements likeproject development agreements.
Other revenue bases may also be of interest, such as payroll tax and fuel excises, or other existingtaxes. While these revenue bases could be relatively simple to administer, it is important toconsider the alignment of these mechanisms with the benefits of infrastructure, and the complexways in which the economic incidence of these taxes are distributed through supply chains(including labour in the case of payroll taxes) and to consumers.
Land use and rate structure
The choices of applicable land uses, rate structure and thresholds raise similar considerations tothe choice of boundary.
In general, the broader the base, the lower the rate of charge must be to avoid adverse impacts onbeneficiaries that receive lower benefits, if it is the case that benefits are unevenly distributedacross land-use types or across high and low-value properties and a wider net includes minorbeneficiaries. Low rates, however, mean less value captured from the largest beneficiaries.
One approach that can be applied to account for systematic differences in benefit across land-usetypes is to set differential rates of charge by land-use type, which was applied in the case of the CityLoop and is a common feature of the tax system (e.g. the variable rates under the VictorianGovernment’s Fire Services Property Levy). Differential rates of charge mean a greater degree ofvalue capture is possible than if certain property classes are exempted entirely, although thisapproach may be complex and difficult to justify with available evidence on project impacts.
Another design choice could be for the inclusion of value thresholds. While this may increaseperceived fairness, it also narrows the revenue base in a way that could exclude significantbeneficiaries. Value thresholds also induce distortions for purposes of tax avoidance which increaseadministrative and enforcement costs as well as legal complexity.
Geography
The choice of levy boundaries determines which beneficiaries are in the value capture area andhence how much value capture is possible.
A wider boundary broadens the pool of beneficiaries contributing, providing the potential capturemore value and improve the correlation between benefit and contribution. However at a certainradius from the relevant infrastructure, where value gains due to the project have diminished,payments may exceed benefits received. At this point the levy acts less as a value capturemechanism and more as a general revenue-raising tool.
The choice of boundary and rate of charge may also raise fairness issues – e.g. where benefits aresimilar but tax liabilities change sharply – that can undermine support for value capture. Devisingmultiple (concentric) levy boundaries with differential rates may be sensible in this context, butincreases the complexity of the mechanism.
Just as important as the choices themselves is having a transparent and objective process toensure that decisions are made in a way that is both defensible and supports the overall policyobjectives. To take one illustrative example – the geographic boundary of a betterment levy orspecial developer contribution for a new rail project – a systematic process for making this choicecould include elements of the following:
· delineating areas within standard walking catchments (e.g. 1 km from a new station);
· determining which adjacent areas are part of a contiguous area of the same land use andhence see spill over demand that warrants inclusion (e.g. a residential precinct bordered byplanning buffers, major roads or other infrastructure links, part of which is just outside the1 km radius);
· determining which properties or areas have ‘locked in’ land use and are unlikely to see valueuplift from anticipated changes in land use (hence are not candidates for redevelopmentand will benefit less from the project);
Infrastructure VictoriaValue capture: options, challenges and opportunities for Victoria – Technical appendix EY ÷ 20
· determining a statistical geography level (e.g. LGA, suburb, SA2, or SA1) or other metricson which the boundaries should be based;
· examining behavioural and network model outputs for geographic areas which are locatedat possible boundaries, and setting criteria for inclusion/exclusion based on measurableoutputs (e.g. a 5% travel time improvement as the threshold for inclusion).
Timing and payment
The benefits of infrastructure projects may start to materialise in land values from the time theproject is funded/committed, and increase during construction (for those not adversely affected byconstruction activities) and after the commencement of operations. For properties that are to bedeveloped there is likely to be a different timing profile depending on the nature of thedevelopment and related planning issues.
However, there may also be differences between when the benefit is created through the actions ofgovernment and when they are realised by private parties. While price rises may provide animmediate and partial benefit to landowners by increasing consumption and borrowing capacity, inmany cases it is only when the property is sold that the full gain is realised. Depending on when avalue capture mechanism is imposed and the payment method, this has the potential to create acash flow mismatch for beneficiaries.
For most projects, it is preferable to impose value capture mechanisms as early as possible,including during the construction period, in order to reduce the timing mismatch between when aproject is financed and ongoing funding. This would result in lower financing costs and overall valuecapture contributions. Alternatively, governments may choose to wait until a project is up andrunning and the benefits are fully evident.
Revenue from development based value capture mechanisms will vary depending on the timing ofownership, planning consents, development activity and sales.
The duration of any value capture mechanism is also an important consideration. If the goal is tocapture a share of value gains or recover a share of project costs (e.g. to repay a new loan facility),then this can be achieved over a timeframe that ensures annual value capture liabilities arereasonable and doesn’t over or under-collect revenue.
Policy options are available to overcome the timing mismatch issue where the majority of benefitsmay only be realised upon the sale of properties. These include concessions similar to those appliedto other taxes (e.g. tax exemptions, thresholds, etc.), which can increase system distortions, and/orthe application of deferral provisions so that tax liabilities may be carried forward against theproperty and paid upon disposal while the state manages the cash flow issues in the interim. Whiledeferral provisions are not generally applied to other taxes, the mechanism would not be overlycomplex. However, the costs of allowing deferrals and any impacts on the timing of propertytransactions would need to be assessed.
For this study we have assumed that payments should commence from when the benefit isreceived, with the start of the construction period chosen as the relevant timing for bettermentlevies. This means that, given the timing of the future projects and scenarios, the value capturerevenue streams are not modelled to commence until that time. Payment deferral mechanisms forindividual beneficiaries are possible with all value capture mechanisms but are not included in themodelling.
3.1.5 Selection of mechanisms
Owing to the disparate nature and potential diverse policy considerations of the various categoriesof value capture, there are a range of mechanisms available depending on the desired outcome.Therefore the application of value capture should be decided on a case-by-case basis.
The results of the beneficiary analysis, quantification of potential land value impacts, andconsideration of the evaluation criteria outlined above, provided the basis for aligning value capturemechanisms with each of the infrastructure options. These are summarised in the table below.
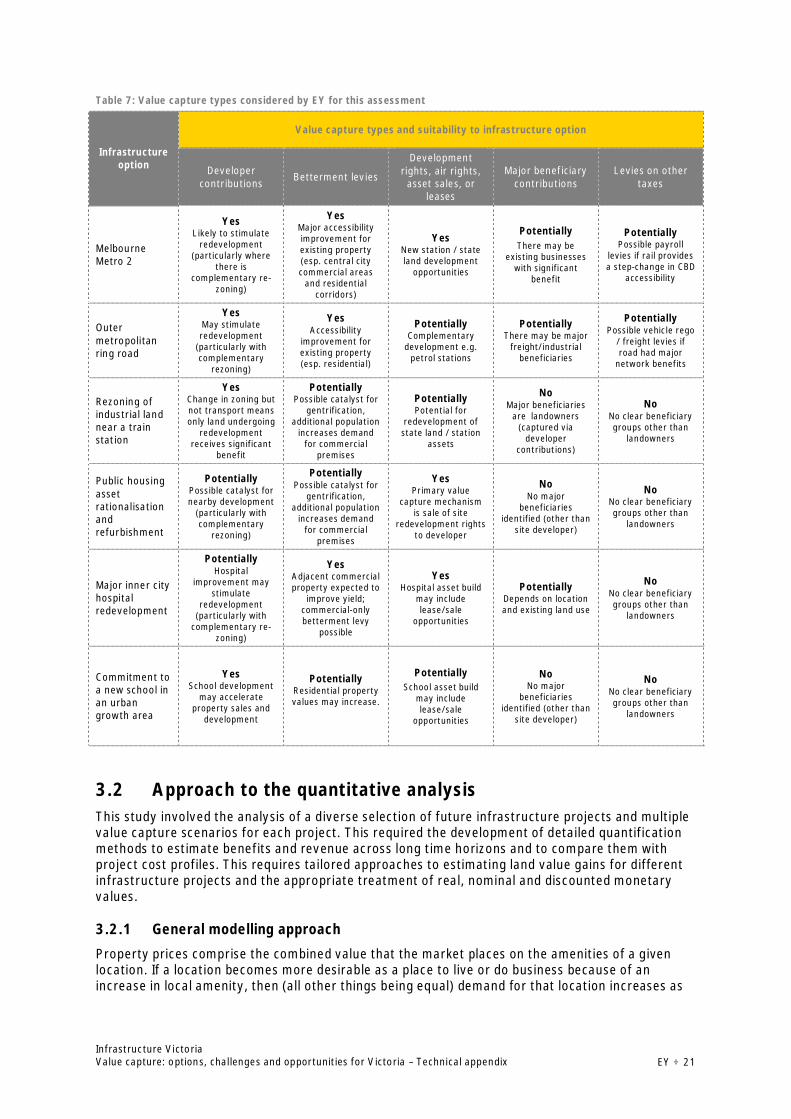
Infrastructure VictoriaValue capture: options, challenges and opportunities for Victoria – Technical appendix EY ÷ 21
Table 7: Value capture types considered by EY for this assessment
Infrastructureoption
Value capture types and suitability to infrastructure option
Developercontributions Betterment levies
Developmentrights, air rights,
asset sales, orleases
Major beneficiarycontributions
Levies on othertaxes
MelbourneMetro 2
YesLikely to stimulate
redevelopment(particularly where
there iscomplementary re-
zoning)
YesMajor accessibilityimprovement forexisting property(esp. central citycommercial areas
and residentialcorridors)
YesNew station / stateland development
opportunities
PotentiallyThere may be
existing businesseswith significant
benefit
PotentiallyPossible payroll
levies if rail providesa step-change in CBD
accessibility
Outermetropolitanring road
YesMay stimulateredevelopment
(particularly withcomplementary
rezoning)
YesAccessibility
improvement forexisting property(esp. residential)
PotentiallyComplementary
development e.g.petrol stations
PotentiallyThere may be major
freight/industrialbeneficiaries
PotentiallyPossible vehicle rego
/ freight levies ifroad had major
network benefits
Rezoning ofindustrial landnear a trainstation
YesChange in zoning butnot transport meansonly land undergoing
redevelopmentreceives significant
benefit
PotentiallyPossible catalyst for
gentrification,additional population
increases demandfor commercial
premises
PotentiallyPotential for
redevelopment ofstate land / station
assets
NoMajor beneficiaries
are landowners(captured via
developercontributions)
NoNo clear beneficiarygroups other than
landowners
Public housingassetrationalisationandrefurbishment
PotentiallyPossible catalyst fornearby development
(particularly withcomplementary
rezoning)
PotentiallyPossible catalyst for
gentrification,additional population
increases demandfor commercial
premises
YesPrimary value
capture mechanismis sale of site
redevelopment rightsto developer
NoNo major
beneficiariesidentified (other than
site developer)
NoNo clear beneficiarygroups other than
landowners
Major inner cityhospitalredevelopment
PotentiallyHospital
improvement maystimulate
redevelopment(particularly with
complementary re-zoning)
YesAdjacent commercialproperty expected to
improve yield;commercial-onlybetterment levy
possible
YesHospital asset build
may includelease/sale
opportunities
PotentiallyDepends on locationand existing land use
NoNo clear beneficiarygroups other than
landowners
Commitment toa new school inan urbangrowth area
YesSchool development
may accelerateproperty sales and
development
PotentiallyResidential propertyvalues may increase.
PotentiallySchool asset build
may includelease/sale
opportunities
NoNo major
beneficiariesidentified (other than
site developer)
NoNo clear beneficiarygroups other than
landowners
3.2 Approach to the quantitative analysisThis study involved the analysis of a diverse selection of future infrastructure projects and multiplevalue capture scenarios for each project. This required the development of detailed quantificationmethods to estimate benefits and revenue across long time horizons and to compare them withproject cost profiles. This requires tailored approaches to estimating land value gains for differentinfrastructure projects and the appropriate treatment of real, nominal and discounted monetaryvalues.
3.2.1 General modelling approach
Property prices comprise the combined value that the market places on the amenities of a givenlocation. If a location becomes more desirable as a place to live or do business because of anincrease in local amenity, then (all other things being equal) demand for that location increases as

Infrastructure VictoriaValue capture: options, challenges and opportunities for Victoria – Technical appendix EY ÷ 22
more people or businesses attempt to locate there. This drives up land prices and places pressureon governments to increase supply through land use and density changes.
In order to estimate land value change arising from the amenity afforded by governmentinvestment in infrastructure, the benefits created by a project (such as accessibility improvementsfrom transport investments or proximity to education opportunities) were identified, along with thelikely recipients of these benefits. Evidence from the literature, recent property transactions andadditional regression analysis was used to estimate property effects associated with similar types ofprojects in similar types of areas, and to estimate their potential impact on property values andproperty market dynamics.
The modelling also required the development of area-wide property models to reflect current andfuture land values in the vicinity of the future infrastructure projects. These property models weredeveloped from a mix of public sources and transactions databases. With this information in place itis possible to apply benefit and value mechanism design assumptions to estimate changes inproperty values due to infrastructure provision and to quantify value capture revenue streams.
Details regarding the approach to estimating land value and related benefits are provided below ineach project evaluation. However, in recognition of the scope and purpose of this study, thepreliminary nature of the future project proposals, and the challenge in estimating land valuechanges over the long forecast periods required, the results should be interpreted carefully.
3.2.2 Real and nominal dollars
Financial cost and revenue analysis through time often has to give consideration to whether usereal (or constant) dollar values, or whether to use nominal values, where the key differencebetween the two is in relation to the treatment of inflation.
Expressing monetary values in real terms fixes the price basis to a certain point in time andremoves inflation from past and future monetary values. While inflation means that something thatcosts $100 in 2016 will cost more in a future period (say $110 because inflation is 10%), the ‘real’value of the item in the future is still $100 when expressed in real terms or 2016 dollars. Byexpressing monetary values in real terms we get a sense of what the equivalent value is today (interms of purchasing power or other comparator).
Nominal monetary values, on the other hand, do not include any adjustments for inflation. Valuesare simply expressed as total units of value at the time they are incurred. Using the example above,with $100 available in the future period it would not be possible to purchase the item that costs$100 in 2016 because the price will have increased to $110 because of inflation.
Both nominal and real (2016) values have been used in this study depending on availableinformation and the type of analysis being performed. Where possible, results of benefits andrevenue analysis have been presented in real terms using 2016 prices, except in instances wherethe time value of money and risk are taken into account through discounting (see below).
3.2.3 Discounting
A feature of value capture funding is the timing difference between upfront investment expenditureand subsequent revenue collections, where the use of discounting is required to enable a ‘like-for-like’ comparison in ‘present value’ (PV) terms that accounts for the time value or opportunity costof money and risk.
In establishing value capture funding mechanisms to generate revenue and achieve a level of costrecovery while also allowing for the time value of money and risk, total revenue (i.e. the sum ofannual cash flow over the duration of the funding arrangement) may be higher than the total costof the project. By converting future revenues and costs into present values using discounting, amore meaningful comparison can be made, where revenue raised is generally less than the cost ofthe project.
Infrastructure VictoriaValue capture: options, challenges and opportunities for Victoria – Technical appendix EY ÷ 23
Present values for project costs and revenues were calculated using the Victorian Government’sstandard discount rate of 7% (when using real monetary values) and 9.7% (when using nominalmonetary values, which is the 7% adjusted for future inflation that is assumed to be 2.5%), withoutany additional adjustments for risk.
This represents a simplified approach that treats the risks across the costs and different revenuestreams the same. In reality, costs and revenues are likely to come from a number of differentsources, with different profiles around timing, risk and uncertainty. These are likely to exhibitdifferent risk profiles and therefore require different treatments in respect of discounting and risk-adjustment.
It is considered that the simplified approach is appropriate for a study of this nature, with moredetailed risk analysis required for implementation through the development of project businesscases and design of value capture revenue mechanisms.
3.2.4 Limitations of the analysis
The quantification of land value benefits attributable to infrastructure investment is a difficult andcomplex task. As outlined above, the modelling exercise for this research paper is illustrative onlyto help demonstrate the impact of value capture mechanism and their design.
This report does not constitute or claim to represent a comprehensive cost benefit analysis, and isonly designed to provide an indicative and high level assessment of the potential value captureopportunities on a range of different scenarios. To that end, a number of assumptions have beenutilised in our analysis and, while we note that this approach may not fully capture the preciseintricacies of each project and scenario, all of the assumptions that have been used areconservative estimates based on current market information and data, and existing EY knowledgeand experience.
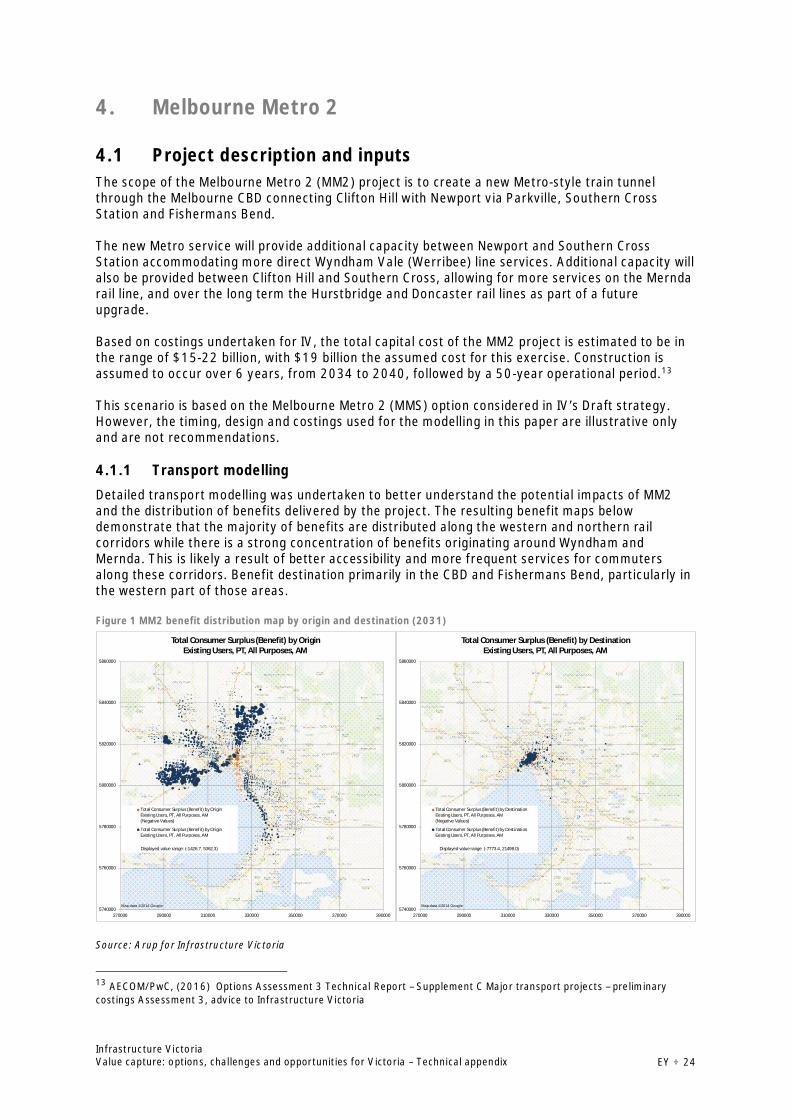
Infrastructure VictoriaValue capture: options, challenges and opportunities for Victoria – Technical appendix EY ÷ 24
4. Melbourne Metro 2
4.1 Project description and inputsThe scope of the Melbourne Metro 2 (MM2) project is to create a new Metro-style train tunnelthrough the Melbourne CBD connecting Clifton Hill with Newport via Parkville, Southern CrossStation and Fishermans Bend.
The new Metro service will provide additional capacity between Newport and Southern CrossStation accommodating more direct Wyndham Vale (Werribee) line services. Additional capacity willalso be provided between Clifton Hill and Southern Cross, allowing for more services on the Merndarail line, and over the long term the Hurstbridge and Doncaster rail lines as part of a futureupgrade.
Based on costings undertaken for IV, the total capital cost of the MM2 project is estimated to be inthe range of $15-22 billion, with $19 billion the assumed cost for this exercise. Construction isassumed to occur over 6 years, from 2034 to 2040, followed by a 50-year operational period.13
This scenario is based on the Melbourne Metro 2 (MMS) option considered in IV’s Draft strategy.However, the timing, design and costings used for the modelling in this paper are illustrative onlyand are not recommendations.
4.1.1 Transport modelling
Detailed transport modelling was undertaken to better understand the potential impacts of MM2and the distribution of benefits delivered by the project. The resulting benefit maps belowdemonstrate that the majority of benefits are distributed along the western and northern railcorridors while there is a strong concentration of benefits originating around Wyndham andMernda. This is likely a result of better accessibility and more frequent services for commutersalong these corridors. Benefit destination primarily in the CBD and Fishermans Bend, particularly inthe western part of those areas.
Figure 1 MM2 benefit distribution map by origin and destination (2031)
Source: Arup for Infrastructure Victoria
13 AECOM/PwC, (2016) Options Assessment 3 Technical Report – Supplement C Major transport projects – preliminarycostings Assessment 3, advice to Infrastructure Victoria
5740000
5760000
5780000
5800000
5820000
5840000
5860000
270000 290000 310000 330000 350000 370000 390000
Total Consumer Surplus (Benefit) by DestinationExisting Users, PT, All Purposes, AM
Total Consumer Surplus (Benefit) by DestinationExisting Users, PT, All Purposes, AM(Negative Values)
Total Consumer Surplus (Benefit) by DestinationExisting Users, PT, All Purposes, AM
Map data ©2014 Google
Displayed value range: (-7773.4, 21498.0)
5740000
5760000
5780000
5800000
5820000
5840000
5860000
270000 290000 310000 330000 350000 370000 390000
Total Consumer Surplus (Benefit) by OriginExisting Users, PT, All Purposes, AM
Total Consumer Surplus (Benefit) by OriginExisting Users, PT, All Purposes, AM(Negative Values)
Total Consumer Surplus (Benefit) by OriginExisting Users, PT, All Purposes, AM
Map data ©2014 Google
Displayed value range: (-1426.7, 5362.3)
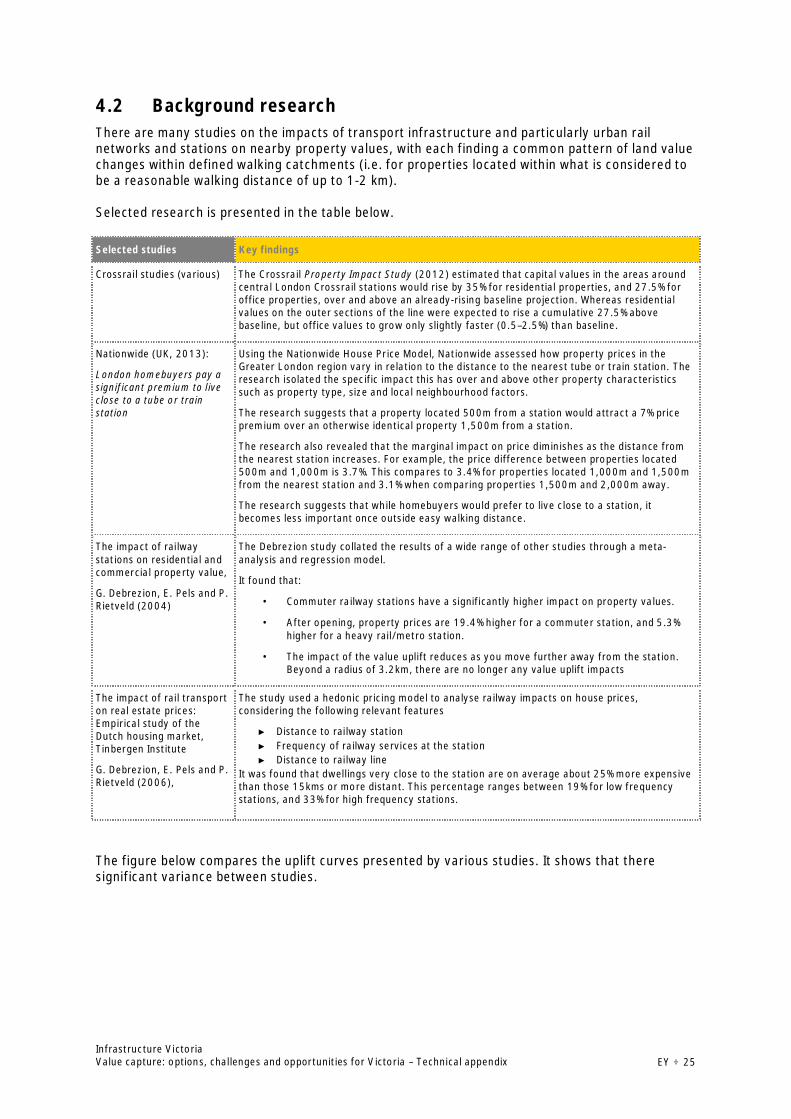
Infrastructure VictoriaValue capture: options, challenges and opportunities for Victoria – Technical appendix EY ÷ 25
4.2 Background researchThere are many studies on the impacts of transport infrastructure and particularly urban railnetworks and stations on nearby property values, with each finding a common pattern of land valuechanges within defined walking catchments (i.e. for properties located within what is considered tobe a reasonable walking distance of up to 1-2 km).
Selected research is presented in the table below.
Selected studies Key findings
Crossrail studies (various) The Crossrail Property Impact Study (2012) estimated that capital values in the areas aroundcentral London Crossrail stations would rise by 35% for residential properties, and 27.5% foroffice properties, over and above an already-rising baseline projection. Whereas residentialvalues on the outer sections of the line were expected to rise a cumulative 27.5% abovebaseline, but office values to grow only slightly faster (0.5–2.5%) than baseline.
Nationwide (UK, 2013):
London homebuyers pay asignificant premium to liveclose to a tube or trainstation
Using the Nationwide House Price Model, Nationwide assessed how property prices in theGreater London region vary in relation to the distance to the nearest tube or train station. Theresearch isolated the specific impact this has over and above other property characteristicssuch as property type, size and local neighbourhood factors.
The research suggests that a property located 500m from a station would attract a 7% pricepremium over an otherwise identical property 1,500m from a station.
The research also revealed that the marginal impact on price diminishes as the distance fromthe nearest station increases. For example, the price difference between properties located500m and 1,000m is 3.7%. This compares to 3.4% for properties located 1,000m and 1,500mfrom the nearest station and 3.1% when comparing properties 1,500m and 2,000m away.
The research suggests that while homebuyers would prefer to live close to a station, itbecomes less important once outside easy walking distance.
The impact of railwaystations on residential andcommercial property value,
G. Debrezion, E. Pels and P.Rietveld (2004)
The Debrezion study collated the results of a wide range of other studies through a meta-analysis and regression model.
It found that:
· Commuter railway stations have a significantly higher impact on property values.
· After opening, property prices are 19.4% higher for a commuter station, and 5.3%higher for a heavy rail/metro station.
· The impact of the value uplift reduces as you move further away from the station.Beyond a radius of 3.2km, there are no longer any value uplift impacts
The impact of rail transporton real estate prices:Empirical study of theDutch housing market,Tinbergen Institute
G. Debrezion, E. Pels and P.Rietveld (2006),
The study used a hedonic pricing model to analyse railway impacts on house prices,considering the following relevant features
► Distance to railway station► Frequency of railway services at the station► Distance to railway line
It was found that dwellings very close to the station are on average about 25% more expensivethan those 15kms or more distant. This percentage ranges between 19% for low frequencystations, and 33% for high frequency stations.
The figure below compares the uplift curves presented by various studies. It shows that theresignificant variance between studies.
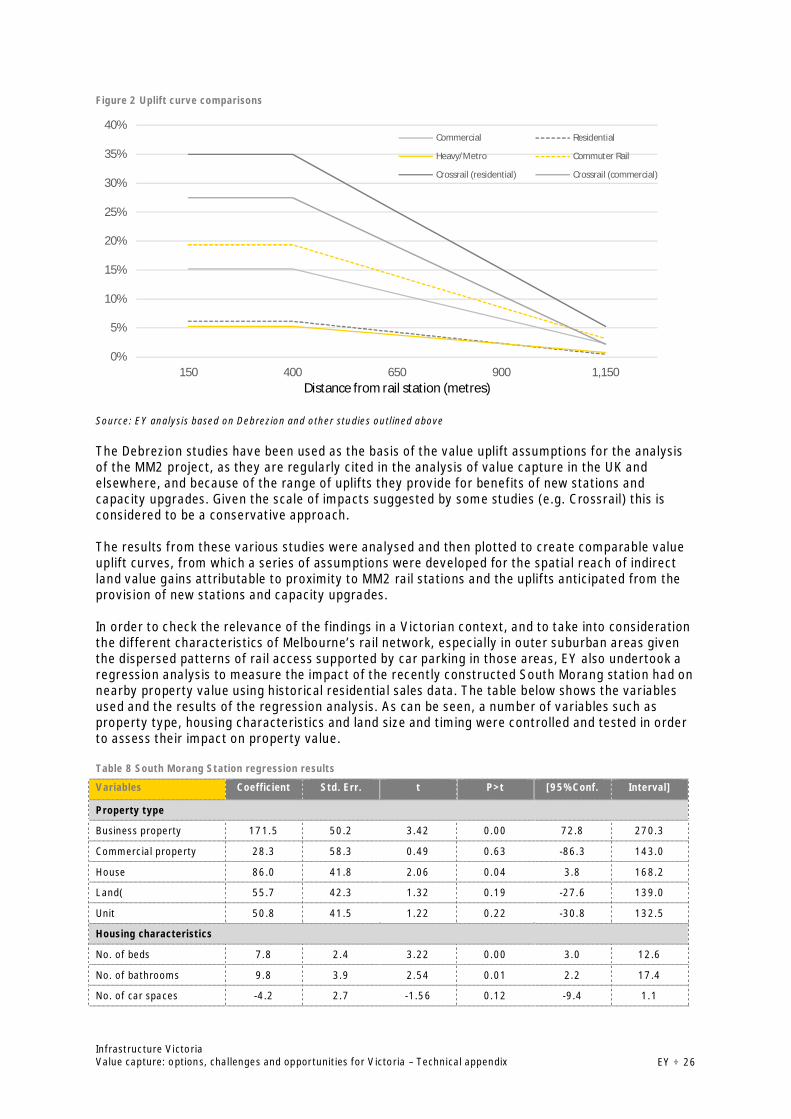
Infrastructure VictoriaValue capture: options, challenges and opportunities for Victoria – Technical appendix EY ÷ 26
Figure 2 Uplift curve comparisons
Source: EY analysis based on Debrezion and other studies outlined above
The Debrezion studies have been used as the basis of the value uplift assumptions for the analysisof the MM2 project, as they are regularly cited in the analysis of value capture in the UK andelsewhere, and because of the range of uplifts they provide for benefits of new stations andcapacity upgrades. Given the scale of impacts suggested by some studies (e.g. Crossrail) this isconsidered to be a conservative approach.
The results from these various studies were analysed and then plotted to create comparable valueuplift curves, from which a series of assumptions were developed for the spatial reach of indirectland value gains attributable to proximity to MM2 rail stations and the uplifts anticipated from theprovision of new stations and capacity upgrades.
In order to check the relevance of the findings in a Victorian context, and to take into considerationthe different characteristics of Melbourne’s rail network, especially in outer suburban areas giventhe dispersed patterns of rail access supported by car parking in those areas, EY also undertook aregression analysis to measure the impact of the recently constructed South Morang station had onnearby property value using historical residential sales data. The table below shows the variablesused and the results of the regression analysis. As can be seen, a number of variables such asproperty type, housing characteristics and land size and timing were controlled and tested in orderto assess their impact on property value.
Table 8 South Morang Station regression results
Variables Coefficient Std. Err. t P>t [95% Conf. Interval]
Property type
Business property 171.5 50.2 3.42 0.00 72.8 270.3
Commercial property 28.3 58.3 0.49 0.63 -86.3 143.0
House 86.0 41.8 2.06 0.04 3.8 168.2
Land( 55.7 42.3 1.32 0.19 -27.6 139.0
Unit 50.8 41.5 1.22 0.22 -30.8 132.5
Housing characteristics
No. of beds 7.8 2.4 3.22 0.00 3.0 12.6
No. of bathrooms 9.8 3.9 2.54 0.01 2.2 17.4
No. of car spaces -4.2 2.7 -1.56 0.12 -9.4 1.1
0%
5%
10%
15%
20%
25%
30%
35%
40%
150 400 650 900 1,150Distance from rail station (metres)
Commercial Residential
Heavy/Metro Commuter Rail
Crossrail (residential) Crossrail (commercial)
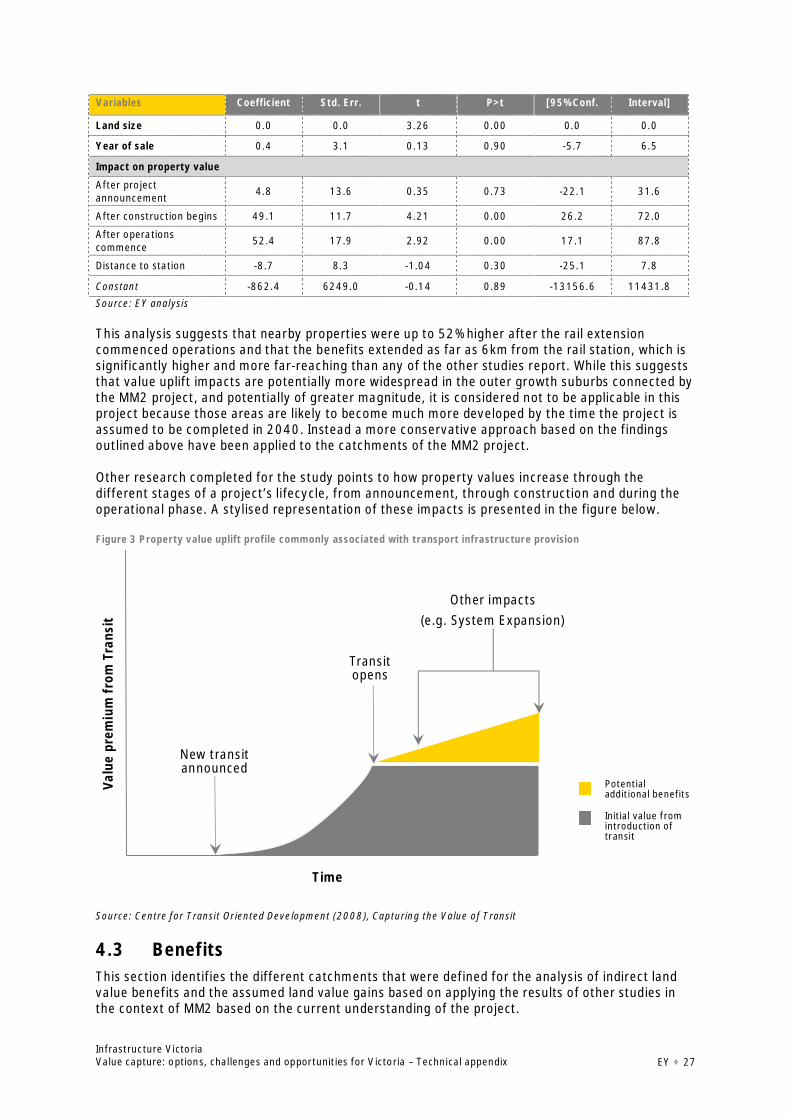
Infrastructure VictoriaValue capture: options, challenges and opportunities for Victoria – Technical appendix EY ÷ 27
Variables Coefficient Std. Err. t P>t [95% Conf. Interval]
Land size 0.0 0.0 3.26 0.00 0.0 0.0
Year of sale 0.4 3.1 0.13 0.90 -5.7 6.5
Impact on property value
After projectannouncement 4.8 13.6 0.35 0.73 -22.1 31.6
After construction begins 49.1 11.7 4.21 0.00 26.2 72.0
After operationscommence 52.4 17.9 2.92 0.00 17.1 87.8
Distance to station -8.7 8.3 -1.04 0.30 -25.1 7.8
Constant -862.4 6249.0 -0.14 0.89 -13156.6 11431.8Source: EY analysis
This analysis suggests that nearby properties were up to 52% higher after the rail extensioncommenced operations and that the benefits extended as far as 6km from the rail station, which issignificantly higher and more far-reaching than any of the other studies report. While this suggeststhat value uplift impacts are potentially more widespread in the outer growth suburbs connected bythe MM2 project, and potentially of greater magnitude, it is considered not to be applicable in thisproject because those areas are likely to become much more developed by the time the project isassumed to be completed in 2040. Instead a more conservative approach based on the findingsoutlined above have been applied to the catchments of the MM2 project.
Other research completed for the study points to how property values increase through thedifferent stages of a project’s lifecycle, from announcement, through construction and during theoperational phase. A stylised representation of these impacts is presented in the figure below.
Figure 3 Property value uplift profile commonly associated with transport infrastructure provision
Source: Centre for Transit Oriented Development (2008), Capturing the Value of Transit
4.3 BenefitsThis section identifies the different catchments that were defined for the analysis of indirect landvalue benefits and the assumed land value gains based on applying the results of other studies inthe context of MM2 based on the current understanding of the project.
Valu
epr
emiu
mfr
omTr
ansi
t
New transitannounced
Transitopens
Other impacts(e.g. System Expansion)
Time
Potentialadditional benefits
Initial value fromintroduction oftransit
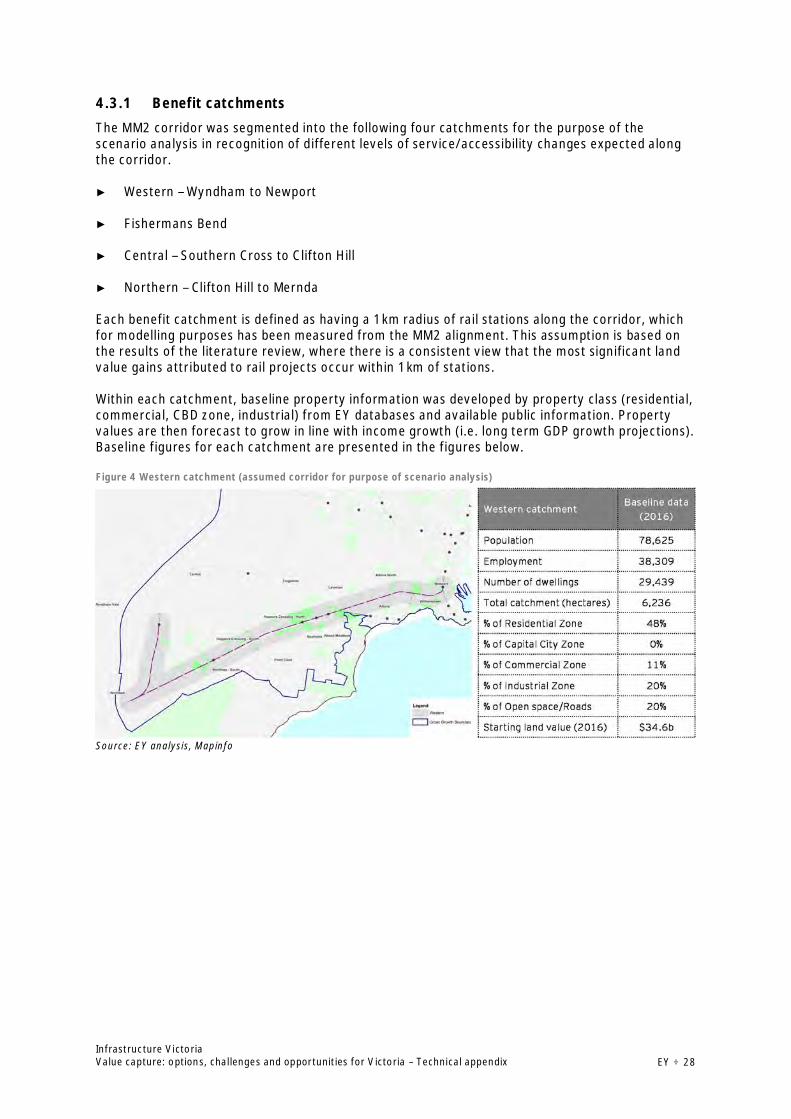
Infrastructure VictoriaValue capture: options, challenges and opportunities for Victoria – Technical appendix EY ÷ 28
4.3.1 Benefit catchments
The MM2 corridor was segmented into the following four catchments for the purpose of thescenario analysis in recognition of different levels of service/accessibility changes expected alongthe corridor.
► Western – Wyndham to Newport
► Fishermans Bend
► Central – Southern Cross to Clifton Hill
► Northern – Clifton Hill to Mernda
Each benefit catchment is defined as having a 1km radius of rail stations along the corridor, whichfor modelling purposes has been measured from the MM2 alignment. This assumption is based onthe results of the literature review, where there is a consistent view that the most significant landvalue gains attributed to rail projects occur within 1km of stations.
Within each catchment, baseline property information was developed by property class (residential,commercial, CBD zone, industrial) from EY databases and available public information. Propertyvalues are then forecast to grow in line with income growth (i.e. long term GDP growth projections).Baseline figures for each catchment are presented in the figures below.
Figure 4 Western catchment (assumed corridor for purpose of scenario analysis)
Source: EY analysis, Mapinfo
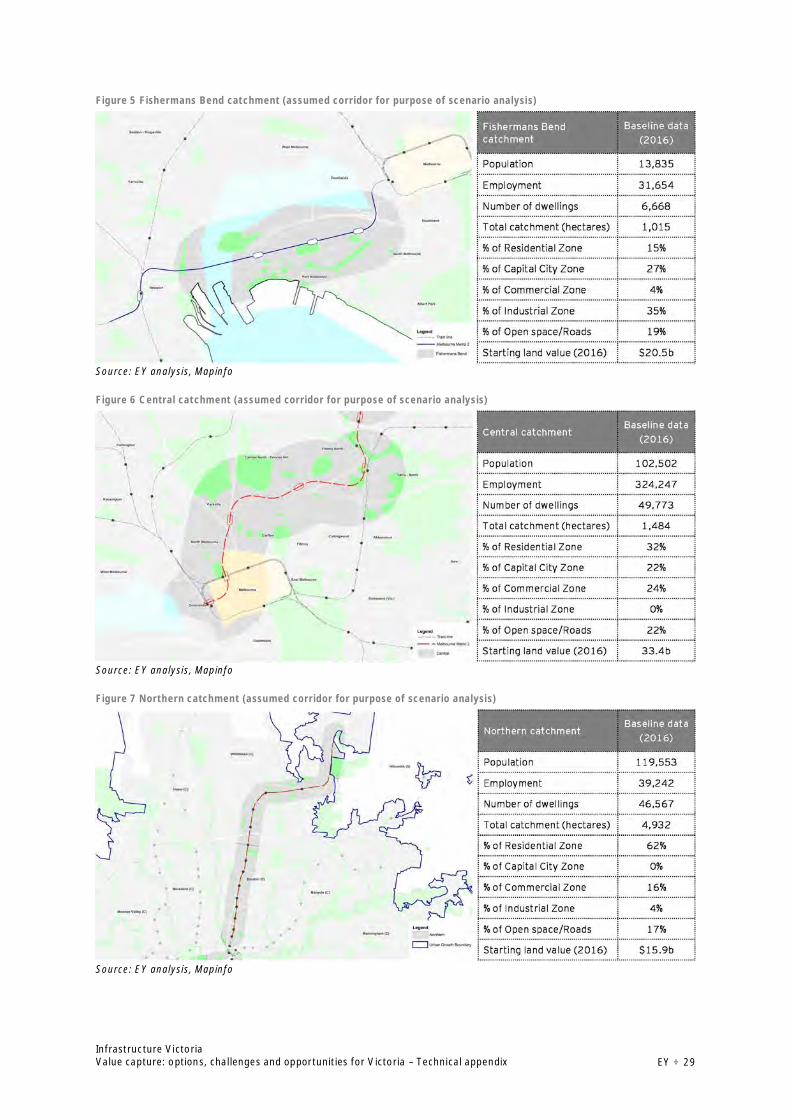
Infrastructure VictoriaValue capture: options, challenges and opportunities for Victoria – Technical appendix EY ÷ 29
Figure 5 Fishermans Bend catchment (assumed corridor for purpose of scenario analysis)
Source: EY analysis, Mapinfo
Figure 6 Central catchment (assumed corridor for purpose of scenario analysis)
Source: EY analysis, Mapinfo
Figure 7 Northern catchment (assumed corridor for purpose of scenario analysis)
Source: EY analysis, Mapinfo

Infrastructure VictoriaValue capture: options, challenges and opportunities for Victoria – Technical appendix EY ÷ 30
4.3.2 Estimated benefits: land value gains
MM2 will provide new stations in Fishermans Bend and North Fitzroy and extra capacity for thecorridor, with a second and more direct route for the Werribee lines into the CBD, allowing for moreservices to be run. This increase in services would benefit all commuters along the rail corridor byimproving the level of accessibility for these areas, and thus increasing the attractiveness of theseareas for home buyers.
Western and northern rail corridors: The MM2 project will improve rail connectivity for the westernand northern rail corridors and provide better access to employment in the CBD, Fishermans Bendand other parts of inner Melbourne, with up to 33 extra services (165% increase) on the WerribeeLine, and an extra 18 services (75% increase) from Rushall to Mernda. By enabling faster and morefrequent rail services, demand for rail services will increase due to large journey time savings.However, these benefits may be offset by increased crowding. Demand for residential propertyalong the western and northern rail corridors is expected to increase as a results of theseimprovements.
Montague and Wirraway (Fishermans Bend catchment): As part of the MM2 project, two newstations will be built in Fishermans Bend (Montague, Wirraway). This will provide a step-changeincrease in rail connectivity for the Fishermans Bend precinct as it is connected to the urban railnetwork. A key benefit for business will be its enhanced access to labour markets acrossMelbourne. Fishermans Bend will also become better connected with other employment centres onthe rail network with up to 42 new services being delivered, supporting both commuting fromFishermans Bend and business-to-business interactions. Travel to and from Fishermans Bend willbecome less car reliant, reducing local area congestion and parking requirements. There may alsobe less congestion on some strategic routes serving the precinct. Additional public transportdemand could increase crowding on other parts of the network.
CBD, Southbank, Docklands and North Fitzroy (Central catchment): Modest increases in railconnectivity at Southern Cross (5% increase in services) and Flagstaff (14% increase in services) willfree up capacity from the City Loop, particularly during peak periods, allowing more services to runon other lines and providing more efficient travel for commuters into the city for work. A moresignificant increase in rail connectivity is expected at Parkville (up to 42 new services or 88%increase), although accessibility gains are limited by available rail and other public transport androad options, particularly after the step-change already provided by MM1. It will also significantlyimprove rail connectivity for the surrounding precinct in North Fitzroy, given the new stationassumed there. While the area is already well served by other public transport and roadconnections, the new station will help to reduce crowding on existing tram and bus serviceconnecting the area with the CBD and Parkville in particular.
Each catchment was analysed individually in terms of their projected land values (assumed to growin line with nominal GDP) and assessed value uplifts to estimate the impact attributable to theproject. For example, the Fishermans Bend catchment would benefit from a commuter rail systemwhere previously there was no rail services in place. Therefore, properties within that catchmentwould benefit from the full value uplift due to commuter rail. However, MM2 would move theWestern catchment from what is equivalent to a heavy rail level of service to a more frequentcommuter rail system and therefore would only benefit from the incremental value uplift associatedwith that change. Half the uplift was assumed for the Central and Northern catchments given thelower relative increase in rail services the project provides for those station catchments.
These assumptions are summarised in the table below and presented alongside the estimates ofindirect land value gains that accrue to properties after construction is completed and operationscommence in 2040.
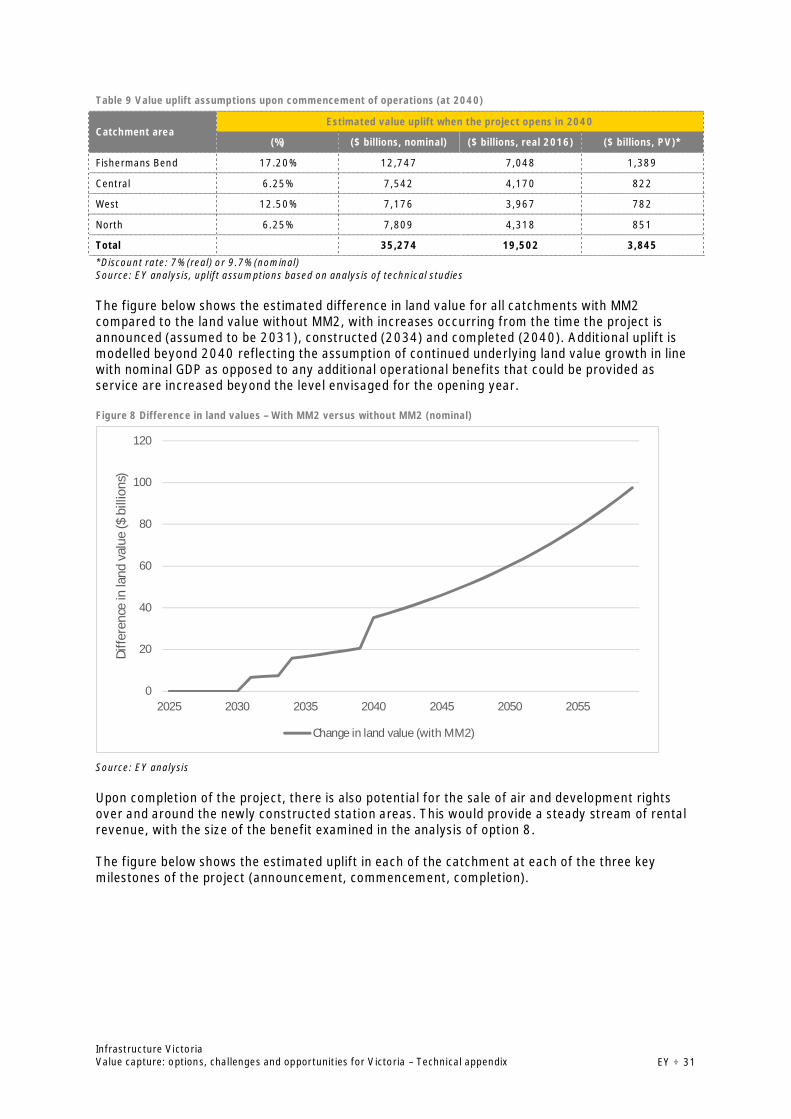
Infrastructure VictoriaValue capture: options, challenges and opportunities for Victoria – Technical appendix EY ÷ 31
Table 9 Value uplift assumptions upon commencement of operations (at 2040)
Catchment areaEstimated value uplift when the project opens in 2040
(%) ($ billions, nominal) ($ billions, real 2016) ($ billions, PV)*
Fishermans Bend 17.20% 12,747 7,048 1,389
Central 6.25% 7,542 4,170 822
West 12.50% 7,176 3,967 782
North 6.25% 7,809 4,318 851
Total 35,274 19,502 3,845
*Discount rate: 7% (real) or 9.7% (nominal)Source: EY analysis, uplift assumptions based on analysis of technical studies
The figure below shows the estimated difference in land value for all catchments with MM2compared to the land value without MM2, with increases occurring from the time the project isannounced (assumed to be 2031), constructed (2034) and completed (2040). Additional uplift ismodelled beyond 2040 reflecting the assumption of continued underlying land value growth in linewith nominal GDP as opposed to any additional operational benefits that could be provided asservice are increased beyond the level envisaged for the opening year.
Figure 8 Difference in land values – With MM2 versus without MM2 (nominal)
Source: EY analysis
Upon completion of the project, there is also potential for the sale of air and development rightsover and around the newly constructed station areas. This would provide a steady stream of rentalrevenue, with the size of the benefit examined in the analysis of option 8.
The figure below shows the estimated uplift in each of the catchment at each of the three keymilestones of the project (announcement, commencement, completion).
0
20
40
60
80
100
120
2025 2030 2035 2040 2045 2050 2055
Diffe
renc
ein
land
valu
e($
billi
ons)
Change in land value (with MM2)
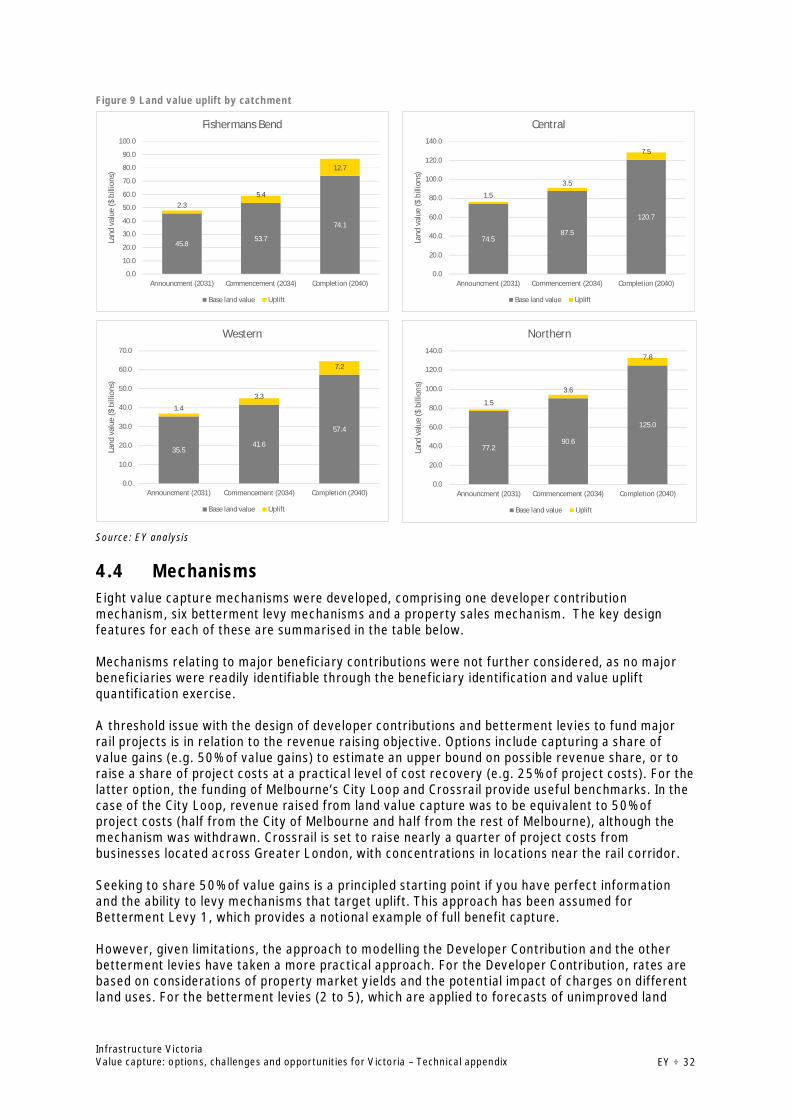
Infrastructure VictoriaValue capture: options, challenges and opportunities for Victoria – Technical appendix EY ÷ 32
Figure 9 Land value uplift by catchment
Source: EY analysis
4.4 MechanismsEight value capture mechanisms were developed, comprising one developer contributionmechanism, six betterment levy mechanisms and a property sales mechanism. The key designfeatures for each of these are summarised in the table below.
Mechanisms relating to major beneficiary contributions were not further considered, as no majorbeneficiaries were readily identifiable through the beneficiary identification and value upliftquantification exercise.
A threshold issue with the design of developer contributions and betterment levies to fund majorrail projects is in relation to the revenue raising objective. Options include capturing a share ofvalue gains (e.g. 50% of value gains) to estimate an upper bound on possible revenue share, or toraise a share of project costs at a practical level of cost recovery (e.g. 25% of project costs). For thelatter option, the funding of Melbourne’s City Loop and Crossrail provide useful benchmarks. In thecase of the City Loop, revenue raised from land value capture was to be equivalent to 50% ofproject costs (half from the City of Melbourne and half from the rest of Melbourne), although themechanism was withdrawn. Crossrail is set to raise nearly a quarter of project costs frombusinesses located across Greater London, with concentrations in locations near the rail corridor.
Seeking to share 50% of value gains is a principled starting point if you have perfect informationand the ability to levy mechanisms that target uplift. This approach has been assumed forBetterment Levy 1, which provides a notional example of full benefit capture.
However, given limitations, the approach to modelling the Developer Contribution and the otherbetterment levies have taken a more practical approach. For the Developer Contribution, rates arebased on considerations of property market yields and the potential impact of charges on differentland uses. For the betterment levies (2 to 5), which are applied to forecasts of unimproved land
45.853.7
74.1
2.35.4
12.7
0.0
10.0
20.0
30.0
40.0
50.0
60.0
70.0
80.0
90.0
100.0
Announcment (2031) Commencement (2034) Completion (2040)
Land
valu
e($
billi
ons)
Fishermans Bend
Base land value Uplift
74.587.5
120.7
1.5
3.5
7.5
0.0
20.0
40.0
60.0
80.0
100.0
120.0
140.0
Announcment (2031) Commencement (2034) Completion (2040)
Land
valu
e($
billi
ons)
Central
Base land value Uplift
35.541.6
57.4
1.4
3.3
7.2
0.0
10.0
20.0
30.0
40.0
50.0
60.0
70.0
Announcment (2031) Commencement (2034) Completion (2040)
Land
valu
e($
billi
ons)
Western
Base land value Uplift
77.290.6
125.0
1.5
3.6
7.8
0.0
20.0
40.0
60.0
80.0
100.0
120.0
140.0
Announcment (2031) Commencement (2034) Completion (2040)
Land
valu
e($
billi
ons)
Northern
Base land value Uplift
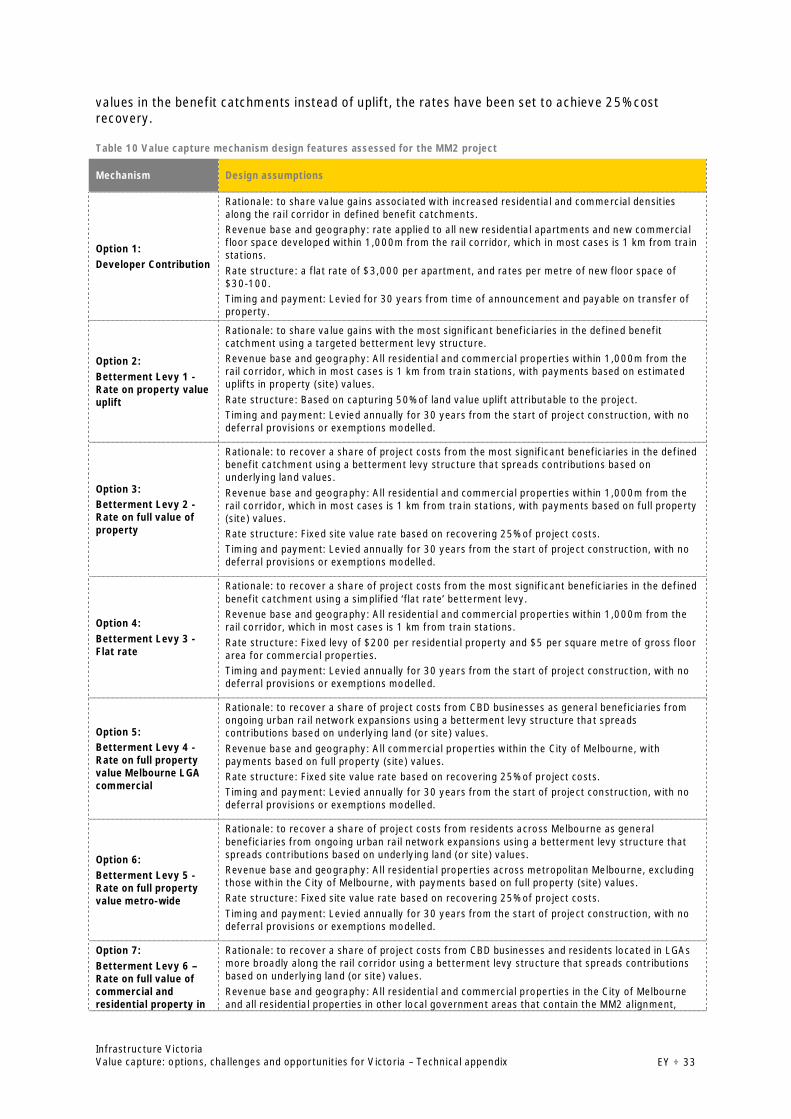
Infrastructure VictoriaValue capture: options, challenges and opportunities for Victoria – Technical appendix EY ÷ 33
values in the benefit catchments instead of uplift, the rates have been set to achieve 25% costrecovery.
Table 10 Value capture mechanism design features assessed for the MM2 project
Mechanism Design assumptions
Option 1:Developer Contribution
Rationale: to share value gains associated with increased residential and commercial densitiesalong the rail corridor in defined benefit catchments.Revenue base and geography: rate applied to all new residential apartments and new commercialfloor space developed within 1,000m from the rail corridor, which in most cases is 1 km from trainstations.Rate structure: a flat rate of $3,000 per apartment, and rates per metre of new floor space of$30-100.Timing and payment: Levied for 30 years from time of announcement and payable on transfer ofproperty.
Option 2:Betterment Levy 1 -Rate on property valueuplift
Rationale: to share value gains with the most significant beneficiaries in the defined benefitcatchment using a targeted betterment levy structure.Revenue base and geography: All residential and commercial properties within 1,000m from therail corridor, which in most cases is 1 km from train stations, with payments based on estimateduplifts in property (site) values.Rate structure: Based on capturing 50% of land value uplift attributable to the project.Timing and payment: Levied annually for 30 years from the start of project construction, with nodeferral provisions or exemptions modelled.
Option 3:Betterment Levy 2 -Rate on full value ofproperty
Rationale: to recover a share of project costs from the most significant beneficiaries in the definedbenefit catchment using a betterment levy structure that spreads contributions based onunderlying land values.Revenue base and geography: All residential and commercial properties within 1,000m from therail corridor, which in most cases is 1 km from train stations, with payments based on full property(site) values.Rate structure: Fixed site value rate based on recovering 25% of project costs.Timing and payment: Levied annually for 30 years from the start of project construction, with nodeferral provisions or exemptions modelled.
Option 4:Betterment Levy 3 -Flat rate
Rationale: to recover a share of project costs from the most significant beneficiaries in the definedbenefit catchment using a simplified ‘flat rate’ betterment levy.Revenue base and geography: All residential and commercial properties within 1,000m from therail corridor, which in most cases is 1 km from train stations.Rate structure: Fixed levy of $200 per residential property and $5 per square metre of gross floorarea for commercial properties.Timing and payment: Levied annually for 30 years from the start of project construction, with nodeferral provisions or exemptions modelled.
Option 5:Betterment Levy 4 -Rate on full propertyvalue Melbourne LGAcommercial
Rationale: to recover a share of project costs from CBD businesses as general beneficiaries fromongoing urban rail network expansions using a betterment levy structure that spreadscontributions based on underlying land (or site) values.Revenue base and geography: All commercial properties within the City of Melbourne, withpayments based on full property (site) values.Rate structure: Fixed site value rate based on recovering 25% of project costs.Timing and payment: Levied annually for 30 years from the start of project construction, with nodeferral provisions or exemptions modelled.
Option 6:Betterment Levy 5 -Rate on full propertyvalue metro-wide
Rationale: to recover a share of project costs from residents across Melbourne as generalbeneficiaries from ongoing urban rail network expansions using a betterment levy structure thatspreads contributions based on underlying land (or site) values.Revenue base and geography: All residential properties across metropolitan Melbourne, excludingthose within the City of Melbourne, with payments based on full property (site) values.Rate structure: Fixed site value rate based on recovering 25% of project costs.Timing and payment: Levied annually for 30 years from the start of project construction, with nodeferral provisions or exemptions modelled.
Option 7:Betterment Levy 6 –Rate on full value ofcommercial andresidential property in
Rationale: to recover a share of project costs from CBD businesses and residents located in LGAsmore broadly along the rail corridor using a betterment levy structure that spreads contributionsbased on underlying land (or site) values.Revenue base and geography: All residential and commercial properties in the City of Melbourneand all residential properties in other local government areas that contain the MM2 alignment,
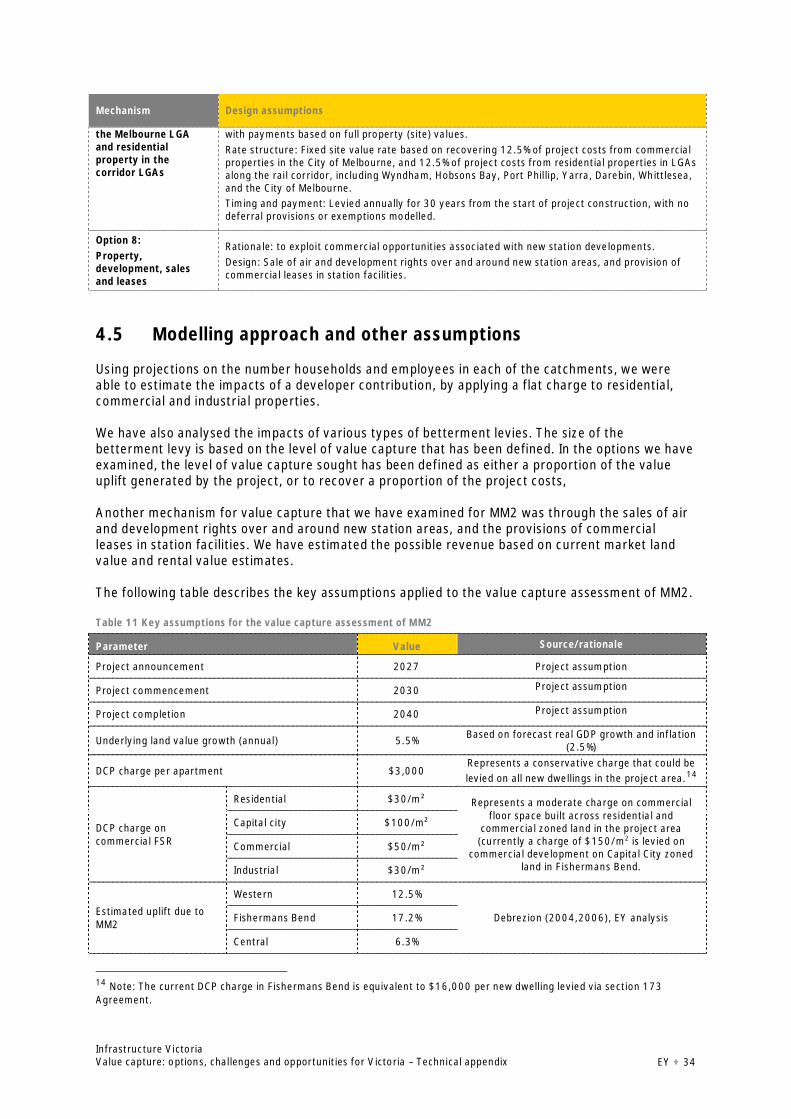
Infrastructure VictoriaValue capture: options, challenges and opportunities for Victoria – Technical appendix EY ÷ 34
Mechanism Design assumptions
the Melbourne LGAand residentialproperty in thecorridor LGAs
with payments based on full property (site) values.Rate structure: Fixed site value rate based on recovering 12.5% of project costs from commercialproperties in the City of Melbourne, and 12.5% of project costs from residential properties in LGAsalong the rail corridor, including Wyndham, Hobsons Bay, Port Phillip, Yarra, Darebin, Whittlesea,and the City of Melbourne.Timing and payment: Levied annually for 30 years from the start of project construction, with nodeferral provisions or exemptions modelled.
Option 8:Property,development, salesand leases
Rationale: to exploit commercial opportunities associated with new station developments.Design: Sale of air and development rights over and around new station areas, and provision ofcommercial leases in station facilities.
4.5 Modelling approach and other assumptions
Using projections on the number households and employees in each of the catchments, we wereable to estimate the impacts of a developer contribution, by applying a flat charge to residential,commercial and industrial properties.
We have also analysed the impacts of various types of betterment levies. The size of thebetterment levy is based on the level of value capture that has been defined. In the options we haveexamined, the level of value capture sought has been defined as either a proportion of the valueuplift generated by the project, or to recover a proportion of the project costs,
Another mechanism for value capture that we have examined for MM2 was through the sales of airand development rights over and around new station areas, and the provisions of commercialleases in station facilities. We have estimated the possible revenue based on current market landvalue and rental value estimates.
The following table describes the key assumptions applied to the value capture assessment of MM2.
Table 11 Key assumptions for the value capture assessment of MM2
Parameter Value Source/rationale
Project announcement 2027 Project assumption
Project commencement 2030 Project assumption
Project completion 2040 Project assumption
Underlying land value growth (annual) 5.5% Based on forecast real GDP growth and inflation(2.5%)
DCP charge per apartment $3,000Represents a conservative charge that could belevied on all new dwellings in the project area.14
DCP charge oncommercial FSR
Residential $30/m² Represents a moderate charge on commercialfloor space built across residential and
commercial zoned land in the project area(currently a charge of $150/m2 is levied on
commercial development on Capital City zonedland in Fishermans Bend.
Capital city $100/m²
Commercial $50/m²
Industrial $30/m²
Estimated uplift due toMM2
Western 12.5%
Debrezion (2004,2006), EY analysisFishermans Bend 17.2%
Central 6.3%
14 Note: The current DCP charge in Fishermans Bend is equivalent to $16,000 per new dwelling levied via section 173Agreement.
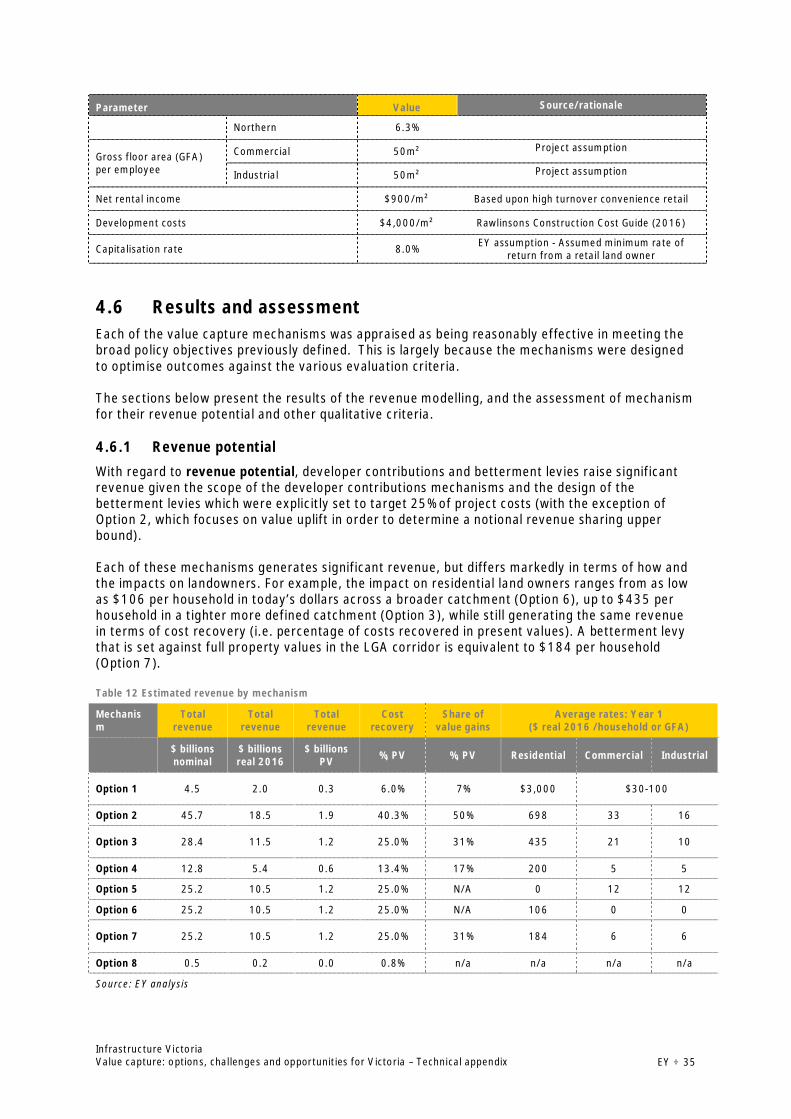
Infrastructure VictoriaValue capture: options, challenges and opportunities for Victoria – Technical appendix EY ÷ 35
Parameter Value Source/rationale
Northern 6.3%
Gross floor area (GFA)per employee
Commercial 50m² Project assumption
Industrial 50m² Project assumption
Net rental income $900/m² Based upon high turnover convenience retail
Development costs $4,000/m² Rawlinsons Construction Cost Guide (2016)
Capitalisation rate 8.0% EY assumption - Assumed minimum rate ofreturn from a retail land owner
4.6 Results and assessmentEach of the value capture mechanisms was appraised as being reasonably effective in meeting thebroad policy objectives previously defined. This is largely because the mechanisms were designedto optimise outcomes against the various evaluation criteria.
The sections below present the results of the revenue modelling, and the assessment of mechanismfor their revenue potential and other qualitative criteria.
4.6.1 Revenue potential
With regard to revenue potential, developer contributions and betterment levies raise significantrevenue given the scope of the developer contributions mechanisms and the design of thebetterment levies which were explicitly set to target 25% of project costs (with the exception ofOption 2, which focuses on value uplift in order to determine a notional revenue sharing upperbound).
Each of these mechanisms generates significant revenue, but differs markedly in terms of how andthe impacts on landowners. For example, the impact on residential land owners ranges from as lowas $106 per household in today’s dollars across a broader catchment (Option 6), up to $435 perhousehold in a tighter more defined catchment (Option 3), while still generating the same revenuein terms of cost recovery (i.e. percentage of costs recovered in present values). A betterment levythat is set against full property values in the LGA corridor is equivalent to $184 per household(Option 7).
Table 12 Estimated revenue by mechanism
Mechanism
Totalrevenue
Totalrevenue
Totalrevenue
Costrecovery
Share ofvalue gains
Average rates: Year 1($ real 2016 /household or GFA)
$ billionsnominal
$ billionsreal 2016
$ billionsPV %, PV %, PV Residential Commercial Industrial
Option 1 4.5 2.0 0.3 6.0% 7% $3,000 $30-100
Option 2 45.7 18.5 1.9 40.3% 50% 698 33 16
Option 3 28.4 11.5 1.2 25.0% 31% 435 21 10
Option 4 12.8 5.4 0.6 13.4% 17% 200 5 5
Option 5 25.2 10.5 1.2 25.0% N/A 0 12 12
Option 6 25.2 10.5 1.2 25.0% N/A 106 0 0
Option 7 25.2 10.5 1.2 25.0% 31% 184 6 6
Option 8 0.5 0.2 0.0 0.8% n/a n/a n/a n/a
Source: EY analysis
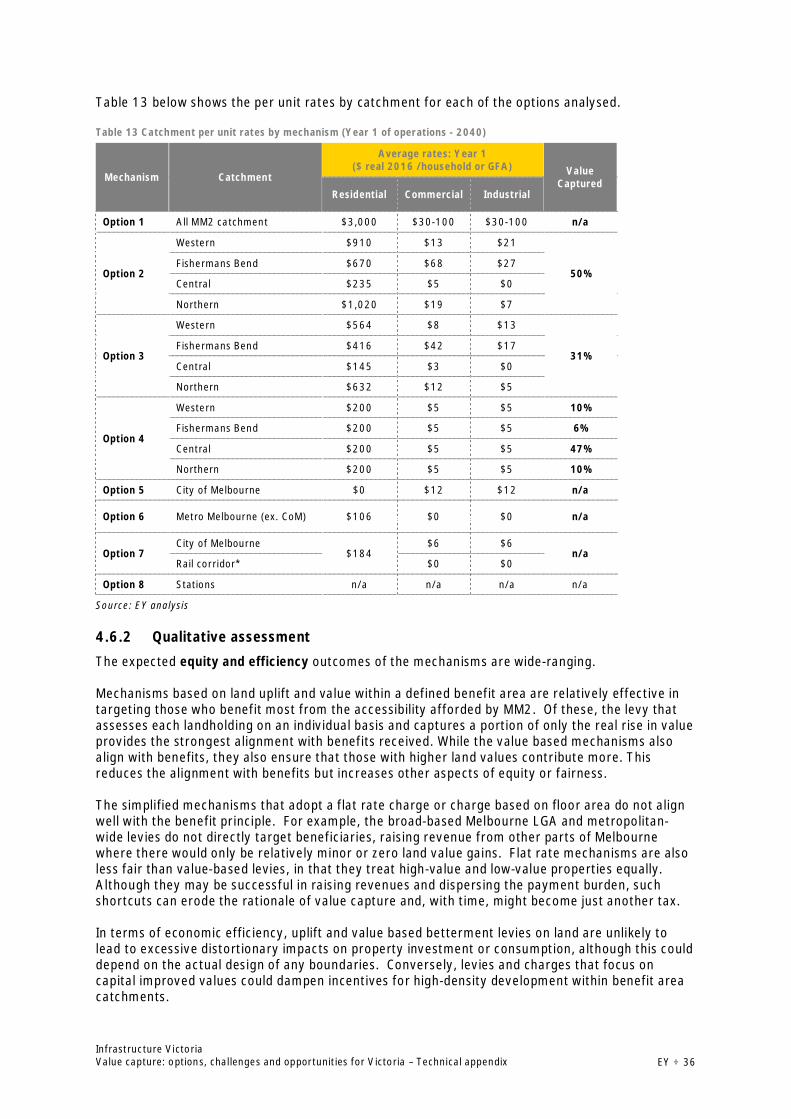
Infrastructure VictoriaValue capture: options, challenges and opportunities for Victoria – Technical appendix EY ÷ 36
Table 13 below shows the per unit rates by catchment for each of the options analysed.
Table 13 Catchment per unit rates by mechanism (Year 1 of operations - 2040)
Mechanism Catchment
Average rates: Year 1($ real 2016 /household or GFA) Value
CapturedResidential Commercial Industrial
Option 1 All MM2 catchment $3,000 $30-100 $30-100 n/a
Option 2
Western $910 $13 $21
50%Fishermans Bend $670 $68 $27
Central $235 $5 $0
Northern $1,020 $19 $7
Option 3
Western $564 $8 $13
31%Fishermans Bend $416 $42 $17
Central $145 $3 $0
Northern $632 $12 $5
Option 4
Western $200 $5 $5 10%
Fishermans Bend $200 $5 $5 6%
Central $200 $5 $5 47%
Northern $200 $5 $5 10%
Option 5 City of Melbourne $0 $12 $12 n/a
Option 6 Metro Melbourne (ex. CoM) $106 $0 $0 n/a
Option 7City of Melbourne
$184$6 $6
n/aRail corridor* $0 $0
Option 8 Stations n/a n/a n/a n/a
Source: EY analysis
4.6.2 Qualitative assessment
The expected equity and efficiency outcomes of the mechanisms are wide-ranging.
Mechanisms based on land uplift and value within a defined benefit area are relatively effective intargeting those who benefit most from the accessibility afforded by MM2. Of these, the levy thatassesses each landholding on an individual basis and captures a portion of only the real rise in valueprovides the strongest alignment with benefits received. While the value based mechanisms alsoalign with benefits, they also ensure that those with higher land values contribute more. Thisreduces the alignment with benefits but increases other aspects of equity or fairness.
The simplified mechanisms that adopt a flat rate charge or charge based on floor area do not alignwell with the benefit principle. For example, the broad-based Melbourne LGA and metropolitan-wide levies do not directly target beneficiaries, raising revenue from other parts of Melbournewhere there would only be relatively minor or zero land value gains. Flat rate mechanisms are alsoless fair than value-based levies, in that they treat high-value and low-value properties equally.Although they may be successful in raising revenues and dispersing the payment burden, suchshortcuts can erode the rationale of value capture and, with time, might become just another tax.
In terms of economic efficiency, uplift and value based betterment levies on land are unlikely tolead to excessive distortionary impacts on property investment or consumption, although this coulddepend on the actual design of any boundaries. Conversely, levies and charges that focus oncapital improved values could dampen incentives for high-density development within benefit areacatchments.
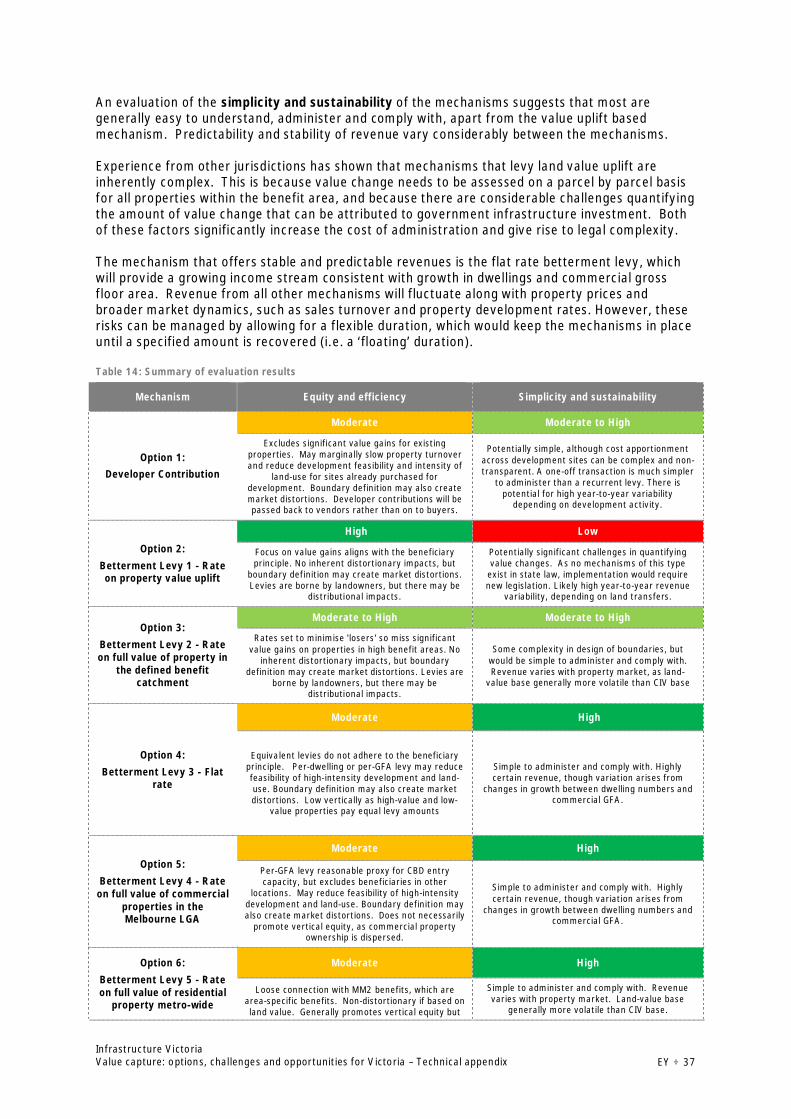
Infrastructure VictoriaValue capture: options, challenges and opportunities for Victoria – Technical appendix EY ÷ 37
An evaluation of the simplicity and sustainability of the mechanisms suggests that most aregenerally easy to understand, administer and comply with, apart from the value uplift basedmechanism. Predictability and stability of revenue vary considerably between the mechanisms.
Experience from other jurisdictions has shown that mechanisms that levy land value uplift areinherently complex. This is because value change needs to be assessed on a parcel by parcel basisfor all properties within the benefit area, and because there are considerable challenges quantifyingthe amount of value change that can be attributed to government infrastructure investment. Bothof these factors significantly increase the cost of administration and give rise to legal complexity.
The mechanism that offers stable and predictable revenues is the flat rate betterment levy, whichwill provide a growing income stream consistent with growth in dwellings and commercial grossfloor area. Revenue from all other mechanisms will fluctuate along with property prices andbroader market dynamics, such as sales turnover and property development rates. However, theserisks can be managed by allowing for a flexible duration, which would keep the mechanisms in placeuntil a specified amount is recovered (i.e. a ‘floating’ duration).
Table 14: Summary of evaluation results
Mechanism Equity and efficiency Simplicity and sustainability
Option 1:Developer Contribution
Moderate Moderate to High
Excludes significant value gains for existingproperties. May marginally slow property turnoverand reduce development feasibility and intensity of
land-use for sites already purchased fordevelopment. Boundary definition may also createmarket distortions. Developer contributions will bepassed back to vendors rather than on to buyers.
Potentially simple, although cost apportionmentacross development sites can be complex and non-transparent. A one-off transaction is much simpler
to administer than a recurrent levy. There ispotential for high year-to-year variability
depending on development activity.
Option 2:Betterment Levy 1 - Rateon property value uplift
High Low
Focus on value gains aligns with the beneficiaryprinciple. No inherent distortionary impacts, but
boundary definition may create market distortions.Levies are borne by landowners, but there may be
distributional impacts.
Potentially significant challenges in quantifyingvalue changes. As no mechanisms of this type
exist in state law, implementation would requirenew legislation. Likely high year-to-year revenue
variability, depending on land transfers.
Option 3:Betterment Levy 2 - Rateon full value of property in
the defined benefitcatchment
Moderate to High Moderate to High
Rates set to minimise 'losers' so miss significantvalue gains on properties in high benefit areas. No
inherent distortionary impacts, but boundarydefinition may create market distortions. Levies are
borne by landowners, but there may bedistributional impacts.
Some complexity in design of boundaries, butwould be simple to administer and comply with.Revenue varies with property market, as land-
value base generally more volatile than CIV base
Option 4:Betterment Levy 3 - Flat
rate
Moderate High
Equivalent levies do not adhere to the beneficiaryprinciple. Per-dwelling or per-GFA levy may reducefeasibility of high-intensity development and land-use. Boundary definition may also create marketdistortions. Low vertically as high-value and low-
value properties pay equal levy amounts
Simple to administer and comply with. Highlycertain revenue, though variation arises from
changes in growth between dwelling numbers andcommercial GFA.
Option 5:Betterment Levy 4 - Rate
on full value of commercialproperties in theMelbourne LGA
Moderate High
Per-GFA levy reasonable proxy for CBD entrycapacity, but excludes beneficiaries in other
locations. May reduce feasibility of high-intensitydevelopment and land-use. Boundary definition mayalso create market distortions. Does not necessarily
promote vertical equity, as commercial propertyownership is dispersed.
Simple to administer and comply with. Highlycertain revenue, though variation arises from
changes in growth between dwelling numbers andcommercial GFA.
Option 6:Betterment Levy 5 - Rateon full value of residential
property metro-wide
Moderate High
Loose connection with MM2 benefits, which arearea-specific benefits. Non-distortionary if based onland value. Generally promotes vertical equity but
Simple to administer and comply with. Revenuevaries with property market. Land-value base
generally more volatile than CIV base.
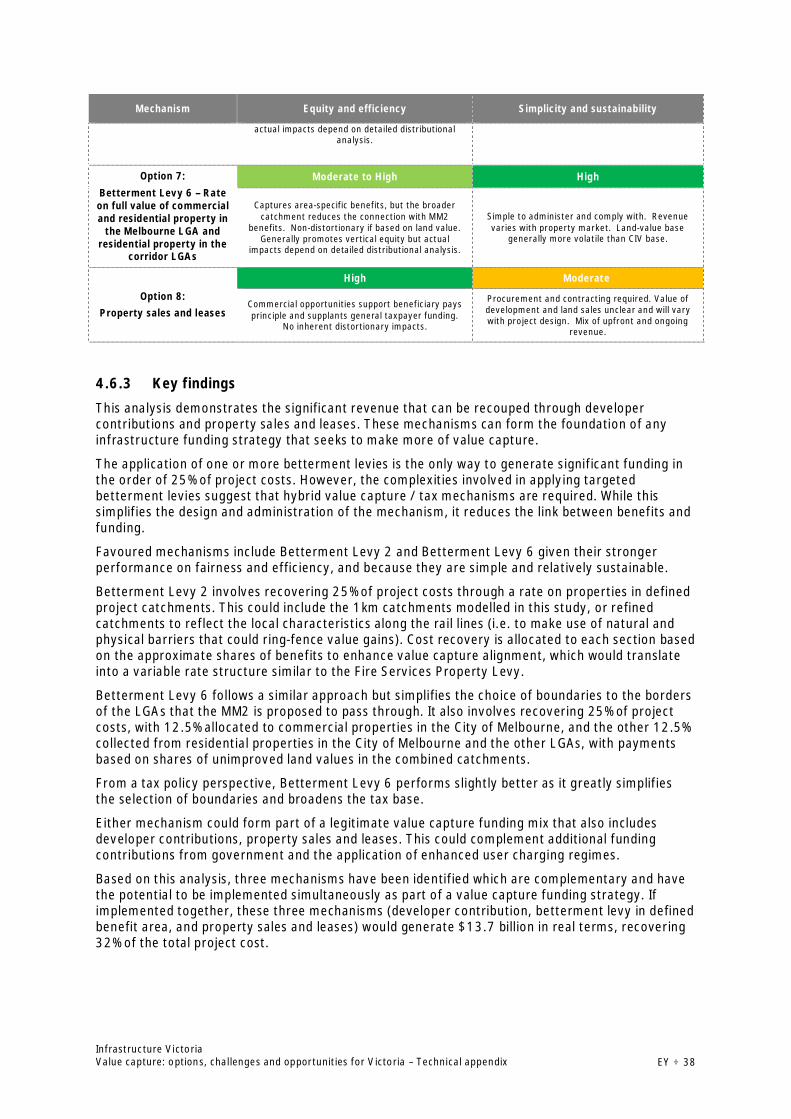
Infrastructure VictoriaValue capture: options, challenges and opportunities for Victoria – Technical appendix EY ÷ 38
Mechanism Equity and efficiency Simplicity and sustainability
actual impacts depend on detailed distributionalanalysis.
Option 7:Betterment Levy 6 – Rateon full value of commercialand residential property in
the Melbourne LGA andresidential property in the
corridor LGAs
Moderate to High High
Captures area-specific benefits, but the broadercatchment reduces the connection with MM2
benefits. Non-distortionary if based on land value.Generally promotes vertical equity but actual
impacts depend on detailed distributional analysis.
Simple to administer and comply with. Revenuevaries with property market. Land-value base
generally more volatile than CIV base.
Option 8:Property sales and leases
High Moderate
Commercial opportunities support beneficiary paysprinciple and supplants general taxpayer funding.
No inherent distortionary impacts.
Procurement and contracting required. Value ofdevelopment and land sales unclear and will varywith project design. Mix of upfront and ongoing
revenue.
4.6.3 Key findings
This analysis demonstrates the significant revenue that can be recouped through developercontributions and property sales and leases. These mechanisms can form the foundation of anyinfrastructure funding strategy that seeks to make more of value capture.
The application of one or more betterment levies is the only way to generate significant funding inthe order of 25% of project costs. However, the complexities involved in applying targetedbetterment levies suggest that hybrid value capture / tax mechanisms are required. While thissimplifies the design and administration of the mechanism, it reduces the link between benefits andfunding.
Favoured mechanisms include Betterment Levy 2 and Betterment Levy 6 given their strongerperformance on fairness and efficiency, and because they are simple and relatively sustainable.
Betterment Levy 2 involves recovering 25% of project costs through a rate on properties in definedproject catchments. This could include the 1km catchments modelled in this study, or refinedcatchments to reflect the local characteristics along the rail lines (i.e. to make use of natural andphysical barriers that could ring-fence value gains). Cost recovery is allocated to each section basedon the approximate shares of benefits to enhance value capture alignment, which would translateinto a variable rate structure similar to the Fire Services Property Levy.
Betterment Levy 6 follows a similar approach but simplifies the choice of boundaries to the bordersof the LGAs that the MM2 is proposed to pass through. It also involves recovering 25% of projectcosts, with 12.5% allocated to commercial properties in the City of Melbourne, and the other 12.5%collected from residential properties in the City of Melbourne and the other LGAs, with paymentsbased on shares of unimproved land values in the combined catchments.
From a tax policy perspective, Betterment Levy 6 performs slightly better as it greatly simplifiesthe selection of boundaries and broadens the tax base.
Either mechanism could form part of a legitimate value capture funding mix that also includesdeveloper contributions, property sales and leases. This could complement additional fundingcontributions from government and the application of enhanced user charging regimes.
Based on this analysis, three mechanisms have been identified which are complementary and havethe potential to be implemented simultaneously as part of a value capture funding strategy. Ifimplemented together, these three mechanisms (developer contribution, betterment levy in definedbenefit area, and property sales and leases) would generate $13.7 billion in real terms, recovering32% of the total project cost.
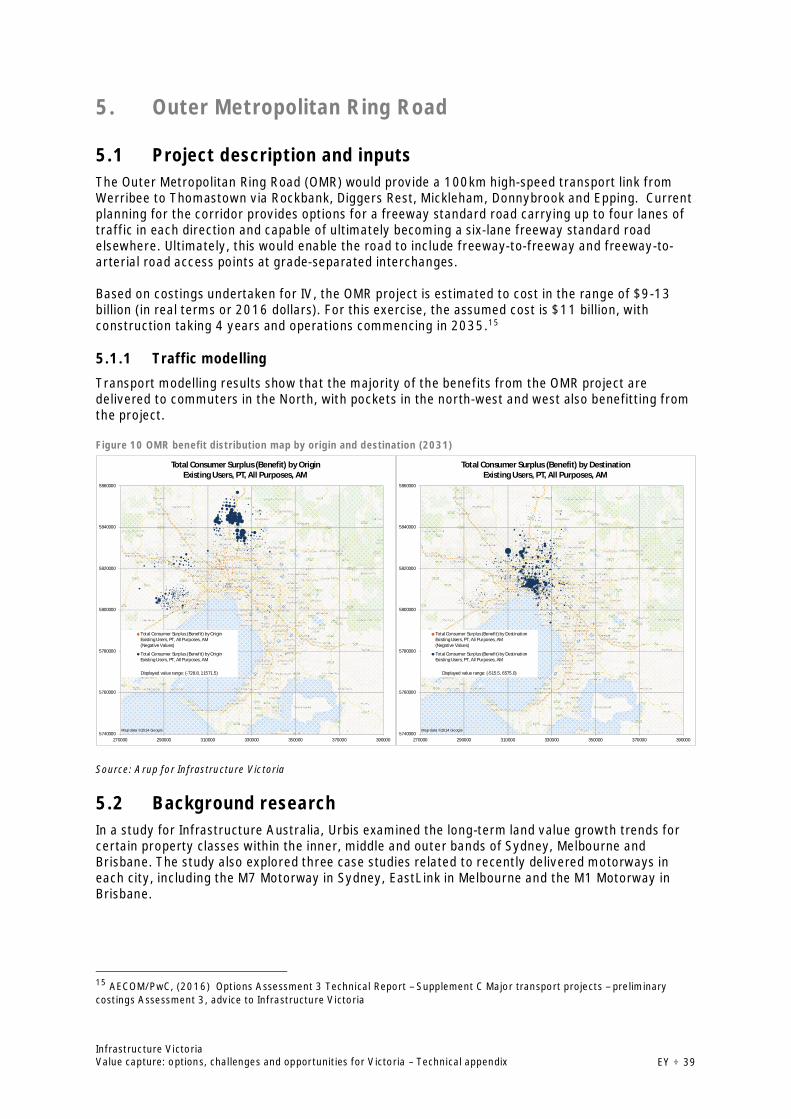
Infrastructure VictoriaValue capture: options, challenges and opportunities for Victoria – Technical appendix EY ÷ 39
5. Outer Metropolitan Ring Road
5.1 Project description and inputsThe Outer Metropolitan Ring Road (OMR) would provide a 100km high-speed transport link fromWerribee to Thomastown via Rockbank, Diggers Rest, Mickleham, Donnybrook and Epping. Currentplanning for the corridor provides options for a freeway standard road carrying up to four lanes oftraffic in each direction and capable of ultimately becoming a six-lane freeway standard roadelsewhere. Ultimately, this would enable the road to include freeway-to-freeway and freeway-to-arterial road access points at grade-separated interchanges.
Based on costings undertaken for IV, the OMR project is estimated to cost in the range of $9-13billion (in real terms or 2016 dollars). For this exercise, the assumed cost is $11 billion, withconstruction taking 4 years and operations commencing in 2035.15
5.1.1 Traffic modelling
Transport modelling results show that the majority of the benefits from the OMR project aredelivered to commuters in the North, with pockets in the north-west and west also benefitting fromthe project.
Figure 10 OMR benefit distribution map by origin and destination (2031)
Source: Arup for Infrastructure Victoria
5.2 Background researchIn a study for Infrastructure Australia, Urbis examined the long-term land value growth trends forcertain property classes within the inner, middle and outer bands of Sydney, Melbourne andBrisbane. The study also explored three case studies related to recently delivered motorways ineach city, including the M7 Motorway in Sydney, EastLink in Melbourne and the M1 Motorway inBrisbane.
15 AECOM/PwC, (2016) Options Assessment 3 Technical Report – Supplement C Major transport projects – preliminarycostings Assessment 3, advice to Infrastructure Victoria
5740000
5760000
5780000
5800000
5820000
5840000
5860000
270000 290000 310000 330000 350000 370000 390000
Total Consumer Surplus (Benefit) by OriginExisting Users, PT, All Purposes, AM
Total Consumer Surplus (Benefit) by OriginExisting Users, PT, All Purposes, AM(Negative Values)
Total Consumer Surplus (Benefit) by OriginExisting Users, PT, All Purposes, AM
Map data ©2014 Google
Displayed value range: (-728.8, 11571.5)
5740000
5760000
5780000
5800000
5820000
5840000
5860000
270000 290000 310000 330000 350000 370000 390000
Total Consumer Surplus (Benefit) by DestinationExisting Users, PT, All Purposes, AM
Total Consumer Surplus (Benefit) by DestinationExisting Users, PT, All Purposes, AM(Negative Values)
Total Consumer Surplus (Benefit) by DestinationExisting Users, PT, All Purposes, AM
Map data ©2014 Google
Displayed value range: (-515.5, 6575.0)
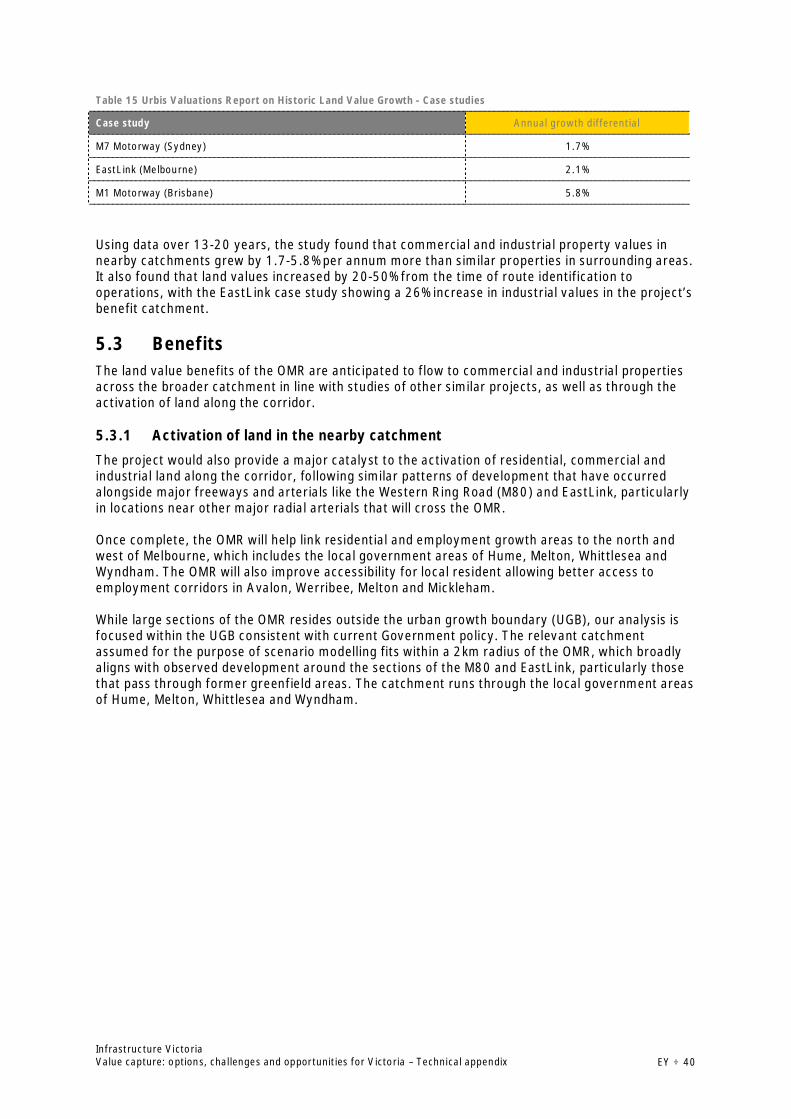
Infrastructure VictoriaValue capture: options, challenges and opportunities for Victoria – Technical appendix EY ÷ 40
Table 15 Urbis Valuations Report on Historic Land Value Growth - Case studies
Case study Annual growth differential
M7 Motorway (Sydney) 1.7%
EastLink (Melbourne) 2.1%
M1 Motorway (Brisbane) 5.8%
Using data over 13-20 years, the study found that commercial and industrial property values innearby catchments grew by 1.7-5.8% per annum more than similar properties in surrounding areas.It also found that land values increased by 20-50% from the time of route identification tooperations, with the EastLink case study showing a 26% increase in industrial values in the project’sbenefit catchment.
5.3 BenefitsThe land value benefits of the OMR are anticipated to flow to commercial and industrial propertiesacross the broader catchment in line with studies of other similar projects, as well as through theactivation of land along the corridor.
5.3.1 Activation of land in the nearby catchment
The project would also provide a major catalyst to the activation of residential, commercial andindustrial land along the corridor, following similar patterns of development that have occurredalongside major freeways and arterials like the Western Ring Road (M80) and EastLink, particularlyin locations near other major radial arterials that will cross the OMR.
Once complete, the OMR will help link residential and employment growth areas to the north andwest of Melbourne, which includes the local government areas of Hume, Melton, Whittlesea andWyndham. The OMR will also improve accessibility for local resident allowing better access toemployment corridors in Avalon, Werribee, Melton and Mickleham.
While large sections of the OMR resides outside the urban growth boundary (UGB), our analysis isfocused within the UGB consistent with current Government policy. The relevant catchmentassumed for the purpose of scenario modelling fits within a 2km radius of the OMR, which broadlyaligns with observed development around the sections of the M80 and EastLink, particularly thosethat pass through former greenfield areas. The catchment runs through the local government areasof Hume, Melton, Whittlesea and Wyndham.
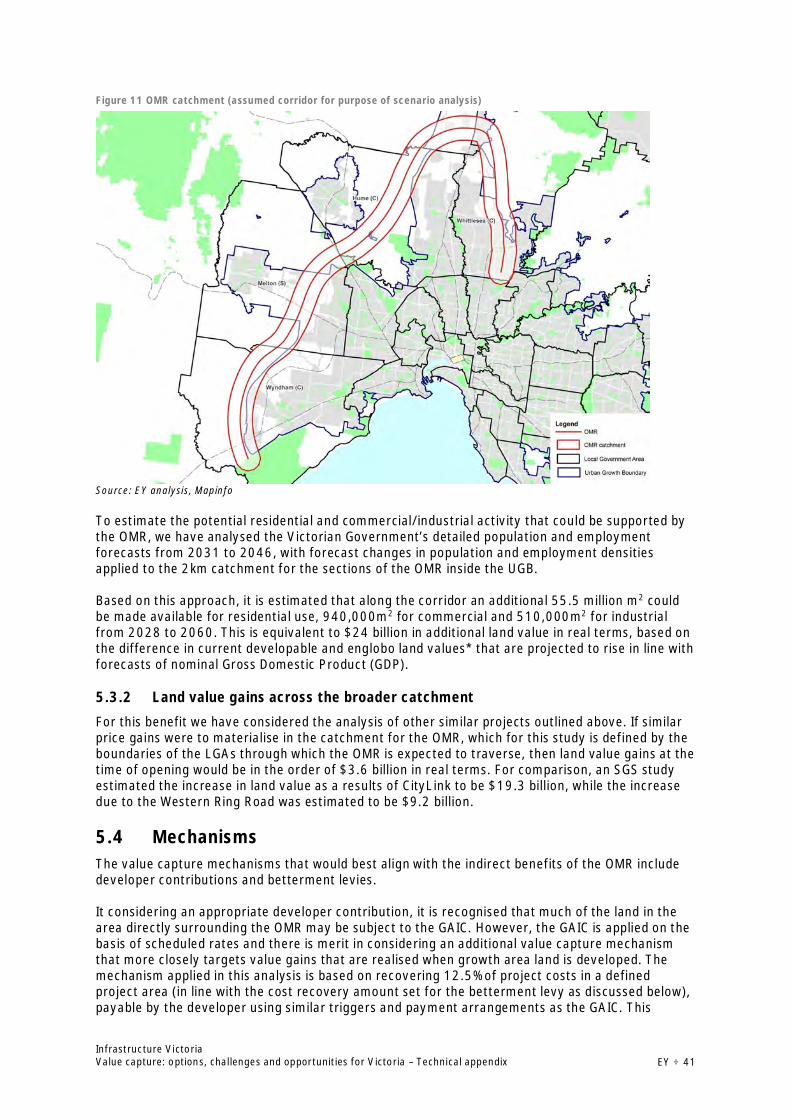
Infrastructure VictoriaValue capture: options, challenges and opportunities for Victoria – Technical appendix EY ÷ 41
Figure 11 OMR catchment (assumed corridor for purpose of scenario analysis)
Source: EY analysis, Mapinfo
To estimate the potential residential and commercial/industrial activity that could be supported bythe OMR, we have analysed the Victorian Government’s detailed population and employmentforecasts from 2031 to 2046, with forecast changes in population and employment densitiesapplied to the 2km catchment for the sections of the OMR inside the UGB.
Based on this approach, it is estimated that along the corridor an additional 55.5 million m2 couldbe made available for residential use, 940,000m2 for commercial and 510,000m2 for industrialfrom 2028 to 2060. This is equivalent to $24 billion in additional land value in real terms, based onthe difference in current developable and englobo land values* that are projected to rise in line withforecasts of nominal Gross Domestic Product (GDP).
5.3.2 Land value gains across the broader catchment
For this benefit we have considered the analysis of other similar projects outlined above. If similarprice gains were to materialise in the catchment for the OMR, which for this study is defined by theboundaries of the LGAs through which the OMR is expected to traverse, then land value gains at thetime of opening would be in the order of $3.6 billion in real terms. For comparison, an SGS studyestimated the increase in land value as a results of CityLink to be $19.3 billion, while the increasedue to the Western Ring Road was estimated to be $9.2 billion.
5.4 MechanismsThe value capture mechanisms that would best align with the indirect benefits of the OMR includedeveloper contributions and betterment levies.
It considering an appropriate developer contribution, it is recognised that much of the land in thearea directly surrounding the OMR may be subject to the GAIC. However, the GAIC is applied on thebasis of scheduled rates and there is merit in considering an additional value capture mechanismthat more closely targets value gains that are realised when growth area land is developed. Themechanism applied in this analysis is based on recovering 12.5% of project costs in a definedproject area (in line with the cost recovery amount set for the betterment levy as discussed below),payable by the developer using similar triggers and payment arrangements as the GAIC. This
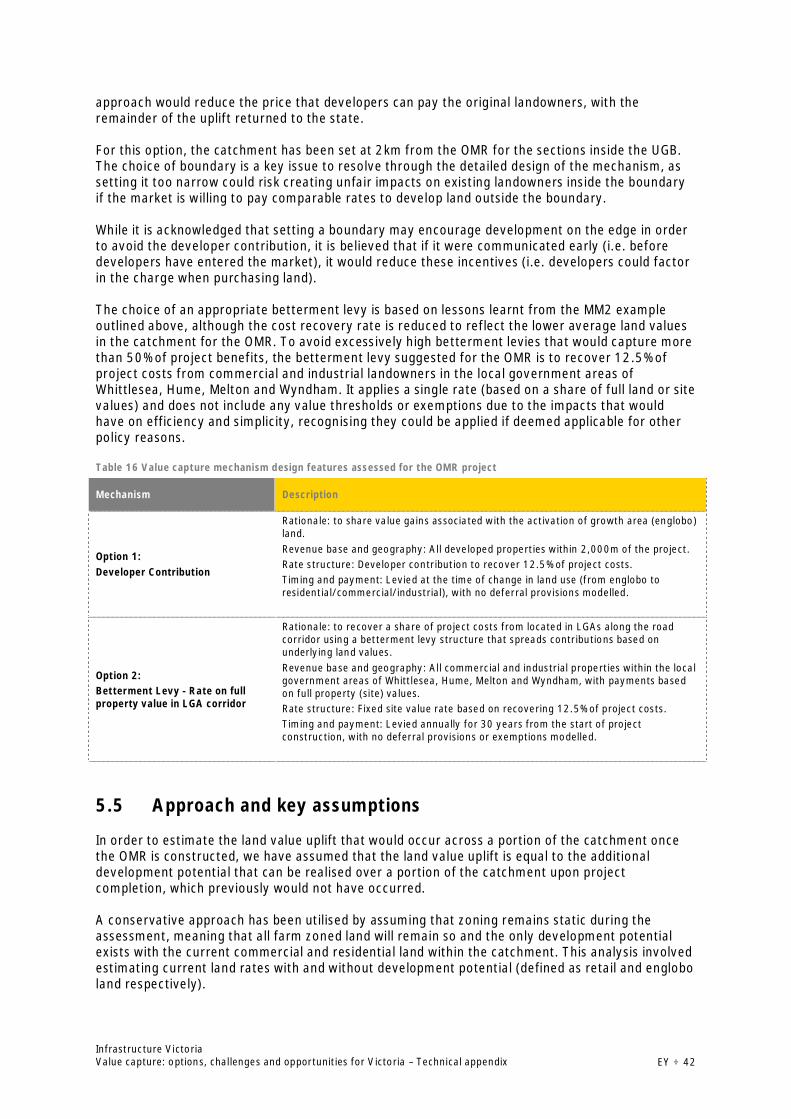
Infrastructure VictoriaValue capture: options, challenges and opportunities for Victoria – Technical appendix EY ÷ 42
approach would reduce the price that developers can pay the original landowners, with theremainder of the uplift returned to the state.
For this option, the catchment has been set at 2km from the OMR for the sections inside the UGB.The choice of boundary is a key issue to resolve through the detailed design of the mechanism, assetting it too narrow could risk creating unfair impacts on existing landowners inside the boundaryif the market is willing to pay comparable rates to develop land outside the boundary.
While it is acknowledged that setting a boundary may encourage development on the edge in orderto avoid the developer contribution, it is believed that if it were communicated early (i.e. beforedevelopers have entered the market), it would reduce these incentives (i.e. developers could factorin the charge when purchasing land).
The choice of an appropriate betterment levy is based on lessons learnt from the MM2 exampleoutlined above, although the cost recovery rate is reduced to reflect the lower average land valuesin the catchment for the OMR. To avoid excessively high betterment levies that would capture morethan 50% of project benefits, the betterment levy suggested for the OMR is to recover 12.5% ofproject costs from commercial and industrial landowners in the local government areas ofWhittlesea, Hume, Melton and Wyndham. It applies a single rate (based on a share of full land or sitevalues) and does not include any value thresholds or exemptions due to the impacts that wouldhave on efficiency and simplicity, recognising they could be applied if deemed applicable for otherpolicy reasons.
Table 16 Value capture mechanism design features assessed for the OMR project
Mechanism Description
Option 1:Developer Contribution
Rationale: to share value gains associated with the activation of growth area (englobo)land.Revenue base and geography: All developed properties within 2,000m of the project.Rate structure: Developer contribution to recover 12.5% of project costs.Timing and payment: Levied at the time of change in land use (from englobo toresidential/commercial/industrial), with no deferral provisions modelled.
Option 2:Betterment Levy - Rate on fullproperty value in LGA corridor
Rationale: to recover a share of project costs from located in LGAs along the roadcorridor using a betterment levy structure that spreads contributions based onunderlying land values.Revenue base and geography: All commercial and industrial properties within the localgovernment areas of Whittlesea, Hume, Melton and Wyndham, with payments basedon full property (site) values.Rate structure: Fixed site value rate based on recovering 12.5% of project costs.Timing and payment: Levied annually for 30 years from the start of projectconstruction, with no deferral provisions or exemptions modelled.
5.5 Approach and key assumptions
In order to estimate the land value uplift that would occur across a portion of the catchment oncethe OMR is constructed, we have assumed that the land value uplift is equal to the additionaldevelopment potential that can be realised over a portion of the catchment upon projectcompletion, which previously would not have occurred.
A conservative approach has been utilised by assuming that zoning remains static during theassessment, meaning that all farm zoned land will remain so and the only development potentialexists with the current commercial and residential land within the catchment. This analysis involvedestimating current land rates with and without development potential (defined as retail and engloboland respectively).
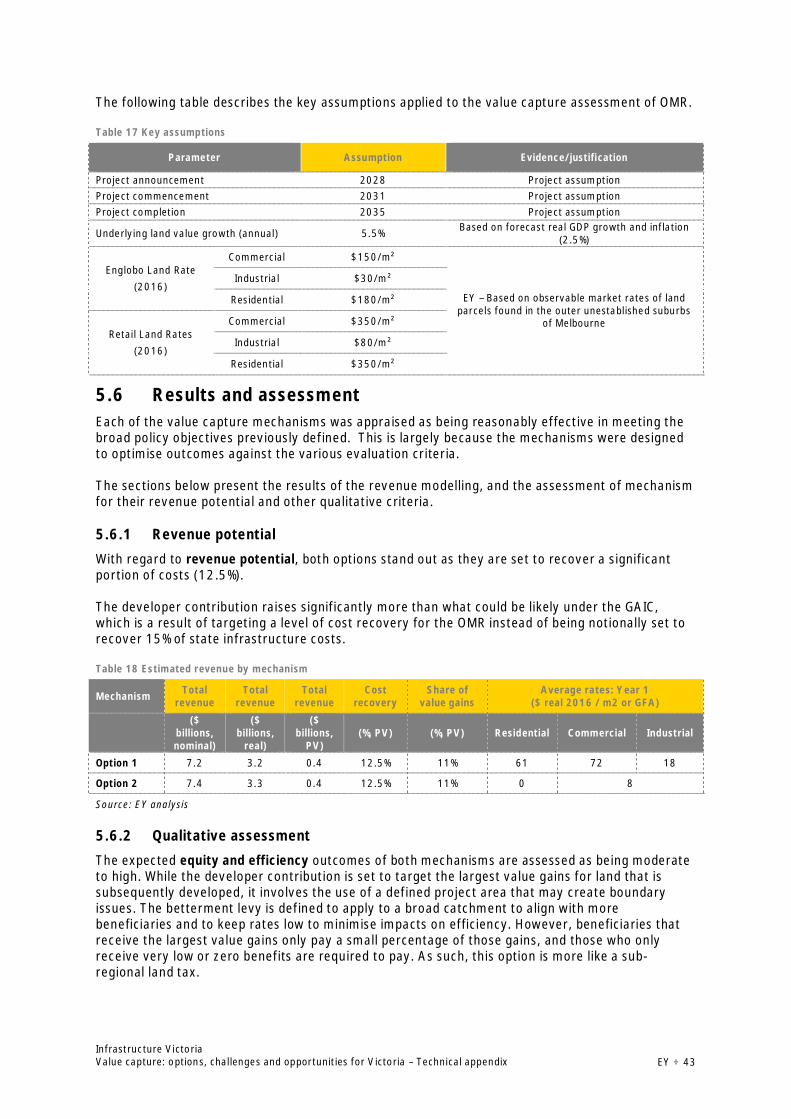
Infrastructure VictoriaValue capture: options, challenges and opportunities for Victoria – Technical appendix EY ÷ 43
The following table describes the key assumptions applied to the value capture assessment of OMR.
Table 17 Key assumptions
Parameter Assumption Evidence/justification
Project announcement 2028 Project assumptionProject commencement 2031 Project assumptionProject completion 2035 Project assumption
Underlying land value growth (annual) 5.5% Based on forecast real GDP growth and inflation(2.5%)
Englobo Land Rate(2016)
Commercial $150/m²
EY – Based on observable market rates of landparcels found in the outer unestablished suburbs
of Melbourne
Industrial $30/m²
Residential $180/m²
Retail Land Rates(2016)
Commercial $350/m²
Industrial $80/m²
Residential $350/m²
5.6 Results and assessmentEach of the value capture mechanisms was appraised as being reasonably effective in meeting thebroad policy objectives previously defined. This is largely because the mechanisms were designedto optimise outcomes against the various evaluation criteria.
The sections below present the results of the revenue modelling, and the assessment of mechanismfor their revenue potential and other qualitative criteria.
5.6.1 Revenue potential
With regard to revenue potential, both options stand out as they are set to recover a significantportion of costs (12.5%).
The developer contribution raises significantly more than what could be likely under the GAIC,which is a result of targeting a level of cost recovery for the OMR instead of being notionally set torecover 15% of state infrastructure costs.
Table 18 Estimated revenue by mechanism
Mechanism Totalrevenue
Totalrevenue
Totalrevenue
Costrecovery
Share ofvalue gains
Average rates: Year 1($ real 2016 / m2 or GFA)
($billions,nominal)
($billions,
real)
($billions,
PV)(%, PV) (%, PV) Residential Commercial Industrial
Option 1 7.2 3.2 0.4 12.5% 11% 61 72 18
Option 2 7.4 3.3 0.4 12.5% 11% 0 8
Source: EY analysis
5.6.2 Qualitative assessment
The expected equity and efficiency outcomes of both mechanisms are assessed as being moderateto high. While the developer contribution is set to target the largest value gains for land that issubsequently developed, it involves the use of a defined project area that may create boundaryissues. The betterment levy is defined to apply to a broad catchment to align with morebeneficiaries and to keep rates low to minimise impacts on efficiency. However, beneficiaries thatreceive the largest value gains only pay a small percentage of those gains, and those who onlyreceive very low or zero benefits are required to pay. As such, this option is more like a sub-regional land tax.
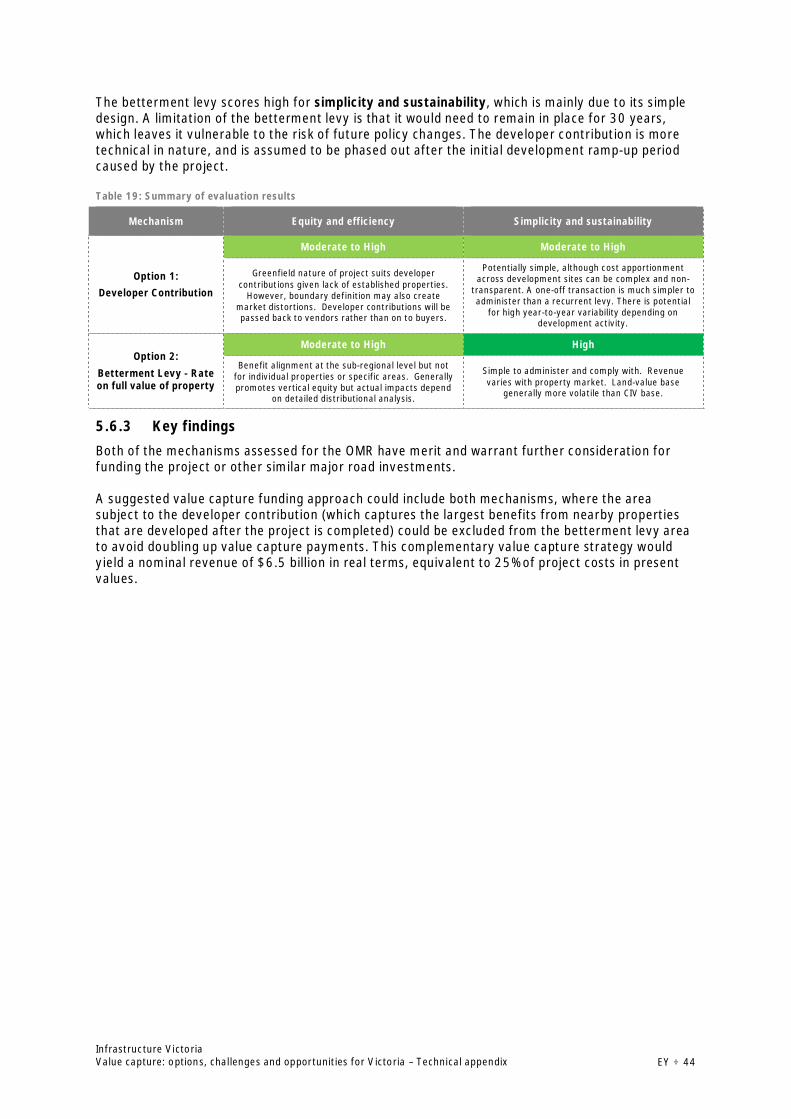
Infrastructure VictoriaValue capture: options, challenges and opportunities for Victoria – Technical appendix EY ÷ 44
The betterment levy scores high for simplicity and sustainability, which is mainly due to its simpledesign. A limitation of the betterment levy is that it would need to remain in place for 30 years,which leaves it vulnerable to the risk of future policy changes. The developer contribution is moretechnical in nature, and is assumed to be phased out after the initial development ramp-up periodcaused by the project.
Table 19: Summary of evaluation results
Mechanism Equity and efficiency Simplicity and sustainability
Option 1:Developer Contribution
Moderate to High Moderate to High
Greenfield nature of project suits developercontributions given lack of established properties.
However, boundary definition may also createmarket distortions. Developer contributions will bepassed back to vendors rather than on to buyers.
Potentially simple, although cost apportionmentacross development sites can be complex and non-
transparent. A one-off transaction is much simpler toadminister than a recurrent levy. There is potential
for high year-to-year variability depending ondevelopment activity.
Option 2:Betterment Levy - Rateon full value of property
Moderate to High High
Benefit alignment at the sub-regional level but notfor individual properties or specific areas. Generallypromotes vertical equity but actual impacts depend
on detailed distributional analysis.
Simple to administer and comply with. Revenuevaries with property market. Land-value base
generally more volatile than CIV base.
5.6.3 Key findings
Both of the mechanisms assessed for the OMR have merit and warrant further consideration forfunding the project or other similar major road investments.
A suggested value capture funding approach could include both mechanisms, where the areasubject to the developer contribution (which captures the largest benefits from nearby propertiesthat are developed after the project is completed) could be excluded from the betterment levy areato avoid doubling up value capture payments. This complementary value capture strategy wouldyield a nominal revenue of $6.5 billion in real terms, equivalent to 25% of project costs in presentvalues.
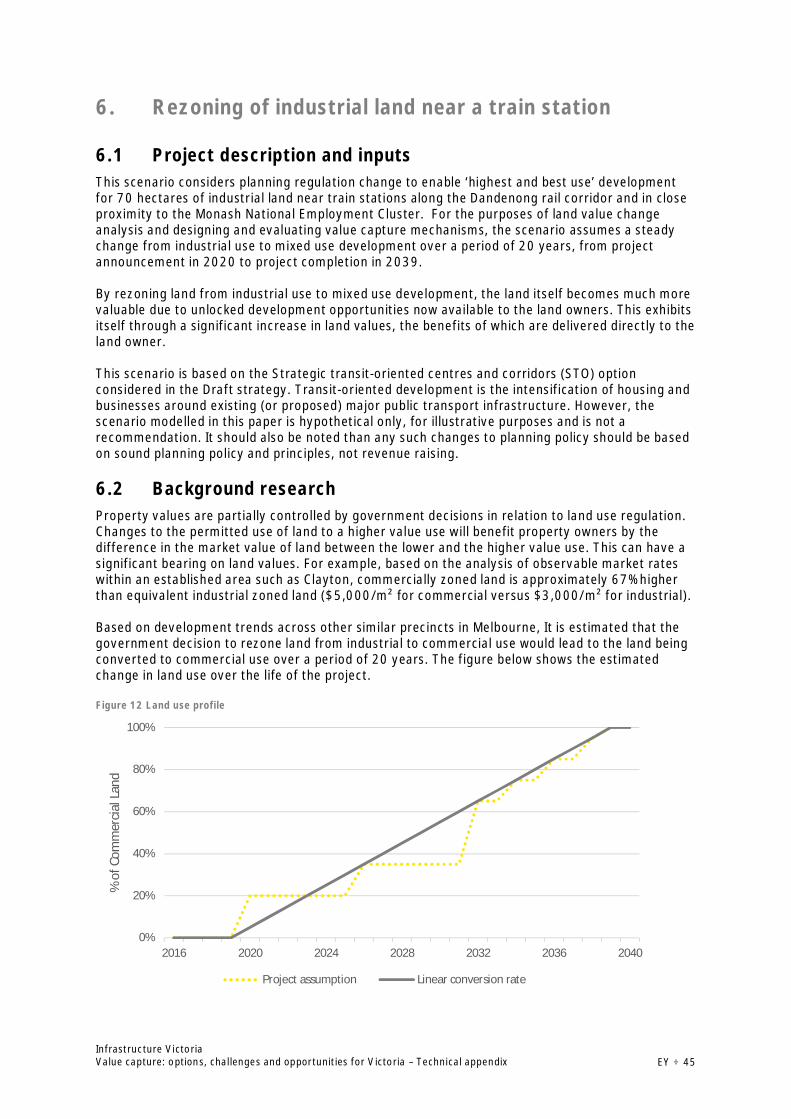
Infrastructure VictoriaValue capture: options, challenges and opportunities for Victoria – Technical appendix EY ÷ 45
6. Rezoning of industrial land near a train station
6.1 Project description and inputsThis scenario considers planning regulation change to enable ‘highest and best use’ developmentfor 70 hectares of industrial land near train stations along the Dandenong rail corridor and in closeproximity to the Monash National Employment Cluster. For the purposes of land value changeanalysis and designing and evaluating value capture mechanisms, the scenario assumes a steadychange from industrial use to mixed use development over a period of 20 years, from projectannouncement in 2020 to project completion in 2039.
By rezoning land from industrial use to mixed use development, the land itself becomes much morevaluable due to unlocked development opportunities now available to the land owners. This exhibitsitself through a significant increase in land values, the benefits of which are delivered directly to theland owner.
This scenario is based on the Strategic transit-oriented centres and corridors (STO) optionconsidered in the Draft strategy. Transit-oriented development is the intensification of housing andbusinesses around existing (or proposed) major public transport infrastructure. However, thescenario modelled in this paper is hypothetical only, for illustrative purposes and is not arecommendation. It should also be noted than any such changes to planning policy should be basedon sound planning policy and principles, not revenue raising.
6.2 Background researchProperty values are partially controlled by government decisions in relation to land use regulation.Changes to the permitted use of land to a higher value use will benefit property owners by thedifference in the market value of land between the lower and the higher value use. This can have asignificant bearing on land values. For example, based on the analysis of observable market rateswithin an established area such as Clayton, commercially zoned land is approximately 67% higherthan equivalent industrial zoned land ($5,000/m² for commercial versus $3,000/m² for industrial).
Based on development trends across other similar precincts in Melbourne, It is estimated that thegovernment decision to rezone land from industrial to commercial use would lead to the land beingconverted to commercial use over a period of 20 years. The figure below shows the estimatedchange in land use over the life of the project.
Figure 12 Land use profile
0%
20%
40%
60%
80%
100%
2016 2020 2024 2028 2032 2036 2040
%of
Com
mer
cial
Land
Project assumption Linear conversion rate
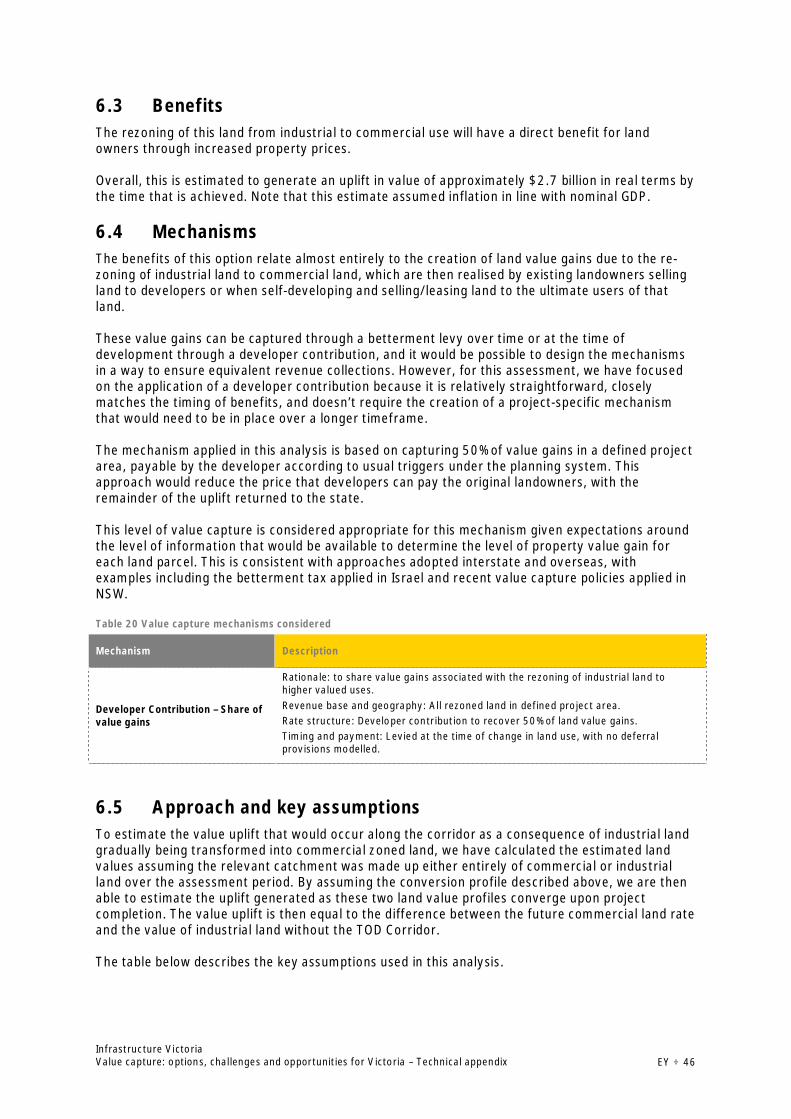
Infrastructure VictoriaValue capture: options, challenges and opportunities for Victoria – Technical appendix EY ÷ 46
6.3 BenefitsThe rezoning of this land from industrial to commercial use will have a direct benefit for landowners through increased property prices.
Overall, this is estimated to generate an uplift in value of approximately $2.7 billion in real terms bythe time that is achieved. Note that this estimate assumed inflation in line with nominal GDP.
6.4 MechanismsThe benefits of this option relate almost entirely to the creation of land value gains due to the re-zoning of industrial land to commercial land, which are then realised by existing landowners sellingland to developers or when self-developing and selling/leasing land to the ultimate users of thatland.
These value gains can be captured through a betterment levy over time or at the time ofdevelopment through a developer contribution, and it would be possible to design the mechanismsin a way to ensure equivalent revenue collections. However, for this assessment, we have focusedon the application of a developer contribution because it is relatively straightforward, closelymatches the timing of benefits, and doesn’t require the creation of a project-specific mechanismthat would need to be in place over a longer timeframe.
The mechanism applied in this analysis is based on capturing 50% of value gains in a defined projectarea, payable by the developer according to usual triggers under the planning system. Thisapproach would reduce the price that developers can pay the original landowners, with theremainder of the uplift returned to the state.
This level of value capture is considered appropriate for this mechanism given expectations aroundthe level of information that would be available to determine the level of property value gain foreach land parcel. This is consistent with approaches adopted interstate and overseas, withexamples including the betterment tax applied in Israel and recent value capture policies applied inNSW.
Table 20 Value capture mechanisms considered
Mechanism Description
Developer Contribution – Share ofvalue gains
Rationale: to share value gains associated with the rezoning of industrial land tohigher valued uses.Revenue base and geography: All rezoned land in defined project area.Rate structure: Developer contribution to recover 50% of land value gains.Timing and payment: Levied at the time of change in land use, with no deferralprovisions modelled.
6.5 Approach and key assumptionsTo estimate the value uplift that would occur along the corridor as a consequence of industrial landgradually being transformed into commercial zoned land, we have calculated the estimated landvalues assuming the relevant catchment was made up either entirely of commercial or industrialland over the assessment period. By assuming the conversion profile described above, we are thenable to estimate the uplift generated as these two land value profiles converge upon projectcompletion. The value uplift is then equal to the difference between the future commercial land rateand the value of industrial land without the TOD Corridor.
The table below describes the key assumptions used in this analysis.
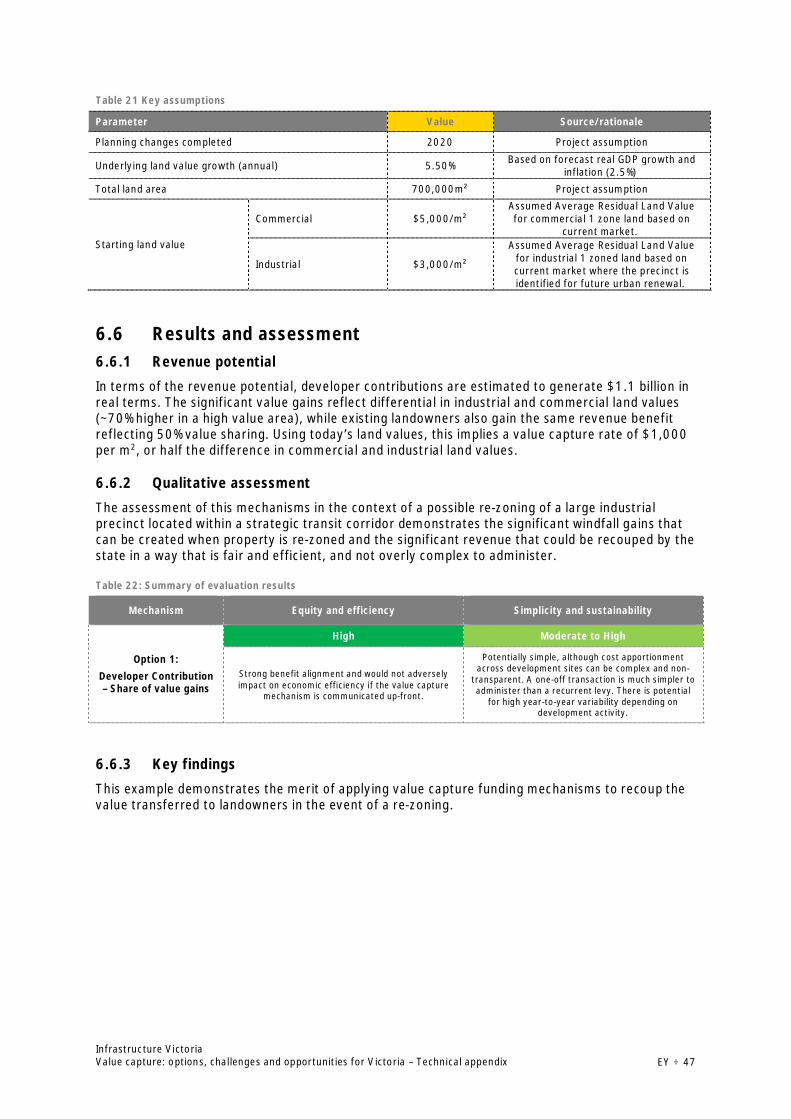
Infrastructure VictoriaValue capture: options, challenges and opportunities for Victoria – Technical appendix EY ÷ 47
Table 21 Key assumptions
Parameter Value Source/rationale
Planning changes completed 2020 Project assumption
Underlying land value growth (annual) 5.50% Based on forecast real GDP growth andinflation (2.5%)
Total land area 700,000m² Project assumption
Starting land value
Commercial $5,000/m²Assumed Average Residual Land Valuefor commercial 1 zone land based on
current market.
Industrial $3,000/m²
Assumed Average Residual Land Valuefor industrial 1 zoned land based oncurrent market where the precinct isidentified for future urban renewal.
6.6 Results and assessment6.6.1 Revenue potential
In terms of the revenue potential, developer contributions are estimated to generate $1.1 billion inreal terms. The significant value gains reflect differential in industrial and commercial land values(~70% higher in a high value area), while existing landowners also gain the same revenue benefitreflecting 50% value sharing. Using today’s land values, this implies a value capture rate of $1,000per m2, or half the difference in commercial and industrial land values.
6.6.2 Qualitative assessment
The assessment of this mechanisms in the context of a possible re-zoning of a large industrialprecinct located within a strategic transit corridor demonstrates the significant windfall gains thatcan be created when property is re-zoned and the significant revenue that could be recouped by thestate in a way that is fair and efficient, and not overly complex to administer.
Table 22: Summary of evaluation results
Mechanism Equity and efficiency Simplicity and sustainability
Option 1:Developer Contribution– Share of value gains
High Moderate to High
Strong benefit alignment and would not adverselyimpact on economic efficiency if the value capture
mechanism is communicated up-front.
Potentially simple, although cost apportionmentacross development sites can be complex and non-
transparent. A one-off transaction is much simpler toadminister than a recurrent levy. There is potential
for high year-to-year variability depending ondevelopment activity.
6.6.3 Key findings
This example demonstrates the merit of applying value capture funding mechanisms to recoup thevalue transferred to landowners in the event of a re-zoning.
Infrastructure VictoriaValue capture: options, challenges and opportunities for Victoria – Technical appendix EY ÷ 48
7. Public housing asset rationalisation and refurbishment
7.1 Project description and inputsThe main challenges of Victoria’s public housing are ageing assets; supply does not meet demand;and, there is a mismatch between assets and tenant requirements. Most public housing estates arewell located in Melbourne’s inner and middle suburbs close to established communityinfrastructure.
To ensure financial sustainability, the Director of Housing seeks to maintain a diverse assetportfolio, which includes a balance between retaining and divesting assets in high value locations.For instance, a number of social housing sites contain social housing that takes up only a smallproportion of the land, with parking and low utilised open space taking up the remainder of thesites. For example, in the short term, there are sites in inner-middle suburban areas that could besuited to redevelopment. Over the longer term, there are high rise estates in inner Melbourne sitesthat could suitable.
This illustrative option proposes to increase and improve the asset base of an existing publichousing estate through an alternative asset development model. In particular, by transferringdevelopments rights of the surplus land to developers, the landowners (in this instance, thegovernment department responsible for social housing) benefit from the windfall due to increasedland values and integrated delivery. This would enable the department to meet growing demand forsocial housing, with the option to redirect other funds to refurbishment of the high-rise publichousing tower.
This scenario is based on the Public housing asset rationalisation and refurbishment (SHA) optionconsidered in the Draft strategy. However, the scenario modelled in this paper is hypothetical only,for illustrative purposes and is not a recommendation.
7.2 BenefitsThe project assumes that 30,000m2 of surplus land is made available to community housingproviders who license a developer to deliver new social housing stock on half the site (15,000m2)with an allowance for private housing on the balance of the site (15,000m2).
The underlying value of the land captured by the registered community housing provider funds theconstruction of new and improved social housing stock at no extra financial cost to the State. TheState retains ownership of the new social housing stock and land with the community housingprovider managing stock and tenants.
Development capacity of the estate is estimated to be around 450 new social housing dwellings onhalf (15,000m2) of the surplus land at a construction value of $72 million, with the remainder ofthe site (15,000m2) developed for private use.
Through this arrangement, the delivery of new social housing stock is fully funded by private unitsales, noting that the transaction process for the land would be subject to approval from theGovernment Land Monitor and independent valuation by the Valuer General. While this removes theoption to use this land for other purposes in the future, it creates a funding stream to acceleratethe delivery of new social housing assets.
While the benefit of this arrangement involves the development of the site and the provision ofsocial housing without having to allocate budget funding, in doing so, the State would forgo 15,000m2 of land that is ultimately transferred to the private sector through subsequent unit sales. Thedeveloper would also receive a margin for undertaking and bearing the risk of the development andunit sales. The value of undertaking this option will therefore vary depending on the sites selectedand the foregone use of that land, as well as any cost of transferring risks to the developer forundertaking the development and unit sales.
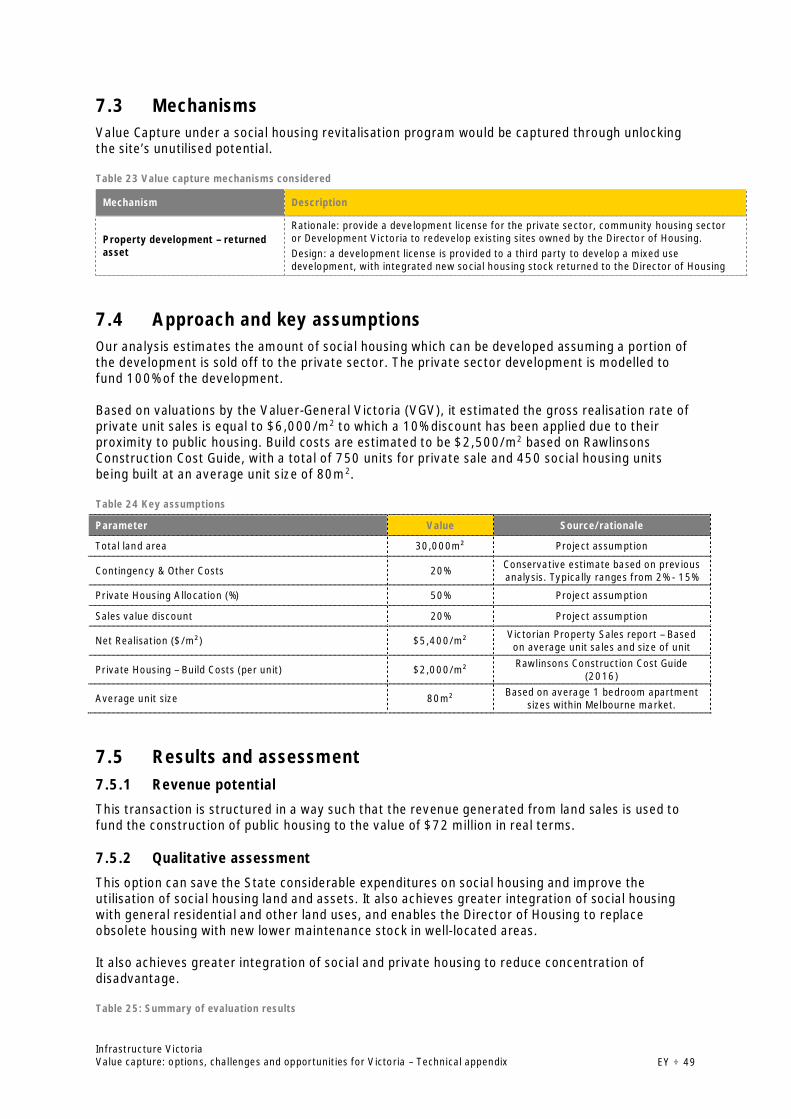
Infrastructure VictoriaValue capture: options, challenges and opportunities for Victoria – Technical appendix EY ÷ 49
7.3 MechanismsValue Capture under a social housing revitalisation program would be captured through unlockingthe site’s unutilised potential.
Table 23 Value capture mechanisms considered
Mechanism Description
Property development – returnedasset
Rationale: provide a development license for the private sector, community housing sectoror Development Victoria to redevelop existing sites owned by the Director of Housing.Design: a development license is provided to a third party to develop a mixed usedevelopment, with integrated new social housing stock returned to the Director of Housing
7.4 Approach and key assumptionsOur analysis estimates the amount of social housing which can be developed assuming a portion ofthe development is sold off to the private sector. The private sector development is modelled tofund 100% of the development.
Based on valuations by the Valuer-General Victoria (VGV), it estimated the gross realisation rate ofprivate unit sales is equal to $6,000/m2 to which a 10% discount has been applied due to theirproximity to public housing. Build costs are estimated to be $2,500/m2 based on RawlinsonsConstruction Cost Guide, with a total of 750 units for private sale and 450 social housing unitsbeing built at an average unit size of 80m2.
Table 24 Key assumptions
Parameter Value Source/rationale
Total land area 30,000m² Project assumption
Contingency & Other Costs 20% Conservative estimate based on previousanalysis. Typically ranges from 2% - 15%
Private Housing Allocation (%) 50% Project assumption
Sales value discount 20% Project assumption
Net Realisation ($/m²) $5,400/m² Victorian Property Sales report – Basedon average unit sales and size of unit
Private Housing – Build Costs (per unit) $2,000/m² Rawlinsons Construction Cost Guide(2016)
Average unit size 80m² Based on average 1 bedroom apartmentsizes within Melbourne market.
7.5 Results and assessment7.5.1 Revenue potential
This transaction is structured in a way such that the revenue generated from land sales is used tofund the construction of public housing to the value of $72 million in real terms.
7.5.2 Qualitative assessment
This option can save the State considerable expenditures on social housing and improve theutilisation of social housing land and assets. It also achieves greater integration of social housingwith general residential and other land uses, and enables the Director of Housing to replaceobsolete housing with new lower maintenance stock in well-located areas.
It also achieves greater integration of social and private housing to reduce concentration ofdisadvantage.
Table 25: Summary of evaluation results

Infrastructure VictoriaValue capture: options, challenges and opportunities for Victoria – Technical appendix EY ÷ 50
Mechanism Equity and efficiency Simplicity and sustainability
Option 1:Property development –
returned asset
High High
Strong benefit alignment with the developerreturning assets to the State, and increases
utilisation of available land in central Melbourne.
Relatively simple to administer and short-term innature. The Director of Housing currently converts
land value to assets through developmentagreements with the private sector on a small scale.This proposal assumes a large scale, multi provider
model.
7.5.3 Key findings
This example highlights the potential from integrating public and private housing stock andleveraging under-utilised assets to fund infrastructure upgrades. Embedding a commercialapproach to asset investment and management could yield benefits across the Government’sportfolio of social services.
Infrastructure VictoriaValue capture: options, challenges and opportunities for Victoria – Technical appendix EY ÷ 51
8. Major hospital redevelopment
8.1 Project description and inputsIn future, inner Melbourne’s major hospital facilities will need to provide for increased demand dueto state-wide population growth and also from new inner city residential development areas, suchas Fishermans Bend. In order to meet this demand, this option assumes a $500 millionredevelopment to a major inner city hospital accommodated in 50,000 m2 of new development.Construction is assumed to start in 2035 and be completed by 2040.
This scenario is based on the Major hospital redevelopments (THR) option considered in IV’s Draftstrategy. THR provides for major public sector hospital development projects over the next 30-yearperiod. However, the scenario modelled in this paper is hypothetical only, for illustrative purposesand is not a recommendation.
8.2 Background researchWhen a new hospital is built or an old hospital expands, the surrounding area often changes to takeadvantage of the increase in demand for goods and services brought about by growth in hospitalactivity. Surrounding commercial land values increase and developers are usually quick to providenew commercial space.
For example, during a valuation of a large parcel of land near a major hospital facility in outerMelbourne, the analysis of a nearby property transaction showed a premium of approximately 70%.Similar results were found in a range of recent transactions near a major hospital facility in NSW,where it was observed that that adjacent sites were selling at a premium in the order of 50% ormore in order to be co-located near the private hospital.16
8.3 BenefitsFor this hypothetical scenario, an area surrounding a typical hospital precinct was examined todetermine the most appropriate catchment. It was determined that the land parcels with main roadfrontages would be the likely candidates for potential uplift due to the proximity to a healthprecinct. While there is typically commercially zoned properties across areas surrounding inner cityhospital precincts, it is most likely to be used for other purposes rather than health due to proximityto other facilities and land uses. Based on this analysis, the total land area of the catchmentattributed to commercial use that is most likely to be enhanced by its proximity to the hospital isassumed to be around 24 hectares.
While the analysis of recent property data outlined above suggests a significant premium (~50%) forcommercial land near major health facilities, a challenge with this scenario is that existing landvalues would already reflect a large portion of the potential uplift given the existence and quality ofthe hospital before the upgrade. Rather than estimate a precise uplift, the analysis instead seeks totest the potential for value capture under the assumption that the expanded hospital could providea further 5% increase in land value (i.e. effectively a 10% contribution to the total possible upliftsuggested from the analysis of recent property transactions). In real terms this is equivalent to$120 million in 2040 when the project is constructed.
16 EY analysis of confidential valuations data
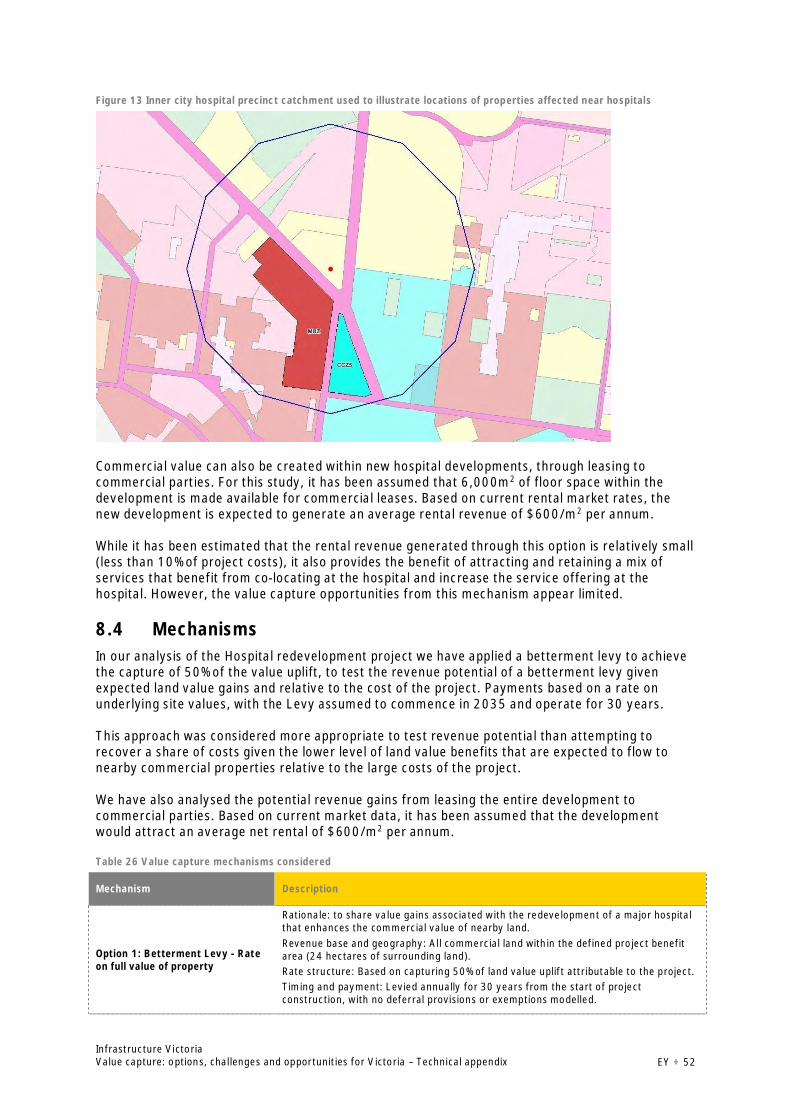
Infrastructure VictoriaValue capture: options, challenges and opportunities for Victoria – Technical appendix EY ÷ 52
Figure 13 Inner city hospital precinct catchment used to illustrate locations of properties affected near hospitals
Commercial value can also be created within new hospital developments, through leasing tocommercial parties. For this study, it has been assumed that 6,000m2 of floor space within thedevelopment is made available for commercial leases. Based on current rental market rates, thenew development is expected to generate an average rental revenue of $600/m2 per annum.
While it has been estimated that the rental revenue generated through this option is relatively small(less than 10% of project costs), it also provides the benefit of attracting and retaining a mix ofservices that benefit from co-locating at the hospital and increase the service offering at thehospital. However, the value capture opportunities from this mechanism appear limited.
8.4 MechanismsIn our analysis of the Hospital redevelopment project we have applied a betterment levy to achievethe capture of 50% of the value uplift, to test the revenue potential of a betterment levy givenexpected land value gains and relative to the cost of the project. Payments based on a rate onunderlying site values, with the Levy assumed to commence in 2035 and operate for 30 years.
This approach was considered more appropriate to test revenue potential than attempting torecover a share of costs given the lower level of land value benefits that are expected to flow tonearby commercial properties relative to the large costs of the project.
We have also analysed the potential revenue gains from leasing the entire development tocommercial parties. Based on current market data, it has been assumed that the developmentwould attract an average net rental of $600/m2 per annum.
Table 26 Value capture mechanisms considered
Mechanism Description
Option 1: Betterment Levy - Rateon full value of property
Rationale: to share value gains associated with the redevelopment of a major hospitalthat enhances the commercial value of nearby land.Revenue base and geography: All commercial land within the defined project benefitarea (24 hectares of surrounding land).Rate structure: Based on capturing 50% of land value uplift attributable to the project.Timing and payment: Levied annually for 30 years from the start of projectconstruction, with no deferral provisions or exemptions modelled.
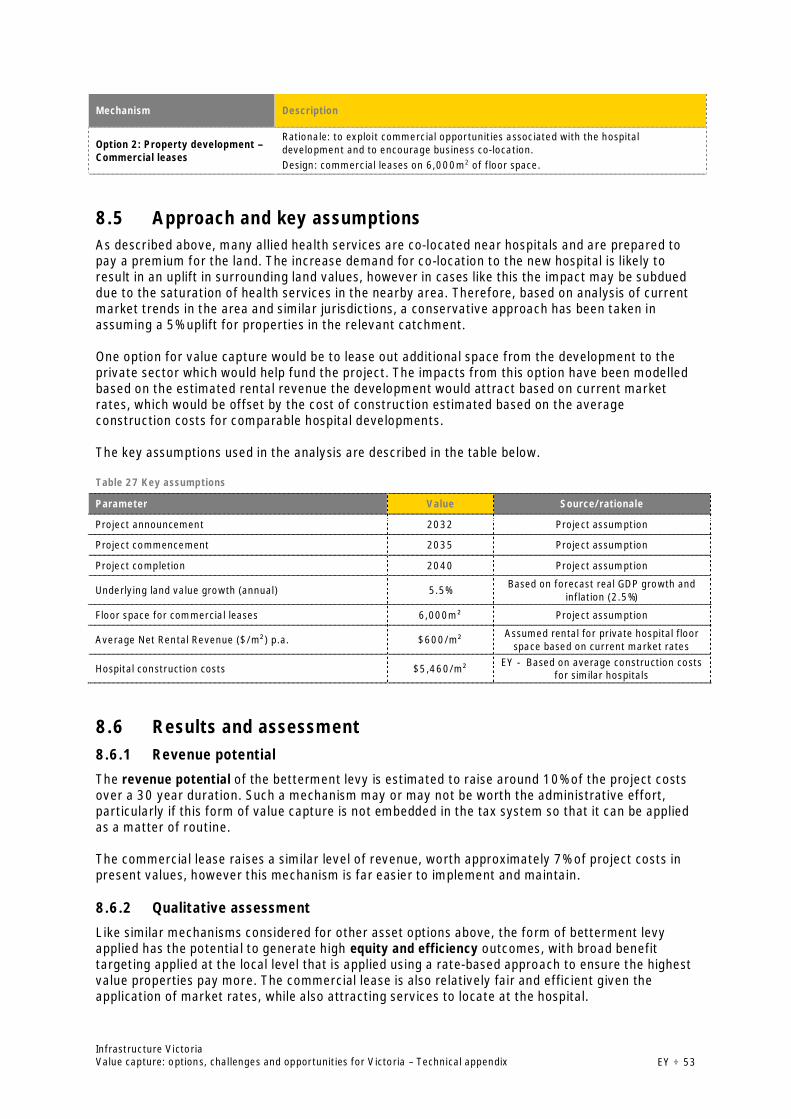
Infrastructure VictoriaValue capture: options, challenges and opportunities for Victoria – Technical appendix EY ÷ 53
Mechanism Description
Option 2: Property development –Commercial leases
Rationale: to exploit commercial opportunities associated with the hospitaldevelopment and to encourage business co-location.Design: commercial leases on 6,000m2 of floor space.
8.5 Approach and key assumptionsAs described above, many allied health services are co-located near hospitals and are prepared topay a premium for the land. The increase demand for co-location to the new hospital is likely toresult in an uplift in surrounding land values, however in cases like this the impact may be subdueddue to the saturation of health services in the nearby area. Therefore, based on analysis of currentmarket trends in the area and similar jurisdictions, a conservative approach has been taken inassuming a 5% uplift for properties in the relevant catchment.
One option for value capture would be to lease out additional space from the development to theprivate sector which would help fund the project. The impacts from this option have been modelledbased on the estimated rental revenue the development would attract based on current marketrates, which would be offset by the cost of construction estimated based on the averageconstruction costs for comparable hospital developments.
The key assumptions used in the analysis are described in the table below.
Table 27 Key assumptions
Parameter Value Source/rationale
Project announcement 2032 Project assumption
Project commencement 2035 Project assumption
Project completion 2040 Project assumption
Underlying land value growth (annual) 5.5% Based on forecast real GDP growth andinflation (2.5%)
Floor space for commercial leases 6,000m² Project assumption
Average Net Rental Revenue ($/m²) p.a. $600/m² Assumed rental for private hospital floorspace based on current market rates
Hospital construction costs $5,460/m² EY - Based on average construction costsfor similar hospitals
8.6 Results and assessment8.6.1 Revenue potential
The revenue potential of the betterment levy is estimated to raise around 10% of the project costsover a 30 year duration. Such a mechanism may or may not be worth the administrative effort,particularly if this form of value capture is not embedded in the tax system so that it can be appliedas a matter of routine.
The commercial lease raises a similar level of revenue, worth approximately 7% of project costs inpresent values, however this mechanism is far easier to implement and maintain.
8.6.2 Qualitative assessment
Like similar mechanisms considered for other asset options above, the form of betterment levyapplied has the potential to generate high equity and efficiency outcomes, with broad benefittargeting applied at the local level that is applied using a rate-based approach to ensure the highestvalue properties pay more. The commercial lease is also relatively fair and efficient given theapplication of market rates, while also attracting services to locate at the hospital.
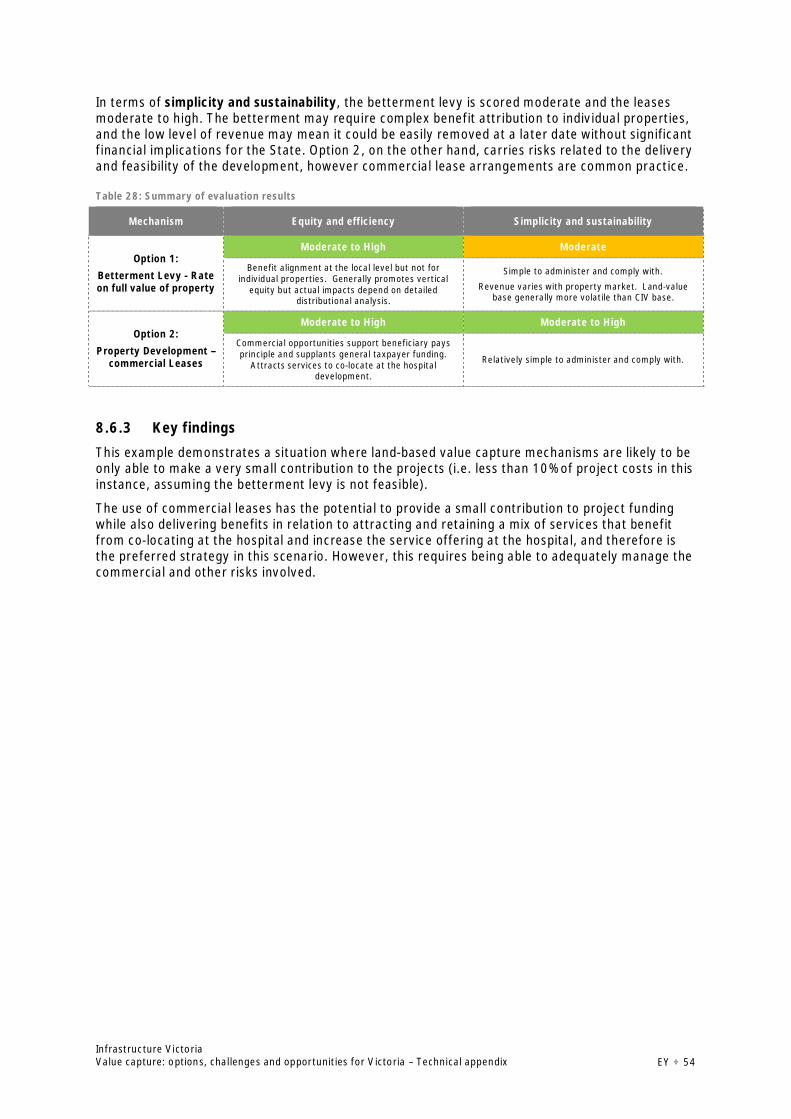
Infrastructure VictoriaValue capture: options, challenges and opportunities for Victoria – Technical appendix EY ÷ 54
In terms of simplicity and sustainability, the betterment levy is scored moderate and the leasesmoderate to high. The betterment may require complex benefit attribution to individual properties,and the low level of revenue may mean it could be easily removed at a later date without significantfinancial implications for the State. Option 2, on the other hand, carries risks related to the deliveryand feasibility of the development, however commercial lease arrangements are common practice.
Table 28: Summary of evaluation results
Mechanism Equity and efficiency Simplicity and sustainability
Option 1:Betterment Levy - Rateon full value of property
Moderate to High Moderate
Benefit alignment at the local level but not forindividual properties. Generally promotes vertical
equity but actual impacts depend on detaileddistributional analysis.
Simple to administer and comply with.
Revenue varies with property market. Land-valuebase generally more volatile than CIV base.
Option 2:Property Development –
commercial Leases
Moderate to High Moderate to High
Commercial opportunities support beneficiary paysprinciple and supplants general taxpayer funding.
Attracts services to co-locate at the hospitaldevelopment.
Relatively simple to administer and comply with.
8.6.3 Key findings
This example demonstrates a situation where land-based value capture mechanisms are likely to beonly able to make a very small contribution to the projects (i.e. less than 10% of project costs in thisinstance, assuming the betterment levy is not feasible).
The use of commercial leases has the potential to provide a small contribution to project fundingwhile also delivering benefits in relation to attracting and retaining a mix of services that benefitfrom co-locating at the hospital and increase the service offering at the hospital, and therefore isthe preferred strategy in this scenario. However, this requires being able to adequately manage thecommercial and other risks involved.

Infrastructure VictoriaValue capture: options, challenges and opportunities for Victoria – Technical appendix EY ÷ 55
9. Commitment to a new school in an urban growth area
9.1 Project description and inputsCurrently, there is a high degree of uncertainty about when and where new schools will bedeveloped to meet the demands of a growing population in both new and existing suburbs. Somecommunities can wait many years before school facilities are delivered.
It assumes a new school is committed in an urban growth area (for the purposes of modelling, theschool is assumed to be committed in Clyde North), comprising a school catchment area of 100hectares servicing 8,750 new homes. Development and construction costs for the school areestimated to be $20 million over five years in real terms.
This hypothetical scenario is based on the School infrastructure funding certainty (SIF) optionconsidered in the Draft strategy. The SIF option would require the government to publish aproposed plan for school capital works (new and upgrades). However, the scenario modelled in thispaper is hypothetical only, for illustrative purposes and is not a recommendation.
9.2 Background researchCommitting to the delivery of new schools in urban growth areas can have positive impacts on theattractiveness of the area for people and families seeking new residential locations. Depending onthe way the school is planned and delivered, this can accelerate land sales for residential lots in thenearby catchment, and increase the amount people are willing to pay to live there.
To understand the potential impacts on sales rates and values, EY investigated similar projects inother urban growth zones that were subject to recent assessments or valuations. EY also liaisedwith market participants about the likely scale of impact of a new schools asset on their underlyingland values.
It is well established that there is a correlation between property values and being located in aschool catchment area. Property owners located within a school zone (particularly high performingschools) can indirectly benefit being located near the social infrastructure through increasedproperty values.
Access to high quality amenities and services, in particular schooling and education is a key driverfor growth in property values across Melbourne. A 12 month analysis undertaken by REIV showsthat homes located within the catchment area for some of Melbourne’s best public secondaryschool are fetching close to a $25,000 to $300,000 premium compared to those outside the zone(excluding University High School, where the $600,000 premium is more likely to reflect a range ofother factors given the location of the zone in the Parkville precinct).
For example, in relation to sale value, regression analysis undertaken by EY for Kororoit CreekPrimary School in Melbourne’s North West, suggests that nearby property prices were up to 37%higher after the announcement of the school, and up to 68% higher after the school opened. Forexample, for vacant housing lots worth $150,000 this could add up to another $100,000 to thevalue of the lot.
These impacts are similar to impacts in other prominent school zones across Melbourne, albeit atthe lower end of the value scale, highlighting the material value that the construction of a newschool can have on property prices.
9.3 BenefitsThe benefits associated with the construction of a new school are expected to accrue to allresidential lots within the school’s catchment. For the purposes of this analysis, it has been
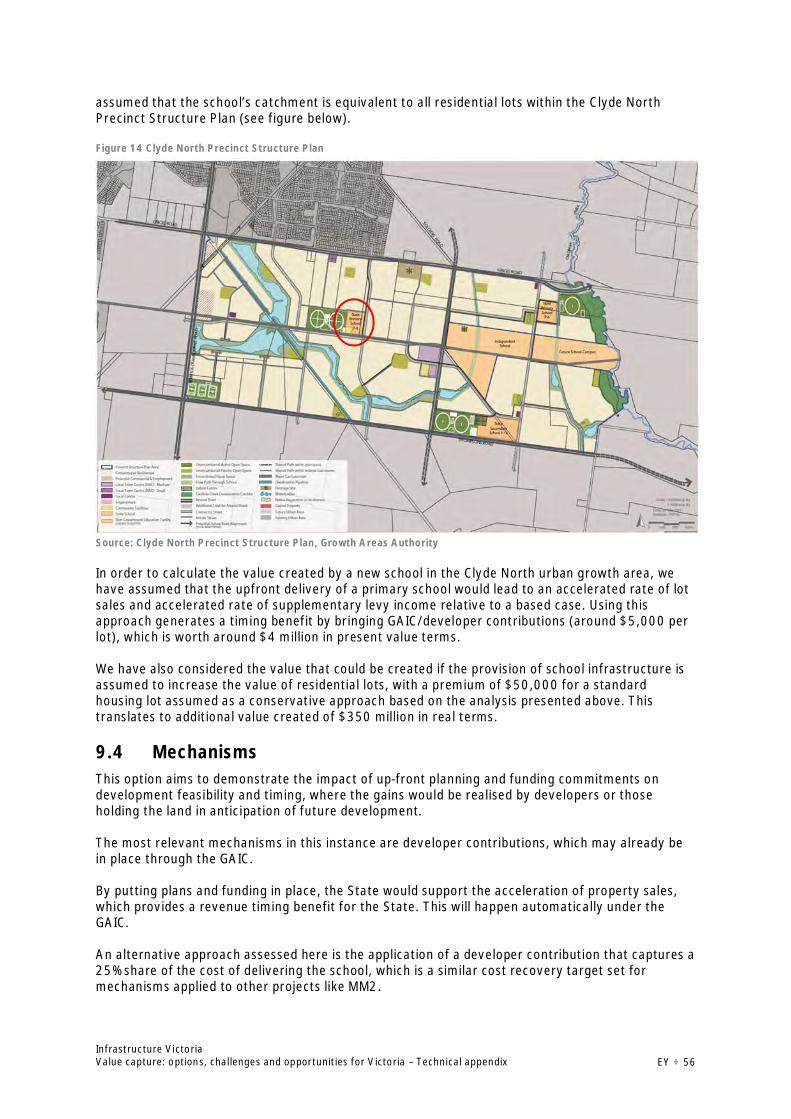
Infrastructure VictoriaValue capture: options, challenges and opportunities for Victoria – Technical appendix EY ÷ 56
assumed that the school’s catchment is equivalent to all residential lots within the Clyde NorthPrecinct Structure Plan (see figure below).
Figure 14 Clyde North Precinct Structure Plan
Source: Clyde North Precinct Structure Plan, Growth Areas Authority
In order to calculate the value created by a new school in the Clyde North urban growth area, wehave assumed that the upfront delivery of a primary school would lead to an accelerated rate of lotsales and accelerated rate of supplementary levy income relative to a based case. Using thisapproach generates a timing benefit by bringing GAIC/developer contributions (around $5,000 perlot), which is worth around $4 million in present value terms.
We have also considered the value that could be created if the provision of school infrastructure isassumed to increase the value of residential lots, with a premium of $50,000 for a standardhousing lot assumed as a conservative approach based on the analysis presented above. Thistranslates to additional value created of $350 million in real terms.
9.4 MechanismsThis option aims to demonstrate the impact of up-front planning and funding commitments ondevelopment feasibility and timing, where the gains would be realised by developers or thoseholding the land in anticipation of future development.
The most relevant mechanisms in this instance are developer contributions, which may already bein place through the GAIC.
By putting plans and funding in place, the State would support the acceleration of property sales,which provides a revenue timing benefit for the State. This will happen automatically under theGAIC.
An alternative approach assessed here is the application of a developer contribution that captures a25% share of the cost of delivering the school, which is a similar cost recovery target set formechanisms applied to other projects like MM2.
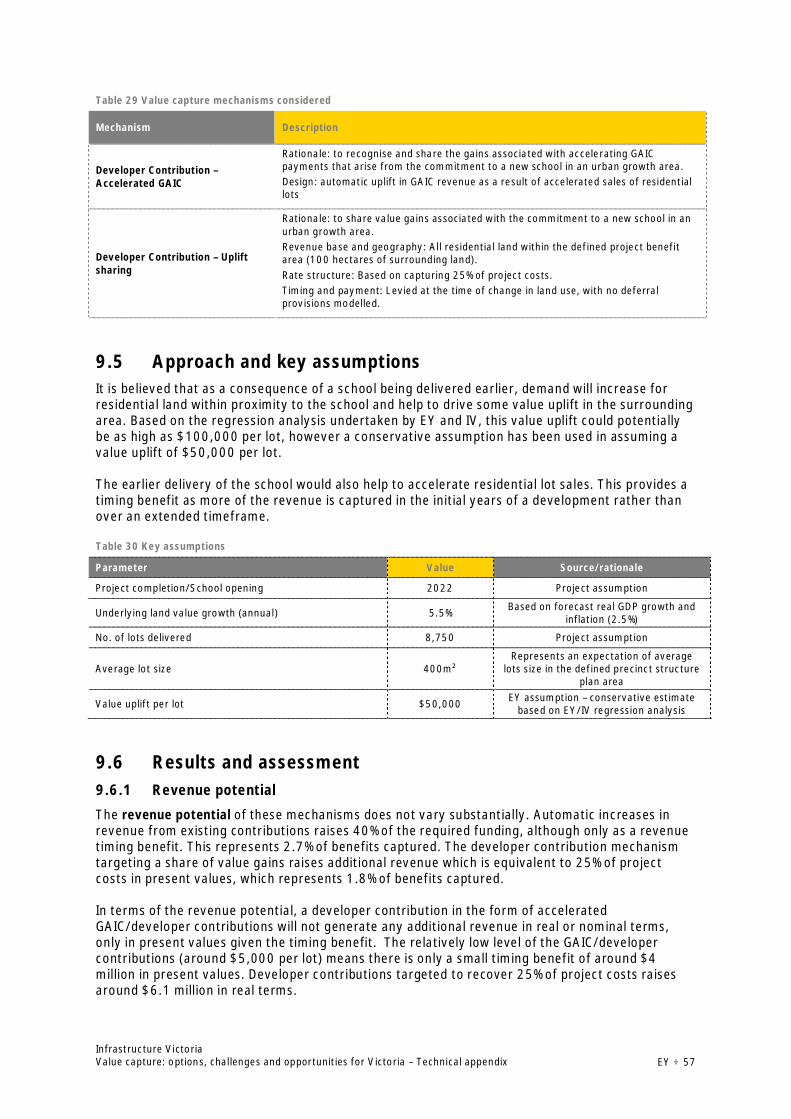
Infrastructure VictoriaValue capture: options, challenges and opportunities for Victoria – Technical appendix EY ÷ 57
Table 29 Value capture mechanisms considered
Mechanism Description
Developer Contribution –Accelerated GAIC
Rationale: to recognise and share the gains associated with accelerating GAICpayments that arise from the commitment to a new school in an urban growth area.Design: automatic uplift in GAIC revenue as a result of accelerated sales of residentiallots
Developer Contribution – Upliftsharing
Rationale: to share value gains associated with the commitment to a new school in anurban growth area.Revenue base and geography: All residential land within the defined project benefitarea (100 hectares of surrounding land).Rate structure: Based on capturing 25% of project costs.Timing and payment: Levied at the time of change in land use, with no deferralprovisions modelled.
9.5 Approach and key assumptionsIt is believed that as a consequence of a school being delivered earlier, demand will increase forresidential land within proximity to the school and help to drive some value uplift in the surroundingarea. Based on the regression analysis undertaken by EY and IV, this value uplift could potentiallybe as high as $100,000 per lot, however a conservative assumption has been used in assuming avalue uplift of $50,000 per lot.
The earlier delivery of the school would also help to accelerate residential lot sales. This provides atiming benefit as more of the revenue is captured in the initial years of a development rather thanover an extended timeframe.
Table 30 Key assumptions
Parameter Value Source/rationale
Project completion/School opening 2022 Project assumption
Underlying land value growth (annual) 5.5% Based on forecast real GDP growth andinflation (2.5%)
No. of lots delivered 8,750 Project assumption
Average lot size 400m²Represents an expectation of average
lots size in the defined precinct structureplan area
Value uplift per lot $50,000 EY assumption – conservative estimatebased on EY/IV regression analysis
9.6 Results and assessment9.6.1 Revenue potential
The revenue potential of these mechanisms does not vary substantially. Automatic increases inrevenue from existing contributions raises 40% of the required funding, although only as a revenuetiming benefit. This represents 2.7% of benefits captured. The developer contribution mechanismtargeting a share of value gains raises additional revenue which is equivalent to 25% of projectcosts in present values, which represents 1.8% of benefits captured.
In terms of the revenue potential, a developer contribution in the form of acceleratedGAIC/developer contributions will not generate any additional revenue in real or nominal terms,only in present values given the timing benefit. The relatively low level of the GAIC/developercontributions (around $5,000 per lot) means there is only a small timing benefit of around $4million in present values. Developer contributions targeted to recover 25% of project costs raisesaround $6.1 million in real terms.
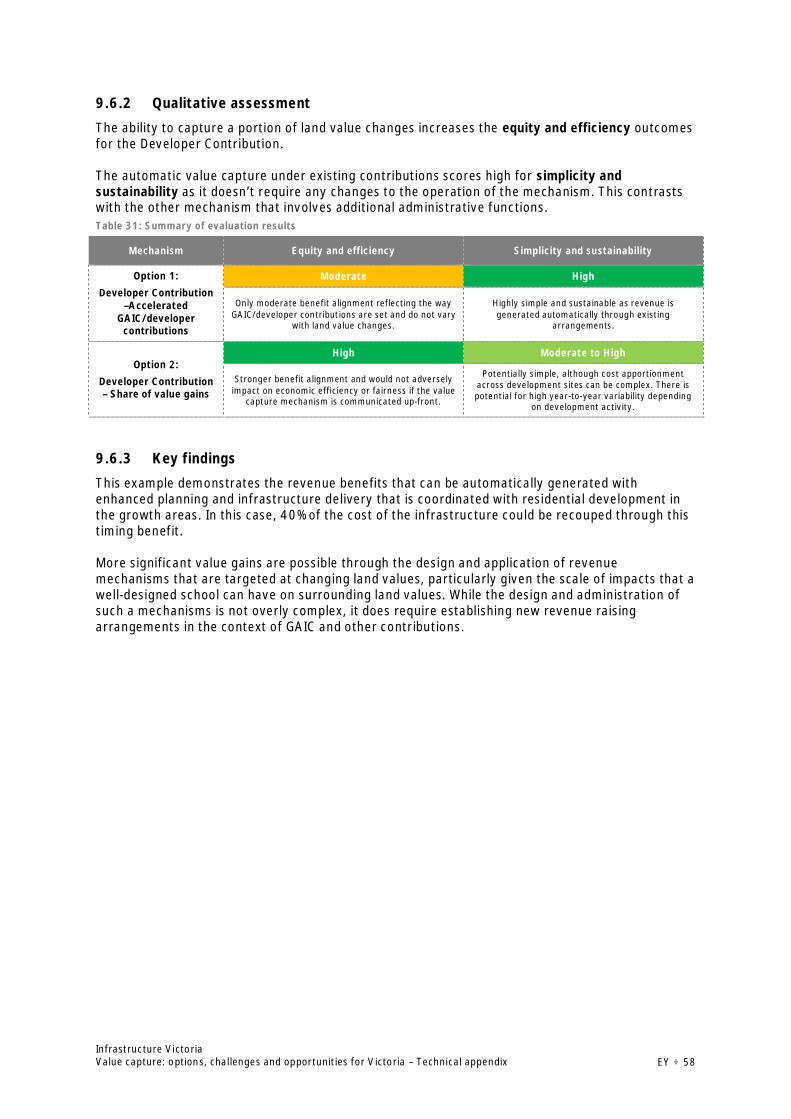
Infrastructure VictoriaValue capture: options, challenges and opportunities for Victoria – Technical appendix EY ÷ 58
9.6.2 Qualitative assessment
The ability to capture a portion of land value changes increases the equity and efficiency outcomesfor the Developer Contribution.
The automatic value capture under existing contributions scores high for simplicity andsustainability as it doesn’t require any changes to the operation of the mechanism. This contrastswith the other mechanism that involves additional administrative functions.Table 31: Summary of evaluation results
Mechanism Equity and efficiency Simplicity and sustainability
Option 1:Developer Contribution
–AcceleratedGAIC/developer
contributions
Moderate High
Only moderate benefit alignment reflecting the wayGAIC/developer contributions are set and do not vary
with land value changes.
Highly simple and sustainable as revenue isgenerated automatically through existing
arrangements.
Option 2:Developer Contribution– Share of value gains
High Moderate to High
Stronger benefit alignment and would not adverselyimpact on economic efficiency or fairness if the value
capture mechanism is communicated up-front.
Potentially simple, although cost apportionmentacross development sites can be complex. There ispotential for high year-to-year variability depending
on development activity.
9.6.3 Key findings
This example demonstrates the revenue benefits that can be automatically generated withenhanced planning and infrastructure delivery that is coordinated with residential development inthe growth areas. In this case, 40% of the cost of the infrastructure could be recouped through thistiming benefit.
More significant value gains are possible through the design and application of revenuemechanisms that are targeted at changing land values, particularly given the scale of impacts that awell-designed school can have on surrounding land values. While the design and administration ofsuch a mechanisms is not overly complex, it does require establishing new revenue raisingarrangements in the context of GAIC and other contributions.
Infrastructure VictoriaValue capture: options, challenges and opportunities for Victoria – Technical appendix EY ÷ 59
Appendix 1. Australian and international case studies
This section includes a selection of Australian and international case studies on value capture andinfrastructure.
These case studies have helped to guide the development of our analysis and assessment of valuecapture mechanisms and to inform how value capture could be applied to a selection futureinfrastructure case studies identified during the study and analysed in subsequent chapters.
Victorian examplesFunding Melbourne’s City Loop
In planning since 1929, Melbourne’s underground rail loop came to fruition following a 1960 Actestablishing funding arrangements, inclusion in the 1969 metropolitan transport plan and an Act ofParliament in 1971 which established an authority to oversee its construction. Constructioncommenced that year and was completed progressively between 1981 and 1985.
The project was originally estimated to cost $117.23 million (1971 prices) excluding landacquisition, signalling and communications, and administrative and service costs includingconsultancy fees and interest on monies borrowed. However, due to delays and cost increases, andafter including land acquisition, the cost of the project is recorded as being around $650 million(1985 prices).
The funding scheme for the loop was altered numerous times between 1960 and 1983, but wasbased originally on value capture principles and retained some aspect of this throughout.
Arrangements established in the 1960 Act were premised on the wider metropolitan area receiving3/5ths of the benefit from the project with landowners in the inner city receiving 2/5ths of thebenefits, and a 60-40 split between state government and inner-city ratepayer contributions wasspecified in the Act on this basis. Discretion to remit levies for particular properties was provided,evidencing a strong desire to link payments to benefits received. The Commissioner of Land Taxwas responsible for charging and collecting two special annual levies through the land tax system,including a 'special duty of land tax' based on the value of land prescribed under the Land Tax Act1958 (Vic), and a 'special rate' charged on the value of land determined by the local council underthe Local Government Act 1958 (Vic).
However this scheme was abandoned early on, and a 1970 scheme established a 25-25-50% split offunding the cost of the project between the Melbourne Metropolitan Board of Works (MMBW) via acity-wide levy (25%), the City of Melbourne via a special council rates levy on commercial properties(25%), and rail passengers via a ticket levy and the state government (which paid the balance of the50% not collected by the ticket levy).
The MMBW and CoM contributions were capped and later reduced to 15% and 10% respectively,with the CoM special levy repealed several years early in 1995, in part due to financial difficultiesresulting from the financial collapses and recession of the early 1990s.
Analysis of the funding of Melbourne’s City Loop provides a number of important lessons forconsidering the possible application of value capture to fund Victoria’s future infrastructure needs.This includes:
· Reminding us that funding infrastructure from new land-based value capture mechanismsis not new for Victoria, and that the indirect benefits of infrastructure have been longrecognised by policy makers and the wider community, particularly for the transport sector
· How value capture funding may be more acceptable to the community if mechanisms aresimple and broadly applied to align funding with benefits received. This ensures that

Infrastructure VictoriaValue capture: options, challenges and opportunities for Victoria – Technical appendix EY ÷ 60
mechanisms are easy to understand and comply with, and avoids having to undertakedetailed assessments of land value benefits attributable to the project and attempting tofactor that into mechanism design
· Warning of possible financial risks associated with relying on value capture mechanismscollected by other levels of government or corporate entities.
Sources: SGS Economics & Planning (2012), Long run economic and land use impacts of major infrastructure projects , withfurther details sourced from City of Melbourne Underground Railway Construction Act 1960, Melbourne Underground RailLoop Act 1970, Transport Act 1983, and various amendment Acts in 1963, 1975, 1976, and 1995; MelbourneUnderground Rail Loop Authority, Annual Report 1971-72; Metropolitan Transit Authority, Annual Report 1984-85.
Southern Cross Station
Southern Cross Station is Melbourne’s centre for interstate and regional connections and is anintegral part of Melbourne’s metropolitan rail services. It also provides a regional and airport linkbus interchange.
The Spencer Street Station Authority (later renamed the Southern Cross Station Authority) wasestablished by the Victorian Government to oversee station redevelopment during the constructionphase, with Civic Nexus awarded the concession to construct and operate the station for a period of30 years.
The concession included certain commercial rights (air rights, retail rights and advertising rights) aswell as the managerial responsibility of the station. The Commercial rights included in the projectput to market by the government were:
· a 99 year lease of the air rights for space above the station;
· a 50 year lease air rights space above the bus interchange;
· retail rights within the station itself for full 30 year concession period; and,
· advertising rights within the station precinct.
The development air rights associated with the project allowed the availability of a long term returnto the concessionaire, while the inclusion of commercial and retail rights helped to fund the projectby partially offsetting the cost of the station redevelopment.
Source: Public Accounts and Estimates Committee (2006) Report on private investment in public infrastructure, seventyfirst report to the Parliament, Government Printer for the State of Victoria, Melbourne.
Melbourne property prices in school zones
It is well established that there is a correlation between property values and being located in aschool catchment area. Property owners located within a school zone (particularly high performingschools) can indirectly benefit being located near the social infrastructure through increasedproperty values.
Access to high quality amenities and services, in particular schooling and education is a key driverfor growth in property values across Melbourne. A 12 month analysis undertaken by REIV showsthat homes located within the catchment area for some of Melbourne’s best public secondaryschool are fetching close to a $60,000 to $300,000 premium compared to those bordering thezone (however it should be noted that other factors may be at play and we have excluded UniversityHigh School, where the $600,000 premium is likely to reflect a range of other factors given thelocation of the zone in the Parkville precinct).
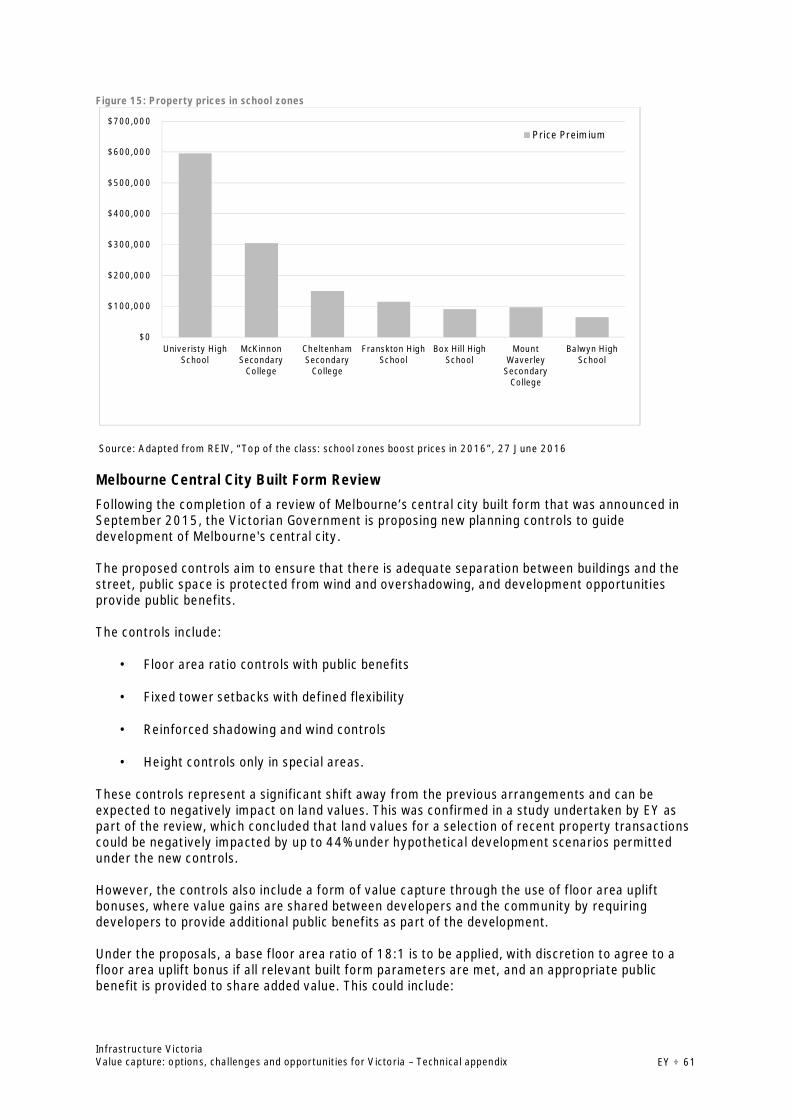
Infrastructure VictoriaValue capture: options, challenges and opportunities for Victoria – Technical appendix EY ÷ 61
Figure 15: Property prices in school zones
Source: Adapted from REIV, “Top of the class: school zones boost prices in 2016”, 27 June 2016
Melbourne Central City Built Form Review
Following the completion of a review of Melbourne’s central city built form that was announced inSeptember 2015, the Victorian Government is proposing new planning controls to guidedevelopment of Melbourne's central city.
The proposed controls aim to ensure that there is adequate separation between buildings and thestreet, public space is protected from wind and overshadowing, and development opportunitiesprovide public benefits.
The controls include:
· Floor area ratio controls with public benefits
· Fixed tower setbacks with defined flexibility
· Reinforced shadowing and wind controls
· Height controls only in special areas.
These controls represent a significant shift away from the previous arrangements and can beexpected to negatively impact on land values. This was confirmed in a study undertaken by EY aspart of the review, which concluded that land values for a selection of recent property transactionscould be negatively impacted by up to 44% under hypothetical development scenarios permittedunder the new controls.
However, the controls also include a form of value capture through the use of floor area upliftbonuses, where value gains are shared between developers and the community by requiringdevelopers to provide additional public benefits as part of the development.
Under the proposals, a base floor area ratio of 18:1 is to be applied, with discretion to agree to afloor area uplift bonus if all relevant built form parameters are met, and an appropriate publicbenefit is provided to share added value. This could include:
$0
$100,000
$200,000
$300,000
$400,000
$500,000
$600,000
$700,000
Univeristy HighSchool
McKinnonSecondary
College
CheltenhamSecondary
College
Franskton HighSchool
Box Hill HighSchool
MountWaverley
SecondaryCollege
Balwyn HighSchool
Price Preimium
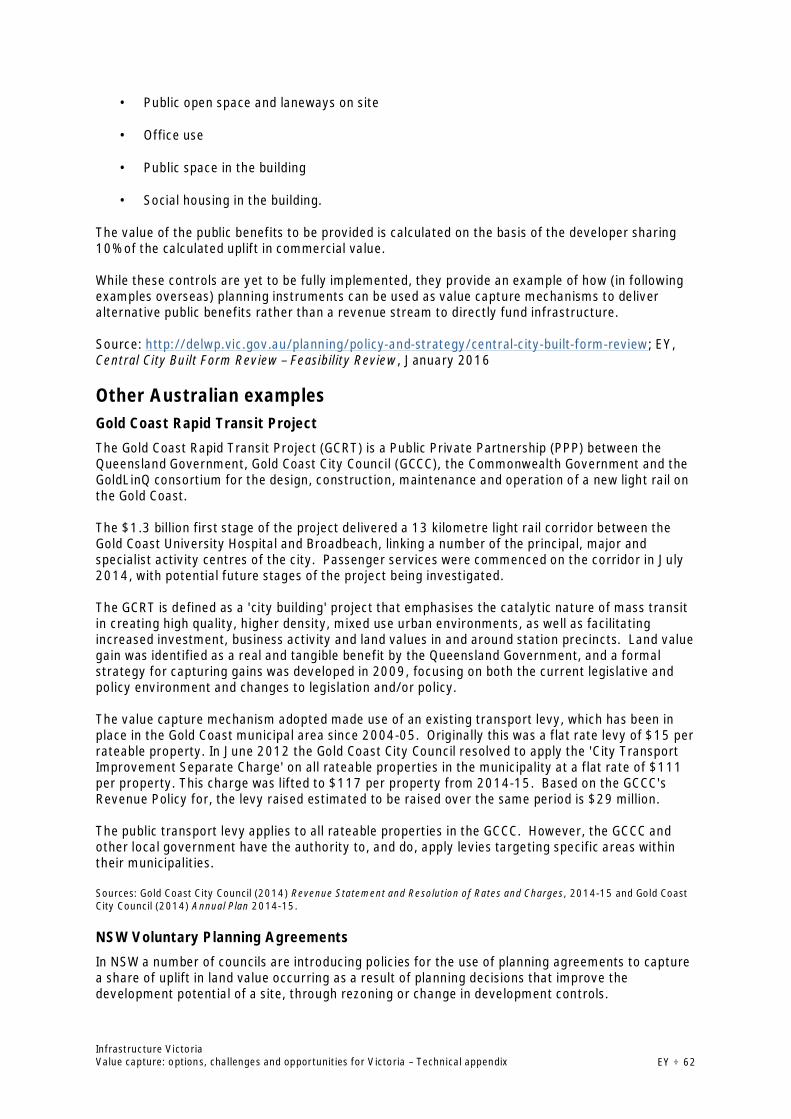
Infrastructure VictoriaValue capture: options, challenges and opportunities for Victoria – Technical appendix EY ÷ 62
· Public open space and laneways on site
· Office use
· Public space in the building
· Social housing in the building.
The value of the public benefits to be provided is calculated on the basis of the developer sharing10% of the calculated uplift in commercial value.
While these controls are yet to be fully implemented, they provide an example of how (in followingexamples overseas) planning instruments can be used as value capture mechanisms to deliveralternative public benefits rather than a revenue stream to directly fund infrastructure.
Source: http://delwp.vic.gov.au/planning/policy-and-strategy/central-city-built-form-review; EY,Central City Built Form Review – Feasibility Review, January 2016
Other Australian examplesGold Coast Rapid Transit Project
The Gold Coast Rapid Transit Project (GCRT) is a Public Private Partnership (PPP) between theQueensland Government, Gold Coast City Council (GCCC), the Commonwealth Government and theGoldLinQ consortium for the design, construction, maintenance and operation of a new light rail onthe Gold Coast.
The $1.3 billion first stage of the project delivered a 13 kilometre light rail corridor between theGold Coast University Hospital and Broadbeach, linking a number of the principal, major andspecialist activity centres of the city. Passenger services were commenced on the corridor in July2014, with potential future stages of the project being investigated.
The GCRT is defined as a 'city building' project that emphasises the catalytic nature of mass transitin creating high quality, higher density, mixed use urban environments, as well as facilitatingincreased investment, business activity and land values in and around station precincts. Land valuegain was identified as a real and tangible benefit by the Queensland Government, and a formalstrategy for capturing gains was developed in 2009, focusing on both the current legislative andpolicy environment and changes to legislation and/or policy.
The value capture mechanism adopted made use of an existing transport levy, which has been inplace in the Gold Coast municipal area since 2004-05. Originally this was a flat rate levy of $15 perrateable property. In June 2012 the Gold Coast City Council resolved to apply the 'City TransportImprovement Separate Charge' on all rateable properties in the municipality at a flat rate of $111per property. This charge was lifted to $117 per property from 2014-15. Based on the GCCC'sRevenue Policy for, the levy raised estimated to be raised over the same period is $29 million.
The public transport levy applies to all rateable properties in the GCCC. However, the GCCC andother local government have the authority to, and do, apply levies targeting specific areas withintheir municipalities.
Sources: Gold Coast City Council (2014) Revenue Statement and Resolution of Rates and Charges, 2014-15 and Gold CoastCity Council (2014) Annual Plan 2014-15.
NSW Voluntary Planning Agreements
In NSW a number of councils are introducing policies for the use of planning agreements to capturea share of uplift in land value occurring as a result of planning decisions that improve thedevelopment potential of a site, through rezoning or change in development controls.

Infrastructure VictoriaValue capture: options, challenges and opportunities for Victoria – Technical appendix EY ÷ 63
For instance, the Draft Woollahra Voluntary Planning Agreement Policy sets out the circumstancesunder which land value is to be captured and the method of calculating the contribution associatedwith land value capture.17
The policy defines value capture as a funding mechanism that captures, for the community’sbenefit, a share of the unearned land value increment accruing to developers as a consequence of:
· planning amendments that facilitate development, or the granting of or modification to adevelopment consent; or
· the approval of or a modification to a development consent that allows development to exceedthe otherwise permissible development controls.
The policy distinguishes land value capture from developer contributions on the basis that it is valuesharing between the Council (on behalf of the community) and developers, rather than on fundingthe costs of infrastructure. The monetary contribution of the value capture mechanism represents50% of the gain on the residual value of land that can be attributed to a change to a statutoryplanning control.
Examples in the United KingdomCrossrail’s value capture funding mix
London Crossrail project will provide a new east-west railway across London, connecting the outersuburbs to the City, Canary Wharf and the West End, as well as linking the city’s key financial,business, retail and entertainment locations directly with Heathrow Airport. The project will providewide-scale improvements in access to employment, spur regeneration and property developmentthrough improvements to public spaces and transport interchanges at 31 stations, and supportwider economic growth through agglomeration-driven productivity gains.
The funding mix for the £14.8 billion project includes a substantial component – over a third ofproject costs – derived from land-based value capture mechanisms, including:
· A Business Rate Supplement (BRS) paid annually by non-domestic properties in GreaterLondon, which targets businesses and other non-domestic properties in London with arateable value of over £55,000 at 2 pence per £1 (i.e. 2% of value per annum), and remainsin place until a £3.5bn loan is repaid.
· A Community Infrastructure Levy (CIL) paid by developers on all new developments acrossGreater London, expected to raise £0.3bn.
· Section 106 contributions (Development Charges) under an existing planning mechanism,expected to raise £0.3bn.
· Development rights through sale of surplus land and over-station development at somestations.
· Contributions by major beneficiaries, including the Canary Wharf Group (for the station atCanary Wharf), BAA (owner of Heathrow airport), and Berkeley homes (for Woolwichstation)
17 Woollahra Municipal Council (2016), Draft Woollahra Voluntary Planning Agreement Policy: Exhibition version of 8February 2016(http://www.woollahra.nsw.gov.au/__data/assets/pdf_file/0004/163543/1._Woollahra_Voluntary_Planning_Agreement_Policy_-_Exhibition_version_of_8_February_2016.pdf)

Infrastructure VictoriaValue capture: options, challenges and opportunities for Victoria – Technical appendix EY ÷ 64
Additional funding is also being derived from other sources, including from the national railinfrastructure operator (Network Rail) due to estimated efficiency dividends, Transport for London,and the UK Government (via the Department for Transport).
This model represents a landmark in project funding, demonstrating that it is possible to implementa more efficient and equitable funding mix that better reflects the beneficiary-pays principle formajor infrastructure projects. It also highlights the spectrum of value capture and other fundingmechanisms that can be applied to fund a major infrastructure project.
The majority of value capture funding is raised through the BRS which, like the funding approachapplied for Melbourne’s City Loop, involves a simple design and a broad alignment of funding andproject benefits (see City Loop case study).
Sources: www.crossrail.co.uk, GLA, BRS Final Prospectus, 2010.
Design of the Crossrail BRS
A high profile example of a betterment levy that has been applied overseas is the Business RateSupplement that has been put in place to fund around £4.1 billion (~25%) of the £14.8 billionCrossrail project in London. The Business Rate Supplement targets businesses and other non-domestic properties in London with a rateable value of over £55,000 at 2 pence per £1 (i.e. 2% ofproperty values, collected annually). Rateable value is equivalent to Net Annual Value in Victoria,and represents an estimate of rental value (not asset value), and the levy equates to an annualcontribution of £2,000 for premises valued at £100,000.
Another important feature of the Business Rate Supplement is that it applies a ‘fixed rate, variableduration’ design, whereby the levy will remain in place until a £4.1 billion loan is repaid. However,because the levy is based on property value rather than on land value uplift (i.e. the measuredincrease in property values due to the provision of Crossrail), beneficiary targeting and valuecapture potential is limited. This illustrates a general challenge in achieving beneficiary paysfunding with a property value-based mechanism.
A possible criticism of the mechanisms is that by restricting it to non-domestic properties andthrough the use of a threshold, it excludes a large number of landowners that will benefit from theproject (i.e. all residential properties and around 80% of business properties are exempt). However,the design ensures that the incidence of the levy is predominantly felt by higher value properties ininner London along the broader east-west Crossrail corridor. And while there are large numbers ofproperties in outer London that are required to pay the BRS, many of these areas will benefit fromreduced congestion on the broader London transport network, making it easier to do business andaccess customer markets.
The Greater London Authority estimates that the BRS will raise approximately £220 million in2016-17 (equivalent to around AUD $370 million using today’s exchange rate). With just over46,000 properties estimated to be subject to the BRS this is equal to around £4,800 per property(AUD $8,000). The boroughs with the highest average rates are those with major singlelandholdings, including Hillingdon (London Heathrow) and Tower Hamlets (Canary Wharf). The nexthighest are the City of London (£6,675 per property), Westminster (£5,671) and Camden(£4,661).
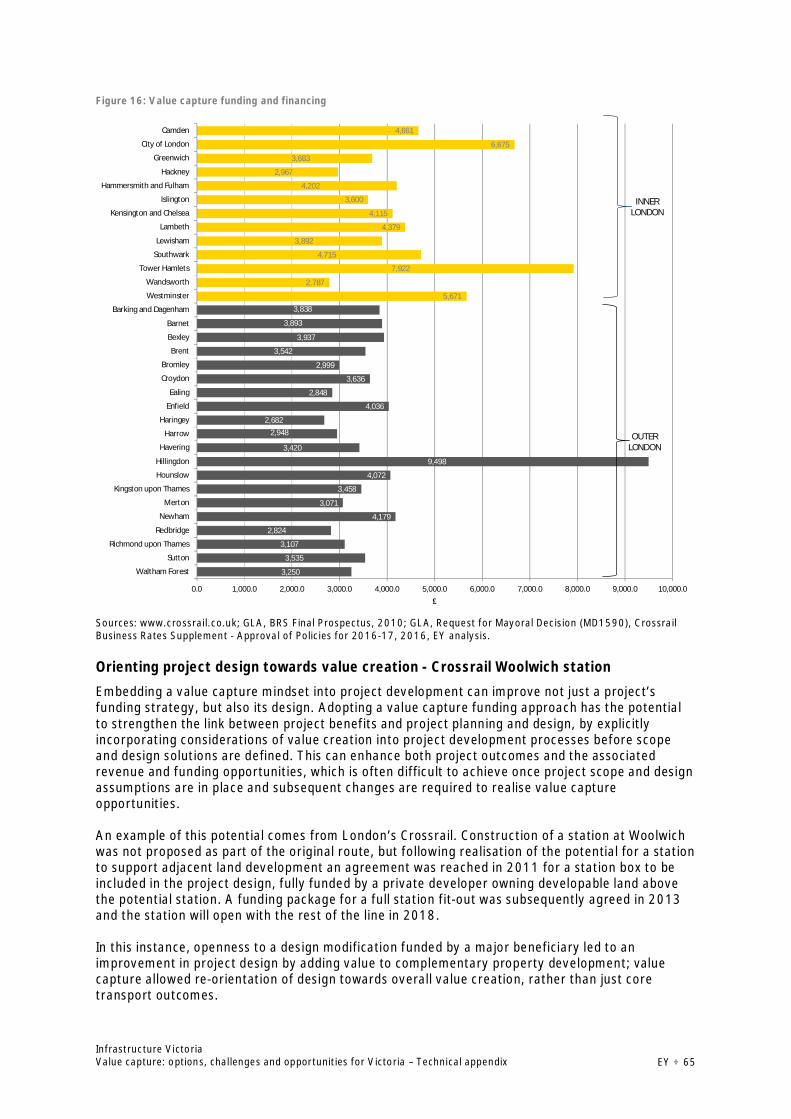
Infrastructure VictoriaValue capture: options, challenges and opportunities for Victoria – Technical appendix EY ÷ 65
Figure 16: Value capture funding and financing
Sources: www.crossrail.co.uk; GLA, BRS Final Prospectus, 2010; GLA, Request for Mayoral Decision (MD1590), CrossrailBusiness Rates Supplement - Approval of Policies for 2016-17, 2016, EY analysis.
Orienting project design towards value creation - Crossrail Woolwich station
Embedding a value capture mindset into project development can improve not just a project’sfunding strategy, but also its design. Adopting a value capture funding approach has the potentialto strengthen the link between project benefits and project planning and design, by explicitlyincorporating considerations of value creation into project development processes before scopeand design solutions are defined. This can enhance both project outcomes and the associatedrevenue and funding opportunities, which is often difficult to achieve once project scope and designassumptions are in place and subsequent changes are required to realise value captureopportunities.
An example of this potential comes from London’s Crossrail. Construction of a station at Woolwichwas not proposed as part of the original route, but following realisation of the potential for a stationto support adjacent land development an agreement was reached in 2011 for a station box to beincluded in the project design, fully funded by a private developer owning developable land abovethe potential station. A funding package for a full station fit-out was subsequently agreed in 2013and the station will open with the rest of the line in 2018.
In this instance, openness to a design modification funded by a major beneficiary led to animprovement in project design by adding value to complementary property development; valuecapture allowed re-orientation of design towards overall value creation, rather than just coretransport outcomes.
3,250
3,535
3,107
2,824
4,179
3,071
3,458
4,072
9,498
3,420
2,9482,682
4,036
2,848
3,636
2,999
3,542
3,937
3,893
3,8385,671
2,787
7,922
4,715
3,892
4,379
4,115
3,600
4,202
2,967
3,683
6,675
4,661
0.0 1,000.0 2,000.0 3,000.0 4,000.0 5,000.0 6,000.0 7,000.0 8,000.0 9,000.0 10,000.0
Waltham Forest
Sutton
Richmond upon Thames
Redbridge
Newham
Merton
Kingston upon Thames
Hounslow
Hillingdon
Havering
Harrow
Haringey
Enfield
Ealing
Croydon
Bromley
Brent
Bexley
Barnet
Barking and Dagenham
Westminster
Wandsworth
Tower Hamlets
Southwark
Lewisham
Lambeth
Kensington and Chelsea
Islington
Hammersmith and Fulham
Hackney
Greenwich
City of London
Camden
£
INNERLONDON
OUTERLONDON
Infrastructure VictoriaValue capture: options, challenges and opportunities for Victoria – Technical appendix EY ÷ 66
Examples of recent UK City Deals
Cardiff Capital Region City Deal
The Cardiff Capital Region, made up of 10 local authorities across south-east Wales, is the largestcity region in Wales. It accounts for around half of all Welsh employment and gross value added(GVA) – a key measure of economic output. Despite this, the region’s GVA is lower than all but oneof the largest English city regions. There are also challenges in enabling Valleys communities toaccess economic opportunities.
The Cardiff Capital Region City Deal was agreed in March 2016. It has been allocated a £1.2 billioninvestment fund over a 20-year period, from which £734 million will be spent on the Metro projectand Valleys line electrification.
Both the UK and Welsh Government are contributing £500 million to this fund respectively. TheWelsh Government funding will be provided over the first seven years of the Investment Fund, from2016/17 to 2022/23. The ten local authorities in the Cardiff Capital Region will contribute aminimum of £120 million over the 20 year period of the Fund. In addition, over £100m from theEuropean Regional Development Fund has been committed to delivering the City Deal.
In order to receive the remainder of the funding, the Cardiff Capital Region have to demonstrate,via an independent assessment every five years, that the investments have met key objectives andcontributed to Welsh and UK economic growth. This remaining element could fund other schemesto further support economic growth, including investment in further transport projects, housingand employment sites, or research and innovation facilities.
The City Deal also aims to attract £4 billion of additional private sector investment, creating25,000 new jobs and increasing the region’s GVA by at least 5% over the investment period.
Source: Growth in south-east Wales, Gareth Thomas, Andrew Minnis and Elfyn Henderson, National Assembling for WalesResearch Service, 7 June 2016, https://assemblyinbrief.wordpress.com/tag/city-deal/
Aberdeen City
The UK government and the Scottish Government committed to jointly investing up to £250m overthe next 10 years subject to detailed business cases and implementation plans.
The deal includes a new investment in an Oil and Gas Technology Centre and support research inbiopharmaceuticals and food science.
There are also initiatives on expending Aberdeen Harbour and transport infrastructure.
Benefits and implications of city deals
Benefits of the City Deals initiative include its focus on productivity and liveability, and its enhancedgovernance framework that sees greater collaboration and accountability between stakeholders,including shared local decision-making. It also relies more on growing efficient revenue sources andcreating improved investment accountability by increasing transparency and sharing contributionsto infrastructure funding in exchange for a share of any increase in tax receipts realised by thehigher tiers of the government.
A relevant question is whether similar arrangements could work in Australia given its differentallocation of revenue raising powers and delivery responsibilities across its three levels ofgovernment. While these possibilities are worthy of consideration, what is clear is that a similarapproach would be less effective as part of a state-based value capture policy, particularly giventhe largest share of indirect tax gains linked to wider productivity growth underpinned byinfrastructure investment flow to the Federal Government. As such, for similar arrangements towork in Australia both state and Federal governments would be required to participate.
Infrastructure VictoriaValue capture: options, challenges and opportunities for Victoria – Technical appendix EY ÷ 67
Source: https://www.gov.uk/government/publications/aberdeen-city-region-deal
Examples in the United StatesTransbay Transit Center – San Francisco
The Transbay Transit Center is an example of how the design and scope of a project can have asignificant impact on the availability and suitability of new funding and financing options, and viceversa.
The project was originally conceived as a transport project, but with the addition of significantinvestment in amenity features and the creation of opportunities for development, value capturerevenues in the form of future property taxes were unlocked and made available to support a loanfrom the Federal government.
The Transbay Transit Center is a $4.5bn transportation and housing project in downtown SanFrancisco which will replace the former Transbay Terminal with a modern regional transit hubconnecting eight Bay Area counties and the State of California through 11 different transportsystems.
The project will create a new neighbourhood with homes, offices, parks and shops surrounding thenew Transit Center. It will feature a 5.4 acre park on the roof of the bus and rail station and anadjacent tower (which at 326m will be the tallest in San Francisco). New elevated bus ramps willopen up additional parcels of land for development opportunities.
Phase 1 of the project ($1.6bn) has been fully funded. A significant portion of this funding is basedon value capture revenues arising from the development opportunities created through the designof the project. Revenue sources include $429 million of land sales, and $171 million TIFIA loansecured by dedicated property tax increment revenues from land sold and developed in the state-owned parcels surrounding the Transit Center, and a commitment of passenger facilities chargesfrom the Transit Center's initial primary tenant, AC Transit.
The repayment and servicing of the TIFIA loan is achieved through the implementation of a TaxIncrement Financing scheme. In total, the approximately $430m (FY 2004/05 dollars) in netproperty tax increment is expected to be generated over the life of the Redevelopment Plan, afterthe Agency meets its obligations to make payments to affected taxing entities. Approximately$178m of the net tax increment is pledged to help pay the cost of rebuilding the transit hub. Theremaining tax increment generated will be split evenly between an affordable housing program inthe Project Area and funds for other non-housing projects and activities related to the Project.
Additional beneficiary-pays funding sources are being used to contribute to Phase 1, including$100 million in local sales taxes, and $200 million from Bay Area toll bridge revenue.
Source: http://transbaycenter.org/
East Point, Georgia
The City of East Point, Georgia created the $22 million Camp Creek Tax Allocation Fund (TAD) in2001 to extend infrastructure into an area that had not been previously developed due to difficulttopography. These improvements sparked the development of the Camp Creek Trade Centre (abusiness park), Camp Creek Market Place (a 123,000m2 regional shopping centre) and 1,400housing units in the area in 5 years. The additional tax revenue from these developments isgenerating the income stream to repay the TIF bonds that funded the initial improvements.
This TIF has been so successful that, in 2006, the City created its second TIF – the East PointCorridors TAD, to encourage private investment in the City’s major corridors and Central BusinessDistrict.
Infrastructure VictoriaValue capture: options, challenges and opportunities for Victoria – Technical appendix EY ÷ 68
The East Point Corridors TAD is a $98 million TIF that is expected to generate $164 million inappreciation of existing properties and $191 million in new development over 25 years, therebyproviding the new tax revenue needed to retire the TIF bonds. Public infrastructure to be funded bythe TAD includes:
· new parks, open spaces and pathways and trails, linking to the area’s parks· roadway improvements and sidewalk and pedestrian friendly streetscape improvements· land assemblages and/or on site preparation for private commercial and residential
development· construction of new public facilities, including a community recreation centre· improvements to the area’s basic water, sewer and transportation infrastructure.
The TAD, through provision of the above-mentioned infrastructure, is also expected to provideincentives for significant commercial, industrial and residential private development. As noted bythe East Point Corridors TAD Development Plan:
“Creating the East Point Corridors TAD will provide inducement for certain major newdevelopments that will spur more desirable and sustainable, market-based commercial andresidential development in this area. With careful planning and guidance, the Main Street Corridor,Cleveland Avenue Corridor and Washington Road Corridor – and their surrounding communities –can be transformed into desirable, viable commercial and pedestrian friendly communities.”
Source: City of East Point (2006) East Point Corridors Tax Allocation District and Redevelopment Plan.
Other examplesProperty development funding mass transit – Hong Kong’s MTR
Hong Kong’s “rail plus property” model for funding the city’s railway system is the world’s best-known and most successful example of value capture via property development, with manystakeholders interested in understanding its relevance for value capture in Australia.
The Mass Transit Railway (MTR) corporation, a majority government-owned entity which hasexpanded from Hong Kong to operating rail systems around the world (including in Melbourne), actsas both infrastructure investor, system operator, and property developer, with the synergiesbetween these three activities in the context of Hong Kong’s extremely high population densityallowing for profitable operations (farebox revenue covering operating costs) and developmentprofits that fully fund the transport infrastructure, with no contribution required from government.
MTR funds construction of rail lines by developing and managing residential and commercialproperty on top of and around stations, leasing the land from the Hong Kong government on a‘greenfields’ basis (i.e. at pre-railway values). MTR then develops the land and either sells or retainsthe developed properties. The increased density associated with the development, which isundertaken with a focus on seamless design of stations to facilitate ridership, in turn supportspatronage and fare revenue.
In 2015 MTR generated a HKD $19bn (AUD $3.2bn) operating profit. This was made up of a $7bnprofit from transport operations, $5bn from station commercial businesses, $4bn from propertyrental and management businesses, and $3bn from property development.
In considering whether this example can guide the development of value capture policy and practicein Victoria, it is important to recognise that Hong Kong is a vastly different city than Melbourne orany of Australia’s capital cities.
As of 2015 its population stood at 7.3 million, with an average density of 6,760 persons per squarekilometre and with the most densely populated district of Kwun Tong having a density of 57,360persons per square kilometre. This level of population and density of development (and associatedtransport system congestion), combined with some of the world’s highest property prices, greatly
Infrastructure VictoriaValue capture: options, challenges and opportunities for Victoria – Technical appendix EY ÷ 69
enhances the potential for supporting the construction and operation of rail systems on acommercial basis.
This limits the relevance of this case study for advancing value capture policy in Victoria. There arealso other socio-economic and political differences that can influence the effectiveness of valuecapture funding through property development.
However, there may be some lessons that can be adapted to the Victorian context. For example, itcould be possible to fund greenfield rail investments (e.g. rail extensions, new stations) throughproperty developments on surplus government land and from across the broader catchments inwhich they serve, particularly if the infrastructure can be shown to increase land values andaccelerate development. It also highlights a possible benefit of increasing population densities alongrail corridors, where a critical mass of development can help to fund the project while alsoachieving other desirable land use outcomes.
Sources: MTR annual report 2015; Wing-tat Hung (2014) “Transit oriented development and value capture – Hong Kong”,presentation to UNESCAP conference, Ahmedabad; EY (2011) “Land value capture as a funding source for urbaninvestment – the Warsaw metro system”, http://www.censtatd.gov.hk/hkstat/hkif/index.jsp
Porto Maravilha Urban Operation, Rio De Janeiro
Porto Maravilha is a waterfront region and one of the oldest urbanised areas of Rio de Janeiro. Thestrategic location of the port played a key role in the city’s social and economic development, buthas struggled as a consequence of economic decline and the modernisation of maritimetransportation. The project's aim is to regenerate the waterfront area of Rio de Janeiro and tocreate a vibrant city centre that blends a modern multimodal transportation hub with the region’shistorical and architectural heritage.
An ‘Urban operation’ is a funding, financing and delivery model regulated by the municipality toimplement urban improvements within a defined area of the city. It is funded by the selling ofbonds that can be converted into additional development rights inside its perimeter, calledCertificates of Potential Additional Construction (CEPACs). All funds raised through the sale of theCEPACs must be reinvested inside the Urban Operation area. CEPACs were developed as early as1995 for the redevelopment of the Faria Lima area of São Paulo, and were used to fund the city’sÁgua Espraiada redevelopment project.
The value of CEPACs is dependent upon the increase land value within the Urban Operation area.CEPACs anticipate local government revenues that would be collected in the future through landvalue gains. By capitalising on anticipated future expectations, the government raises upfront cashand invests it in a way that triggers an effective increase of real estate values.
In June 2011, Caixa Econômica Federal Bank, a state-owned financial institution, bought all theCEPACs for the Porto Maravilha Urban Operation for R$ 3.5 billion (approximately AU$2 billion).Caixa Econômica Federal Bank sells the bonds at a profit to property developers for theconstruction of commercial and residential buildings in the project’s area. The funds raised by thesale of CEPACs account for all the works and public services in Porto Maravilha, generating newopportunities for social and economic development, this includes:
· construction of 4 km of tunnels, enabling more public spaces for pedestrians and cyclists;
· rehabilitation of 70 km of streets and 650,000 m² of footpaths;
· construction of 17 km of bicycle paths;
· planting of 15,000 trees;
· replacement of a 4.8 km elevated highway to increase traffic capacity by 30%;
Infrastructure VictoriaValue capture: options, challenges and opportunities for Victoria – Technical appendix EY ÷ 70
· construction of 28 km of light rail transit, connected to the metropolitan public transportsystem;
· improvement in local drainage capacity and adaptation to rising sea levels;
· construction of museums and the restoration of historic buildings;
· creation of a new fibre-optic network; and,
· professional capacity building and training for micro and small enterprises.
Source: Metropolis (2014) Porto Maravilha Urban Operation <http://policytransfer.metropolis.org/case-studies/porto-maravilha-urban-operation>.
Israel’s uplift-based betterment levies
Israel has one of the world’s longest established and most successful value capture policies, whichcan be traced back to British administration over the region in the early parts of the 20th century.Israel’s betterment tax was initially based on unworkable British value capture policies, but wassubstantially revised in 1981 to set out clear and practical rules for levying the net bettermentderived from land-use decisions.
Under the Israeli betterment levy, the Government imposes a ‘land appreciation tax’ (LAT) upon thesale of “real property” (i.e. land) to capture value uplift since the time of purchase, with the tax rateset in line with personal marginal tax rates up to a maximum of 25%. Furthermore, in certain cases,local planning commissions may levy up to 50% of land value uplift attributable to planningdecisions.
The success of the Israeli betterment levy can be attributed to five key factors. Firstly, it has aclear purpose, which is to fund local infrastructure and services. Secondly, the value appraisalprocedure is transparent and is undertaken at an individual property level, with a right for propertyowners/developers to appeal the results of the appraisal. Thirdly, the betterment rate is consistentand non-discretionary, but provides for exemptions based on economic or equity grounds.Fourthly, the revenue collected from the levy is sufficient to justify the significant costs required toadminister it. And finally, there is strong support from all sides of politics for the betterment levyand other forms of value capture, such that it has not featured as a prominent issue in national orlocal politics.
Sources: Alterman, R. (2012) Land-use regulations and property values: The "windfalls capture" idea revisited. In: N.Brooks, K. Donaghy and G. Knaap eds., 2012. The Oxford Handbook of Urban Economics and Planning. New York: OxfordUniversity Press. pp. 755-786; Deloitte (2016), International Tax: Israel Highlights 2016(http://www2.deloitte.com/content/dam/Deloitte/global/Documents/Tax/dttl-tax-israelhighlights-2016.pdf)
The impact of transport infrastructure on property prices
Land value gains associated with transport investment have been the subject of considerable study.Clear and lasting value uplift on residential and commercial landholdings located in close proximityto new transport projects is well-documented. Selected research on these impacts is presented inthe table below.
Table 32: Selected evidence on the impact of transport infrastructure on property prices
Selected studies Key findings
Crossrail studies(various)
The Crossrail Property Impact Study (2012) estimated that capital values in the areas aroundcentral London Crossrail stations would rise by 35% for residential properties, and 27.5% for officeproperties, over and above an already-rising baseline projection. Whereas residential values on theouter sections of the line were expected to rise a cumulative 27.5% above baseline, but office valuesto grow only slightly faster (0.5–2.5%) than baseline.
Nationwide (UK, Using the Nationwide House Price Model, Nationwide assessed how property prices in the Greater
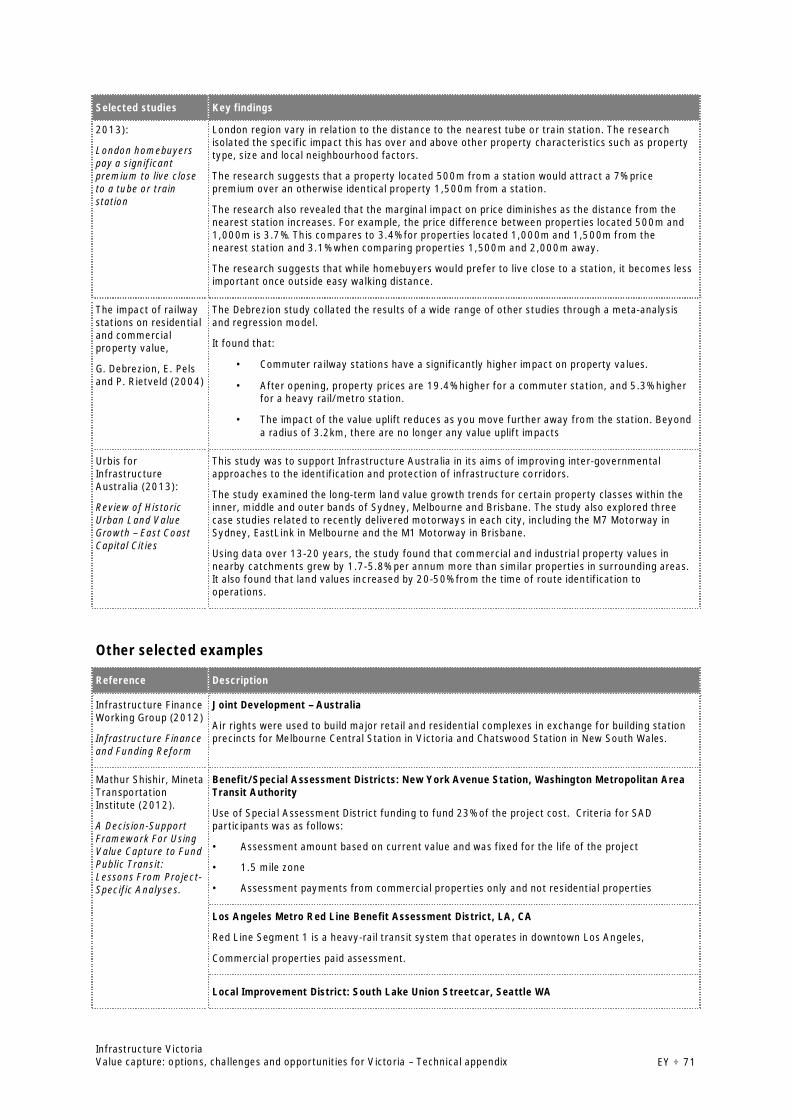
Infrastructure VictoriaValue capture: options, challenges and opportunities for Victoria – Technical appendix EY ÷ 71
Selected studies Key findings
2013):
London homebuyerspay a significantpremium to live closeto a tube or trainstation
London region vary in relation to the distance to the nearest tube or train station. The researchisolated the specific impact this has over and above other property characteristics such as propertytype, size and local neighbourhood factors.
The research suggests that a property located 500m from a station would attract a 7% pricepremium over an otherwise identical property 1,500m from a station.
The research also revealed that the marginal impact on price diminishes as the distance from thenearest station increases. For example, the price difference between properties located 500m and1,000m is 3.7%. This compares to 3.4% for properties located 1,000m and 1,500m from thenearest station and 3.1% when comparing properties 1,500m and 2,000m away.
The research suggests that while homebuyers would prefer to live close to a station, it becomes lessimportant once outside easy walking distance.
The impact of railwaystations on residentialand commercialproperty value,
G. Debrezion, E. Pelsand P. Rietveld (2004)
The Debrezion study collated the results of a wide range of other studies through a meta-analysisand regression model.
It found that:
· Commuter railway stations have a significantly higher impact on property values.
· After opening, property prices are 19.4% higher for a commuter station, and 5.3% higherfor a heavy rail/metro station.
· The impact of the value uplift reduces as you move further away from the station. Beyonda radius of 3.2km, there are no longer any value uplift impacts
Urbis forInfrastructureAustralia (2013):
Review of HistoricUrban Land ValueGrowth – East CoastCapital Cities
This study was to support Infrastructure Australia in its aims of improving inter-governmentalapproaches to the identification and protection of infrastructure corridors.
The study examined the long-term land value growth trends for certain property classes within theinner, middle and outer bands of Sydney, Melbourne and Brisbane. The study also explored threecase studies related to recently delivered motorways in each city, including the M7 Motorway inSydney, EastLink in Melbourne and the M1 Motorway in Brisbane.
Using data over 13-20 years, the study found that commercial and industrial property values innearby catchments grew by 1.7-5.8% per annum more than similar properties in surrounding areas.It also found that land values increased by 20-50% from the time of route identification tooperations.
Other selected examples
Reference Description
Infrastructure FinanceWorking Group (2012)
Infrastructure Financeand Funding Reform
Joint Development – Australia
Air rights were used to build major retail and residential complexes in exchange for building stationprecincts for Melbourne Central Station in Victoria and Chatswood Station in New South Wales.
Mathur Shishir, MinetaTransportationInstitute (2012).
A Decision-SupportFramework For UsingValue Capture to FundPublic Transit:Lessons From Project-Specific Analyses.
Benefit/Special Assessment Districts: New York Avenue Station, Washington Metropolitan AreaTransit Authority
Use of Special Assessment District funding to fund 23% of the project cost. Criteria for SADparticipants was as follows:
• Assessment amount based on current value and was fixed for the life of the project
• 1.5 mile zone
• Assessment payments from commercial properties only and not residential properties
Los Angeles Metro Red Line Benefit Assessment District, LA, CA
Red Line Segment 1 is a heavy-rail transit system that operates in downtown Los Angeles,
Commercial properties paid assessment.
Local Improvement District: South Lake Union Streetcar, Seattle WA
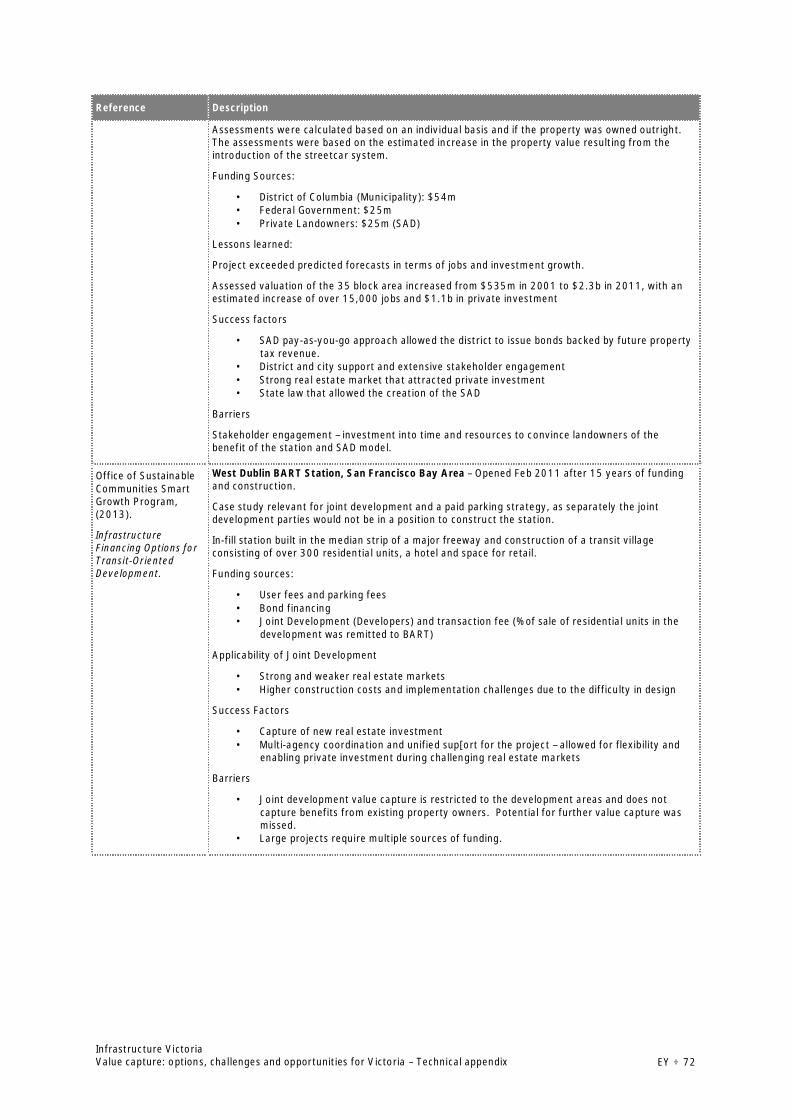
Infrastructure VictoriaValue capture: options, challenges and opportunities for Victoria – Technical appendix EY ÷ 72
Reference Description
Assessments were calculated based on an individual basis and if the property was owned outright.The assessments were based on the estimated increase in the property value resulting from theintroduction of the streetcar system.
Funding Sources:
· District of Columbia (Municipality): $54m· Federal Government: $25m· Private Landowners: $25m (SAD)
Lessons learned:
Project exceeded predicted forecasts in terms of jobs and investment growth.
Assessed valuation of the 35 block area increased from $535m in 2001 to $2.3b in 2011, with anestimated increase of over 15,000 jobs and $1.1b in private investment
Success factors
· SAD pay-as-you-go approach allowed the district to issue bonds backed by future propertytax revenue.
· District and city support and extensive stakeholder engagement· Strong real estate market that attracted private investment· State law that allowed the creation of the SAD
Barriers
Stakeholder engagement – investment into time and resources to convince landowners of thebenefit of the station and SAD model.
Office of SustainableCommunities SmartGrowth Program,(2013).
InfrastructureFinancing Options forTransit-OrientedDevelopment.
West Dublin BART Station, San Francisco Bay Area – Opened Feb 2011 after 15 years of fundingand construction.
Case study relevant for joint development and a paid parking strategy, as separately the jointdevelopment parties would not be in a position to construct the station.
In-fill station built in the median strip of a major freeway and construction of a transit villageconsisting of over 300 residential units, a hotel and space for retail.
Funding sources:
· User fees and parking fees· Bond financing· Joint Development (Developers) and transaction fee (% of sale of residential units in the
development was remitted to BART)
Applicability of Joint Development
· Strong and weaker real estate markets· Higher construction costs and implementation challenges due to the difficulty in design
Success Factors
· Capture of new real estate investment· Multi-agency coordination and unified sup[ort for the project – allowed for flexibility and
enabling private investment during challenging real estate markets
Barriers
· Joint development value capture is restricted to the development areas and does notcapture benefits from existing property owners. Potential for further value capture wasmissed.
· Large projects require multiple sources of funding.
Infrastructure VictoriaValue capture: options, challenges and opportunities for Victoria – Technical appendix EY ÷ 73
Appendix 2. Value capture funding in Victoria’s current taxand planning system
Some value capture mechanisms are already present in Victoria’s current tax and planning systemand these are outlined in this section. They include:
· Value capture via ‘automatic uplift’ to existing taxes
· Developer contributions and related mechanisms
· Development rights, sales and leases
· User charges
Value capture via ‘automatic uplift’
It is recognised that existing taxes provide a degree of ‘automatic’ value capture whenever a stateinvestment raises property values, especially in the case of land tax, stamp duty and capital gainstax, as well as sometimes in the case of local government rates to the extent that a growingrevenue base can be translated into higher rates through the rate-setting process.
It is also noted that infrastructure projects that raise productivity and incomes also increase arange of taxes, particularly labour income and payroll taxes. In either of these cases, some of thisadditional revenue is received by the state; some is reflected in the local government rates base orin Commonwealth tax revenues.
In the UK, a model for capturing automatic uplift accruing to other levels of government has beenimplemented in the form of “City Deals”. Under these agreements, growth in central governmenttax revenue attributable to investments by sub-national authorities is estimated and a portionreturned to these parties, with this ‘earn back model’ helping to establish a rolling fund forinfrastructure delivery by local governments. It is essentially a codified contract between aneconomic region and the central government, and an important tool to support the UKGovernment’s devolution agenda and the growing role it creates for regional governments ininfrastructure and service delivery and as significant population and economic centres.
Each City Deal identifies a list of priority infrastructure projects to be delivered along withbenchmarks of economic and productivity growth to be achieved. Highlights for recent City Deals inCardiff and Aberdeen are identified in the table below.
Benefits of the City Deals initiative include its focus on productivity and liveability, and its enhancedgovernance framework that sees greater collaboration and accountability between stakeholders,including shared local decision-making. It also relies more on growing efficient revenue sources andcreating improved investment accountability by increasing transparency and sharing contributionsto infrastructure funding in exchange for a share of any increase in tax receipts realised by thehigher tiers of the government.
A relevant question is whether similar arrangements could work in Australia given its differentallocation of revenue raising powers and delivery responsibilities across its three levels ofgovernment. While these possibilities are worthy of consideration, what is clear is that a similarapproach would be less effective as part of a state-based value capture policy, particularly giventhe largest share of indirect tax gains linked to wider productivity growth underpinned byinfrastructure investment flow to the Federal Government. As such, for similar arrangements towork in Australia both state and Federal governments would be required to participate.

Infrastructure VictoriaValue capture: options, challenges and opportunities for Victoria – Technical appendix EY ÷ 74
For the purposes of this report only actions within the power of the state are examined further.Mechanisms for recouping a portion of tax revenue by agreement with the Commonwealth aretherefore not discussed further.18
Limitations as value capture mechanisms
The issue of automatic uplift raises three questions for value capture policy:
· Are new value capture revenue streams really needed when existing taxes already capturesome uplift; are existing taxes an adequate value capture strategy?
· Might new value capture mechanisms risk ‘double taxing’ and potentially over-chargingbeneficiaries? Is it possible that new mechanisms on top of existing taxes might lead tosome properties becoming net losers from infrastructure projects?
· Do tax increases materialise as an increase in overall tax collections and, if so, which levelsof government derive the greatest benefit?
In considering the first and second questions it is important to consider how existing taxes and landvalue uplift observed from infrastructure investment are related.
Potential purchasers of property naturally take established taxes into account when consideringproperty acquisitions. That means that any value uplift observed following provision of beneficialinfrastructure represents the market’s view of how much more the location is worth, net of theanticipated higher payments of established taxes – Capital Gains Tax, rates, land tax and everyother property tax that purchasers take into account. Just as anticipated taxes are capitalised intoland values when the infrastructure environment is static, so too are future payments on thesetaxes reflected in how much more markets value properties anticipated to benefit from newly-announced projects.
If land value growth does occur after infrastructure is provided and the value uplift can be traced tothe investment, this means existing taxes are failing to capture all value generated. Reliance onexisting taxes is evidently not an adequate value capture strategy since, on this basis, there aresignificant private windfalls – currently subsidised by public spending – that could instead becaptured and used to fund infrastructure instead of burdening general taxpayers with the fundingtask. While it is true that rising revenue from existing taxes means some value created is beingautomatically captured, this does not diminish the opportunity for new revenue streams.
The eventual uplift is also the amount that value capture instruments may target without risking‘double taxation’ (i.e. taxing the same value gain twice). As long as revenue targets are no higherthan what would otherwise be privately captured, and the mechanism targets beneficiariesaccurately, then fears of ‘double taxation’ are misplaced. In practice, value capture mechanismsusually aim for a far smaller share of benefits, so the risk of landowners missing out on capital gainsis further diminished.
The opportunity for new value capture revenue streams is significant because the powers ofexisting state taxes to capture gains are generally minor. The average land tax rate across thestate, for instance, is in the region of 0.1-0.2%. A project that increases private land values will thusrecoup only one or two-thousandths of that gain each year, or perhaps 4-5% in present-value termsover all future years (although the proportions will be higher where project benefits areconcentrated on taxable land).
18 Although a state-based uplift tax mechanism functioning much like CGT and tapping broadly the same tax base isconsidered, under the category of betterment levies.
Infrastructure VictoriaValue capture: options, challenges and opportunities for Victoria – Technical appendix EY ÷ 75
There are also constraints on the ability of local government taxes to support automatic valuecapture, as council apply low rates that are generally set against annual operating expenditure inthe context of rate capping.
Interest in accessing Commonwealth tax bases to fund state infrastructure is prompted by the viewthat Capital Gains Tax (CGT), as a revenue line more closely reflecting land value uplift, may bequantitatively more important than existing state taxes. As CGT is collected by the Commonwealth,there is currently a misalignment between the level of government with the most influence over therevenue base and the level collecting the tax.
In relation to the third question identified above, there is some uncertainty regarding the extent towhich changes in property related taxes for individual beneficiaries translate into an overallincrease in tax collections. For example, changes in the value of land and property developments inone location may be offset by reductions elsewhere if it reflects a redistribution of market demandinstead of a general increase in the willingness to pay for land. While there may be clear benefits forcertain landowners that justifies the application of value capture at the local level, the potential fora redistribution of land values provides a constraint on the ability for governments to automaticallycapture value from overall property tax collections.
However, in the case of income and payroll taxes the situation is different. Infrastructure projectsthat can be demonstrated to increase economic productivity do create permanent increases inthose taxes, with the primary beneficiary being the Federal Government as the collector of personaland company income taxes. The extent of this automatic tax gain depends on the nature of theproject and its impact on productivity, with our analysis of the current Melbourne Metro projectbusiness case suggesting it could be in the range of 15-35% of project costs, with the majorityflowing to the Federal Government and not the State Government as funder of the project.
Developer contributions and related mechanisms
There are a number of funding mechanisms that are available through the planning system thathave characteristics of value capture mechanisms, including:
· The Growth Area Infrastructure Contribution (GAIC)
· Development Contribution Plans (DCPs)
· Section 173 Agreements under the Planning and Environment Act 1987
· The new Victorian Infrastructure Contributions system
· Places Victoria (Urban Renewal Authority) Charges.
Growth Area Infrastructure Contribution (GAIC)
The Growth Area Infrastructure Contribution (GAIC) began operation on 1 July 2010 and applies togrowth area land brought into the Urban Growth Boundary since 2005-06 or subsequently which iszoned for urban development.
The GAIC is applied on a per hectare basis, with rates indexed annually at the start of each financialyear. The indexed GAIC rates for the 2014/15 financial year were $88,770 per hectare for Type Agrowth area land, and $105,420 per hectare for Type B & C growth area land.19
GAIC is designed to cover around 15% of State Government infrastructure costs in the growthareas, and developers are making a significant contribution to funding infrastructure in growth
19 Metropolitan Planning Authority (2015), Annual Report for 2014-15 (https://vpa-web.s3.amazonaws.com/wp-content/uploads/2015/10/MPA-2014-2015-Annual-Report_WEB-1.pdf)

Infrastructure VictoriaValue capture: options, challenges and opportunities for Victoria – Technical appendix EY ÷ 76
areas. According the annual report for the Metropolitan Planning Authority, around $40 million wasreceived from the GAIC in 2014-15, with around $13 million in payments deferred and around $64million in staged payments agreed.
The State Revenue Office (SRO) collects the GAIC, with funds raised directed to the ConsolidatedFund before being distributed evenly into the Building New Communities Fund and the GrowthAreas Public Transport Fund.
The Growth Areas Public Transport Fund can be applied by the Planning Minister, with the approvalof the Treasurer, for the following purposes:
· Land acquisition and capital works costs for State funded public transport infrastructure inany growth area;
· Recurrent costs for public transport services in a growth area for up to 5 years; and
· The Commissioner of State Revenue's costs in administering the GAIC scheme.
The Building New Communities Fund can be applied by the Planning Minister for the followingpurposes:
· Transport infrastructure including walking and cycling but excluding major public transportinfrastructure;
· Community infrastructure including health facilities, education facilities, regional libraries,neighbourhood houses and major recreation facilities;
· Environmental infrastructure including regional open space, trails and creek protection;
· Economic infrastructure including providing access to information and technology andinfrastructure supporting the development of commerce and industry; and
· The acquisition of land and other infrastructure necessary or required for the establishmentor maintenance of any infrastructure referred to above.
The Planning Minister must not authorise the payment of an amount of $2 million or more from theBuilding New Communities Fund for the purpose of particular capital works without the approval ofthe Treasurer.
Development Contribution Plans (DCPs) and Section 173 Agreements
DCPs and Section 173 Agreements are administered by local government through planningschemes and the Planning and Environment Act 1987.
Development contributions can be either payments or in-kind works provided by developers tocontribute to the supply of infrastructure required to meet the future needs of a particulardevelopment and surrounding community. As such, they reflect a degree of value capture given theflow of benefits from local infrastructure provision to the attractiveness and feasibility ofdevelopment.
Contributions under a DCP may be levied through one or both of a development infrastructure levy(DIL) or a community infrastructure levy (CIL).
Voluntary agreements provide an alternative mechanism that can be easier to implement, placingan obligation on the landowner or developer to provide or pay for infrastructure, with themechanisms provided under Section 173 of the Planning and Environment Act 1987.
Infrastructure VictoriaValue capture: options, challenges and opportunities for Victoria – Technical appendix EY ÷ 77
Amounts collected via DCPs or Section 173 Agreements will vary by local government area ordevelopment project.
The new Victorian Infrastructure Contributions system
Infrastructure contributions traditionally help fund essential works and services for newcommunities including roads, parks, local sports and community facilities. More recently howeverlegislative reform in Victoria has widened their potential scope and application to include fundingState infrastructure.
The new Victorian Infrastructure Contributions system introduced in 2015 provides for a StandardLevy and Supplementary Levy (where appropriate). Development contributions have previouslybeen designed to fund State infrastructure (e.g. Fisherman’s Bend) however the new systemprovides a clearer basis for the application of an Infrastructure Contributions Plan in a planningscheme.
The supplementary levy is an optional levy for use when the standard levy cannot adequately fundthe required infrastructure to unlock the growth capacity of the area. The supplementary levy mayalso be used to fund state infrastructure in growth areas where the GAIC does not apply. Thesupplementary levy can also be utilised in Strategic Development Areas identified in Plan Melbourneincluding urban renewal and National Employment Clusters.
Places Victoria (Urban Renewal Authority) Charges
Places Victoria has relatively broad statutory rights under the Urban Renewal Authority Act 2003to impose infrastructure charges – both developer contributions and betterment levies – onproperties within prescribed project areas.
There is significant flexibility in how these charges may be applied, with scope for the charge to bedifferent for different classes of property and to include a scale of charges dependent ongeographic location. Major investments that have ‘place-making’ objectives (particularly transportinfrastructure, but also the social infrastructure needed to serve growing populations) could befunded more extensively, with benefit-capture focused developer contributions in particular, bydeclaring the relevant project areas and using Places Victoria powers.
The use of these powers were originally an important part of funding projects like the $290 millionRevitalising Central Dandenong initiative through its Infrastructure Recovery Charge. According toPlaces Victoria’s annual reports, the Infrastructure Recovery Charge raised $283,000 in 2013-14and $3.4 million in 2012-13.
Limitations as value capture mechanisms
In recent years there has been considerable energy devoted to reforming Victoria’s system ofdeveloper contributions and related mechanisms, although limitations and revenue shortages stillexist. For example, the Ministerial Advisory Committee review of Plan Melbourne highlightedshortcomings affecting growth area councils like Wyndham, pointing out that DCPs will raise only$1.6 billion of the $2.4 billion needed to fund local roads, open space and other communityinfrastructure.20
The report also highlighted that in the established areas of Melbourne, there is no opportunity tocapture the uplift from rezoning or permits to fund community infrastructure, except through aDCP incorporated into a planning scheme by other means such as Section 173 Agreement. Theyalso noted that other value capture options to share the rise in property prices attributable toplanning decisions are available but are not generally being applied.
20 Plan Melbourne 2015 Review, Report by the Ministerial Advisory Committee, June 2015

Infrastructure VictoriaValue capture: options, challenges and opportunities for Victoria – Technical appendix EY ÷ 78
Development rights, sales and leases
The sale or granting of development rights, asset sales and leases are a common feature ofinfrastructure provision in Victoria.
Well known examples in the transport section include the transfer of commercial and developmentrights associated with Southern Cross station, with residential development rights at Elsternwickstation.
More recently, the business case for the Melbourne Metro project focused on identifyingopportunities for the project to directly generate and capture value through integrateddevelopment and other commercial opportunities. Quantified value capture opportunitiesinclude:21
· Over site developments at CBD North and CBD South
· In-station retail and advertising.
Additional opportunities that are yet to be quantified include:
· Use of new telecommunications infrastructure to drive revenue
· Redevelopment of surplus land at Arden as part of the broader urban renewal of the Arden-Macaulay precinct.
The Tunnel and Stations PPP package will be responsible for delivering over site developments atCBD North and CBD South as well as retail and other commercial opportunities within the newstations.
Other projects and sectors also make use of commercial opportunities, including leases. Examplesinclude VicTrack’s commercialisation of its telecommunications network, and the use of commercialleases in the health sector, which can attract a range of services to co-locate at hospitals.
User charges and value capture
Users are usually the most direct or observable category of beneficiary of an infrastructure project.A user charge is a charge applied for the use of a specific asset each time the asset is used, in-principle providing the clearest form of value capture mechanism. The price charged typicallyreflects the use made of the asset and the timing of that use.
Well-designed user charges can provide a long term and sustainable funding base to improve notonly infrastructure supply, but also to facilitate more efficient use of infrastructure, by aligning theprice paid by users with the costs their use imposes. Tolls are a common form of charging for theuse of roads, and have directly funded numerous road projects over many years in Australia. Apublic transport levy is another form of additional charge imposed on transport fares paid by usersof specific public transport infrastructure or on fares paid by public transport users generally.Similarly, pricing of utilities, such as electricity, has been structured to ensure that charges paidrecoup costs. This is best exemplified by different charges for on and off-peak usage.
In principle, user charges are the clearest form of value capture mechanism – a direct beneficiarycharge. In practice, there are significant issues and challenges that mean prices cannot necessarilybe set purely according to beneficiary pays objectives. User charges are usually set with referenceto considerations like demand management, the practicality of charging, equity, or cost recoveryrather than benefit capture.
21 Department of Economic Development, Jobs, Transport and Resources (2016), Melbourne Metro Business Case

Infrastructure VictoriaValue capture: options, challenges and opportunities for Victoria – Technical appendix EY ÷ 79
The transport sector provides relevant examples of this. For instance, for many toll roads, thisinvolves the use of simplified tolling regimes with tolls that are fixed for each segment of the tollroad to balance cost recovery through higher demand and revenue collections with operationalefficiency. Both of Melbourne’s toll roads in CityLink and EastLink are good examples of this. And inthe case of public transport, fares are usually set to achieve a mix of objectives, where revenueraising is given a lower priority compared to other social policy objectives around access toemployment and services.
Because of these limitations on the application of user charges, and the lower level of charges thatare typically set compared to the benefits received by many users, there is the potential for theseunpriced benefits to manifest in nearby land values. While this might not be surprising the case ofhigh performing government schools and major public transport links, it is also the case forproperties located near but not too close to major toll roads such as CityLink, where a study by SGSEconomics and Planning for the Victorian Department of Transport in 2012 estimated that CityLinkadded around $25,000 to average household prices and around $18,000 to average unit prices by2011, adding around $30 billion to overall property values with the highest gains for households ininner and western Melbourne.22
Detailed consideration of particular categories of user charges is a separate exercise, andaccordingly the discussion of value capture below excludes further examination of user charging asa value capture tool for project funding. However, as the examples above demonstrate, there is thepotential for complementary user charging and value capture strategies to play a role in fundingthe delivery of infrastructure in Victoria. Any value capture policy and funding strategy needs tohave consideration of road and public transport user charging arrangements, as there is a directlink between the application of user charges and the level of value uplift a project may transfer tonearby properties. In this context, it is the unpriced benefits of infrastructure projects thatbecomes capitalised into land values through the operation of the property market. In this context,the design of value capture mechanisms should seek to minimise the risk of over-collecting (or“double dipping”) revenue compared to the benefits received by property owners.
While a greater role for user charging in some circumstances is possible, in other situations usercharges will only be able to provide a small contribution to project funding, with other objectivesrelated to demand management and social equity also important.
22 SGS Economics & Planning, Long run economic and land use impacts of major infrastructure projects, Report for theVictorian Department of Transport, 2012
Infrastructure VictoriaValue capture: options, challenges and opportunities for Victoria – Technical appendix EY ÷ 80
Bibliography
AECOM/PwC, (2016) Options Assessment 3 Technical Report – Supplement C Major transportprojects – preliminary costings Assessment 3, advice to Infrastructure Victoria
Alterman, R. (2012) Land-use regulations and property values: The "windfalls capture" idearevisited, in N. Brooks, K. Donaghy and G. Knaap eds., The Oxford Handbook of Urban Economicsand Planning, Oxford University Press, New York, pp. 755-786.
ATAP Steering Committee Secretariat (2016) Australian Transport Assessment and Planning(ATAP) Guidelines: T3 Wider economic benefits, Commonwealth Department of Infrastructure andRegional Development, Commonwealth of Australia, Canberra.
Cao, L., Hosking, A., Kouparitsas, M., Mullaly, D., Rimmer, X., Shi, Q., Stark, W. and Wende, S.(2015) Understanding the economy-wide efficiency and incidence of major Australian taxes,Working Paper 2015-01, The Treasury, Commonwealth of Australia, Canberra.
Centre for Transit Oriented Development (2008), Capturing the Value of Transit
City of East Point (2006) East Point Corridors Tax Allocation District and Redevelopment Plan.
Clegg, N. The Rt. Hon. (2011) Do it your way – Deputy Prime Minister launches new ‘city deals’,Speech published under the 2010 to 2015 Conservative and Liberal Democrat coalitiongovernment, Cabinet Office, Deputy Prime Minister’s Office, London.
Congress of the United States of America (1998) Transportation Infrastructure Finance andInnovation Act.
Debrezion, G, Pels, E, and Rietveld, P. (2004) The Impact of Railway Stations on Residential andCommercial Property Value: A Meta-analysis, Discussion Paper, Tinbergen Institute.
Debrezion, G., Pels, E., and Rietveld, P. (2006) The impact of rail transport on real estate prices:Empirical study of the Dutch housing market, Tinbergen Institute.
Deloitte (2016) International Tax: Israel Highlights 2016,<http://www2.deloitte.com/content/dam/Deloitte/global/Documents/Tax/dttl-tax-israelhighlights-2016.pdf>.
Department of Economic Development, Jobs, Transport and Resources (2016), Melbourne MetroBusiness Case, Victorian Government, Melbourne.
Department of Environment, Land, Water and Planning (2016) Central City Built Form Review,<http://delwp.vic.gov.au/planning/policy-and-strategy/central-city-built-form-review>
Dye, R. and Merriman, D. (2006) Tax Increment Financing – A Tool for Local EconomicDevelopment, Land Lines: January 2006, Volume 18, Number 1.
EY (2016) Central City Built Form Review – Feasibility Review.
Fishermans Bend Advisory Committee (2015) Report 1, report prepared for the Victorian Ministerfor Planning, Melbourne.
Gareth Thomas, G., Minnis, A. and Henderson, E. (2016) Growth in south-east Wales, NationalAssembly for Wales Research Service.
Gold Coast City Council (2014) Revenue Statement and Resolution of Rates and Charges, 2014-15.
Infrastructure VictoriaValue capture: options, challenges and opportunities for Victoria – Technical appendix EY ÷ 81
Gold Coast City Council (2014) Annual Plan 2014-15.
Greater London Authority (2010), Intention to levy a business rate supplement to finance theGreater London Authority’s contribution to the Crossrail project: Final Prospectus, Greater LondonAuthority, London.
GVA (2012) Crossrail Property Impact Study, consultant’s report prepared for Crossrail Limited,London.
Henry, K. (2010) Australia’s Future Tax System, report prepared for the Treasurer, Commonwealthof Australia, Canberra.
Infrastructure Australia (2016), Australian Infrastructure Plan, Commonwealth of Australia,Canberra.
Infrastructure Finance Working Group (2012) Infrastructure Finance and Funding Reform, reportprepared for Infrastructure Australia, Commonwealth of Australia, Canberra.
Infrastructure Victoria (2016) Victoria’s Draft 30-Year Infrastructure Strategy
Infrastructure Victoria (2016) All Things Considered – Exploring options for Victoria’s 30-yearinfrastructure strategy
Infrastructure Victoria (2016) Funding and Financing Additional Information Paper
Dominique Boufand David Hensher (2007) The dark side of making transit irresistible: The exampleof France, Working Paper ITLS-WP-07-10 prepared for the Institute of Transport and LogisticsStudies
Mathur, S. and Smith, A. (2012) A Decision-Support Framework For Using Value Capture to FundPublic Transit: Lessons From Project-Specific Analyses, Mineta Transportation Institute, San Jose.
Melbourne Underground Rail Loop Authority (1972), Report for the Year Ended June 30, 1972,Melbourne.
Metropolis (2014) Porto Maravilha Urban Operation <http://policytransfer.metropolis.org/case-studies/porto-maravilha-urban-operation>.
Metropolitan Planning Authority (2015), Annual Report for 2014-15, Melbourne, <https://vpa-web.s3.amazonaws.com/wp-content/uploads/2015/10/MPA-2014-2015-Annual-Report_WEB-1.pdf>.
Metropolitan Transit Authority (1985), Annual Report 1984-85, Melbourne.
Ministerial Advisory Committee (2015) Plan Melbourne 2015 Review, report prepared for theMinister for Planning, Victorian Government, Melbourne.
MTR (2015) 2015 Annual Report.
Nationwide (2013) London homebuyers pay a significant premium to live close to a tube or trainstation, < http://www.nationwide.co.uk/about/media-centre-and-specialist-areas/media-centre/press-releases/archive/2013/1/london-homebuyers-pay-a-significant-premium-to-live-close-to-a-tube-or-train-st>.
Organisation for Economic Co-operation and Development (2000) Integrating Transport in the City:Reconciling the Economic, Social and Environmental Dimensions, OECD Publishing, Paris.

Infrastructure VictoriaValue capture: options, challenges and opportunities for Victoria – Technical appendix EY ÷ 82
Office of Sustainable Communities Smart Growth Program (2013) Infrastructure Financing Optionsfor Transit-Oriented Development, United States Environmental Protection Agency, Washington.
Parliament of Victoria (1960) City of Melbourne Underground Railway Construction Act.
Parliament of Victoria (1970) Melbourne Underground Rail Loop Act.
Parliament of Victoria (1983) Transport Act.
Parliament of Victoria (1987) Planning and Environment Act.
Parliament of Victoria (2003) Urban Renewal Authority Act.
Parliament of Victoria (2010) Planning and Environment Amendment (Growth Areas InfrastructureContribution) Act.
Productivity Commission (2014) Public Infrastructure, Commonwealth of Australia, Canberra.
Source: Public Accounts and Estimates Committee (2006) Report on private investment in publicinfrastructure, seventy first report to the Parliament, Government Printer for the State of Victoria,Melbourne.
PwC (2014) Crossrail 2 Funding and Financing Study, <https://www.pwc.co.uk/capital-projects-infrastructure/assets/crossrail-2-funding-and-financing-study.pdf>.
Real Estate Institute of Victoria (2016) Top of the class: school zones boost prices in 2016, 27June 2016, < https://www.reiv.com.au/news/latest-news/top-of-the-class-school-zones-boost-prices-in-2016>.
Romana Medda, F. and Modelewska, M. (2011) Land value capture as a funding source for urbaninvestment – the Warsaw metro system, Ernst & Young, Warsaw.
Scottish Government (2016) Tax Incremental Financing,<http://www.gov.scot/Topics/Government/Finance/18232/TIF>.
SGS Economics & Planning (2012) Long run economic and land use impacts of major infrastructureprojects, consultant’s report prepared for the Victorian Department of Transport, Planning andLocal Infrastructure, Melbourne.
Thomas, G., Minnis, A. and Henderson, E. (2016) Growth in south-east Wales, National Assemblyfor Wales Research Service, <https://assemblyinbrief.wordpress.com/tag/city-deal/>
Urbis (2013) Review of Historic Urban Land Value Growth – East Coast Capital Cities, consultantreport prepared for Infrastructure Australia, Commonwealth of Australia, Canberra.
Urbis (2013), Review of Historic Urban Land Value Growth – East Coast Capital Cities, consultant’sreport prepared for Infrastructure Australia, Commonwealth of Australia, Canberra.
US Department of the Transportation, Transportation Infrastructure Finance and Innovation Act(TIFIA), Federal Highway Administration, <https://www.transportation.gov/tifia>
Wing-tat Hung (2014) Transit oriented development and value capture – Hong Kong”, presentationto UNESCAP conference, Ahmedabad.
Woollahra Municipal Council (2016), Draft Woollahra Voluntary Planning Agreement Policy:Exhibition version of 8 February 2016,<http://www.woollahra.nsw.gov.au/__data/assets/pdf_file/0004/163543/1._Woollahra_Voluntary_Planning_Agreement_Policy_-_Exhibition_version_of_8_February_2016.pdf>.

Infrastructure VictoriaValue capture: options, challenges and opportunities for Victoria – Technical appendix EY ÷ 83

EY | Assurance | Tax | Transactions | Advisory
About EYEY is a global leader in assurance, tax, transaction and advisory services. Theinsights and quality services we deliver help build trust and confidence in thecapital markets and in economies the world over. We develop outstanding leaderswho team to deliver on our promises to all of our stakeholders. In so doing, we playa critical role in building a better working world for our people, for our clients andfor our communities.
EY refers to the global organisation and may refer to one or more of the memberfirms of Ernst & Young Global Limited, each of which is a separate legal entity.Ernst & Young Global Limited, a UK company limited by guarantee, does notprovide services to clients. For more information about our organisation, pleasevisit ey.com.
© 2016 Ernst & Young, AustraliaAll Rights Reserved.
In line with EY’s commitment to minimize its impact on the environment, thisdocument has been printed on paper with a high recycled content.
Ernst & Young is a registered trademark. Our report may be relied upon byInfrastructure Victoria for the purpose of the Value Capture – Options, challengesand opportunities for Victoria only pursuant to the terms of our engagement letterdated 27 May 2016. We disclaim all responsibility to any other party for any loss orliability that the other party may suffer or incur arising from or relating to or in anyway connected with the contents of our report, the provision of our report to theother party or the reliance upon our report by the other party.
Liability limited by a scheme approved under Professional Standards Legislation.
ey.com