Embed Size (px)
Citation preview

Prepared by FIL Investment Services (UK) Limited
Covering the following fund ranges:Fidelity Investment Funds IIIFidelity Institutional Funds Fidelity UK Real Estate Fund
Value Assessment Report2021
2 Introduction
3 How we have assessed value
4 The Board
6 Message from the Chair
9 Quality of service
11 Performance
12 AFM costs
13 Economies of scale
14 Comparable market rates
15 Comparable services
16 Classes of units
17 Glossary
19 Fund pages and ratings
44 Important legal information
Contents
1 Fidelity Value Assessment Report 2021

Each year, Fund Managers in the UK must assess if
their funds represent ‘value for money’ and report
results to their investors in a value assessment
report. These requirements were set by the Financial
Conduct Authority (FCA).
This is our Value Assessment report for Investors
and their advisers. Reading it should help you to
understand how we carried out the Assessment,
so we have included details of our approach and
the information we used. The reference date of the
Assessment was 30 June 2021 and the conclusions
we have reached for each fund are shown on the
fund pages.
The Report also includes a message from the Chair
of the Board of FIL Investment Services (UK) Limited
explaining how the Board has overseen the
Value Assessment.
This Value Assessment Report is an important
addition to other fund documents that are available
to investors, including the Key Investor Information
Document (KIID) and fund factsheet. A full list of
funds covered in the Assessment is included in
the Fund Pages section of this report. Other funds
provided by the Management Company are featured
in separate value assessment reports dedicated to
those fund ranges.
Introduction
2Fidelity Value Assessment Report 2021
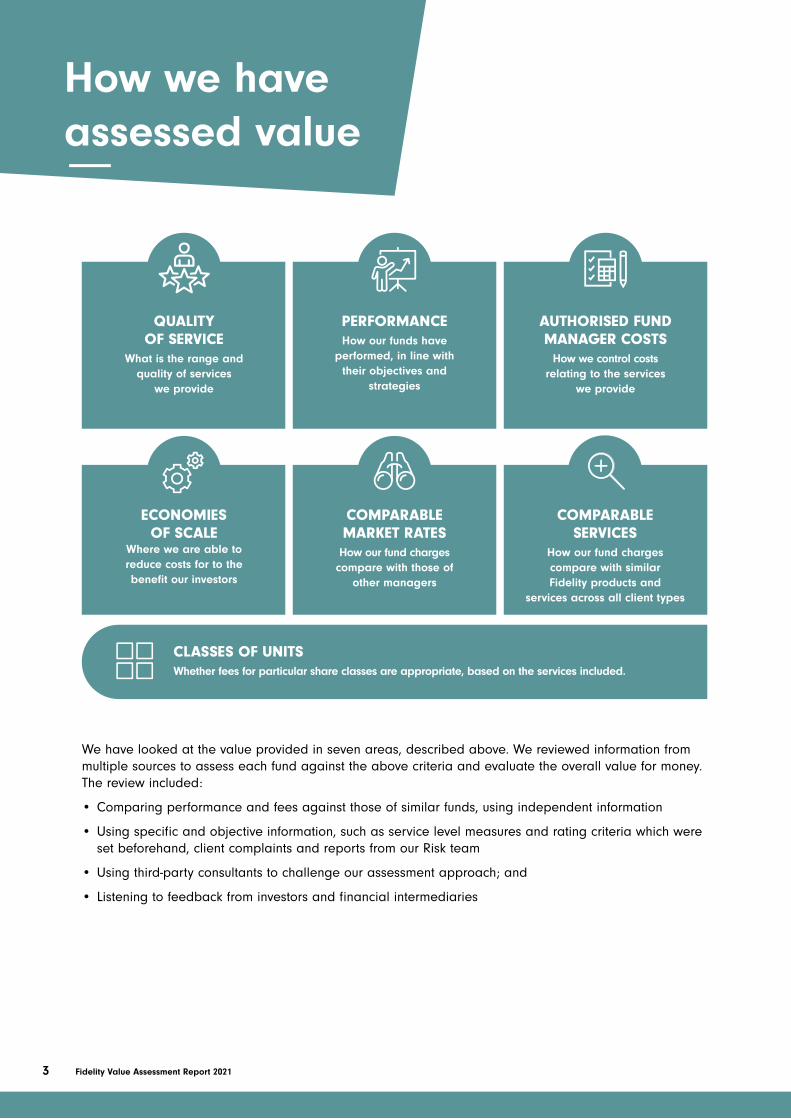
CLASSES OF UNITSWhether fees for particular share classes are appropriate, based on the services included.
PERFORMANCEHow our funds have
performed, in line with their objectives and
strategies
AUTHORISED FUND MANAGER COSTS
How we control costs relating to the services
we provide
QUALITY OF SERVICE
What is the range and quality of services
we provide
ECONOMIES OF SCALE
Where we are able to reduce costs for to the benefit our investors
We have looked at the value provided in seven areas, described above. We reviewed information from multiple sources to assess each fund against the above criteria and evaluate the overall value for money. The review included:
• Comparing performance and fees against those of similar funds, using independent information
• Using specific and objective information, such as service level measures and rating criteria which were set beforehand, client complaints and reports from our Risk team
• Using third-party consultants to challenge our assessment approach; and
• Listening to feedback from investors and financial intermediaries
How we have assessed value
COMPARABLEMARKET RATES How our fund charges compare with those of
other managers
COMPARABLE SERVICES
How our fund charges compare with similar Fidelity products and
services across all client types
3 Fidelity Value Assessment Report 2021
The Board
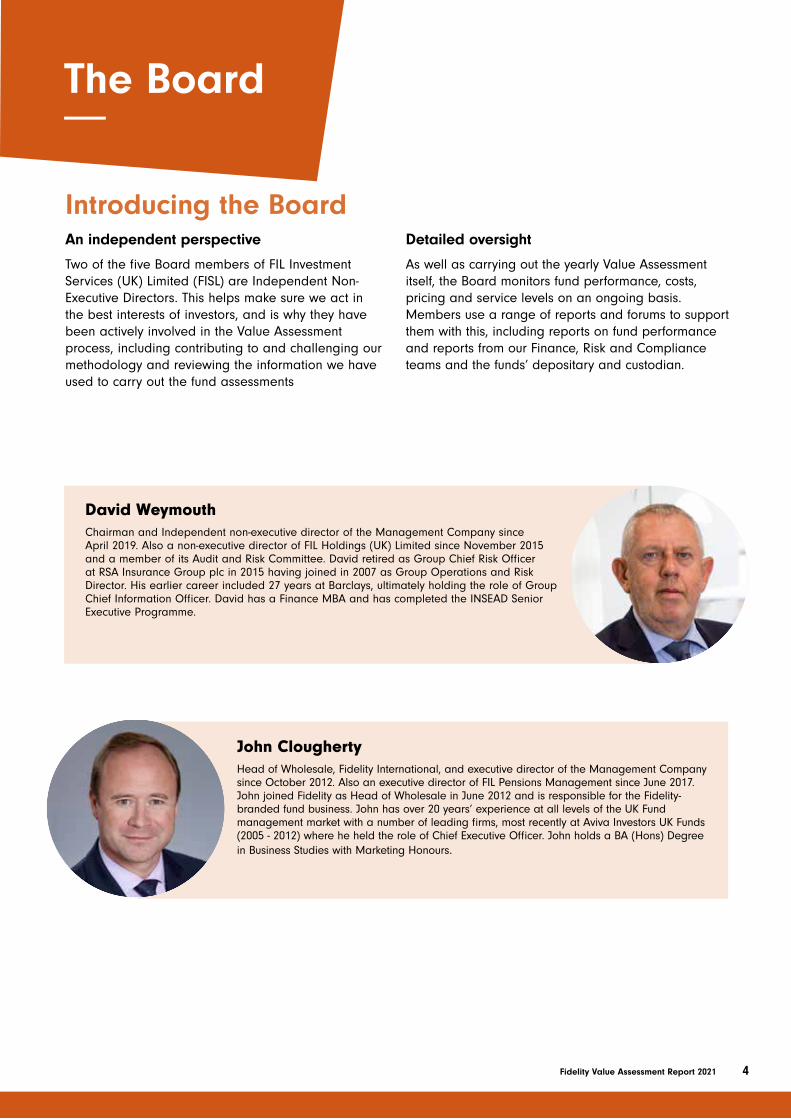
Introducing the BoardAn independent perspective
Two of the five Board members of FIL Investment Services (UK) Limited (FISL) are Independent Non-Executive Directors. This helps make sure we act in the best interests of investors, and is why they have been actively involved in the Value Assessment process, including contributing to and challenging our methodology and reviewing the information we have used to carry out the fund assessments
Detailed oversight
As well as carrying out the yearly Value Assessment itself, the Board monitors fund performance, costs, pricing and service levels on an ongoing basis. Members use a range of reports and forums to support them with this, including reports on fund performance and reports from our Finance, Risk and Compliance teams and the funds’ depositary and custodian.
John CloughertyHead of Wholesale, Fidelity International, and executive director of the Management Company since October 2012. Also an executive director of FIL Pensions Management since June 2017. John joined Fidelity as Head of Wholesale in June 2012 and is responsible for the Fidelity-branded fund business. John has over 20 years’ experience at all levels of the UK Fund management market with a number of leading firms, most recently at Aviva Investors UK Funds (2005 - 2012) where he held the role of Chief Executive Officer. John holds a BA (Hons) Degree in Business Studies with Marketing Honours.
David WeymouthChairman and Independent non-executive director of the Management Company since April 2019. Also a non-executive director of FIL Holdings (UK) Limited since November 2015 and a member of its Audit and Risk Committee. David retired as Group Chief Risk Officer at RSA Insurance Group plc in 2015 having joined in 2007 as Group Operations and Risk Director. His earlier career included 27 years at Barclays, ultimately holding the role of Group Chief Information Officer. David has a Finance MBA and has completed the INSEAD Senior Executive Programme.
4Fidelity Value Assessment Report 2021

The Board
Introducing the Board
Malcolm PalmerChief Operating Officer, Investment Solutions and Services (“ISS”), and executive director of the Management Company since February 2021. Also an executive director of FIL Pensions Management, FIL Investment Advisors (UK) Limited and FIL Investments International. Malcolm joined Fidelity in July 2020 and is responsible for the operational and change activities of ISS supporting FIL’s investment and distribution businesses. Malcolm trained as an economist but has spent the majority of his career in Operations, Change Management and Client Delivery, with previous roles including Global Head of Securities Operations at Northern Trust and Managing Director at JP Morgan. Malcolm holds a Bachelor’s Honours degree in Economics.
Peter BrookmanHead of UK Fund Accounting and executive director of the Management Company since December 2020. Peter joined Fidelity in April 2020 and is responsible for operations in terms of global cash and reconciliations and fund accounting in the UK. Peter has over 30 years’ experience in fund administration, with previous roles including Global Fund Services UK COO at Northern Trust, and Head of UK Collective Funds Accounting at BNP Paribas Fund Services. His experience includes strategic leadership, client servicing, product development, operations, investment processing, transfer agency and fund accounting. Peter is an Associate Member of the Chartered Institute for Securities & Investment where he sits as a panel member for syllabus and question bank reviews.
Dr Teresa Robson-CappsIndependent non-executive director of the Management Company since March 2019. Also a non-executive director of FIL Holdings (UK) Limited since April 2018 and a member of its Audit and Risk Committee. Teresa’s career has spanned several industries including banking, insurance, retail, communications and professional services, in roles ranging from customer services to strategic business leadership. Latterly, Teresa’s roles included HSBC (2006 - 2011) where she became Deputy Head of Direct Bank and First Direct, and Accenture (2003 - 2006) where she was an Associate Partner in Transformational Outsourcing. Teresa has a doctorate in Management Control and Accounting, and is a Chartered Management Accountant.
5 Fidelity Value Assessment Report 2021
Message from the Chair
At Fidelity International, the needs of our customers have always steered our decisions, which is why I am very pleased to present our second annual Value Assessment report.
As the Chair of the Board, I am responsible for ensuring that Fidelity’s funds are not only meeting their investment objectives but also providing good value for money to our investors. In order to help you assess the value our funds offer, we have measured our performance against the seven key criteria set out last year by the UK’s financial regulator, the Financial Conduct Authority (FCA). This year, we have made several improvements to the report to ensure that you are more informed than ever about whether our charges are justified in the context of the overall service we deliver to you.
How we deliver value for clients
We take the entire concept of providing value for money very seriously and firmly at our core is the belief that every penny of the money invested with us is to help people and their families to achieve their goals.
When we assess value, we look at the costs and charges relating to the entire customer experience and range of services that we provide for our clients. For all funds covered in this assessment, the Board is committed to:
• Delivering a quality and range of services which meets the high expectations of our clients, while maintaining competitive fees.
• Fully deploying Fidelity’s investment management expertise, processes and technology to deliver fund performance which is consistent with the fund’s objectives and benchmarks.
A Word on the ongoing Covid-19 situation
This report assesses funds as at 30 June 2021. The on-going Covid-19 situation is still affecting the lives of everyone in the country. We appreciate that it remains an uncertain time for investors and therefore want to reassure you that, at Fidelity, our clients and their investments remain at the forefront of any decisions we have made.
Despite the challenges of the past 18 months, neither the investment management nor administration of your funds have been affected, and our operational and client servicing activities continue to function effectively.
We have a comprehensive Business Continuity Programme in place, which supports remote working and provides hardware, applications and network support to allow this. Our Portfolio Managers and supporting investment functions (trading, portfolio monitoring, compliance) are fully set up to work at home with full visibility of the portfolios and portfolio management systems.
Further to the market turbulence of 2020, the good news is that equity markets have recovered strongly over the past year. Our global investment research network, acclaimed portfolio management expertise and strong risk management, means that our funds have been able to benefit from this recovery without exposing your portfolios to excessive risk-taking.
6Fidelity Value Assessment Report 2021
Message from the Chair continued
How We Deliver Value for Clients
When you invest in our funds, you are investing in the very nature of Fidelity itself as both a brand, investment manager and trusted partner.
We seek to provide world-class investment solutions across a broad range of asset classes, including fundamental active, index and factor-based equities, fixed income, multi asset strategies and bespoke investment solutions.
As investors into our funds, either directly or through an intermediary, you benefit from a world-class global infrastructure that includes well-resourced investment teams and well-tested risk management and governance processes - we are the safe custodians of your investments.
We have simple and transparent share class structures and fee models. Alongside educational materials and a wealth of other investor information, fund manager insights and factual information, we hope this allows you to make informed choices on the best investment for you and your needs.
Our commitment to sustainable investing
Every investment decision has potential long-term financial and societal consequences. Fidelity’s size and scale provides a level of corporate access that very few of our peers enjoy and we are committed to using our position to steer companies towards the right business decisions. Environmental, Social and Governance (ESG) factors, particularly employee welfare, will become increasingly important to ensure the long-term resilience of businesses. We have been a signatory to the Principles for Responsible Investment (PRI) since 2012 and are proud of our ratings - in 2020 we scored A+ in all the categories assessed by PRI. Our ESG strategy forms a central pillar of our research and investment processes to ensure we are investing both for you and generations to come.
7 Fidelity Value Assessment Report 2021
Our Purpose and Values
Message from the Chair continued
WE BELIEVE THAT INVESTING IS THE KEY TO WEALTH CREATION AND SECURING A BETTER FINANCIAL FUTURE: especially with governments around the globe retrenching fiscally and people having to become more self-sufficient to provide for their future financial security.
WE ACT WITH INTEGRITY: Our clients expect us to apply responsible and sensible stewardship standards when we invest for them. We behave ethically, with fairness and equality. And we recognise that, as a responsible allocator of capital, asset management companies like ourselves play a key role in sustainable economic growth and job creation.
CLIENTS ARE AT THE HEART OF OUR BUSINESS: Investing clients’ money is why we exist. Our purpose is to provide choices and optimal financial outcomes to clients, whether they are individuals, employers, financial advisers or institutions.
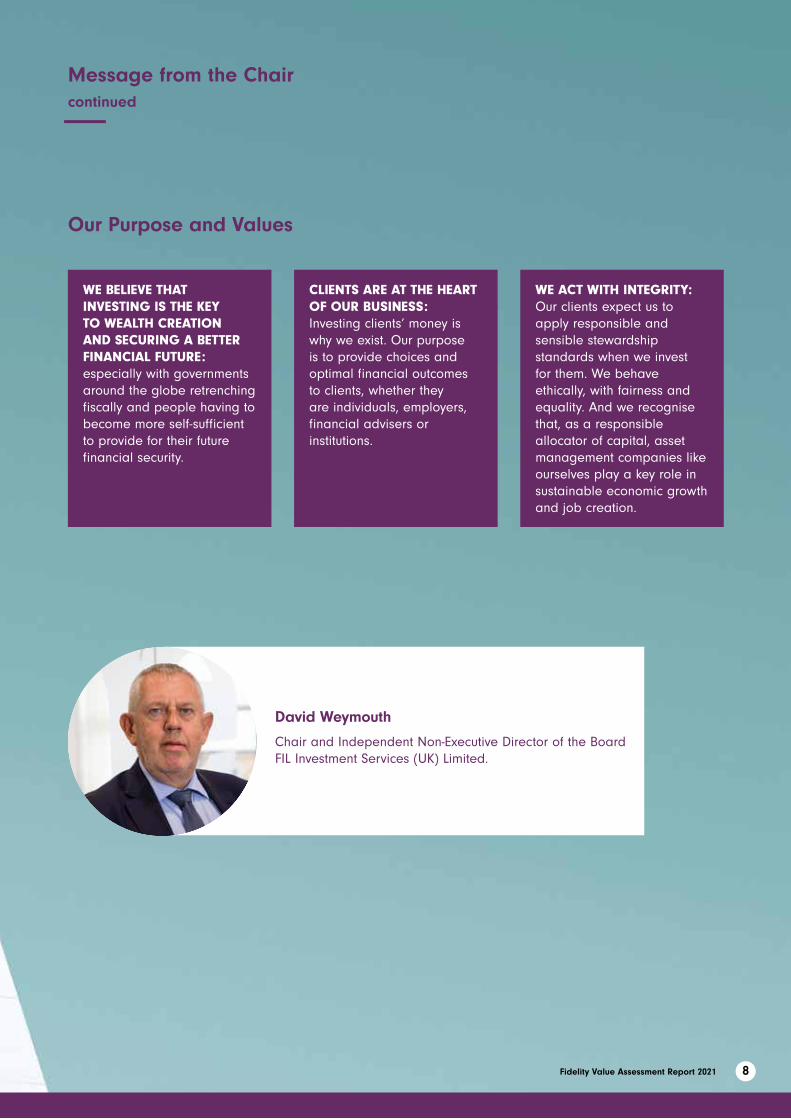
David Weymouth
Chair and Independent Non-Executive Director of the Board FIL Investment Services (UK) Limited.
8Fidelity Value Assessment Report 2021
Quality of service
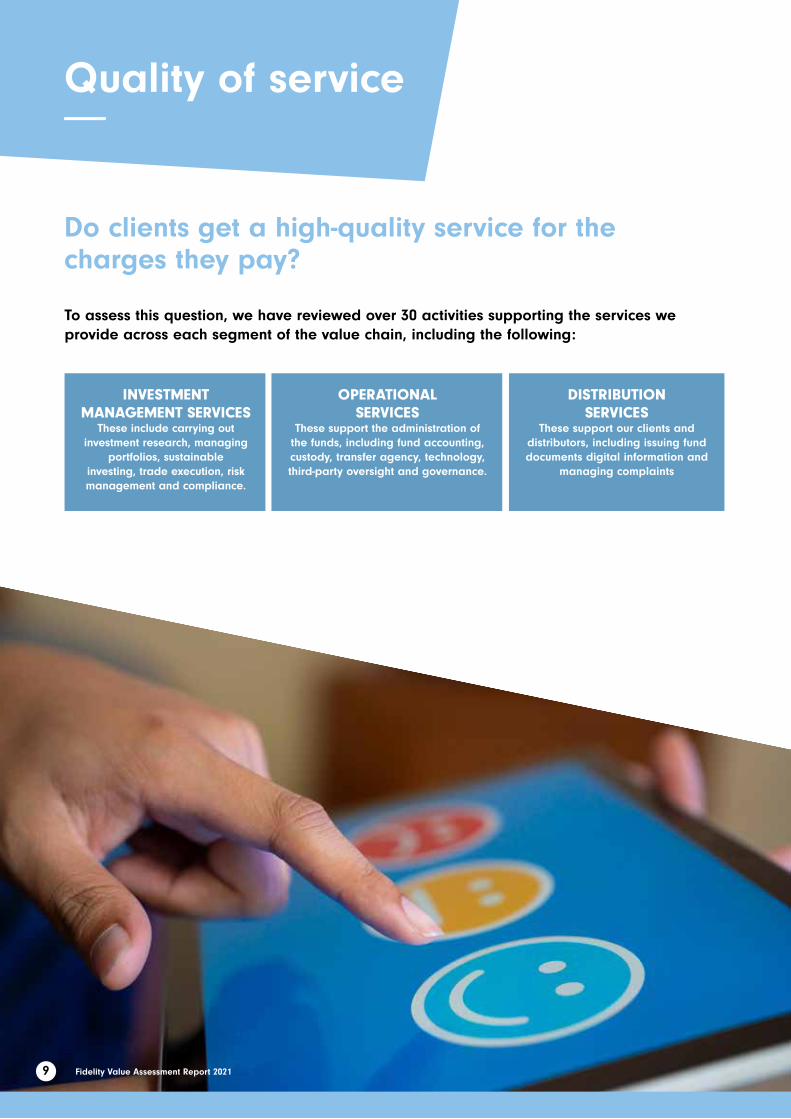
Do clients get a high-quality service for the charges they pay?
To assess this question, we have reviewed over 30 activities supporting the services we provide across each segment of the value chain, including the following:
OPERATIONAL SERVICES
These support the administration of the funds, including fund accounting, custody, transfer agency, technology, third-party oversight and governance.
INVESTMENT MANAGEMENT SERVICES
These include carrying out investment research, managing
portfolios, sustainable investing, trade execution, risk management and compliance.
DISTRIBUTION SERVICES
These support our clients and distributors, including issuing fund documents digital information and
managing complaints
9 Fidelity Value Assessment Report 2021
Where we will do more.
We aim to develop and improve services and respond to ever-changing market and client expectations.
We will continue to monitor the quality and range of services it offers and consult our network of distributors on where services can be improved.
In summary
Overall, the quality and range of services provide significant value across all stages of the customer journey.
Operational services
Investors enjoy a seamless experience when investing in our funds as transfer agency and fund accounting processes are managed in-house, unlike those of many other fund managers. This means we have more control over the way these services are managed, so we can make sure they are more efficient and resilient.
We also have dedicated teams and policies for overseeing services provided by third parties, such as the funds’ custodian, information providers and technology companies, so they provide a high level of service at a competitive cost.
Distribution services
We believe fund information should always be clear and easy to access, and we work hard to make sure you understand what you are buying, what the fund should be doing and what services you should receive for the fees paid.
We also have a range of services to educate and inform distributors, so we can provide a better service for investors. In industry surveys, our distribution services rank highly among our competitors, including website services and client engagement.
How did we do?
Investment ManagementOur investors benefit from the management company’s investment management expertise and its global infrastructure and scale.
Our portfolio management and research professionals have the advantage of our global reach and local positioning. The team of trading specialists provide valuable insights into the markets and we operate within established risk management and governance practices.
We believe that investing in companies with high standards of corporate responsibility can help protect and increase investment returns for our clients. As part of our commitment to integrating Environmental, social and governance (ESG) considerations in our investment process, we have continued to build out both a range of sustainable funds based on an engagement and exclusion model and we use a proprietary ESG scoring system which is based on fundamental research and a structured and thematic approach to engagement with companies we invest in. We have been a signatory to the Principles for Responsible Investment (PRI) since 2012 and have been awarded A+ in all the categories assessed by PRI for the last four years.
In the UK, after winning the prestigious Investment Week Fund Manager of the Year Award – Global Group of the Year 2020. We were again listed as a finalist in the same award in 2021. We have also received numerous awards in individual areas, including: Investment Week Fund Manager of the Year Awards 2021 - Asia Pacific ex Japan for the Fidelity Asia Pacific Opportunities Fund, Investment Week Fund Manager of the Year Awards 2021 - Global Income, for the Fidelity Global Dividend Fund.
10Fidelity Value Assessment Report 2021
Performance
Are funds achieving their performance objectives?
The Assessment looked at how the funds are performing. We looked at each fund‘s returns after charges to see if they are consistent with its objective, policy and strategy – as well as comparing them with its benchmark or a target objective if it has one. Normally, we do this over one, three and five years, but different time periods may apply based on a fund’s objective or if it is less than five years old.We also looked at how the funds performed compared with similar funds in their Investment Association (IA) sectors.
Where we will do more.
In the rare cases where we have found sustained underperformance to be an issue, the Board and relevant heads of investment and portfolio managers have looked closely at the funds and identified actions we need to take.
In summary
We are delivering competitive fund returns for clients on a wide range of investment solutions. You can be confident that we are managing your funds to deliver the outcomes you expect..
How did we do?
The funds performed well compared with those of our competitors. Across our range, 60% of actively managed funds were ahead of the median performance of similar companies in their IA sectors (where they have one) over the recommended holding period. And 78% of the active funds outperformed their benchmark or target over the same period.
We have reviewed each case where funds underperformed their benchmark and are confident the investment team has sound investment convictions and robust investment processes.
Where we have found funds are not performing as well as we would expect, we have taken action as described in the Fund Pages of this report. Additionally, where a fund has performed exceptionally well against its benchmark, we have examined the reasons for this as well to ensure that the fund is not taking excessive risk in search of the strong performance.
The figures above do not include funds which have not existed for the full term of their recommended holding period. We provide Information on the performance to date for these funds in the fund pages of this report (if the information is available).
11 Fidelity Value Assessment Report 2021
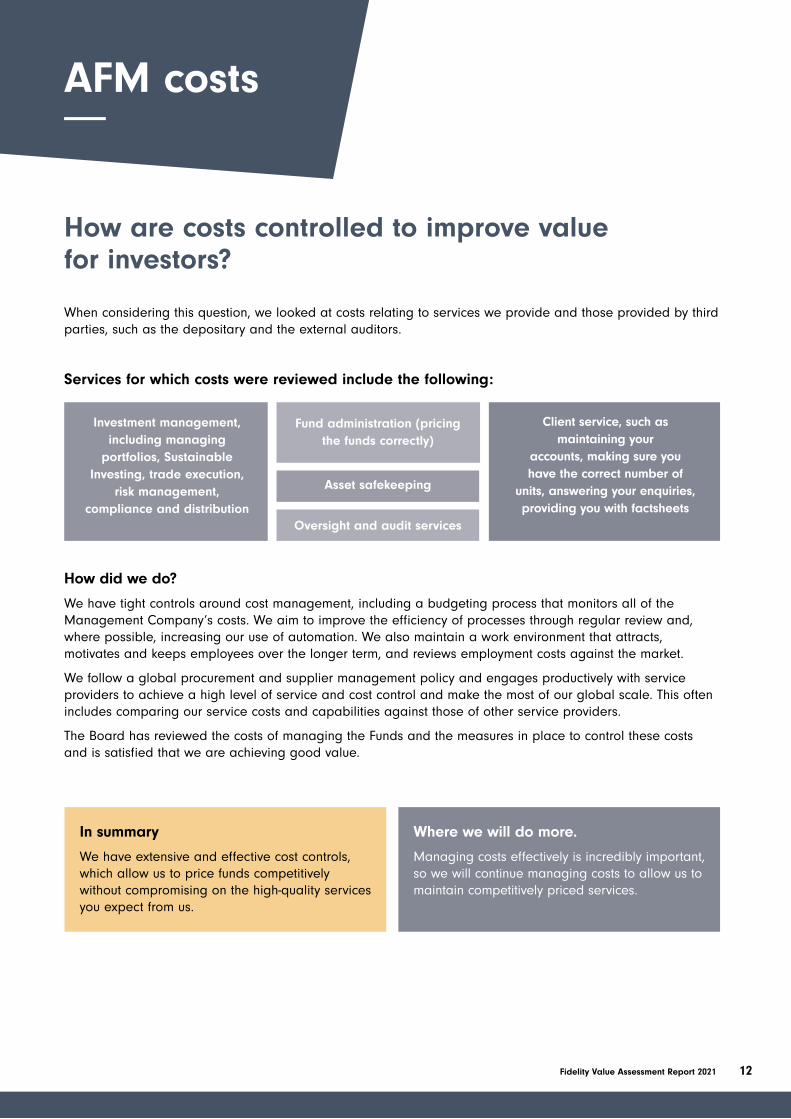
How are costs controlled to improve value for investors?
Services for which costs were reviewed include the following:
In summary
We have extensive and effective cost controls, which allow us to price funds competitively without compromising on the high-quality services you expect from us.
Where we will do more.
Managing costs effectively is incredibly important, so we will continue managing costs to allow us to maintain competitively priced services.
AFM costs
Oversight and audit services
Fund administration (pricing the funds correctly)
Client service, such as maintaining your
accounts, making sure you have the correct number of
units, answering your enquiries, providing you with factsheets
Investment management, including managing
portfolios, Sustainable Investing, trade execution,
risk management, compliance and distribution
Asset safekeeping
How did we do?
We have tight controls around cost management, including a budgeting process that monitors all of the Management Company’s costs. We aim to improve the efficiency of processes through regular review and, where possible, increasing our use of automation. We also maintain a work environment that attracts, motivates and keeps employees over the longer term, and reviews employment costs against the market.
We follow a global procurement and supplier management policy and engages productively with service providers to achieve a high level of service and cost control and make the most of our global scale. This often includes comparing our service costs and capabilities against those of other service providers.
The Board has reviewed the costs of managing the Funds and the measures in place to control these costs and is satisfied that we are achieving good value.
When considering this question, we looked at costs relating to services we provide and those provided by third parties, such as the depositary and the external auditors.
12Fidelity Value Assessment Report 2021
Economies of scale
Do the funds provide economies of scale?
We reviewed the range of services and considered how costs change with the size of the fund. We also looked at how the assets managed by the Management Company have grown over time and considered where investors benefit from the ‘buying power’ we have as a large-scale firm.
Finally, we considered how the Management Company is able to provide a better service as a result of being part of Fidelity International, a global investment group.
How did we do?
Over the past five years, during a time when most funds have grown in size, fees on the majority of our funds have reduced.
Our global scale and buying power allows our pricing to be competitive. Across all our Open-Ended Investment Companies (OEICs), on average the funds are priced lower than other funds in their sector as has been shown by our regular fee reviews against competitors.
Being part of a large global investment group means that as well as the funds benefitting from the better rates we negotiate with our service providers, the portfolio managers are supported by our investment in robust global infrastructure and research.
The Investment Management Charge is the largest component of the Ongoing Charges Figure (OCF) and for most share classes, these fees are applied as a fixed percentage of the assets in the share class.
You benefit from economies of scale in relation to other charges included in the OCF, but these can be relatively small benefits. For example, audit fees and custody fees become proportionately smaller as the size of a fund increases.
Where we will do more.
We will continue to review fees, services and costs, as the size of the funds and the Management Company changes, so you can benefit from the savings and breadth of resources that are generated by the scale of our business.
In summary
The Management Company and the majority of individual funds have achieved Partial Economies of Scale. You have benefitted from more competitive fees and improvements in the quality and range of services offered
13 Fidelity Value Assessment Report 2021

Comparable market rates
How do the fees compare with competitors?
Where we will do more.
We will continue be very active in reviewing our pricing against that of our competitors based on the level of services provided. Where funds are higher than the median price of their respective sectors, they have been further examined, taking into account the costs of running the funds, the range and quality of services and their investment objectives and performance.
How did we do?
On average, Fidelity’s funds are priced lower than the average of peers in their sectors. Each fund’s charges are reviewed in the respective Fund Pages later in this Report.
To review our fees against those of our competitors, we compared the Ongoing Charges Figure (OCF), as this is a consistent measure set by the Regulator and is the figure used in our factsheets and Key Investor Information Documents (KIIDs). The OCF includes the following components:
• The Registrar Fee which relates to maintaining the shareholder register and acting as the transfer agent. It is a fixed percentage of the assets in a share class.
• The Service Fee which covers administration services, such as fund accounting and auditing.
• The Investment Management Charge which covers the cost of providing services such as managing portfolios, research, trade execution and related operational and risk services.
We looked at all our actively managed funds and compared our OCFs with the OCFs of other actively managed funds in the same IA Sector. If the fund was not represented in an IA sector, we used the Morningstar equivalent, where possiblet. We used the equivalent approach for index (also known as passive) funds. So, both active and index funds are compared against those of our competitors on a like-for-like basis.
We recognise that cost should not be considered in isolation but should be reviewed alongside the services and performance objectives of the funds (which are assessed after fees have been taken out).
In summary
Across all our OEICs, 67% of funds are priced the same or lower than the average price of similar funds in their sectors (where they have one). Other funds are close to the sector median pricing or provide particular benefits and extra value for investors.
14Fidelity Value Assessment Report 2021
Comparable services
How do charges compare with those on similar Fidelity funds or mandates?We think it is essential that we act in the best interests of all investors without unfairly benefitting one investor type to the detriment of another. We compared fund pricing between similar Fidelity funds domiciled in the UK and similar non-UK funds. We also compared funds against comparable investment mandates we manage for institutional clients (“segregated mandates”).
In summary
We offer funds that are priced both competitively and fairly. There is strong governance over pricing to make sure all our clients are charged consistently for similar services.
Where we will do more
If we find inconsistencies in fees, we will carry out a pricing review on the affected funds.
How did we do?
We follow a global pricing policy and governance process when setting fees for funds and segregated mandates. This approach aims to make sure clients are treated fairly and fees for similar services are consistent for all our clients.
The Value Assessment confirmed that, where we provide similar services to other funds and clients, these services are comparably priced. In short, the fee levels are consistent and provide good value for money.
15 Fidelity Value Assessment Report 2021

Classes of units
Are there cheaper share classes available than the one you are in?To consider this question, we reviewed the share classes we offer within our funds. Each has specific eligibility criteria and minimum investment amounts, so the benefits you receive are matched to your needs.
Where we will do more
We will continue working hard to make sure you are paying the most suitable rates for you. We will give you regular updates on how best to achieve this. We would also urge you to contact your financial intermediary or your usual Fidelity contact if you believe that there may be a more suitable share class available to you.
In summary
For years we have been working hard to make sure that clients are in the cheapest class available to them and that the available share classes remain suitable for clients and represent good value for money.
How did we do?
Fidelity has demonstrated its commitment to ensuring you are in the right share class for the services you receive and to maintaining a straightforward share class offering across the fund range.
16Fidelity Value Assessment Report 2021
Glossary
Absolute returnAbsolute return is the return that a Fund or asset achieves over a specified period. Absolute return differs from relative return (the return compared to the benchmark) because it is concerned with the return of a particular asset and does not compare it with the return against the benchmark.
Active fundSee ‘Active management’.
Active managementActive management is when a manager uses analytical research, forecasts and their own judgement and experience to make investment decisions to achieve a specific result.
Annualised returnUnless we tell you otherwise, annualised returns in this Report are calculated “arithmetically“ and do not consider the effect of compounding returns. In certain cases, where stated, a “geometrically“ calculated annualised return may be shown, which takes compounding into account.
Asset classAn asset class is a group of investments with similar characteristics (such as equities), which are governed by similar or the same laws and regulations.
Assets under management (AUM)The total value of investments held within a portfolio.
Authorised Fund Manager (AFM)The Authorised Fund Manager is responsible for the overall management of the Fund. The AFM must act in the best interests of the client and make sure the Scheme is run well.
Basis points (BPS)Basis points are a way of expressing the fractions of a percentage as a whole number. For example, 0.25% is 25 basis points (25bps) and 1.0% is 100 basis points (100 bps).
BenchmarkA suitable reference, such as a market index, that can be used to measure the performance of a fund or the risks relating to it.
BoardThe Board of FIL Investment Services (UK) Limited.
Chief Investment Officer (CIO)Chief Investment Officer is the most senior person on Fidelity’s equity and fixed income investment teams and is responsible for overseeing how we manage portfolios. The CIO is involved in regular reviews of investment strategies,
including performance and risk. For the Solutions and Multi Asset funds, given the team’s broader investment universe and remit, this function is carried out by the Global Head of Solutions and Multi Asset, supported by Heads of Multi Asset Investment Management in Europe and Asia respectively. To keep things simple, in this document, we refer to, the head of the CIO function for an asset class is the CIO for the asset class.
CreditThe credit market refers to the market through which companies and governments issue debt securities to investors, such as investment-grade bonds and corporate bonds. Issuing debt securities is how governments and companies raise capital. A bond is a debt instrument where a company borrows money now while paying the lender (investor) interest (coupon) until they pay back the debt principal (the amount borrowed) at maturity
DomicileThe domicile is the country in which a fund is legally based. A fund’s domicile also determines the fund’s primary primary regulator. For UK-domiciled funds, this is the Financial Conduct Authority (FCA).
DrawdownsThis is the measure of the decline in performance of the Fund from the historical peak of performance.
Financial Conduct Authority (FCA) The Financial Conduct Authority is the UK’s Financial Regulator.
FundsFor the purpose of this document, the funds are those listed in the fund pages of this report, managed by FIL Investment Services (UK) Ltd.
Independent non-executive directors (INEDs)An independent non-executive director is an external director who is part of the Board but is not a member of the Management Company’s executive management team. INEDs are not employees of the Management Company or connected to it in any other way.
Investment AssociationThe Investment Association is the trade body and industry voice for UK investment managers.
Investment Association Sector (IA Sector)Funds are often categorised according to their Investment Association sector. This is a useful way to find and compare funds, for instance when comparing performance and fund charges of similar funds. Which sector a fund is placed in, mostly depends on the fund’s assets, such as equities and fixed income, but may also depend on the country it invests in.
17 Fidelity Value Assessment Report 2021
Key Investor Information Document (KIID)The Key Investor Information Document provides investors with important information about a fund, including details about the fund’s different share classes and the risks of investing in it.
Management CompanyThe Management Company is FIL Investment Services (UK) Limited, who is also the AFM of the funds.
Ongoing Charges Figure (OCF)The OCF represents the charges taken from a fund over a year. It is calculated at the end of the fund's financial year and may vary from year to year. For classes of funds with fixed ongoing charges, this may not vary from year to year. For new classes of funds or classes which are undergoing corporate actions (for example, changes to the annual management charge), the OCF is estimated until the criteria are met for an actual OCF to be published.
The types of charges included in the OCF are management fees, administration fees, custodian and depositary fees and transaction charges, shareholder reporting costs, regulatory registration fees, Directors fees (where these apply)and bank charges.
The OCF does not include: portfolio transaction costs, except in the case of an entry or exit charge paid by the fund when buying or selling units in another collective investment scheme.
The OCFs given in the fund pages of this Report relate to the lowest cost retail share class (where available) or otherwise to the share class that is available to the largest group of investors.
For more information about charges (including details of the fund's financial year end), please see the charges section in the most recent prospectus.
Open-Ended Investment Company (OEIC)Open-Ended Investment Companies are professionally managed collective investment schemes that pool your money with other investors’ money.
Overweight PositionsAn overweight portfolio holds a larger amount of a particular security (or holds a larger amount of a particular sector) when compared with the weight of that security (sector) held in the benchmark portfolio.
Passive fundA passive fund (also known as an index fund) is one that tries to copy the performance of an index.
Peer Group Quartile RankingThe peer group quartile ranking categorises similar funds into four equal bands based on their performance in specified criteria. The first quartile contains the top 25% of funds and the fourth quartile contains the bottom 25% of funds.
PercentileA percentile refers to each of the 100 equal groups into which a population can be divided. This report includes details on what percentile a fund’s OCF is compared with those of similar funds in its sector. For example, a percentile of 80 shows that a fund‘s OCF is lower than 80 percent of those similar funds in the sector.
Portfolio ManagerA portfolio manager is a person (or team) who is responsible for investing a fund’s assets in-line with the investment strategy.
Segregated mandateA segregated mandate is an investment portfolio that is managed on behalf of an institutional investor.
Share classShare classes are different categories of shares in the same fund. They share the same investment objective and policies, but the fees and investment minimums may be different, and they may be restricted to particular types of investor, such as institutions.
Short Dated Sterling CreditBonds with a short period left to repayment. Generally five years or less
Underweight PortfolioAn underweight portfolio holds a smaller value of a particular security (or holds a smaller value of aparticular sector) when compared with the weight of that security (sector) held in the benchmark portfolio.
Value InvestingValue investing is an investment strategy that involves picking stocks that appear to be trading for less than their true or reasonable value. Value investors actively research stocks they think the stock market is underestimating in terms of their future potential and so should have a price that is higher than the price they are currently trading at.
YieldThe income from an investment, usually stated as a percentage of the value of the investment.
18Fidelity Value Assessment Report 2021
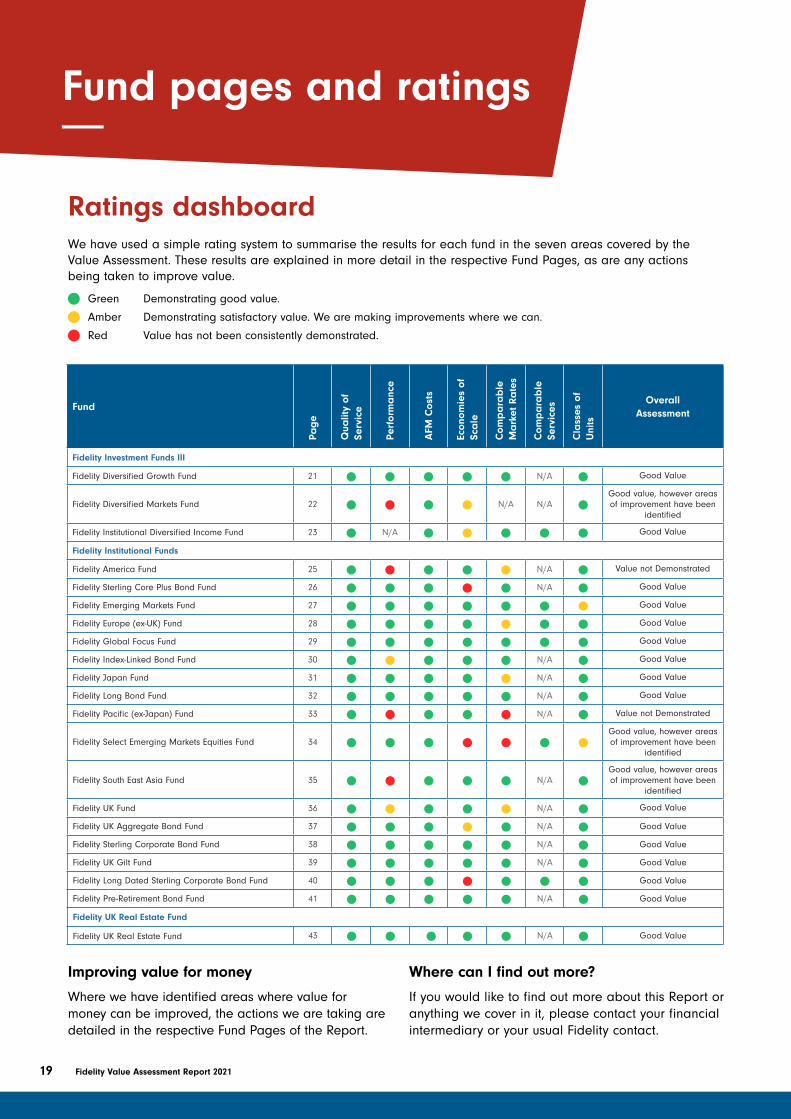
Improving value for money
Where we have identified areas where value for money can be improved, the actions we are taking are detailed in the respective Fund Pages of the Report.
Where can I find out more?
If you would like to find out more about this Report or anything we cover in it, please contact your financial intermediary or your usual Fidelity contact.
Ratings dashboardWe have used a simple rating system to summarise the results for each fund in the seven areas covered by the Value Assessment. These results are explained in more detail in the respective Fund Pages, as are any actions being taken to improve value.
n Green Demonstrating good value.
nAmber Demonstrating satisfactory value. We are making improvements where we can.
nRed Value has not been consistently demonstrated.
Fund
Page
Qua
lity
of
Serv
ice
Perf
orm
anc
e
AFM
Cos
ts
Econ
omie
s of
Sc
ale
Com
pa
rab
le
Ma
rket
Ra
tes
Com
pa
rab
le
Serv
ices
Cla
sses
of
Uni
ts
Overall Assessment
Fidelity Investment Funds III
Fidelity Diversified Growth Fund 21 n n n n n N/A n Good Value
Fidelity Diversified Markets Fund 22 n n n n N/A N/A nGood value, however areas of improvement have been
identified
Fidelity Institutional Diversified Income Fund 23 n N/A n n n n n Good Value
Fidelity Institutional Funds
Fidelity America Fund 25 n n n n n N/A n Value not Demonstrated
Fidelity Sterling Core Plus Bond Fund 26 n n n n n N/A n Good Value
Fidelity Emerging Markets Fund 27 n n n n n n n Good Value
Fidelity Europe (ex-UK) Fund 28 n n n n n n n Good Value
Fidelity Global Focus Fund 29 n n n n n n n Good Value
Fidelity Index-Linked Bond Fund 30 n n n n n N/A n Good Value
Fidelity Japan Fund 31 n n n n n N/A n Good Value
Fidelity Long Bond Fund 32 n n n n n N/A n Good Value
Fidelity Pacific (ex-Japan) Fund 33 n n n n n N/A n Value not Demonstrated
Fidelity Select Emerging Markets Equities Fund 34 n n n n n n nGood value, however areas of improvement have been
identified
Fidelity South East Asia Fund 35 n n n n n N/A nGood value, however areas of improvement have been
identified
Fidelity UK Fund 36 n n n n n N/A n Good Value
Fidelity UK Aggregate Bond Fund 37 n n n n n N/A n Good Value
Fidelity Sterling Corporate Bond Fund 38 n n n n n N/A n Good Value
Fidelity UK Gilt Fund 39 n n n n n N/A n Good Value
Fidelity Long Dated Sterling Corporate Bond Fund 40 n n n n n n n Good Value
Fidelity Pre-Retirement Bond Fund 41 n n n n n N/A n Good Value
Fidelity UK Real Estate Fund
Fidelity UK Real Estate Fund 43 n n n n n N/A n Good Value
Fund pages and ratings
19 Fidelity Value Assessment Report 2021
20Fidelity Value Assessment Report 2021
Fidelity Investment Funds III
21 Fidelity Value Assessment Report 2021
Fidelity Diversified Growth Fund
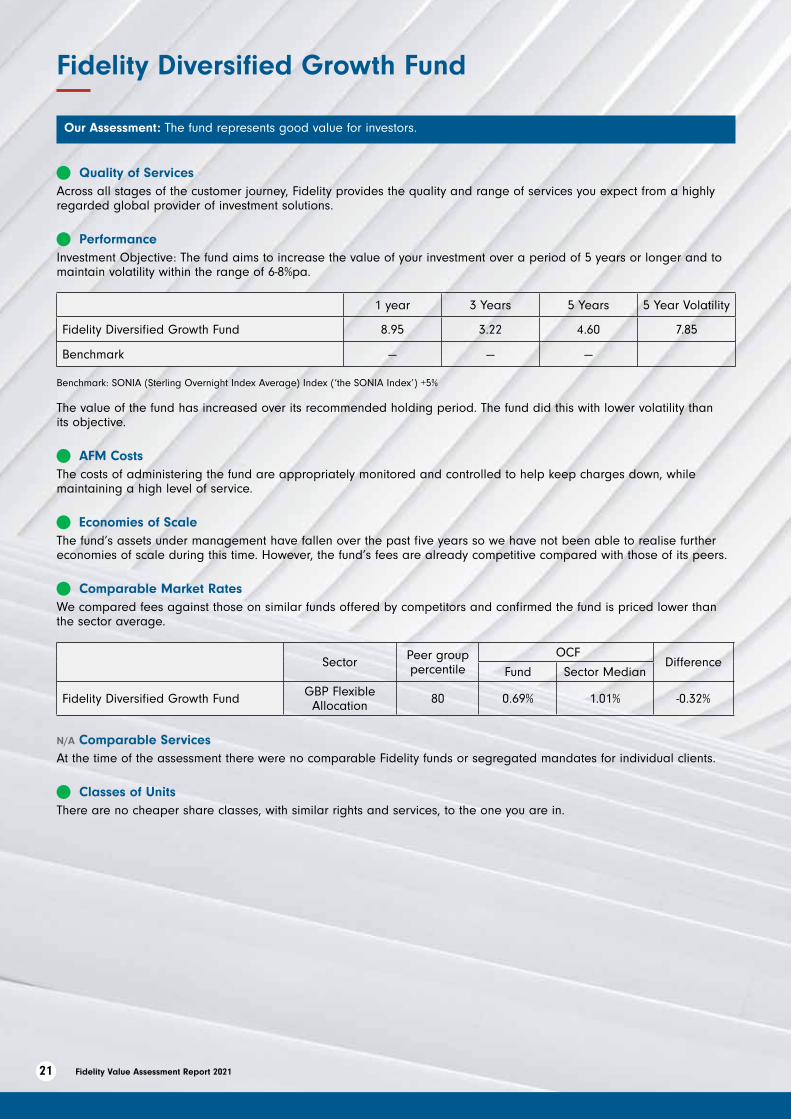
Our Assessment: The fund represents good value for investors.
n Quality of Services Across all stages of the customer journey, Fidelity provides the quality and range of services you expect from a highly regarded global provider of investment solutions.
n PerformanceInvestment Objective: The fund aims to increase the value of your investment over a period of 5 years or longer and to maintain volatility within the range of 6-8%pa.
1 year 3 Years 5 Years 5 Year Volatility
Fidelity Diversified Growth Fund 8.95 3.22 4.60 7.85
Benchmark --- --- ---
Benchmark: SONIA (Sterling Overnight Index Average) Index (‘the SONIA Index’) +5%
The value of the fund has increased over its recommended holding period. The fund did this with lower volatility than its objective.
n AFM Costs The costs of administering the fund are appropriately monitored and controlled to help keep charges down, while maintaining a high level of service.
n Economies of ScaleThe fund’s assets under management have fallen over the past five years so we have not been able to realise further economies of scale during this time. However, the fund’s fees are already competitive compared with those of its peers.
n Comparable Market RatesWe compared fees against those on similar funds offered by competitors and confirmed the fund is priced lower than the sector average.
Sector Peer group percentile
OCF Difference
Fund Sector Median
Fidelity Diversified Growth Fund GBP Flexible Allocation 80 0.69% 1.01% -0.32%
N/A Comparable ServicesAt the time of the assessment there were no comparable Fidelity funds or segregated mandates for individual clients.
n Classes of UnitsThere are no cheaper share classes, with similar rights and services, to the one you are in.

22Fidelity Value Assessment Report 2021 Fidelity Value Assessment Report 2021
Fidelity Diversified Markets Fund
Our Assessment: The fund represents good value for investors. However, areas of improvement have been identified.
n Quality of Services Across all stages of the customer journey, Fidelity provides the quality and range of services you expect from a highly regarded global provider of investment solutions.
n PerformanceInvestment Objective: The fund aims to increase the value of your investment over a period of 5 years or longer and to maintain volatility within the range of 6-8%pa.
1 year 3 Years 5 Years 5 Year Volatility
Fidelity Diversified Markets Fund 9.08 3.12 4.72 8.14
Benchmark 3.05 3.42 3.37
Benchmark: SONIA (Sterling Overnight Index Average) Index (‘the SONIA Index’) +3%
The fund’s volatility has been higher than its annualised target but this is a result of increased market volatility caused by the pandemic related market correction. Until the market correction, the Fund’s volatility was significantly lower than the upper band of the objective. We remain confident in the investment strategy and the Portfolio Manager‘s investment convictions.
n AFM Costs The costs of administering the fund are appropriately monitored and controlled to help keep charges down, while maintaining a high level of service.
n Economies of ScaleWe have not been able to realise Economies of Scale over this period.
N/A Comparable Market RatesThis fund is not categorised within an IA Sector or a Morningstar peer group, so we are unable to make a fee comparison.
N/A Comparable ServicesAt the time of the assessment there were no comparable Fidelity funds or segregated mandates for individual clients.
n Classes of UnitsThere are no cheaper share classes, with similar rights and services, to the one you are in.
23 Fidelity Value Assessment Report 2021
Fidelity Institutional Diversified Income Fund
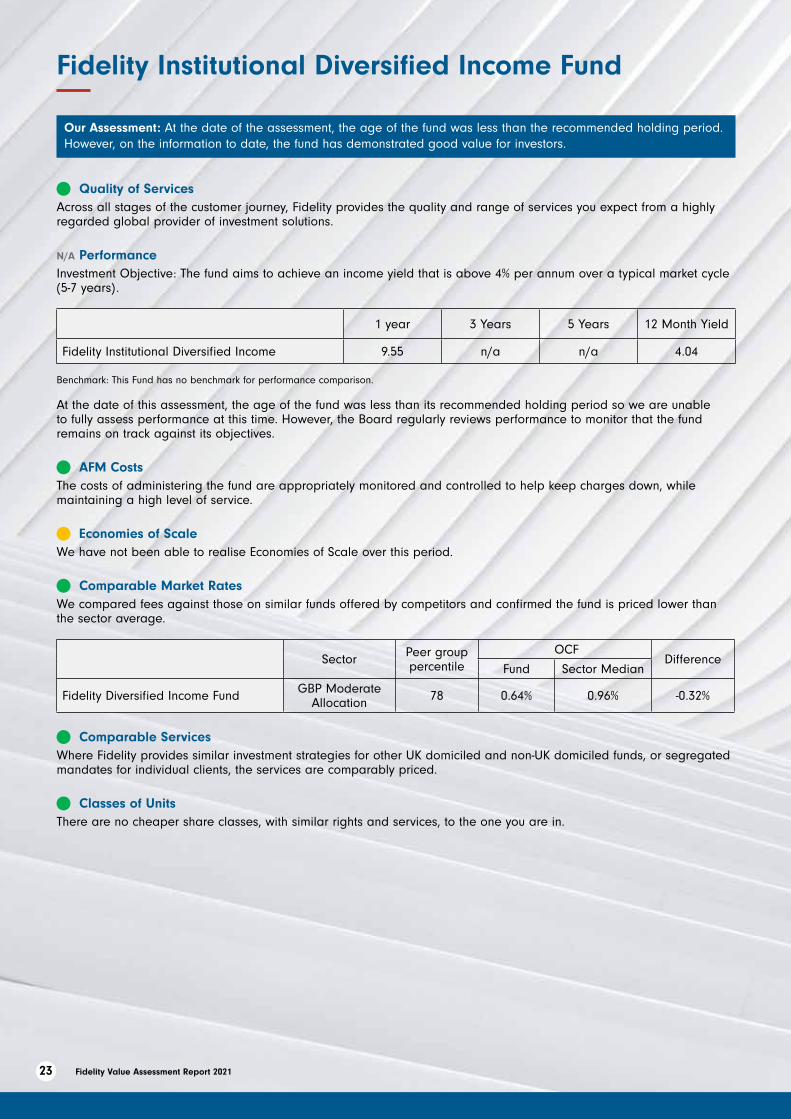
Our Assessment: At the date of the assessment, the age of the fund was less than the recommended holding period. However, on the information to date, the fund has demonstrated good value for investors.
n Quality of Services Across all stages of the customer journey, Fidelity provides the quality and range of services you expect from a highly regarded global provider of investment solutions.
N/A PerformanceInvestment Objective: The fund aims to achieve an income yield that is above 4% per annum over a typical market cycle (5-7 years).
1 year 3 Years 5 Years 12 Month Yield
Fidelity Institutional Diversified Income 9.55 n/a n/a 4.04
Benchmark: This Fund has no benchmark for performance comparison.
At the date of this assessment, the age of the fund was less than its recommended holding period so we are unable to fully assess performance at this time. However, the Board regularly reviews performance to monitor that the fund remains on track against its objectives.
n AFM Costs The costs of administering the fund are appropriately monitored and controlled to help keep charges down, while maintaining a high level of service.
n Economies of ScaleWe have not been able to realise Economies of Scale over this period.
n Comparable Market RatesWe compared fees against those on similar funds offered by competitors and confirmed the fund is priced lower than the sector average.
Sector Peer group percentile
OCF Difference
Fund Sector Median
Fidelity Diversified Income Fund GBP Moderate Allocation 78 0.64% 0.96% -0.32%
n Comparable ServicesWhere Fidelity provides similar investment strategies for other UK domiciled and non-UK domiciled funds, or segregated mandates for individual clients, the services are comparably priced.
n Classes of UnitsThere are no cheaper share classes, with similar rights and services, to the one you are in.

24Fidelity Value Assessment Report 2021Fidelity Value Assessment Report 2021
Fidelity Institutional Funds
25 Fidelity Value Assessment Report 2021
Fidelity America Fund
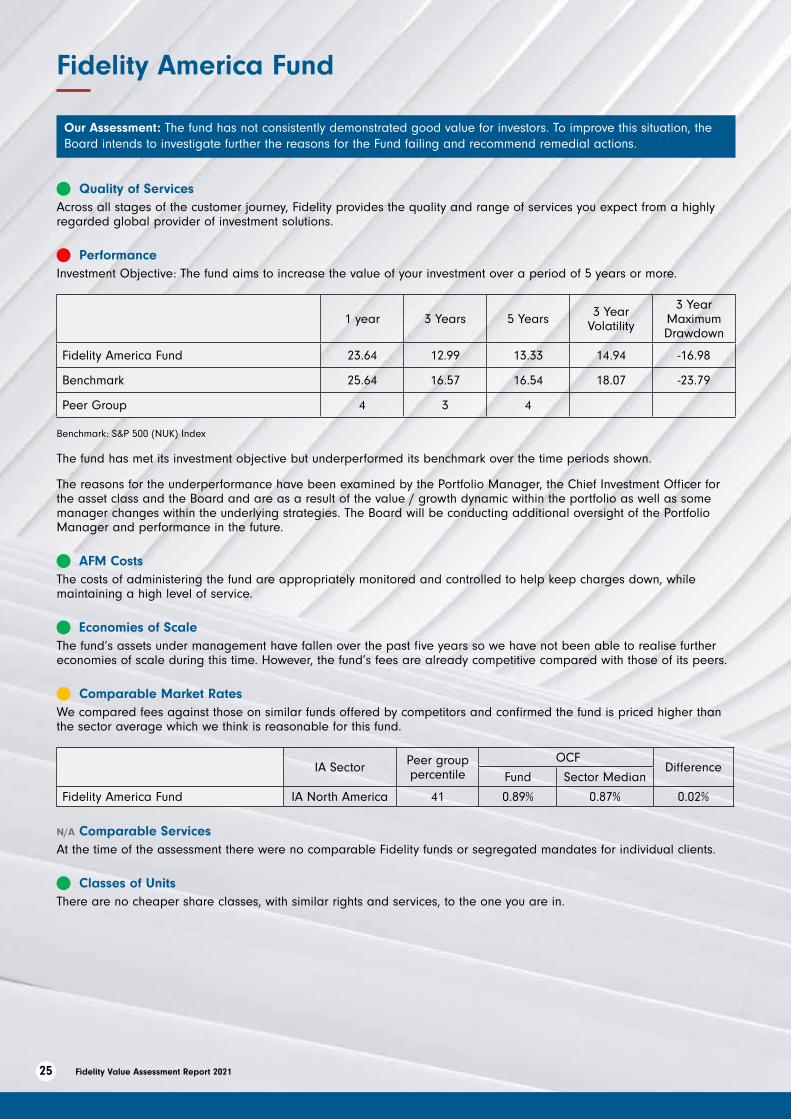
Our Assessment: The fund has not consistently demonstrated good value for investors. To improve this situation, the Board intends to investigate further the reasons for the Fund failing and recommend remedial actions.
n Quality of Services Across all stages of the customer journey, Fidelity provides the quality and range of services you expect from a highly regarded global provider of investment solutions.
n PerformanceInvestment Objective: The fund aims to increase the value of your investment over a period of 5 years or more.
1 year 3 Years 5 Years 3 Year Volatility
3 Year Maximum Drawdown
Fidelity America Fund 23.64 12.99 13.33 14.94 -16.98
Benchmark 25.64 16.57 16.54 18.07 -23.79
Peer Group 4 3 4
Benchmark: S&P 500 (NUK) Index
The fund has met its investment objective but underperformed its benchmark over the time periods shown.
The reasons for the underperformance have been examined by the Portfolio Manager, the Chief Investment Officer for the asset class and the Board and are as a result of the value / growth dynamic within the portfolio as well as some manager changes within the underlying strategies. The Board will be conducting additional oversight of the Portfolio Manager and performance in the future.
n AFM Costs The costs of administering the fund are appropriately monitored and controlled to help keep charges down, while maintaining a high level of service.
n Economies of ScaleThe fund’s assets under management have fallen over the past five years so we have not been able to realise further economies of scale during this time. However, the fund’s fees are already competitive compared with those of its peers.
n Comparable Market RatesWe compared fees against those on similar funds offered by competitors and confirmed the fund is priced higher than the sector average which we think is reasonable for this fund.
IA Sector Peer group percentile
OCF Difference
Fund Sector Median
Fidelity America Fund IA North America 41 0.89% 0.87% 0.02%
N/A Comparable ServicesAt the time of the assessment there were no comparable Fidelity funds or segregated mandates for individual clients.
n Classes of UnitsThere are no cheaper share classes, with similar rights and services, to the one you are in.
26Fidelity Value Assessment Report 2021 Fidelity Value Assessment Report 2021
Fidelity Sterling Core Plus Bond Fund
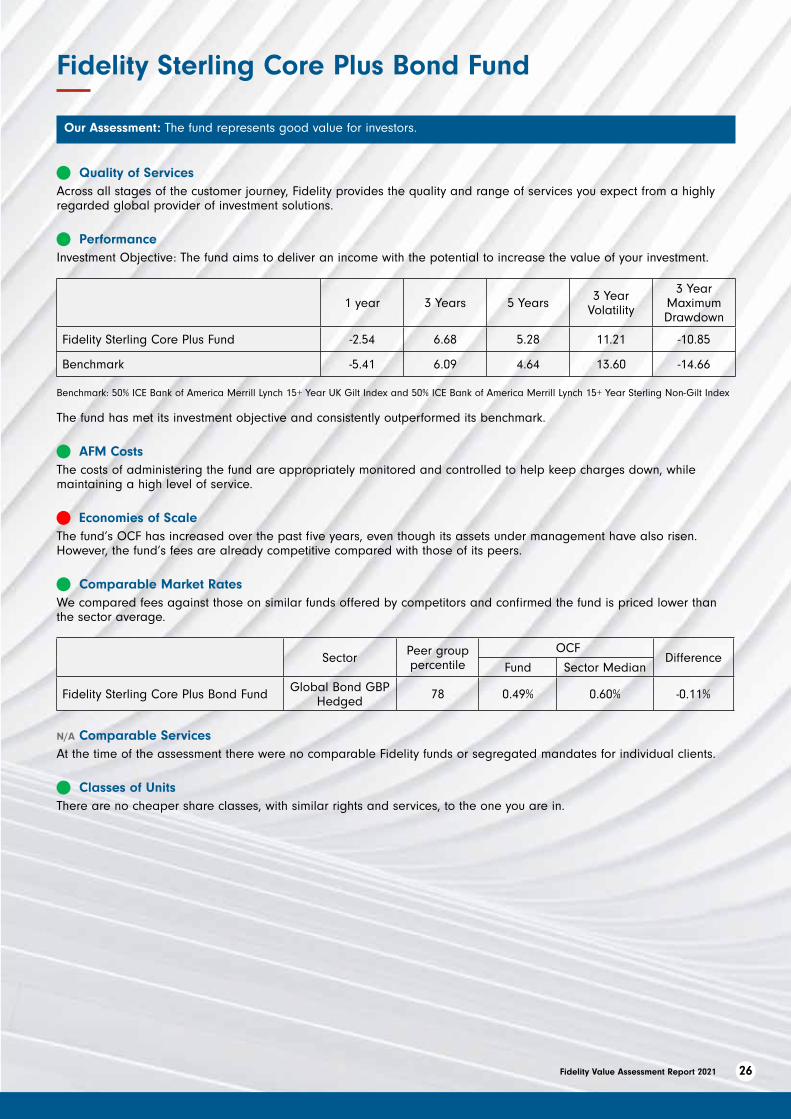
Our Assessment: The fund represents good value for investors.
n Quality of Services Across all stages of the customer journey, Fidelity provides the quality and range of services you expect from a highly regarded global provider of investment solutions.
n PerformanceInvestment Objective: The fund aims to deliver an income with the potential to increase the value of your investment.
1 year 3 Years 5 Years 3 Year Volatility
3 Year Maximum Drawdown
Fidelity Sterling Core Plus Fund -2.54 6.68 5.28 11.21 -10.85
Benchmark -5.41 6.09 4.64 13.60 -14.66
Benchmark: 50% ICE Bank of America Merrill Lynch 15+ Year UK Gilt Index and 50% ICE Bank of America Merrill Lynch 15+ Year Sterling Non-Gilt Index
The fund has met its investment objective and consistently outperformed its benchmark.
n AFM Costs The costs of administering the fund are appropriately monitored and controlled to help keep charges down, while maintaining a high level of service.
n Economies of ScaleThe fund’s OCF has increased over the past five years, even though its assets under management have also risen. However, the fund’s fees are already competitive compared with those of its peers.
n Comparable Market RatesWe compared fees against those on similar funds offered by competitors and confirmed the fund is priced lower than the sector average.
Sector Peer group percentile
OCF Difference
Fund Sector Median
Fidelity Sterling Core Plus Bond Fund Global Bond GBP Hedged 78 0.49% 0.60% -0.11%
N/A Comparable ServicesAt the time of the assessment there were no comparable Fidelity funds or segregated mandates for individual clients.
n Classes of UnitsThere are no cheaper share classes, with similar rights and services, to the one you are in.
27 Fidelity Value Assessment Report 2021
Fidelity Emerging Markets Fund
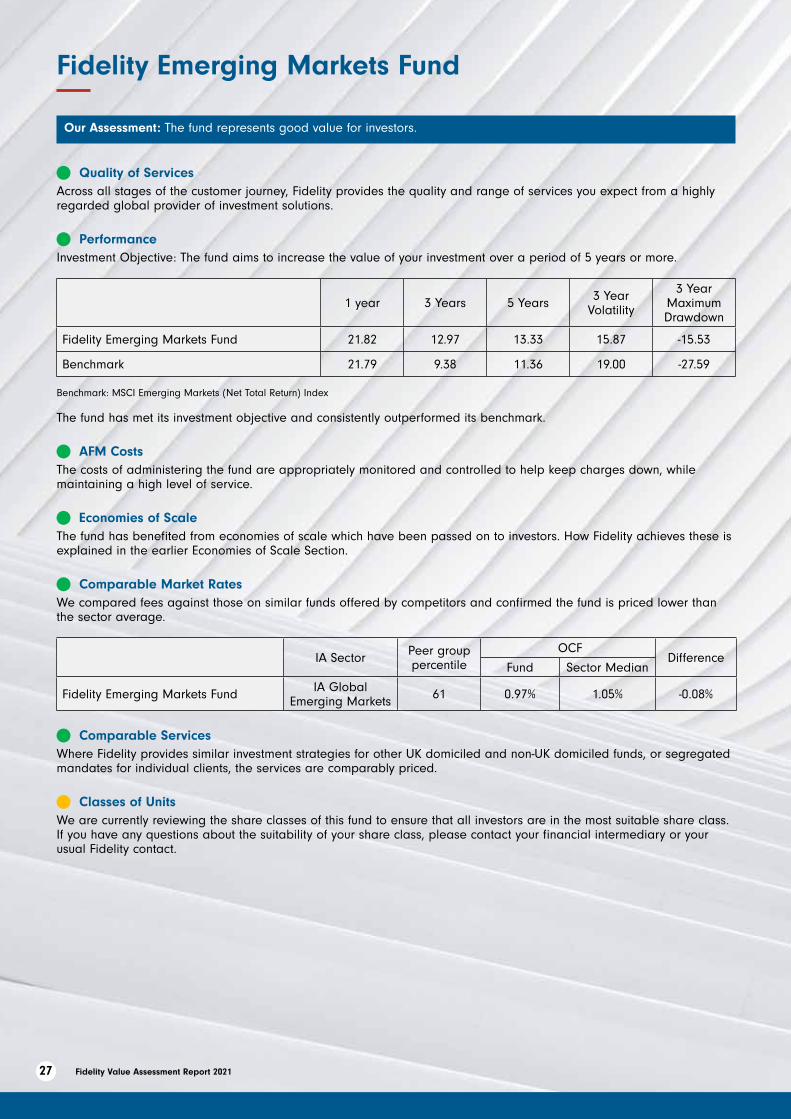
Our Assessment: The fund represents good value for investors.
n Quality of Services Across all stages of the customer journey, Fidelity provides the quality and range of services you expect from a highly regarded global provider of investment solutions.
n PerformanceInvestment Objective: The fund aims to increase the value of your investment over a period of 5 years or more.
1 year 3 Years 5 Years 3 Year Volatility
3 Year Maximum Drawdown
Fidelity Emerging Markets Fund 21.82 12.97 13.33 15.87 -15.53
Benchmark 21.79 9.38 11.36 19.00 -27.59
Benchmark: MSCI Emerging Markets (Net Total Return) Index
The fund has met its investment objective and consistently outperformed its benchmark.
n AFM Costs The costs of administering the fund are appropriately monitored and controlled to help keep charges down, while maintaining a high level of service.
n Economies of ScaleThe fund has benefited from economies of scale which have been passed on to investors. How Fidelity achieves these is explained in the earlier Economies of Scale Section.
n Comparable Market RatesWe compared fees against those on similar funds offered by competitors and confirmed the fund is priced lower than the sector average.
IA Sector Peer group percentile
OCF Difference
Fund Sector Median
Fidelity Emerging Markets Fund IA Global Emerging Markets 61 0.97% 1.05% -0.08%
n Comparable ServicesWhere Fidelity provides similar investment strategies for other UK domiciled and non-UK domiciled funds, or segregated mandates for individual clients, the services are comparably priced.
n Classes of UnitsWe are currently reviewing the share classes of this fund to ensure that all investors are in the most suitable share class. If you have any questions about the suitability of your share class, please contact your financial intermediary or your usual Fidelity contact.

28Fidelity Value Assessment Report 2021
Fidelity Europe (ex-UK) Fund
Our Assessment: The fund represents good value for investors.
n Quality of Services Across all stages of the customer journey, Fidelity provides the quality and range of services you expect from a highly regarded global provider of investment solutions.
n PerformanceInvestment Objective: The fund aims to increase the value of your investment over a period of 5 years or more.
1 year 3 Years 5 Years 3 Year Volatility
3 Year Maximum Drawdown
Fidelity Europe (ex-UK) Fund 21.82 12.97 13.33 15.87 -15.53
Benchmark 21.79 9.38 11.36 19.00 -27.59
Benchmark: MSCI Europe ex UK (Net Total Return) Index
The fund has met its investment objective and consistently outperformed its benchmark.
n AFM Costs The costs of administering the fund are appropriately monitored and controlled to help keep charges down, while maintaining a high level of service.
n Economies of ScaleThe fund’s assets under management have fallen over the past five years so we have not been able to realise further economies of scale during this time.
n Comparable Market RatesWe compared fees against those on similar funds offered by competitors and the fund is priced marginally higher than the sector average, which we think is reasonable for this fund.
IA Sector Peer group percentile
OCF Difference
Fund Sector Median
Fidelity Europe (ex-UK) Fund Europe ex UK Equity 36 0.91% 0.87% 0.04%
n Comparable ServicesWhere Fidelity provides similar investment strategies for other UK domiciled and non-UK domiciled funds, or segregated mandates for individual clients, the services are comparably priced.
n Classes of UnitsThere are no cheaper share classes, with similar rights and services, to the one you are in.
29 Fidelity Value Assessment Report 2021
Fidelity Global Focus Fund
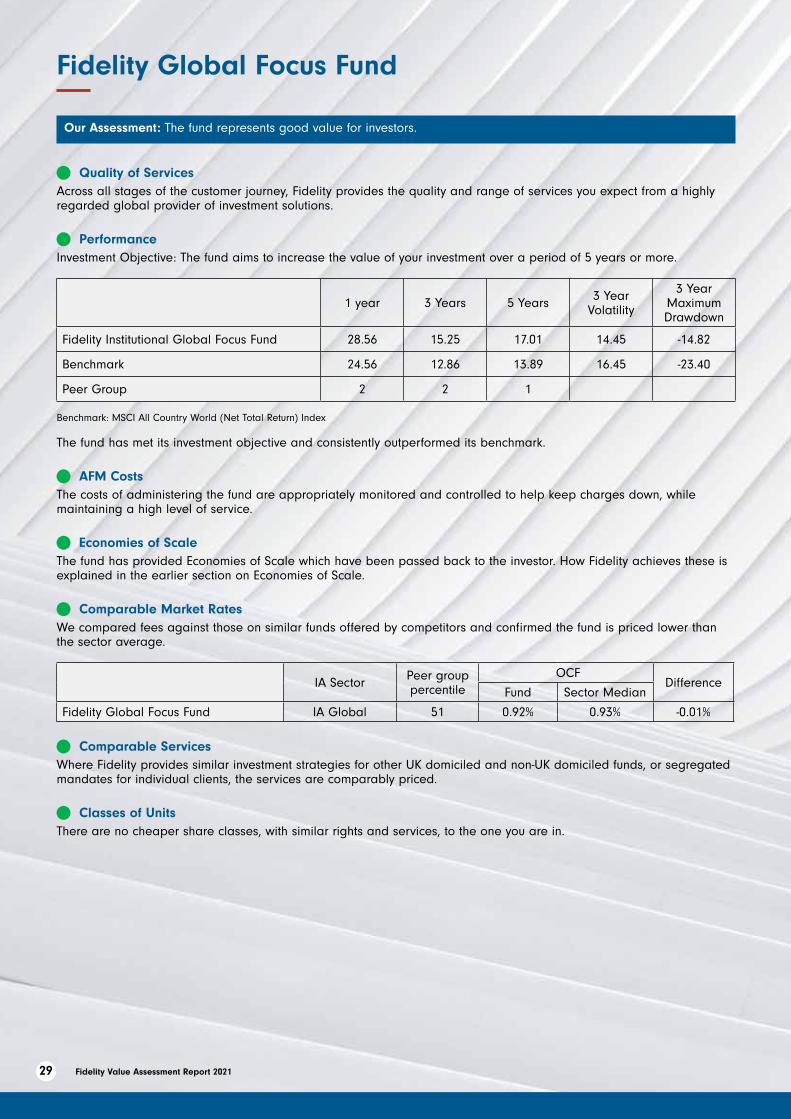
Our Assessment: The fund represents good value for investors.
n Quality of Services Across all stages of the customer journey, Fidelity provides the quality and range of services you expect from a highly regarded global provider of investment solutions.
n PerformanceInvestment Objective: The fund aims to increase the value of your investment over a period of 5 years or more.
1 year 3 Years 5 Years 3 Year Volatility
3 Year Maximum Drawdown
Fidelity Institutional Global Focus Fund 28.56 15.25 17.01 14.45 -14.82
Benchmark 24.56 12.86 13.89 16.45 -23.40
Peer Group 2 2 1
Benchmark: MSCI All Country World (Net Total Return) Index
The fund has met its investment objective and consistently outperformed its benchmark.
n AFM Costs The costs of administering the fund are appropriately monitored and controlled to help keep charges down, while maintaining a high level of service.
n Economies of ScaleThe fund has provided Economies of Scale which have been passed back to the investor. How Fidelity achieves these is explained in the earlier section on Economies of Scale.
n Comparable Market RatesWe compared fees against those on similar funds offered by competitors and confirmed the fund is priced lower than the sector average.
IA Sector Peer group percentile
OCF Difference
Fund Sector Median
Fidelity Global Focus Fund IA Global 51 0.92% 0.93% -0.01%
n Comparable ServicesWhere Fidelity provides similar investment strategies for other UK domiciled and non-UK domiciled funds, or segregated mandates for individual clients, the services are comparably priced.
n Classes of UnitsThere are no cheaper share classes, with similar rights and services, to the one you are in.
30Fidelity Value Assessment Report 2021
Fidelity Index-Linked Bond Fund
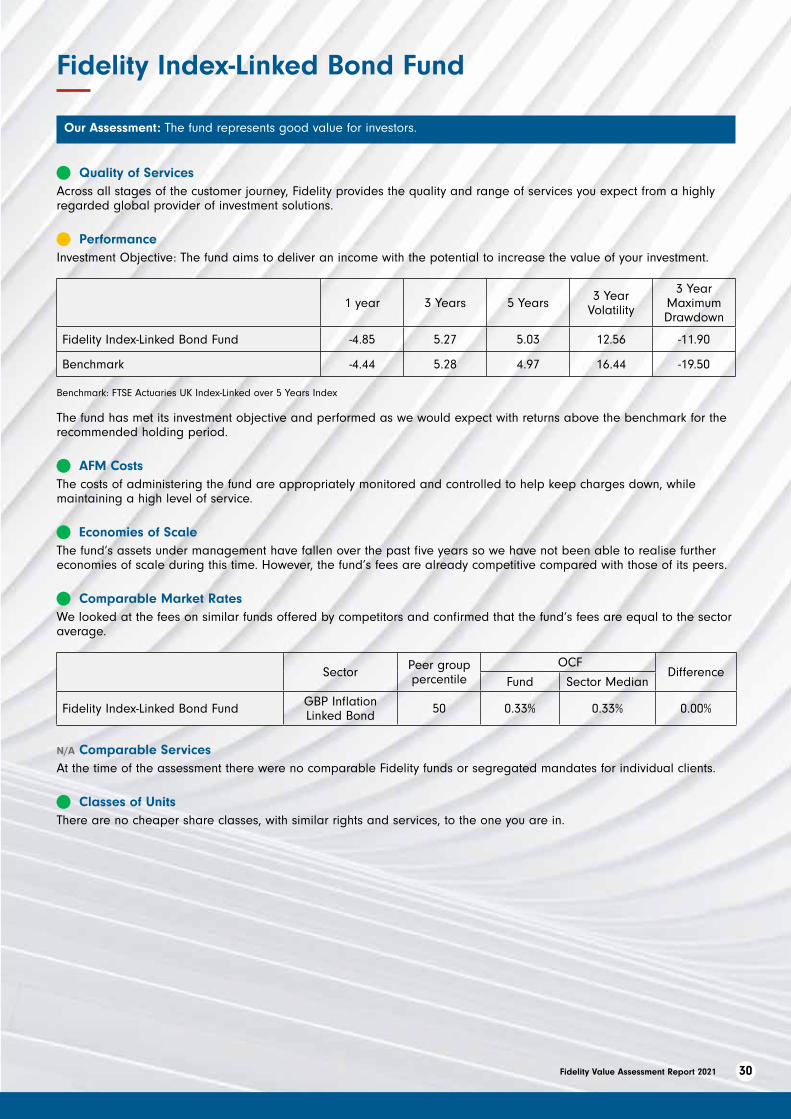
Our Assessment: The fund represents good value for investors.
n Quality of Services Across all stages of the customer journey, Fidelity provides the quality and range of services you expect from a highly regarded global provider of investment solutions.
n PerformanceInvestment Objective: The fund aims to deliver an income with the potential to increase the value of your investment.
1 year 3 Years 5 Years 3 Year Volatility
3 Year Maximum Drawdown
Fidelity Index-Linked Bond Fund -4.85 5.27 5.03 12.56 -11.90
Benchmark -4.44 5.28 4.97 16.44 -19.50
Benchmark: FTSE Actuaries UK Index-Linked over 5 Years Index
The fund has met its investment objective and performed as we would expect with returns above the benchmark for the recommended holding period.
n AFM Costs The costs of administering the fund are appropriately monitored and controlled to help keep charges down, while maintaining a high level of service.
n Economies of ScaleThe fund’s assets under management have fallen over the past five years so we have not been able to realise further economies of scale during this time. However, the fund’s fees are already competitive compared with those of its peers.
n Comparable Market RatesWe looked at the fees on similar funds offered by competitors and confirmed that the fund‘s fees are equal to the sector average.
Sector Peer group percentile
OCF Difference
Fund Sector Median
Fidelity Index-Linked Bond Fund GBP Inflation Linked Bond 50 0.33% 0.33% 0.00%
N/A Comparable ServicesAt the time of the assessment there were no comparable Fidelity funds or segregated mandates for individual clients.
n Classes of UnitsThere are no cheaper share classes, with similar rights and services, to the one you are in.
31 Fidelity Value Assessment Report 2021
Fidelity Japan Fund
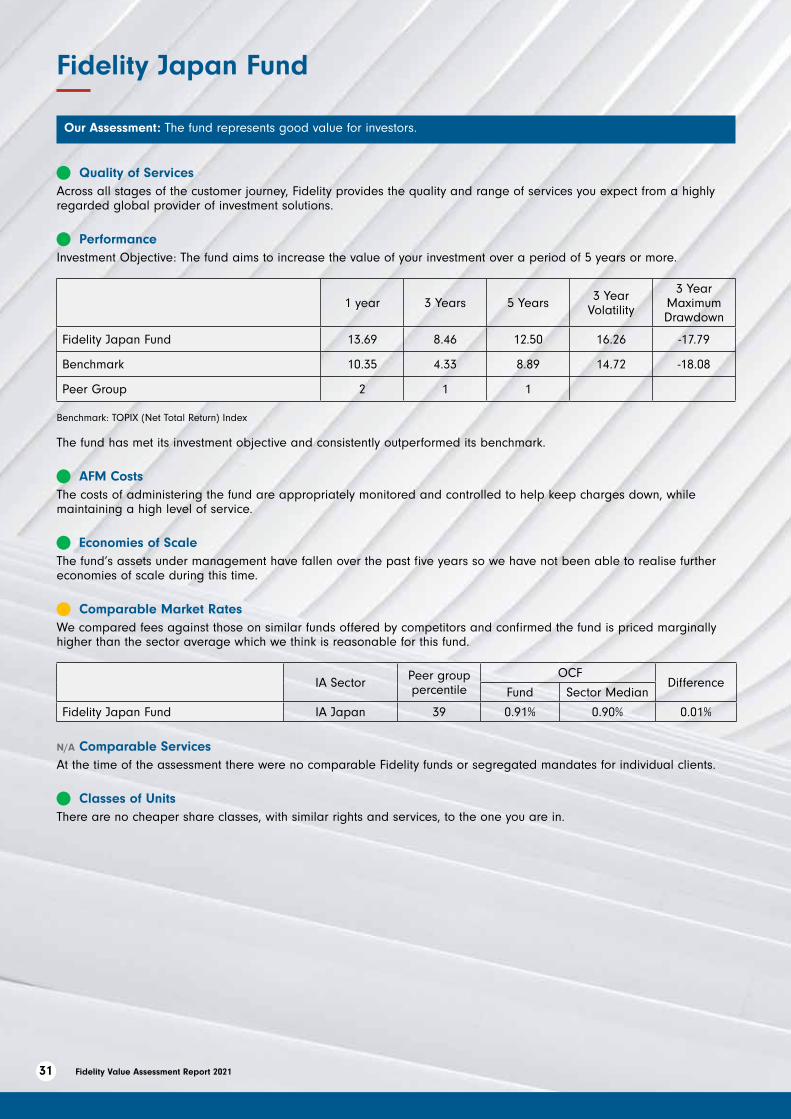
Our Assessment: The fund represents good value for investors.
n Quality of Services Across all stages of the customer journey, Fidelity provides the quality and range of services you expect from a highly regarded global provider of investment solutions.
n PerformanceInvestment Objective: The fund aims to increase the value of your investment over a period of 5 years or more.
1 year 3 Years 5 Years 3 Year Volatility
3 Year Maximum Drawdown
Fidelity Japan Fund 13.69 8.46 12.50 16.26 -17.79
Benchmark 10.35 4.33 8.89 14.72 -18.08
Peer Group 2 1 1
Benchmark: TOPIX (Net Total Return) Index
The fund has met its investment objective and consistently outperformed its benchmark.
n AFM Costs The costs of administering the fund are appropriately monitored and controlled to help keep charges down, while maintaining a high level of service.
n Economies of ScaleThe fund’s assets under management have fallen over the past five years so we have not been able to realise further economies of scale during this time.
n Comparable Market Rates We compared fees against those on similar funds offered by competitors and confirmed the fund is priced marginally higher than the sector average which we think is reasonable for this fund.
IA Sector Peer group percentile
OCF Difference
Fund Sector Median
Fidelity Japan Fund IA Japan 39 0.91% 0.90% 0.01%
N/A Comparable ServicesAt the time of the assessment there were no comparable Fidelity funds or segregated mandates for individual clients.
n Classes of UnitsThere are no cheaper share classes, with similar rights and services, to the one you are in.
32Fidelity Value Assessment Report 2021
Fidelity Long Bond Fund
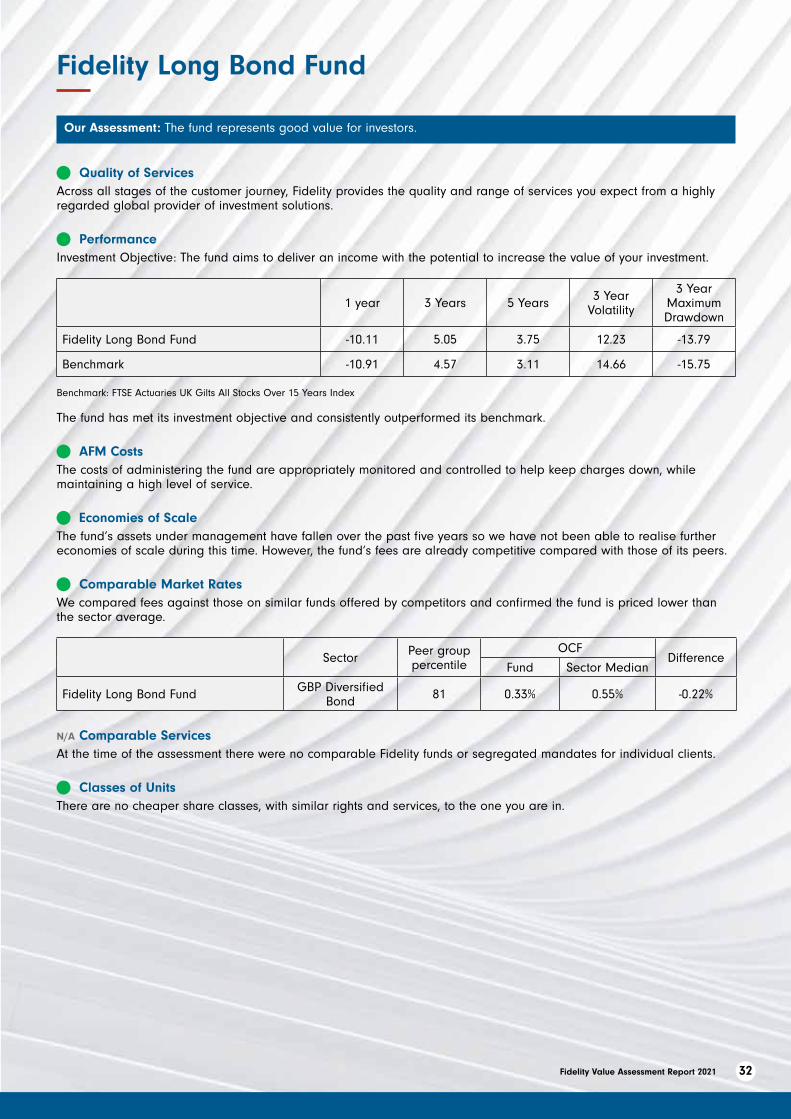
Our Assessment: The fund represents good value for investors.
n Quality of Services Across all stages of the customer journey, Fidelity provides the quality and range of services you expect from a highly regarded global provider of investment solutions.
n PerformanceInvestment Objective: The fund aims to deliver an income with the potential to increase the value of your investment.
1 year 3 Years 5 Years 3 Year Volatility
3 Year Maximum Drawdown
Fidelity Long Bond Fund -10.11 5.05 3.75 12.23 -13.79
Benchmark -10.91 4.57 3.11 14.66 -15.75
Benchmark: FTSE Actuaries UK Gilts All Stocks Over 15 Years Index
The fund has met its investment objective and consistently outperformed its benchmark.
n AFM Costs The costs of administering the fund are appropriately monitored and controlled to help keep charges down, while maintaining a high level of service.
n Economies of ScaleThe fund’s assets under management have fallen over the past five years so we have not been able to realise further economies of scale during this time. However, the fund’s fees are already competitive compared with those of its peers.
n Comparable Market RatesWe compared fees against those on similar funds offered by competitors and confirmed the fund is priced lower than the sector average.
Sector Peer group percentile
OCF Difference
Fund Sector Median
Fidelity Long Bond Fund GBP Diversified Bond 81 0.33% 0.55% -0.22%
N/A Comparable ServicesAt the time of the assessment there were no comparable Fidelity funds or segregated mandates for individual clients.
n Classes of UnitsThere are no cheaper share classes, with similar rights and services, to the one you are in.

33 Fidelity Value Assessment Report 2021
Fidelity Pacific (ex-Japan) Fund
Our Assessment: The fund has not demonstrated good value for investors. Please note that this Fund Closed in September 2021
n Quality of Services Across all stages of the customer journey, Fidelity provides the quality and range of services you expect from a highly regarded global provider of investment solutions.
n PerformanceInvestment Objective: The fund aims to increase the value of your investment over a period of 5 years or more.
1 year 3 Years 5 Years 3 Year Volatility
3 Year Maximum Drawdown
Fidelity Pacific (ex-Japan) Fund 10.90 2.53 7.78 16.42 -26.01
Benchmark 20.02 6.22 9.22 15.48 -27.98
Peer Group 4 4 4
Benchmark: MSCI Pacific ex Japan (Net Total Return) Index
The fund has met its investment objective but underperformed its benchmark over the time periods shown.
The reasons for underperformance have been examined by the Portfolio Manager, the Chief Investment Officer for the asset class and the Board. Due to the size of the Fund, its future prospects as part of the Fidelity range of funds and the performance, this fund closed in September 2021.
n AFM Costs The costs of administering the fund are appropriately monitored and controlled to help keep charges down, while maintaining a high level of service.
n Economies of ScaleThe fund’s assets under management have fallen over the past five years so we have not been able to realise further economies of scale during this time.
n Comparable Market RatesWe compared fees against those on similar funds offered by competitors and confirmed the fund is priced higher than the sector average.
IA Sector Peer group percentile
OCF Difference
Fund Sector Median
Fidelity Pacific (ex-Japan) Fund IA Asia Pacific Excluding Japan 33 1.04% 0.95% 0.09%
N/A Comparable ServicesAt the time of the assessment there were no comparable Fidelity funds or segregated mandates for individual clients.
n Classes of UnitsThere are no cheaper share classes, with similar rights and services, to the one you are in.
34Fidelity Value Assessment Report 2021
Fidelity Select Emerging Markets Equities Fund
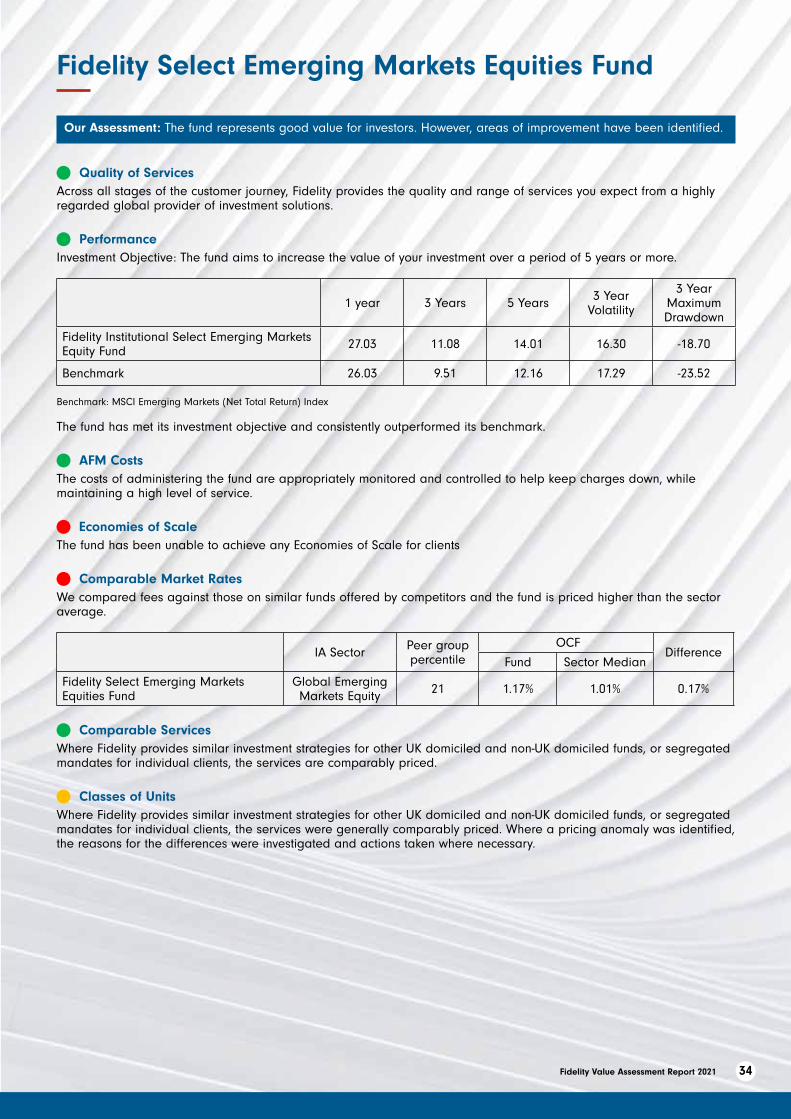
Our Assessment: The fund represents good value for investors. However, areas of improvement have been identified.
n Quality of Services Across all stages of the customer journey, Fidelity provides the quality and range of services you expect from a highly regarded global provider of investment solutions.
n PerformanceInvestment Objective: The fund aims to increase the value of your investment over a period of 5 years or more.
1 year 3 Years 5 Years 3 Year Volatility
3 Year Maximum Drawdown
Fidelity Institutional Select Emerging Markets Equity Fund 27.03 11.08 14.01 16.30 -18.70
Benchmark 26.03 9.51 12.16 17.29 -23.52
Benchmark: MSCI Emerging Markets (Net Total Return) Index
The fund has met its investment objective and consistently outperformed its benchmark.
n AFM Costs The costs of administering the fund are appropriately monitored and controlled to help keep charges down, while maintaining a high level of service.
n Economies of ScaleThe fund has been unable to achieve any Economies of Scale for clients
n Comparable Market RatesWe compared fees against those on similar funds offered by competitors and the fund is priced higher than the sector average.
IA Sector Peer group percentile
OCF Difference
Fund Sector Median
Fidelity Select Emerging Markets Equities Fund
Global Emerging Markets Equity 21 1.17% 1.01% 0.17%
n Comparable ServicesWhere Fidelity provides similar investment strategies for other UK domiciled and non-UK domiciled funds, or segregated mandates for individual clients, the services are comparably priced.
n Classes of UnitsWhere Fidelity provides similar investment strategies for other UK domiciled and non-UK domiciled funds, or segregated mandates for individual clients, the services were generally comparably priced. Where a pricing anomaly was identified, the reasons for the differences were investigated and actions taken where necessary.
35 Fidelity Value Assessment Report 2021
Fidelity South East Asia Fund
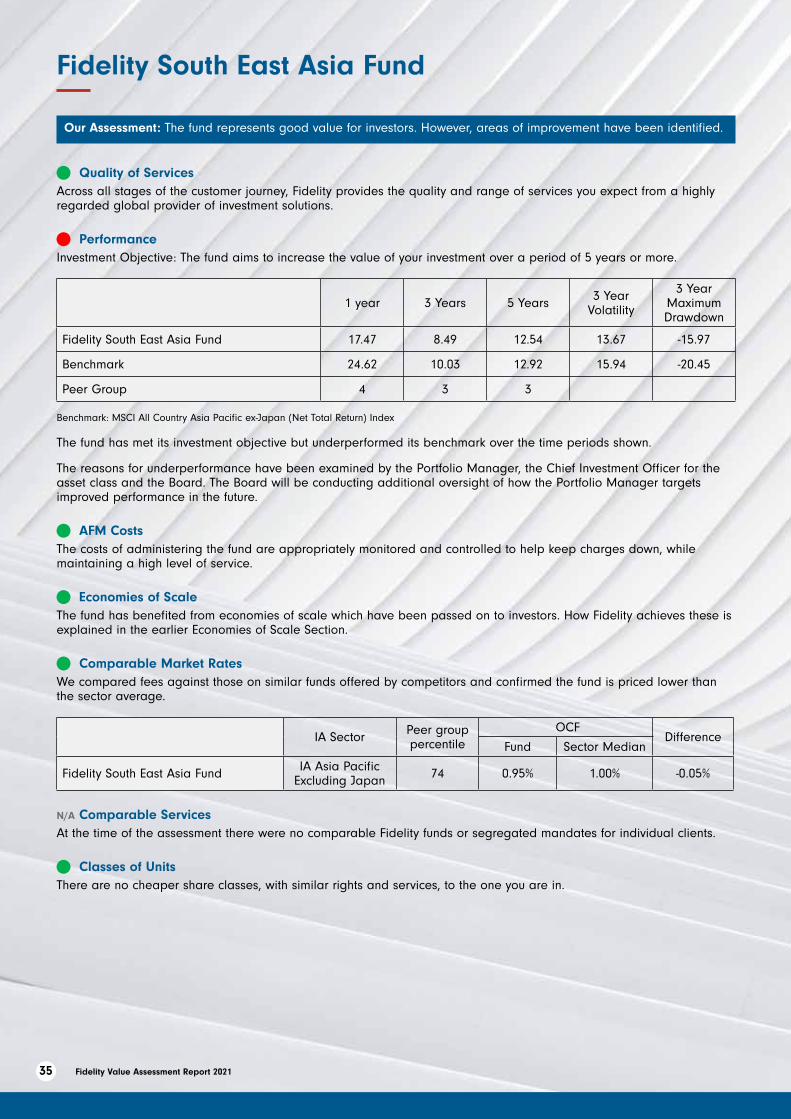
Our Assessment: The fund represents good value for investors. However, areas of improvement have been identified.
n Quality of Services Across all stages of the customer journey, Fidelity provides the quality and range of services you expect from a highly regarded global provider of investment solutions.
n PerformanceInvestment Objective: The fund aims to increase the value of your investment over a period of 5 years or more.
1 year 3 Years 5 Years 3 Year Volatility
3 Year Maximum Drawdown
Fidelity South East Asia Fund 17.47 8.49 12.54 13.67 -15.97
Benchmark 24.62 10.03 12.92 15.94 -20.45
Peer Group 4 3 3
Benchmark: MSCI All Country Asia Pacific ex-Japan (Net Total Return) Index
The fund has met its investment objective but underperformed its benchmark over the time periods shown.
The reasons for underperformance have been examined by the Portfolio Manager, the Chief Investment Officer for the asset class and the Board. The Board will be conducting additional oversight of how the Portfolio Manager targets improved performance in the future.
n AFM Costs The costs of administering the fund are appropriately monitored and controlled to help keep charges down, while maintaining a high level of service.
n Economies of ScaleThe fund has benefited from economies of scale which have been passed on to investors. How Fidelity achieves these is explained in the earlier Economies of Scale Section.
n Comparable Market RatesWe compared fees against those on similar funds offered by competitors and confirmed the fund is priced lower than the sector average.
IA Sector Peer group percentile
OCF Difference
Fund Sector Median
Fidelity South East Asia Fund IA Asia Pacific Excluding Japan 74 0.95% 1.00% -0.05%
N/A Comparable ServicesAt the time of the assessment there were no comparable Fidelity funds or segregated mandates for individual clients.
n Classes of UnitsThere are no cheaper share classes, with similar rights and services, to the one you are in.

36Fidelity Value Assessment Report 2021
Fidelity UK Fund
Our Assessment: The fund represents good value for investors.
n Quality of Services Across all stages of the customer journey, Fidelity provides the quality and range of services you expect from a highly regarded global provider of investment solutions.
n PerformanceInvestment Objective: The fund aims to increase the value of your investment over a period of 5 years or more.
1 year 3 Years 5 Years 3 Year Volatility
3 Year Maximum Drawdown
Fidelity UK Fund 22.54 2.85 6.14 16.84 -25.53
Benchmark 21.45 2.05 6.48 19.75 -34.15
Peer Group 3 3 3
Benchmark: FTSE All Share Total Return Index
While the fund has underperformed its benchmark for the recommended holding period, the performance relative to benchmark has improved in recent periods. The Portfolio Manager has demonstrated effective active management of the fund and sound investment convictions and the fund has met its investment objective.
n AFM Costs The costs of administering the fund are appropriately monitored and controlled to help keep charges down, while maintaining a high level of service.
n Economies of ScaleThe fund’s assets under management have fallen over the past five years so we have not been able to realise further economies of scale during this time.
n Comparable Market RatesWe compared fees against those on similar funds offered by competitors and the fund is priced marginally higher than the sector average, which we think is reasonable for this fund.
IA Sector Peer group percentile
OCF Difference
Fund Sector Median
Fidelity UK Fund IA UK All Companies 39 0.89% 0.85% 0.04%
N/A Comparable ServicesAt the time of the assessment there were no comparable Fidelity funds or segregated mandates for individual clients.
n Classes of UnitsThere are no cheaper share classes, with similar rights and services, to the one you are in.
37 Fidelity Value Assessment Report 2021
Fidelity UK Aggregate Bond Fund
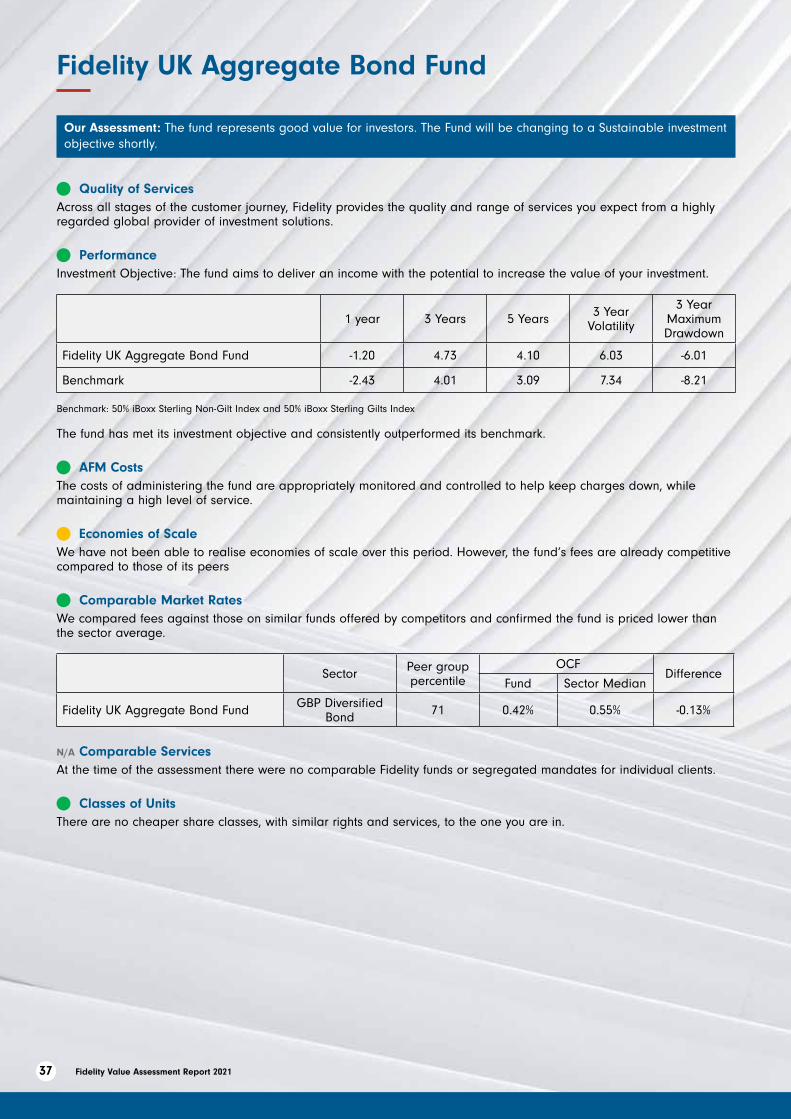
Our Assessment: The fund represents good value for investors. The Fund will be changing to a Sustainable investment objective shortly.
n Quality of Services Across all stages of the customer journey, Fidelity provides the quality and range of services you expect from a highly regarded global provider of investment solutions.
n PerformanceInvestment Objective: The fund aims to deliver an income with the potential to increase the value of your investment.
1 year 3 Years 5 Years 3 Year Volatility
3 Year Maximum Drawdown
Fidelity UK Aggregate Bond Fund -1.20 4.73 4.10 6.03 -6.01
Benchmark -2.43 4.01 3.09 7.34 -8.21
Benchmark: 50% iBoxx Sterling Non-Gilt Index and 50% iBoxx Sterling Gilts Index
The fund has met its investment objective and consistently outperformed its benchmark.
n AFM Costs The costs of administering the fund are appropriately monitored and controlled to help keep charges down, while maintaining a high level of service.
n Economies of ScaleWe have not been able to realise economies of scale over this period. However, the fund‘s fees are already competitive compared to those of its peers
n Comparable Market RatesWe compared fees against those on similar funds offered by competitors and confirmed the fund is priced lower than the sector average.
Sector Peer group percentile
OCF Difference
Fund Sector Median
Fidelity UK Aggregate Bond Fund GBP Diversified Bond 71 0.42% 0.55% -0.13%
N/A Comparable ServicesAt the time of the assessment there were no comparable Fidelity funds or segregated mandates for individual clients.
n Classes of UnitsThere are no cheaper share classes, with similar rights and services, to the one you are in.
38Fidelity Value Assessment Report 2021
Fidelity Sterling Corporate Bond Fund
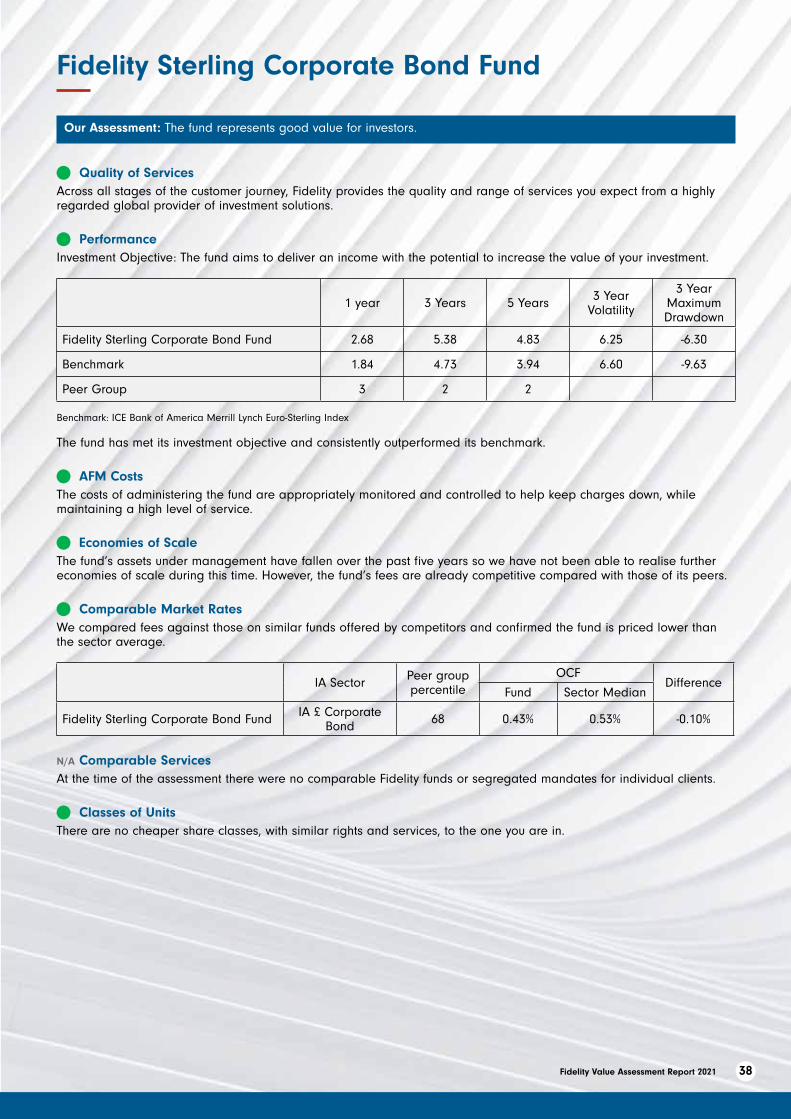
Our Assessment: The fund represents good value for investors.
n Quality of Services Across all stages of the customer journey, Fidelity provides the quality and range of services you expect from a highly regarded global provider of investment solutions.
n PerformanceInvestment Objective: The fund aims to deliver an income with the potential to increase the value of your investment.
1 year 3 Years 5 Years 3 Year Volatility
3 Year Maximum Drawdown
Fidelity Sterling Corporate Bond Fund 2.68 5.38 4.83 6.25 -6.30
Benchmark 1.84 4.73 3.94 6.60 -9.63
Peer Group 3 2 2
Benchmark: ICE Bank of America Merrill Lynch Euro-Sterling Index
The fund has met its investment objective and consistently outperformed its benchmark.
n AFM Costs The costs of administering the fund are appropriately monitored and controlled to help keep charges down, while maintaining a high level of service.
n Economies of ScaleThe fund’s assets under management have fallen over the past five years so we have not been able to realise further economies of scale during this time. However, the fund’s fees are already competitive compared with those of its peers.
n Comparable Market RatesWe compared fees against those on similar funds offered by competitors and confirmed the fund is priced lower than the sector average.
IA Sector Peer group percentile
OCF Difference
Fund Sector Median
Fidelity Sterling Corporate Bond Fund IA £ Corporate Bond 68 0.43% 0.53% -0.10%
N/A Comparable ServicesAt the time of the assessment there were no comparable Fidelity funds or segregated mandates for individual clients.
n Classes of UnitsThere are no cheaper share classes, with similar rights and services, to the one you are in.
39 Fidelity Value Assessment Report 2021
Fidelity UK Gilt Fund
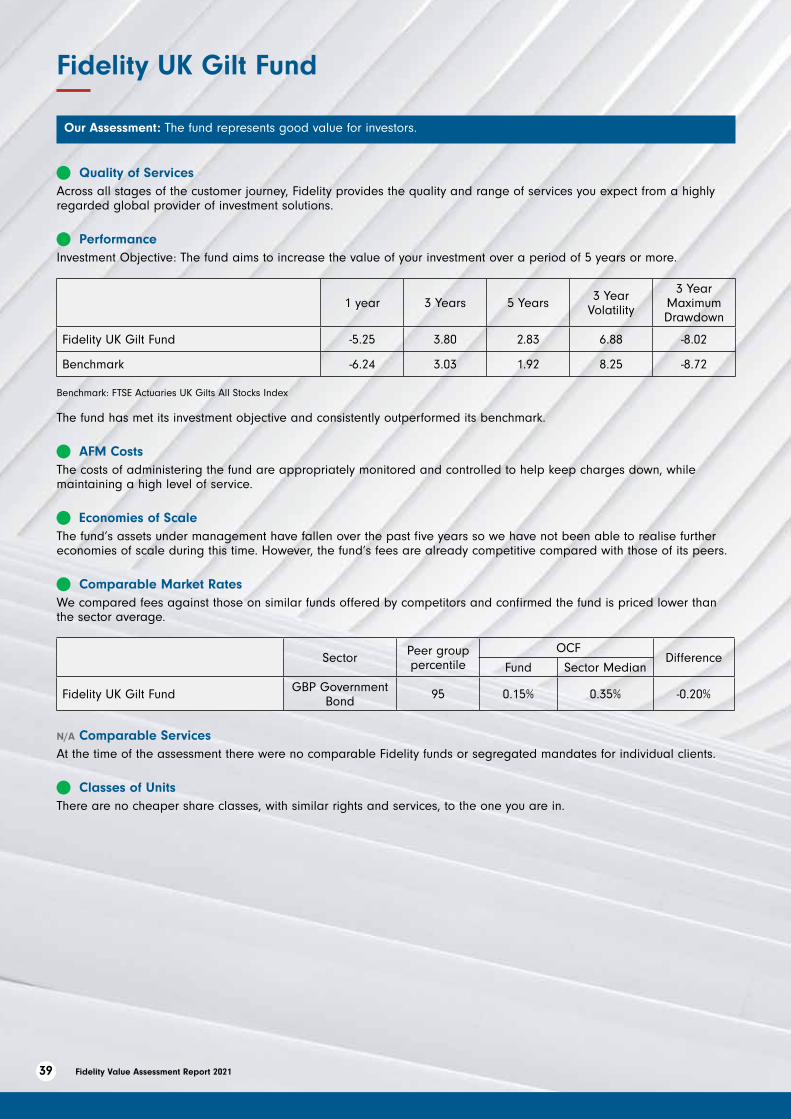
Our Assessment: The fund represents good value for investors.
n Quality of Services Across all stages of the customer journey, Fidelity provides the quality and range of services you expect from a highly regarded global provider of investment solutions.
n PerformanceInvestment Objective: The fund aims to increase the value of your investment over a period of 5 years or more.
1 year 3 Years 5 Years 3 Year Volatility
3 Year Maximum Drawdown
Fidelity UK Gilt Fund -5.25 3.80 2.83 6.88 -8.02
Benchmark -6.24 3.03 1.92 8.25 -8.72
Benchmark: FTSE Actuaries UK Gilts All Stocks Index
The fund has met its investment objective and consistently outperformed its benchmark.
n AFM Costs The costs of administering the fund are appropriately monitored and controlled to help keep charges down, while maintaining a high level of service.
n Economies of ScaleThe fund’s assets under management have fallen over the past five years so we have not been able to realise further economies of scale during this time. However, the fund’s fees are already competitive compared with those of its peers.
n Comparable Market RatesWe compared fees against those on similar funds offered by competitors and confirmed the fund is priced lower than the sector average.
Sector Peer group percentile
OCF Difference
Fund Sector Median
Fidelity UK Gilt Fund GBP Government Bond 95 0.15% 0.35% -0.20%
N/A Comparable ServicesAt the time of the assessment there were no comparable Fidelity funds or segregated mandates for individual clients.
n Classes of UnitsThere are no cheaper share classes, with similar rights and services, to the one you are in.
40Fidelity Value Assessment Report 2021
Fidelity Long Dated Sterling Corporate Bond Fund
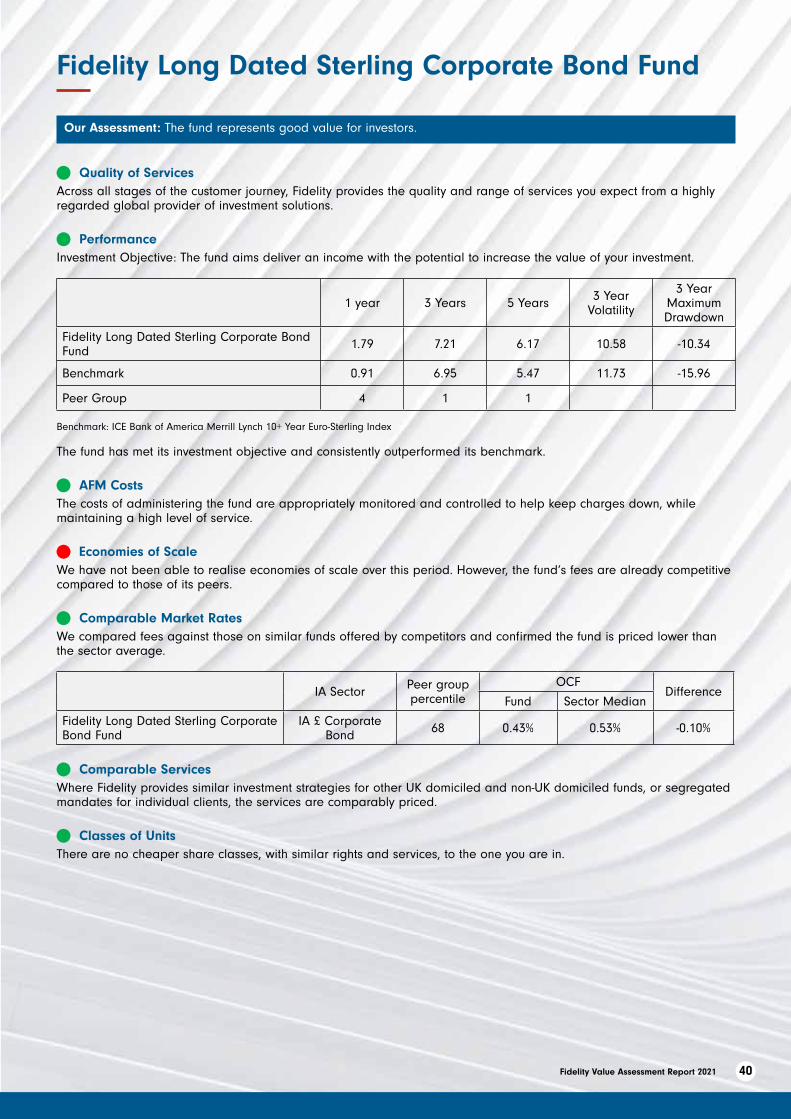
Our Assessment: The fund represents good value for investors.
n Quality of Services Across all stages of the customer journey, Fidelity provides the quality and range of services you expect from a highly regarded global provider of investment solutions.
n PerformanceInvestment Objective: The fund aims deliver an income with the potential to increase the value of your investment.
1 year 3 Years 5 Years 3 Year Volatility
3 Year Maximum Drawdown
Fidelity Long Dated Sterling Corporate Bond Fund 1.79 7.21 6.17 10.58 -10.34
Benchmark 0.91 6.95 5.47 11.73 -15.96
Peer Group 4 1 1
Benchmark: ICE Bank of America Merrill Lynch 10+ Year Euro-Sterling Index
The fund has met its investment objective and consistently outperformed its benchmark.
n AFM Costs The costs of administering the fund are appropriately monitored and controlled to help keep charges down, while maintaining a high level of service.
n Economies of ScaleWe have not been able to realise economies of scale over this period. However, the fund‘s fees are already competitive compared to those of its peers.
n Comparable Market RatesWe compared fees against those on similar funds offered by competitors and confirmed the fund is priced lower than the sector average.
IA Sector Peer group percentile
OCF Difference
Fund Sector Median
Fidelity Long Dated Sterling Corporate Bond Fund
IA £ Corporate Bond 68 0.43% 0.53% -0.10%
n Comparable ServicesWhere Fidelity provides similar investment strategies for other UK domiciled and non-UK domiciled funds, or segregated mandates for individual clients, the services are comparably priced.
n Classes of UnitsThere are no cheaper share classes, with similar rights and services, to the one you are in.
41 Fidelity Value Assessment Report 2021
Fidelity Pre-Retirement Bond Fund
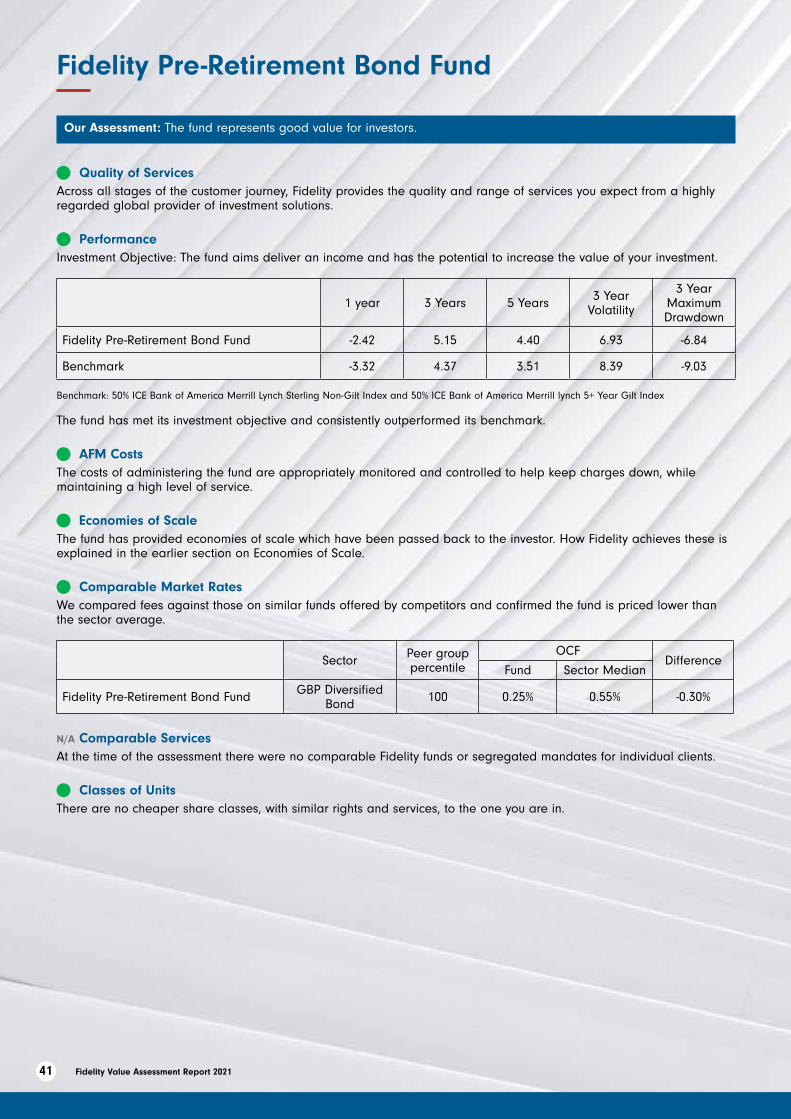
Our Assessment: The fund represents good value for investors.
n Quality of Services Across all stages of the customer journey, Fidelity provides the quality and range of services you expect from a highly regarded global provider of investment solutions.
n PerformanceInvestment Objective: The fund aims deliver an income and has the potential to increase the value of your investment.
1 year 3 Years 5 Years 3 Year Volatility
3 Year Maximum Drawdown
Fidelity Pre-Retirement Bond Fund -2.42 5.15 4.40 6.93 -6.84
Benchmark -3.32 4.37 3.51 8.39 -9.03
Benchmark: 50% ICE Bank of America Merrill Lynch Sterling Non-Gilt Index and 50% ICE Bank of America Merrill lynch 5+ Year Gilt Index
The fund has met its investment objective and consistently outperformed its benchmark.
n AFM Costs The costs of administering the fund are appropriately monitored and controlled to help keep charges down, while maintaining a high level of service.
n Economies of ScaleThe fund has provided economies of scale which have been passed back to the investor. How Fidelity achieves these is explained in the earlier section on Economies of Scale.
n Comparable Market RatesWe compared fees against those on similar funds offered by competitors and confirmed the fund is priced lower than the sector average.
Sector Peer group percentile
OCF Difference
Fund Sector Median
Fidelity Pre-Retirement Bond Fund GBP Diversified Bond 100 0.25% 0.55% -0.30%
N/A Comparable ServicesAt the time of the assessment there were no comparable Fidelity funds or segregated mandates for individual clients.
n Classes of UnitsThere are no cheaper share classes, with similar rights and services, to the one you are in.
42 Fidelity Value Assessment Report 2021
Fidelity UK Real Estate Fund
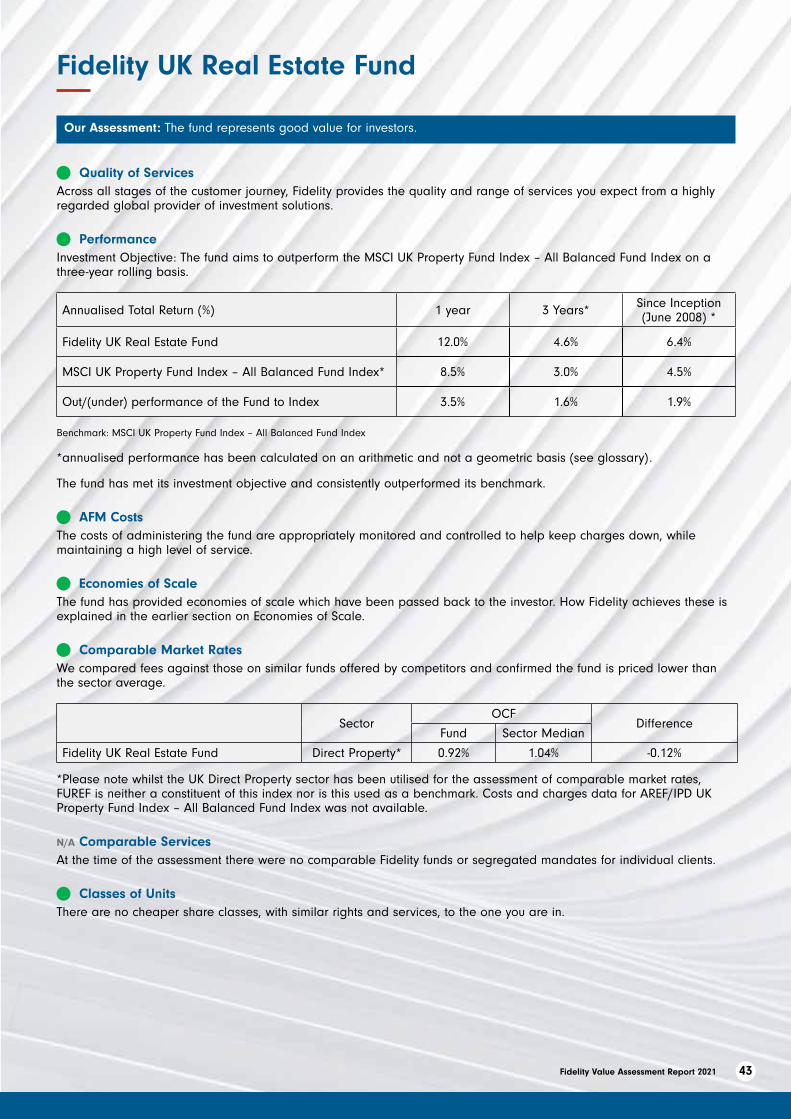
43Fidelity Value Assessment Report 2021
Fidelity UK Real Estate Fund
Our Assessment: The fund represents good value for investors.
n Quality of Services Across all stages of the customer journey, Fidelity provides the quality and range of services you expect from a highly regarded global provider of investment solutions.
n PerformanceInvestment Objective: The fund aims to outperform the MSCI UK Property Fund Index – All Balanced Fund Index on a three-year rolling basis.
Annualised Total Return (%) 1 year 3 Years* Since Inception (June 2008) *
Fidelity UK Real Estate Fund 12.0% 4.6% 6.4%
MSCI UK Property Fund Index – All Balanced Fund Index* 8.5% 3.0% 4.5%
Out/(under) performance of the Fund to Index 3.5% 1.6% 1.9%
Benchmark: MSCI UK Property Fund Index – All Balanced Fund Index
*annualised performance has been calculated on an arithmetic and not a geometric basis (see glossary).
The fund has met its investment objective and consistently outperformed its benchmark.
n AFM Costs The costs of administering the fund are appropriately monitored and controlled to help keep charges down, while maintaining a high level of service.
n Economies of ScaleThe fund has provided economies of scale which have been passed back to the investor. How Fidelity achieves these is explained in the earlier section on Economies of Scale.
n Comparable Market RatesWe compared fees against those on similar funds offered by competitors and confirmed the fund is priced lower than the sector average.
Sector OCF
Difference Fund Sector Median
Fidelity UK Real Estate Fund Direct Property* 0.92% 1.04% -0.12%
*Please note whilst the UK Direct Property sector has been utilised for the assessment of comparable market rates, FUREF is neither a constituent of this index nor is this used as a benchmark. Costs and charges data for AREF/IPD UK Property Fund Index – All Balanced Fund Index was not available.
N/A Comparable ServicesAt the time of the assessment there were no comparable Fidelity funds or segregated mandates for individual clients.
n Classes of UnitsThere are no cheaper share classes, with similar rights and services, to the one you are in.
Important legal information
This document is for information purposes only and is not intended to promote, offer, or solicit the purchase of any fund referenced. It is not intended as and should not be considered, or relied upon, as investment advice. This material must not be reproduced or circulated without prior permission. Past performance is not a reliable indicator of future results. Prices of shares can go down as well as up and investors may not get back the amount originally invested. Source of fund performance and volatility and risk measures is Morningstar. Performance Basis: bid-bid with income reinvested, in GBP, net of fees. Peer Group data is sourced from Morningstar. Source of fund performance and volatility and risk measures is Morningstar. Performance Basis: bid-bid with income reinvested, in GBP, net of fees. For our index range, to be able to provide an accurate tracking error, we have used the Performance NAV (PNAV), which enables calculation of how a fund would have hypothetically performed if its valuation point had been aligned with the index.
Fidelity International refers to the group of companies which form the global investment management organisation that provides information on products and services in designated jurisdictions outside of North America. Unless otherwise stated all views expressed are those of Fidelity International. FIL Limited assets and resources as at 30/06/2021 - data is unaudited. Research professionals include both analysts and associates.
The latest fund factsheets and key investor documents are available in English and can be obtained from our website at www.fidelityinternational.com. The relevant Prospectuses may also be obtained from Fidelity. Please note the assets of Fidelity International Real Estate Fund – UK Real Estate Fund were transferred into the Fidelity UK Real Estate Fund with effect from the 1st of October 2016. Any performance track record quoted may therefore reflect both Funds.
The FTSE All-Share Index is calculated by FTSE International Limited. FTSE International Limited does not sponsor, endorse or promote this product. All copyright in the index values and constituent list vests in FTSE International Limited. Fidelity has obtained full licence from FTSE International Limited to use such copyright in the creation of this product. FTSE® and Footsie® are trademarks jointly owned by the London Stock Exchange Plc and The Financial Times Limited and are used by FTSE International Limited under licence. All-Share™ is a trade mark of FTSE International Limited. S&P® and S&P 500® are registered trademarks of Standard & Poor’s Financial Services LLC (S&P) and Dow Jones® is a registered trademark of Dow Jones Trademark Holdings LLC (Dow Jones). These trademarks have been licensed for use by S&P Dow Jones Indices LLC (SPDJI) and, in some cases, sublicensed to FIL Investment Management Limited (FIL). The S&P 500® NUK (the Index) is a product of SPDJI and/or affiliates and has been licensed for use by FIL. The Fund is not sponsored, endorsed, sold or promoted by SPDJI, Dow Jones, S&P, their respective affiliates or their third party licensors (collectively SPDJI Entities) and SPDJI Entities make no representation regarding the advisability of investing in such products. NUK means Net Total Return (WHT 15%). NUK is a customised index variant, designed and maintained by S&P, which aligns more closely with this fund’s withholding tax treatment. The funds described herein are indexed to an MSCI index. The funds or securities referred to herein are not sponsored, endorsed, or promoted by MSCI, and MSCI bears no liability with respect to any such funds or securities or any index on which the funds or securities are based. The Prospectus contains a more detailed description of the limited relationship MSCI has with Fidelity and any related funds.
Data Source - © 2021 Morningstar, Inc. All Rights Reserved. The information contained herein:
(1) is proprietary to Morningstar and/or its content providers;
(2) may not be copied or distributed; and
(3) is not warranted to be accurate, complete or timely. Neither Morningstar nor its content providers are responsible for any damages or losses arising from any use of this information.
Fidelity, Fidelity International, the Fidelity International logo and F symbol are registered trademarks of FIL Limited.
Issued by FIL Investment Services (UK) Limited, a firm authorised and regulated by the Financial Conduct Authority. Registered offices at Beech Gate, Millfield Lane, Lower Kingswood, Tadworth, Surrey, KT20 6RP.
44 Fidelity Value Assessment Report 2021