Embed Size (px)
Citation preview
This is a regular publication looking at Fidelity and recent developments in three of its investment trusts – Fidelity Asian Values, Fidelity Japanese Values and Fidelity Special Values.
In this issue:
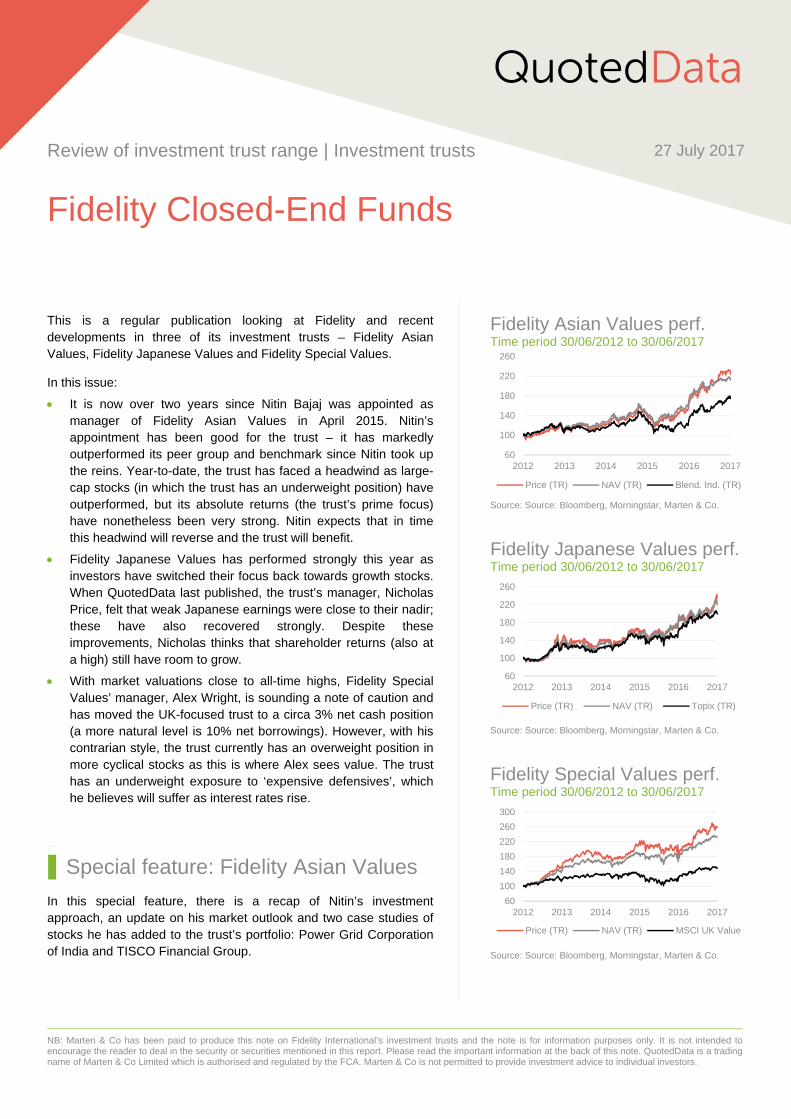
It is now over two years since Nitin Bajaj was appointed as manager of Fidelity Asian Values in April 2015. Nitin’s appointment has been good for the trust – it has markedly outperformed its peer group and benchmark since Nitin took up the reins. Year-to-date, the trust has faced a headwind as large-cap stocks (in which the trust has an underweight position) have outperformed, but its absolute returns (the trust’s prime focus) have nonetheless been very strong. Nitin expects that in time this headwind will reverse and the trust will benefit.
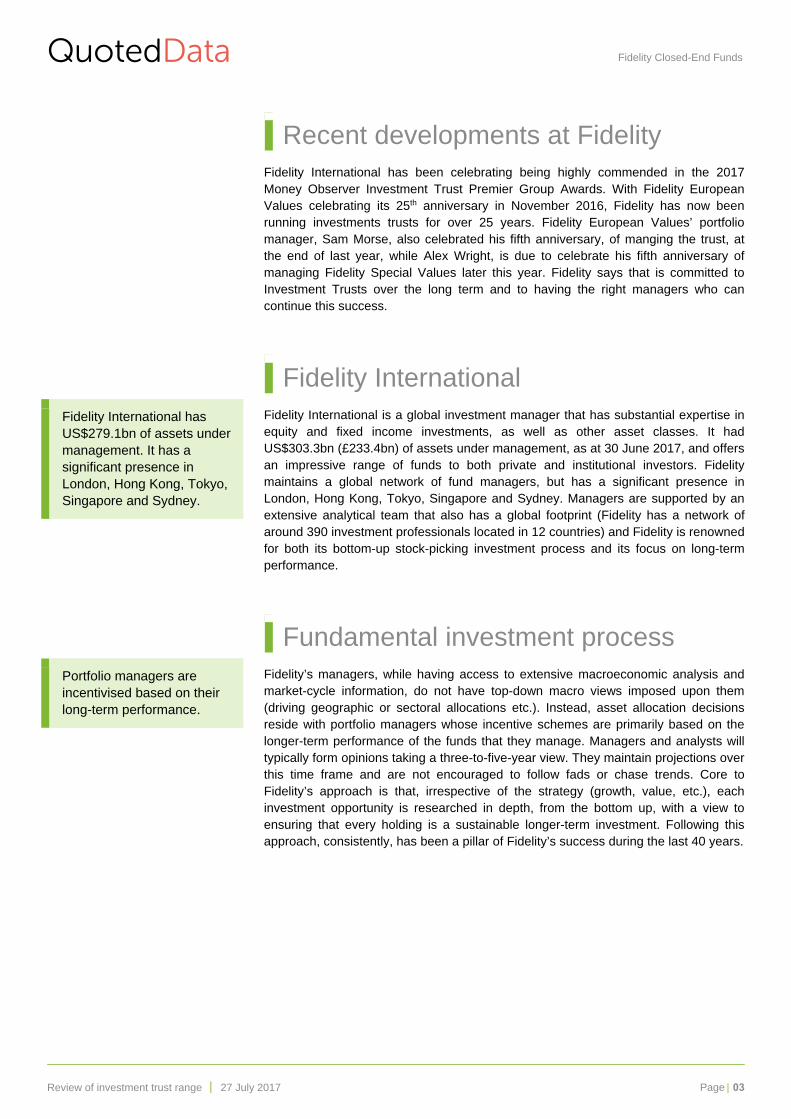
Fidelity Japanese Values has performed strongly this year as investors have switched their focus back towards growth stocks. When QuotedData last published, the trust’s manager, Nicholas Price, felt that weak Japanese earnings were close to their nadir; these have also recovered strongly. Despite these improvements, Nicholas thinks that shareholder returns (also at a high) still have room to grow.
With market valuations close to all-time highs, Fidelity Special Values’ manager, Alex Wright, is sounding a note of caution and has moved the UK-focused trust to a circa 3% net cash position (a more natural level is 10% net borrowings). However, with his contrarian style, the trust currently has an overweight position in more cyclical stocks as this is where Alex sees value. The trust has an underweight exposure to ‘expensive defensives’, which he believes will suffer as interest rates rise.
Special feature: Fidelity Asian Values
In this special feature, there is a recap of Nitin’s investment approach, an update on his market outlook and two case studies of stocks he has added to the trust’s portfolio: Power Grid Corporation of India and TISCO Financial Group.
QuotedData
Review of investment trust range | Investment trusts 27 July 2017
Fidelity Closed-End Funds
NB: Marten & Co has been paid to produce this note on Fidelity International’s investment trusts and the note is for information purposes only. It is not intended toencourage the reader to deal in the security or securities mentioned in this report. Please read the important information at the back of this note. QuotedData is a trading name of Marten & Co Limited which is authorised and regulated by the FCA. Marten & Co is not permitted to provide investment advice to individual investors.
Fidelity Asian Values perf. Time period 30/06/2012 to 30/06/2017
Source: Source: Bloomberg, Morningstar, Marten & Co.
Fidelity Japanese Values perf.Time period 30/06/2012 to 30/06/2017
Source: Source: Bloomberg, Morningstar, Marten & Co.
Fidelity Special Values perf. Time period 30/06/2012 to 30/06/2017
Source: Source: Bloomberg, Morningstar, Marten & Co.
60
100
140
180
220
260
2012 2013 2014 2015 2016 2017
Price (TR) NAV (TR) Blend. Ind. (TR)
60
100
140
180
220
260
2012 2013 2014 2015 2016 2017
Price (TR) NAV (TR) Topix (TR)
60
100
140
180
220
260
300
2012 2013 2014 2015 2016 2017
Price (TR) NAV (TR) MSCI UK Value

QuotedData Fidelity Closed-End Funds
Review of investment trust range │ 27 July 2017 Page 02
Contents 3 Recent developments at Fidelity
3 Fidelity International
3 Fundamental investment process
4 Previous research publications
5 Fidelity Asian Values
5 Two years on and all is well
5 Long-term growth from small-cap Asia ex Japan
6 Asset allocation
7 Performance
9 Fidelity Japanese Values
9 Reasons to be cheerful
9 Long-term growth from Japanese-listed equities
10 Despite challenges, Japanese corporates continue to prosper
10 Asset allocation
11 Performance
13 Fidelity Special Values
13 Sounding a note of caution
13 UK-focused special situations
14 Bifurcated markets are a headwind for the value investor
14 The Trump reflation trade has reversed this year
14 The Current environment remains challenging for the value investor
14 Asset allocation
16 Performance
17 Special feature: Fidelity Asian Values
17 Nitin Bajaj
17 Investment approach – smaller companies with a value bias
18 Manager’s outlook
19 Power Grid Corporation – a case study
20 TISCO Financial Group – a case study
QuotedData Fidelity Closed-End Funds
Review of investment trust range │ 27 July 2017 Page 03
Recent developments at Fidelity Fidelity International has been celebrating being highly commended in the 2017 Money Observer Investment Trust Premier Group Awards. With Fidelity European Values celebrating its 25th anniversary in November 2016, Fidelity has now been running investments trusts for over 25 years. Fidelity European Values’ portfolio manager, Sam Morse, also celebrated his fifth anniversary, of manging the trust, at the end of last year, while Alex Wright, is due to celebrate his fifth anniversary of managing Fidelity Special Values later this year. Fidelity says that is committed to Investment Trusts over the long term and to having the right managers who can continue this success.
Fidelity International Fidelity International is a global investment manager that has substantial expertise in equity and fixed income investments, as well as other asset classes. It had US$303.3bn (£233.4bn) of assets under management, as at 30 June 2017, and offers an impressive range of funds to both private and institutional investors. Fidelity maintains a global network of fund managers, but has a significant presence in London, Hong Kong, Tokyo, Singapore and Sydney. Managers are supported by an extensive analytical team that also has a global footprint (Fidelity has a network of around 390 investment professionals located in 12 countries) and Fidelity is renowned for both its bottom-up stock-picking investment process and its focus on long-term performance.
Fundamental investment process Fidelity’s managers, while having access to extensive macroeconomic analysis and market-cycle information, do not have top-down macro views imposed upon them (driving geographic or sectoral allocations etc.). Instead, asset allocation decisions reside with portfolio managers whose incentive schemes are primarily based on the longer-term performance of the funds that they manage. Managers and analysts will typically form opinions taking a three-to-five-year view. They maintain projections over this time frame and are not encouraged to follow fads or chase trends. Core to Fidelity’s approach is that, irrespective of the strategy (growth, value, etc.), each investment opportunity is researched in depth, from the bottom up, with a view to ensuring that every holding is a sustainable longer-term investment. Following this approach, consistently, has been a pillar of Fidelity’s success during the last 40 years.
Fidelity International has US$279.1bn of assets under management. It has a significant presence in London, Hong Kong, Tokyo, Singapore and Sydney.
Portfolio managers are incentivised based on their long-term performance.

QuotedData Fidelity Closed-End Funds
Review of investment trust range │ 27 July 2017 Page 04
Previous research publications Readers interested in further information about Fidelity Asian Values, Fidelity Japanese Values and Fidelity Special Values may wish to read QuotedData’s previous reviews of Fidelity’s closed-end funds range, as detailed in Figure 1. You can read the notes by clicking on them in Figure 1 or by visiting www.quoteddata.com.
Figure 1: Marten & Co. previously published research on Fidelity’s investment trusts
Date Company profiles Special feature
15 October 2015 FAS, FJV, FSV FAS
20 May 2016 FAS, FJV, FSV FJV
2 February 2017 FAS, FJV, FSV FSV
Source: Marten & Co.
234567891011121314
Additional information is available at the fund manager’s website, https://www.fidelity.co.uk/ investor/investment-trusts.page
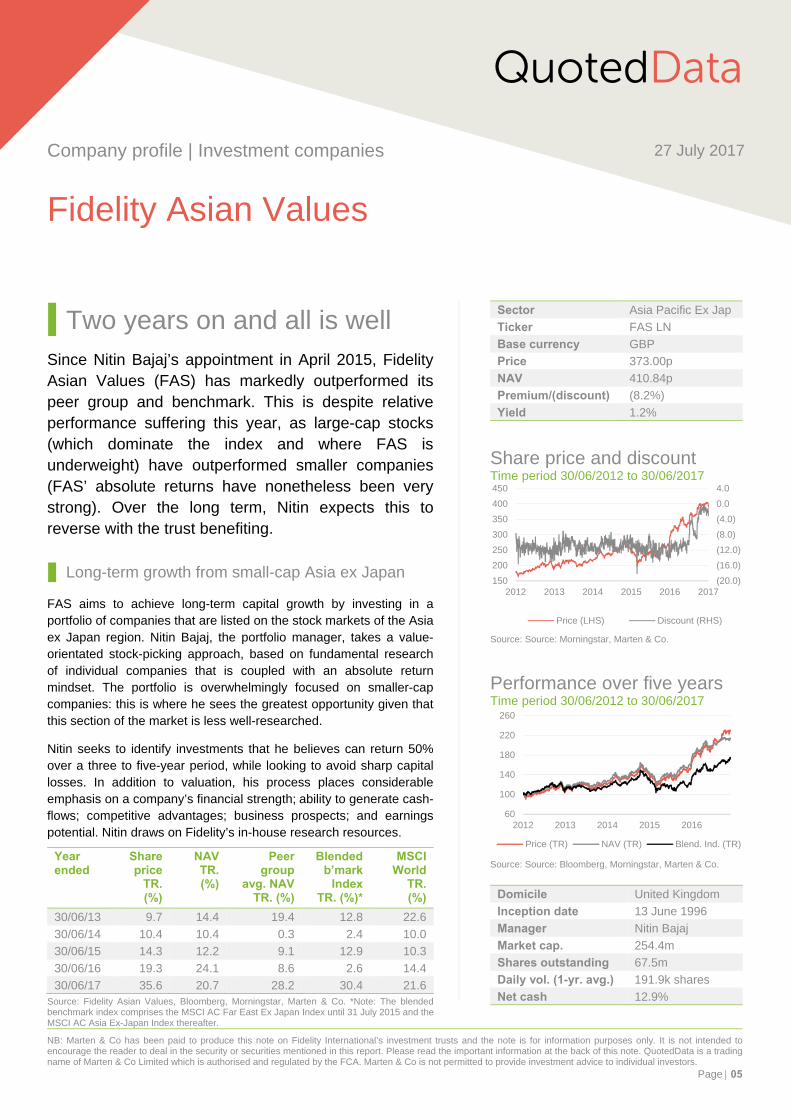
Two years on and all is well Since Nitin Bajaj’s appointment in April 2015, Fidelity Asian Values (FAS) has markedly outperformed its peer group and benchmark. This is despite relative performance suffering this year, as large-cap stocks (which dominate the index and where FAS is underweight) have outperformed smaller companies (FAS’ absolute returns have nonetheless been very strong). Over the long term, Nitin expects this to reverse with the trust benefiting.
Long-term growth from small-cap Asia ex Japan
FAS aims to achieve long-term capital growth by investing in a portfolio of companies that are listed on the stock markets of the Asia ex Japan region. Nitin Bajaj, the portfolio manager, takes a value-orientated stock-picking approach, based on fundamental research of individual companies that is coupled with an absolute return mindset. The portfolio is overwhelmingly focused on smaller-cap companies: this is where he sees the greatest opportunity given that this section of the market is less well-researched.
Nitin seeks to identify investments that he believes can return 50% over a three to five-year period, while looking to avoid sharp capital losses. In addition to valuation, his process places considerable emphasis on a company’s financial strength; ability to generate cash-flows; competitive advantages; business prospects; and earnings potential. Nitin draws on Fidelity’s in-house research resources.
Year ended
Share price
TR. (%)
NAV TR. (%)
Peer group
avg. NAV TR. (%)
Blended b’mark
Index TR. (%)*
MSCI World
TR.(%)
30/06/13 9.7 14.4 19.4 12.8 22.6
30/06/14 10.4 10.4 0.3 2.4 10.0
30/06/15 14.3 12.2 9.1 12.9 10.3
30/06/16 19.3 24.1 8.6 2.6 14.4
30/06/17 35.6 20.7 28.2 30.4 21.6 Source: Fidelity Asian Values, Bloomberg, Morningstar, Marten & Co. *Note: The blended benchmark index comprises the MSCI AC Far East Ex Japan Index until 31 July 2015 and the MSCI AC Asia Ex-Japan Index thereafter.
QuotedData
Company profile | Investment companies 27 July 2017
Fidelity Asian Values
NB: Marten & Co has been paid to produce this note on Fidelity International’s investment trusts and the note is for information purposes only. It is not intended toencourage the reader to deal in the security or securities mentioned in this report. Please read the important information at the back of this note. QuotedData is a tradingname of Marten & Co Limited which is authorised and regulated by the FCA. Marten & Co is not permitted to provide investment advice to individual investors.1
Page 05
Sector Asia Pacific Ex Jap
Ticker FAS LN
Base currency GBP
Price 373.00p
NAV 410.84p
Premium/(discount) (8.2%)
Yield 1.2%
Share price and discount Time period 30/06/2012 to 30/06/2017
Source: Source: Morningstar, Marten & Co.
Performance over five years Time period 30/06/2012 to 30/06/2017
Source: Source: Bloomberg, Morningstar, Marten & Co.
Domicile United Kingdom
Inception date 13 June 1996
Manager Nitin Bajaj
Market cap. 254.4m
Shares outstanding 67.5m
Daily vol. (1-yr. avg.) 191.9k shares
Net cash 12.9%
(20.0)
(16.0)
(12.0)
(8.0)
(4.0)
0.0
4.0
150
200
250
300
350
400
450
2012 2013 2014 2015 2016 2017
Price (LHS) Discount (RHS)
60
100
140
180
220
260
2012 2013 2014 2015 2016
Price (TR) NAV (TR) Blend. Ind. (TR)
QuotedData Fidelity Asian Values
Company profile │ 27 July 2017 Page 06
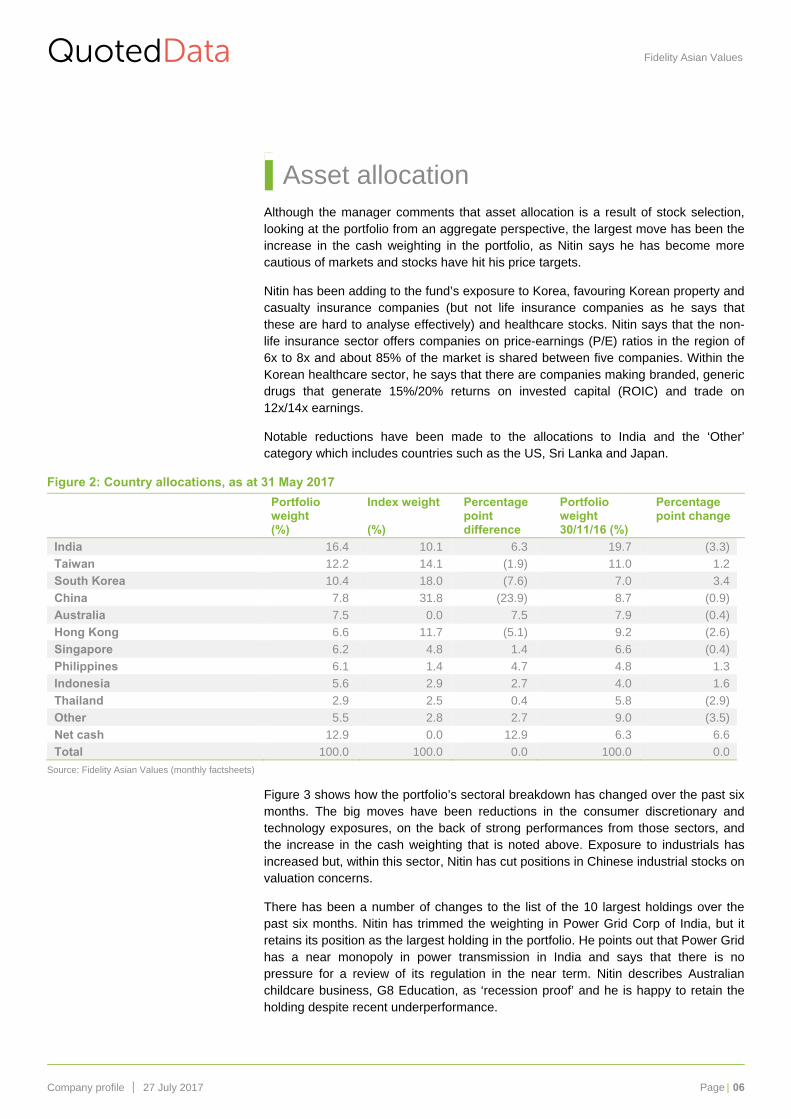
Asset allocation Although the manager comments that asset allocation is a result of stock selection, looking at the portfolio from an aggregate perspective, the largest move has been the increase in the cash weighting in the portfolio, as Nitin says he has become more cautious of markets and stocks have hit his price targets.
Nitin has been adding to the fund’s exposure to Korea, favouring Korean property and casualty insurance companies (but not life insurance companies as he says that these are hard to analyse effectively) and healthcare stocks. Nitin says that the non-life insurance sector offers companies on price-earnings (P/E) ratios in the region of 6x to 8x and about 85% of the market is shared between five companies. Within the Korean healthcare sector, he says that there are companies making branded, generic drugs that generate 15%/20% returns on invested capital (ROIC) and trade on 12x/14x earnings.
Notable reductions have been made to the allocations to India and the ‘Other’ category which includes countries such as the US, Sri Lanka and Japan.
Figure 2: Country allocations, as at 31 May 2017
Portfolio weight (%)
Index weight (%)
Percentage point difference
Portfolio weight 30/11/16 (%)
Percentage point change
India 16.4 10.1 6.3 19.7 (3.3)
Taiwan 12.2 14.1 (1.9) 11.0 1.2
South Korea 10.4 18.0 (7.6) 7.0 3.4
China 7.8 31.8 (23.9) 8.7 (0.9)
Australia 7.5 0.0 7.5 7.9 (0.4)
Hong Kong 6.6 11.7 (5.1) 9.2 (2.6)
Singapore 6.2 4.8 1.4 6.6 (0.4)
Philippines 6.1 1.4 4.7 4.8 1.3
Indonesia 5.6 2.9 2.7 4.0 1.6
Thailand 2.9 2.5 0.4 5.8 (2.9)
Other 5.5 2.8 2.7 9.0 (3.5)
Net cash 12.9 0.0 12.9 6.3 6.6
Total 100.0 100.0 0.0 100.0 0.0
Source: Fidelity Asian Values (monthly factsheets)
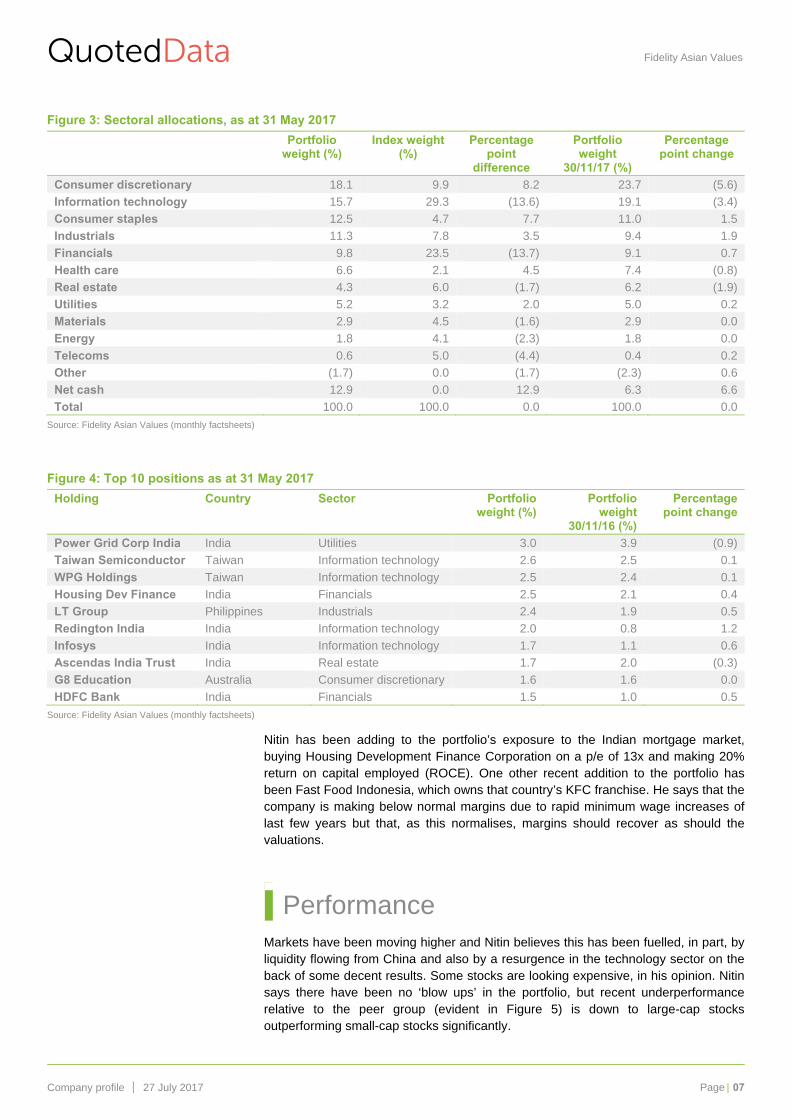
Figure 3 shows how the portfolio’s sectoral breakdown has changed over the past six months. The big moves have been reductions in the consumer discretionary and technology exposures, on the back of strong performances from those sectors, and the increase in the cash weighting that is noted above. Exposure to industrials has increased but, within this sector, Nitin has cut positions in Chinese industrial stocks on valuation concerns.
There has been a number of changes to the list of the 10 largest holdings over the past six months. Nitin has trimmed the weighting in Power Grid Corp of India, but it retains its position as the largest holding in the portfolio. He points out that Power Grid has a near monopoly in power transmission in India and says that there is no pressure for a review of its regulation in the near term. Nitin describes Australian childcare business, G8 Education, as ‘recession proof’ and he is happy to retain the holding despite recent underperformance.
QuotedData Fidelity Asian Values
Company profile │ 27 July 2017 Page 07
Figure 3: Sectoral allocations, as at 31 May 2017
Portfolio weight (%)
Index weight (%)
Percentage point
difference
Portfolio weight
30/11/17 (%)
Percentage point change
Consumer discretionary 18.1 9.9 8.2 23.7 (5.6)
Information technology 15.7 29.3 (13.6) 19.1 (3.4)
Consumer staples 12.5 4.7 7.7 11.0 1.5
Industrials 11.3 7.8 3.5 9.4 1.9
Financials 9.8 23.5 (13.7) 9.1 0.7
Health care 6.6 2.1 4.5 7.4 (0.8)
Real estate 4.3 6.0 (1.7) 6.2 (1.9)
Utilities 5.2 3.2 2.0 5.0 0.2
Materials 2.9 4.5 (1.6) 2.9 0.0
Energy 1.8 4.1 (2.3) 1.8 0.0
Telecoms 0.6 5.0 (4.4) 0.4 0.2
Other (1.7) 0.0 (1.7) (2.3) 0.6
Net cash 12.9 0.0 12.9 6.3 6.6
Total 100.0 100.0 0.0 100.0 0.0
Source: Fidelity Asian Values (monthly factsheets)
Figure 4: Top 10 positions as at 31 May 2017
Holding Country Sector Portfolio weight (%)
Portfolio weight
30/11/16 (%)
Percentage point change
Power Grid Corp India India Utilities 3.0 3.9 (0.9)
Taiwan Semiconductor Taiwan Information technology 2.6 2.5 0.1
WPG Holdings Taiwan Information technology 2.5 2.4 0.1
Housing Dev Finance India Financials 2.5 2.1 0.4
LT Group Philippines Industrials 2.4 1.9 0.5
Redington India India Information technology 2.0 0.8 1.2
Infosys India Information technology 1.7 1.1 0.6
Ascendas India Trust India Real estate 1.7 2.0 (0.3)
G8 Education Australia Consumer discretionary 1.6 1.6 0.0
HDFC Bank India Financials 1.5 1.0 0.5
Source: Fidelity Asian Values (monthly factsheets)
Nitin has been adding to the portfolio’s exposure to the Indian mortgage market, buying Housing Development Finance Corporation on a p/e of 13x and making 20% return on capital employed (ROCE). One other recent addition to the portfolio has been Fast Food Indonesia, which owns that country’s KFC franchise. He says that the company is making below normal margins due to rapid minimum wage increases of last few years but that, as this normalises, margins should recover as should the valuations.
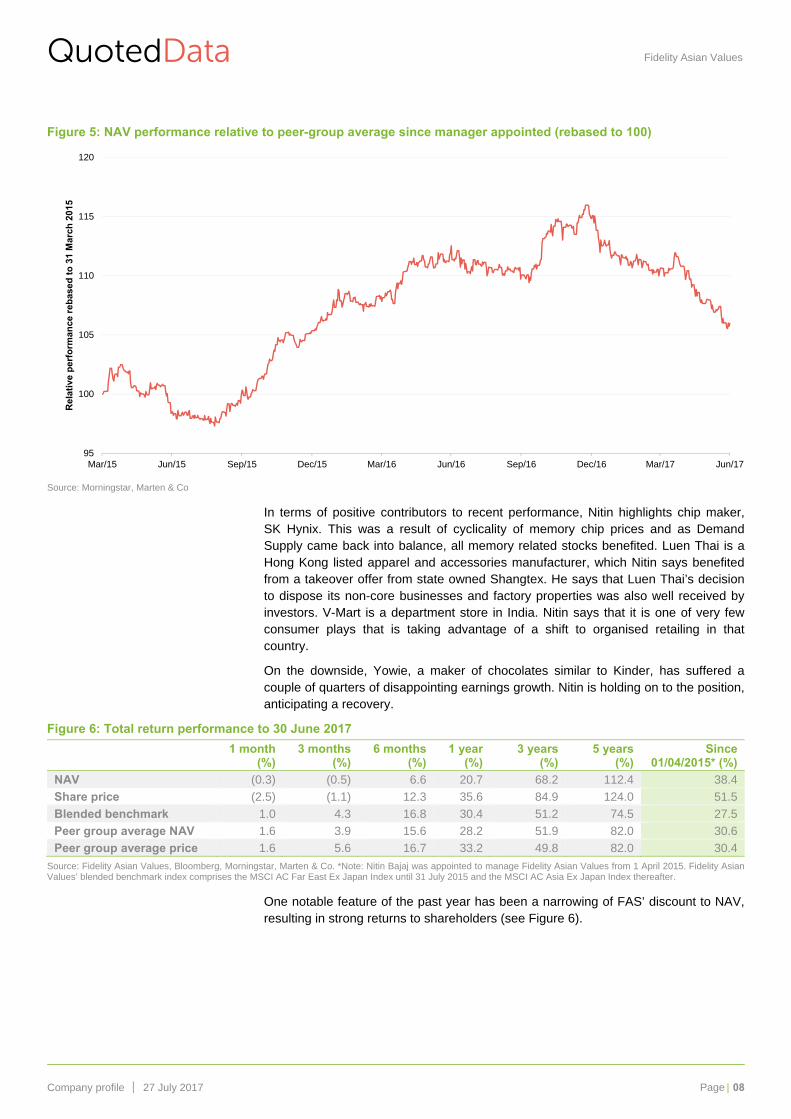
Performance Markets have been moving higher and Nitin believes this has been fuelled, in part, by liquidity flowing from China and also by a resurgence in the technology sector on the back of some decent results. Some stocks are looking expensive, in his opinion. Nitin says there have been no ‘blow ups’ in the portfolio, but recent underperformance relative to the peer group (evident in Figure 5) is down to large-cap stocks outperforming small-cap stocks significantly.
QuotedData Fidelity Asian Values
Company profile │ 27 July 2017 Page 08
Figure 5: NAV performance relative to peer-group average since manager appointed (rebased to 100)
Source: Morningstar, Marten & Co
In terms of positive contributors to recent performance, Nitin highlights chip maker, SK Hynix. This was a result of cyclicality of memory chip prices and as Demand Supply came back into balance, all memory related stocks benefited. Luen Thai is a Hong Kong listed apparel and accessories manufacturer, which Nitin says benefited from a takeover offer from state owned Shangtex. He says that Luen Thai’s decision to dispose its non-core businesses and factory properties was also well received by investors. V-Mart is a department store in India. Nitin says that it is one of very few consumer plays that is taking advantage of a shift to organised retailing in that country.
On the downside, Yowie, a maker of chocolates similar to Kinder, has suffered a couple of quarters of disappointing earnings growth. Nitin is holding on to the position, anticipating a recovery.
Figure 6: Total return performance to 30 June 2017
1 month (%)
3 months (%)
6 months (%)
1 year (%)
3 years (%)
5 years (%)
Since 01/04/2015* (%)
NAV (0.3) (0.5) 6.6 20.7 68.2 112.4 38.4
Share price (2.5) (1.1) 12.3 35.6 84.9 124.0 51.5
Blended benchmark 1.0 4.3 16.8 30.4 51.2 74.5 27.5
Peer group average NAV 1.6 3.9 15.6 28.2 51.9 82.0 30.6
Peer group average price 1.6 5.6 16.7 33.2 49.8 82.0 30.4
Source: Fidelity Asian Values, Bloomberg, Morningstar, Marten & Co. *Note: Nitin Bajaj was appointed to manage Fidelity Asian Values from 1 April 2015. Fidelity Asian Values’ blended benchmark index comprises the MSCI AC Far East Ex Japan Index until 31 July 2015 and the MSCI AC Asia Ex Japan Index thereafter.
One notable feature of the past year has been a narrowing of FAS’ discount to NAV, resulting in strong returns to shareholders (see Figure 6).
95
100
105
110
115
120
Mar/15 Jun/15 Sep/15 Dec/15 Mar/16 Jun/16 Sep/16 Dec/16 Mar/17 Jun/17
Rel
ativ
e p
erfo
rman
ce r
ebas
ed t
o 3
1 M
arch
201
5
NB: Marten & Co has been paid to produce this note on Fidelity International’s investment trusts and the note is for information purposes only. It is not intended to encourage the reader to deal in the security or securities mentioned in this report. Please read the important information at the back of this note. QuotedData is a trading name of Marten & Co Limited which is authorised and regulated by the FCA. Marten & Co is not permitted to provide investment advice to individual investors.
Page 09
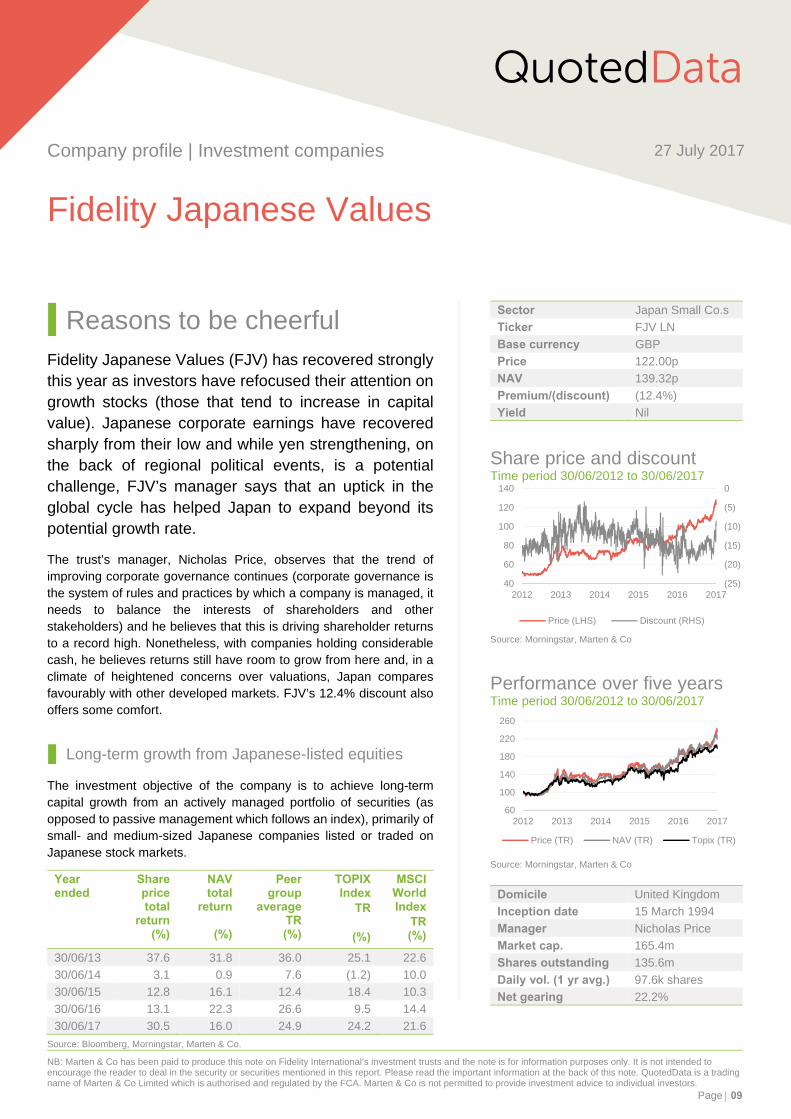
Reasons to be cheerful Fidelity Japanese Values (FJV) has recovered strongly this year as investors have refocused their attention on growth stocks (those that tend to increase in capital value). Japanese corporate earnings have recovered sharply from their low and while yen strengthening, on the back of regional political events, is a potential challenge, FJV’s manager says that an uptick in the global cycle has helped Japan to expand beyond its potential growth rate.
The trust’s manager, Nicholas Price, observes that the trend of improving corporate governance continues (corporate governance is the system of rules and practices by which a company is managed, it needs to balance the interests of shareholders and other stakeholders) and he believes that this is driving shareholder returns to a record high. Nonetheless, with companies holding considerable cash, he believes returns still have room to grow from here and, in a climate of heightened concerns over valuations, Japan compares favourably with other developed markets. FJV’s 12.4% discount also offers some comfort.
Long-term growth from Japanese-listed equities
The investment objective of the company is to achieve long-term capital growth from an actively managed portfolio of securities (as opposed to passive management which follows an index), primarily of small- and medium-sized Japanese companies listed or traded on Japanese stock markets.
Year ended
Share price total
return (%)
NAV total
return
(%)
Peer group
average TR (%)
TOPIX Index
TR
(%)
MSCI World Index
TR(%)
30/06/13 37.6 31.8 36.0 25.1 22.6
30/06/14 3.1 0.9 7.6 (1.2) 10.0
30/06/15 12.8 16.1 12.4 18.4 10.3
30/06/16 13.1 22.3 26.6 9.5 14.4
30/06/17 30.5 16.0 24.9 24.2 21.6
Source: Bloomberg, Morningstar, Marten & Co. 123456
QuotedData
Company profile | Investment companies 27 July 2017
Fidelity Japanese Values
Sector Japan Small Co.s
Ticker FJV LN
Base currency GBP
Price 122.00p
NAV 139.32p
Premium/(discount) (12.4%)
Yield Nil
Share price and discount Time period 30/06/2012 to 30/06/2017
Source: Morningstar, Marten & Co
Performance over five years Time period 30/06/2012 to 30/06/2017
Source: Morningstar, Marten & Co
Domicile United Kingdom
Inception date 15 March 1994
Manager Nicholas Price
Market cap. 165.4m
Shares outstanding 135.6m
Daily vol. (1 yr avg.) 97.6k shares
Net gearing 22.2%
(25)
(20)
(15)
(10)
(5)
0
40
60
80
100
120
140
2012 2013 2014 2015 2016 2017
Price (LHS) Discount (RHS)
60
100
140
180
220
260
2012 2013 2014 2015 2016 2017
Price (TR) NAV (TR) Topix (TR)
QuotedData Fidelity Japanese Values
Company profile │ 27 July 2017 Page 10
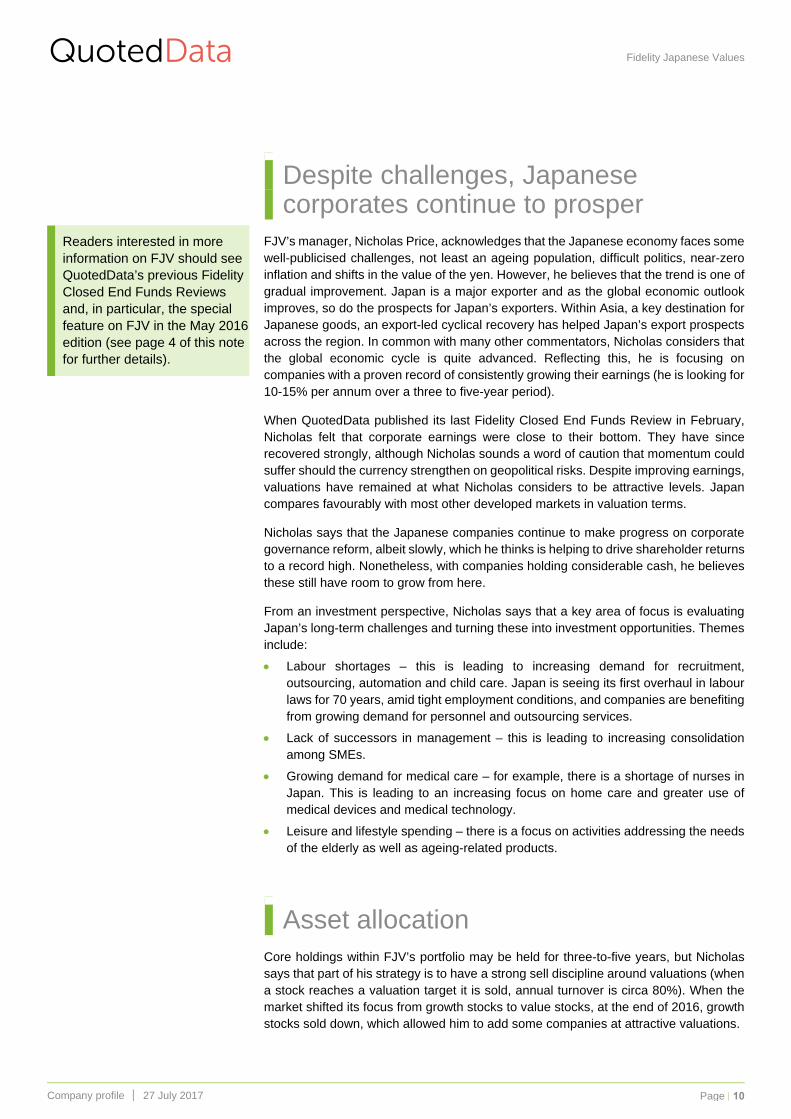
Despite challenges, Japanese corporates continue to prosper
FJV’s manager, Nicholas Price, acknowledges that the Japanese economy faces some well-publicised challenges, not least an ageing population, difficult politics, near-zero inflation and shifts in the value of the yen. However, he believes that the trend is one of gradual improvement. Japan is a major exporter and as the global economic outlook improves, so do the prospects for Japan’s exporters. Within Asia, a key destination for Japanese goods, an export-led cyclical recovery has helped Japan’s export prospects across the region. In common with many other commentators, Nicholas considers that the global economic cycle is quite advanced. Reflecting this, he is focusing on companies with a proven record of consistently growing their earnings (he is looking for 10-15% per annum over a three to five-year period).
When QuotedData published its last Fidelity Closed End Funds Review in February, Nicholas felt that corporate earnings were close to their bottom. They have since recovered strongly, although Nicholas sounds a word of caution that momentum could suffer should the currency strengthen on geopolitical risks. Despite improving earnings, valuations have remained at what Nicholas considers to be attractive levels. Japan compares favourably with most other developed markets in valuation terms.
Nicholas says that the Japanese companies continue to make progress on corporate governance reform, albeit slowly, which he thinks is helping to drive shareholder returns to a record high. Nonetheless, with companies holding considerable cash, he believes these still have room to grow from here.
From an investment perspective, Nicholas says that a key area of focus is evaluating Japan’s long-term challenges and turning these into investment opportunities. Themes include:
Labour shortages – this is leading to increasing demand for recruitment, outsourcing, automation and child care. Japan is seeing its first overhaul in labour laws for 70 years, amid tight employment conditions, and companies are benefiting from growing demand for personnel and outsourcing services.
Lack of successors in management – this is leading to increasing consolidation among SMEs.
Growing demand for medical care – for example, there is a shortage of nurses in Japan. This is leading to an increasing focus on home care and greater use of medical devices and medical technology.
Leisure and lifestyle spending – there is a focus on activities addressing the needs of the elderly as well as ageing-related products.
Asset allocation Core holdings within FJV’s portfolio may be held for three-to-five years, but Nicholas says that part of his strategy is to have a strong sell discipline around valuations (when a stock reaches a valuation target it is sold, annual turnover is circa 80%). When the market shifted its focus from growth stocks to value stocks, at the end of 2016, growth stocks sold down, which allowed him to add some companies at attractive valuations.
Readers interested in more information on FJV should see QuotedData’s previous Fidelity Closed End Funds Reviews and, in particular, the special feature on FJV in the May 2016 edition (see page 4 of this note for further details).
QuotedData Fidelity Japanese Values
Company profile │ 27 July 2017 Page 11
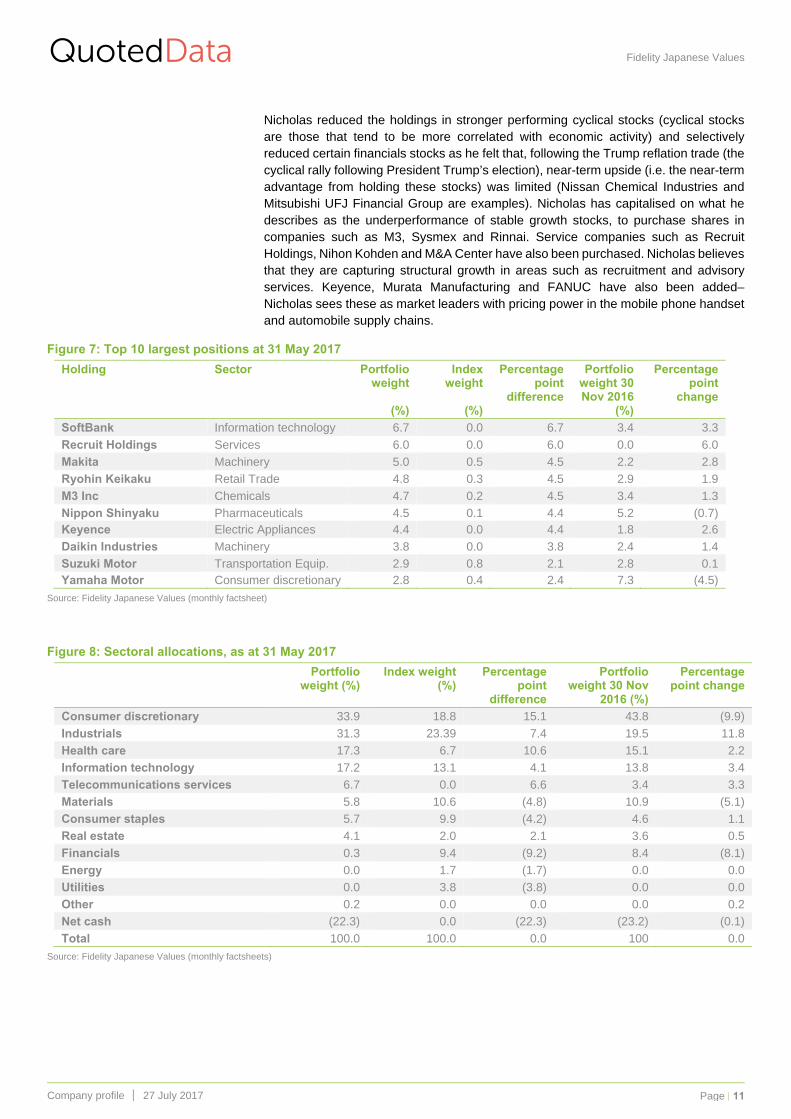
Nicholas reduced the holdings in stronger performing cyclical stocks (cyclical stocks are those that tend to be more correlated with economic activity) and selectively reduced certain financials stocks as he felt that, following the Trump reflation trade (the cyclical rally following President Trump’s election), near-term upside (i.e. the near-term advantage from holding these stocks) was limited (Nissan Chemical Industries and Mitsubishi UFJ Financial Group are examples). Nicholas has capitalised on what he describes as the underperformance of stable growth stocks, to purchase shares in companies such as M3, Sysmex and Rinnai. Service companies such as Recruit Holdings, Nihon Kohden and M&A Center have also been purchased. Nicholas believes that they are capturing structural growth in areas such as recruitment and advisory services. Keyence, Murata Manufacturing and FANUC have also been added– Nicholas sees these as market leaders with pricing power in the mobile phone handset and automobile supply chains.
Figure 7: Top 10 largest positions at 31 May 2017
Holding Sector Portfolio weight
(%)
Index weight
(%)
Percentage point
difference
Portfolio weight 30 Nov 2016
(%)
Percentage point
change
SoftBank Information technology 6.7 0.0 6.7 3.4 3.3
Recruit Holdings Services 6.0 0.0 6.0 0.0 6.0
Makita Machinery 5.0 0.5 4.5 2.2 2.8
Ryohin Keikaku Retail Trade 4.8 0.3 4.5 2.9 1.9
M3 Inc Chemicals 4.7 0.2 4.5 3.4 1.3
Nippon Shinyaku Pharmaceuticals 4.5 0.1 4.4 5.2 (0.7) Keyence Electric Appliances 4.4 0.0 4.4 1.8 2.6
Daikin Industries Machinery 3.8 0.0 3.8 2.4 1.4
Suzuki Motor Transportation Equip. 2.9 0.8 2.1 2.8 0.1 Yamaha Motor Consumer discretionary 2.8 0.4 2.4 7.3 (4.5)
Source: Fidelity Japanese Values (monthly factsheet)
Figure 8: Sectoral allocations, as at 31 May 2017
Portfolio weight (%)
Index weight (%)
Percentage point
difference
Portfolio weight 30 Nov
2016 (%)
Percentage point change
Consumer discretionary 33.9 18.8 15.1 43.8 (9.9)
Industrials 31.3 23.39 7.4 19.5 11.8
Health care 17.3 6.7 10.6 15.1 2.2
Information technology 17.2 13.1 4.1 13.8 3.4
Telecommunications services 6.7 0.0 6.6 3.4 3.3
Materials 5.8 10.6 (4.8) 10.9 (5.1)
Consumer staples 5.7 9.9 (4.2) 4.6 1.1
Real estate 4.1 2.0 2.1 3.6 0.5
Financials 0.3 9.4 (9.2) 8.4 (8.1)
Energy 0.0 1.7 (1.7) 0.0 0.0
Utilities 0.0 3.8 (3.8) 0.0 0.0
Other 0.2 0.0 0.0 0.0 0.2
Net cash (22.3) 0.0 (22.3) (23.2) (0.1)
Total 100.0 100.0 0.0 100 0.0
Source: Fidelity Japanese Values (monthly factsheets)
QuotedData Fidelity Japanese Values
Company profile │ 27 July 2017 Page 12
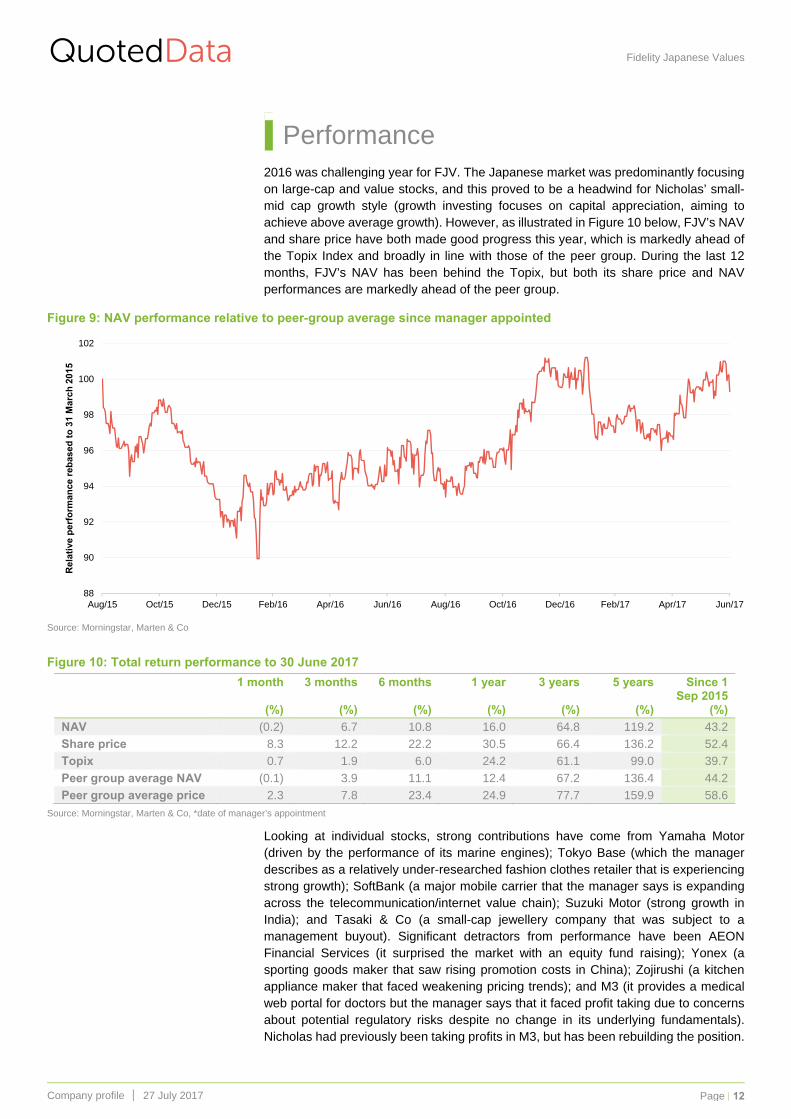
Performance 2016 was challenging year for FJV. The Japanese market was predominantly focusing on large-cap and value stocks, and this proved to be a headwind for Nicholas’ small-mid cap growth style (growth investing focuses on capital appreciation, aiming to achieve above average growth). However, as illustrated in Figure 10 below, FJV’s NAV and share price have both made good progress this year, which is markedly ahead of the Topix Index and broadly in line with those of the peer group. During the last 12 months, FJV’s NAV has been behind the Topix, but both its share price and NAV performances are markedly ahead of the peer group.
Figure 9: NAV performance relative to peer-group average since manager appointed
Source: Morningstar, Marten & Co
Figure 10: Total return performance to 30 June 2017
1 month
(%)
3 months
(%)
6 months
(%)
1 year
(%)
3 years
(%)
5 years
(%)
Since 1 Sep 2015
(%)
NAV (0.2) 6.7 10.8 16.0 64.8 119.2 43.2
Share price 8.3 12.2 22.2 30.5 66.4 136.2 52.4
Topix 0.7 1.9 6.0 24.2 61.1 99.0 39.7
Peer group average NAV (0.1) 3.9 11.1 12.4 67.2 136.4 44.2
Peer group average price 2.3 7.8 23.4 24.9 77.7 159.9 58.6
Source: Morningstar, Marten & Co, *date of manager’s appointment
Looking at individual stocks, strong contributions have come from Yamaha Motor (driven by the performance of its marine engines); Tokyo Base (which the manager describes as a relatively under-researched fashion clothes retailer that is experiencing strong growth); SoftBank (a major mobile carrier that the manager says is expanding across the telecommunication/internet value chain); Suzuki Motor (strong growth in India); and Tasaki & Co (a small-cap jewellery company that was subject to a management buyout). Significant detractors from performance have been AEON Financial Services (it surprised the market with an equity fund raising); Yonex (a sporting goods maker that saw rising promotion costs in China); Zojirushi (a kitchen appliance maker that faced weakening pricing trends); and M3 (it provides a medical web portal for doctors but the manager says that it faced profit taking due to concerns about potential regulatory risks despite no change in its underlying fundamentals). Nicholas had previously been taking profits in M3, but has been rebuilding the position.
88
90
92
94
96
98
100
102
Aug/15 Oct/15 Dec/15 Feb/16 Apr/16 Jun/16 Aug/16 Oct/16 Dec/16 Feb/17 Apr/17 Jun/17
Rel
ativ
e p
erfo
rman
ce r
ebas
ed t
o 3
1 M
arch
201
5
NB: Marten & Co has been paid to produce this note on Fidelity International’s investment trusts and the note is for information purposes only. It is not intended to encourage the reader to deal in the security or securities mentioned in this report. Please read the important information at the back of this note. QuotedData is a trading name of Marten & Co Limited which is authorised and regulated by the FCA. Marten & Co is not permitted to provide investment advice to individual investors.
Page 13
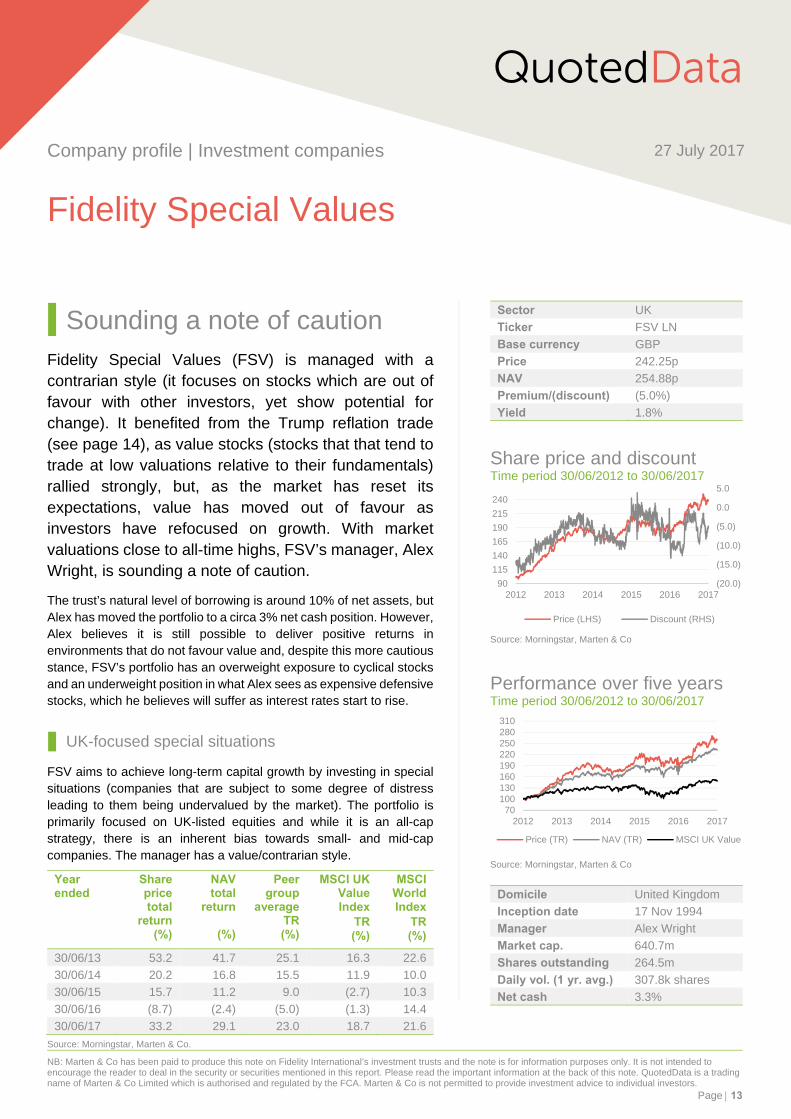
Sounding a note of caution Fidelity Special Values (FSV) is managed with a contrarian style (it focuses on stocks which are out of favour with other investors, yet show potential for change). It benefited from the Trump reflation trade (see page 14), as value stocks (stocks that that tend to trade at low valuations relative to their fundamentals) rallied strongly, but, as the market has reset its expectations, value has moved out of favour as investors have refocused on growth. With market valuations close to all-time highs, FSV’s manager, Alex Wright, is sounding a note of caution.
The trust’s natural level of borrowing is around 10% of net assets, but Alex has moved the portfolio to a circa 3% net cash position. However, Alex believes it is still possible to deliver positive returns in environments that do not favour value and, despite this more cautious stance, FSV’s portfolio has an overweight exposure to cyclical stocks and an underweight position in what Alex sees as expensive defensive stocks, which he believes will suffer as interest rates start to rise.
UK-focused special situations
FSV aims to achieve long-term capital growth by investing in special situations (companies that are subject to some degree of distress leading to them being undervalued by the market). The portfolio is primarily focused on UK-listed equities and while it is an all-cap strategy, there is an inherent bias towards small- and mid-cap companies. The manager has a value/contrarian style.
Year ended
Share price total
return (%)
NAV total
return
(%)
Peer group
average TR (%)
MSCI UK Value Index
TR(%)
MSCI World Index
TR(%)
30/06/13 53.2 41.7 25.1 16.3 22.6
30/06/14 20.2 16.8 15.5 11.9 10.0
30/06/15 15.7 11.2 9.0 (2.7) 10.3
30/06/16 (8.7) (2.4) (5.0) (1.3) 14.4
30/06/17 33.2 29.1 23.0 18.7 21.6
Source: Morningstar, Marten & Co. 12345678910
QuotedData
Company profile | Investment companies 27 July 2017
Fidelity Special Values
Sector UK
Ticker FSV LN
Base currency GBP
Price 242.25p
NAV 254.88p
Premium/(discount) (5.0%)
Yield 1.8%
Share price and discount Time period 30/06/2012 to 30/06/2017
Source: Morningstar, Marten & Co
Performance over five years Time period 30/06/2012 to 30/06/2017
Source: Morningstar, Marten & Co
Domicile United Kingdom
Inception date 17 Nov 1994
Manager Alex Wright
Market cap. 640.7m
Shares outstanding 264.5m
Daily vol. (1 yr. avg.) 307.8k shares
Net cash 3.3%
(20.0)
(15.0)
(10.0)
(5.0)
0.0
5.0
90
115
140
165
190
215
240
2012 2013 2014 2015 2016 2017
Price (LHS) Discount (RHS)
70100130160190220250280310
2012 2013 2014 2015 2016 2017
Price (TR) NAV (TR) MSCI UK Value
QuotedData Fidelity Special Values
Company profile │ 27 July 2017 Page 14
Bifurcated (divided) markets are a headwind for the value investor
As discussed in QuotedData’s February 2017 special feature on FSV, Alex believes that the high levels of liquidity pumped into the financial system, post the financial crisis, has distorted markets, with companies that benefit from a low inflation/low interest-rate environment becoming increasingly expensive (for example tobacco; personal goods; software and computer services; pharma & healthcare; beverages), and given rise to the so-called ‘expensive defensives’. Similarly, those companies that are challenged by this environment have continued to become cheaper (for example mining, oil & gas, financial services, REITS and banks). In a more usual market environment, these anomalies would not be expected to persist for as long as they have, but this lack of mean reversion (the tendency for prices and returns to revert towards their average, or mean’ over time) has made it difficult for the value investor.
The Trump reflation trade has reversed this year
Markets rallied following the election of President Trump last year, with previously cheaper cyclical stocks ‘leading the charge’. However, the idea that value stocks could continue to lead the market has disappointed, as investors have reassessed their expectations of what he will actually be able to deliver. Investors have switched their attention back to growth stocks (for example technology stocks have seen strong outperformance in the US), whereas value stocks have given up most of the previous outperformance year-to-date.
Current environment remains challenging for the value investor
Alex says that the current environment is challenging for the value investor and that, looking at cyclically adjusted valuations, markets look expensive. He says that he is still able to find opportunities, but these are less common than they were three years ago or even a year ago. Alex is not expecting to see a sharp market correction, but he does not think that the progress made during the last couple of years is likely to be repeated. Reflecting the balance of these considerations, gearing has been reduced and the portfolio is now circa 3% net cash (a natural gearing level is circa 10% net borrowings). Despite these challenges, FSV’s portfolio retains its pro-cyclical bias, as this is where Alex is finding value. Similarly, he is avoiding expensive defensives. He thinks that these stocks will suffer if interest rates start to rise. Overall, he thinks it is becoming increasingly important to ensure there is good diversification within the portfolio.
Asset allocation The portfolio retains an overweight exposure to banks (this theme is explained on pages 26 and 27 of QuotedData’s February 2017 review). Construction, also discussed, was an area that Alex was adding to, but this has since been reduced. It performed well in the aftermath of the US election, as markets became excited over the prospects of increased infrastructure spending, but, while President Trump is not a lone voice on this, Alex felt that the market had got ahead of itself and challenges remain. The proceeds were allocated to the trust’s positions in BT and Shire.
Readers interested in more information on FSV should see QuotedData’s previous Fidelity Closed Funds Reviews and, in particular, the special feature on FSV in the February 2017 edition (see page 4 of this note for further details).
Readers interested in more information on Alex’s investment process should see pages 23 and 24 of QuotedData’s February 2017 review.
QuotedData Fidelity Special Values
Company profile │ 27 July 2017 Page 15
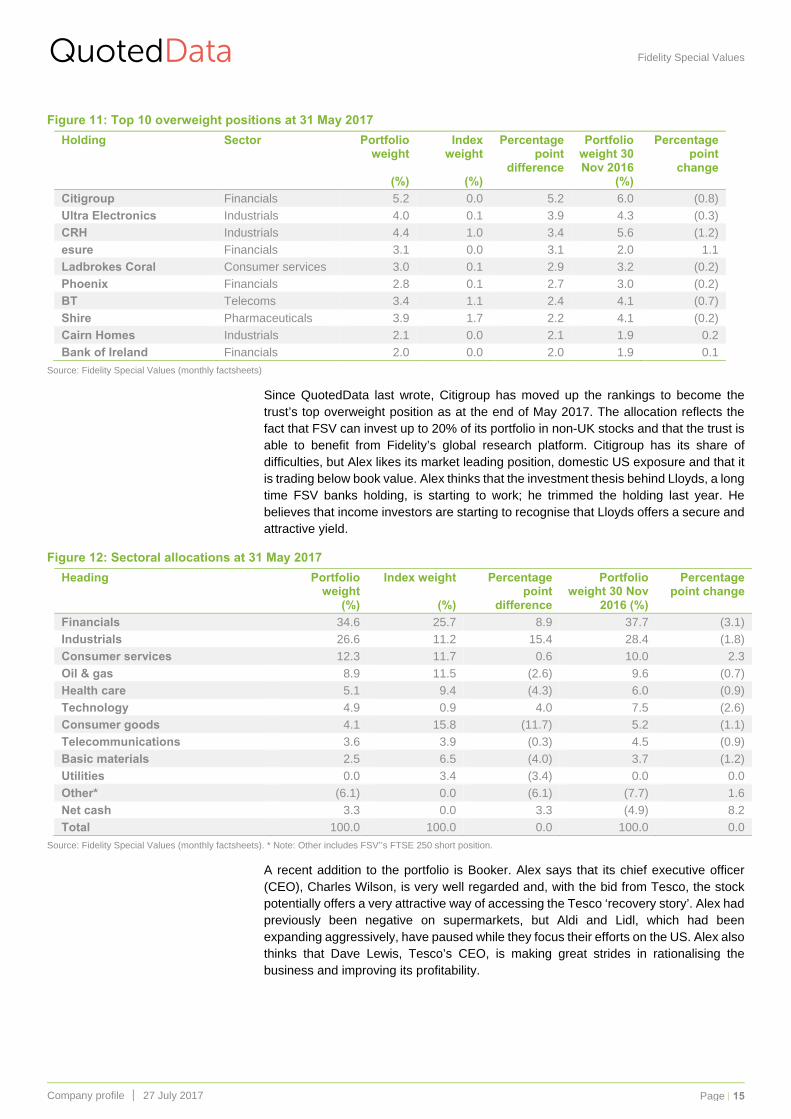
Figure 11: Top 10 overweight positions at 31 May 2017
Holding Sector Portfolio weight
(%)
Index weight
(%)
Percentage point
difference
Portfolio weight 30 Nov 2016
(%)
Percentage point
change
Citigroup Financials 5.2 0.0 5.2 6.0 (0.8)
Ultra Electronics Industrials 4.0 0.1 3.9 4.3 (0.3)
CRH Industrials 4.4 1.0 3.4 5.6 (1.2)
esure Financials 3.1 0.0 3.1 2.0 1.1
Ladbrokes Coral Consumer services 3.0 0.1 2.9 3.2 (0.2)
Phoenix Financials 2.8 0.1 2.7 3.0 (0.2)
BT Telecoms 3.4 1.1 2.4 4.1 (0.7)
Shire Pharmaceuticals 3.9 1.7 2.2 4.1 (0.2)
Cairn Homes Industrials 2.1 0.0 2.1 1.9 0.2
Bank of Ireland Financials 2.0 0.0 2.0 1.9 0.1
Source: Fidelity Special Values (monthly factsheets)
Since QuotedData last wrote, Citigroup has moved up the rankings to become the trust’s top overweight position as at the end of May 2017. The allocation reflects the fact that FSV can invest up to 20% of its portfolio in non-UK stocks and that the trust is able to benefit from Fidelity’s global research platform. Citigroup has its share of difficulties, but Alex likes its market leading position, domestic US exposure and that it is trading below book value. Alex thinks that the investment thesis behind Lloyds, a long time FSV banks holding, is starting to work; he trimmed the holding last year. He believes that income investors are starting to recognise that Lloyds offers a secure and attractive yield.
Figure 12: Sectoral allocations at 31 May 2017
Heading Portfolio weight
(%)
Index weight
(%)
Percentage point
difference
Portfolio weight 30 Nov
2016 (%)
Percentage point change
Financials 34.6 25.7 8.9 37.7 (3.1)
Industrials 26.6 11.2 15.4 28.4 (1.8)
Consumer services 12.3 11.7 0.6 10.0 2.3
Oil & gas 8.9 11.5 (2.6) 9.6 (0.7)
Health care 5.1 9.4 (4.3) 6.0 (0.9)
Technology 4.9 0.9 4.0 7.5 (2.6)
Consumer goods 4.1 15.8 (11.7) 5.2 (1.1)
Telecommunications 3.6 3.9 (0.3) 4.5 (0.9)
Basic materials 2.5 6.5 (4.0) 3.7 (1.2)
Utilities 0.0 3.4 (3.4) 0.0 0.0
Other* (6.1) 0.0 (6.1) (7.7) 1.6
Net cash 3.3 0.0 3.3 (4.9) 8.2
Total 100.0 100.0 0.0 100.0 0.0
Source: Fidelity Special Values (monthly factsheets). * Note: Other includes FSV’’s FTSE 250 short position.
A recent addition to the portfolio is Booker. Alex says that its chief executive officer (CEO), Charles Wilson, is very well regarded and, with the bid from Tesco, the stock potentially offers a very attractive way of accessing the Tesco ‘recovery story’. Alex had previously been negative on supermarkets, but Aldi and Lidl, which had been expanding aggressively, have paused while they focus their efforts on the US. Alex also thinks that Dave Lewis, Tesco’s CEO, is making great strides in rationalising the business and improving its profitability.
QuotedData Fidelity Special Values
Company profile │ 27 July 2017 Page 16
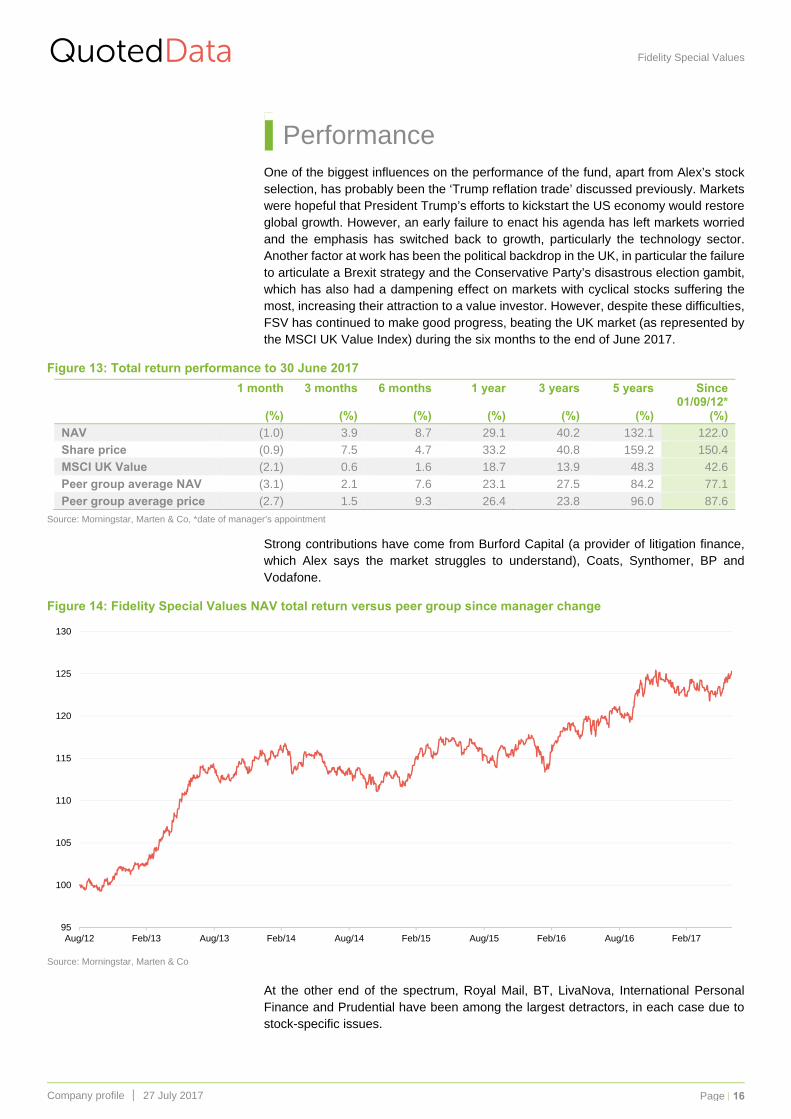
Performance One of the biggest influences on the performance of the fund, apart from Alex’s stock selection, has probably been the ‘Trump reflation trade’ discussed previously. Markets were hopeful that President Trump’s efforts to kickstart the US economy would restore global growth. However, an early failure to enact his agenda has left markets worried and the emphasis has switched back to growth, particularly the technology sector. Another factor at work has been the political backdrop in the UK, in particular the failure to articulate a Brexit strategy and the Conservative Party’s disastrous election gambit, which has also had a dampening effect on markets with cyclical stocks suffering the most, increasing their attraction to a value investor. However, despite these difficulties, FSV has continued to make good progress, beating the UK market (as represented by the MSCI UK Value Index) during the six months to the end of June 2017.
Figure 13: Total return performance to 30 June 2017
1 month
(%)
3 months
(%)
6 months
(%)
1 year
(%)
3 years
(%)
5 years
(%)
Since 01/09/12*
(%)
NAV (1.0) 3.9 8.7 29.1 40.2 132.1 122.0
Share price (0.9) 7.5 4.7 33.2 40.8 159.2 150.4
MSCI UK Value (2.1) 0.6 1.6 18.7 13.9 48.3 42.6
Peer group average NAV (3.1) 2.1 7.6 23.1 27.5 84.2 77.1
Peer group average price (2.7) 1.5 9.3 26.4 23.8 96.0 87.6
Source: Morningstar, Marten & Co, *date of manager’s appointment
Strong contributions have come from Burford Capital (a provider of litigation finance, which Alex says the market struggles to understand), Coats, Synthomer, BP and Vodafone.
Figure 14: Fidelity Special Values NAV total return versus peer group since manager change
Source: Morningstar, Marten & Co
At the other end of the spectrum, Royal Mail, BT, LivaNova, International Personal Finance and Prudential have been among the largest detractors, in each case due to stock-specific issues.
95
100
105
110
115
120
125
130
Aug/12 Feb/13 Aug/13 Feb/14 Aug/14 Feb/15 Aug/15 Feb/16 Aug/16 Feb/17
QuotedData Fidelity Closed-End Funds
Review of investment trust range │ 27 July 2017 Page 17
Special feature: Fidelity Asian Values Fidelity Asian Values (FAS) has been managed by Nitin Bajaj since April 2015. When he took over, he transformed FAS’s portfolio, as he adapted the fund to his absolute return, benchmark-agnostic (i.e. the portfolio is constructed with reference to the benchmark) and small-cap biased approach. FAS’ performance took a turn for the better after Nitin’s appointment although, in the short term, Asian large caps have been outperforming smaller companies.
Nitin Bajaj
Nitin has been based in Singapore since 2013. Prior to that, he had a spell in Fidelity’s Mumbai office (managing the Fidelity India Value Fund and Fidelity India Special Situations Fund), and before that he was based in London. Nitin has worked for Fidelity since 2003, having previously been an analyst for KPMG in India. When Fidelity sold its Indian business in 2012, Nitin moved to join Fidelity’s Singapore operation, taking charge of a SICAV, ‘Fidelity Funds – Asian Smaller Companies Fund’. (A SICAV is an open-ended collective investment scheme common in Western Europe.) He became manager of FAS on 1 April 2015. The two funds have assets of around $1.2bn. The open-ended SICAV has been soft closed (that is temporarily closed) to new investment since April 2017. In other words, FAS is the only way for new investors to access Nitin’s funds. This may be one reason why FAS’s discount has narrowed over the past year.
Investment approach – smaller companies with a value bias
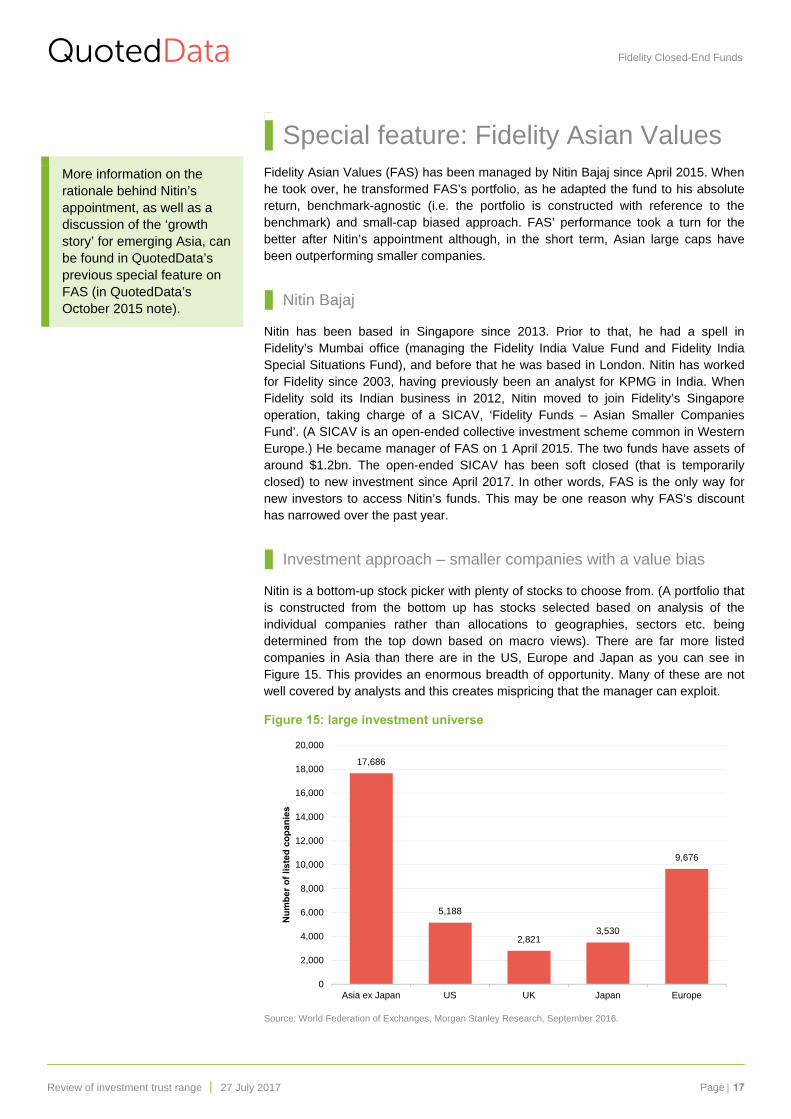
Nitin is a bottom-up stock picker with plenty of stocks to choose from. (A portfolio that is constructed from the bottom up has stocks selected based on analysis of the individual companies rather than allocations to geographies, sectors etc. being determined from the top down based on macro views). There are far more listed companies in Asia than there are in the US, Europe and Japan as you can see in Figure 15. This provides an enormous breadth of opportunity. Many of these are not well covered by analysts and this creates mispricing that the manager can exploit.
Figure 15: large investment universe
Source: World Federation of Exchanges, Morgan Stanley Research, September 2016.
17,686
5,188
2,8213,530
9,676
0
2,000
4,000
6,000
8,000
10,000
12,000
14,000
16,000
18,000
20,000
Asia ex Japan US UK Japan Europe
Nu
mb
er o
f li
sted
co
pan
ies
More information on the rationale behind Nitin’s appointment, as well as a discussion of the ‘growth story’ for emerging Asia, can be found in QuotedData’s previous special feature on FAS (in QuotedData’s October 2015 note).
QuotedData Fidelity Closed-End Funds
Review of investment trust range │ 27 July 2017 Page 18
Sifting through these companies takes a disciplined approach to investing. A self-imposed lower market cap cut-off of $100m (for liquidity reasons) helps whittle down the universe. A team of four/five small-cap analysts, drawn from a 50-strong team focused on Asia ex Japan, works closely with Nitin to come up with ideas for the fund. He has the final say on which stocks are selected for the portfolio.
Nitin favours a value style of investing. Simplistically, he believes that high expectations for growth stocks often end in disappointment while investors react very positively when lowly valued stocks exceed expectations. This value approach is coupled with an absolute return mindset. He believes that the most important risk to guard against is the chance of losing money and not the failure to match a benchmark. For that reason, the FAS portfolio is highly diversified (180 holdings at end May 2017); benchmark weights are ignored when constructing the portfolio; companies with high levels of borrowing, or high valuations, are avoided; and Nitin puts great emphasis on understanding the business models and assessing the management of the stocks that he invests in.
Nitin wants to invest in companies that can grow their earnings and return on equity (ROE) over time and, for that reason, he looks for companies that have defensible market positions. He adopts a three-to-five-year time horizon when assessing stocks.
Although there is a near 100% overlap between the stocks in the open and closed-end funds, FAS, given its fixed pool of capital, has greater freedom to hold larger weights in less liquid stocks, it can be more fully invested than the open-ended fund (the SICAV has 7%-10% cash to meet possible redemptions) and can use protection strategies.
Currently, about 20% of FAS’s portfolio is protected from market falls by a range of long-dated options on the Hang Seng and KOPSI indices plus a shorter-dated option on the Indian market.
Manager’s Outlook Asian markets have been doing well, aided by earnings growth posted by technology companies and liquidity flowing from China. Large-cap companies have been outperforming small caps. There was a shift in focus from expensive consumer staple companies to value stocks during 2016 and into technology stocks this year. This was in common with western markets, most likely on the back of hope that President Trump could kickstart the US economy.
Increased valuations are making it harder for Nitin to spot new opportunities for the fund he says that, at current valuations, it is hard to find many businesses which offer a substantial margin of safety.
He is concerned about the build-up of debt in China. He thinks companies have been postponing much needed restructuring. In addition, China’s demographic pathway is starting to resemble that of Japan. On the back of this Nitin has been trimming exposure to Chinese industrial companies within the portfolio. On the other hand, he thinks that there are selective opportunities in areas where the market has taken too pessimistic a view of the growth prospects, and this is where Nitin is looking for new investments.
In India, Nitin is concerned that there is something of a ‘valuation bubble’, especially in small-cap stocks (i.e. valuations have become inflated). He thinks that South
QuotedData Fidelity Closed-End Funds
Review of investment trust range │ 27 July 2017 Page 19
Korea, by contrast, might be the only Asian country outside China that looks attractive on a relative valuation basis.
Nonetheless, Nitin makes the point that the macro environment does not affect his investment decisions, and that the portfolio is constructed on a stock by stock basis.
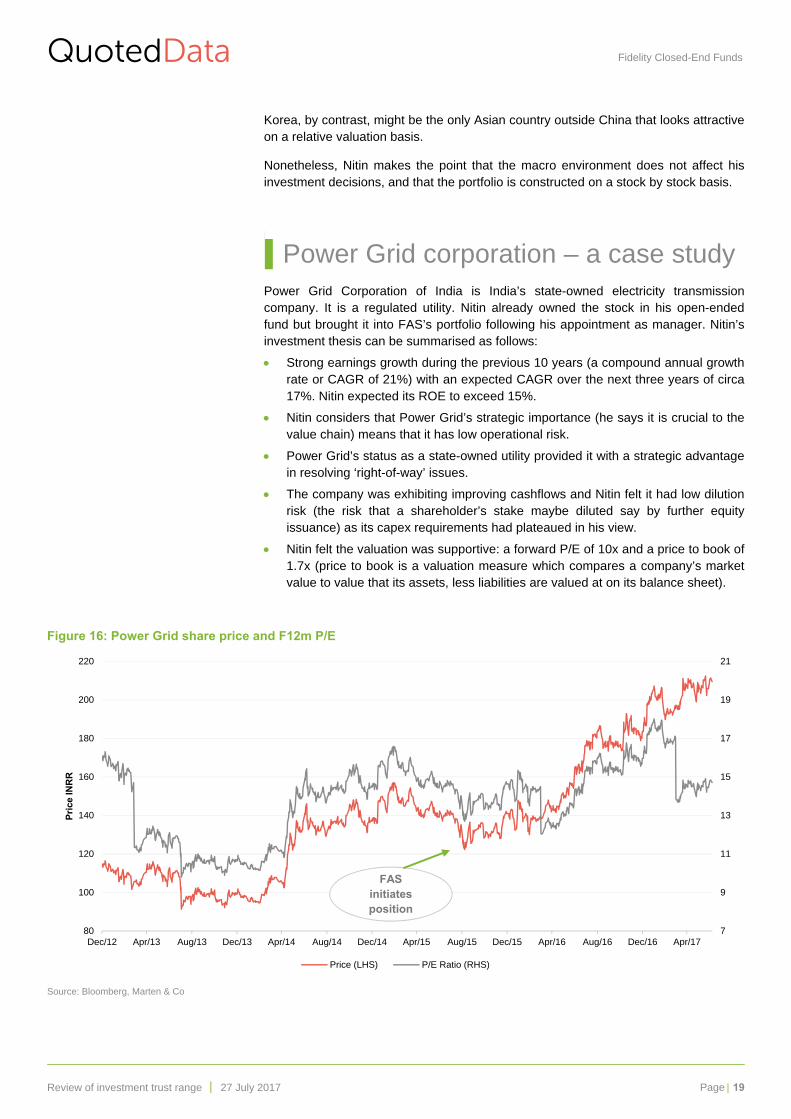
Power Grid corporation – a case study Power Grid Corporation of India is India’s state-owned electricity transmission company. It is a regulated utility. Nitin already owned the stock in his open-ended fund but brought it into FAS’s portfolio following his appointment as manager. Nitin’s investment thesis can be summarised as follows:
Strong earnings growth during the previous 10 years (a compound annual growth rate or CAGR of 21%) with an expected CAGR over the next three years of circa 17%. Nitin expected its ROE to exceed 15%.
Nitin considers that Power Grid’s strategic importance (he says it is crucial to the value chain) means that it has low operational risk.
Power Grid’s status as a state-owned utility provided it with a strategic advantage in resolving ‘right-of-way’ issues.
The company was exhibiting improving cashflows and Nitin felt it had low dilution risk (the risk that a shareholder’s stake maybe diluted say by further equity issuance) as its capex requirements had plateaued in his view.
Nitin felt the valuation was supportive: a forward P/E of 10x and a price to book of 1.7x (price to book is a valuation measure which compares a company’s market value to value that its assets, less liabilities are valued at on its balance sheet).
Figure 16: Power Grid share price and F12m P/E
Source: Bloomberg, Marten & Co
7
9
11
13
15
17
19
21
80
100
120
140
160
180
200
220
Dec/12 Apr/13 Aug/13 Dec/13 Apr/14 Aug/14 Dec/14 Apr/15 Aug/15 Dec/15 Apr/16 Aug/16 Dec/16 Apr/17
Pri
ce IN
RR
Price (LHS) P/E Ratio (RHS)
FASinitiates position
QuotedData Fidelity Closed-End Funds
Review of investment trust range │ 27 July 2017 Page 20
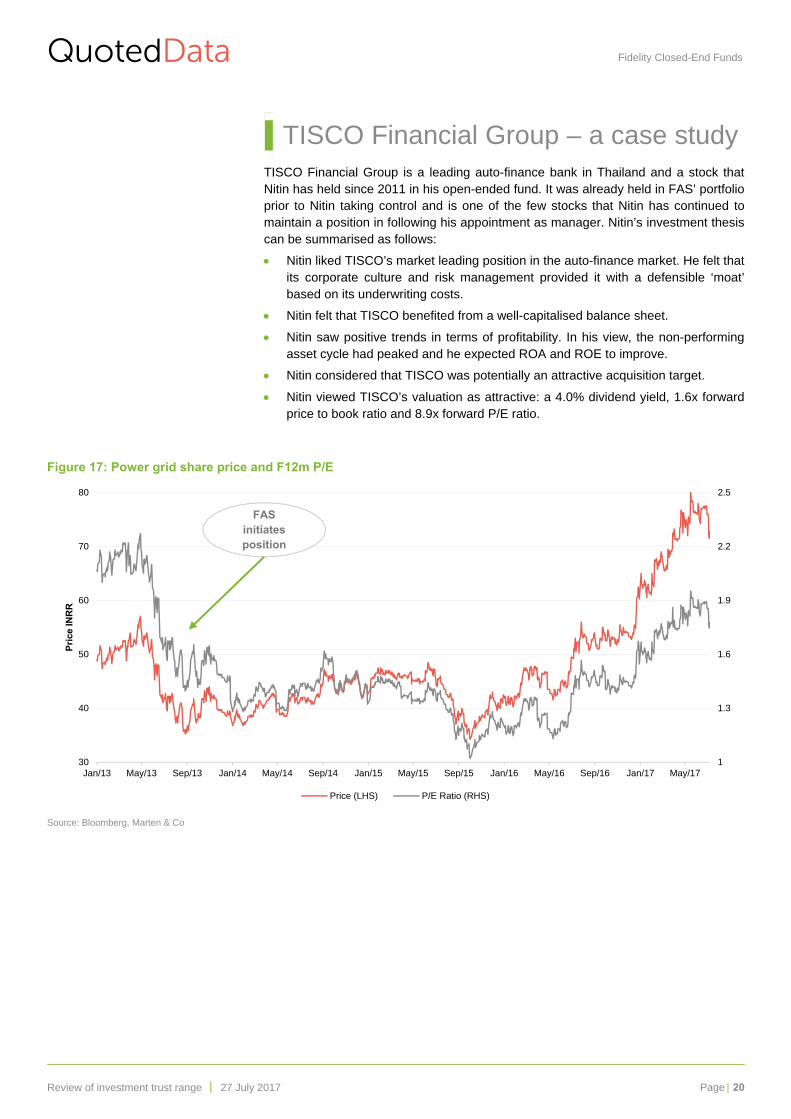
TISCO Financial Group – a case study TISCO Financial Group is a leading auto-finance bank in Thailand and a stock that Nitin has held since 2011 in his open-ended fund. It was already held in FAS’ portfolio prior to Nitin taking control and is one of the few stocks that Nitin has continued to maintain a position in following his appointment as manager. Nitin’s investment thesis can be summarised as follows:
Nitin liked TISCO’s market leading position in the auto-finance market. He felt that its corporate culture and risk management provided it with a defensible ‘moat’ based on its underwriting costs.
Nitin felt that TISCO benefited from a well-capitalised balance sheet.
Nitin saw positive trends in terms of profitability. In his view, the non-performing asset cycle had peaked and he expected ROA and ROE to improve.
Nitin considered that TISCO was potentially an attractive acquisition target.
Nitin viewed TISCO’s valuation as attractive: a 4.0% dividend yield, 1.6x forward price to book ratio and 8.9x forward P/E ratio.
Figure 17: Power grid share price and F12m P/E
Source: Bloomberg, Marten & Co
1
1.3
1.6
1.9
2.2
2.5
30
40
50
60
70
80
Jan/13 May/13 Sep/13 Jan/14 May/14 Sep/14 Jan/15 May/15 Sep/15 Jan/16 May/16 Sep/16 Jan/17 May/17
Pri
ce IN
RR
Price (LHS) P/E Ratio (RHS)
FASinitiates position
QuotedData Fidelity Closed-End Funds
Review of investment trust range │ 27 July 2017 Page 21
QuotedData is a trading name of Marten & Co, which is authorised and regulated by the Financial Conduct Authority 123a Kings Road, London SW3 4PL 0203 691 9430
www.quoteddata.com
Registered in England & Wales number 07981621, 135a Munster Road, London SW6 6DD
Edward Marten
Christopher Bunstead([email protected])
Investment company research:
James Carthew([email protected])
Matthew Read([email protected])
About Marten & Co.
Marten & Co. is a boutique that specialises in the provision of high quality equity investment research to a wide audience and raising the profile of listed companies to potential investors. We are authorised and regulated by the Financial ConductAuthority.
We strive to provide clear, comprehensive and enjoyable research to as wide an audience as possible, in order to give themthe information they need to make informed investment decisions. Anyone can sign up to receive research atwww.QuotedData.com. Professional investors can opt to receive tailored research tailored by clicking Subscribe
IMPORTANT INFORMATION
Marten & Co (which is authorised and regulated by the Financial Conduct Authority) was paid to produce this note on Fidelity International’s investment trusts.
This note is for information purposes only and is not intended to encourage the reader to deal in the security or securities mentioned within it.
Marten & Co is not authorised to give advice to retail clients. The research does not have regard to the specific investment objectives, financial situation and needs of any specific person who may receive it.
This note has been compiled from publicly available information. This note is not directed at any person in any jurisdiction where (by
reason of that person’s nationality, residence or otherwise) the publication or availability of this note is prohibited.
Accuracy of Content: Whilst Marten & Co uses reasonable efforts to obtain information from sources which we believe to be reliable and to ensure that the information in this note is up to date and accurate, we make no representation or warranty that the information contained in this note isaccurate, reliable or complete. The information contained in this note is provided by Marten & Co for personal use and information purposes generally. You are solely liable for any use you may make of this information. The information is inherently subject to change without notice and may become outdated. You, therefore, should verify any information obtained from this note before you use it.
Investment Performance Information: Please remember that past performance is not necessarily a guide to the future and that the value of shares and the income from them can go down as well as up. Exchange rates may also cause the value of underlying overseas investments to godown as well as up. Marten & Co may write on companies that use gearing in a number of forms that can increase volatility and, in some cases, to a complete loss of an investment.
No Advice: Nothing contained in this note constitutes or should be construed to constitute investment, legal, tax or other advice.
No Representation or Warranty: No representation, warranty or guarantee of any kind, express or implied is given by Marten & Co in respect ofany information contained on this note.
Exclusion of Liability: To the fullest extent allowed by law, Marten & Co shall not be liable for any direct or indirect losses, damages, costs orexpenses incurred or suffered by you arising out or in connection with the access to, use of or reliance on any information contained on this note. In no circumstance shall Marten & Co and its employees have any liability for consequential or special damages.
Governing Law and Jurisdiction: These terms and conditions and all matters connected with them, are governed by the laws of England and Wales and shall be subject to the exclusive jurisdiction of the English courts. If you access this note from outside the UK, you are responsible for ensuring compliance with any local laws relating to access.
No information contained in this note shall form the basis of, or be relied upon in connection with, any offer or commitment whatsoever inany jurisdiction.