Embed Size (px)
Citation preview
Value and Costs of Auditor’s Assurance: Evidence from the Review of
Quarterly Financial Statements
Jean Bédard Université Laval
Lucie Courteau Free University of Bolzano [email protected]
October 2008
We would like to thank Robert Kneckel, Lasse Niemi and the participants at research workshops at the
Australian National University, the HEC Montréal, Université du Québec à Montréal, University of
Auckland , 2008 EARNet conference, and second Audit Quality Workshop for their comments. We
acknowledge financial support from the Social Science Research Council of Canada.
2
Value and Costs of Auditor’s Assurance: Evidence from the Review of
Quarterly Financial Statements
ABSTRACT
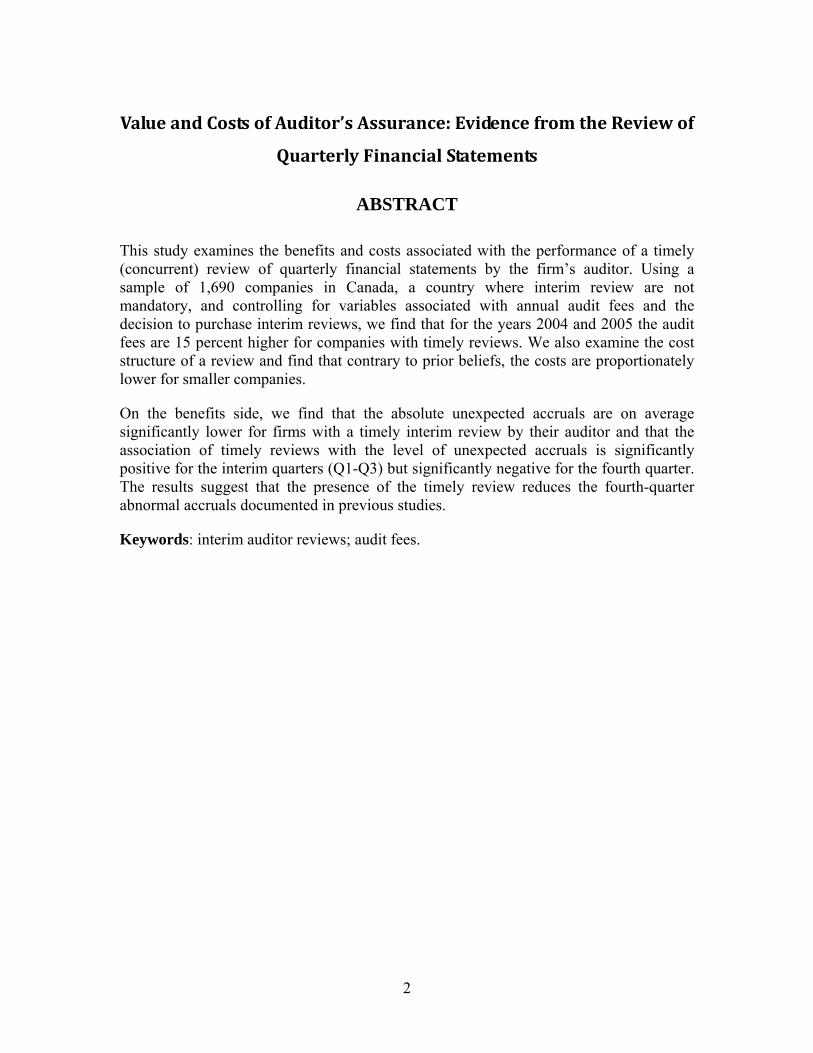
This study examines the benefits and costs associated with the performance of a timely (concurrent) review of quarterly financial statements by the firm’s auditor. Using a sample of 1,690 companies in Canada, a country where interim review are not mandatory, and controlling for variables associated with annual audit fees and the decision to purchase interim reviews, we find that for the years 2004 and 2005 the audit fees are 15 percent higher for companies with timely reviews. We also examine the cost structure of a review and find that contrary to prior beliefs, the costs are proportionately lower for smaller companies.
On the benefits side, we find that the absolute unexpected accruals are on average significantly lower for firms with a timely interim review by their auditor and that the association of timely reviews with the level of unexpected accruals is significantly positive for the interim quarters (Q1-Q3) but significantly negative for the fourth quarter. The results suggest that the presence of the timely review reduces the fourth-quarter abnormal accruals documented in previous studies.
Keywords: interim auditor reviews; audit fees.
3
Value and Costs of Auditor’s Assurance: Evidence from the Review of
Quarterly Financial Statements
I. INTRODUCTION
This study examines the costs and benefits associated with the performance of a review
of quarterly financial statements by the firm’s auditor. This issue is important because the
regulator’s typical response to accounting scandals has been to increase auditors’
involvements with the financial statements with prescriptions such as mandatory review
of interim financial statements (SEC 1999b) and auditor attestation of management's
assessment of the company's internal control (SOX 2002). The merits, benefits, and costs
of these prescriptions have fuelled the debate over the last decades and will continue.
While in some jurisdictions, such as the U.S, requires that a review of the interim
financial statements of a company be carried out by its auditor, in other jurisdictions such
as Canada reviews are not required.
Timely reviews are believed to improve the quality of interim reporting by allowing
timely consideration of significant accounting matters affecting the interim financial
statements and reducing the likelihood of restatements or other adjustments in the fourth
quarter (SEC 1999b). Critics of these mandatory reviews, however, contend that they
increase audit costs and might not be justified from a cost-benefit analysis, particularly
for small companies. While some of the benefits of timely reviews have been
demonstrated empirically (2000b; Manry et al. 2003) there is no empirical evidence as to
their cost. In its proposal, the SEC (1999a) estimated that the incremental cost of a timely
review over a retrospective review would range from approximately $3,000 to $12,000
per year. Given the SEC’s gross underestimation of the cost associated with auditor
attestation of the company's internal control (e.g. FEI 2005), there is a need for empirical
evidence on the cost of this prescription. In addition, while a large body of research
provides us with a good understanding of the cost drivers of an audit, there is no
empirical data as to the cost structure of an interim review.

4
This study contributes to this debate and extends the literature on interim review and
audits fees by providing empirical evidence on the cost and the benefits associated with
auditors’ review of interim financial statements. In particular, we seek to estimate the
increase in audit cost related to the timely interim review as well as the cost drivers of
this type of review. We also investigate whether the main objective of the timely review,
i.e. the increase in the quality of interim financial statements, is attained by comparing
the level of unexpected accruals between firms with and without a timely interim review.
The tests are performed on a sample of 1,690 companies listed in Canada, where
quarterly financial statements reviews are voluntary and audit fees are available.
Controlling for variables associated with annual audit fees and the decision to
purchase interim reviews, we find that total audit fees are 15 percent higher for
companies with timely reviews. We do not find evidence that the costs are
proportionately greater for smaller companies, on the contrary the results show that they
are proportionally smaller.
On the benefits side, we find that the absolute unexpected accruals are on average
significantly lower for firms with a timely interim review by their auditor and that the
association of timely reviews with the level of unexpected accruals is significantly
positive for the interim quarters (Q1-Q3) but significantly negative for the fourth quarter.
This result suggests that the presence of the timely review reduces the fourth-quarter
earnings management documented in previous studies (Givoly and Ronen 1981, Das et
al. 2007, Dhaliwal et al. 2004, Jacob and Jorgensen 2007).
The remainder of the paper is organized as follow. Section II reviews the literature on
timely review and presents the research questions. Section III describes the sample, the
model, and empirical measures. Section IV presents the results and Section V the
conclusion.
5
II. BACKGROUND ON THE REVIEW OF QUARTERLY
FINANCIAL STATEMENTS
Reviews of interim financial statements originated in the U.S., with ASR No. 177 (SEC
1975) requiring large publicly listed companies to disclose selected quarterly data in their
annual reports and that their auditor be associated with these data via the performance of
a retroactive “limited review”.1 At that time the SEC recommended a timely review of
interim financial statements but did not require it. While not required by regulation, the
major U.S. accounting firms started to require timely reviews as a precondition of
accepting the audit appointment for SEC registrants in the mid-nineties (Public
Accounting Report, 1994). The SEC made them mandatory in March 2000 (SEC 1999b).
Foreign SEC registrants that qualify as “foreign private issuers” are not subject to these
mandatory review.
As in the U.S., Canadian companies report quarterly financial statements but
unlike in the U.S., the Canadian Securities Administrators (CSA) do not require an
auditor review of quarterly financial statements. While propositions of mandating review
of an issuer's interim financial statements by its external auditors prior to filing and
distribution to shareholders have been made in the past (e.g. OSC 2000a; Crowford
Committee 2003) such proposals were rejected on the basis of lack of consensus
regarding the costs and benefits of such review in particular for smaller companies (OSC
2000b). Thus, Canadian companies are not required to have their quarterly financial
statements reviewed and this even if their stocks are listed in the U.S. because of the
mandatory review exemption for “foreign private issuers”. Canadian companies are
however encouraged to have their interim financial statements reviewed and if they are
not reviewed, that fact must be disclosed in the financial statements (OSC 2004, sec.
4.3(3)). Differing from the U.S. only timely reviews (i.e. review prior to filing and
1 Small companies (assets lower than $200 million), companies with low income (income lower than $0.2 million in any of the previous three years), and closely held companies were excluded from the requirement.
6
distribution of interim financial statements to shareholders), are allowed under Canadian
regulations.
Auditor Fees and Interim Review
While audit fees research has provided us with a good understanding of the cost drivers
of a financial statements audit, our knowledge of the cost function of an interim financial
statement review is limited. This section presents the effect of an interim review on total
audit fees (including audit and review) and explores the drivers of cost of an interim
review.2
Cost of a Review
Reviews are distinguishable from audits in that their scope is narrower than that of an
audit. A review consists of enquiry, analytical procedures and discussion. It does not
normally include procedures such as physical inspection, confirmation from external
parties and examination of documents that are usually performed in an audit, unless the
auditor has doubts about the plausibility of the information obtained through enquiry,
analytical procedures and discussion with management. The need to perform these review
procedures three times throughout the year is expected to lead to increased assurance cost
(audit and review). Offsetting the review costs, however, is the performance of some
substantive audit procedures during the review instead of at year-end, strengthened client
internal accounting and reporting controls resulting from the discipline involved in the
review process, and time savings in fixing problems that may not otherwise have been
discovered until year-end (Andersen 1999). As indicated by the SEC (1999a), the cost of
reviews will only be partially offset by a reduction of year-end audit fees. Accordingly,
overall audit and review fees are expected to be higher when the auditor also performs a
review of the firm’s interim financial statements.
2 Timely reviews of interim reports may also add to the time necessary to prepare interim reports. Ettredge et al. (2000a) estimate that this type of review increases the reporting lag of interim reports when interim earnings contain special items.
7
Comments from the audit firms on the SEC’s proposed rules provide some
indications as to the cost increase associated with timely reviews of interim financial
statements. PriceWaterhouseCoopers (1999) estimates that the first implementation of
their policy of requiring the performance of timely interim reviews for their U.S. clients,
resulted in an incremental annual effort in the range of 5-10 percent from the then-current
annual audit effort. Ettredge et al. (1994, 141) report that, in their responses to the SEC’s
(1989) request for comments, two large accounting firms indicated an incremental price
ranging from 5% of the annual audit fees for large clients to 15% or 20% for small
clients. The SEC (1999a) estimated that the incremental cost of a timely review over a
retrospective review would range from approximately $3,000 to $12,000 per year for non
Big 5 auditors. The above discussion suggests the first research hypothesis:
H1: Audit fees are positively associated with the timely review of interim financial
statements.
Review Cost Structure
Simunic (1980) models audit fees as consisting of a resource cost component, and an
expected liability loss component. Resource costs are increasing in the level of audit
work whereas expected liability losses generally decrease with increasing audit work.
Simunic (1980) and a large body of subsequent research has examined the effect of
various factors that may affect auditor’s work or liability (see Hay et al. 2006 for a
review).
A review differs from an audit in terms of the work performed and the auditor
communication. As noted earlier, the nature and extent of work is lower for a review. The
form and distribution of the auditor communication also differs. Information about the
nature, extent of involvement with the interim financial statements, and the results of the
review can be communicated in either oral or written form to the audit committee. In
addition, under Canadian GAAS (CICA 7050.08) auditors are not allowed to consent that
their report be made public; its distribution is limited to the audit committee. These
differences between an audit and a review will affect both the resource cost and expected
liability loss components of the audit fees.
8
Resource cost attributes and their effect may differ between a review and an audit.
For example, because a review does not normally include procedures such as physical
inspection and confirmation from external parties, the presence (or level) of accounts
receivable and inventories may not result in increased work as it is the case for an audit.
The attributes of the expected liability loss may also be less important because of the
lower litigation risk associated with a review. Indeed, prohibition from consenting to the
inclusion of the auditor interim review report in a public document means that neither the
company nor its directors and officers can use it for statutory due diligence defence. In
addition, exposure to legal liability towards third parties is not increased because the
report is not public (CICA 7050.08). As suggested by the negative association found by
Krishnan and Zhang (2005) between the disclosure of the auditor’s review report and
auditor’s litigation risk and auditor’s type (Big 4 or non Big 4), the exposure of auditors
to legal liability is lower when their report is not public.
Based on the audit fees literature, Ettredge et al. (1994) and the professional
literature, we identify the following attributes that we expect to be associated with the
incremental price of a review: the company’s size and its degree of complexity as
measured by the number and location of its segments.
Company Size
The work effort of auditors at quarter end varies according to the nature of the
assignment and audit firm. Similar to Ettredge et al. (1994), we expect that as company
size increases, the incremental effect of a review on audit fees decrease. As suggested by
PriceWaterhouseCoopers (1999) the relative cost may be higher for smaller companies
because of “(1) the relatively lower cost of auditing smaller entities and, therefore, the
relatively higher impact of adding three visits to the company during the year, and (2) the
less structure in such entities resulting in additional need to follow up on inquiries and
analytical procedures.” In addition, smaller companies generally have less sophisticated
accounting and reporting system, and lower quality accounting personnel. This leads to
our second research hypothesis:
9
H2: The association of audit fees with timely review of interim financial
statements decreases as company size increases.
Company’s Segments
We expect the incremental price of a review to increase with the number and location of
the company’s business and geographic segments. More segments not only increase the
complexity of the quarterly financial statements but impose additional costs associated
with making enquiries and discussions with persons responsible for financial and
accounting matters at different locations. In addition, foreign operations could result in
higher review costs in countries where the auditor does not have an affiliated firm or
where quarterly financial statements are not required (Ettredge et al. 1994). We
hypothesize that
H3: The association of audit fees with timely review of interim financial
statements increases with the number of business and geographic segments.
The benefits of Auditor Assurance on Interim Financial Information
According to regulators and commentators, the review of interim financial statements
allows the timely consideration of significant accounting matters affecting the quarterly
financial statements, and provides an opportunity for early resolution of issues affecting
the annual financial statements. (CICA ES .02). Consequently, the review should result in
more reliable and credible interim financial statements and reduce the likelihood of year-
end adjustments (SEC 1999a (SEC ASR No. 177 (1975, 818).). It may also reduce the
risk of material misstatements in the audited annual financial statements because of the
improved auditor’s knowledge of the business (Boritz 2006).
While early research on the benefits of interim review was not consistent with the
regulator’s assertions (e.g. Givoly et al. 1978; Alford and Edmonds 1981), more recent
research results are. Ettredge et al. (2000b) show that for the years 1989 and 1990, 131
companies with a timely review recorded a higher proportion of non-routine adjustments
during the first 3 quarters and a lower proportion of non-routine adjustments in the fourth
10
quarter than the 69 companies with a retrospective review. Manry et al. (2003) find that
between 1990 and 1995, their 412 sample companies with timely reviews have higher
contemporaneous association between returns and interim-quarter earnings than the 84
companies with retrospective review, suggesting that timely reviewed quarterly earnings
“better” reflect economic information that is impounded in returns.
Because of the lack of public information on the presence of timely review report,
these researchers had to rely on surveys. For example, the results of Ettredge et al.
(2000b) are based on survey results from 371 companies out of a sample of 709
companies selected from approximately 2,700 NYSE and AMEX companies. Similarly,
Manry et al.’s (2003) conclusions are based on the results of a survey from 412
companies out of a sample of 1,025 companies listed in the 1995 Directory of Corporate
Affiliations. Moreover, Ettredge et al. (2000b) limited their study to the timely
consideration of non-routine items, which is one of the potential benefits of timely
review.
Quality of Quarterly Earnings and Interim Review
Financial reporting involves making choices regarding accounting policies and their
application, and requires management to make numerous decisions, estimates and
judgments that affect results. The quality of earnings and accruals is associated with both
the difficulty in estimating accrual accounts and managerial opportunism (Dechow and
Dichev 2002). For example, earnings quality may be low because of unintentional errors
in estimating numerous future economic events.
Quarterly Earnings Quality
The Canadian Institute of Chartered Accountants (CICA) in the introduction to Chapter
7050 of the CICA Handbook on interim financial information, identifies four major
differences between interim and annual financial reports: (1) interim information is less
precise, (2) it is reported on a more timely basis, which leaves less time for its
preparation, (3) it uses more estimates than annual information for revenues, cost and
expenses, and (4) some of the estimates used are based on expectations of what will
11
happen in the rest of the fiscal year, which means that corrections of these estimates may
be needed in subsequent quarters. For example, to save cost and time, enterprises often
use estimates to measure inventories at the end of interim periods instead of physical
observation, do not make a detailed calculation at the end of each interim period for
impairment of assets (e.g. accounts receivable, goodwill) or accruals (e.g. pension
benefits, taxes and warranties).
These characteristics of interim reporting increase the risk of lower earnings quality
caused by the difficulty in estimating accrual accounts. Indeed, the quality of quarterly
financial statements has been questioned because, for example, firms do not disclose all
required information for quarterly financial statements (McEwen & Scwartz 1992).
Canadian companies are not different. An OSC review of 150 interim financial
statements filed in 2001 indicates that 33% did not present all the required information or
were not consistent with GAAP (OSC 2002).
Earnings quality may also be reduced through intentional bias in accruals from
earnings management.3 Quarterly earnings are however different from annual earnings.
Because they are not audited, interim reports are more likely to suffer from earnings
management because there is more opportunity for making accounting choices that may
misrepresent the firm’s actual situation and performance. On the other hand, many of the
incentives to manage earnings are absent at the time of interim reports. Management
compensation levels depend on annual earnings, not on quarterly numbers, so there is less
incentive for earnings management (Jeter and Shivakumar 1999). Similarly, most debt
covenant restrictions refer to annual rather than quarterly accounting numbers, so the
motivation to manage earnings to avoid violating minimum ratio requirements contained
in the covenants is also absent in interim quarters. The incentive to meet or beat analyst
earnings forecasts remains however.
3 Healy and Palepu (1993) point out that accounting choices are not always made to the detriment of earnings quality, however. They contend that the discretion left to the preparers of financial statements is often used to better represent the real performance of the firm and that it may be a mistake to classify all discretionary accruals as indicators of poor earnings quality.

12
Myers et al. (2007) examine firms that report long strings of growing quarterly EPS
and find that they enjoy higher stock returns (an average 20% per year in first 5 years of
the string). They also find that the high returns disappear very fast after the end of the
string. Hence, there is a high incentive for these firms to manage earnings in each quarter
to ensure the continuation of the string.
Whatever the source of the problems (difficulty in estimating accrual accounts or
managerial opportunism), the quality of quarterly financial statements has been
questioned (McEwen & Scwartz 1992, OSC 2002), and the large proportion quarterly
financial statements restatements (Huron Consulting Group 2004) is an indication of the
low quality of these statements. The cost of these restatements can be quite high, with
market impact of around nine percent: 9% for the period 1995-1999 (Palmrose et al.
2004) and 9.5% or $18.2 billion for the period 1997-2002 (GAO 2002).
Time-Pattern of Quarterly Earnings Quality
Several studies have shown a discrepancy between the quality of interim reports (Q1-Q3)
and that of the fourth quarter (Q4). Given the short reporting lag and the heavy use of
estimations associated with interim financial statements, they are likely to contain more
reporting errors than annual statements. The fourth-quarter accruals are then used to
correct these earlier errors. Incentives to manage earnings may also differ between the
three first quarters and the fourth. Cohen et al. (2004), for example, find significantly less
earnings management in interim quarters than in the fourth.
On the other hand, Jeter and Shivakumar (1999) find a tendency to defer bad news to
the last quarter. Kerstein and Rai (2007) find that firms use income-increasing earnings
management to convert small cumulative losses in the interim quarters (Q1-Q3) into
small annual profits, or to prevent small cumulative profits from becoming small annual
losses.4 Jacob and Jorgensen (2007) confirm Kerstein and Rai’s (2007) results by comparing
the distribution of earnings for the fiscal year with the distribution of earnings for 4-
4 Dechow et al. (2003) document a low frequency of firms with small losses and high frequency of small profit firms.
13
quarter periods ending at Q1, Q2 and Q3. They find the asymmetry in earnings
distribution below and above zero only for the 4-quarter periods that coincide with the
fiscal year. Hence it seems that earnings management to avoid small losses is done in the
4th quarter.5
Das et al. (2007) examine the behaviour of quarterly earnings changes, with respect to
the same quarter a year earlier, and find that around 22% of Compustat firms over the
period 1988-2004 exhibited reversal of earnings changes in the fourth quarter. Roughly
half of these reversals are consistent with an increase in fourth-quarter earnings to reverse
decreases in the first three quarters, and half are consistent with decreasing fourth-quarter
earnings to build “reserves” for the next year. They find that fourth-quarter reversals are
associated with various measures of earnings management.
It seems that investors in the market are aware of the prevalence of earnings
management at year-end rather than in interim quarters since Salamon and Stober (1994)
find evidence that fourth-quarter earnings response coefficients are smaller than the
response to interim earnings.
Effect of Auditing on Financial Statement Quality
There is a large body of literature on the effect of an audit on the quality of financial
statements (Becker et al 1998, Chih-Ying et al 2008, Myers et al 2003, Frankel et al.
2002, among others). Studies of post audit financial statements suggest that measures of
audit quality such as Big 4, industry specialization, independence and quantity of audit
work are positively associated with earnings quality (Francis 2004). In addition,
adjusting-entry studies (Wright and Wright 1997) and a survey of auditors by Nelson et
al. (2002) also show that an audit has a positive effect on the quality of financial
statements.
5 Durtschi and Easton (2005) contest the results of this line of research, though, arguing that the methodology used in the studies that find a lower frequency of small losses than small profits may be creating the phenomenon observed. This does not contradict the fact that earnings management differs across quarters, however.
14
Even if the scope of reviews is less than that of an audit, they have been found to be
positively associated with the quality of financial statements. The review of interim
financial statements results in better procedures and control over the quarterly financial
reporting process and timely consideration of significant accounting matters affecting the
quarterly financial statements. As indicated before, the review of interim financial
statements by an auditor is associated with more timely consideration of non-routine
items (Ettredge et al. 2000b) and higher contemporaneous association between stock
returns and interim-quarter earnings (Manry et al. 2003). In addition, (Mangena and
Tauringana 2007) find that the degree of disclosure compliance in interim financial
statements is positively associated with the presence of an auditor’s review report. We
hypothesize that:
H4 The review of interim financial statements decreases the level of unexpected
accruals in the interim financial statements.
Given the short reporting lag and the heavy use of estimations associated with interim
financial statements, quarterly financial statements are likely to contain more reporting
errors than annual statements. The fourth-quarter accruals are then used to correct these
earlier errors. For example, regulators and commentators believe that by providing more
reliable interim financial statements, quarterly reviews reduce the likelihood of year-end
adjustments (SEC 1999a, SEC 1975, 818). Ettredge et al.’s (2000b) findings that U.S.
companies with timely reviews have a lower proportion of non-routine adjustments in the
fourth quarter than the companies with retrospective reviews are consistent with these
beliefs.
Moreover, timely reviews may reduce the risk of material misstatements in the
audited annual financial statements because of the improved auditor’s knowledge of the
business (Boritz 2006). We hypothesize that:
H5 The review of interim financial statements decreases the level of unexpected
accruals in the fourth quarter.
15
III. METHODOLOGY
Sample
In order to test the costs and benefits associated with the involvement of auditors in the
preparation of quarterly financial reports, we need a setting where the timely review is
not mandatory. Canadian listed firms offer an excellent testing ground since the
economic setting is very similar to that of the US but the adoption of timely reviews is
entirely voluntary. Our sample consists of all the COMPUSTAT Canada population for
which financial information is available (2,060 firms), from which we exclude companies
with non-Canadian auditors (74), companies which do not provide audit fee information
(149), companies in the financial industry (115), companies that filed a Sarbanes-Oxley
Section 404 report in 2004 or 2005 because of the large impact of such a report on audit
fees (32). The final sample includes 1,690 company-years.
Audit Fee Model Specifications and Variable Definitions
Our multivariate model investigates the cost of interim financial statement reviews. We
model audit fees as a function of the performance of review services, its interaction with
attributes hypothesized to relate to review fees, and control variables that have been
found to be related to audit fees in previous research.
LnFEE= α + β1 REVIEW + β2 INTERACTIONS + β2 CONTROLS + ε (1)
Audit fees Variable
Consistent with previous research we use the natural log of the audit fees (LnFEE) as a
measure of fees. As in the U.S., under Canadian rules a company must disclose under the
caption “Audit Fees” the amount of audit fee billed by its external auditors for the audit
and review of its financial statements (CSA 2003a). We collected the fee data manually
from the companies’ regulatory filing in the SEDAR website. Depending on the
company’s status, the information may be disclosed in the Annual Information Form,
16
Management Information Circular, or Management’s Discussion and Analysis (CSA
2003a).6
Experimental Variables
We examine hypothesis H1 using REVIEW, a dichotomous variable that takes a value of
one if the company does not disclose that the financial statements have not been reviewed
by its auditor and zero otherwise. According to the regulation, since the 30th March 2004
and for financial years beginning on or after 1st January 2004, if the company’s auditor
has not performed a review of the interim financial statements, the company must
disclose that fact in a notice accompanying the interim financial statements (OSC 2004).
The presence or absence of such notice is determined by reviewing quarterly financial
statements filed on SEDAR.7 In the absence of a notice it is presumed that a review has
been performed. The absence of notice may also occur if there is no review and the
company is unaware of the requirement. Given that some companies could be unaware of
this requirement in the quarters closely following the date when the requirement came
into force (second and third quarters of 2004), for the year 2004 we use the third quarter
of 2004 when a notice of no review is disclosed in that quarter and the first quarter of the
2005 financial year otherwise.8
In H2 we hypothese that the incremental effect of an interim review on audit fees
decreases with company size. We use the interaction between REVIEW and SIZE as
measured with the natural logarithm of total assets (REVIEW*SIZE) to test this
6 When collecting the data, we noticed that the description of the nature of the services comprising the fees disclosed under the caption “Audit-Related Fees” often includes the review of quarterly financial statements that should be included under the caption “Audit Fees”. We repeated the analyses using the total of the fees disclosed under the captions “Audit Fees” and “Audit-Related Fees” as a measure of audit fees. The results for our hypotheses are unchanged.
7 Quarterly financial statements were searched with the keyword “review”. In the absence of a hit, the file pdf format was checked to determine whether it was in an image format, in which case the presence or absence of a notice was manually ascertained.
8 Indeed, Boritz (2006) indicates that oral reporting, as permitted by Canadian review standards, can lead to vagueness as to whether or not a complete review was conducted and results in companies that have not had a review failing to include a notice in their interim filings because they believe that any auditor involvement with interim financial statements constitutes a review.
17
hypothesis and expect a negative sign for this variable. We use the natural logarithm of
the number of business segments (BUSSEG) and geographical segments (GEOSEG) as
indicators of the number and location of the company’s segments, a measure of audit
complexity. Because this information is not available in COMPUSTAT Canada, we
collected the segment information manually from the financial statements. We test H3
with the interaction between REVIEW and these two variables.
Control Variables
To obtain the incremental effect of a review on total audit fees (audit and review) we
need to control for attributes related to audit fees in general. Our control variables are
derived from Hay et al.’s (2006) meta-analysis. Given the dominance of size as a
determinant of audit fees and its significance in the decision to buy quarterly reviews
(Ettredge et al. 1994) we control for client size with SIZE (the natural logarithm of total
assets) and expect a positive relationship between size and fees.
We control for client complexity with the number of business segments (BUSSEG)
and the number of geographical segment (GEOSEG). We expect that complexity will be
positively associated with audit fees. Some accounts require additional audit effort
because the auditing standards require procedures as a means of obtaining audit evidence
regarding their existence and measurement. For example, for accounts receivable the
auditor must use confirmation and for inventories the auditor must be present for the
physical count. We use INVREC (the ratio of inventory plus accounts receivable to total
assets) to control for this effect, which affects the cost of year-end audits but not that of
quarterly review.
We control for the audit firm’s professional risk with variables related to the client’s
profitability and its presence on the U.S. market. Poor financial performance increases
the auditor’s professional risk (Simunic 1980). Hence, we expect that the relationship
between audit fee and ROA (net income divided by total assets) will be negative.
The U.S. being a more litigious environment than Canada (Clarkson and Simunic
1994), an auditor is more exposed to professional risk if the Canadian company has
18
securities listed or quoted on a U.S. marketplace. In general, auditors will perform more
work and charge a risk premium for higher professional risk clients. Moreover,
companies with securities listed or quoted on a U.S. marketplace may require work
related to the reconciliation between Canadian GAAP and U.S. GAAP and assistance
with and review of documents filed with the SEC. We expect that that the relationship
between audit fee and USA (an indicator variable equal to 1 if the company is also a SEC
registrant and zero otherwise) will be positive.
We also control for two auditor attributes: size and tenure. We expect that BIG4 (an
indicator variable equal to one when the auditor is a Big 4 firm and zero otherwise) will
be positively associated with fees. Since a change in auditor may result in reduced fees
because of low-balling or more efficient service and in higher fees because of the costs
associated with obtaining a sufficient understanding of the entity, we do not propose a
direction of association for AUDCHG (an indicator variable equal to one if the company
changed auditors from the previous year and zero otherwise).
Finally, we control for industries with indicator variables for energy (GICS= 10),
materials (GICS= 15), consumer discretionary (GICS= 25), consumer staples (GICS=
30), health care (GICS= 35), information technology (GICS= 45), telecommunications
services (GICS= 50), utilities (GICS= 55), and for the year with an indicator variable
equal to one for the 2005 fiscal year (Y2005).
Earnings Quality Model Specification and Variable Definitions
Measuring Earnings Quality
We use two types of measures for the quality of quarterly earnings, one of the most
important benefits of timely review. We first measure the lack of quality as the level of
current unexpected accruals and then use fourth-quarter earnings reversals as indicators
of earnings management (Das et al. 2007).
19
Unexpected current accruals9
Current accruals are more likely to be used for earnings management than long-term
accruals because accounting decisions associated with them have only a short-term effect.
Several methodologies have been developed for the detection of earnings management
through accruals, each one with its advantages and its problems. The basic model was
developed by Jones (1991) and it still serves as the basis for most models used today.
The Jones Model has been found to be quite efficient at detecting unexpected
accruals, except for firms with extreme performance, i.e. firms with very high or very low
cash flows from operations or net income. To minimise the bias induced by extreme firm
performance, we winsorize earnings and operating cash flows at the level of the 1st and
99th percentiles (Dechow and Sloan 1995) and included ROA as a control variable in our
regressions testing the effect of a review. Dechow and Sloan (1995) propose a
modification to the basic Jones model which takes into consideration that earnings
management can be achieved through real operations as much as through the choice of
accounting methods and their application, and which is usually referred to as the
Modified Jones Model.
We choose to use the Jones (1991) model of expected quarterly current accruals,
estimated in cross-section by industry.10 This choice is justified by the fact that current
accruals are more likely to be used to manage earnings across quarters and that the the
auditor’s work focuses on the accounting treatment of operations rather than on their
economic adequacy. Several studies use the Jones model in combination with other
models of earnings management and their results are quite consistent across models (e.g.
9 The terms discretionary, abnormal, and unexpected accruals are often used interchangeably in the accounting literature. Because the underlying construct for our measure is the part of accruals that cannot be predicted from publicly available information, we label our measure unexpected accruals.
10 The Modified Jones Model takes into consideration the fact that some earnings management is done through real operations. Given that the auditor’s opinion is on the financial statement not the underlying operation, this model is less appropriate for this study. We also performed our analysis with the Modified Jones Model and our results are similar.
20
Das et al. 2007). We do take into consideration the difference in earnings management
across quarters by adding indicator variables in the tests of H4 and H5.
Current expected quarterly accruals are modeled as follows:
Current Accruals i,q = β1 (1/Assets i, q-1) + β2 (ΔRevenuei,q) + εi,q (2)
where Current Accruals is computed as net income before extraordinary items (item
#Q8) plus depreciation and amortization (item #Q5) minus operating cash flows (item
#108) for quarter q, Assets q-1 is total assets at the end of the previous quarter (item #Q6),
ΔRevenue is the change in revenue (item #12) from the previous quarter to the current
quarter, i is the firm, and q is the quarter. All variables (except 1/Assets) are scaled by
total assets at the end of the previous quarter (q-1).
The βs are estimated in cross-sectional regressions, one for each quarter and each
industry (2-digit SIC). Industry-quarters with less than 6 observations are excluded.
Following Kothari et al. (2004), we delete observations in which the absolute value of
total current accruals scaled by beginning total assets are greater than one. Earnings and
operating cash flows are winsorized at the level of the 1st and 99th percentiles to minimise
the bias induced by extreme firm performance (Dechow and Sloan 1995). The coefficient
estimates are then used to compute the expected accruals for each firm-quarter. The
difference between the firm’s actual and expected accruals is the measure of unexpected
accruals.
Unexpected accruals depend both on random errors caused by difficulties in
estimating accrual accounts and bias caused by managerial opportunism. Whether the
bias results in increased or decreased reported earnings depends on whether managers
need to add to pre-managed earnings to attain earnings target or to create reserves for
subsequent periods when the results exceed the target. Therefore we examine both signed
(UnAccruals) and absolute unexpected accruals (|UnAccruals|). Absolute unexpected
accruals are an indicator of random errors and/or non directional bias while signed
accruals are an indication managerial opportunism. We also examine whether the
association between timely reviews and earnings management is different for firms with
21
positive (income-increasing) unexpected accruals (PosUnAccruals). Indeed, auditors may
be more concerned with income-increasing than income decreasing accruals.
In order to test hypotheses H4 and H5 on the effect of timely interim reviews on
earnings quality, we use the following regression model.
ACCRUALS= α + β1 REVIEW *Q1-Q3 + β2 REVIEW*Q4 + β3 Q4 + β4 SIZE + β5 MGREORG + β6 ROA + β7 USA + β8 BIG4 + ε
(3)
where ACCRUALS equal, successively, |UnAccruals|, UnAccruals and PosUnAccruals
computed with the Jones Model, Q1-Q3 is equal to 1 for interim quarters and 0
otherwise, Q4 indicates a fourth-quarter observation and all other variables are defined as
before. Q1-Q3 and Q4 are introduced to take into account the differences in earnings
quality across quarters that have been documented in prior research. From H4, we
anticipate that in the interim quarters (Q1-Q3), unexpected accruals will be lower for
firms with a timely review, which means that β1 is expected to be negative. From H5, we
expect that the timely review of the three first quarters’ financial statements will decrease
the higher level of unexpected accruals generally found in the fourth quarter, which
means that β2 is expected to be negative.
Earnings reversals
As an alternative to current unexpected accruals, we also measure earnings quality with a
methodology developed by Das et al. (2007) for detecting unexpected accounting
changes in the fourth quarter caused by managerial opportunism. For each firm-year, the
earnings increase is measured for each of the interim quarters and for the last quarter as
the difference between the quarter’s earnings and those of the same quarter of the
previous year. If a firm’s earnings are down from the year before in the interim quarters,
it is expected that they will be down also in the last quarter of the year. A reversal of the
tendency of the first three quarters is considered as an indication of possible earnings
management. In fact, Das et al. (2007) find a significant association between the presence
of earnings reversals and accrual-based measures of fourth-quarter earnings management.
22
Following Das et al. (2007), we compute each quarter’s earnings change by
subtracting from the quarter’s earnings the earnings of the same quarter of the preceding
year. In any one year, if the firm has positive earnings changes in at least 2 interim
quarters and a negative change in the 4th quarter, it is classified as having a Positive to
Negative reversal. If it has at least 2 interim quarters with positive changes and a negative
change in the 4th quarter, it is classified as a Negative to Positive reversal. Firms which
experience neither type of reversal are in the non-reversal group.
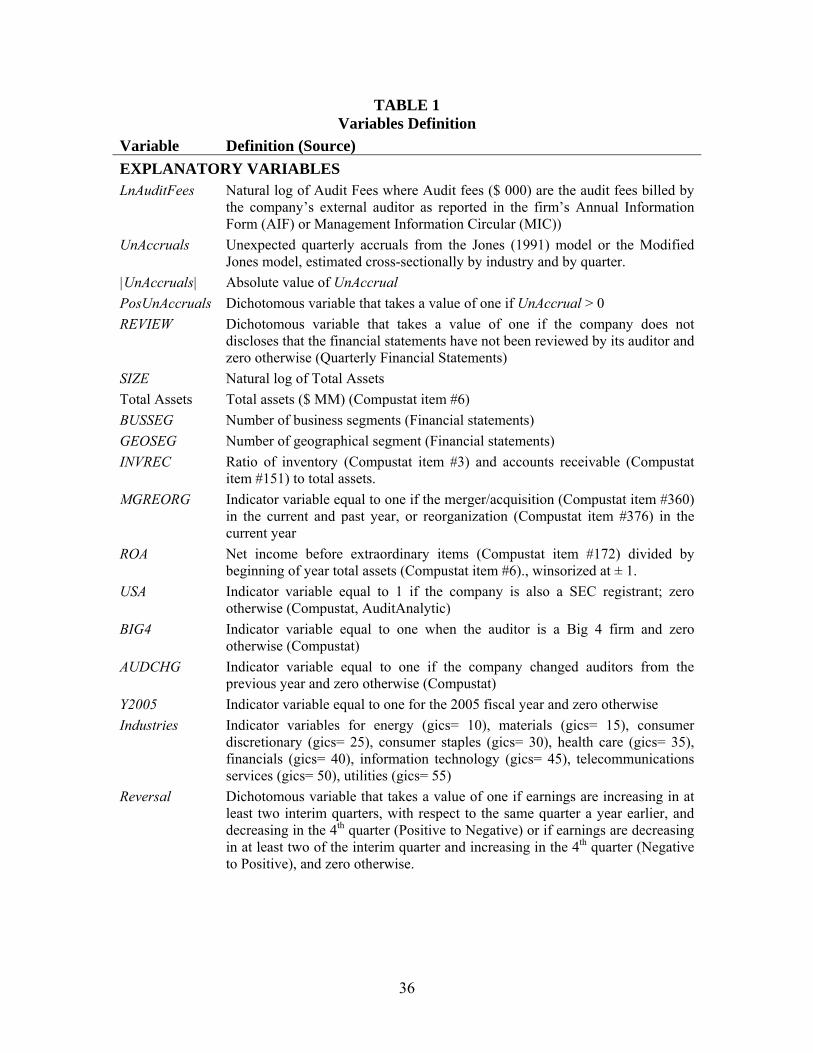
Table 1 provides a summary of the definition and sources of all variables.
TABLE 1
IV. RESULTS
Descriptive statistics
Table 2 provides descriptive data about the sample. Of the 1,690 companies included in
our sample, 59.47 percent did not disclose that their interim financial statements had not
been reviewed by their auditor. Thus, 1005 companies voluntarily purchased a timely
review. The timely review purchase rate is slightly higher than the 54 percent reported by
Ettredge et al. (1994) for a sample of 371 U.S. companies in 1989 and lower than the 80
percent reported by Manry et al. (2003) for a sample of 443 U.S. companies in 1995.
The average fees billed for the audit are $400,580 (median $125,370). While mean
Total Assets is quite large (more than 1 billion dollars), the median company is much
smaller with $95 millions of assets. This skewness is corrected with the variable SIZE.
More than one quarter of the companies are cross listed in the US (27.46%) and 76.33%
are audited by BIG4 firms.
Panel B of Table 2 provides summary statistics of our three measures of earnings
management. The unexpected current accruals from the Jones and the Modified Jones
models are very similar, their absolute value representing a little more than 4% of total
assets (means of 0.044 for the Jones model and 0.047 for the Modified Jones model). The
23
reversal measure detects earnings management only when it is important enough to
modify the earnings trend between the interim and the last quarter, which is why the
measure is much lower than with the accrual-based methodology. While the Jones model
finds 46.56 percent of firm-quarters with positive (income-increasing) unexpected
accruals, only 19.63 percent of firm-years are identified with negative-to-positive
reversals.
TABLE 2
Auditors Review and Audit Fees
Panel A of Table 3 shows that companies with reviewed interim financial statements
were billed higher audit fees, with a mean (median) audit fees of $574,020 ($188,350) for
companies with interim reviews and $146,110 ($69,510) for companies without.
TABLE 3
Panel B reports the coefficients and test statistics for the regressions of equation (1) .
Model 1 regresses LnAuditFees on Review and the control variables. Model 2 regresses
LnAuditFees on the explanatory variables separately for the companies with reviews
(model 2a) and without (model 2b).11 Running separate regressions allows the
coefficients to be different to account for the possibly different audit cost structure of
reviewed and non reviewed firms. The last columns of the table present the differences
between the coefficients for these two regressions. All three models are highly
significant. Model 1 has the highest explanatory power with an adjusted R2 of 0.78. The
R2 is lower for model 2a and 2b with R2 of 0.55 and 0.32 respectively.
Model 1 is used to test hypothesis H1 that timely reviews of interim financial
statements are associated with an increase in audit fees. In that model, the coefficient on
11 Because of the high correlation between BUSSEG and GEOSEG we exclude BUSSEG from the models.
24
REVIEW, has a positive value of 0.156 and is significant at the .01 level. Consequently,
having the interim financial statements reviewed is associated to an increase of
approximately 15 percent in audit fees. Thus, even if the cost of reviews may be partially
offset by a reduction of year-end audit fees, the net effect is an increase in the overall
audit and review fees billed by the auditors.
Consistent with the expectations based on prior research, audit fees are positively
associated with size (SIZE,), complexity (GEOSEG, INVREC, MGREORG), audit firm
professional risk (1-ROA, USA), and the use of a Big 4 auditing firms (BIG4). The
coefficient on AUDCHG, while not significant in Models 1 and 2b, is negative and
significant in Model 2a. The coefficient on Y2005, is positive and significant indicating
that audit fees have increased from 2004 and 2005.
Comparison of the coefficients of Models 2a and 2b indicates that four regression
coefficients differ across the two groups of firms (Intercept, SIZE, MGREORG, ROA).
The audit cost structure of reviewed and non reviewed firms seems to be different.
Hypotheses H2 and H3 propose that the effect of the review will decrease with SIZE and
increase with the number of segments (GEOSEG). Contrary to the expectation (H2), the
effect of firm size is significantly larger when there is a review, suggesting that the cost
increment of a review is increasing with size. It should be noted, however, that the
intercept is significantly smaller for non reviewed firms. The effect of GEOSEG is not
significantly different between the two models. Contrary to the expectation, the number
of geographic segments (GEOSEG) does not increase the cost of a review. We repeat the
analysis of Models 2a and 2b with the number of business segments (BUSEG) and find
similar results (not tabulated).
Contrary to the suggestion of Ettredge et al. (1994), the lack of significant difference
on RECINV indicates that a higher proportion of accounts receivable and inventory does
not increase the cost of quarterly review. Such a result is consistent with the CICA
standards, which indicate that a review does not generally include tests of details. The
difference on MGREORG suggests that having a timely review reduce the effect on audit fees of
being involved in a merger/acquisition or a reorganization.
25
Timely Review and Earnings Quality
Tables 4, 5 and 6 show the results of testing hypotheses H4 and H5. In Table 4, earnings
quality is (negatively) measured by unexpected current accruals from a cross-sectional
version of the Jones (1991) applied to current accruals. In Panel A as well as in Figure 1,
the univariate comparison of absolute unexpected accruals (|UnAccruals|) reveals that
they are significantly higher for firms whose interim reports are not reviewed by the
auditor on a timely basis. For the interim reports, unexpected accruals are 0.045 for firms
without a timely review and 0.033 for the reviewed quarterly reports. The difference of
0.081 vs. 0.051 for the fourth quarter is also significant at the 0.01 level. This first result
seems to support H4 that timely reviews are significantly associated with lower levels of
earnings management. This result does not hold for signed unexpected accruals
(UnAccruals), however. The mean and median unexpected accruals are negative (i.e.
income-decreasing) for both reviewed and non-reviewed firms in interim reports as well
as in the fourth quarter, and non-reviewed firms have more income-decreasing accruals
although none of the differences are significant.
FIGURE 1
Panel B of Table 4 shows the results of the multivariate analysis which takes into
account other factors that have been found to affect the level of accruals. The first section
of the panel refers to the regression with absolute unexpected accruals (|UnAccruals|) as
the dependent variable. While the effect of the review on fourth-quarter accruals, as
measured by the coefficient on the interaction term REVIEW*Q4, is negative and
significant (-0.013, p=0.003), as expected, the coefficient on the interaction term
REVIEW*Q1-Q3, is significantly positive (0.005, p=0.042), suggesting that unexpected
accruals are higher with a review. Hence, H4 seems to be supported only for the final
quarter of the year. It seems that having a review results in a more timely consideration of
the possible difficulties in estimating accrual accounts in the interim quarters and in
curtailing of managerial opportunism at year-end.
26
Hypothesis H5 seems to be supported, however, since the coefficient on REVIEW*Q4
is negative and lower than that of REVIEW*Q1-Q3, which is positive. Hence, the
reduction in unexpected accruals associated with timely review is stronger for Q4 than
for Q1-Q3.
The significantly positive coefficient on Q4 indicates that absolute unexpected
accruals are higher in the fourth quarter than in the interim quarters, which is consistent
with prior results on the difference in earnings management across quarters.
The two remaining models of Panel B in Table 4 take into consideration whether the
unexpected accruals are positive (income-increasing) or negative. The estimation of both
β1 and β2 are insignificant both when the signed accruals are used as the dependant
variable (UnAccruals) and when we only consider whether the unexpected accruals are
positive or not (PosUnAccruals).
Contrary to the model for absolute accruals where it is positive, the coefficient on Q4
is significantly negative in both regressions, suggesting that the increase in unexpected
accruals observed in the first model relates to income-decreasing accruals. This is
consistent with the hypothesis that fourth-quarter accruals are used for the correction of
errors made in the first three quarters rather than for attaining earnings targets or avoiding
the reporting of small losses.
TABLE 4
Table 5 presents the analysis based on fourth-quarter earnings reversal as a measure
of earnings management. Panel A shows that the percentage of reversals is essentially the
same between firms who have a timely review and those who don’t. It is even a little
higher for firms with a review, although the difference between the two groups is not
significant. This is true both for the positive-to-negative (PN) and the negative-to-positive
(NP) firms. This contradicts the results obtained with unexpected accruals. This is to be
expected, however, since earnings reversals represent a much more restrictive measure of
earnings management.
27
TABLE 5
The absence of association between interim review and earnings reversal is confirmed
by the results of the logistic regression presented in Panel B of Table 5. Whether the NP
and PN reversals are considered separately, in the second or third model, or together in
the first model, none of the coefficient estimates on the dichotomous variable Review is
significantly different from zero.
This result puts in question the benefits that are expected from a timely auditor review
of quarterly financial statements. While the review seems to significantly reduce the size
of fourth-quarter absolute unexpected accruals, it does not seem to be enough to impede
levels of earnings management that cause a reversal of earnings trend between interim
quarters and year-end. One must be cautious, however, in interpreting the results of Table
5, since the explanatory power of the model, as measured by the R2 and the likelihood
ratio χ2, is very low.
V EXTENSIONS AND SENSITIVITY ANALYSES
Audit Fees
Excluding small and large firms
Given that none of the companies with SIZE smaller than 5.66 had their interim financial
statements reviewed and all of the companies with size larger than 15.00 had theirs
reviewed, we also perform an analysis excluding these 139 observations. The results (non
tabulated) related to the experimental variables hold. The coefficient on REVIEW is
slightly higher (0.162 instead of 0.156). The effect of size is still larger when there is a
review than not (H2), but the increase is smaller 0.071 instead of 0.248 in Table 3 and the
increase is now marginally significant (p=0.062). As in the main analysis, the number of
geographic segments (GEOSEG) is not significantly associated the cost of a review (H3).
To better control for the effect of SIZE on our results, we match the reviewed and non
reviewed firms based on SIZE. The analysis of the 547 pairs (1094 firms) still indicates a
28
significant audit fees increase associated with a review of quarterly financial statements
(REVIEW =0.134). The effect of firm size is still larger when there is a review, but the
increase is smaller 0.080 and not statistically significant (p=0.52)
Excluding cross-listed firms
In our tests of the impact of an interim review on audit fees, we control for the cost
increase associated with being cross-listed in the U.S (Choi et al. 2008) with a
dichotomous variable. Given that cross-listing in the U.S may also affect the audit cost
function, we repeat the analysis excluding those firms. The results are unchanged. An
auditor’s review of quarterly financial statements is associated with a statistically
significant increase audit fees (H1). The coefficient on REVIEW is slightly lower
however, with a value of 0.134 instead of 0.156. As with the full sample, the effect of
firm size is significantly larger when there is a review than not (H2) and the number of
geographic segments (GEOSEG) is not significantly associated the cost of a review (H3).
Other Measures of Earnings Quality
Modified Jones Model
The Jones model does not take into account that some earnings management is done through real
operations rather than with accounting accruals. Graham et al. (2005) find that 78% of the 400
executives they surveyed say they would be likely to take economic actions to smooth earnings
while only 21% say they would do it primarily through accounting choices. Given that an audit
and a review control primarily for the way operations are accounted not for the nature of the
operations, we used the Jones Model on our main analysis. However, some operations such as
channel stuffing may be detected by the auditors. To examine this issue, we perform the analysis
using the Modified Jones Model, which accounts for both real and accrual-based earnings
management. The results (Table 6, Panel A) are very similar to those of Table 4. For
|UnAccruals|, the coefficients on REVIEW*Q4 and on REVIEW*Q1-Q3 are significant and
slightly larger than those of the basic Jones Model (-0.012 versus -0.013, and 0.007
versus 0.005 respectively). As in Table 4, these coefficients are not significant for the
signed accruals (UnAccruals) and when we consider whether the unexpected accruals are
positive or not (PosUnAccruals).
29
TABLE 6
Total Accruals
To take into account the impact of a review on accruals from long terms assets and
liabilities (e.g., impairment of long term assets, differed tax, etc.) we repeat the analysis
using the Total accruals. As indicated in Panel B of Table 6, for |UnAccruals|, the results on
REVIEW*Q4 and on REVIEW*Q1-Q3 are very similar to those of the current accruals.
For the signed accruals (UnAccruals) these coefficients are not significant as for the
current accruals. The only differences are for PosUnAccruals where the coefficients on
REVIEW*Q1-Q3 and REVIEW*Q4 are now significant and negative (-0.098, p =.03 and -
0.185, p. = .01). Thus, a review reduces the likelihood of positive unexpected total
accruals in all four quarters, suggesting that it might reduce income increasing earnings
management in non current assets. The non significant coefficients for UnAccruals
suggest that this effect does not hold for the value of signed accruals.
Unexpected accruals adjusted for performances
The Jones Model has been found to be quite efficient at detecting unexpected accruals,
except for firms with extreme performance, i.e. firms with very high or very low cash
flows from operations or net income. To correct for this weakness of the model,
researchers have added independent variables to control for extreme performance. Bowen
et al. (2007) add the change in operating cash flows, Cohen et al. (2004) add current cash
flow level, a measure of current operating performance, Kothari et al (2002) add return
on assets (ROA) to the regression model and Jeter and Shivakumar (1999) add a discrete
variable indicating the quintile in which the firm’s cash flows from operations falls, with
respect to the other sample firms. As an alternative to adding ROA to the model, Kothari
et al. (2002) also use a matched pair design where control firms are matched by ROA and
find that this methodology is more efficient at reducing the bias induced by extreme
performance. Finally, Kasznik (1999) uses a portfolio technique to adjust a firm’s
unexpected accruals for the median of a group of firms which belong to the same
percentile in the distribution of ROA.
30
Other modifications have been also proposed. Cohen et al. (2004) add the firm’s
Book/Market ratio to the Modified Jones Model to take into account the fact that fast
growing firms are likely to have larger accruals, even in the absence of earnings
management. This decreases the likelihood of classifying as discretionary some accruals
which are in fact non-discretionary.
As a robustness test, we use Kasznik’s (1999) protfolio methodology to minimise
the bias due to extreme performance. We rank all our sample firms on their ROA and
form 100 percentile portfolios. A firm’s Adjusted unexpected accruals is calculated by
subtracting from its unexpected accruals (from the Jones Model) the median unexpected
accruals of the firms which belong to the same ROA percentile. As Table 6, Panel C
shows, the results for the adjusted unexpected total accruals are similar to those obtained
using the traditional Jones Model, although the results for Review Q1-Q3 are a little
weaker, the coefficients being only marginally significant. The inferences drawn from the
previous tests seem to be robust to the measure of unexpected accruals. 12
CONCLUSION
In this study we examine the costs and benefits associated with the performance of a
timely review of quarterly financial statements by the company’s auditor and find that
total audit fees are 15 percent higher for companies with timely reviews. We also
examine the cost drivers of a review. We find that contrary to expectations based on audit
firms’ comments (e.g. PriceWaterhouseCoopers 1999) the costs are proportionately lower
for smaller companies. Our results also suggest that having a timely review reduces the
effect on audit fees of being involved in a merger or a reorganization, a result that is consistent
with the benefits of the timely involvement of the auditor in these situations.
The main benefit from timely reviews is the improvement in interim financial reports.
In our sample of Canadian firms, we find a significant increase (not a decrease) in the
12 In addition, we use changes from third- to fourth-quarter effective tax rates as a measure of earnings management (Dhaliwal et al. 2004) and find that having a review has no effect on this measure of earnings management.
31
level of unexpected accruals in the interim reports that have been reviewed by the
auditors, as compared with those that had not been reviewed, but a significant decrease in
the fourth-quarter unexpected accruals. Moreover, when the level of earnings
management is measured by the presence of an earnings reversal in the fourth quarter, the
effect of timely reviews seem to disappear.
Mandatory timely reviews were required before the enactment of the Sarbanes-Oxley
Act (2002) with its new requirement regarding disclosure controls and procedures,
internal control over financial reporting, and audit committees. Given that internal
controls and assurance services are alternative means to improve the quality of interim
reports, future research could examine the cumulative effect of these controls and
assurance service on the quality of interim reports as well as their cumulative costs.
Regulators should also take into account the benefit and costs of these
alternative/complementary means of control before requiring mandatory quarterly
reviews.
32
References
Alford, M. R., and T. P. Edmonds. 1981. A Replication: Does Audit Involvement Affect the Quality of Interim Report Numbers? Journal of Accounting, Auditing & Finance 4 (3):255-264.
American Institute of Certified Public Accountants (AICPA), Auditing Standard Board. 1992. Statement on Auditing Standards No. 71, Interim Financial Information. New York, NY: AICPA.
Boritz, E. 2006. Maintaining Quality Capital Markets Through Quality Information. A Discussion Paper prepared for the Capital Markets Leadership Task Force.
Bowen R., M. S. Rajgopal, and M. Venkatachalam. 2007. Accounting Discretion, Corporate Governance and Firm Performance. WP Duke University
Canadian Institute of Chartered Accountants (CICA). Section 7050 - Auditor review of interim financial statements. Toronto: CICA.
Canadian Securities Administrators (CSA). 2003a. Multilateral Instrument 52-110 Audit Committees.
Canadian Securities Administrators (CSA). 2003b. Multilateral Instrument 51-102 Continuous Disclosure Obligations.
Choi, J.-H., m. J.-B. Kim, X. Liu, and D. A. Simunic. 2008. Audit Pricing, Legal Liability Regimes, and Big 4 Premiums: Theory and Cross-country Evidence. Contemporary Accounting Research 25 (1):55–99.
Clarkson, P.M., and D.A. Simunic. 1994 The association between audit quality, retained ownership, and firm-specific risk in the US vs. Canadian IPO markets. Journal of Accounting and Economics, 17, 207-228.
Cohen, D.A., A. Dey and T.Z. Lys. 2004. Trends in Earnings Management and Informativeness of Earnings: Announcements in the Pre- and Post-Sarbanes Oxley Periods. Working paper. Northwestern University
Das, S., P.K. Shroff and H. Zhang. 2007. Quarterly earnings patterns and earnings management. Working Paper. University of Minnesota.
Dechow P.M.; S.A. Richardson; I. Tuna. 2003 Why Are Earnings Kinky? An Examination of the Earnings Management Explanation. Review of Accounting Studies, 8/ 2-3: 355-383.
Dechow, P.M. and I. Dichev. 2002. The quality of accruals and earnings: The role of accrual estimation errors. The Accounting Review. Vol. 77, p.35-59
Dechow, P.M. and R.G. Sloan. 1995. Detecting earnings management. The Accounting Review 70 (April): 193-225.
DeFond, M.L. and C.W. Park. 2001. “The Reversal of Abnormal Accruals and the Market Valuation of Earnings Surprises.” The Accounting Review. 76/3, pp. 375–404.
33
Dhaliwal, D., C. Gleason, and L. Mills. 2004. Last chance earnings management: Using the tax expense to meet analysts’ forecasts. Contemporary Accounting Research 21: 431-459.
Durtschi, C. and P. Easton. 2005. Earnings management? The shapes of the frequency distributions of earnings metrics are not evidence ipso facto. Journal of Accounting Research 43: 521-556.
Edmonds, T. P. 1983. The effect of auditor involvement on the predictive capacity of interim financial information. Journal of business finance & accounting 10-3 (Autumn): 429-441.
Ettredge, M., D. Simon, D. Smith, and M. Stone. 1994. Why Do Companies Purchase Timely Quarterly Reviews? Journal of Accounting and Economics 18: 131-155.
Ettredge, M., D. T. Simon, D. B Smith, M. S Stone. 2000a. Would switching to timely reviews delay quarterly and annual earnings releases? Review of Quantitative Finance and Accounting, 14, 111-130.
Ettredge, M., D. T. Simon, D. B Smith, M. S Stone. 2000b. The effect of the external accountant's review on the timing of adjustments to quarterly earnings. Journal of Accounting Research, 38-1 (Spring): 195-207
Financial Executives International (FEI) 2005. FEI Survey on SOX Section 404 Implementation/March 2005. [online] http://fei.mediaroom.com/index.php?s=43&item=47 [accessed July 20, 2008]
Five Year Review Committee (Crowford Committee). 2003. Five Year Review Committee Final Report ~ Reviewing the Securities Act (Ontario). Toronto: Queen’s Printer for Ontario, 303.
Francis, J. R. 2004. What do we know about audit quality? The British Accounting Review 36 (4):345-368.
Frankel, R., M. Johnson, and K. Nelson. 2002. The relation between auditors’ fees for non-audit services and earnings management. The Accounting Review (Supplement): 71-105.
Givoly, D., J. Ronen, and A. Schiff. 1978. Does Audit Involvement Affect the Quality of Interim Report Numbers? Journal of Accounting, Auditing & Finance 1 (4):361-372.
Graham, J.R., C.R. Harvey and S. Rajgopal 2005. The economic implications of corporate financial reporting. Journal of Accounting and Economics. 40/1-3, p. 3-73
Hay, D. C., W. R. Knechel, and N. Wong. 2006. Audit Fees: A Meta-analysis of the Effect of Supply and Demand Attributes. Contemporary Accounting Research 23 (1):141-191.
Healy, P.M. and K.G. Palepu 1993) The effect of firms’ financial disclosure strategies on stock prices. Accounting Horizons, 7/1: 111.
Huron Consulting Group 2005. 2004 Annual Review of Financial Reporting Matters. [online] http://www.huronconsultinggroup.com/library/Huron_2004_Review_of_Financial_Reporting_Matters.pdf. [accessed July 20, 2008]

34
Jacob, J. and B. Jorgensen. 2007. Earnings management and accounting income aggregation. Journal of Accounting and Economics, 43, 369-390.
Jeter, D., and L. Shivakumar. 1999. Cross-sectional estimation of abnormal accruals using quarterly and annual data: Effectiveness in detecting event-specific earnings management. Accounting and Business Research 29 (4): 299-319.
Jones, J. 1991. “Earnings Management During Import Relief Investigations.” Journal of Accounting Research 29, 193-228.
Kerstein, J., and A. Rai. 2007. Intra-year shifts in the earnings distribution and their implications for earnings management. Journal of Accounting and Economics,44 p. 399-419.
Kothari, S.P., A. J. Leone, and C. E. Wasley. 2005. Performance matched discretionary accrual measures. Journal of Accounting and Economics 39: 163–197.
Levitt, A. 1998. The Number Game. Address to the NYU Center for Law and Business (Sept. 28 1998).
Mangena, M., and V. Tauringana. 2007. Corporate Compliance with Non-Mandatory Statements of Best Practice: The Case of the ASB Statement on Interim Reports. European Accounting Review 16 (2):399 - 427.
Manry, D., S. L. Tiras, and C. M. Wheatley. 2003. The Influence of Interim Auditor Reviews on the Association of Returns with Earnings. Accounting Review 78 (1):251.
Myers, J. N., L. A. Myers, and D. J. Skinner. 2007. Earnings Momentum and Earnings Management. Journal of Accounting, Auditing & Finance 22 (2):249-284.
National Association of Corporate Directors (NACD). 2000. Report of the NACD Blue Ribbon Commission on Audit Committees: A Practical Guide. Washington, DC: The National Association of Corporate Directors and The Center for Board Leadership.
National Commission on Fraudulent Financial Reporting (NCFFR). 1987. Report of the Commission on Fraudulent Financial Reporting. New York, NY: NCFR.
Nelson, M. W., J. A. Elliott, and R. L. TarpIey. 2002. Evidence from Auditors about Managers' and Auditors' Earnings Management Decisions. Accounting Review 77 (4):175.
Ontario Securities Commission (OSC). 2000a. Notice of proposed rule 52-501 and companion policy 52-501CP financial statements. Toronto: Ontario Securities Commission.
———. 2000b. Notice of rule 52-501 Financial statements and companion policy 52-501CP. Toronto: Ontario Securities Commission.
———. 2002. Staff notice 52-713 Report on staff’s review of interim financial statements and interim management’s discussion and analysis. Toronto: Ontario Securities Commission.
———. 2004. National Instrument 51-102 Continous Disclosure Obligations. Toronto: Ontario Securities Commission.
Palmrose, Z.-V., V. J. Richardson, and S. Scholz. 2004. Determinants of market reactions to restatement announcements. Journal of Accounting and Economics 37 (1):59-89.
PricewaterhouseCoopers LLP. 1999. Comment on the Proposed Rule of the Securities and Exchange Commission (Commission), Audit Committee Disclosure.
35
Public Accounting Report, 1994. Deloitte & Touche requires timely quarterly reviews. Public Accounting Report, 5.
Roychowdhury, S. 2006. Earnings management through real activities manipulation. Journal of Accounting and Economics 42: 335-370.
Salamon, G. and T. Stober. 1994. Cross-quarter differences in the security price response to earnings announcements: Fourth quarter and seasonality influences. Contemporary Accounting Research: 297-330.
Securities and Exchange Commission (SEC) 1976. Accounting series release no. 177, in Accounting Series Releases SEC Docket 7, No. 17. Washington, DC: Government Printing office.
Securities and Exchange Commission (SEC) 1989, Request for comment on increasing the level of involvement of the independent accountant with interim financial information. Washington, DC: Government Printing office.
Securities and Exchange Commission (SEC). 1999a. Proposed Rule: Audit Committee Disclosure, 17 CFR Parts 210, 228, 229, and 240. SEC Release No. 34-41987. http://www.sec.gov/rules/proposed/34-41987.htm.
Securities and Exchange Commission (SEC). 1999b. Final Rule: Audit Committee Disclosure, 17 CFR Parts 210, 228, 229, and 240. SEC Release No. 34-42266. http://www.sec.gov/rules/final/34-42266.htm.
Simunic, D. A. 1980. The Pricing of Audit Services: Theory and Evidence. Journal of Accounting Research 18 (1):161-190.
Wright, A., and S. Wright. 1997. An Examination of Factors Affecting the Decision to Waive Audit Adjustments. Journal of Accounting, Auditing & Finance 12 (1):15-36.
36
TABLE 1 Variables Definition
Variable Definition (Source) EXPLANATORY VARIABLES LnAuditFees Natural log of Audit Fees where Audit fees ($ 000) are the audit fees billed by
the company’s external auditor as reported in the firm’s Annual Information Form (AIF) or Management Information Circular (MIC))
UnAccruals Unexpected quarterly accruals from the Jones (1991) model or the Modified Jones model, estimated cross-sectionally by industry and by quarter.
|UnAccruals| Absolute value of UnAccrual PosUnAccruals Dichotomous variable that takes a value of one if UnAccrual > 0 REVIEW Dichotomous variable that takes a value of one if the company does not
discloses that the financial statements have not been reviewed by its auditor and zero otherwise (Quarterly Financial Statements)
SIZE Natural log of Total Assets Total Assets Total assets ($ MM) (Compustat item #6) BUSSEG Number of business segments (Financial statements) GEOSEG Number of geographical segment (Financial statements) INVREC Ratio of inventory (Compustat item #3) and accounts receivable (Compustat
item #151) to total assets. MGREORG Indicator variable equal to one if the merger/acquisition (Compustat item #360)
in the current and past year, or reorganization (Compustat item #376) in the current year
ROA Net income before extraordinary items (Compustat item #172) divided by beginning of year total assets (Compustat item #6)., winsorized at ± 1.
USA Indicator variable equal to 1 if the company is also a SEC registrant; zero otherwise (Compustat, AuditAnalytic)
BIG4 Indicator variable equal to one when the auditor is a Big 4 firm and zero otherwise (Compustat)
AUDCHG Indicator variable equal to one if the company changed auditors from the previous year and zero otherwise (Compustat)
Y2005 Indicator variable equal to one for the 2005 fiscal year and zero otherwise Industries Indicator variables for energy (gics= 10), materials (gics= 15), consumer
discretionary (gics= 25), consumer staples (gics= 30), health care (gics= 35), financials (gics= 40), information technology (gics= 45), telecommunications services (gics= 50), utilities (gics= 55)
Reversal Dichotomous variable that takes a value of one if earnings are increasing in at least two interim quarters, with respect to the same quarter a year earlier, and decreasing in the 4th quarter (Positive to Negative) or if earnings are decreasing in at least two of the interim quarter and increasing in the 4th quarter (Negative to Positive), and zero otherwise.
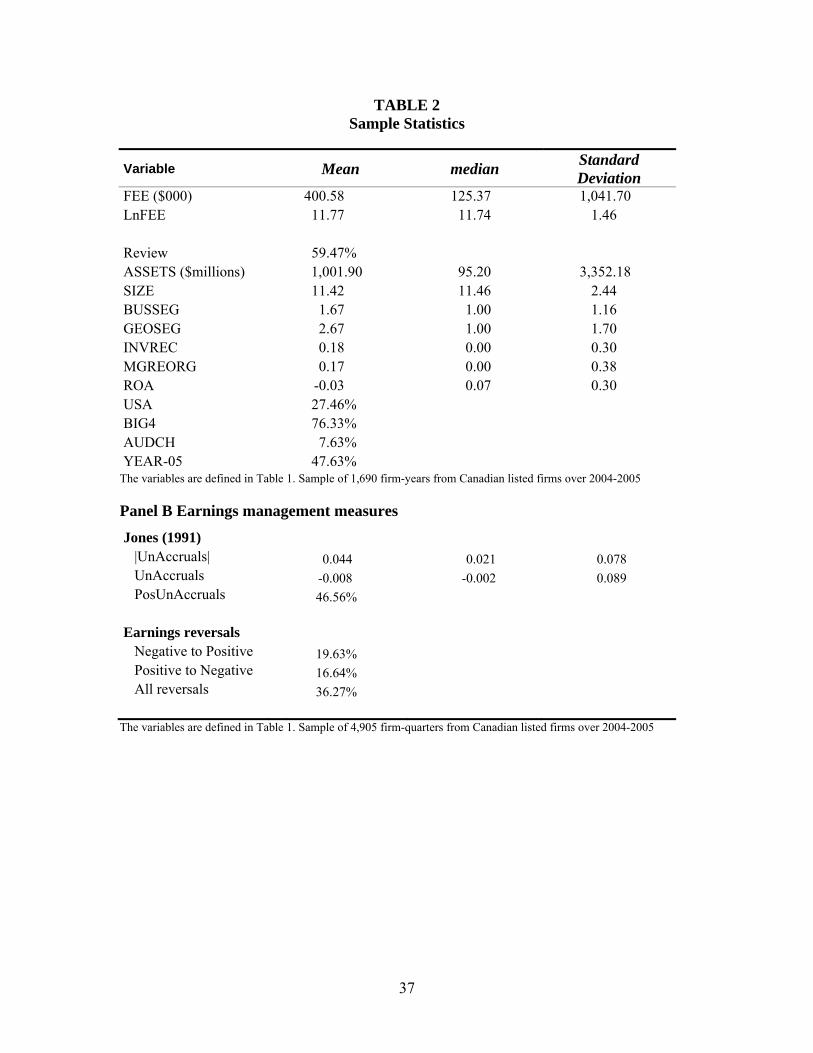
37
TABLE 2 Sample Statistics
Variable Mean median Standard Deviation
FEE ($000) 400.58 125.37 1,041.70 LnFEE 11.77 11.74 1.46 Review 59.47% ASSETS ($millions) 1,001.90 95.20 3,352.18 SIZE 11.42 11.46 2.44 BUSSEG 1.67 1.00 1.16 GEOSEG 2.67 1.00 1.70 INVREC 0.18 0.00 0.30 MGREORG 0.17 0.00 0.38 ROA -0.03 0.07 0.30 USA 27.46% BIG4 76.33% AUDCH 7.63% YEAR-05 47.63%
The variables are defined in Table 1. Sample of 1,690 firm-years from Canadian listed firms over 2004-2005
Panel B Earnings management measures
Jones (1991) |UnAccruals| 0.044 0.021 0.078 UnAccruals -0.008 -0.002 0.089 PosUnAccruals 46.56% Earnings reversals Negative to Positive 19.63% Positive to Negative 16.64% All reversals 36.27%
The variables are defined in Table 1. Sample of 4,905 firm-quarters from Canadian listed firms over 2004-2005
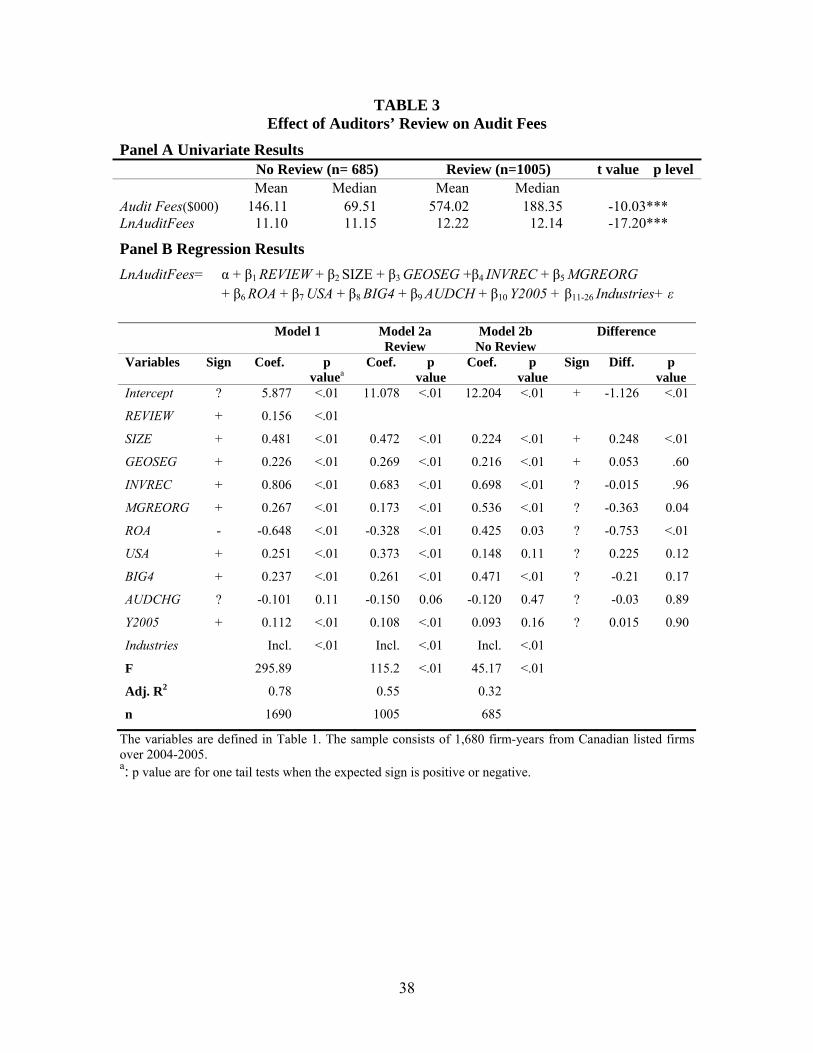
38
TABLE 3 Effect of Auditors’ Review on Audit Fees
Panel A Univariate Results No Review (n= 685) Review (n=1005) t value p level
Mean Median Mean Median Audit Fees($000) 146.11 69.51 574.02 188.35 -10.03***LnAuditFees 11.10 11.15 12.22 12.14 -17.20***
Panel B Regression Results LnAuditFees= α + β1 REVIEW + β2 SIZE + β3 GEOSEG +β4 INVREC + β5 MGREORG
+ β6 ROA + β7 USA + β8 BIG4 + β9 AUDCH + β10 Y2005 + β11-26 Industries+ ε Model 1 Model 2a
Review Model 2b
No Review Difference
Variables Sign Coef. p valuea
Coef. p value
Coef. p value
Sign Diff. p value
Intercept ? 5.877 <.01 11.078 <.01 12.204 <.01 + -1.126 <.01
REVIEW + 0.156 <.01
SIZE + 0.481 <.01 0.472 <.01 0.224 <.01 + 0.248 <.01
GEOSEG + 0.226 <.01 0.269 <.01 0.216 <.01 + 0.053 .60
INVREC + 0.806 <.01 0.683 <.01 0.698 <.01 ? -0.015 .96
MGREORG + 0.267 <.01 0.173 <.01 0.536 <.01 ? -0.363 0.04
ROA - -0.648 <.01 -0.328 <.01 0.425 0.03 ? -0.753 <.01
USA + 0.251 <.01 0.373 <.01 0.148 0.11 ? 0.225 0.12
BIG4 + 0.237 <.01 0.261 <.01 0.471 <.01 ? -0.21 0.17
AUDCHG ? -0.101 0.11 -0.150 0.06 -0.120 0.47 ? -0.03 0.89
Y2005 + 0.112 <.01 0.108 <.01 0.093 0.16 ? 0.015 0.90
Industries Incl. <.01 Incl. <.01 Incl. <.01
F 295.89 115.2 <.01 45.17 <.01
Adj. R2 0.78 0.55 0.32
n 1690 1005 685
The variables are defined in Table 1. The sample consists of 1,680 firm-years from Canadian listed firms over 2004-2005. a: p value are for one tail tests when the expected sign is positive or negative.
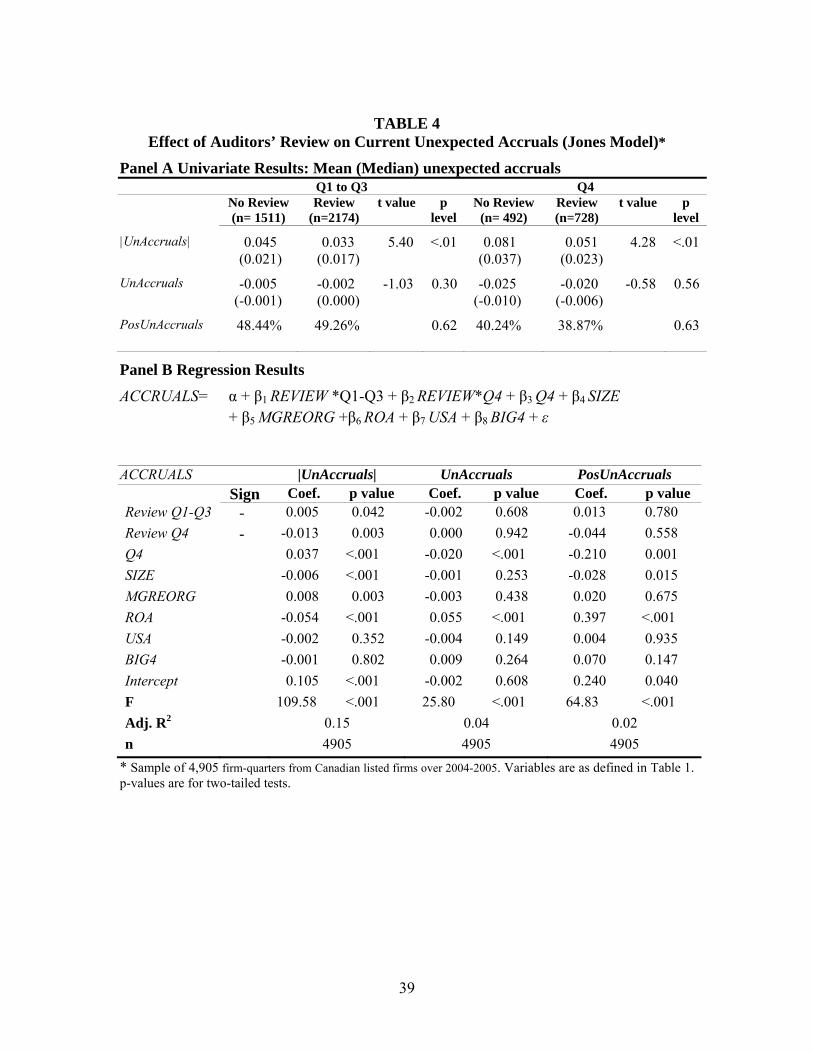
39
TABLE 4
Effect of Auditors’ Review on Current Unexpected Accruals (Jones Model)*
Panel A Univariate Results: Mean (Median) unexpected accruals Q1 to Q3 Q4 No Review
(n= 1511) Review
(n=2174) t value p
level No Review
(n= 492) Review (n=728)
t value p level
|UnAccruals| 0.045 0.033 5.40 <.01 0.081 0.051 4.28 <.01 (0.021) (0.017) (0.037) (0.023) UnAccruals -0.005 -0.002 -1.03 0.30 -0.025 -0.020 -0.58 0.56 (-0.001) (0.000) (-0.010) (-0.006) PosUnAccruals 48.44% 49.26% 0.62 40.24% 38.87% 0.63
Panel B Regression Results
ACCRUALS= α + β1 REVIEW *Q1-Q3 + β2 REVIEW*Q4 + β3 Q4 + β4 SIZE + β5 MGREORG +β6 ROA + β7 USA + β8 BIG4 + ε
ACCRUALS |UnAccruals| UnAccruals PosUnAccruals
Sign Coef. p value Coef. p value Coef. p valueReview Q1-Q3 - 0.005 0.042 -0.002 0.608 0.013 0.780 Review Q4 - -0.013 0.003 0.000 0.942 -0.044 0.558 Q4 0.037 <.001 -0.020 <.001 -0.210 0.001 SIZE -0.006 <.001 -0.001 0.253 -0.028 0.015 MGREORG 0.008 0.003 -0.003 0.438 0.020 0.675 ROA -0.054 <.001 0.055 <.001 0.397 <.001 USA -0.002 0.352 -0.004 0.149 0.004 0.935 BIG4 -0.001 0.802 0.009 0.264 0.070 0.147 Intercept 0.105 <.001 -0.002 0.608 0.240 0.040 F 109.58 <.001 25.80 <.001 64.83 <.001 Adj. R2 0.15 0.04 0.02 n 4905 4905 4905
* Sample of 4,905 firm-quarters from Canadian listed firms over 2004-2005. Variables are as defined in Table 1. p-values are for two-tailed tests.
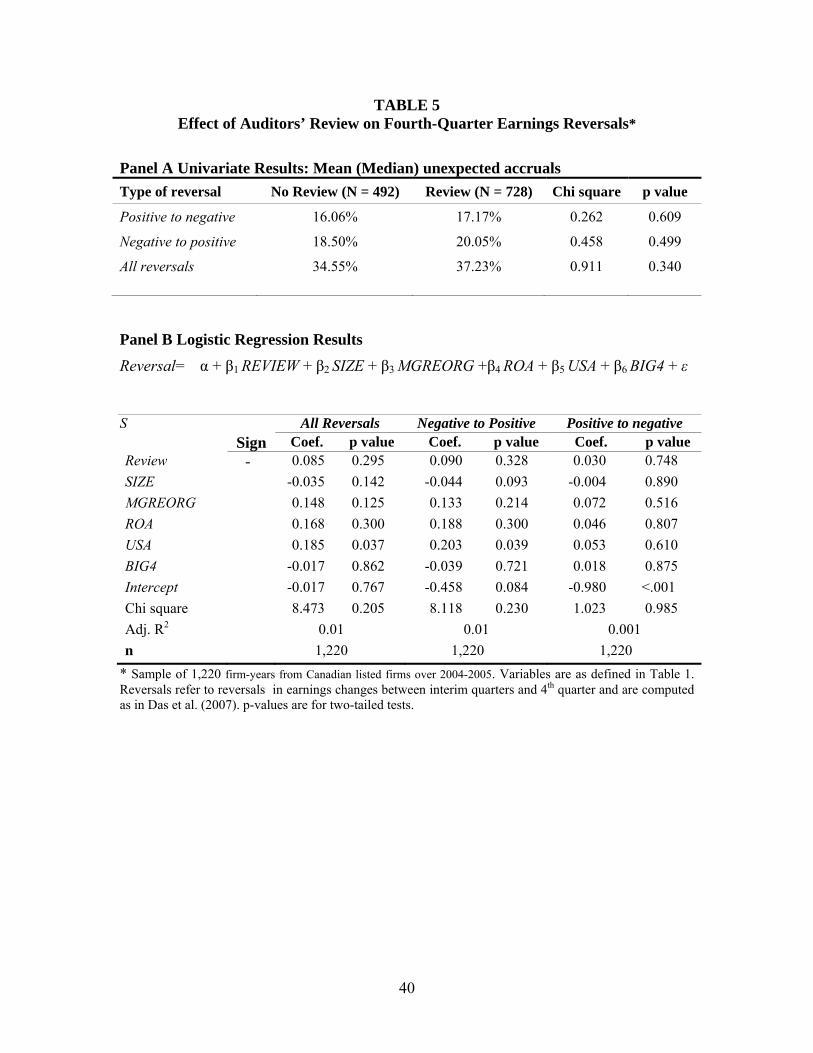
40
TABLE 5 Effect of Auditors’ Review on Fourth-Quarter Earnings Reversals*
Panel A Univariate Results: Mean (Median) unexpected accruals Type of reversal No Review (N = 492) Review (N = 728) Chi square p value
Positive to negative 16.06% 17.17% 0.262 0.609
Negative to positive 18.50% 20.05% 0.458 0.499
All reversals 34.55% 37.23% 0.911 0.340
Panel B Logistic Regression Results
Reversal= α + β1 REVIEW + β2 SIZE + β3 MGREORG +β4 ROA + β5 USA + β6 BIG4 + ε S All Reversals Negative to Positive Positive to negative
Sign Coef. p value Coef. p value Coef. p valueReview - 0.085 0.295 0.090 0.328 0.030 0.748 SIZE -0.035 0.142 -0.044 0.093 -0.004 0.890 MGREORG 0.148 0.125 0.133 0.214 0.072 0.516 ROA 0.168 0.300 0.188 0.300 0.046 0.807 USA 0.185 0.037 0.203 0.039 0.053 0.610 BIG4 -0.017 0.862 -0.039 0.721 0.018 0.875 Intercept -0.017 0.767 -0.458 0.084 -0.980 <.001 Chi square 8.473 0.205 8.118 0.230 1.023 0.985 Adj. R2 0.01 0.01 0.001 n 1,220 1,220 1,220
* Sample of 1,220 firm-years from Canadian listed firms over 2004-2005. Variables are as defined in Table 1. Reversals refer to reversals in earnings changes between interim quarters and 4th quarter and are computed as in Das et al. (2007). p-values are for two-tailed tests.
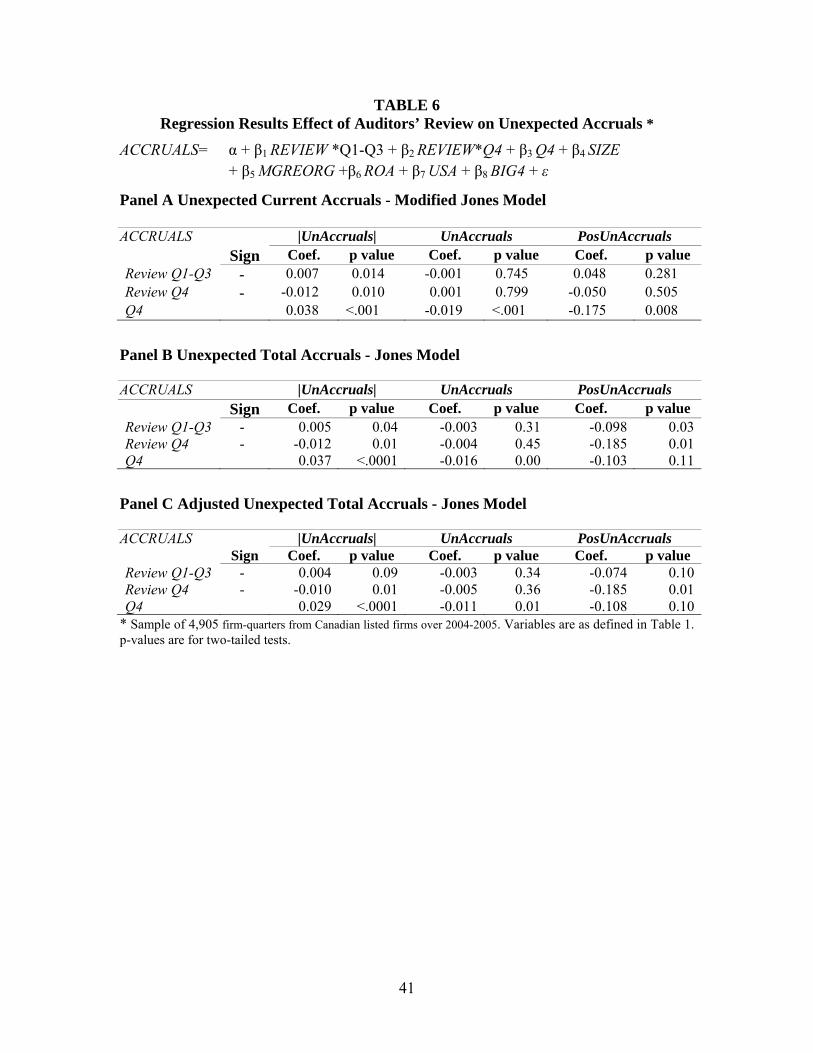
41
TABLE 6 Regression Results Effect of Auditors’ Review on Unexpected Accruals *
ACCRUALS= α + β1 REVIEW *Q1-Q3 + β2 REVIEW*Q4 + β3 Q4 + β4 SIZE + β5 MGREORG +β6 ROA + β7 USA + β8 BIG4 + ε
Panel A Unexpected Current Accruals - Modified Jones Model ACCRUALS |UnAccruals| UnAccruals PosUnAccruals
Sign Coef. p value Coef. p value Coef. p valueReview Q1-Q3 - 0.007 0.014 -0.001 0.745 0.048 0.281 Review Q4 - -0.012 0.010 0.001 0.799 -0.050 0.505 Q4 0.038 <.001 -0.019 <.001 -0.175 0.008
Panel B Unexpected Total Accruals - Jones Model ACCRUALS |UnAccruals| UnAccruals PosUnAccruals
Sign Coef. p value Coef. p value Coef. p valueReview Q1-Q3 - 0.005 0.04 -0.003 0.31 -0.098 0.03Review Q4 - -0.012 0.01 -0.004 0.45 -0.185 0.01Q4 0.037 <.0001 -0.016 0.00 -0.103 0.11
Panel C Adjusted Unexpected Total Accruals - Jones Model ACCRUALS |UnAccruals| UnAccruals PosUnAccruals
Sign Coef. p value Coef. p value Coef. p value Review Q1-Q3 - 0.004 0.09 -0.003 0.34 -0.074 0.10Review Q4 - -0.010 0.01 -0.005 0.36 -0.185 0.01Q4 0.029 <.0001 -0.011 0.01 -0.108 0.10
* Sample of 4,905 firm-quarters from Canadian listed firms over 2004-2005. Variables are as defined in Table 1. p-values are for two-tailed tests.
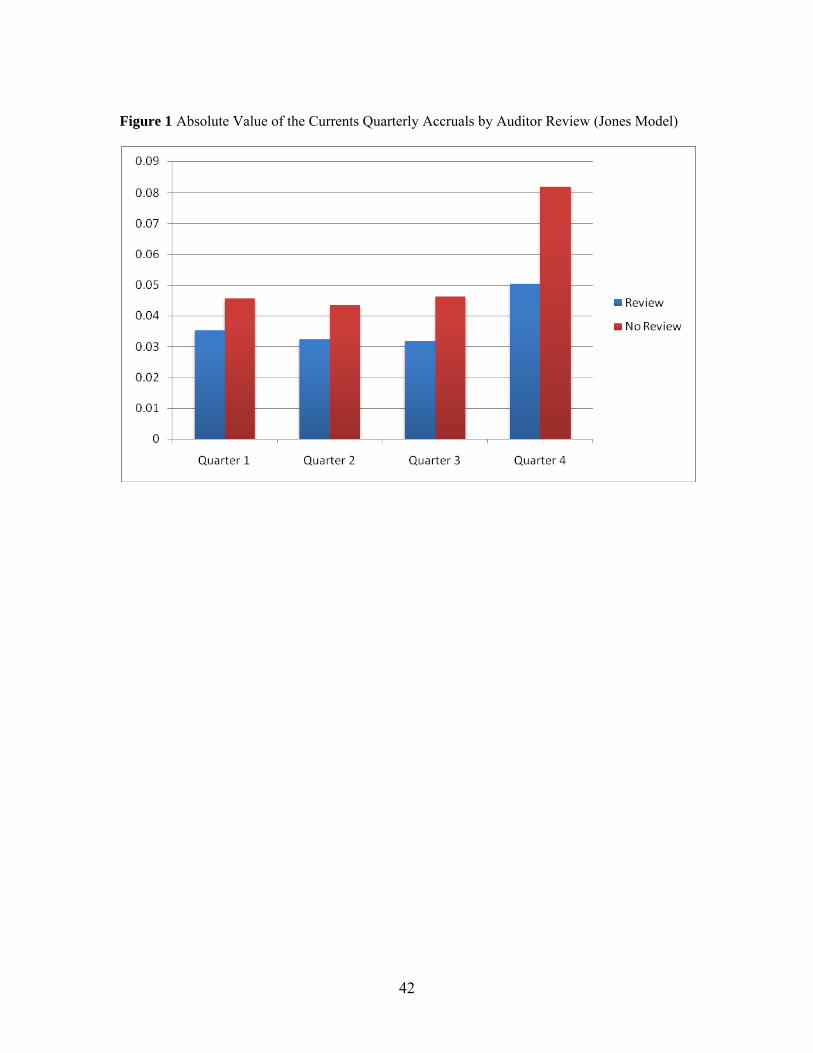
42
Figure 1 Absolute Value of the Currents Quarterly Accruals by Auditor Review (Jones Model)