Embed Size (px)
Citation preview
1
Adoption of the Balanced Scorecard: A Contingency Variables Analysis
Kevin HendricksRichard Ivey School of BusinessUniversity of Western Ontario
Larry MenorRichard Ivey School of BusinessUniversity of Western Ontario
and
Christine Wiedman*
Richard Ivey School of BusinessUniversity of Western Ontario
September 2004
We thank Harpreet Hora for her research assistance. We also acknowledge the SocialSciences and Humanities Research Council for providing funding for this project.
*Corresponding author. Richard Ivey Business School, University of Western Ontario,London, Ontario, N6A 3K7. Phone: (519) 661-8164. Fax: (519) 661-3959. E-mail:[email protected]

2
Adoption of the Balanced Scorecard: A Contingency Variables Analysis
ABSTRACT
We examine the association between contingency variables and the adoption of a Balanced
Scorecard (BSC). The contingency variables we examine include business-level strategy, firm
size, environmental uncertainty, and investment in intangible assets. Utilizing both survey
and archival data, collected as part of a mixed-methodology design, we find that BSC
adoption is significantly related to business strategy, firm size, and environmental
uncertainty. Specifically, BSC adopters are (1) more likely to follow a Prospector or Analyzer
business strategy, (2) are significantly larger, and (3) exhibit significantly higher
environmental uncertainty than non-adopters. We also examined the financial performance
of BSC adopters prior to the decision to adopt and following the implementation of the
BSC. While we found no post-implementation performance effects, we did find tentative
evidence that the financial performance of BSC adopters leading up to the adoption decision
was weaker than comparison firms. Our empirical findings provide theoretical and
managerial insights into the BSC adoption decision, and substantiate the need for additional
BSC adoption and implementation research.
3
Adoption of the Balanced Scorecard: A Contingency Variables Analysis
INTRODUCTION
The Balanced Scorecard (BSC), a comprehensive framework that identifies a range
of distinct performance dimensions and measurement indicators useful for managing diverse
firm objectives and activities across all organizational levels, has become a widely advocated
management “best practice.” Originally conceived of as a performance measurement system,
the BSC approach has evolved into a strategic management tool critical to the firm’s planning
process. The BSC approach, as currently advocated and practiced, suggests that senior
management translate the firm’s vision and strategy into four performance perspectives:
Financial, Customer, Internal Business, and Learning and Growth. Providing a more
balanced view of the firm through the use of leading and lagging indicators, both financial
and non-financial in nature, performance goals can then be established for a selected four or
five relevant measures under each perspective that are aligned with the organization’s
business strategy, decisions and activities (see Figure 1).
Insert Figure 1 about here
The International Federation of Accountants (1998) has noted the evolution of
managerial accounting emphasis from cost determination and financial control, to examining
contingent factors influencing the choice of control mechanisms, to emphasizing reduction
of waste in business processes, to more strategic approaches for identifying, measuring, and
managing the drivers of firm values. Included among these approaches are economic value
measures which approximate shareholder returns (e.g., Stewart 1991), strategic management
accounting systems that inform managers about strategic uncertainties (e.g., Simons 1991),
and the BSC. In a recent survey, Rigby (2003) reports that the BSC is one of the key
4
“compass setting” tools used by managers. Several of the anticipated benefits accruing to the
organization that adopts and successfully implements an integrated BSC include, among
others, better management understanding between specific organizational decisions and
actions and the chosen strategic goals, a redefinition of relationships with customers, re-
engineering of fundamental business processes, and the emergence of a new corporate
culture emphasizing team effort among organizational functions to implement the firm’s
strategy (Kaplan and Norton 1996).
Although the benefits of the BSC are widely touted, little rigorous empirical research
to date has been conducted to support those beliefs (Ittner and Larcker 2001).1 Ittner and
Larcker (1998) examine one dimension of the BSC — namely the role of customer
satisfaction — in predicting future improved performance. Chenhall and Langfield-Smith
(1998) examine the perceived benefits from employing balanced performance measures. Lipe
and Salterio (2000) focus on the behavioral aspects of using the BSC to manage people,
including examining the judgmental effects of common versus unique performance
measures, and Lipe and Salterio (2002) consider the impact of the organization of
information on the scorecard. Ittner et al. (2003) examine the subjectivity in the weighting of
BSC measures. Banker et al. (2004) use an experiment to assess how individuals’ evaluations
of the performance of business unit managers depends on strategically linked performance
measures of a BSC.
While valuable to the ongoing study of the BSC, the studies cited above have mostly
focused on measurement related issues, and have yet to (1) examine the factors associated
with the adoption of the BSC and (2) demonstrate that the adoption and implementation of
the BSC itself is associated with improved performance. Given the recent emphasis placed 1 Atkinson et al. (1997: 94) note that, “…the balanced scorecard is among the most significant developments inmanagement accounting and thus, deserves intense research attention.”

5
on the use of the BSC and its implications for better strategic management of the firm (see
Kaplan and Norton (2001ab)) more research on BSC adoption and implementation issues is
warranted.
In this study, we examine contingency factors affecting the adoption of the BSC
using a combination of survey and archival data. The contingency factors we examine
include business-level strategy, firm size, environmental uncertainty, and investment in
intangible assets. Our study sample includes 179 Canadian firms from a diverse range of
industries. We find that 23.5 per cent of our sample firms reported that they had decided to
adopt and implement a BSC.2
Consistent with our predictions, we find that BSC adoption is significantly related to
firm strategy, firm size, and environmental uncertainty. Specifically, we find that BSC
adopters are more likely to characterize their firm following Prospector or Analyzer business
strategies than Defender or Reactor business strategies, according to the Miles and Snow
(1978) typology. Also, BSC adopters are significantly larger and exhibit significantly higher
environmental uncertainty relative to the non-adopters. These results are consistent after
controlling for industry membership and concurrent firm performance. However, we do not
find the decision to adopt the BSC to be related to the firm’s investment in intangible assets.
We also provide preliminary evidence on the financial performance of BSC adopters
prior to the decision to adopt the BSC, and following the implementation of the BSC. While
our empirical tests are constrained by the number of BSC adopters in our data sample, we
do report some tentative evidence that the financial performance of BSC adopters leading up
to the adoption decision is weaker than comparison firms. This finding suggests that lower-
2 This adoption rate is notably smaller than the BSC utilization rates reported in Bain & Company’s annualinternational survey of senior executives on management tools. Summarizing the 2002 survey results, Rigby(2003) reported a 62% BSC utilization rate among survey respondents.

6
than-desired firm performance may also be a factor in the decision for firms to adopt the
BSC. Unfortunately, the recency of BSC adoptions and small sample size make it difficult to
measure post-implementation performance effects. We leave this important question for
future research.
To our knowledge, this study is the first to provide evidence on the contingency
factors affecting the adoption of the BSC for firms in a wide variety of industries, and to
document a specific association between BSC adoption and business strategy using the Miles
and Snow (1978) typology. Our findings complement those of Hoque and James (2000) who
survey 66 Australian manufacturing firms to identify factors associated with the usage of
BSC-type measures3 and find a positive relation between these measures and organizational
size. By surveying top executives of the firm, we are able to examine BSC adoption from the
perspective of knowledgeable key informants. Kaplan and Norton (2001b) argue that
executive support is needed for the introduction and development of the BSC, and that the
BSC should be an initiative that is supported by top management and then cascaded down to
functional and team levels. Examination of this management control system at the business
level also allows us to combine cross-disciplinary research tools from both survey and capital
markets research, as we utilize both key-informant survey data and firm-level archival data.
The remainder of the paper is organized as follows. First, we introduce the
contingency variables salient to BSC adoption and offer our research hypotheses. Second,
we describe our empirical mixed methodology approach. Third, we present our results that
test our predictions. Fourth, we describe additional analyses addressing the association
3 Hoque and James (2000) define “BSC usage” as the “firms’ tendency to use quantitative measures (frequencyand extent of reporting) of several kinds in assessing performance. This construct shares with the BSC the ideathat financial measures alone are insufficient.” (p. 8) Their instrument incorporates the four dimensions definedby Kaplan and Norton (1996).

7
between BSC adoption and performance. Finally, we offer a discussion of the research
results before concluding.
RESEARCH HYPOTHESES
While research on the BSC is growing, little research has examined the contingency
variables that affect BSC use and effectiveness. For example, in their review of the
performance measurement literature, Ittner and Larker (1998: 223-224) argue,
… the use and performance consequences of these [BSC] measures appear to beaffected by organizational strategies and the structural and environmental factorsconfronting the organization. Future research can make a significant contribution byproviding evidence on the contingency variables affecting the predictive ability,adoption and performance consequences of various non-financial measures andbalanced scorecards.
More generally, Fisher (1995), like Covaleski et al. (1996), argues for a contingency
theory approach to research on the management control systems. He suggests contingent
control variables that relate to: external environment, competitive strategy and mission,
technology, unit, firm and industry variables, and knowledge and observability factors. More
recently, Chenhall (2003) summarizes contextual research in this area, and notes that little
work has been published on newer management control system practices4, including the
BSC, target costing and life cycle costing. Drawing from Chenhall’s (2003) summary and
previous research in the area, we examine the importance of contingency variables in
explaining the decision for an organization to adopt the BSC. Specifically, we examine:
business strategy, firm size, demand volatility (i.e., environmental uncertainty) and
investment in intangible assets.
4 Chenhall (2003) notes that the terms management accounting, management accounting systems, managementcontrol systems and organizational systems have sometimes been used interchangeably. We follow the morerecent definition of management control systems to represent systems of accounting and other controls thatprovide a broad scope of information to assist managerial decision making.

8
Business Strategy
It has long been argued in the accounting literature that accounting control systems
should be designed according to the business strategy of the firm (Langfield-Smith 1997;
Dent 1990; Simons 1987; Otley 1980). While the importance of business strategy as a
contingency variable has been explored for other management control systems
(Govindarajan and Fisher, 1990; Simons, 1987; Gosselin, 1987) it has yet to be examined
with the BSC.
In examining the business strategy contingency variable, we utilize Miles and Snow’s
(1978) four types of firms. Miles and Snow proposed a comprehensive, business-level
strategic typology interrelating organizational strategy, structure and process. Their typology
provides a useful framework for distinguishing distinct firm strategies vis-à-vis the
competitive environments in which firms operate.5 The four strategic archetypes they
idendified, each providing a distinct competitive response to the question “how should we
compete in a given line of business?,” were: Defenders, Prospectors, Analyzers and Reactors
(see Zahra and Pearce (1990) for a review on research on the Miles and Snow typology).
Miles and Snow (1978) argue that Defenders and Prospectors view organizational
performance very differently, and at extremes on an adaptability continuum. Defenders are
“organizations which have narrow product-market domains. Top managers in this type of
organization are highly expert in their organization’s limited area of operation but do not
tend to search outside of their domains for new opportunities.” (Miles and Snow, 1978: 29)
5 An advantage of the Miles and Snow typology is the strong and consistent support for its validity in theliterature (e.g. James and Hatten 1995; and Simons 1987; Hambrick 1983; Snow and Hrebniniak 1980), and itsconceptual and theoretical contributions to the strategic management literature (Ghoshal 2003; Hambrick 2003;and Chakravarthy and White 2002).

9
Defenders view their performance primarily in terms of efficiency, or “doing things right.”
As a result, Defenders organizations have control structures that emphasize efficiency and
stability, with financial and production experts being more influential organization members.
In contrast, Prospectors are “organizations which almost continually search for
market opportunities, and they regularly experiment with potential responses to emerging
environmental trends.” (Miles and Snow, 1978: 29) Prospectors evaluate performance in
terms of effectiveness and “doing the right things,” with marketing and research and
development experts possessing more influence in the organization.
Miles and Snow hypothesized that organizations are responsive to their
environments and become dominated by the adaptive decision patterns they employ. As a
result, managers need to identify their firm’s strategy type in order to understand how their
organization competes as that dictates (1) how to improve their firm’s position in the
industry, (2) what functional strategies to pursue, (3) what type of structure and process to
adopt, and (4) how to make meaning, ongoing strategic and tactical decisions. Miles and
Snow observed that the Defender, Prospector and Analyzer strategies should lead to
effective performance if properly implemented, and should all outperform the Reactors.6
As noted earlier, previous management accounting research suggests that business
strategy is an important determinant in the design of systems (e.g., management control
system adoption decision). Govindarajan and Gupta (1985) and Gupta and Govindarajan
(1984) find that firms following a Prospector strategy perform better when using long-term
performance evaluation that focuses on the future development of the company. Similarly,
6 According to Miles and Snow (1978: 29), Analyzers are “organizations which operate in two types of product-market domains, one relatively stable, the other changing. In their stable areas, these organizations operateroutinely and efficiently through use of formalized structures and processes. In their more turbulent areas, topmangers watch their competitors closely for new ideas, and then they rapidly adopt those which appear to bethe most promising.” Reactors are “organizations in which top managers frequently perceive change anduncertainty occurring in their organizational environments but are unable to respond effectively.”

10
Simons (1987) finds that Prospector firms seem to place more emphasis on forecast data in
control systems. This research suggests that Prospectors benefit from broader planning
mechanisms that allow them to exploit new opportunities. Defenders, it can be posited, are
better off focusing on financial measures, including cost efficiency in their control systems.
The appropriate management control system for Analyzer firms is less clear (Olson
and Slater 2002). Analyzers have characteristics of both the Defender and Prospector
strategies as they operate in two types of product-market domains, one relatively stable, the
other changing. Analyzers are concerned both with developing new products and venturing
into new markets while protecting a stable core of products and markets. Because of this,
singular focus on cost control is not likely to be optimal. Miles and Snow (1978) argue that
the Analyzer organizational structure must accommodate both stable and dynamic areas of
operation, making them extremely complex to manage. Gosselin (1997) finds that both
Prospectors and Analyzers are more likely than Defenders to adopt innovative management
accounting systems (specifically, activity management approaches.) Olson and Slater (2002)
examined the relationship between strategic type and BSC performance dimension emphasis.
They found, for example, that Prospectors firms on the whole emphasized innovation and
growth perspectives more than the other strategy types, while defenders were more inclined
to emphasize the financial perspective. While this study did not distinguish the respondents
in terms of BSC adopters and non-adopters, these findings further motivate the examination
of the firm strategy and BSC adoption relationship.
Given the broader scope and the inclusion of non-financial, forward-looking
measures in the BSC, these studies suggest that the use of the BSC is more likely to benefit
firms following a Prospector or Analyzer strategy, and less likely to benefit firms following a
Defender strategy. Also, given Miles and Snow’s (1978) prediction that firms following a
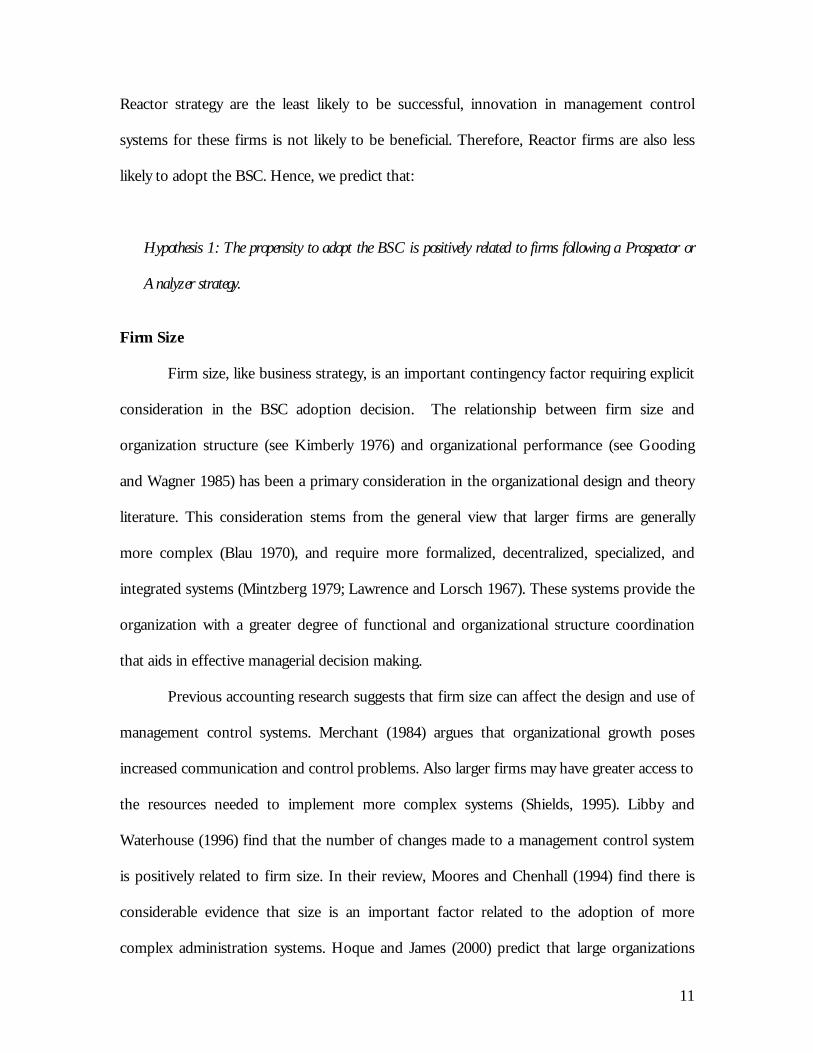
11
Reactor strategy are the least likely to be successful, innovation in management control
systems for these firms is not likely to be beneficial. Therefore, Reactor firms are also less
likely to adopt the BSC. Hence, we predict that:
Hypothesis 1: The propensity to adopt the BSC is positively related to firms following a Prospector or
Analyzer strategy.
Firm Size
Firm size, like business strategy, is an important contingency factor requiring explicit
consideration in the BSC adoption decision. The relationship between firm size and
organization structure (see Kimberly 1976) and organizational performance (see Gooding
and Wagner 1985) has been a primary consideration in the organizational design and theory
literature. This consideration stems from the general view that larger firms are generally
more complex (Blau 1970), and require more formalized, decentralized, specialized, and
integrated systems (Mintzberg 1979; Lawrence and Lorsch 1967). These systems provide the
organization with a greater degree of functional and organizational structure coordination
that aids in effective managerial decision making.
Previous accounting research suggests that firm size can affect the design and use of
management control systems. Merchant (1984) argues that organizational growth poses
increased communication and control problems. Also larger firms may have greater access to
the resources needed to implement more complex systems (Shields, 1995). Libby and
Waterhouse (1996) find that the number of changes made to a management control system
is positively related to firm size. In their review, Moores and Chenhall (1994) find there is
considerable evidence that size is an important factor related to the adoption of more
complex administration systems. Hoque and James (2000) predict that large organizations
12
depend on sophisticated information and control systems using diverse measures, and find
the use of BSC-type measures (measured as a 20-item scale) to be increasing with
organization size. By design, the BSC represents an integrative management tool useful for
coordinating cross-function and cross-level decisions and activities. Hence, we predict that:
Hypothesis 2: The propensity to adopt the BSC is positively related to firm size.
Environmental Uncertainty
Given the previous discussions of the business strategy and firm size contingency
variables, examining the impact of environmental uncertainty on BSC adoption is to be
expected. Indeed, Zahra and Pearce (1990) note the confounding association between these
three contextual factors as they apply to the general business strategy and performance
relationship. Environmental uncertainty has long been viewed as a central problem for
organizations, notably dating back to March and Simon (1958), which creates difficulties for
effective strategic management (Grant 2003; Jauch and Kraft 1986). Further, the
classic/normative approaches in the business strategy literature advocating strategic fit (e.g.,
Frederickson 1984; Burgelman 1983; and Miles and Snow 1978) address the problem a firm’s
environment creates for strategic and tactical decision making (Nutt 2002). Frederickson
(1984: 445), for example, describes the need for firm comprehensiveness, which is “the
extent to which organizations attempt to be exhaustive or inclusive in making and
integrating strategic decisions.” A management control system like the BSC is likely useful in
achieving such comprehensiveness.
Chenhall (2003) emphasizes the importance of considering the environment in
future contingency-based research. Previous research has found that environmental
uncertainty, which Milliken (1987: 136) operationally defines as the “ [organization’s]

13
perceived inability to predict accurately” due to a “lack…of information” or “an inability to
discriminate between relevant and irrelevant data,” is related to greater usefulness of broad
scope information. Gordon and Narayanan (1984) argue that the operating environment
should be the major consideration in designing management accounting systems. They
survey senior managers from 34 firms, and find that the environmental uncertainty is related
to the extent to which their information systems emphasize external, non-financial and
future-oriented information. Chenhall and Morris (1986) find a positive association between
perceived environmental uncertainty and the demand for broad-based information systems
incorporating non-financial indicators. Gosselin (1997) finds that environmental uncertainty
influences the decision to implement activity-based costing. Given that an integrative BSC
incorporates both non-financial and future-oriented information, we posit that the
usefulness of such a system would be particularly critical for firms where environmental
uncertainty is high. Hence, we predict that:
Hypothesis 3: The propensity to adopt the BSC is positively related to the firm’s environmental
uncertainty.
Investments in Intangible Assets
Examining investments in intangible assets as a contingency variable is particularly
apt when studying BSC adoption. Kaplan and Norton (1996), in their discussion of the
learning and growth perspective of the BSC, identified three essential categories of intangible
assets: employee capabilities; information systems capabilities; and motivation,
empowerment, and alignment. Kaplan and Norton (2004: 2) recently revised their
description of these intangible asset categories whereby:
14
• Human Capital represents “skills, talent and knowledge that a company’s
employees possess”;
• Information Capital represents “the company’s databases, information systems,
networks, and technology infrastructure”; and
• Organizational Capital represents “the company’s culture, its leadership, how
aligned its people are with its strategic goals, and employees’ ability to share
knowledge.”
Lev (2000) acknowledges the difficulty in establishing a comprehensive definition of
intangible assets. He classifies intangibles into four categories: product innovation, such as a
company’s R&D efforts; company brand, “which let a company sell its products or services
at a higher price than its competitors”; structural assets, representing “better smarter,
different ways of doing business that can set a company apart from its competitors”; and
monopolies, or “companies that enjoy a franchise, or have substantial sunk costs that a
competitor would have to match, or a barrier to entry that it can use to its advantage.” (p.
214)
While the need for the effective management of such intangible assets7 — difficult to
achieve through traditional management control systems — has been recognized across a
variety of business disciplines, their depiction has differed in the literature. Stewart (1997)
and Gray (2001), for example, employ similar categorizations of an organization’s intangibles
in their discussion of “intellectual capital.” Teece (2000), on the other hand, describes these
intangibles as “knowledge assets,” while Garud (1997) describes such intangibles as “know-
how, know-why, and know-what.” Common to each of these characterizations of intangible
7 The descriptor “intangible,” as it applies to this discussion, is slightly misleading. Many of the forms ofintangible assets identified in the extant literature (e.g., people, systems, databases, etc.) can be counted ortouched.
15
assets is the recognition of the general difficulty in managing organizational knowledge for
sustained competitive advantage (Argote et al. 2003; Eisenhardt and Santos 2002).
The increased importance of intangible assets for many organizations is reflected, in
part, on the firm’s balance sheet by their increased percentage of total assets. Yet many argue
that most current management control systems and financial reporting models have not
changed sufficiently to manage and measure these assets (Lev 2002). Guthrie et al. (2001:
366) argue that “there is a growing awareness that intellectual capital adds significantly to the
value of a business and, in some cases, represents almost the entire value base. Stemming
from this is the drive to establish new measures and ways of reporting that can be used to
record and report the value attributable to intellectual capital within a company.” Similarly,
Blair and Wallman (2003) conclude, “Although good management has always involved
elements of intuition and gut instinct, managers themselves concede that their poor
understanding of the role of intangibles makes its harder for them to judge the performance
of individual employees or teams within the firm, as well as the true costs and benefits of a
large share of their business activity. One indication that some firms consider the costs of
not knowing substantial is the energy they are devoting to the development of internal
nonstandard and nonfinancial measures of performance.” (p. 462)
The BSC represents a notable management tool presumed to result in better
managing of intangible assets through the use of non-financial measures directly reflecting an
organization’s learning and growth decisions, activities, and outcomes. Hence, we predict
that:
Hypothesis 4: The propensity to adopt the BSC is positively related to the firm’s investment in intangible
assets.
16
METHODS
This study attempts to address Ittner and Larcker’s (2001) concerns about the
reliance on — and limitations associated with — the use of a single data source (e.g., public
ly available information, surveys conducted by a third party or the researchers, etc.), and
Birnberg’s et al. (1990) recommendation for the use of multiple methods in empirical
management accounting research. Specifically, we uniquely combine the strengths of survey-
based research (Young 1996) with rigorous empirical capital markets research (e.g. event
studies (McWilliams et al. 1999) to examine issues associated with the adoption of a BSC.
Sample and Survey Procedure
We constructed a focused survey to be administered to management key informants
(Seidler 1974) who could provide valid proxy/judgmental and retrospective data that
identifies BSC adopters and categorizes firm business strategies.8 Specifically, we asked
senior executives from Canadian organizations to identify whether their firms had adopted
the BSC, when they decided to adopt the BSC, when they began using the BSC and whether
or not they have since discontinued its use. Because response rates for senior executives are
typically lower than for other organizational respondents9 (Zajac, 1990), we confined our
survey to fit on one page and to be completed within a short period of time in order to
increase our potential response rate (Burchell and Marsh 1992). Prior to constructing this
survey, the researchers interviewed several executives who were intimately involved with the
adoption and implementation of a BSC at their respective organizations. These interviews
8 A copy of the survey may be obtained from the corresponding author.9 Recommendations for appropriate survey response rates are many and vary dramatically (Dillman 2000).Baruch (1999) notes that respondent survey fatigue is becoming a critical concern for survey researchers andresponse rates are likely to be smaller if the targeted respondents hold more senior-level positions within anorganization. Baruch recommends the following response rate norms: 36 +/- 13 for top management, 60 +/-20 for other populations.
17
provided additional face validity to our choices of contextual variables used in this BSC
adoption study. We also employed a missed-mode data collection strategy as outlined below.
We obtained our survey population of Canadian firms from PC Compustat (1,448
firms) and eliminated all firms with non-Canadian mailing addresses or missing contact
information. This resulted in 1,363 firms. We further eliminated firms with missing industry,
identifier, or sales information (237 firms), and firms no longer in business in 2001 (256). We
also eliminated firms with sales of less than $10 million (49 firms) and trust funds in the
6700-6799 SIC code range (36), as these firms are not likely to require sophisticated
management control systems like a BSC (Chenhall 2003). Finally, we removed 206 firms
with invalid contact information. Our final sampling frame consisted of 579 Canadian firms.
We systematically identified the top executives at each firm, and selected multiple
target key informants based upon the following order of preference: Chief Executive
Officer, President, Chief Financial Officer or Vice President of Finance, Chairman of the
Board, Controller, Chief Operating Officer, and Vice President. Using this ordering we were
able to identify 1,929 key informant contacts for the 579 firms.
Our initial survey administration was conducted by mail in the summer of 2003. Five
weeks after our initial mailing, we sent a second request to all companies who had not
responded. We received 92 usable key informant responses, and repeated responses (i.e.
responses from two executives from the same company) for only three companies.
Therefore at the firm level our initial response rate is 15 per cent.
We conducted a follow-up data collection effort, utilizing the same survey as before,
with those companies who had not responded to our initial mailing. This time the survey
was administered by phone in winter 2004. For this data collection effort, we identified and
targeted a single key informant from each firm, preferably the Chief Financial Officer or

18
Vice President of Finance.10 We systematically phoned each of the targeted key informants
to solicit a response to our short survey; a new informant was identified if the original
informant was no longer with the organization or not able to respond. Informants willing to
respond were able to provide their responses by phone, mail or fax. This process yielded
usable responses from an additional 93 firms. The response rate for this phase of the survey
is 19 per cent, similar to what was achieved in other studies (see, for example, Wasserman,
2003 and Cormier et al. 2004).
In total, this mixed-mode survey effort yielded responses from 185 key informants
from 182 unique firms. For the companies where we received two responses, we only
included the first response received in our statistical tests. Further, we eliminated two firms
where responses differed across the two respondents. One final firm was lost due because it
was missing key data. This resulted in a final sample of 179 firms. Of the responding 179
firms, 42 (23.5 per cent) reported that they had adopted the BSC approach. The timing of
the decision to adopt the BSC is reported in Figure 2. Except for one firm, the year of
adoptions began in 1996 and ran through 2003, with the highest number of adoptions (ten)
in 2002.
Insert Figure 2 about here
One advantage of the mixed-mode data collection strategy is that the phone survey
component allowed us to systematically follow up with key informants for reasons for non-
response. The most significant reasons, in declining order of frequency, are: the informant
10 Based upon the responses received from our mail survey and discussions with BSC administrators, it becameapparent that not all of the firm’s senior managers were adequately informed about, or involved with, theirorganization’s BSC efforts.

19
was reached but did not respond to follow-up messages (24 per cent); the informant
provided no response even after follow-up (23 per cent); the informant was no longer with
the company (16 per cent); we were unable to reach the information by phone (12 per cent);
the organization had a policy not to respond to surveys (11 per cent); and the informant had
not heard of the BSC (1 per cent). These categories are generally consistent with those
reported in Kennedy and Affleck-Graved (2001).
Finally, we compared respondents to non-respondents to assess potential response
bias. Specifically we compared the two groups along the dimensions of: size (total sales),
leverage (total liabilities to total assets), market value to book value, and profitability (net
income to total assets). The two groups were not statistically significantly different using
either parametric or nonparametric tests.11
One further aspect about our survey collection effort deserves comment. In order to
improve response rates we employed a mixed-mode data collection strategy (Dillman 2000).
In obtaining responses from some members from our sample using a mail survey while
obtaining responses from others using telephone solicitation/collection, there exists the
possibility for measurement differences resulting from the use of two distinct data collection
modes. Specifically, it is possible that key informants do not respond the same way to
different survey modes (Dillman and Tarnai 1988). While generally a valid concern, the
objective/retrospective nature, and unobtrusiveness, of the specific questions asked in the
survey likely attenuates the likelihood of measurement differences from our mixed-mode
surveying effort.
11 For nonparametric tests, we use the Kolmogorov-Smirnov test, because of its advantage of making noassumptions about the distribution of the data.

20
Measurement of the Contingency Variables
We employed the self-typing paragraph approach to measure the Miles and Snow
(1978) business strategy types. Each key informant read four short unlabeled paragraphs and
identified the paragraph which best characterizes his or her firm’s business strategy. We used
the popular self-typing paragraphs tested in James and Hatten (1995) and similar to Shortell
and Zajac (1990). James and Hatten (1995) found this to be a useful measurement approach
that resulted in reasonable convergent validity. Snow and Hambrick (1980) found this
approach to be efficient since it allows rapid collection of substantial databases. Further, this
measurement instrument should be valid since it is top managers’ views and decisions which
largely define a business’ strategy. We define PROS/ANALYZ as a binary indicator variable
equaling one if the firm’s business strategy was characterized as being either that of a
Prospector or an Analyzer.
Our remaining contingnency variables, in contrast, are taken from COMPUSTAT.
Firm size (SIZE) is measured as the log of the mean sales over the adoption decision period,
defined for this study as 1996-2003. Environmental uncertainty (EU) is measured as the
coefficient of variation in sales (Gosselin and Pare, 1998) over the decision period:
CV =
(x i − x)2
n −2i=1
n−1
∑y
where y represents annual sales for the firm, xi is the first difference in annual sales (i.e. sales
in year i+1 less sales in year i), and n is the number of years of data available over the
adoption decision period. This coefficient of variation measure captures the demand
unpredictability dimension of environmental uncertainty. While the environmental
uncertainty construct has proven challenging to measure (Buchko 1994), similar measures to

21
the one utilized here have also been applied at the industry level of analysis (e.g. Bourgeois
1985; Carpenter and Fredrickson 2001). Lastly, investment in intangible assets (INTANG) is
measured as the mean ratio of intangible assets to total assets over the adoption decision
period.
Descriptive statistics for the sample are reported in Table 1. Panel A provides
financial measures, Panel B industry membership, and Panel C strategy type. As indicated in
Panel A, the mean (median) level of total sales for sample firms is CDN $1,408.5 (126.4)
million. Given that the average COMPUSTAT US firm has a mean total sales of USD $2.3
million during 2000-2002, our sample is considerably larger than the typical COMPUSTAT
firm, reflecting, as least in part, our decision to exclude firms with sales of less than $10
million.
Industry membership data in Panel B indicate that the largest number of firms are in
manufacturing. Thirty firms (16.8 per cent of the sample) are in the 2000-2999 SIC code
range, representing process manufacturing, and 44 firms (24.6 per cent of the sample) are in
the 3000-3999 range, representing industrial, commercial and high-tech manufacturing.
Panel C reports the business strategy type as characterized by key informant survey
responses on the Miles and Snow (1978) typology. Fifty one firms (28.5 per cent of the
sample) are described as Defenders, 63 firms (35.2 per cent) as Prospectors, 46 firms (25.7
per cent) as Analyzers, and eight firms (4.6 per cent) as Reactors. Further, eleven firms
indicated that none of the four categories applied to them. While Miles and Snow indicated
that any firm not fitting the Defender, Prospector or Analyzer profile was by default a
Reactor, we chose not to impute that classification on those eleven firms. This does not
materially affect the reported empirical analysis.
Insert Table 1 about here

22
Univariate tests of differences in key variables between non-adopters and BSC
adopters are reported in Table 2. Notably, the most common business strategy among non-
adopters was the Defender strategy (32.9 per cent of the non-adopters), while the most
common among BSC adopters was the Prospector strategy (50.0 per cent of BSC adopters.)
Also worth observing was that SIZE is significantly higher (p=0.0001) for BSC adopters
than non-adopters.
Insert Table 2 about here
.
RESULTS
To test the effect of contextual variables on the adoption of the BSC, we estimate
the following probit regression Model 1:
Pr(BSC _ Adopt) = 1 + 2PROSP/ ANALZ + 3SIZE + 4 EU + 5INTANG +
where BSC_Adopt is an indicator variable that equals one if the firm has adopted the BSC.
We predict positive estimated coefficients for PROSP/ANAL, SIZE, EU and INTANG.
In sensitivity tests, we also include indicator variables that correspond to one-digit
SIC codes ( ) to control for industry effects in Model 2:
Pr(BSC _ Adopt) = 1 + 2PROSP/ ANALZ + 3SIZE + 4 EU + 5INTANG + ii=1
8
∑ +
We also include return on assets (ROA), defined as mean operating profit before
depreciation divided by total assets, to control for firm operating performance, in Model 3:
+++++++= ∑=
8
1654321 /)_Pr(
iiROAINTANGEUSIZEANALZPROSPAdoptBSC

23
The empirical results are reported in Table 3. All continuous variables are winsorized
at the 1 and 99 percentiles to control for the effect of outliers. The Pseudo R2 for Model 1 is
0.25. In this model, PROSP/ANALYZ, SIZE and EU are positive, as predicted, and
statistically significant at the p <0.01 level. These findings suggest that the probability of
BSC adoption is associated with firms following a Prospector or Analyzer strategy, and is
associated with increasing firm size and environmental uncertainty. Investment in intangible
assets (INTANG) does not appear to be associated with BSC adoption. However we caution
that these findings should be interpreted cautiously. Measuring investment in intangibles in a
meaningful way is challenging given that numerous definitions for intangibles exist and that
the conservative financial accounting model is biased against the recognition of value for
these assets.
Our results for Model 1 are quite consistent across Models 2 and 3 where industry
and operating performance control variables are included. BSC adoption appears to be
higher for firms in the 4000-4999 (Transportation, communication, power and sanitation)
and the 8000-8999 (Health Services) SIC code ranges. We also find that our conclusions
remain unchanged when we drop the 11 firms who characterize their strategy as “other” and
when we do not winsorize the data.12
Insert Table 3 about here
12 To assess potential multicollinearity of our model, we compute condition numbers of the matrices ofexplanatory variables (Greene 2003.) Condition numbers between 30 and 100 indicate moderate to strongdependencies among the variables (Judge et al. 1985). The highest condition numbers for the matrices ofexplanatory variables included in Table 3 are all below 15, indicating that multicollinearity is not a problem.
24
BSC AND PERFORMANCE
Pre-adoption Performance
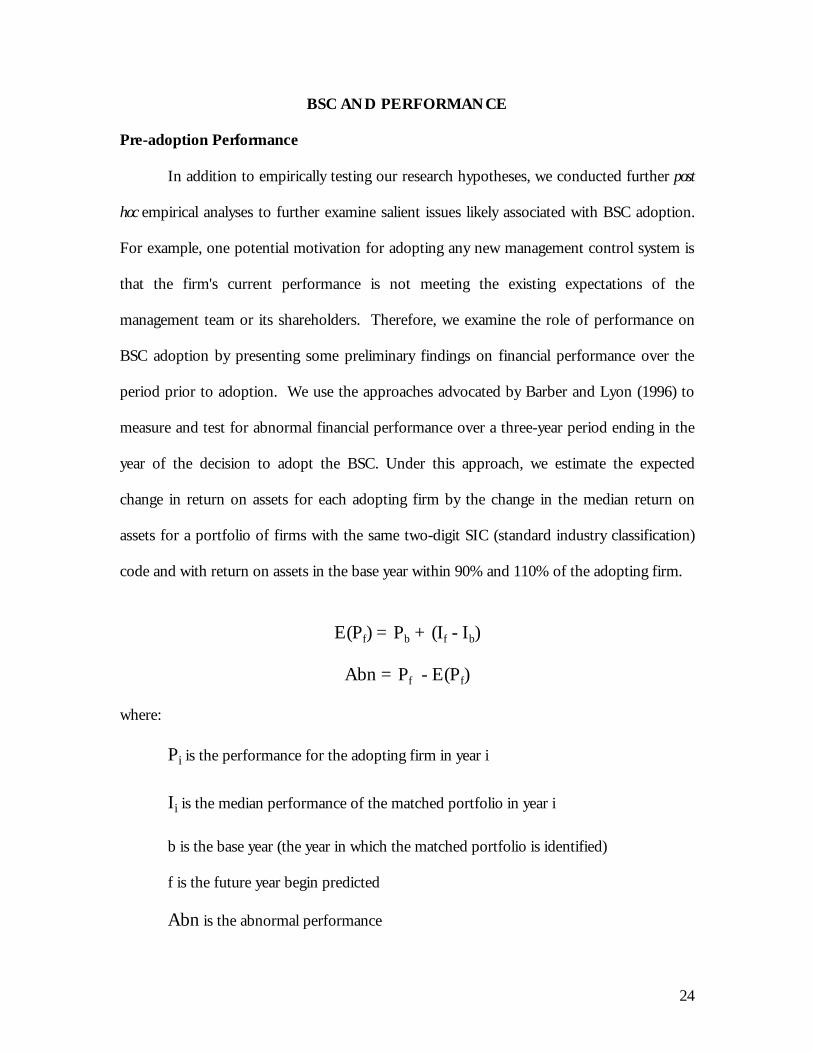
In addition to empirically testing our research hypotheses, we conducted further post
hoc empirical analyses to further examine salient issues likely associated with BSC adoption.
For example, one potential motivation for adopting any new management control system is
that the firm's current performance is not meeting the existing expectations of the
management team or its shareholders. Therefore, we examine the role of performance on
BSC adoption by presenting some preliminary findings on financial performance over the
period prior to adoption. We use the approaches advocated by Barber and Lyon (1996) to
measure and test for abnormal financial performance over a three-year period ending in the
year of the decision to adopt the BSC. Under this approach, we estimate the expected
change in return on assets for each adopting firm by the change in the median return on
assets for a portfolio of firms with the same two-digit SIC (standard industry classification)
code and with return on assets in the base year within 90% and 110% of the adopting firm.
E(Pf) = Pb + (If - Ib)
Abn = Pf - E(Pf)
where:
Pi is the performance for the adopting firm in year i
Ii is the median performance of the matched portfolio in year i
b is the base year (the year in which the matched portfolio is identified)
f is the future year begin predicted
Abn is the abnormal performance

25
We run a paired t-test comparing the actual performance in the year f (the year of the
decision to adopt the BSC) against its expectation across all adopting firms. Year b is
defined as three years prior to the year of adoption. Performance is measured as both return
on assets (ROA) and returns on sales (ROS). We refer to this approach as the SIC code-
based or “sicc-based" method.
Barber and Lyon also find that for some non-random samples of smaller, higher
performing firms, their recommended approach using SIC matching is not always well
specified. For these firms they recommend forming the control portfolio not based on SIC
code but instead based on size. Here, the control portfolio is comprised of all firms within
70% to 130% in size (total assets) and within 90% to 110% in performance (return on assets
or return on sales) in the base year. We will refer to this approach as the "size-based"
method.
Insert Table 4 about here
Table 4 reports the results using both the "sicc-based" and "size-based" approaches
for return on assets (ROA) and return on sales (ROS). Thirty-nine (38) of the 42 BSC
adopters had the necessary data to perform the sicc-based (size-based) tests. The results
indicate that the mean and median abnormal performance13 over the three-year period up to
the year of the decision to adopt the BSC is negative across both measures of performance
and across both sicc-based and size-based methods. For example, the median abnormal
ROA for the BSC adoption firms is –0.0080; the median abnormal ROS is –0.0191. Only the
Wilcoxon (non-parametric) tests on abnormal ROS under the sicc-based method are
statistically significant. Here only 34% of the adopters have positive abnormal ROS 13 We report results for both uncapped and capped data, where observations are capped symmetrically at the2.5% levels of each tail to mitigate the impact of outliers.
26
performance. These findings provide weak exploratory evidence that poor performance
(measured as increasing costs or declining margins) may be a factor in the decision to adopt
the BSC.
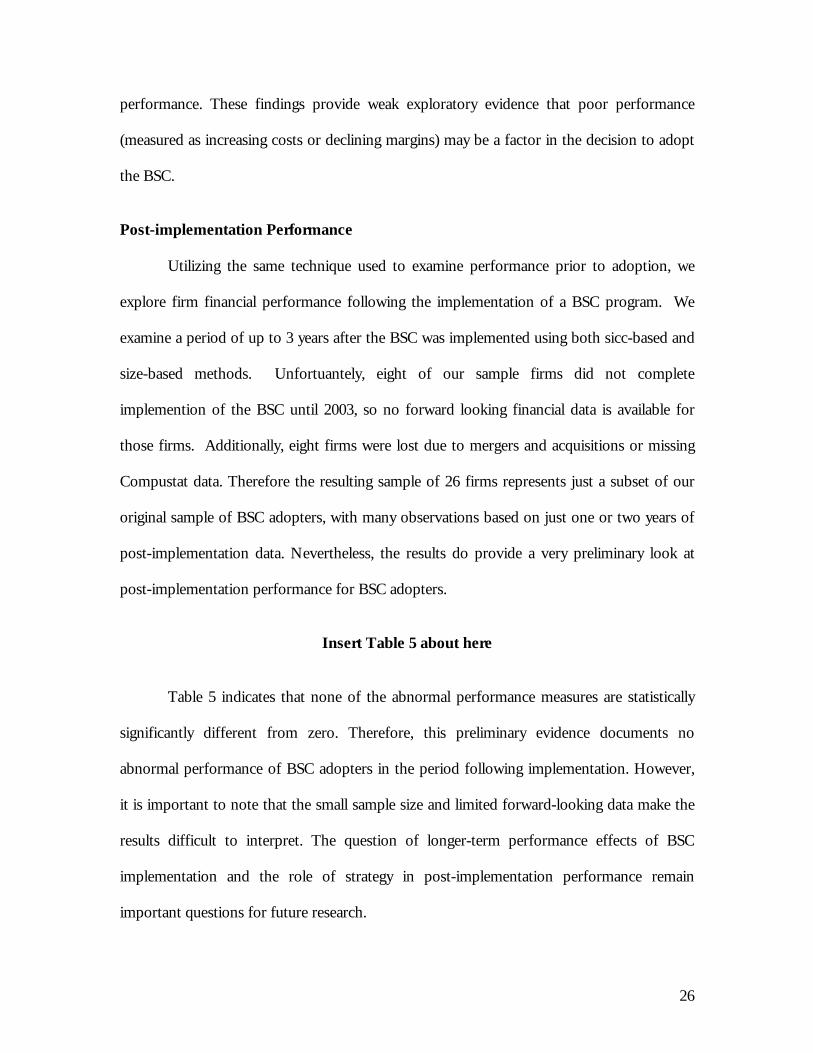
Post-implementation Performance
Utilizing the same technique used to examine performance prior to adoption, we
explore firm financial performance following the implementation of a BSC program. We
examine a period of up to 3 years after the BSC was implemented using both sicc-based and
size-based methods. Unfortuantely, eight of our sample firms did not complete
implemention of the BSC until 2003, so no forward looking financial data is available for
those firms. Additionally, eight firms were lost due to mergers and acquisitions or missing
Compustat data. Therefore the resulting sample of 26 firms represents just a subset of our
original sample of BSC adopters, with many observations based on just one or two years of
post-implementation data. Nevertheless, the results do provide a very preliminary look at
post-implementation performance for BSC adopters.
Insert Table 5 about here
Table 5 indicates that none of the abnormal performance measures are statistically
significantly different from zero. Therefore, this preliminary evidence documents no
abnormal performance of BSC adopters in the period following implementation. However,
it is important to note that the small sample size and limited forward-looking data make the
results difficult to interpret. The question of longer-term performance effects of BSC
implementation and the role of strategy in post-implementation performance remain
important questions for future research.

27
DISCUSSION AND CONCLUSION
This research has begun to address an important shortcoming in the study of
management control systems: the rigorous empirical examination of contingency variables
associated with BSC adoption. Employing a mixed-methodology approach, utilizing both
survey and archival data analysis, we provide intriguing evidence about the critical decision
factors that motivate firms to adopt a BSC. Further, an understanding of these decision
factors, here characterized as contingency variables, allows for a better profile of the type of
organization most likely to adopt a BSC.
Our research indicates, as predicted from the managerial accounting and strategic
management literatures, that organizations needing to be innovative, as opposed to solely
being efficient, are more likely to adopt a BSC. For Prospectors and Analyzers, the adoption
of a BSC is a critical management choice that facilitates the alignment of the array of
decisions made to best match strategic and tactical decisions and activities with
environmental requirements. The BSC, in short, is a critical component of the firm’s
adaptive decision patterns.
According to Miles and Snow (1978), every organization over time follows an
“adaptive cycle” in order to develop a consistency of approach in addressing three
overarching managerial problems.14 To address these problems, the firm’s management has
to constantly make decisions to solve,
…(1) an entrepreneurial problem set centering on the definition of an organization’sproduct-market domain; (2) an engineering problem set focusing on the choice oftechnologies and processes to be used for production and distribution; and (3) an
14 Miles and Snow, in a recent published interview (Ketchen 2003), noted with some regret that their adaptivecycle has been underutilized vis-à-vis their strategic typology in the strategic management literature. In theirview, “[perhaps] the adaptive cycle was too general or simplistic, but we have always felt that it would serve as agood starting point for empirical studies of organizational adaptation or for managers to use in their strategicplanning.” (Ketchen 2003: 99).
28
administrative problem set involving the selection, rationalization, and development oforganizational structure and policy processes. (Conant et al. 1990: 366 [emphasis notin original]).
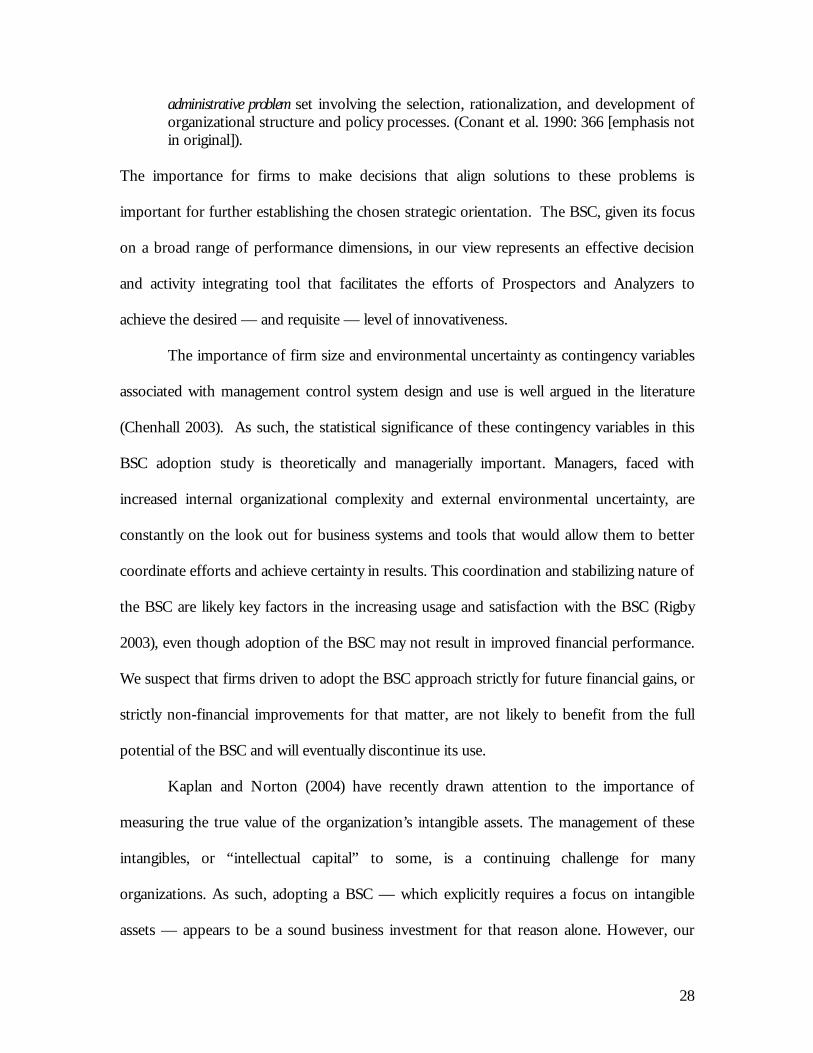
The importance for firms to make decisions that align solutions to these problems is
important for further establishing the chosen strategic orientation. The BSC, given its focus
on a broad range of performance dimensions, in our view represents an effective decision
and activity integrating tool that facilitates the efforts of Prospectors and Analyzers to
achieve the desired — and requisite — level of innovativeness.
The importance of firm size and environmental uncertainty as contingency variables
associated with management control system design and use is well argued in the literature
(Chenhall 2003). As such, the statistical significance of these contingency variables in this
BSC adoption study is theoretically and managerially important. Managers, faced with
increased internal organizational complexity and external environmental uncertainty, are
constantly on the look out for business systems and tools that would allow them to better
coordinate efforts and achieve certainty in results. This coordination and stabilizing nature of
the BSC are likely key factors in the increasing usage and satisfaction with the BSC (Rigby
2003), even though adoption of the BSC may not result in improved financial performance.
We suspect that firms driven to adopt the BSC approach strictly for future financial gains, or
strictly non-financial improvements for that matter, are not likely to benefit from the full
potential of the BSC and will eventually discontinue its use.
Kaplan and Norton (2004) have recently drawn attention to the importance of
measuring the true value of the organization’s intangible assets. The management of these
intangibles, or “intellectual capital” to some, is a continuing challenge for many
organizations. As such, adopting a BSC — which explicitly requires a focus on intangible
assets — appears to be a sound business investment for that reason alone. However, our

29
research suggests that investments in intangible assets are not a key independent BSC adoption
factor. One caveat to our findings is that our measure for investment in intangibles is based
on a financial accounting model that has been criticized as being overly conservative and
increasingly irrelevant with regard to the measurement of intangibles (Lev 2002.) Therefore,
our measure may not be effectively capturing our construct of interest. Alternatively, our
finding may suggest that that investment in intangibles may be a variable more relevant to
subsequent implementation of the BSC than its adoption. Future research in this area
appears warranted to further probe the relation between investment in intangibles and the
adoption and successful implementation of the BSC.
Based upon post hoc analyses, we find tentative support for the supposition that BSC
adopters experienced poorer financial performance prior to adoption than comparison firms.
This suggests that a firm’s poor performance results may influence the decision to adopt a
BSC. Additionally, we did not find any improvements in financial performance for BSC
adopters post-implementation. There are several plausible explanations for this non-finding.
First, the small sample of adopters we examined may not have provided us with enough
statistical power to root out the true effect size of the BSC implementation and performance
relationship. Second, the lag in achieving improved financial performance from BSC
adoption may be longer than the 3 year window we employed. Third, we might have mis-
specified the BSC implementation and performance relationship. In particular, an assessment
of non-financial performance improvements (e.g., operations-based, customer-based, etc.)
may be more apt for our study; unfortunately we did not collect this data as part of this
phase of our BSC project. Fourth, and most intriguing, perhaps the adopters in our sample
had not yet achieved an effective implementation of the BSC.

30
While this study was motivated by the need for better understanding of BSC
adoption, we concur with Ittner and Larcker’s (1998) surprise that there has not been more
research effort in understanding BSC implementation and performance issues. Our post hoc
analysis suggests that a potentially important next step in BSC research is the examination of
implementation issues. Chenhall (2003) emphasizes the distinction between management
control system adoption and the implementation of such systems. While there are a number
of “step-by-step” guides related to BSC implementation (see Niven 2002), rigorously detailed
study of BSC implementation efforts remain few and largely case-based (see Lohman et al.
2004). Implementation, in general, provides unique organizational challenges (Nutt 1986),
and additional conceptual and theoretical understanding of the entrenchment of
management practices (Zeitz et al. 1999) is required. Therefore, future BSC research should
not only examine the BSC adoption and outcome relationship, but also the BSC usage and
outcome relationship. Indeed, BSC usage may encompass a number of distinct stages (e.g.,
formulation and implementation), each requiring its own empirical scrutiny.
As noted in our introduction, the BSC was originally conceived of as a performance
measurement system but has evolved into a strategic management tool critical for assessing
firm decisions, activities, and performance. The BSC has, according to its advocates, become
a business model that actually matters; such a business model would be of practical value for
many organizations (Magretta 2002). Certainly, a scan of the organizations that have adopted
and implemented a BSC approach so far (see listings from the Balanced Scorecard
Collaborative [www.bscol.com] or the Balanced Scorecard Institute
[www.balancedscorecard.org]) suggests the diverse interest in this management control
system. Indeed, interest in the BSC is especially high from non-profit or public sector
organizations (e.g., Chan 2004). As further evidence of the ongoing interest and relevance of

31
the BSC, functional standards have already been established that have resulted in a number
of recent software applications (e.g., Microsoft Office Business Scorecards Accelerator), each
meant to facilitate the adoption and implementation of the BSC approach. We believe that
ongoing research in the adoption and implementation of Balanced Scorecards is required in
order to ensure that theoretical and managerial understanding on this topic keeps pace with
what is occurring in practice.

32
REFERENCES
Argote, L., McEvily, B. and R. Reagans. 2003. Managing knowledge in organizations:Integrative framework and review of emerging themes. Management Science. 49 (4), 571-582.
Atkinson, A. A., R. Balakrishnan, P. Booth, J. M. Cote, T. Grout, T. Mali, H. Roberts, E.Ulan, and A. Wu. 1997. New directions in management accounting research. Journal ofManagement Accounting Research, 9, 80-108.
Banker, R. D., Chang, H. and M. J. Pizzini. 2004. The balanced scorecard: Judgmental effectsof performance measures linked to strategy. The Accounting Review, 79 (1), 1-23.
Barber, B. M. and J. D. Lyon. 1996. Detecting abnormal operating performance: Theempirical power and specification of test statistics, Journal of Financial Economics, 41, 359-399.
Baruch, Y. 1999. Response rate in academic studies – A comparative analysis. HumanRelations, 52 (4), 421-438.
Birnberg, J.G., Shields, M.D. and S.M. Young. 1990. The case for multiple methods inempirical management accounting research (with an illustration from budget setting). Journalof Management Accounting Research, Fall, 33-66.
Blair, M. and S. Wallman. 2003. The growing intangibles reporting discrepancy. In J. Handand B. Lev (Eds.), Intangible assets: values, measures and risks, Oxford University Press, Oxford.
Blau, P.M. 1970. A formal theory of differentiation in organizations. American SociologicalReview, 35, 201-218.
Bourgeois, L. J. III. 1985. Strategic goals, perceived uncertainty, and economic performancein volatile environments. Academy of Management Journal, 28 (3) 548-573.
Buchko, A.A. 1994. Conceptualization and measurement of environmental uncertainty: Anassessment of the Miles and Snow perceived environmental uncertainty scale. Academy ofManagement Journal, 37 (2), 410-425.
Burchell, B. and C. Marsh. 1992. The effect of questionnaire length on survey response.Quality & Quantity, 26, 233-244.
Burgelman, R.A. 1983. A model of the interaction of strategic behavior, corporate context,and the concept of strategy. Academy of Management Review, 8, 61-70.
Carpenter, M. A. and J. W. Fredrickson. 2001. Top management teams, global strategicposture, and the moderating role of uncertainty. Academy of Management Journal, 44 (3), 533-545.
Chakravarthy, B.S. and R.E. White. 2002. Strategy process: Forming, implementing andchanging strategies. In A. Pettigrew, H. Thomas, and R. Whittington (Eds.), Handbook ofStrategy and Management, Sage Publications, London.
33
Chan, Y.C.L. 2004. Performance measurement and adoption of balanced scorecards. TheInternational Journal of Public Sector Management, 17 (3), 204-221.
Chenhall, R. H. 2003. Management control systems design within its organizational context:Findings from contingency-based research and directions for the future. Accounting,Organizations and Society, 28 (2, 3), 127-168.
Chenhall, R.H. and D. Morris. 1986. The impact of structure, environment andinterdependencies on the perceived usefulness of management accounting systems.Accounting Review, 61, 16-35.
Chenhall, R. and K. Langfield-Smith. 1998. The relationship between strategic priorities,management techniques and management accounting: An empirical investigation using asystems approach. Accounting, Organizations and Society, 23, 243-264.
Conant, J.S., Mokwa, M.P. and P.R. Varadarajan. 1990. Strategic types, distinctive marketingcompetencies and organizational performance: A multiple measures-based study. StrategicManagement Journal, 11, 365-383.
Cormier, D., Gordon, I.M. and M. Magnan. 2004. Corporate environmental disclosure:Contrasting management’s perceptions and reality. Journal of Business Ethics. 49 (2), 143-165.
Covaleski, M.A., Dirsmith, M.S. and S. Samuel. 1996. Managerial accounting research: Thecontributions of organizational and sociological theories. Journal of Management AccountingResearch, 8, 1-35.
Dent, J. 1990. Strategy, organization and control: Some possibilities for accounting research.Accounting, Organization, and Society, 15, 3-25.
Dillman, D.A. 2000. Mail and Internet Surveys. John Wiley & Sons, Inc., New York.
Dillman, D.A. and J. Tarnai. 1988. Administrative issues in mixed mode surveys. In R.M.Groves, P.P. Biemer, L.E. Lyberg, J.T. Massey, W.L. Nicholls and J. Wakesberg (Eds.),Telephone Survey Methodology, Wiley, New York.
Eisenhardt, K.M. and F.M. Santos. 2002. Knowledge-based view: A new theory of strategy?In A. Pettigrew, H. Thomas, and R. Whittington (Eds.), Handbook of Strategy and Management,Sage Publications, London.
Fisher, J. 1995. Contingency-based research on management control systems: Categorizationby level of complexity. Journal of Accounting Literature, 14, 24-48.
Fredrickson, J.W. 1984. The comprehensiveness of strategic decision processes: Extension,observations, future directions. Academy of Management Journal, 27 (3), 445-466.

34
Garud, R. 1997. On the distinction between know-how, know-why, and know-what.Advances in Strategic Management, 14, 81-101.
Gooding, R.Z. and J.A. Wagner. 1985. A meta-analytic review of the relationship betweensize and performance: The productivity and efficiency of organizations and their subunits.Administrative Science Quarterly, 30, 462-481.
Ghoshal, S. 2003. Miles and Snow: Enduring insights for managers. Academy of ManagementExecutive, 17 (4), 109-114.
Gordon, L. A., and V. K. Narayanan. 1984. Management accounting systems, perceivedenvironmental uncertainty and organization structure: An empirical investigation. Accounting,Organizations and Society, 9 (1), 33-47.
Gosselin, M. 1997. The effect of strategy and organizational structure on the adoption andimplementation of activity-based costing. Accounting, Organizations and Society, 22 (2), 105-122.
Gosselin, M, and P. Paré. 1998. An examination of the influence of environmentaluncertainty and organizational structure on activity-based costing. Working Paper, UniversitéLaval, November 1998.
Govindarajan, V. and J. Fisher. 1990. Strategy, control systems, and resource sharing: effectson business unit performance. Academy of Management Journal, 259-285.
Govindarajan, V. and A.K. Gupta. 1985. Linking control systems to business strategy:impact on performance. Accounting, Organizations and Strategy, 51-66.
Grant, R.M. 2003. Strategic planning in a turbulent environment: Evidence from the oilmajors. Strategic Management Journal, 24, 491-517.
Gray, D. 2001. Intellectual Capital – Measuring and Enhancing the True Value of your Business.Pearson Education Limited, London.
Greene, W. Econometric Analysis. New York: MacMillan, 2003.
Gupta, A.K. and V. Govindarajan. 1984. Business unit strategy, managerial characteristics,and business unit effectiveness at strategy implementation. Academy of Management Journal , 25-51.
Guthrie, J., Petty, R. and U. Johanson. 2001. Sunrise in the knowledge economy. Accounting,Auditing & Accountability Journal; 14(4), 365-382.
Hambrick, D.C. 1983. Some tests of effectiveness and functional attributes of Miles andSnow’s strategic types. Academy of Management Journal, 26, 5-26.
Hambrick, D.C. 2003. On the staying power of defenders, analyzers, and prospectors.Academy of Management Executive, 17 (4), 115-118.

35
Hoque, Z. and W. James. 2000. Linking balanced scorecard measures to size and marketfactors: Impact on organizational performance. Journal of Management Accounting Research, 12,1-17.
International Federation of Accountants 1998. International Management AccountingPractice Statement: Management Accounting Concepts. International Federation ofAccountants, New York.
Ittner, C.D. and D. F. Larcker 1998. Innovations in performance measurement: Trends andresearch implications. Journal of Management Accounting Research, Vol. 10, 205-238.
Ittner, C.D. and D.F. Larcker. 2001. Assessing empirical research in managerial accounting:A value-based management perspective. Journal of Accounting and Economics, 32, 349-410.
Ittner, C. D., Larcker, D.F. and M. W. Meyer. 2003. Subjectivity and the weighting ofperformance measures: Evidence from a balanced scorecard. The Accounting Review. 78 (3),725-758.
James, W. and K. Hatten. 1995. Further evidence on the validity of the self-typing paragraphapproach: Miles and Snow archetypes in banking. Strategic Management Journal, 16 (2), 161-168.
Jauch, L.R. and K.L. Kraft. 1986. Strategic management of uncertainty. Academy ofManagement Review, 11, 777-790.
Judge, G. G., W. E. Griffiths, R. Carter Hill, H. Luetkepohl, and T. Lee. Regression Diagnostics,New York: Wiley, 1985.
Kaplan, R. and D. Norton. 1996. The Balanced Scorecard: Translating Strategy into Action. HarvardBusiness School Press, Boston, MA.
Kaplan, R. S. and D. P. Norton. 2001a. Building a strategy-focused organization. Ivey BusinessJournal, May/June.
Kaplan, R. S. and D. P. Norton. 2001b. The strategy-focused organization. Strategy andLeadership, 29, 3, 41-42.
Kaplan, R. S. and D. P. Norton. 2004. Measuring the strategic readiness of intangible assets.Harvard Business Review, February, 1-13.
Kennedy, T. and J. Affleck-Graves. 2001. The impact of activity-based costing techniques onfirm performance. Journal of Management Accounting Research, 13, 19-45,
Ketchen, D.J. 2003. An interview with Raymond E. Miles and Charles C. Snow. Academy ofManagement Executive, 17 (4), 97-104.
Kimberly, J.R. 1976. Organizational size and the structural perspective: A review, critique,and proposal. Administrative Science Quarterly, 21, 571-597.
36
Langfield-Smith, K. 1997. Management control systems and strategy: A critical review.Accounting, Organizations, and Society, 22, 207-232.
Lawrence, P.R. and J.W. Lorsch. 1967. Organizations and Environment. Harvard UniversityPress, Boston, MA.
Lev, B. 2000. New math for a new economy. Fast Company, 31, January 2000, 214.
Lev, B. 2002. Intangible assets: Concepts and measurement. Forthcoming in K. Kempf-Leonard (Ed.), Encyclopedia of Social Measurement, Academic Press.
Libby, T. and J. H. Waterhouse. 1996. Predicting change in management accounting systems.Journal of Management Accounting Research, 8. 137-150.
Lipe, M. G. and S. E. Salterio. 2000. The balanced scorecard: Judgmental effects of commonand unique performance measures. The Accounting Review, Vol. 75, No. 3, July, 283-298.
Lipe, M. G. and S. E. Salterio. 2002. A note on the judgmental effects of the balancedscorecard’s information organization. Accounting, Organizations and Society, 27 (6), 531-540.
Lohman, C., Fortuin, L. and M. Wouters. 2004. Designing a performance measurementsystem: A case study. European Journal of Operational Research, 156, 267-286.
Magretta, J. 2002. Why business models matter. Harvard Business Review, May, 3-8.
March, J.G. and H.A. Simon. 1958. Organizations. Wiley, New York.
McWilliams, A., Siegel, D. and S.W. Teoh. 1999. Issues in the use of the event studymethodology: A critical analysis of corporate social responsibility studies. OrganizationalResearch Methods, 2 (4), 340-365.
Merchant, K. A. 1984. Influences on departmental budgeting: An empirical examination of acontingency model. Accounting, Organizations and Society, 9 (3/4), 291-307.
Miles, R. E. and C. C. Snow. 1978. Organizational strategy, structure, and process. New York, NY:McGraw–Hill.
Milliken, F.J. 1987. Three types of perceived uncertainty about the environment: State,effect, and response uncertainty. Academy of Management Review, 12, 133-143.
Mintzberg, H. 1979. The Structuring of Organization. Prentice-Hall, Inc., Englewood Cliffs, NJ.
Moores, K. and R. C. Chenhall. 1994. Framework and MAS evidence. In K. Moores and P.Booth P. (Eds.), Strategic Management Accounting: Australian Cases. John Wiley and Sons,Brisbanem 12-26.
Niven, P.R. 2002. Balanced Scorecard Step-By-Step. John Wiley & Sons, Inc., New York.

37
Nutt, P.C. 1986. Tactics of implementation. Academy of Management Journal, 29 (2), 231-261.
Nutt, P.C. 2002. Making strategic choices. Journal of Management Studies, 39 (1), 67-96.
Olson, E.M. and S.F. Slater. 2002. The balanced scorecard, competitive strategy, andperformance. Business Horizons, May-June, 11-16.
Otley, D. T. 1980. The contingency theory of management accounting: Achievement andPrognosis. Accounting, Organizations and Society, 431-428.
Rigby, D. 2003. Management tools survey 2003: Usage as companies strive to make headwayin tough times. Strategy & Leadership, 31 (5), 4-11.
Seidler, J. 1974. On using informants: A technique for collecting quantitative data andcontrolling for measurement error in organizational analysis. American Sociological Review, 39,816-831.
Simons, R. 1987. Accounting control systems and business strategy: An empirical analysis.Accounting, Organizations and Society, 12 (4), 357-374.
Simons, R. 1991. Strategic orientation and top management attention to control systems.Strategic Management Journal, 12, 49-62.
Shields, M. D. 1995. An empirical analysis of firms’ implementation experience with activity-based costing. Journal of Management Accounting Research, 7, 148-166.
Snow, C. C. and L. G. Hrebiniak. 1980. Distinctive competence and organizationalperformance. Administrative Science Quarterly, 317-336.
Stewart, G. 1991. The Quest for Value. Harper Business, New York.
Stewart, T.A. 1997. Intellectual Capital: The New Wealth of Organizations. Doubleday, New York.
Teece, D.J. 2000. Strategies for managing knowledge assets: The role of firm structure andindustrial context. Long Range Planning, 33, 35-54.
Wasserman, N. 2003. Founder-CEO succession and the paradox of entrepreneurial success.Organization Science. 14 (2), 149-172.
Young, S. 1996. Survey research in management accounting: A critical assessment. In A.Richardson (Ed.), Research Methods in Accounting: Issues and Debates, CGA-Canada ResearchFoundation, Vancouver, BC.
Zahra, S.A. and J.A. Pearce. 1990. Research evidence on the Miles-Snow typology. Journal ofManagement, 16 (4), 751-768.

38
Zajac, E. J. 1990. CEO selection, succession, compensation, and firm performance: Atheoretical integreation and empirical analysis. Strategic Management Journal, 11, 217-230.
Zeitz, G., Mittal, V., McAulay, B. 1999. Distinguishing adoption and entrenchment ofmanagement practices: A framework for analysis. Organization Studies, 20 (5), 741-776.

39
FIGURE 1The Balanced Scorecard
Source: Kaplan and Norton (1996)
Obj
ectiv
esM
easu
res
Targ
ets
Initi
ativ
esCustomer
“To achieve ourvision, how should weappear to ourcustomers?”
Obj
ectiv
esM
easu
res
Targ
ets
Initi
ativ
es
Internal Business Process“To satisfy ourshareholdersand customers,what businessprocessesmust weexcel at?”
Obj
ectiv
esM
easu
res
Targ
ets
Initi
ativ
es
Learning and Growth
“To achieve ourvision, how will we sustainour abilityto changeand improve?”
Obj
ectiv
esM
easu
res
Targ
ets
Initi
ativ
es
Financial
“To succeedfinancially, howshould we appear to ourshareholders?”
Visionand
Strategy

40
FIGURE 2
Balanced Scorecard Adoption by Year
0
2
4
6
8
10
12
pre1996
1996 1997 1998 1999 2000 2001 2002 2003
Year
Num
ber
of A
dopt
ions

41
TABLE 1Descriptive Statistics for the Sample
All variables in Panel A are taken from COMPUSTAT and are measured over the adoption decisionperiod, defined as 1996 through 2003. SIZE is the log of the mean sales for the firm. EU orenvironmental uncertainty is measured as the coefficient of variation in sales. INTANG is the ratioof intangible assets to total assets. MSALES is the mean sales and MTASSETS in the mean totalassets. MROA is the mean operating profit before depreciation divided by total assets. MROS is themean operating profit before depreciation and amortization divided by total sales. MR&D is themean ratio of R&D expense to sales. All variables are winsorized at the 1 and 99 percentiles. SICcodes are taken from COMPUSTAT for 2003.
Panel A: Firm CharacteristicsN Mean Std. Dev. Median
SIZE 179 4.996 2.256 4.839EU 179 0.308 0.282 0.227INTANG 179 0.076 0.109 0.036MSALES 179 1408.5 3602.4 126.4MTASSETS 179 6489.2 32369.4 159.6MROA 177 0.064 0.203 0.102MROS 176 -1.526 8.710 0.100MR&D 74 3.532 11.542 0.076
Panel B: Industry Membership
Industry Sector (by 1-digit SIC code) SIC Codes Number of Percent ofFirms Sample
Mining and Construction 1000-1999 22 12.3%Process manufacturing 2000-2999 30 16.8%Industrial, commercial and high-tech manufacturing 3000-3999 44 24.6%Transportation, communications, power, sanitation 4000-4999 20 11.2%Wholesale and retail trade 5000-5999 13 7.3%Finance, insurance, and real estate 6000-6999 22 12.3%Services: business 7000-7999 22 12.3%Services: health 8000-8999 6 3.4%
179 100.0%Panel C: Firm Strategy
Miles and Snow (1978) Strategy Number of Percent ofFirms Sample
Defender 51 28.5%Prospector 63 35.2%Analyzer 46 25.7%Reactor 8 4.5%Other 11 6.1%
179 100.0%

42
TABLE 2Univariate Tests of Differences Between Non-adopters and BSC Adopters
DEFEND is an indicator variable that equals one if the firms has characterized its strategy as beingthe Defender type. Similarly, PROSP, ANALYZ, and REACT are indicator variables representingthe remaining three Miles and Snow (1978) strategy types: Prospector, Analyzer, and Reactor,respectively. SIZE, EU, INTANG and MROA are taken from COMPUSTAT and are measured overthe adoption decision period, defined as 1996 through 2003. SIZE is the log of the mean sales in themean total assets. EU or environmental uncertainty is measured as the coefficient of variation insales. INTANG is the ratio of intangible assets to total assets. MROA is the mean operating profitbefore depreciation divided by total assets. All variables are winsorized at the 1 and 99 percentiles.SIC codes are taken from COMPUSTAT for 2003.
Variable Mean Std. Dev. Median Mean Std. Dev. Median t-test Wilcoxon
non-adopters (n=137) BSC-adopters (N=42) p -value
DEFEND 0.3285 0.4714 0.0000 0.1429 0.3542 0.0000 0.0075 0.0202PROSP 0.3066 0.4628 0.0000 0.5000 0.5061 0.5000 0.0307 0.0221ANALYZ 0.2336 0.4247 0.0000 0.3333 0.4771 0.0000 0.2288 0.1976REACT 0.0511 0.2210 0.0000 0.0238 0.1543 0.0000 0.3714 0.4582OTHER 0.0803 0.2727 0.0000 0.0000 0.0000 0.0000 0.0008 0.0593
SIZE 4.5533 1.9962 4.5903 6.4395 2.4678 6.7282 0.0001 0.0001EU 0.3045 0.2643 0.2361 0.3183 0.3363 0.2002 0.8082 0.6337INTANG 0.0767 0.1165 0.0287 0.0730 0.0790 0.0429 0.8153 0.3447
non-adopters (n=135) BSC-adopters (N=42) p -value
ROA 0.0615 0.2035 0.1019 0.0728 0.2038 0.0884 0.7543 0.6854

43
TABLE 3Probit Regression Results: Dependent Variable is BSC_Adopt
BSC_Adopt is an indicator that equals one if the firm has adopted the BSC. PROS/ANALYZ is anindicator variable that equals one if the firm has characterized its strategy as being either theProspector or the Analyzer type. SIZE, EU, INTANG and MROA are taken from COMPUSTATand are measured over the adoption decision period, defined as 1996 through 2003. SIZE is the logof the mean sales in the mean total assets. EU or environmental uncertainty is measured as thecoefficient of variation in sales. INTANG is the ratio of intangible assets to total assets. MROA isthe mean operating profit before depreciation divided by total assets. All variables are winsorized atthe 1 and 99 percentiles. SIC codes are taken from COMPUSTAT for 2003.
Probit Regression Results: Dependent Variable is BSC_Adopt
Predicted sign Model 1 Model 2 Model 3
Intercept ? -2.9823 -3.4210 -3.4186(0.0001) (0.0001) (0.0001)
PROSP/ANALYZ + 0.6751 0.6704 0.6645(0.0092) (0.0172) (0.0195)
SIZE + 0.2802 0.2899 0.3202(0.0001) (0.0001) (0.0001)
EU + 1.1719 1.3391 1.1472(0.0074) (0.0035) (0.0341)
INTANG + -0.8207 -1.6750 -1.7384(0.4715) (0.1885) (0.1714)
ROA - -0.6841(0.4144)
SIC 2000-2999 ? 0.1299 0.0613(0.8090) (0.9107)
SIC 3000-3999 ? 0.1712 0.1107(0.7165) (0.8174)
SIC 4000-4999 ? 1.1844 1.1668(0.0236) (0.0269)
SIC 5000-5999 ? -0.2838 -0.3559(0.6667) (0.5924)
SIC 6000-6999 ? 0.4615 0.5212(0.3870) (0.3512)
SIC 7000-7999 ? 0.6173 0.6222(0.2507) (0.2480)
SIC 8000-8999 ? 1.0092 0.9540(0.1477) (0.1764)
N 179 179 177Log likelihood -78.55 -72.19 -70.33Pseudo R2 0.25 0.32 0.34

44
TABLE 4Relative Performance Prior to Adoption of the BSC
Panel A: SICC-basedN Mean Abn Median Abn Mean Abn Median Abn
39 Years -3 to -0 Years -3 to 0 Years -3 to 0 Years -3 to 0
Abnormal Perf. (Uncapped) -0.0311 -0.0080 -0.1761 -0.0191
Abnormal Perf. (Capped) -0.0241 -0.0080 -0.0481 -0.0191
Per cent positive 46.15% 34.21%
Significance t-Test Wilcoxon t-Test Wilcoxon
Uncapped -1.34 -1.00 -1.07 -2.57
Capped -1.56 -1.03 -2.82 -2.71
Panel B: Size-basedN Mean Abn Median Abn Mean Abn Median Abn
38 Years -3 to -0 Years -3 to 0 Years -3 to 0 Years -3 to 0
Abnormal Perf. (Uncapped) -0.0217 -0.0049 0.6020 -0.0091
Abnormal Perf. (Capped) -0.0179 -0.0049 -0.0071 -0.0091
Per cent positive 43.59% 44.44%
Significance t-Test Wilcoxon t-Test Wilcoxon
Uncapped -1.03 -0.77 0.96 -1.33
Capped -1.28 -0.77 -0.25 -1.20
ROA ROS
ROA ROS
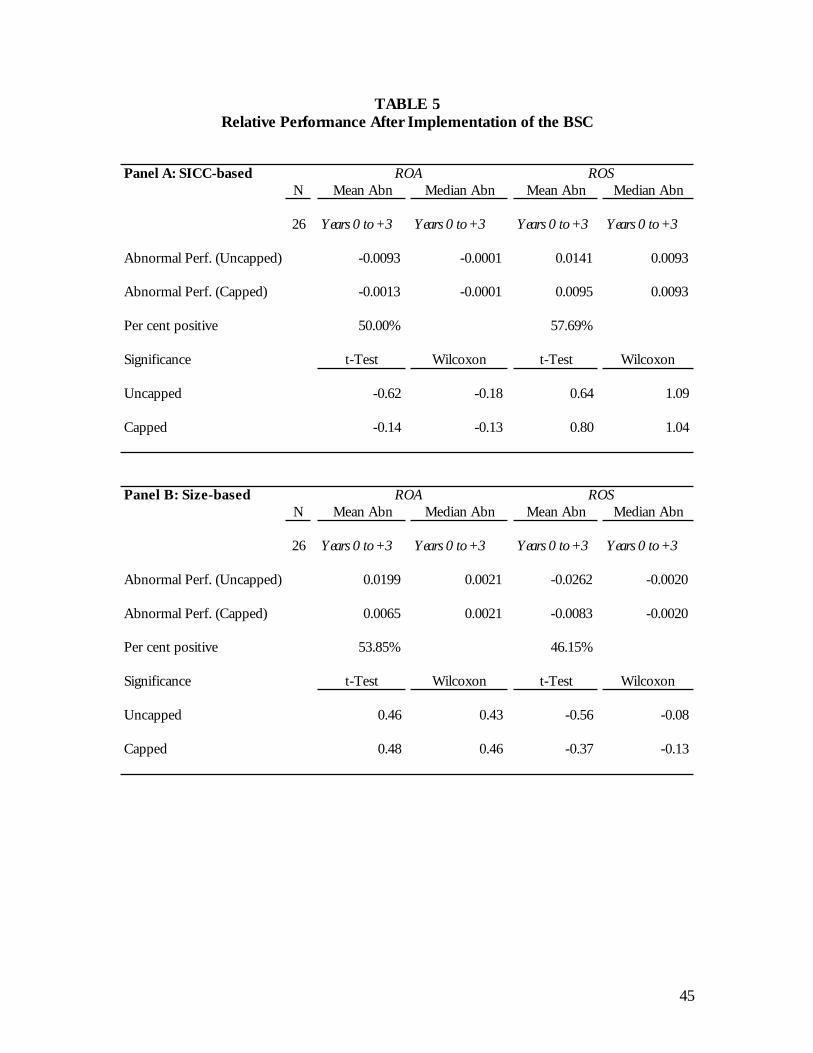
45
TABLE 5Relative Performance After Implementation of the BSC
Panel A: SICC-based ROA ROSN Mean Abn Median Abn Mean Abn Median Abn
26 Years 0 to +3 Years 0 to +3 Years 0 to +3 Years 0 to +3
Abnormal Perf. (Uncapped) -0.0093 -0.0001 0.0141 0.0093
Abnormal Perf. (Capped) -0.0013 -0.0001 0.0095 0.0093
Per cent positive 50.00% 57.69%
Significance t-Test Wilcoxon t-Test Wilcoxon
Uncapped -0.62 -0.18 0.64 1.09
Capped -0.14 -0.13 0.80 1.04
Panel B: Size-based ROA ROSN Mean Abn Median Abn Mean Abn Median Abn
26 Years 0 to +3 Years 0 to +3 Years 0 to +3 Years 0 to +3
Abnormal Perf. (Uncapped) 0.0199 0.0021 -0.0262 -0.0020
Abnormal Perf. (Capped) 0.0065 0.0021 -0.0083 -0.0020
Per cent positive 53.85% 46.15%
Significance t-Test Wilcoxon t-Test Wilcoxon
Uncapped 0.46 0.43 -0.56 -0.08
Capped 0.48 0.46 -0.37 -0.13


