Embed Size (px)
Citation preview
The IMRE Journal Volume 9 (3) 2015 TU Bergakademie Freiberg www. tu-freiberg.de/fakult6/imre/imre-journal
Valuation of a Rare Earth Elements Project Using the Real Options Model
--- Application of the Real Option Model to Bayan Obo Mine
Jiangxue Liu
TU Bergakademie Freiberg Correspondance: Jiangxue Liu TU Bergakademie Freberg Schlossplatz 1. 09599 Freiberg Germany e-mail : [email protected]
Jan C. Bongaerts
TU Bergakademie Freiberg Correspondance: Prof. Dr. Jan C. Bongaerts TU Bergakademie Freberg Schlossplatz 1. 09599 Freiberg Germany e-mail : [email protected]
Frank Heyde
TU Bergakademie Freiberg Correspondance: PD Dr. rer. nat. habil. Frank Heyde TU Bergakademie Freberg Prüferstraße 9 09599 Freiberg Germany e-mail : [email protected] Revised: 01.12.2015 Online Publication Date: 15.12.2015
Abstract
Technological innovations resulted in manifold applications using rareearths which lead to a dramatic increase in their demand. Rare earths are arelatively abundant group of 17 rare earth elements (REE) including the15 lanthanide elements, scandium and yttrium. Given their relativeabundance in the earth’s crust, however, they seldom occur inconcentrated forms in economically exploitable ore deposits. Theextraction and production of REE can be technically challenging andrequires substantial and dedicated mineralogical, chemical and processing expertise. Furthermore, the REE market is relative volatile not like atransparent commodity market as in the case of copper and gold.
This paper provides an overview of the supply chain for REE in order toprovide a useful context to analyze geological, technical, economic,environmental and social impact factors. Subsequently, a valuation modelusing the real options method is introduced to assess investment optionsfor a REE project which can be understood as an investment project dealing with the mining, processing, separation, and recycling of REE.The model is applied to a valuation of the Bayan Obo deposit, the biggestREE deposit in the world.
Keywords: Rare Earth Elements, Supply Chain of Rare Earths, Risk Analysis, Simulation, Real Options Model, Mean Reverting Model
Introduction
In recent years technological innovations resulted in manifoldapplications using rare earths which lead to a dramatic increase in theirdemand. Because of their unique physicochemical properties, rare earths are considered indispensable in modern industry because of their uniquephysicochemical properties. They are extensively used in new materials, energy conservation, environmental protection and IT devices as well asin military weapon systems. They have also significantly contributed tothe miniaturization of electronic components, as for example cell phonesand laptop computers. Rare earths are essential for green technologiessuch as wind powered turbines.

Page 2 Valuation of a Rare Earth Elements project using the real options model
The IMRE Journal
They are widely applied in the automotive industry for catalysts, hybrid vehicle batteries, motors and generators, etc. (Hurst, 2010).
In contrast to their denomination, rare earths are not rare in natural occurrence. Only heavy rare earth elements (HREE) are less common. Given their relative abundance in the earth’s crust, however, they seldom occur in concentrated forms in economically exploitable ore deposits. Unlike common metals such as copper and iron, REE do not occur naturally as metallic elements, but mostly as rare earth oxides (REO) or other combinations due to their strong affinity for oxygen. The production of REE is subject to high risks because of the uncertainty of complexity, high cost and high probability of failure of the entire process from exploration through production, processing and separation. In particular, the steps of processing and separation can be technically challenging and require substantial and dedicated mineralogical, chemical and processing expertise. Furthermore, the chemical extraction processes have generated severe environmental problems.
In the 1970s, China rapidly became the world’s leader producer of REE, replacing the USA, the biggest producer from 1960s to 1980s. China is currently responsible for 95% of supply. In 2010, China restricted the production and export of REE. Some REE, especially HREE, have been in short supply. Many industrialized countries, such as the US, Japan and EU countries identified REE, particularly HREE as “critical metals” due to their high risks of supply shortage and high impacts on the economy. Many countries also started to seek for alternative REE sources. From 2010 to 2012, over 200 projects on the exploration of REE exploration projects outside of China were started up. Because of the technological challenges, environmental problems, and various uncertainties over the supply chain for REE, an assessment of the supply chain for REE and an evaluation of rare earths projects are becoming important for investors. However, the traditional discount cash flow (DCF) neither account for the influence of risk factors on the development of a REE project, nor the flexibility of the investors. Hence, in order to capture the risks over the supply chain and evaluate the value of different options of investors, the real option approach (ROA) is implemented.
The paper deals with the valuation of REE. First, an introduction to REE, and an overview of the supply
chain for REE are presented, which generally consists of mining, processing, separation, and recycling. Subsequently, a more in-depth analysis of uncertainties across the supply chain will be highlighted. In order to assess potential REE production projects, a new valuation model using real option approach is developed.
1 Production chain for REE
The supply chain of REE begins with the mining. There are three mining methods to extract the REE bearing deposits: surface mining (open pit mining), underground mining and In-Situ Leaching (ISL), which is also called solution mining. Hard rock REE ores are usually mined by conventional open pit methods, which typically involve removing the overburden, blasting, excavation and milling. Placer deposits are usually mined by either dry land mining or by dredging technologies. Ion adsorption deposits in southern China are mined using the ISL method. Instead of excavation and blasting, a chemical solution with dissolving chemical components is injected into the ore body, and the rare earth minerals are leached out selectively. After mining, the ores are processed to produce a concentrate with high REE contents by using flotation and leaching methods, with which about a 60-70% REO concentrate can be obtained.
Finally, the concentrate will be separated into individual oxides and further refined into metals. Because of their chemical similarity, the separation of the individual REE is very difficult and requires specific technologies. Ion exchange and solvent extraction are two advanced methods used for separation. At present, most of the core rare earth separating and refining are undertaken in China.
There are many environmental issues associated with REE production process. One of the most significant environmental concerns is the association of most REE deposits with significant concentrations of radioactive elements: uranium and thorium. During the mining, processing, and separating processes, a large number of chemical materials are applied, leading to waste discharges to air and water. After processing process, residuals containing radioactive substances, fluorides, sulphides, acids and heavy metals are stockpiled in a large tailing impoundment. If there is a lack in environmental control, it can lead to contaminate surrounding soil and groundwater. Moreover, a
Page 3 Valuation of a Rare Earth Elements project using the real options model
The IMRE Journal
considerable amount of energy is used, which increases carbon dioxides emissions. The ion adsorption clay deposits in Southern China are free from radioactive elements. A significant environmental issue of the ISL method is associated with high residuals of strong chemical reagents such as ammonium nitrogen, as well as acids in mine tailings, which can lead to the destruction of vegetation and ground water pollution.
From the 1960s until the 1980s, the United States was the world biggest producer of REO. In the 1970s, China began to produce REE and rapidly became the world’s leader producer. China now is currently responsible for 95% of supply. In 2010 China restricted the production and export of REE. Some REE, especially HREE have been in supply shortage. Many industrialized countries such as the US, Japan and EU countries identified REE, particularly HREE as critical materials according to their importance for their economies and their supply shortage risk. Many countries started to seek for alternative REE supply outside China. The most advanced mining projects is the Mt Weld mine in Australia by Lynas Corporation Ltd. (processing in Malaysia, LAMP). Many other potential rare earth mining projects are currently in different development stages. The world’s rare earth supplies patterns are undergoing profound changes and an oversupply of LREE on the global REE market is anticipated. In contrast, for HREE, shortage is expected for the next several years.
Considering the shortage in the supply of the rare earth minerals especially HREE and the environmental risks related to the production of REE, it is essential to establish substitution and recycling strategies for REE. Many countries have established several policies and research initiatives that relate to raw materials and recycling. The EU, for instance, developed the Raw Materials Initiative to increase the resource efficiency and promote identifying substitution of REE and recycling. However, the recycling processes for REE are very complex and extensive. Currently, only a small amount of magnetic scrap containing neodymium, praseodymium, dysprosium and yttrium from laser and garnet is currently being recycled (UNEP, 2011). The largest rare earth recycling potential is related to final products containing high levels of REE and an established collection or recycling infrastructure, for instance, fluorescent lamps, magnets, car batteries and catalytic converters (EPA, 2011).
2 Uncertainties about the production chain for REE
An investment in a REE project is very risky because of uncertainty over the future reward from the investment due to operating and market fluctuations. The uncertainties related to the supply chain of REE can be classified into market uncertainties, geological and operational uncertainties. Market uncertainties: the REE market is a relatively volatile market. Historically, REE prices have been very low due to China’s abundance of resources and its ability to produce them very cheaply. In 2010, when China announced its REE export quota, prices dramatically increased. Until 2011, they were nearly 11 times higher than in 2009. After September 2011, the prices dropped sharply. It should be observed that market demands for REE differ over time, depending on applications. Due to the development of permanent magnets with NdFeB, the REE market is driven by the demand for neodymium and dysprosium. Because many of REE are sold as oxide components, the prices are often referred to rare earth oxides (REO). Figure 1 illustrates each price path of individual REO.
While other raw materials, like copper and gold, are traded in a transparent commodity exchange market like the London Metals Exchange, there is no such exchange market for REE and REE are commonly traded in over-the-counter (OTC) markets. Buyers and sellers are matched through brokers or trading platforms such as Metal Pages, Asian Metal and China Rare Earth. It is hard to know accurate spot prices and predict future prices. As an important step, in May 2014, the Baotou Rare Earth Products Exchange was established for REE trading. This exchange may increase market transparency and provide the ability to hedge against price volatility. Geological and operational uncertainties: to produce REE economically, the entire production process is determined not only by crustal abundance but also by many other factors including 1) the metal concentration in ore deposits, 2) the feasibility of exploration and mining, 3) the complexity of processing and refining of the ore, 4) technical and economic feasibility, 5) environmental impacts from main operations and 6) potential social risks and local community confrontation.

Page 4 Valuation of a Rare Earth Elements project using the real options model
The IMRE Journal
Figure 2.1 - REO prices of individual REE from 2009 to 2014 (Source:Self-complied based on the free-on-board (FOB) prices provide by Asian Metal. Prices refer to a minimum purity of 99% and minimum purity for yttrium oxide is 99.999%) To start a new mine is also a complex process and takes years for planning. From discovery to initial production, the development process of a proposed REE project may take more than 10 years and requires a large amount of money. Similar like other hard rock or placer mines, the development process includes many major stages until production, as follows:
Preliminary exploration and discovery Land and water acquisition commitment Exploration Feasibility studies / environmental permitting Final engineering Development and construction Start-up to full production
Obviously, each stage requires time and a project developer has to plan such time from find-to-mine in appropriate time segments. Varied risks occur in the different stages of any REE project. Some of them are present in more than one stage. They may have impacts on the time schedule of the project development, on the REE production volume, on the success of the whole project etc. Table 2.1 summarizes the risk factors by type and impact across the project stages.
Table 2.1 - Risk factors and their impacts Risk factor Project stage Impact Risk type
Political risk All stages Project Overall risk
success
Environmental risk
All stages Project success
Overall risk
Social risk Development stage, production stage
Project success
Overall risk
Exploration risk
Development stage
Schedule Time related risk
Permitting risk Development stage
Schedule Time related risk
Construction risk
Development stage
Schedule Time related risk
Geological risk
Production stage
REE output volume
Volume related risk
Technical risk Production stage
REE output volume
Volume related risk
Market risk Market stage REE prices Price risk
Source: Self-prepared Concerning their impacts on the REE project development, they can be classified as overall risk, time related risk, REE volume related risk, and market risk. Overall risk: these risk factors are present in the entire life-cycle of a project. Typically, they are political risks, environmental risks, and social risks.
Time risk: these risk factors have an impact on the timing of project stages. For example, in the development stage, the production stage of the project success depends on conditions which need to be met a-priori, such as: 1) the exploration completed 2) permitting for exploration and processing have successfully awarded, and 3) construction at the mine site such as the enrichment factory, assembly, accommodation facilities for the workers, the machines and equipment on site, and the waste storage facility is already completed. Hence, at this stage, these “time risk” factors have a strong impact on the timing of REE production start-up.
Volume risk: The key consideration for making a decision to invest or not in a REE project is the REE output volume, which depends on possibly accurate estimations of REE reserves as well as the recovery rates in the mining and processing processes. These two estimations depend on a
$‐
$500.000,00
$1.000.000,00
$1.500.000,00
$2.000.000,00
$2.500.000,00
$3.000.000,00
$3.500.000,00
$4.000.000,00
$4.500.000,00
02.01.2008
02.01.2009
02.01.2010
02.01.2011
02.01.2012
02.01.2013
02.01.2014
Yttrium / $/mt
Lanthan/ $/mt
Cer/ $/mt
Praseodym/ $/mt
Neodym/ $/mt
Samarium/ $/mt
Europium / $/mt
Gadolinium/ $/mt
Terbium/ $/mt
Dysprosium/ $/mt
Page 5 Valuation of a Rare Earth Elements project using the real options model
The IMRE Journal
geological risk and a technical risk representatively and both risks can be summarized into a volume related risk. The expected reserve volume changes during the development as more geological information is available. The production volume changes also when the technology is improving.
Market risk: The volatility of the REE market is reflected through the price development of REE products. Depending on demand, the prices of REE and their development trends fluctuate over time. In general, prices of HREE are much higher than LREE. The prices of the highly demanded and less abundant REE can be increased due to the shortage of supply.
3 Valuation of a REE project
3.1 ROA application in REE investment
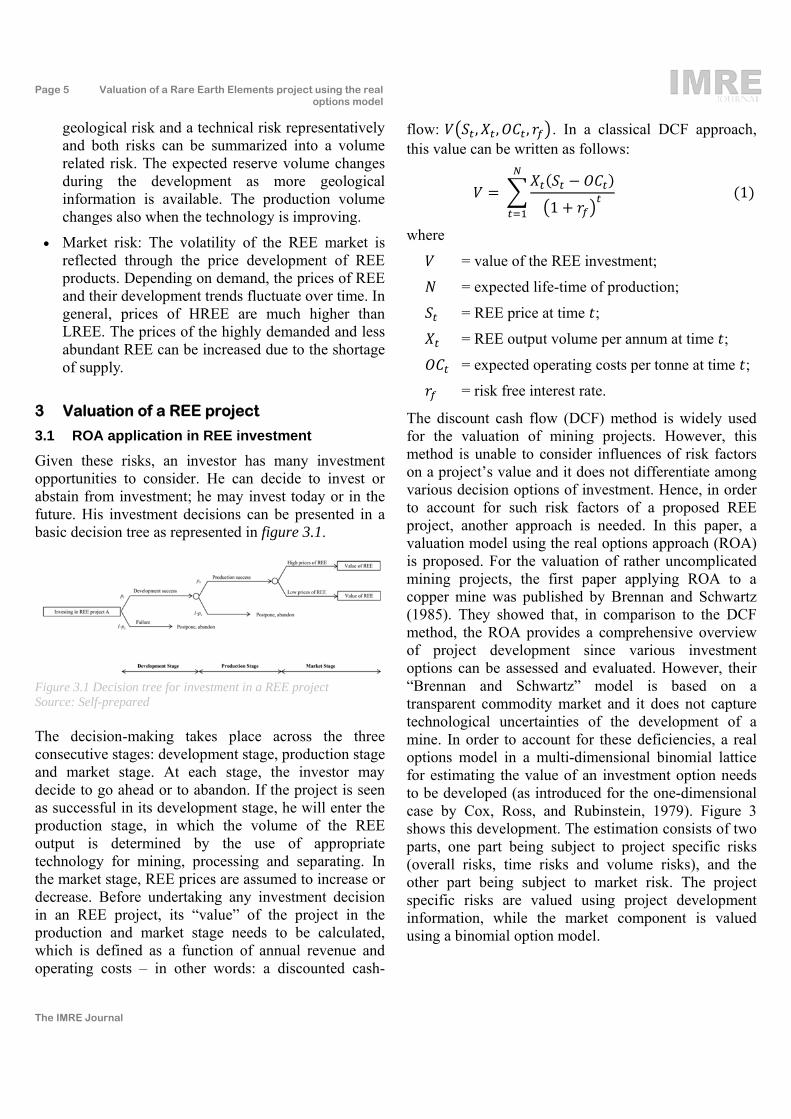
Given these risks, an investor has many investment opportunities to consider. He can decide to invest or abstain from investment; he may invest today or in the future. His investment decisions can be presented in a basic decision tree as represented in figure 3.1.
Figure 3.1 Decision tree for investment in a REE project Source: Self-prepared The decision-making takes place across the three consecutive stages: development stage, production stage and market stage. At each stage, the investor may decide to go ahead or to abandon. If the project is seen as successful in its development stage, he will enter the production stage, in which the volume of the REE output is determined by the use of appropriate technology for mining, processing and separating. In the market stage, REE prices are assumed to increase or decrease. Before undertaking any investment decision in an REE project, its “value” of the project in the production and market stage needs to be calculated, which is defined as a function of annual revenue and operating costs – in other words: a discounted cash-
flow: , , , . In a classical DCF approach, this value can be written as follows:
1
1
where
= value of the REE investment;
= expected life-time of production;
= REE price at time ;
= REE output volume per annum at time ;
= expected operating costs per tonne at time ;
= risk free interest rate.
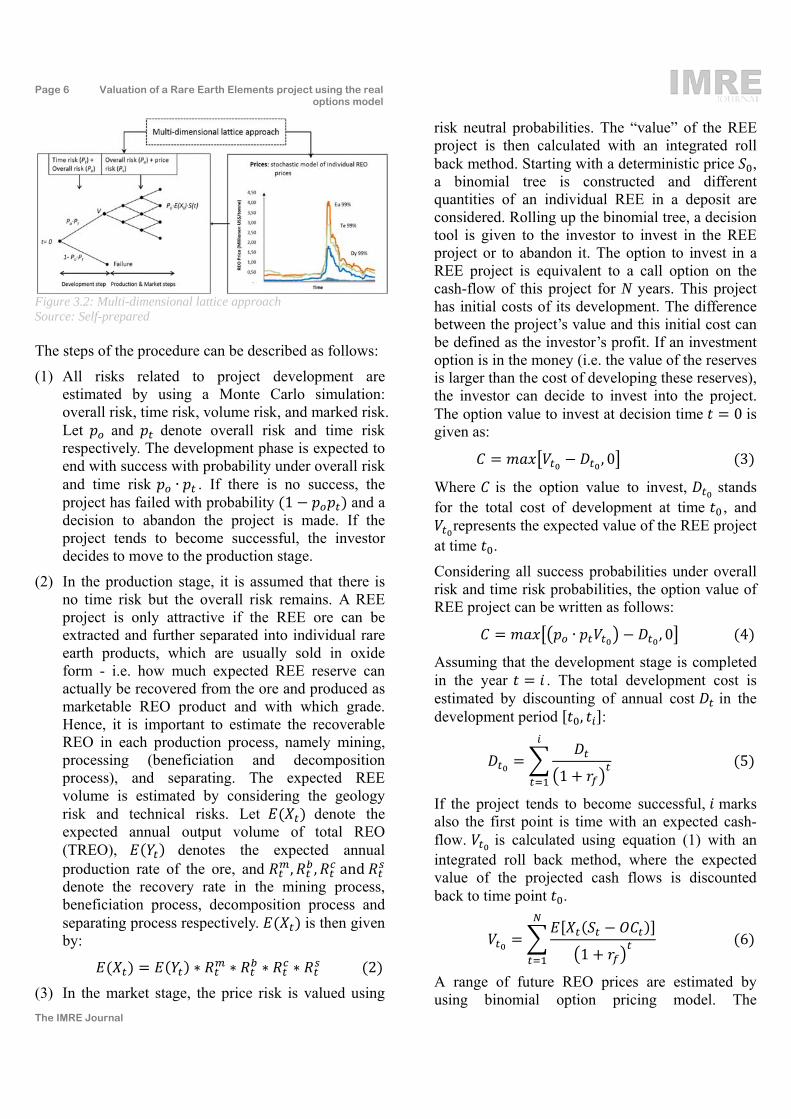
The discount cash flow (DCF) method is widely used for the valuation of mining projects. However, this method is unable to consider influences of risk factors on a project’s value and it does not differentiate among various decision options of investment. Hence, in order to account for such risk factors of a proposed REE project, another approach is needed. In this paper, a valuation model using the real options approach (ROA) is proposed. For the valuation of rather uncomplicated mining projects, the first paper applying ROA to a copper mine was published by Brennan and Schwartz (1985). They showed that, in comparison to the DCF method, the ROA provides a comprehensive overview of project development since various investment options can be assessed and evaluated. However, their “Brennan and Schwartz” model is based on a transparent commodity market and it does not capture technological uncertainties of the development of a mine. In order to account for these deficiencies, a real options model in a multi-dimensional binomial lattice for estimating the value of an investment option needs to be developed (as introduced for the one-dimensional case by Cox, Ross, and Rubinstein, 1979). Figure 3 shows this development. The estimation consists of two parts, one part being subject to project specific risks (overall risks, time risks and volume risks), and the other part being subject to market risk. The project specific risks are valued using project development information, while the market component is valued using a binomial option model.
Page 6 Valuation of a Rare Earth Elements project using the real options model
The IMRE Journal
Figure 3.2: Multi-dimensional lattice approach Source: Self-prepared The steps of the procedure can be described as follows:
(1) All risks related to project development are estimated by using a Monte Carlo simulation: overall risk, time risk, volume risk, and marked risk. Let and denote overall risk and time risk respectively. The development phase is expected to end with success with probability under overall risk and time risk ∙ . If there is no success, the project has failed with probability 1 and a decision to abandon the project is made. If the project tends to become successful, the investor decides to move to the production stage.
(2) In the production stage, it is assumed that there is no time risk but the overall risk remains. A REE project is only attractive if the REE ore can be extracted and further separated into individual rare earth products, which are usually sold in oxide form - i.e. how much expected REE reserve can actually be recovered from the ore and produced as marketable REO product and with which grade. Hence, it is important to estimate the recoverable REO in each production process, namely mining, processing (beneficiation and decomposition process), and separating. The expected REE volume is estimated by considering the geology risk and technical risks. Let denote the expected annual output volume of total REO (TREO), denotes the expected annual production rate of the ore, and , , and denote the recovery rate in the mining process, beneficiation process, decomposition process and separating process respectively. is then given by:
∗ ∗ ∗ ∗ 2
(3) In the market stage, the price risk is valued using
risk neutral probabilities. The “value” of the REE project is then calculated with an integrated roll back method. Starting with a deterministic price , a binomial tree is constructed and different quantities of an individual REE in a deposit are considered. Rolling up the binomial tree, a decision tool is given to the investor to invest in the REE project or to abandon it. The option to invest in a REE project is equivalent to a call option on the cash-flow of this project for N years. This project has initial costs of its development. The difference between the project’s value and this initial cost can be defined as the investor’s profit. If an investment option is in the money (i.e. the value of the reserves is larger than the cost of developing these reserves), the investor can decide to invest into the project. The option value to invest at decision time 0 is given as:
, 0 3
Where is the option value to invest, stands for the total cost of development at time , and
represents the expected value of the REE project at time .
Considering all success probabilities under overall risk and time risk probabilities, the option value of REE project can be written as follows:
∙ , 0 4
Assuming that the development stage is completed in the year . The total development cost is estimated by discounting of annual cost in the development period , :
1 5
If the project tends to become successful, marks also the first point is time with an expected cash-flow. is calculated using equation (1) with an integrated roll back method, where the expected value of the projected cash flows is discounted back to time point .
1 6
A range of future REO prices are estimated by using binomial option pricing model. The
Page 7 Valuation of a Rare Earth Elements project using the real options model
The IMRE Journal
description of the estimation is provided in chapter 3.3.
Table 3.1 shows following project data are required for the estimate of the option value:
Table 3.1: Required parameters for estimating the option value of a REE project
No. Parameter Description
1 Success probability under overall risk
2 Success probability under time risk
3 Time point with the first expected cash-flow occurs
4 Expected production volume of the ore at time
5 Expected volume of REE output at time
6 Expected operation costs at time
7 Development costs at time
8 Expected price at time
9 Expected value of REE output determined by variability of the price of the REE
Source: Self-prepared 3.2 Estimation of project related risks
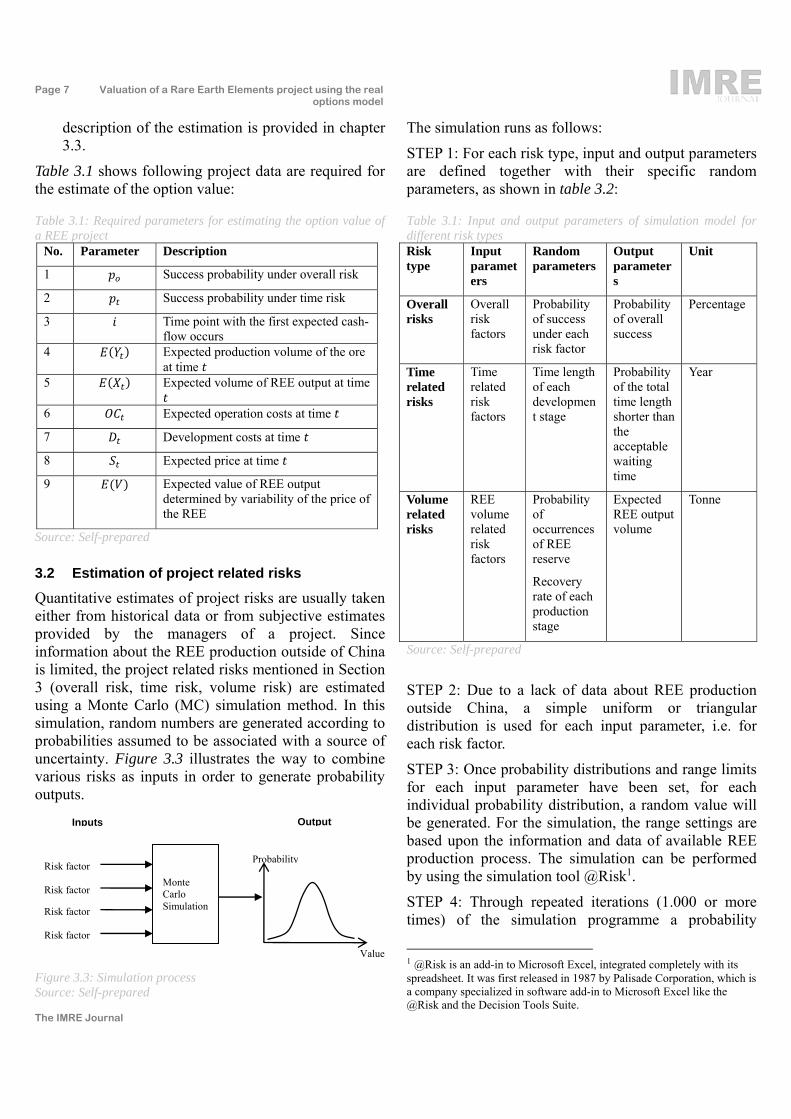
Quantitative estimates of project risks are usually taken either from historical data or from subjective estimates provided by the managers of a project. Since information about the REE production outside of China is limited, the project related risks mentioned in Section 3 (overall risk, time risk, volume risk) are estimated using a Monte Carlo (MC) simulation method. In this simulation, random numbers are generated according to probabilities assumed to be associated with a source of uncertainty. Figure 3.3 illustrates the way to combine various risks as inputs in order to generate probability outputs.
Figure 3.3: Simulation process Source: Self-prepared
The simulation runs as follows:
STEP 1: For each risk type, input and output parameters are defined together with their specific random parameters, as shown in table 3.2:
Table 3.1: Input and output parameters of simulation model for different risk types Risk type
Input parameters
Random parameters
Output parameters
Unit
Overall risks
Overall risk factors
Probability of success under each risk factor
Probability of overall success
Percentage
Time related risks
Time related risk factors
Time length of each development stage
Probability of the total time length shorter than the acceptable waiting time
Year
Volume related risks
REE volume related risk factors
Probability of occurrences of REE reserve
Recovery rate of each production stage
Expected REE output volume
Tonne
Source: Self-prepared
STEP 2: Due to a lack of data about REE production outside China, a simple uniform or triangular distribution is used for each input parameter, i.e. for each risk factor.
STEP 3: Once probability distributions and range limits for each input parameter have been set, for each individual probability distribution, a random value will be generated. For the simulation, the range settings are based upon the information and data of available REE production process. The simulation can be performed by using the simulation tool @Risk1.
STEP 4: Through repeated iterations (1.000 or more times) of the simulation programme a probability
1 @Risk is an add-in to Microsoft Excel, integrated completely with its spreadsheet. It was first released in 1987 by Palisade Corporation, which is a company specialized in software add-in to Microsoft Excel like the @Risk and the Decision Tools Suite.
Monte Carlo Simulation
Risk factor
Risk factor
Risk factor
Risk factor
Inputs Output
Probability
Value

Page 8 Valuation of a Rare Earth Elements project using the real options model
The IMRE Journal
density and histogram of every output can be obtained. The higher the iteration number, the more accurate is the estimation. In this paper, the iteration number is set at 5000. With an ever increasing number of iterations, a normal distribution is generated and the mean of this distribution is defined as the expected value.
3.3 Estimation of future prices
The fluctuation of REE prices can be captured by a binomial option model to obtain a range of future prices. Starting with a deterministic price 0 , a binomial tree for prices is constructed with upside and downside changes of prices. These can be written as follows respectively (Nelson, D.B. and Ramaswamy, K., 1990):
√∆ 7
√∆1 8
where:
= upside change (decrease) of the price of REO;
= downside change (rise) of the price of REO price;
= volatility of REO price;
∆ = number of years to expiration,
The upside price and the downside price in 1 can be defined as follows by:
Within the binomial tree of the TREO, upside and downside changes occur with specific and individual probabilities for each node within the tree. The risk-neutral probability of a rise in TREO prices is given by
1 ∆ 9
By corollary, the risk-neutral probability of decrease is then: 1 . By way of example, a one-period binomial tree is shown in figure 3.4 and a binomial tree for 5 periods of change of the TREO prices is shown in figure 3.5.
Figure 3.4: Binomial tree for a one-period of change of the TREO prices Source: Self-prepared
Figure 3.5: Binomial tree for 5 periods of change of the TREO prices Source: Self-prepared
For an estimation of the volatility of REO prices, a stochastic method has to be selected. There are many such methods, especially for metal price modelling, mentioned in the literature and the range goes from simple trend analysis to complex time series and econometric models. For the purpose of an REE project, the selection of an appropriate forecasting model plays a critical part. The most-used model to characterise the future behaviour of prices in discrete time is the Geometric Brownian Motion (GBM). However, REO prices do not follow a stochastic process converging to GBM. Recently, from 2010 to 2012, there was a dramatic increase of prices of all REO during 2010 and 2012, but in 2013, prices collapsed again. In the long run, however, it can be assumed that the prices of REO reflect the marginal production costs and market demand. Therefore, it is probably convenient to use the mean reverting model (MR) to model the future behaviour of REO prices. A MR model is a stochastic process model and it can be written as follows (Nelson, D.B. and Ramaswamy, K. 1990):
10
where
is the natural log of a spot price , with and exp
is the mean reversion speed,
is the long term average to which reverts,
is the volatility of price and
Page 9 Valuation of a Rare Earth Elements project using the real options model
The IMRE Journal
is the standard Wiener process
The estimation of the standard deviation of REO prices using the MR model 2 is carried out by using the
program R 3 . If represents the monthly price, the variance of yearly prices is obtained by:
⋅ √12 11
Applying this MR model to REE, one must recall that there are 17 individual elements and that prices differ depending on their abundance and demand. Note also that each REE deposit has different contents of individual REO and, as a result, the value of a REE project depends on a combination of prices of REO depending on the weighted share of each REO in the REE deposit. Hence, there is a need to create a so-called “total REO price” (TREO) which reflects this occurrence of various REO in a REE deposit, to be written as follows:
∗ 12
where
is the individual REO price at time t; is the number of individual REO, with 1,2, … , 17;
is the percentage of individual REO on total REO, with 1,2, … , 17;
∗ is the TREO price weighted by ratio of individual REO at time t.
3.4 Application of the real option model to Bayan Obo mine
We now apply the real option model to the Bayan Obo mine, the largest REE mine in the world and primary source of LREE. The distribution of individual REE is shown in table 3.2. The mine contains mostly LREE, but only around 1% of the HREE. The most abundant REE in Bayan Obo mine is cerium, which shares 50% of the total REE content, followed by lanthanum (27%) and neodymium (15%). The ore from the open pits is crushed on site at Bayan Obo. The crushed ore is then transported by train to the Baotou Iron and Steel Plant 2 The estimation process is provided in Appendix I. 3 R foundation: R is a language and environment for statistical computing and graphics, which provides a wide variety of statistical (linear and nonlinear modelling, classical statistical tests, time-series analysis, classification, clustering, etc.) and graphical techniques, and is highly extensible.
(Group ltd) (BTISP) in Bautou for further processing into concentrates. The annual mining volume of REO ore is about 40 000 tonnes4. Table 3.2: Distribution of individual REE in Bayan Obo ore
LERR HREE
La2O3 Ce2O2 Pr6O11 Nd2O3 Sm2O3 Eu2O3 Gd2O3
27% 50% 5% 15% 1.1% 0.2% 0.4%
HREE
Tb4O7 Dy2O3 Ho2O3 Er2O3 Tm2O3 Yb2O3 Lu2O3 Y2O3
‐ ‐ ‐ 1. 0% ‐ ‐ ‐ 0.3%
Source: Modern Aspects of Rare Earths and their Complexes, Sastri el. 2003 To calculate the value of the REE production, the expected production volume of TREO purity of 99% in Bayan Obo is firstly estimated using equation 2. Recovery rates in the production process are estimated as follows 5 : 85% , 92% and 92% . Assuming that recovery rates and annual production volumes remain the same for the entire time period 2014 to 2021, the production volume of REE ore is at 40 000 tonnes. The expected annual volume of TREO is then obtained as:
40000 ∙ 85% ∙ 92% ∙ 92% 33143.6t
Subsequently, the volatility of the TREO price is calculated with the MR model. Using of equation 12, the TREO price is calculated by weighting the shares of each REO in the Bayan Obo deposit. A TREO price path for Bayan Obo deposit is shown in figure 3.6.
4 China Ministry of Industry and Information Technology (MIIT) sets up every year rare earth mining quote and rare earth smelting and separating production quotas. The average mining quote from 2009 to 2014 has been calculated at 97316.67 tonnes (REO) (Asian Metal 2015). The REO production in Baotou shares around 40% of the domestic production in China. An annual mining volume of REO ore in amount of 40 000 tonne is assumed in this paper. 5 Since 2012, Chinese government set up a series of regulations and standards to strengthen the REE sector (MIIT, 2012; MLR, 2013; NDRC, 2015). These regulations and standards have set up the minimum requirement of beneficiation, decomposition and separation recovery rate according to REE ore type. In case the Chinese producer can’t meet the requirement, they can’t award REE production rights. Already existing companies will be forced to improve their production process or will be consolidated by other qualified companies. Based on these requirements, the recovery rate of beneficiation, decomposition and separation in Bayan Obo mine has been estimated using MC simulation with triangular distribution in this paper.

Page 10 Valuation of a Rare Earth Elements project using the real options model
The IMRE Journal
Figure 3.6: Average monthly price paths of LREO, HREO, and price path of TREO weighted with REE distribution in Bayan Obo Source: self-complied based on the free-on-board (FOB) prices provide by Asian Metal. Prices refer to a minimum purity of 99% and minimum purity for yttrium oxide is 99.999% Using the MR Model as described in chapter 3.3, the volatility of the monthly TREO price is estimated as:
0.1231. The volatility of the yearly price is then ⋅ √12 0.1231 ⋅ √12 0.4264.
The upside and downside change factors for the TREO price were estimated to be equal to 1.53 and 0.65 respectively according to equations 6 and 7:
√∆ . √ 1.53
√∆ 1 11.53
0.65
For 2014, the price of TREO was estimated to be equal to 96364.38 Yuan/tonne (equal to 16229.06 $/tonne) 6. The binomial tree of the TREO price for the consecutive eight years up to 2021 yields the results as shown in table 3.4 (Appendix II). The upside price in 2015 is calculated by a multiplication of the TREO price in 2014 and the upside change factor (96346.38 x 1.53 = 147626.48), and the downside price in 2015 is equal to the TREO price in 2014 multiplied by the downside change factor (96346.38 x 0.65 = 62902.62). The range of TREO prices from 2014 to 2021 is obtained in a similar approach. The expected cash-flow is calculated with the formula:
∗ . In this paper, data about the average operating costs ( 96012Yuan/tonne ) as provided by Su, W.Q. (2009) are used and it is assumed that the operating costs remain the same for
6 The exchange rate of US$ to Chinese Yuan in January 2014 was 6.061 US$/RMB. Source: http://www.finanzen.net/devisen
the entire time period from 2014 to 2021. The binomial tree of cash-flow is then obtained as shown in table 3.5 (Appendix II).
For example, the up-side cash flow in 2015 is calculated as follow:
33143.6 ∙ 147626.48 96012 ∙ 10
1909.55millionYuan
Assume the risk free interest rate is 7% and ∆ 1. The risk neutral probability of a rise is obtained by:
1 ∆ 1 7% 0.651.53 0.65
0.47
The risk neutral probability of a failure is then 10.53.
Using equation 6, the value of REE production is calculated with an integrated roll back method and discounted to the beginning at the decision time point. Within the binomial tree, the value of each node is recursively calculated as the sum of the current cash-flow and the discounted cash-flow of the next time step
1 . For example, the up-side value in 2015 is calculated as follows:
⋅ 1 ⋅1
Subsequently, the option value of REE project is calculated considering success probabilities under overall risk and time risk (equation 4). Since the Bayan Obo mine has been operating for over 50 years, the mine development period is zero. The main risk in the production stage is the environmental risk. The success probability under environmental risk has been estimated using a simulation method at 60% 7 , i.e. 0.6 . Assuming that there is also no additional capital cost for development of the mine, the option value is then obtained as following formula:
, 0
7 The environmental risk is estimated according to the Environmental Performance Index (EPI) of Yale University and Columbia University. EPI ranks how well countries perform on high-priority environmental issues in two broad policy objectives: environmental health and ecosystems vitality. China with an EPI score of 42 ranges in high environmental risk category. The probability of occurrences of environmental damage ranges between 30% - 49.9%. The success probability under environmental risk is estimated using Monte Carlo simulation with uniform distribution.
0,00
2,00
4,00
6,00
8,00
10,00
12,00
01.01.2008
01.09.2008
01.05.2009
01.01.2010
01.09.2010
01.05.2011
01.01.2012
01.09.2012
01.05.2013
01.01.2014
REO
Prices Millionen Yuan
/tonne
Aver. LREE
Aver. HREE
TREO in Bayan Obo

Page 11 Valuation of a Rare Earth Elements project using the real options model
The IMRE Journal
Note also that the producer has different options during the project life time. As a result, the following 3 cases need to be considered:
(1) Base case: the producer has no option of closing down the mine during the operating time;
(2) The producer has an option to close down the mine (option to abandon) when the cash-flow is negative;
(3) The producer has an operation to close down the mine, but this closing down requires additional costs.
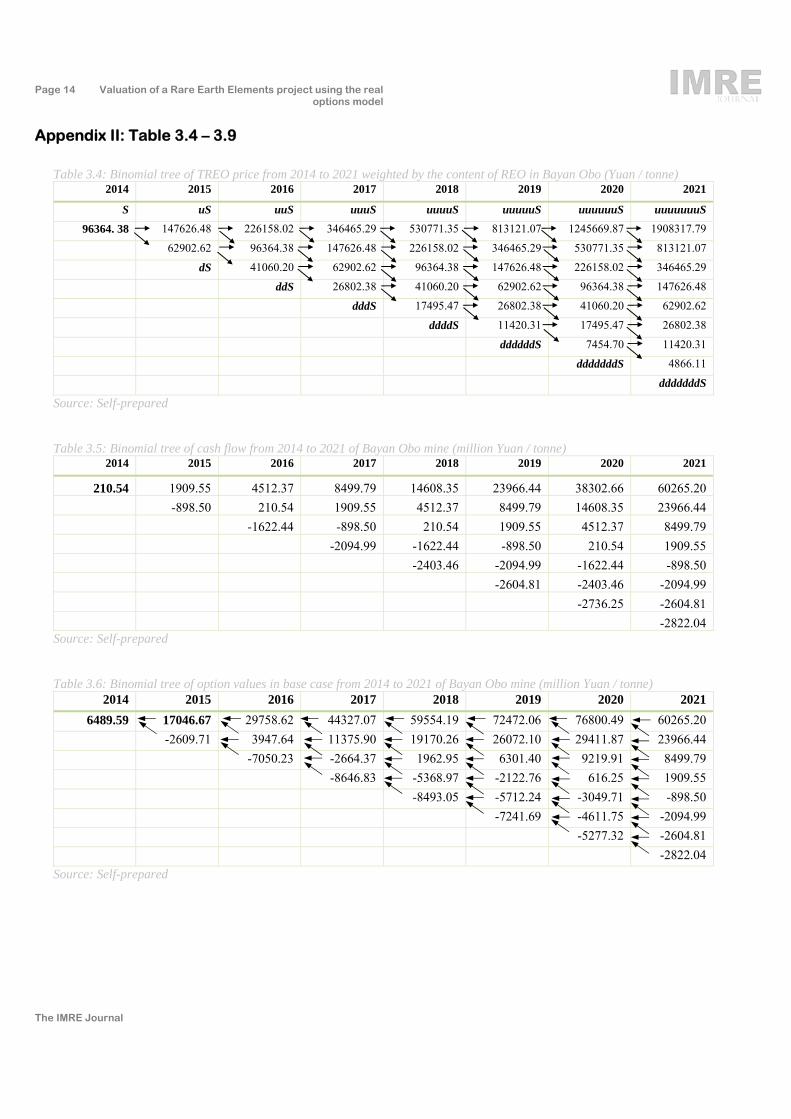
(1) In the first case, the value of the REE production is equal to the discounted cash-flow considering future price movements. The rollback calculation starts at the last time point (year 2021) and the cash-flows are gradually discounted back to 2014. Table 3.6 (Appendix II) shows the binomial tree of the value of the REE production from 2014 to 2021. Arrows present the backwards calculation. For example, the up-side value in 2015 is calculated as follow:
1909.50.47 ⋅ 29758.6 0.53 ⋅ 3947.6
1 0.07
17046.67millionYuan
The value of the REE production is found to be equal to 6489.67 million Yuan (1070.71 million US$) at time t = 0.
Considering success probability, the option value of REE project is then: , 0 0.6 6489.09, 0 3893.76 million Yuan (642.43 million US$). The equivalent real option diagram is shown in figure 3.7:
Figure 3.7: Real option diagram in case 1 Source: Self-prepared
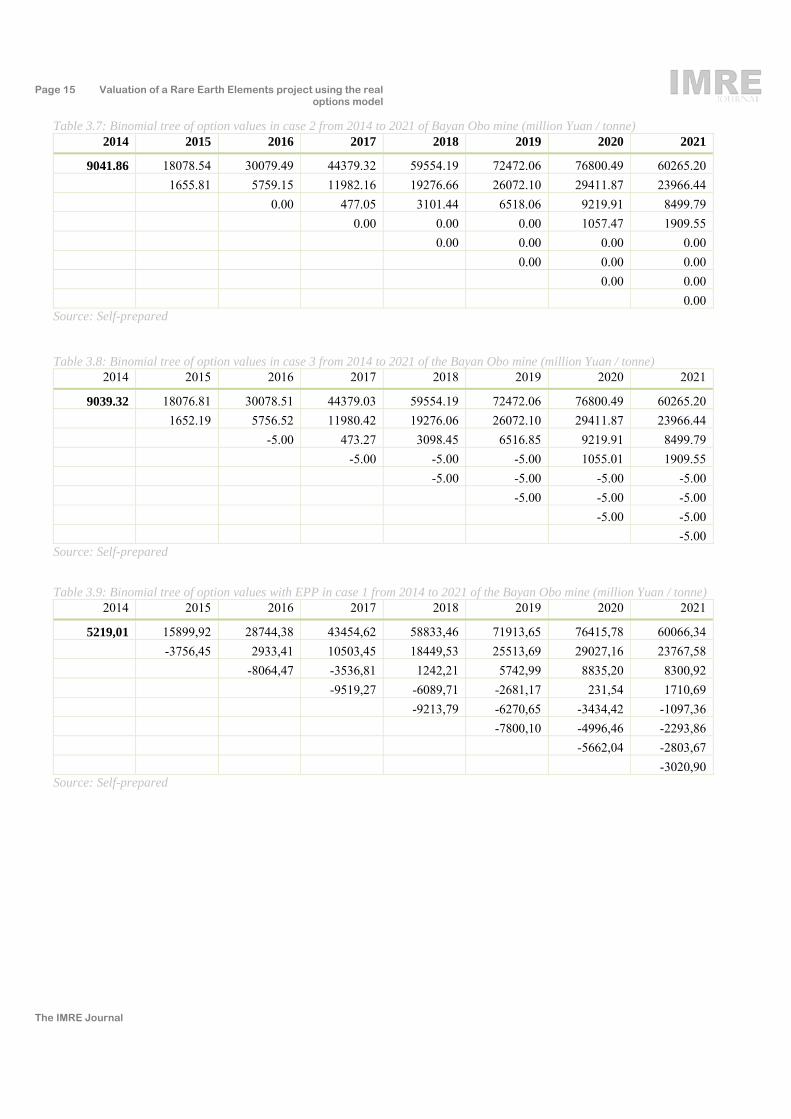
(2) In the case the producer has an option to close down the mine when the price is lower than the costs, the
expected value of each node in the binomial tree is the maximum value of the discounted cash-flow or zero:
∗ , 0
where is the value investment of price movement at time .
The value of a REO production at each node in the binomial tree is shown in table 3.7 (Appendix II), which has been calculated at 9041.86 million Yuan (1491.81 million US$), which is higher than the value without the option to close the operation.
The option value of REE project is then obtained at: max [0.6 × 9041.86, 0] = 5425.12 million Yuan
(895.08 million US$). The equivalent real option diagram is shown in figure 3.8:
Figure 3.8: Real option diagram in case 2 Source: Self-prepared
(3) In the case the producer has an option to close the mine, and the closing cost is , the expected value of each node is the maximum value of the discounted cash-flow or closing costs:
∗ ,
Assume the closing costs for Bayan Obo to be equal to 5 million Yuan, then the value of a REO production at each node in the binomial tree is shown in table 3.8 (Appendix II).
The value of the REE production is 9039.32 million Yuan (1491.39 million US$). The option value of REE project is then: , 0 0.69039.32, 0 5423.59 million Yuan (894.83 million US$), which is 2.54 million Yuan lower than the option value in case 2. The equivalent real option diagram is shown in figure 3.9:

Page 12 Valuation of a Rare Earth Elements project using the real options model
The IMRE Journal
Figure 3.9: Real option diagram in case 3 Source: Self-prepared
Next, assuming that the producer has to pay 15 000 million Yuan for an environmental damage, if an environmental failure occurs with a probability of 1 . In order to avoid of an environmental damage,
the producer intents to increase the budget in amount of 6000 Yuan/tonne annually for an environmental protection plan, i.e. the operation cost is increased to 102 012 Yuan/tonne. As a result, the probability of success under environmental risk will increase correspondently to 80%. The option value is then calculated as:
1 , 0 13
where stands the cost for environmental damage.
Both sets of options now may be combined to show the values of the first three options with and without an Environmental Protection Plan. The equivalent real option diagram of the first option with and without EPP is shown in figure 3.9. Using equation 6, the production value with EPP with has been calculated at 5291.01 million Yuan (figure 3.9, Appendix II), which is lower than the production value without the EPP without (6489.59 million Yuan). However, the option value with the EPP has been calculated using equation 13 as 5291.01 0.8 15000 0.21175.21 million Yuan, which is higher than the option value without the EPP , which is calculated as
6489.59 0.6 15000 0.42016.24.
Calculating with the same methodology as for case 2 and case 3, the production value and the option value with and without EPP in all three case are presented in table 3.10. It is clear to see that the production value
with EPP in all three cases is lower than the production value without EPP.
Figure 3.10: Real option diagrams of with and without environmental protection plan (EPP) in the base case Source: Self-prepared
However, the option value without EPP in all three cases is negative. The option value with the EPP in all 3 cases is higher than without EPP. The difference between the option value with the EPP and the option value without the EPP is positive, and in range of [3281.45 ~ 3080.41] million Yuan in 3 cases. Hence, the producer will benefit from the investment into the EPP despite the lower production value.
Table 3.10: REE investment values and option value with and without the environmental protection plan (EPP)
Case 1 Case 2 Case 3
Without environmental protection plan
Production value without EPP: without (million Yuan) 6489.59 9041.86 9039.32 Option value without EPP
(million Yuan) -2106.24 -547.88 -576.41 With environmental protection plan
Production value with EPP: with (million Yuan) 5219.01 8165.67 8163.12
Option value with EPP (million Yuan) 1175.21 3532.53 3530.50 Comparison of investment values and option values

Page 13 Valuation of a Rare Earth Elements project using the real options model
The IMRE Journal
with and without EPP
with without -1270.58 -876.19 -876.20
3281.45 4080.41 4106.91 Source: Self-prepared
4 Conclusion
Rare earth elements are considered indispensable in modern industry. They are extensively used in new materials, energy conservation, environmental protection and IT devices as well as in military weapon systems. However, rare earth mining and processing is an ore-specific, complex process and has huge impacts on the environment unless it is controlled and managed appropriately. To make REE economically exploitable, the production process is not only determined by their relative abundance in the earth’s crust. Many other factors, such as 1) the metal concentration in ore deposits, 2) the feasibility of exploration and mining, 3) the complexity of processing and refining of the ore, 4) environmental and social feasibilities play a role. From exploration to production, many risk factors have an impact on the success of a REE project. An investor may react to these risks through the development of options as the REE project proceeds.
This paper has dealt with the production chain of REE and its various risk factors. The real options approach has been used in order to value a REE project. In comparison to common metals, there are many challenges to apply this approach to a REE project, such as: 1) The technical feasibility is essential for the success of a REE project; 2) The development phase is long-lasting and risks vary as it continues, 3) There is no transparent market for REE products and only limited data about production volumes and prices are available. Hence, a real options model in multi-dimensional binomial lattice for estimating the value of an investment option has been developed. All project related risk factors are estimated by a Monte Carlo simulation by setting range limits according to project status and location. The future prices are forecasted by a Mean Reverting method. The model provides a method of assessing varies risks of a REE project from development stage until market stage. It incorporates the market price of each individual REO and uses production data to capture volume uncertainty. The other advantage of this method is that it allows an investor to assess different options with various uncertainties during the operation. The new real option
has been applied for the valuation of the Bayan Obo mine, biggest REE mine. Option values for different cases are calculated including the case of an investment into an environmental protection plan was assumed. The method provides a basis for investment decision making.
Appendix I: Autoregressive process of mean reversion model
The MR process from equation 10 is the limiting case of the following autoregressive process for ∆ → 0:
1 1
⇒ 1
where is a stochastic process of mean zero and standard deviation with ∼ 0,
This equation can be written as:
with 1 and ,
The mean reversion speed and the long term average are then written as:
1
Expected value and variance of the MR process are obtained by:
21
Detail can be found in Dixit & Pindyck 1994, and Pelet, M. 2003.
Page 14 Valuation of a Rare Earth Elements project using the real options model
The IMRE Journal
Appendix II: Table 3.4 – 3.9
Table 3.4: Binomial tree of TREO price from 2014 to 2021 weighted by the content of REO in Bayan Obo (Yuan / tonne)
2014 2015 2016 2017 2018 2019 2020 2021
S uS uuS uuuS uuuuS uuuuuS uuuuuuS uuuuuuuS
96364. 38 147626.48 226158.02 346465.29 530771.35 813121.07 1245669.87 1908317.79
62902.62 96364.38 147626.48 226158.02 346465.29 530771.35 813121.07
dS 41060.20 62902.62 96364.38 147626.48 226158.02 346465.29
ddS 26802.38 41060.20 62902.62 96364.38 147626.48
dddS 17495.47 26802.38 41060.20 62902.62
ddddS 11420.31 17495.47 26802.38
ddddddS 7454.70 11420.31
dddddddS 4866.11
dddddddS
Source: Self-prepared
Table 3.5: Binomial tree of cash flow from 2014 to 2021 of Bayan Obo mine (million Yuan / tonne) 2014 2015 2016 2017 2018 2019 2020 2021
210.54 1909.55 4512.37 8499.79 14608.35 23966.44 38302.66 60265.20
-898.50 210.54 1909.55 4512.37 8499.79 14608.35 23966.44
-1622.44 -898.50 210.54 1909.55 4512.37 8499.79
-2094.99 -1622.44 -898.50 210.54 1909.55
-2403.46 -2094.99 -1622.44 -898.50
-2604.81 -2403.46 -2094.99
-2736.25 -2604.81
-2822.04 Source: Self-prepared
Table 3.6: Binomial tree of option values in base case from 2014 to 2021 of Bayan Obo mine (million Yuan / tonne) 2014 2015 2016 2017 2018 2019 2020 2021
6489.59 17046.67 29758.62 44327.07 59554.19 72472.06 76800.49 60265.20
-2609.71 3947.64 11375.90 19170.26 26072.10 29411.87 23966.44
-7050.23 -2664.37 1962.95 6301.40 9219.91 8499.79
-8646.83 -5368.97 -2122.76 616.25 1909.55
-8493.05 -5712.24 -3049.71 -898.50
-7241.69 -4611.75 -2094.99
-5277.32 -2604.81
-2822.04
Source: Self-prepared
Page 15 Valuation of a Rare Earth Elements project using the real options model
The IMRE Journal
Table 3.7: Binomial tree of option values in case 2 from 2014 to 2021 of Bayan Obo mine (million Yuan / tonne) 2014 2015 2016 2017 2018 2019 2020 2021
9041.86 18078.54 30079.49 44379.32 59554.19 72472.06 76800.49 60265.20
1655.81 5759.15 11982.16 19276.66 26072.10 29411.87 23966.44
0.00 477.05 3101.44 6518.06 9219.91 8499.79
0.00 0.00 0.00 1057.47 1909.55
0.00 0.00 0.00 0.00
0.00 0.00 0.00
0.00 0.00
0.00 Source: Self-prepared
Table 3.8: Binomial tree of option values in case 3 from 2014 to 2021 of the Bayan Obo mine (million Yuan / tonne) 2014 2015 2016 2017 2018 2019 2020 2021
9039.32 18076.81 30078.51 44379.03 59554.19 72472.06 76800.49 60265.20
1652.19 5756.52 11980.42 19276.06 26072.10 29411.87 23966.44
-5.00 473.27 3098.45 6516.85 9219.91 8499.79
-5.00 -5.00 -5.00 1055.01 1909.55
-5.00 -5.00 -5.00 -5.00
-5.00 -5.00 -5.00
-5.00 -5.00
-5.00 Source: Self-prepared
Table 3.9: Binomial tree of option values with EPP in case 1 from 2014 to 2021 of the Bayan Obo mine (million Yuan / tonne) 2014 2015 2016 2017 2018 2019 2020 2021
5219,01 15899,92 28744,38 43454,62 58833,46 71913,65 76415,78 60066,34
-3756,45 2933,41 10503,45 18449,53 25513,69 29027,16 23767,58
-8064,47 -3536,81 1242,21 5742,99 8835,20 8300,92
-9519,27 -6089,71 -2681,17 231,54 1710,69
-9213,79 -6270,65 -3434,42 -1097,36
-7800,10 -4996,46 -2293,86
-5662,04 -2803,67
-3020,90 Source: Self-prepared
Page 16 Valuation of a Rare Earth Elements project using the real options model
The IMRE Journal
References
Asian Metal (2015), China’s Rare Earth Industry Policies, Asian Metal Meta Pedia (in Chinese), available at: http://baike.asianmetal.cn/metal/re/policy.shtml
British Geological Survey (BGS) (2010), Rare Earth Elements, Natural Environment Research Council
Brennan, M. J., Schwartz, E., (2001), Evaluating Natural Resource Investment (Eds, Schwartz, E. and Trigeorgis, L.) The MIT Press, London, pp. 335-358
Brennan, M. J., Schwartz, E. S. (1985), Evaluating Natural Resource Investments, Journal of Business, 58(2), 135-157
Castor, S., Hedrick, J. (2006), Rare Earth Elements, in Society for Mining, Metallurgy, and Exploration: Littleton, Colorado, Vol. Industrial Minerals and Rocks, 7th edition, pp 769−792.
Cox, J., Ross, S. and Rubinstein, M., (1979), Option Pricing: A Simplified Approach, Journal of Financial Economics, 7, pp 229-263
Dixit, A. K. and Pindyck R. S., (1994), Investment under uncertainty, Princeton University Press
Gupa, C. K., Krishnamurthy, N. (2005), Extractive Metallurgy of Rare Earths, in CRC Press
Jackson, W., Christiansen, G. (1994), International Strategic Minerals Inventory Summery Report – Rare Earth Oxides, in U.S. Geological Survey Circular 930-N
Gao, Z.Q., Zhou, Q.X. (2011), Contamination from rare earth ore strip mining and its impacts on resources and eco-environment, in Chinese Journal of Ecology, Vol. 30 (In Chinese)
Hatch, G.P. (2011), Critical Rare Earth: Global Supply & Demand Projections and the Leading Contenders for New Sources of Supply, in Technology Metals Research, LLC.
Martínez, L.A., (2010), Strategic Project Evaluation for Open Pit Mining Ventures Using Real Option and Allied Econometric Techniques, PhD Thesis submitted in Mathematical Sciences Discipline Queensland University of Technology Brisbane, Australia.
Ministry of Industry and Information Technology of the People's Republic of China (MIIT) (2012), Standard Entrance Conditions for the Rare Earths Industry (In Chinese)
Ministry of Land and Resources of the People's Republic of China (MLR) (2013), Minimum
Requirements of ‘Three Rates’ for Rational Development and Utilization of Rare Earth Resources (Trial Implementation) (In Chinese)
National Development and reform Commission of the People's Republic of China (NDRC) (2015), Standard System of Clean Production of Rare Earth Industry (In Chinese)
Orris, G. J. and Grauch, R. I. (2002), Rare Earth Element Mines, Deposits and Occurrences. USGS Open-File Report 02-189
Öko-Institut e.V. (2010), Study on Rare Earths and Their Recycling, Institute for Applied Ecology
Pelet, M. (2003), Real Options in Petroleum: Geometric Brownian Motion and Mean-Reversion with Jumps, MSc. Dissertation in Mathematical Modelling and Scientific Computing, New College, Oxford University
Sastri V.R., Perumareddi, J. R., Rayudu, G. V. S., Bünzli, J. C. (2003), Modern Aspects of Rare Earths and their Complexes, Elsevier
Shfiee, S., Topal, E., and Nehring, M., (2009), Adjusted Real Option Valuation to Maximize Mining Project Value - A Case Study Using Century Mine, Proceedings of Project Evaluation Conference, 125-134
Shu, W. Q. (2009), The Economic and Policy Analysis of Chinese Rare Earth Industry, China Financial & Economic Publishing House
Trigeorgis, L. (2002), Real Options – Managerial Flexibility and Strategy in Resource Allocation, MIT Press, Cambridge
U.S. Environmental Protection Agency (EPA) (2012), Rare Earth Elements: A Review of Production, Processing, Recycling, and Associated Environmental Issues
Wu, Q.F., Liu, H., Ma, C.H., Zhao, S.P., Zhu, X.H., Xiong, S.Q., Wang, H.Y., (2011), The use and management of NORM residues in processing Bayan Obo ores in China, Naturally Occurring Radioactive material (NORM VI), Proceedings of an International Symposium Marrakesh, Morocco, 22 – 26 march 2010, International Atomic Energy Agency, Vienna, 2011, pp 65 – 78
Yale Centre for Environmental Policy and Law, New Haven and Centre for International Earth Science Information Network, Columbia University, (2014), Environmental Performance Index, Full Report and Analysis, New York

![New Regulations for IMRE - tu-freiberg.de · −Master Thesis plus colloquium [M.THESIS] x18 CP EREMAP EMA SERMA CULSTU COREL FREEL GERM1 GERM2 3 6 9 CP An internship can also be](https://img.pdfslide.us/doc/110x75/5fd3895de5693d05a46a1439/new-regulations-for-imre-tu-amaster-thesis-plus-colloquium-mthesis-x18-cp.jpg)