Embed Size (px)
Citation preview
OPEN ACCESS
EURASIA Journal of Mathematics Science and Technology Education ISSN: 1305-8223 (online) 1305-8215 (print)
2017 13(10):6471-6490 DOI: 10.12973/ejmste/78076
© Authors. Terms and conditions of Creative Commons Attribution 4.0 International (CC BY 4.0) apply. Correspondence: Brandford Bervell, University of Cape Coast, Cape Coast, Tel:+233200937934. [email protected]
Validation of the UTAUT Model: Re-Considering Non-Linear Relationships of Exogeneous Variables in Higher Education
Technology Acceptance Research
Brandford Bervell College of Distance Education, University of Cape Coast, Cape Coast, GHANA
Irfan Naufal Umar Centre for Instructional Technology and Multimedia, Universiti Sains Malaysia, MALAYSIA
Received 19 May 2017 ▪ Revised 28 July 2017 ▪ Accepted 18 August 2017
ABSTRACT Over the years, The Unified Theory of Acceptance and Use of Technology (UTAUT) has served many researchers in unravelling technology acceptance intentions. What has become a chasm in the literature has been the seeming exclusion of non-linear relationships of UTAUT exogeneous variables (Performance Expectancy, Effort Expectancy, Social Influence and Facilitating Conditions) in model formation and the overall determination of construct predictive relationships. Secondly, there is a dearth in technology acceptance research in distance-based higher education settings. In an attempt to bridge these gaps, this study adopted the UTAUT model and utilized the Partial Least Squares approach to evaluate a combined linear and non-linear relationships based UTAUT model. The survey design was employed in which a questionnaire was used to obtain data from a sample of 267 respondents (tutors) from a distance-based higher education milieu with a country-wide distribution. Results obtained indicated that non-linear relationships exist between exogeneous factors to better explain constructs’ behaviour in the model. A new relationship between facilitating condition and social influence was also discovered. The study thus concluded that in technology acceptance research, there is the need to include non-linear relationships in the UTAUT model to augment the predictive effects and explanations of the constructs’ relationships. It further recommended a comparative analysis between a proposed comprehensive UTAUT model with non-linear relationships and moderators to the original UTAUT model for further empirical analysis. This is to compare results in terms of coefficient of determination (R2) and predictive relevance (Q2). Keywords: UTAUT exogeneous variables, linear relationships, non-linear relationships, technology acceptance, distance higher education
INTRODUCTION
It is an undeniable fact that the 21st century has been awash with technologies beyond fathom. Reminiscing the age trail of distance education and its development of technologies over three to four generations (Anderson & Dron, 2010), it is apt to qualify this age as a techno-centric era where technology has been ubiquitous. Technological integration has bedevilled every nook and cranny of our society and seems to be the chief hub of performance.
The infiltration has not spared the classroom locale as the current educational environments have made technology an epicentre of pedagogical and andragogical practices. This has enrolled the terms educational
B. Bervell & I. N. Umar / Modelling Non-Linear Relationships of UTAUT
6472
technology, instructional technology, online learning and e-learning, blended learning, to mention but a few. The permeating of these disruptive technologies has also awakened the acceptance phenomenon in the education circles, whether on the part of instructors or students both being direct stakeholders in this campaign. Of particular interest has been the study of intentions to accept Learning Management Systems (LMS) for either blended or fully online learning.
However, in investigating the acceptance or otherwise of usage intentions of LMS technology by instructors and students, a plethora of models and theories (modified, adapted or adopted) have been employed. From the old age Innovation Diffusion Theory (IDT) to Model of Personal Computer Usage (MPCU), the Unified Theory of Acceptance and Use of Technology (UTAUT) seem to be the preferred and widely used theory (Attuquayefio & Addo, 2015), especially in the higher education LMS technology acceptance research. UTAUT has by far seemed to be an explanatory of intent behaviour utilized by researchers in most quarters of LMS acceptance studies. The model, as developed by Venkatesh et al., (2003), boasts of the four exogeneous variables [Performance Expectancy (PE), Effort Expectancy (EE), Social Influence (SI) and Facilitating Conditions (FC)] influencing an endogeneous variable, Behavioural Intention (BI) which ultimately induces Use Behaviour (UB) with a discourse of four moderating variables (Age, Gender, Experience and Voluntariness).
By far, the model’s agility in explaining usage intentions has ranged from a low of 36% (without moderator) to as high as about 76% (with moderators) (Khechine et al., 2014) albeit in different settings. This depicts an over-performance of all other technology acceptance models. Nevertheless, the proponent of this model did not deem it a finite model but made suggestions that exposed the model to modifications deemed at improving the predictability power. The concern of this paper is not to add a new variable, but rather unravel the missing non-linear relationships that may exist among the key exogeneous variables in the UTAUT model which are omitted in the model as well as in most LMS acceptance research.
Building on the argument of nonlinear relationships, Kock (2016), supports Roberts (1986) who stated that “the practicality and importance of nonlinear modelling is supported by the emergence of the predicted types of relationships and the substantial proportions of variance that they account for. Moreover, the fact that similar relationships emerged across methods supports the general nature and the underlying concept of nonlinearity. They enable researchers to capture the explicit differences and similarities in outcomes for various components of a construct. Thus, becoming a useful conceptual exercise and a necessary preliminary to generating causal explanations” (pg.4). He contends that, the building of non-linear models accurately reflects the nature of major developmental phenomena and produce outcomes that provide a powerful heuristic, summarizing and integrating present knowledge and forming the basis for the construction of detailed causal and process models. In addition, nonlinear models can yield predicted relationships that hold across methods and account for substantial portions of variance. In cases of inconsistent findings, such models can serve as tools for reconciling and integrating research from diverse sources (Roberts, 1986). This underpins the necessity for this study.
Contribution of this paper to the literature
• The study advanced new non-linear relationships to the original relationships within the UTAUT key constructs which could further best help explain user technology acceptance intentions and decision-making.
• Furthermore, it unravelled a new significant and relevant relationship between Facilitating Conditions and Social Influence (FC > SI) which is very important for decision making by implementers of new technologies in organizations.
• Finally, it proposed a comprehensive linear and nonlinear relationship- based UTAUT model with the original moderators, that could be further verified for comparison in model predictive power, effect size and relevance.
EURASIA J Math Sci and Tech Ed
6473
Problem Statement
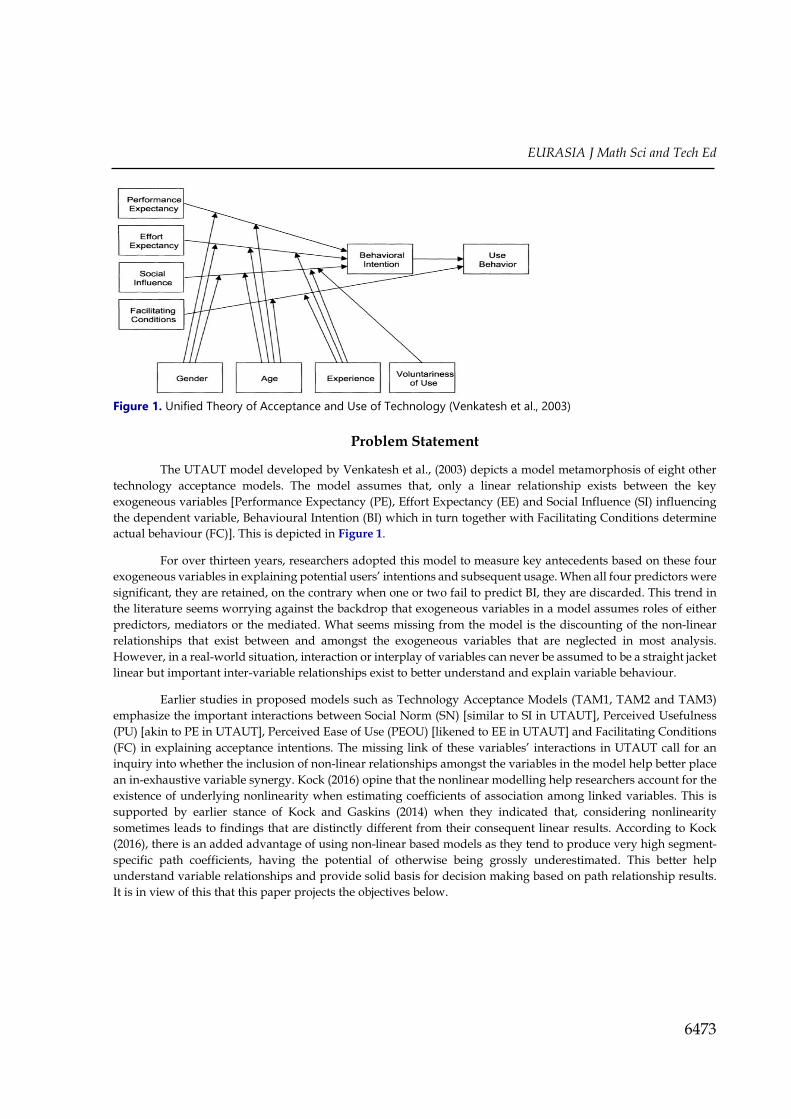
The UTAUT model developed by Venkatesh et al., (2003) depicts a model metamorphosis of eight other technology acceptance models. The model assumes that, only a linear relationship exists between the key exogeneous variables [Performance Expectancy (PE), Effort Expectancy (EE) and Social Influence (SI) influencing the dependent variable, Behavioural Intention (BI) which in turn together with Facilitating Conditions determine actual behaviour (FC)]. This is depicted in Figure 1.
For over thirteen years, researchers adopted this model to measure key antecedents based on these four exogeneous variables in explaining potential users’ intentions and subsequent usage. When all four predictors were significant, they are retained, on the contrary when one or two fail to predict BI, they are discarded. This trend in the literature seems worrying against the backdrop that exogeneous variables in a model assumes roles of either predictors, mediators or the mediated. What seems missing from the model is the discounting of the non-linear relationships that exist between and amongst the exogeneous variables that are neglected in most analysis. However, in a real-world situation, interaction or interplay of variables can never be assumed to be a straight jacket linear but important inter-variable relationships exist to better understand and explain variable behaviour.
Earlier studies in proposed models such as Technology Acceptance Models (TAM1, TAM2 and TAM3) emphasize the important interactions between Social Norm (SN) [similar to SI in UTAUT], Perceived Usefulness (PU) [akin to PE in UTAUT], Perceived Ease of Use (PEOU) [likened to EE in UTAUT] and Facilitating Conditions (FC) in explaining acceptance intentions. The missing link of these variables’ interactions in UTAUT call for an inquiry into whether the inclusion of non-linear relationships amongst the variables in the model help better place an in-exhaustive variable synergy. Kock (2016) opine that the nonlinear modelling help researchers account for the existence of underlying nonlinearity when estimating coefficients of association among linked variables. This is supported by earlier stance of Kock and Gaskins (2014) when they indicated that, considering nonlinearity sometimes leads to findings that are distinctly different from their consequent linear results. According to Kock (2016), there is an added advantage of using non-linear based models as they tend to produce very high segment-specific path coefficients, having the potential of otherwise being grossly underestimated. This better help understand variable relationships and provide solid basis for decision making based on path relationship results. It is in view of this that this paper projects the objectives below.
Figure 1. Unified Theory of Acceptance and Use of Technology (Venkatesh et al., 2003)
B. Bervell & I. N. Umar / Modelling Non-Linear Relationships of UTAUT
6474
Research Objectives
1. To find out non-linear relationships that may exists amongst UTAUT key exogeneous constructs. 2. To find out how non-linear relationships better help to understand behaviour of constructs in a model
for decision-making. 3. To find out factors that best determine behavioural intentions of distance education tutors in accepting
technology based on both linear and non-linear relationships.
Research Questions
Based on the above objectives this paper is guided by the following research questions:
1. What non-linear relationships exist among UTAUT exogeneous variables? 2. How do non-linear relationships better help understand behaviour of constructs in a model for
decision-making? 3. What factors best determine behavioural intentions of distance education tutors in accepting
technology based on both linear and non-linear relationships.
TOWARDS A CONCEPTUAL MODEL AND HYPOTHESES DEVELOPMENT
Original UTAUT Linear Relationships
The construct performance expectancy defines the degree to which an individual believes that using a system will enable him or her attain gains in job performance (Venkatesh et al., 2003). The construct explains that prior to the acceptance of any new technology, individuals project a weighting of the intended benefits to be gained in the event of using that technology with respect to job performance or personal improvement towards discharging responsibilities before making their final decisions of intention to use. The construct is deemed to be a key and strongest predictor of LMS acceptance intentions. Other authors such as Khechine, Lakhal, Pascot and Bytha (2014); Percy and Belle (2012); as well as Ain, Kuar and Waheed (2015) who adopted UTAUT in their studies confirmed this relationship. However, in some instances such as Ambali and Bakar, (2014) PE was not the highest predictor of BI and in Nicholas-Omoregbe, Azeta, Chiazor, and Omoregbe (2017), the construct did not predict BI at all, a result consistent with earlier findings from Jairak, Praneetpolgrang, & Mekhabunchakij (2009). This posed a sharp contradiction to earlier stance by other researchers based on results obtained from different settings.
The second construct that is postulated in the model as a direct predictor of BI, is effort expectancy. The construct explains to some extent the degree of ease associated with the use of a new system (Venkatesh et al., 2003), which will warrant new adjustment strategies by individuals and hence their emphasis on ease of use or otherwise. The constructors of the model proposed that the impact of this construct is strongly felt at the initial stages of LMS technological integration or innovation, where application of new skills is highly required. Studies such as Raman and Don (2013), Maina and Nzuki (2015) and Evans (2013) confirm the effect of effort expectancy on behavioural intention.
In addition to performance expectancy and effort expectancy, Venkatesh et al., (2003) further added that the social influence construct also has a linear relationship with behavioural intention. Venkatesh, Thong and Xu (2012) explained social influence as the extent to which “consumers or new users perceive that important others (eg. family, friends etc.) believe they should use a particular technology” (p.159). In the words of Taiwo and Downe (2012), “besides an effective and easy to use information system, end-users might not be obliged to use the system until they are motivated by important others (people) that can influence their attitude and behaviour. They opined that with the way peoples’ lives are moulded around role models … an encouragement by such important referent others to use the system can motivate potential users to accept an information system” (Taiwo, Downe & Mahmood, 2013 p.54). This is consistent with results from Pardamean and Susanto (2012) and Ambali and Bakar, (2014) and Šumak et al. (2010). Earlier studies by Macharia and Nyakwende (2010) indicate the important role that vice-chancellors as role models play in faculty member’s decisions to use LMS for e-learning. This was later supported
EURASIA J Math Sci and Tech Ed
6475
by Chen, Shang, Yu Hou, and Humaour (2012) who emphasized that if information system use is supported by leaders of institutions, it elicits a positive feeling from users to use it. Nevertheless, the effects of social influence on intentions were non-significant in earlier studies by Al-Gahtani, Hubona & Wang (2007) and later Nassuora (2012).
Modelled to directly influence use behaviour, the construct facilitating conditions, is explained as the “degree to which an individual believes an organizational and technical infrastructure exist to support use of the system” (Venkatesh et al., 2003 p.453). The introduction of new technologies arouses certain instabilities and anxieties. In order to leapfrog the mental instability and working frustrations, individuals expect that organizations will provide the needed support (both administrative and technological) to ease the use of the system. Thus, ICT infrastructure made available and reliable while institutional policies present opportunities and incentives for use of LMS technology influence the use by tutors. The attachment of importance to these conducive or otherwise environments produces a direct effect between facilitating conditions and usage and not behavioural intention (Venkatesh et el., 2003). Though theorized as not to have a direct relationship with behavioural intention, other authors like Mtebe and Raisamo (2014) opined that the initial perception of students on the availability of support services and resources to deliver mobile learning and vice versa, will to a greater extent influence their decision to adopt and subsequently use mobile devices for learning. Other authors have subsequently proven that prior knowledge of facilitating conditions trigger prior intentions to use as opposed to only actual usage.
For instance, Kihoro, Oyier, Kiula, Wafula and Ibukah, (2013) have justified that the awareness of the presence or otherwise of favourable conditions surrounding the use of a potential new information system, can at the initial state prompt a mental state of intentions to use prior to actual use. This is evidenced by the results they obtained in their studies where facilitating conditions predicted behavioural intentions. This is consistent with results obtained by Mtega, Bernard, Msungu, & Sanare (2012). Interestingly, all three studies were carried out in developing countries in Africa where resource for usage of technology is perceived as inadequate. Attuquayefio and Addo (2014) Oye et al., (2012) Ain et al., (2012) opine that Facilitating conditions thus becomes a crucial element of concern in LMS acceptance research especially in developing countries where conditions for technology use may not be at optimum levels. However, in Malaysia, Ambali and Bakar (2014), also found facilitating conditions to be the highest predictor of behavioural intention. Owing to the aforementioned premise on linear relationships in the UTAUT model, the study hypothesizes that:
H01: Performance Expectancy will predict Behavioural intention
H02: Effort Expectancy will predict Behavioural intention
H03: Social influence will predict Behavioural intention
H04: Facilitating conditions will predict Use behaviour
H05: Facilitating conditions will predict Behavioural intention (not original hypothesis in UTAUT)
Proposed Non-Linear Relationships within UTAUT Exogeneous Variables
The study resides heavily on the presence of non-linear relationships amongst the key UTAUT constructs in addition to their original linear relationships with Behavioural intention. The effects of Perceive Ease of Use (PEOU) (similar to Effort Expectancy in UTAUT) on Perceive Usefulness (PU) (similar to Performance Expectancy in UTAUT), has long been argued in TAM 1 (Davis 1989), TAM2 (Davis, Baggozzi & Warsaw, 1989) and relatively recently, TAM3 (Venkatesh & Bala, 2008). The proponents of this relationship opine that exposure to new technology breeds in a perception of how easy or otherwise it will be to the potential user. Thus, individuals at the least experienced stage of acceptance, tie a relationship between the effort to exert in using the technology and performance outcomes. Hence an initial significance tied between effort and performance. Since technology acceptance is mainly focused on new technologies, where user experience is at the minimum, it is important to consider this relationship. According to Venkatesh and Bala (2008), even after initial experience with new system
B. Bervell & I. N. Umar / Modelling Non-Linear Relationships of UTAUT
6476
usage, users will still value perceived ease of use in forming perceptions about its usefulness in later usage. Thus, the hypothesis:
H06: Effort expectancy will predict Performance Expectancy
The effect of Social Norm (SN) on Perceive Usefulness (PU) which are of a similitude to social influence (SI) and Performance Expectancy (PE) respectively in UTAUT, was an additional relationship proposed within the TAM 3 model developed by Venkatesh and Bala (2008). The positive or negative influence of important referent others on potential adopters’ intention decisions raises a consciousness on how important or useful a new technology may be. For new technology and less experienced users, the advice by important social acquaintances on whether to use the technology or not point to the performance expected to be derived from the usage of the said technology. In TAM2, Davis et al., (1989) theorized that subjective norm and image are the two determinants of perceived usefulness that represent the social influences processes (Venkatesh & Bala, 2008). The social influence in turn, positively influences perceived usefulness through processes of internalization (Venkatesh & Davis, 2000) and identification (Warsaw, 1980). Against this background, it can be hypothesized that:
H07: Social influence will predict Performance Expectancy
The presence or otherwise of facilities in support of the use of any technology is crucial to its acceptance. The degree to which an individual believes that organizational and technical resources exist to support the use of the system (Venkatesh et al., 2003) explains the Perception of External Control (PEC) construct which is akin to Facilitating Conditions (Venkatesh & Bala, 2008). Potential adopters of new systems may expect varying degrees of effort to be exerted anchored on the perception they have about the availability of various resources in place in support of its usage. Initial attitude towards usage of the system and its usefulness will largely depend on the resources at the disposal of the user towards usage. Availability of such resources eases the expectation of individual’s in terms of effort required to use the system and vice versa. Since the perception of ease of use is closely tied with usefulness (Davis et al., 1989), perceived resource availability will have an effect on performance expectancy.
Similarly, the effect of social influence on individuals could also be attributed to perceptions of conducive environment surrounding system use. If individuals are certain about the enabling environment for usage of a system, it is likely that the views of referent others may have a minimal or no effect as they will be tempted to try out for curiosity sake. The positive attitude adopted by way of the presence of resources to help in system usage, shifts them to the innovators category that are poised to experience new technology just for trying sake (Rogers, 2003). The other aspect to this effect is that, if important others realize that conditions are favourable in the usage of a new system, they are likely to encourage potential adopters. In view of this, this study hypothesizes that:
H08: Facilitating Conditions will predict Effort Expectancy
H09: Facilitating Conditions will predict Performance Expectancy
H10: Facilitating Conditions will predict Social Influence
Finally, Behavioural intention defines the extent to which potential users are willing to accept or adopt a particular technology for use practices (Venkatesh et al., 2003). Earlier authors such as Davis (1986), Davies, et al., (1989) agree that individuals form intentions prior to actual usage based on certain antecedents. When these determinants are satisfied, then individuals extend their motives now to actual use behaviour. Use behaviour on the other hand explains the extent and dimension to which a technological system is utilized in an organization after implementation. Since the key intentions of technological integration is to stimulate performance at optimum levels beyond what is achieved at the traditional mode of task accomplishment, the results can only be achieved at the post usage stage in order to compare results for the old and new paradigm (traditional vs. technology). Davies et al., (1989), Venkatesh et al., (2003), as well as Venkatesh and Bala (2008) confirmed that, the formation of intentions of individuals to accept a particular technology will eventually lead to usage practices. Thus, an eventual linear relationship exists between these two constructs. As such, this study hypothesizes:

EURASIA J Math Sci and Tech Ed
6477
H11: Behavioural intention will predict Use behaviour (original UTAUT hypothesis)
The research model based on the hypotheses formulated is depicted in Figure 2.
Figure 2. Combined Linear and Non-Linear Relationships-Based UTAUT Model
METHODOLOGY
Sampling, Sample and Data Collection
The study was mainly based on LMS acceptance by tutors in distance education settings in a higher education institution across the country. However, the target total population for the study was about 400 tutors Out of this number; a cluster sampling technique was used to select respondents from across the ten regions of the country to ensure a representative sample. Employing a survey method, 267 respondents were obtained for the study. Responses were obtained from these respondents based on a structured questionnaire. The questionnaire contained two broad sections. The first was for the demographic data (age, gender and face to face experience) and the subsequent based on other continuous variables of interest for the study (performance expectancy, effort expectancy, social influence, facilitating conditions, behavioural intention and use behaviour). The questionnaire was based on a five point Likert scale (1-strongly disagree to 5-strongly agree) measuring the key variables. Items were adapted from Venkatesh et al., (2003), Khechine et al., (2014), and Evans (2013).
DATA ANALYSIS
Respondents’ Profile
Respondents comprised 164 males and 103 females, representing 61.4% and 38.6% respectively with males having the higher percentage. Participants’ age groups ranged between (≤35) 67; (36-46) 102; (47-57) 64 and (≥58) 34. The age category (36-46) had the highest frequency recording 38.2%. Finally, tutors’ experience in terms of face to face experience was ascertained. Their years of experience raged from (≤5yrs) 98; (6-11yrs) 112 and (≥12yrs) 57. Most of the participants had face to face experience between 6-11yrs representing about 41.9% of the entire sample of 267.
Results for Model
The study utilized the SmartPLS 3.2.6 software developed by Ringle et al., (2016) to run the analysis for both the measurement and structural models. According to Hair et al., (2015), this two-stage approach is the standard for evaluating models and their relationships in Partial Least Squares (PLS). As criteria for reflective
B. Bervell & I. N. Umar / Modelling Non-Linear Relationships of UTAUT
6478
models, the study first evaluated the measurement model based on validity and reliability coefficients of Cronbach’s Alpha (CA), Composite Reliability (CR), Average Variance Estimates (AVE), Discriminant Validity and Heterotrait-Monotrait (HTMT). This was followed by examining the significance of the structural model based on, hypothesized relationship testing, Effect size (f2), Predictive relevance (Q2) and Importance –Performance Map Analysis (IPMA).
Assessment of Measurement Model
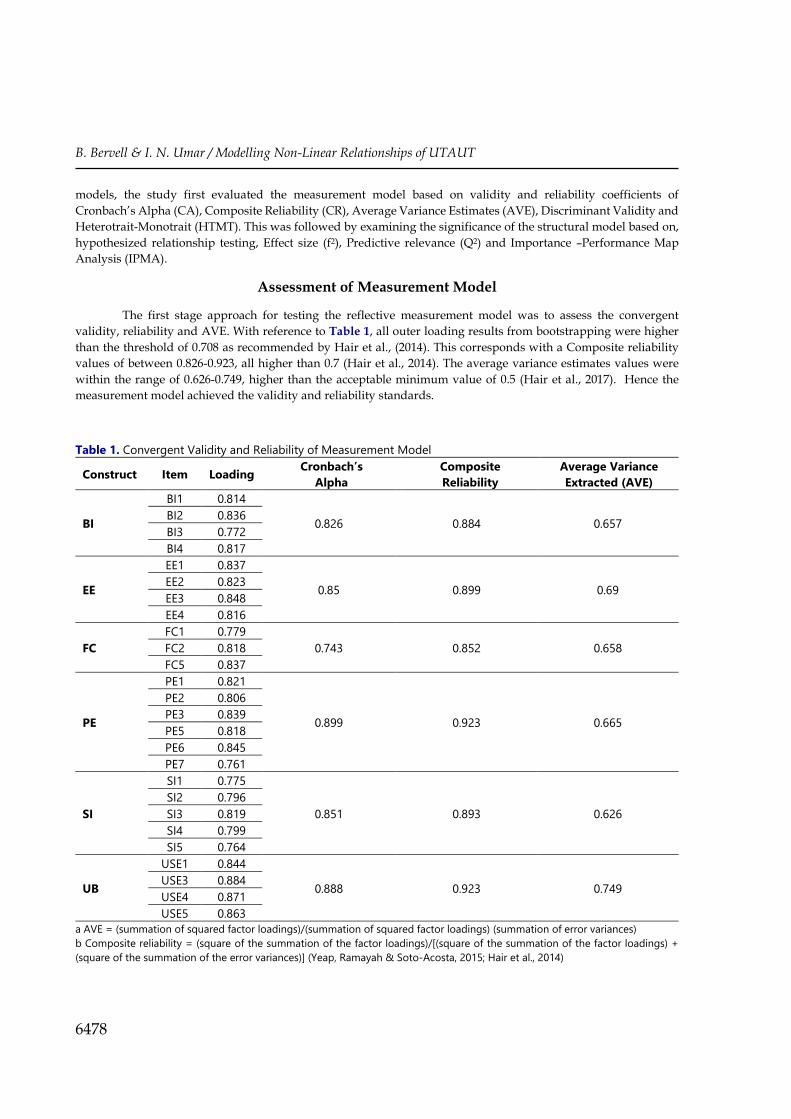
The first stage approach for testing the reflective measurement model was to assess the convergent validity, reliability and AVE. With reference to Table 1, all outer loading results from bootstrapping were higher than the threshold of 0.708 as recommended by Hair et al., (2014). This corresponds with a Composite reliability values of between 0.826-0.923, all higher than 0.7 (Hair et al., 2014). The average variance estimates values were within the range of 0.626-0.749, higher than the acceptable minimum value of 0.5 (Hair et al., 2017). Hence the measurement model achieved the validity and reliability standards.
Table 1. Convergent Validity and Reliability of Measurement Model
Construct Item Loading Cronbach’s Alpha
Composite Reliability
Average Variance Extracted (AVE)
BI
BI1 0.814
0.826 0.884 0.657 BI2 0.836 BI3 0.772 BI4 0.817
EE
EE1 0.837
0.85 0.899 0.69 EE2 0.823 EE3 0.848 EE4 0.816
FC FC1 0.779
0.743 0.852 0.658 FC2 0.818 FC5 0.837
PE
PE1 0.821
0.899 0.923 0.665
PE2 0.806 PE3 0.839 PE5 0.818 PE6 0.845 PE7 0.761
SI
SI1 0.775
0.851 0.893 0.626 SI2 0.796 SI3 0.819 SI4 0.799 SI5 0.764
UB
USE1 0.844
0.888 0.923 0.749 USE3 0.884 USE4 0.871 USE5 0.863
a AVE = (summation of squared factor loadings)/(summation of squared factor loadings) (summation of error variances) b Composite reliability = (square of the summation of the factor loadings)/[(square of the summation of the factor loadings) + (square of the summation of the error variances)] (Yeap, Ramayah & Soto-Acosta, 2015; Hair et al., 2014)
EURASIA J Math Sci and Tech Ed
6479
Discriminant Validity
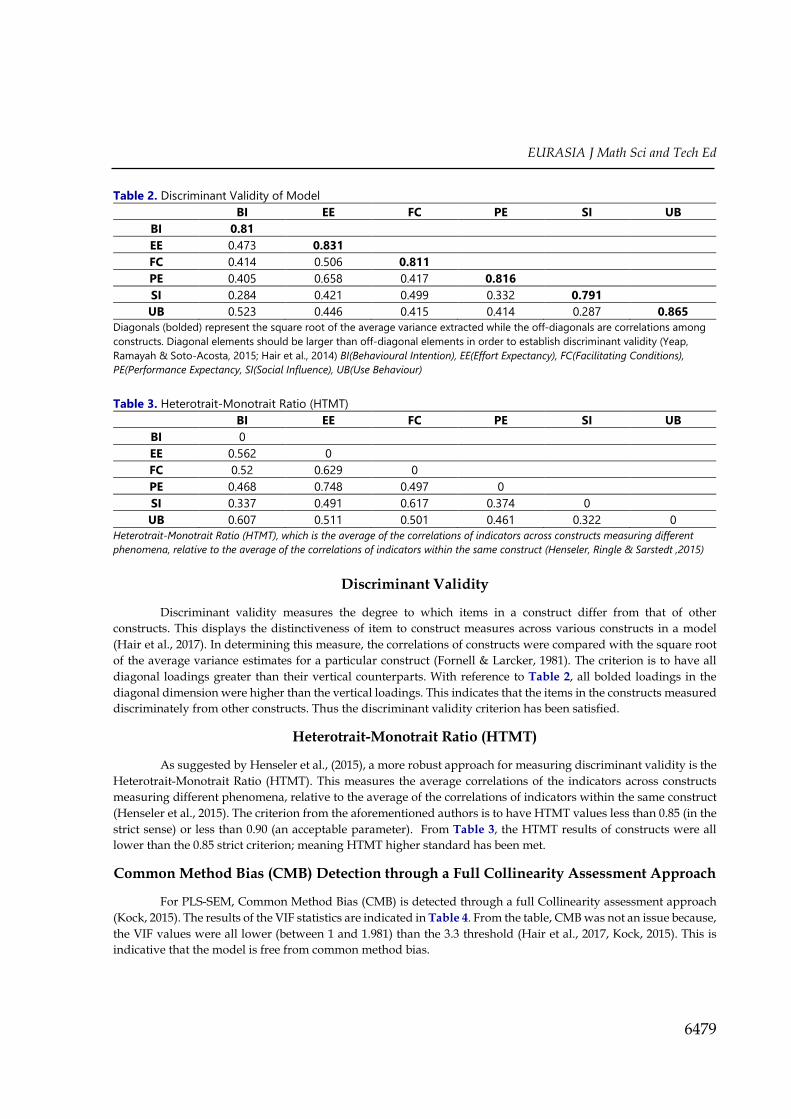
Discriminant validity measures the degree to which items in a construct differ from that of other constructs. This displays the distinctiveness of item to construct measures across various constructs in a model (Hair et al., 2017). In determining this measure, the correlations of constructs were compared with the square root of the average variance estimates for a particular construct (Fornell & Larcker, 1981). The criterion is to have all diagonal loadings greater than their vertical counterparts. With reference to Table 2, all bolded loadings in the diagonal dimension were higher than the vertical loadings. This indicates that the items in the constructs measured discriminately from other constructs. Thus the discriminant validity criterion has been satisfied.
Heterotrait-Monotrait Ratio (HTMT)
As suggested by Henseler et al., (2015), a more robust approach for measuring discriminant validity is the Heterotrait-Monotrait Ratio (HTMT). This measures the average correlations of the indicators across constructs measuring different phenomena, relative to the average of the correlations of indicators within the same construct (Henseler et al., 2015). The criterion from the aforementioned authors is to have HTMT values less than 0.85 (in the strict sense) or less than 0.90 (an acceptable parameter). From Table 3, the HTMT results of constructs were all lower than the 0.85 strict criterion; meaning HTMT higher standard has been met.
Common Method Bias (CMB) Detection through a Full Collinearity Assessment Approach
For PLS-SEM, Common Method Bias (CMB) is detected through a full Collinearity assessment approach (Kock, 2015). The results of the VIF statistics are indicated in Table 4. From the table, CMB was not an issue because, the VIF values were all lower (between 1 and 1.981) than the 3.3 threshold (Hair et al., 2017, Kock, 2015). This is indicative that the model is free from common method bias.
Table 2. Discriminant Validity of Model BI EE FC PE SI UB
BI 0.81
EE 0.473 0.831
FC 0.414 0.506 0.811
PE 0.405 0.658 0.417 0.816
SI 0.284 0.421 0.499 0.332 0.791
UB 0.523 0.446 0.415 0.414 0.287 0.865 Diagonals (bolded) represent the square root of the average variance extracted while the off-diagonals are correlations among constructs. Diagonal elements should be larger than off-diagonal elements in order to establish discriminant validity (Yeap, Ramayah & Soto-Acosta, 2015; Hair et al., 2014) BI(Behavioural Intention), EE(Effort Expectancy), FC(Facilitating Conditions), PE(Performance Expectancy, SI(Social Influence), UB(Use Behaviour)
Table 3. Heterotrait-Monotrait Ratio (HTMT) BI EE FC PE SI UB
BI 0
EE 0.562 0
FC 0.52 0.629 0
PE 0.468 0.748 0.497 0
SI 0.337 0.491 0.617 0.374 0
UB 0.607 0.511 0.501 0.461 0.322 0 Heterotrait-Monotrait Ratio (HTMT), which is the average of the correlations of indicators across constructs measuring different phenomena, relative to the average of the correlations of indicators within the same construct (Henseler, Ringle & Sarstedt ,2015)
B. Bervell & I. N. Umar / Modelling Non-Linear Relationships of UTAUT
6480
Results of the Structural Model
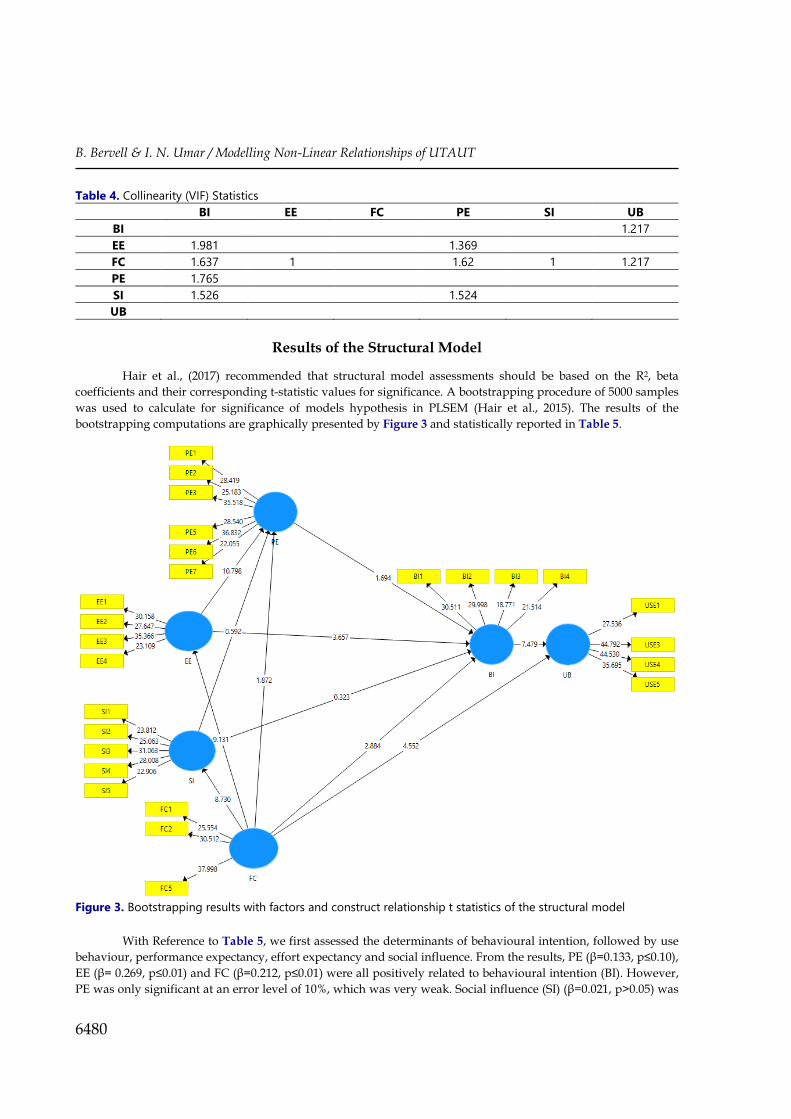
Hair et al., (2017) recommended that structural model assessments should be based on the R2, beta coefficients and their corresponding t-statistic values for significance. A bootstrapping procedure of 5000 samples was used to calculate for significance of models hypothesis in PLSEM (Hair et al., 2015). The results of the bootstrapping computations are graphically presented by Figure 3 and statistically reported in Table 5.
Figure 3. Bootstrapping results with factors and construct relationship t statistics of the structural model
With Reference to Table 5, we first assessed the determinants of behavioural intention, followed by use behaviour, performance expectancy, effort expectancy and social influence. From the results, PE (β=0.133, p≤0.10), EE (β= 0.269, p≤0.01) and FC (β=0.212, p≤0.01) were all positively related to behavioural intention (BI). However, PE was only significant at an error level of 10%, which was very weak. Social influence (SI) (β=0.021, p>0.05) was
Table 4. Collinearity (VIF) Statistics BI EE FC PE SI UB
BI 1.217 EE 1.981 1.369 FC 1.637 1 1.62 1 1.217 PE 1.765 SI 1.526 1.524 UB

EURASIA J Math Sci and Tech Ed
6481
not significant in determining BI. Interestingly, Effort expectancy was the strongest predictor of BI with a relatively higher beta value, followed by facilitating conditions.
In respect of Use behaviour (UB), the constructs BI (β=0.424, p≤0.01) and FC (β=0.24, p≤0.01) were the main predictors with BI as the stronger.
The construct PE was significantly predicted by EE (β=0.593, p≤0.01) with FC (β=0.10, p≤0.10), having the weaker relationship. SI (β=0.032, p>0.05) however, did not indicate any significant relationship with PE.
Facilitating conditions FC (β=0.499, p≤0.01), was a strong antecedent to Social influence and Effort expectancy at FC (β=0.506, p≤0.01). Thus, from the Table 5, hypotheses H1, H2, H4, H5, H6, H8, H9, H10 and H11 were all supported with the exception of H3 and H7.
The predictive significance of the construct to construct relationship was further assessed for their effect sizes using the f2 statistics as suggested by Hair et al., (2017). This was important because the p value can only provide information on the presence or otherwise of an effect but without any indication of the actual size of the effect (Sullivan & Feinn, 2012). Hair et al., (2014) suggest an effect size of 0.02, 0.15 and 0.35 to represent small, medium and larger effects respectively (Cohen, 1988). However, Hair et al., (2017) cite Kenny (2015) who recommended the effect sizes of 0.005, 0.01 and 0.025 to represent small, medium and larger effect sizes respectively. With reference to the f2 statistics column in Table 5, the effect sizes ranged from 0.012, 0.014 representing medium effect sizes; 0.052, 0.07, 0.043; 0.221, 0.332, 0.344 and 0.456 having relatively higher effect sizes.
Furthermore, the model was examined on the R2 values and the predictive relevance. Table 6 captures the results. Most importantly, the overall model performance for variance in BI was 35.1%. This was mainly due to the fact that only two exogeneous variables (EE and FC) predicted strongly BI, without moderators in the model. Variance in UB was 32% by a single predictor BI. PE was predicted by EE and FC at a variance of 44% with SI and EE being at 25% each with a single predictor each. Of further importance to the coefficient of determination is the predictive relevance. This was assessed by a blindfolding procedure which is recommended only for endogeneous constructs of reflective models as suggested by Hair et al., (2017). As a rule of thumb, the Q2 value of more than 0 is required to indicate model predictive value or otherwise (Hair et al., 2014). From Table 6, all figures were larger than 0 and ranged between 0.22 to 0.343, indicating medium to high predictive relevance for the endogeneous variables at the recommended threshold of 0.02, 0.15 and 0.35, representing small, medium and high predictive relevance respectively (Hair et al., 2014).
Table 5. Results of the Structural Analysis and Hypotheses Testing
Hypothesis Relationship Std. Beta
Std. Error t-value Decision f2 CI
LL UL H1 PE -> BI 0.133 0.078 1.694* S 0.014 0.03 0.19 H2 EE -> BI 0.269 0.074 3.657*** S 0.052 0.05 0.30 H3 SI -> BI 0.021 0.064 0.323 NS 0 -0.02 0.09 H4 FC -> UB 0.24 0.052 4.552*** S 0.07 0.08 0.34 H5 FC -> BI 0.212 0.075 2.884*** S 0.043 0.07 0.33 H6 EE -> PE 0.593 0.055 10.798*** S 0.456 0.41 0.62 H7 SI -> PE 0.032 0.053 0.592 NS 0.01 -0.13 0.11 H8 FC -> EE 0.506 0.055 9.131*** S 0.344 0.40 0.60 H9 FC -> PE 0.101 0.053 1.872* S 0.012 0.04 0.21 H10 FC -> SI 0.499 0.058 8.730*** S 0.332 0.29 0.57 H11 BI -> UB 0.424 0.056 7.479*** S 0.221 0.10 0.35
P≤0.01***; p≤0.05**; p≤0.10*; f2 denotes the effect size; S=Supported; NS=Not Supported CI=Confidence Interval
B. Bervell & I. N. Umar / Modelling Non-Linear Relationships of UTAUT
6482
Importance Performance Map Analysis (IPMA)
The Importance Performance Map Analysis (IPMA) provides further emphasis on the PLS estimates of the structural model relationships providing additional clues to the performance and relevance of each latent variable in the model (Hair et al., 2014, Yeap et al., 2015). According to Ringle and Sarstedt (2016), total effects represent the sum of direct and indirect effects and so the IPMA draws on unstandardized effects to facilitate a ceteris paribus interpretation of predecessor constructs’ impact on the target construct. This means that an increase in a certain predecessor construct’s performance would increase the target construct’s performance by the size of its unstandardized total effect (Ringle & Sarstedt, 2016). To ascertain the importance and relevance of the relationships in the model, the PLS IPMA analysis was calculated separately for the constructs BI and PE as endogeneous variables. The results are shown in Table 7 and 8 respectively.
Table 7. Performance Index Values and Total Effects Construct Total Effect (Importance) Index Values (Performance)
EE 0.31 68.88 FC 0.41 56.53 PE 0.14 72.98 SI 0.02 55.61
Table 8. Performance Index Values and Total Effects
Construct Total Effects (Importance) Index Values (Performance) EE 0.59 68.88 FC 0.41 56.53 SI 0.04 55.61
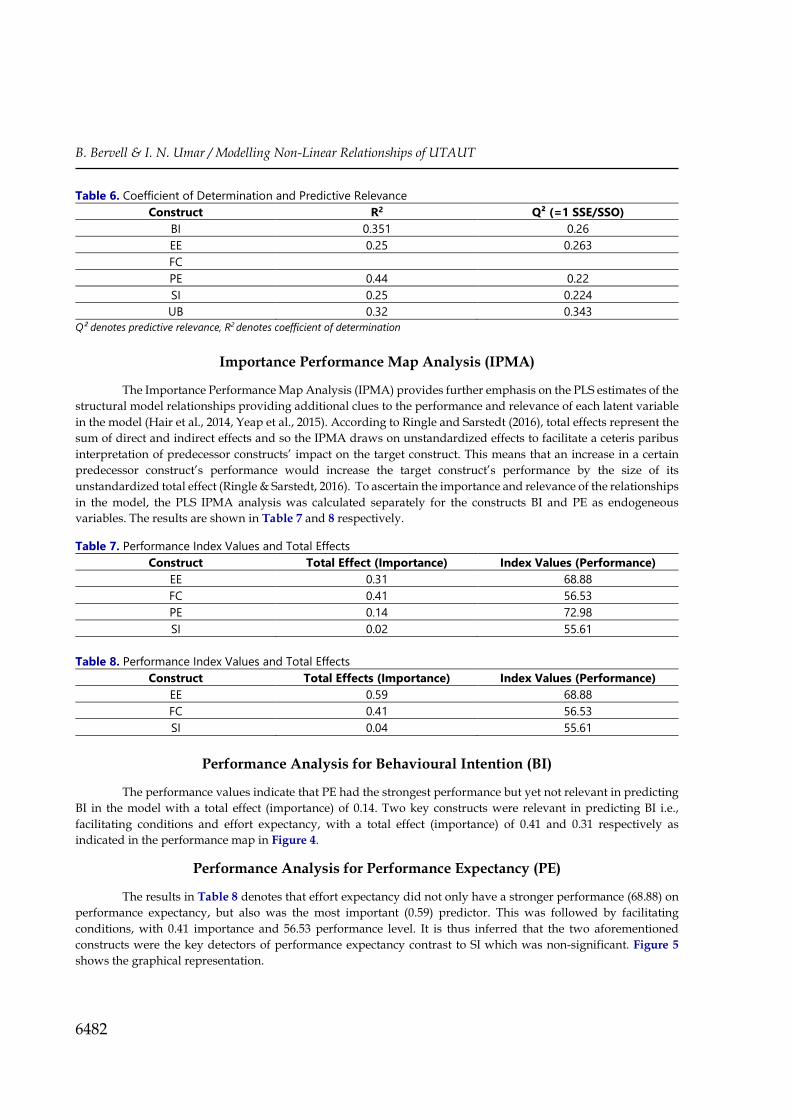
Performance Analysis for Behavioural Intention (BI)
The performance values indicate that PE had the strongest performance but yet not relevant in predicting BI in the model with a total effect (importance) of 0.14. Two key constructs were relevant in predicting BI i.e., facilitating conditions and effort expectancy, with a total effect (importance) of 0.41 and 0.31 respectively as indicated in the performance map in Figure 4.
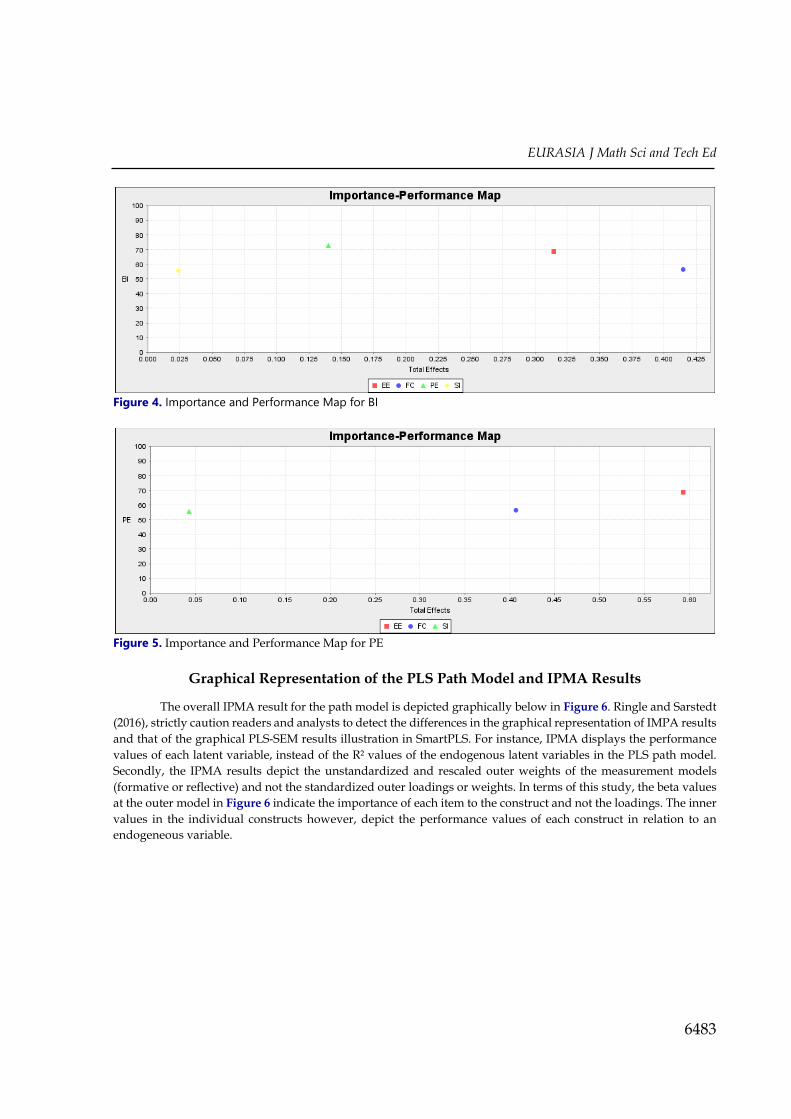
Performance Analysis for Performance Expectancy (PE)
The results in Table 8 denotes that effort expectancy did not only have a stronger performance (68.88) on performance expectancy, but also was the most important (0.59) predictor. This was followed by facilitating conditions, with 0.41 importance and 56.53 performance level. It is thus inferred that the two aforementioned constructs were the key detectors of performance expectancy contrast to SI which was non-significant. Figure 5 shows the graphical representation.
Table 6. Coefficient of Determination and Predictive Relevance Construct R2 Q² (=1 SSE/SSO)
BI 0.351 0.26 EE 0.25 0.263 FC
PE 0.44 0.22 SI 0.25 0.224 UB 0.32 0.343
Q² denotes predictive relevance, R2 denotes coefficient of determination
EURASIA J Math Sci and Tech Ed
6483
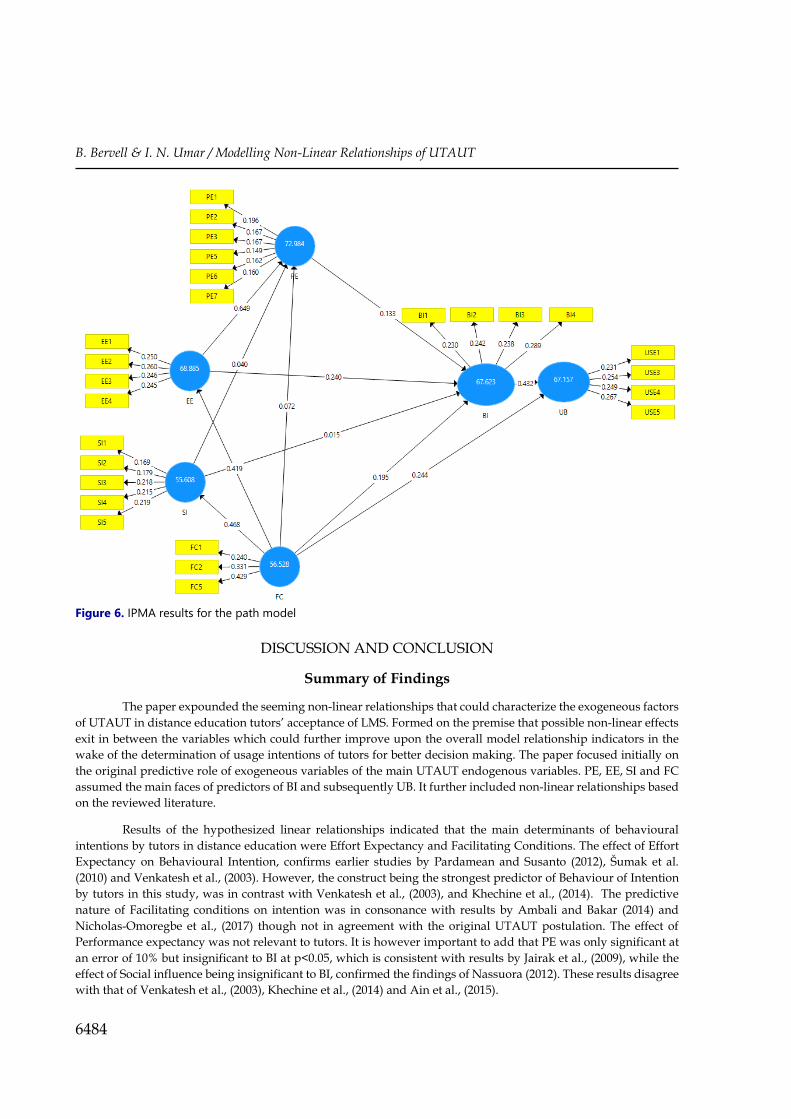
Graphical Representation of the PLS Path Model and IPMA Results
The overall IPMA result for the path model is depicted graphically below in Figure 6. Ringle and Sarstedt (2016), strictly caution readers and analysts to detect the differences in the graphical representation of IMPA results and that of the graphical PLS-SEM results illustration in SmartPLS. For instance, IPMA displays the performance values of each latent variable, instead of the R² values of the endogenous latent variables in the PLS path model. Secondly, the IPMA results depict the unstandardized and rescaled outer weights of the measurement models (formative or reflective) and not the standardized outer loadings or weights. In terms of this study, the beta values at the outer model in Figure 6 indicate the importance of each item to the construct and not the loadings. The inner values in the individual constructs however, depict the performance values of each construct in relation to an endogeneous variable.
Figure 4. Importance and Performance Map for BI
Figure 5. Importance and Performance Map for PE
B. Bervell & I. N. Umar / Modelling Non-Linear Relationships of UTAUT
6484
DISCUSSION AND CONCLUSION
Summary of Findings
The paper expounded the seeming non-linear relationships that could characterize the exogeneous factors of UTAUT in distance education tutors’ acceptance of LMS. Formed on the premise that possible non-linear effects exit in between the variables which could further improve upon the overall model relationship indicators in the wake of the determination of usage intentions of tutors for better decision making. The paper focused initially on the original predictive role of exogeneous variables of the main UTAUT endogenous variables. PE, EE, SI and FC assumed the main faces of predictors of BI and subsequently UB. It further included non-linear relationships based on the reviewed literature.
Results of the hypothesized linear relationships indicated that the main determinants of behavioural intentions by tutors in distance education were Effort Expectancy and Facilitating Conditions. The effect of Effort Expectancy on Behavioural Intention, confirms earlier studies by Pardamean and Susanto (2012), Šumak et al. (2010) and Venkatesh et al., (2003). However, the construct being the strongest predictor of Behaviour of Intention by tutors in this study, was in contrast with Venkatesh et al., (2003), and Khechine et al., (2014). The predictive nature of Facilitating conditions on intention was in consonance with results by Ambali and Bakar (2014) and Nicholas-Omoregbe et al., (2017) though not in agreement with the original UTAUT postulation. The effect of Performance expectancy was not relevant to tutors. It is however important to add that PE was only significant at an error of 10% but insignificant to BI at p<0.05, which is consistent with results by Jairak et al., (2009), while the effect of Social influence being insignificant to BI, confirmed the findings of Nassuora (2012). These results disagree with that of Venkatesh et al., (2003), Khechine et al., (2014) and Ain et al., (2015).
Figure 6. IPMA results for the path model
EURASIA J Math Sci and Tech Ed
6485
The findings from the original UTAUT linear relationships inherent in this study define a direction that, acceptance of LMS by distance education tutors is motivated by their perception of the presence of facilitating conditions needed to enhance easiness to usage, as efforts to be exerted (Effort expectancy) was prime to them. The views of others and usefulness of the system were not of interest to them. The non-impact of Social Influence on them, was partly because tutors in this study were all mature in terms of age and outlook, hence were independent thinkers and so influence of peers played very little role in their intention formations. In terms of LMS usefulness, they were yet to have the full impact after the pilot stage of the LMS technology, having gone the traditional way for over a decade.
Most importantly, the non-predictive nature of performance expectancy and social influence in this study is better explained by the non-linear relationships within the model. The results from the non-linear relationships indicated that, performance expectancy was determined by effort expectancy. This result is in support with Davis (1986) and Venkatesh and Bala (2008). For instance, Davis (1986) opined that when individuals are exposed to new technologies, they need to internalize the novel procedures by way of assimilation and accommodation. The ease with which they form this adjustment is based on how liberal or otherwise the use of the system is, which is eventually tied to how useful the system will be. Maina and Nzuki (2015) and Raman and Don (2013), suggest that it is in the ability to use, that individuals find outcomes, usefulness, and importance. This resonates the age long debate between Clarke, (1994) and Kozma, (1994) on the effect of technology in learning. It is not the technology per se, but how it can be used to achieve the intended goal in instruction or job outcomes. For Venkatesh and Bala, (2008), this perception may persist even after initial experience with the system usage. Invariably, tutors in this study depended on the amount of effort they expect to exert before eventually judging the usefulness of LMS.
Furthermore, the non-significance of SI in determining usage intentions is explained by the non-linear relationship result where Facilitating Conditions strongly predicted Social Influence. This was a new and intriguing finding. The perception of presence and availability of support systems and resources have a positive effect on how referent others may influence tutors to use LMS. The positive relationship suggests that when there is a positive outlook towards resources and support needed to use LMS, there will be a corresponding positive influence from peers to form intentions for LMS acceptance. The reverse of this situation could also be true. Thus, the effects of influence imposed on tutors by their peers depend to a larger extent environmental conduciveness for usage of LMS for teaching and learning.
Another important result from the non-linear relationships model was the direct positive effect between Facilitating Conditions and Effort Expectancy. Facilitating conditions was also a strong predictor of the extent to which tutors perceive the easiness of LMS usage. This is supported by Lee (2008), who stressed that the intra and extra-organizational support such as computing support, training, equipment availability and accessibility, go a long way to provide the needed help to reduce the task burden on individuals toward system usage. Availability of such incentives was seen as important to tutors in this study in forming their expectations of effort towards LMS use for blended instruction. Tutors believed that if expected incentives (training, technical support, motivation etc.) are in place, then there is the likelihood that needed effort to use LMS will be at the barest minimum.
Additionally, the positive effect between Facilitating Conditions and Behavioural Intention and Use Behaviour raises a concern on how tutors tend to associate the availability of perceived support to intention to use and actual use. This is supported by Kihoro et al., (2013), Mtega et al., (2012) and Ambali and Bakar (2014) who suggested that self-awareness of favourable environment surrounding the use of new technology is able to psych up novel users to form positive usage intentions which eventually results in actual system use. Thus, tutors heavily rely on necessary conditions for usage to determine intentions before usage. There is the need to pre-inform tutors on the necessary motivational incentives and support surrounding the use of LMS prior to actual practice to form their intentions which they will later assess in use behaviour experiences to determine how well they will employ LMS.
The original postulations by Venkatesh et al., (2003) with regard to FC and BI as antecedents of UB, were in consistence with the results in this study. However, in this study, BI proved a stronger effect on UB than FC
B. Bervell & I. N. Umar / Modelling Non-Linear Relationships of UTAUT
6486
though both were very relevant. In effect, tutors attached much importance to their overall BI in determining their actual usage of LMS.
It is worth noting that two non-linear relationships hypothesized in this study i.e., FC and SI were not significant antecedents of PE. Distance education tutors did not believe that the presence or other wise of favourable conditions towards system use and that of social influence were indicators that LMS was useful for their instructional purposes. This result is consistent with Davis et al., (1989) and Venkatesh and Bala (2008) in their TAM postulations. To tutors, Facilitating Conditions did not necessarily mean that LMS usage outcomes will be useful, it was to only help them judge how much effort was required to use it. Neither did social influence warrant a sure proof that LMS was useful. It will take some time for them to accentuate the usefulness of LMS to their pedagogical processes after considerable use overtime and the sharing of positive outcomes.
Implications for Theory
The study proved that non-linear relationships exist between and among UTAUT exogeneous constructs. This was necessary to provide better insights into the behaviour of the constructs (especially linear relationships) in the model. The findings depicted that intention to accept LMS by tutors in distance education was a product of two key factors: Effort Expectancy and Facilitating conditions. Of most importance is the intricating relationships that existed among PE, EE, FC and SI. Of particular interest is the new relationship found between FC and SI.
This study sets precedence for other studies to model non-linear relationships in UTAUT in order to better explain their effects. The analysis from the study was further extended to include the predictive relevance of the non-linear relationships and their effect sizes as well as their performance and importance index analysis, all of which were excluded in earlier studies.
The findings from the study also implies that different societies and cultural contexts produce different results of variable behaviour, thus, it is academically not apt to generalize results of variable relationships across cross-cultural boundaries. Hence specificity of context is often the modest way to approach study findings.
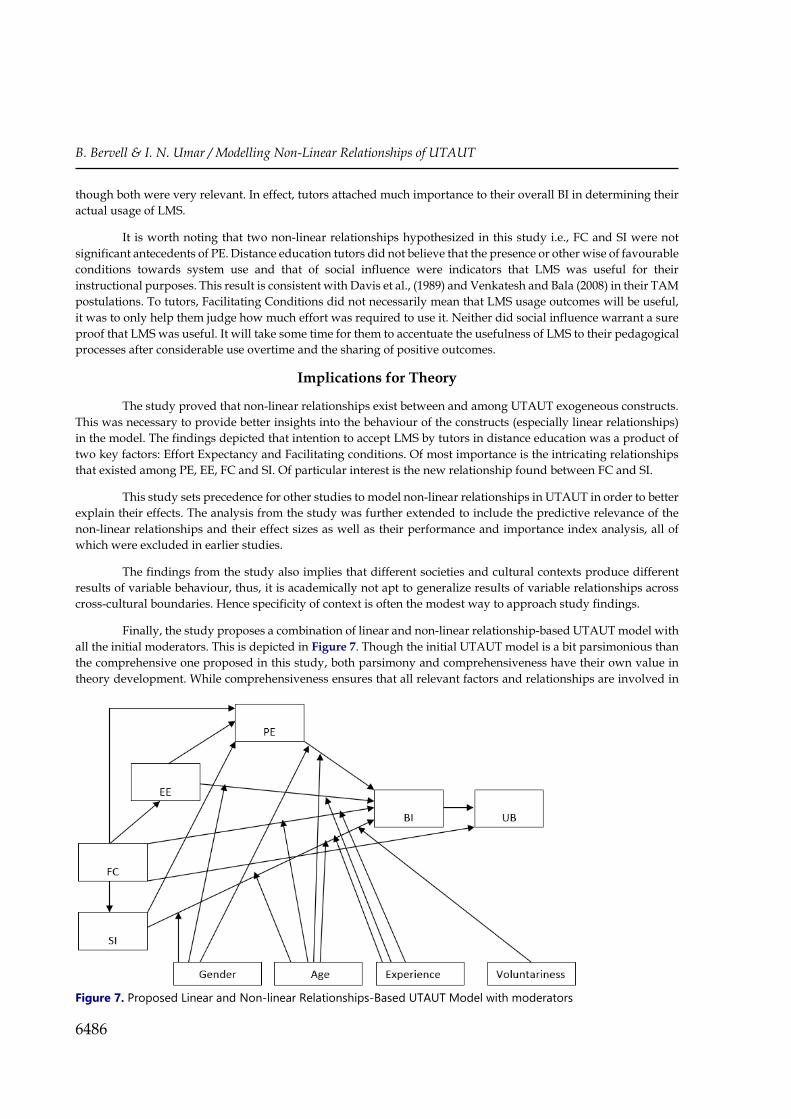
Finally, the study proposes a combination of linear and non-linear relationship-based UTAUT model with all the initial moderators. This is depicted in Figure 7. Though the initial UTAUT model is a bit parsimonious than the comprehensive one proposed in this study, both parsimony and comprehensiveness have their own value in theory development. While comprehensiveness ensures that all relevant factors and relationships are involved in
Figure 7. Proposed Linear and Non-linear Relationships-Based UTAUT Model with moderators
EURASIA J Math Sci and Tech Ed
6487
a theory (Whetten, 1989, Bacharach, 1989, Venkatesh & Bala, 2008) to better understand the phenomenon under study without missing out important details or nitigrities, parsimony dictates whether some factors should be deleted because they add very little or no value to understanding of phenomenon. In effect, parsimony is only achieved after comprehensiveness based on empirical testing.
Implications for Practice
The outcome of the study pointed out most of the hypothesized relationships to be significant. Irrespective of this, some were highlighted by the Importance Performance Map Analysis (IPMA) as crucial in the formation of intentions of use and actual use of LMS by distance education tutors. The prioritization of these factors will enable authorities at the college of distance education and other decision–makers to focus on certain determinants that need to be well managed or improved because they both have explanatory effects on other important factors and those that have low performance.
Tutors have already shown some positive signs of intention to accept LMS; however, the compelling elements were facilitating conditions and effort expectancy. Accordingly, authorities and decision makers must now focus on how to improve upon enabling conditions since they significantly determine how easy tutors envisage usage of LMS, intention behaviour, social influence and use behaviour. In light of this, they should improve upon technical and administrative support initiatives that will enable tutors see the easiness in using LMS and its usefulness to influence them and their peers to have the intentions to use and subsequently use LMS for pedagogical purposes. Motivation packages such as promotion and increase in allowances should be tied to LMS usage.
Additionally, authorities and decision makers should strive to make the system usage as easy as possible for tutors. This can be achieved through the provision of user manuals, more interactive tutorials, frequent training opportunities and forum for discussion for tutors to share experiences and frustrations, for immediate provision of antidotes. Standby technical support teams should be always ready and willing to pick up calls or reply messages that warrant help from tutors with regards to LMS usage. This is because tutors’ expectation of effort required to usage is attached to performance expectations and usage intentions.
Limitations
The study was conducted without moderators and so other studies can replicate it by adding the moderators to the non-linear relationships to compare the original UTAUT model (with moderators) in terms of the coefficient of determination (R2) and predictive relevance (Q2).
Additionally, only two exogeneous variables significantly predicted behavioural intentions at (p≤0.01*** and p≤0.05**) thereby preventing a high level of total variance explained by the model.
ACKNOWLEDGEMENT
We acknowledge the support from all staff, coordinators and course tutors of the College of Distance Education, University of Cape Coast, Ghana.
REFERENCES
Ain, N., Kaur, K., & Waheed, M. (2015). The influence of learning value on learning management system use: An extension of UTAUT2. Information Development.
Al-Gahtani, S. S., Hubona, G. S., & Wang, J. (2007). Information technology (IT) in Saudi Arabia: Culture and the acceptance and use of IT. Information & Management, 44, 681–691.
Ambali, A., R., & Bakar, A. N. (2014). ICT adoption and application in the Malaysian public sector advances in public policy and administration: IGI Global Publishers, USA: Hershey, Pennsylvania.

B. Bervell & I. N. Umar / Modelling Non-Linear Relationships of UTAUT
6488
Anderson, T., & Dron, J. (2010). Three generations of distance education pedagogy. The International Review of Research in Open and Distributed Learning, 12(3), 80-97.
Attuquayefio, S. N., & Addo, H. (2014). Using the UTAUT model to analyze students’ ICT adoption. International Journal of Education and Development using Information and Communication Technology, 10(3), 75.
Bacharach, S. B. (1989). Organizational theories: Some criteria for evaluation. Academy of Management Review, 14, 496–515.
Chen, Y.-C., Shang, R.-A., Yu Hou, A. C., & Humaour, K. C. (2012). Organizational alienation, organizational support, and behavioural intention to adopt information systems. PACIS 2012 Proceedings. Association for Information Systems (AIS) Electronic Library.
Clark, R. E. (1994). Media will never influence learning. Educational Technology Research & Development, 42(2), 21-29. Davis, F. D. (1986). Technology acceptance models for empirically testing new end-user information systems: Theory and
results. Cambridge: MIT Sloan School of Management. Davis, F. D. (1989). Perceived usefulness, perceived ease of use, and user acceptance of information technology.
MIS Quarterly, 13, 319–340. Davis, F. D., Bagozzi, R. P., & Warshaw, P. R. (1989). User acceptance of computer technology: A comparison of
two theoretical models. Management Science, 35, 982–1002. Evans, N. D. (2013). Predicting user acceptance of electronic learning at the University of Zululand. Unpublished Thesis
University of Zululand, South Africa. Fornell, C., & Larcker, D. F. (1981). Evaluating structural equation models with unobservable variables and
measurement error. Journal of Marketing Research, 18(1), 39–50. Hair, J. F., Hult, G. T. M., Ringle, C. M., & Sarstedt, M. (2014). A Primer on Partial Least Squares Structural Equation
Modeling. 1st Edition. Thousand Oaks: Sage. Hair, J. F., Hult, G. T. M., Ringle, C. M., & Sarstedt, M. (2017). A Primer on Partial Least Squares Structural Equation
Modeling. 2nd Edition. Thousand Oaks: Sage. Henseler, J., Ringle, C. M., & Sarstedt, M. (2015). A new criterion for assessing discriminant validity in variance-
based structural equation modeling. J. of the Acad. Mark. Sci. 43, 115–135. Jairak, K., Praneetpolgrang, P., & Mekhabunchakij, K. (2009). An acceptance of mobile learning for higher
education students in Thailand. Special Issue of the International Journal of the Computer, the Internet and Management, 17(SP3), 361–368.
Khechine, H., Lakhal, S., Pascot, D., & Bytha, A (2014). UTAUT model for blended learning: the role of gender and age in the intention to use webinars. Interdisciplinary Journal of E-Learning and Learning Objects, 10, 33-52.
Kihoro, J. M., Oyier, P. A., Kiula, B. M., Wafula, J. M., & Ibukah, R. W. (2013). E-Learning ecosystem for mobility and effective learning: A Case of JKUAT IT students. In IST-Africa 2013 Conference, 1–9.
Kline, R. B. (2015). Principles and Practice of Structural Equation Modelling Methodology in the Social Sciences 4th ed. Guilford Publication: NY.
Kock, N. (2015). Common method bias in PLS-SEM: A full collinearity assessment approach. International Journal of e-Collaboration, 11(4), 1-10.
Kock, N. (2016). Advantages of non-linear over segmentation analyses in path models. International Journal of e-Collaboration, 12(4), 1-6.
Kozma, R. B. (1994). Will media influence learning? Reframing the debate. Educational Technology Research & Development, 42(2), 7-19.
Lee, S. M., Kim, K., Paulson, P., & Park, H. (2008). Developing a socio-technical framework for business-IT alignment. Industrial Management & Data Systems, 108(9), 1167-81.
Macharia, J., & Nyakwende, E. (2010). Vice-chancellors influence on academic staff intentions to use Learning Management System (LMS) for teaching and learning. The Journal of Language, Technology & Entrepreneurship in Africa, 2(1), 220-230.
Maina, M. K., & Nsuki, D. M. (2015). Adoption determinants of E-learning Management System in institutions of higher learning in Kenya: A Case of selected universities in Nairobi metropolitan. International Journal of Business and Social Science, 6(2).
EURASIA J Math Sci and Tech Ed
6489
Mtebe, J. S., & Raisamo, R. (2014) Investigating students’ behavioural intention to adopt and use mobile learning in higher education in East Africa. International Journal of Education and Development using Information and Communication Technology (IJEDICT), 10(3), 4-20.
Mtega, W. P., Bernard, R., Msungu, A. C., & Sanare, R. (2012). Using mobile phones for teaching and learning purposes in higher learning institutions: The case of Sokoine University of Agriculture in Tanzania. In 5th UbuntuNet Alliance annual conference, 118–129. Retrieved from http://www.ubuntunet.net/sites/ ubuntunet.net/files/mtegaw.pdf
Nassuora, A. B. (2012). Student acceptance of mobile learning for higher education. American Academic & Scholarly Research Journal, 4, 0–5.
Nicholas-Omoregbe, O., S., Azeta, A., A., Chiazor, I., A., & Omoregbe, N. (2017). Predicting the adoption of E-Learning Management System: A case of selected private Universities in Nigeria. Turkish Online Journal of Distance Education-TOJDE, 18(2).
Oye, N. D., Iahad, A. N., & Rahim, A.B. N. (2012). Acceptance and usage of ICT by university academicians using UTAUT Model: A case study of University of Port Harcourt, Nigeria. Journal of Emerging Trends in Computing and Information Sciences, 3(1), 2079-8407.
Pardamean, B., & Susanto, M. (2012). User acceptance toward blog technology using the UTAUT model. International Journal of Mathematics and Computers in Simulation, 1(6), 203-212.
Percy, T., & Van Belle, J. P. (2012, September). Exploring the barriers and enablers to the use of open educational resources by university academics in Africa. In IFIP International Conference on Open Source Systems, 112-128. Springer Berlin Heidelberg.
Raman, A., & Don, Y. (2013). Preservice teachers’ acceptance of Learning Management Software: An application of the UTAUT2 model. International Education Studies, 6(7).
Ringle, C. M., & Sarstedt, M. (2016). Gain more insight from your PLS-SEM results: The importance-performance map analysis”. Industrial Management & Data Systems, 116(9), 1865-1886.
Roberts, W. (1986). Nonlinear models of development: An example from the socialization of competence. Child Development, 57, 1166-1178.
Rogers, E. M. (2003). Diffusion of innovations. New York: Free Press. Soto-Acosta, P., Popa, S., & Palacios-Marqués, D. (2015). E-business, organizational innovation and firm
performance in manufacturing SMEs: an empirical study in Spain. Technological and Economic Development of Economy. DOI:10.3846/20294913.2015.1074126
Sullivan, G. M., & Feinn, R. (2012). Using effect size - or why the p value is not enough. Journal of Graduate Medical Education, 4(3), 279–282.
Šumak, B., Polančič, G., & Heričko, M. (2010). An empirical study of virtual learning environment adoption using UTAUT. Second International Conference on Mobile, Hybrid, and On-Line Learning, IEEE Computer Society.
Taiwo, A. A., Downe, A. G., & Mahmood, A. K (2012). User acceptance of E-government: integrating risk and trust dimensions with UTAUT model. In proceedings at the International Conference on Computer and Information sciences. Kuala Lumpur.
Tarhini, A., Hone, K., & Liu, X. (2013). Factors affecting students’ acceptance of e-learning environments in developing countries: a structural equation modeling approach. International Journal of Information and Education Technology, 3(1), 54.
Venkatesh, Thong, J.Y.L, & Xu, X. (2012). Consumer acceptance and use of information technology: Extending the Unified Theory of Acceptance and Use of Technology. MIS Quarterly, 36(1), 157-178.
Venkatesh, V., & Bala, H. (2008). Technology acceptance Model 3 and a research agenda on interventions. Decision Sciences, 39, 2.
Venkatesh, V., & Davis, F. D. (2000). A theoretical extension of the technology acceptance model: Four longitudinal field studies. Management. Science, 46, 186–204.
Venkatesh, V., Morris, G. B. & Davis, F. D. (2003). User acceptance of information technology: Toward a unified view. MIS Quarterly, 27.
B. Bervell & I. N. Umar / Modelling Non-Linear Relationships of UTAUT
6490
Warshaw, P. R. (1980). A new model for predicting behavioral intentions: An alternative to Fishbein. Journal of Marketing Research, 17, 153–172.
Whetten, D. A. (1989). What constitutes a theoretical contribution? Academy of Management Review, 14, 490–495. Yeap, J., A. L., Ramayah, T. & Soto-Acosta, P. (2015). Factors propelling the adoption of m-learning among students
in higher education. Electronic Markets, 26(4), 323-338.0
http://www.ejmste.com


![24 mai 2012 FRAM for monitor Application to patient safety · Habit with Clinicom [none,partialy know, satisfactory, expert] Communication [0-3] FRAM Scoreboard 11 Exogeneous variability](https://img.pdfslide.us/doc/110x75/5fa0c05ce1c3bb187420727f/24-mai-2012-fram-for-monitor-application-to-patient-safety-habit-with-clinicom-nonepartialy.jpg)