Embed Size (px)
Citation preview
Validation of the SWMF Coupled Model for Solar Corona – Inner Heliosphere – CME
With the Observations of the May 12, 1997 Event
Ofer Cohen(1), Igor V. Sokolov(1), Ward B. Manchester(1), Noe Lugaz(1), Ilia I. Roussev(2), Tamas I. Gombosi(1).
1) CSEM, University of Michigan 2) Institute for Astronomy, University of Hawaii.

Input:1. MDI magnetogram data.2. Wang-Sheeley-Arge (WSA) model.
Model comparison with:1. Tomographic density extraction from Mauna Loa Solar
Observatory Mark-III (Mk3) instrument.2. LASCO white-light images (C2,C3).3. WIND solar wind data measured at 1AU.
We validate the same basic version of SWMF that has been delivered to CCMC.
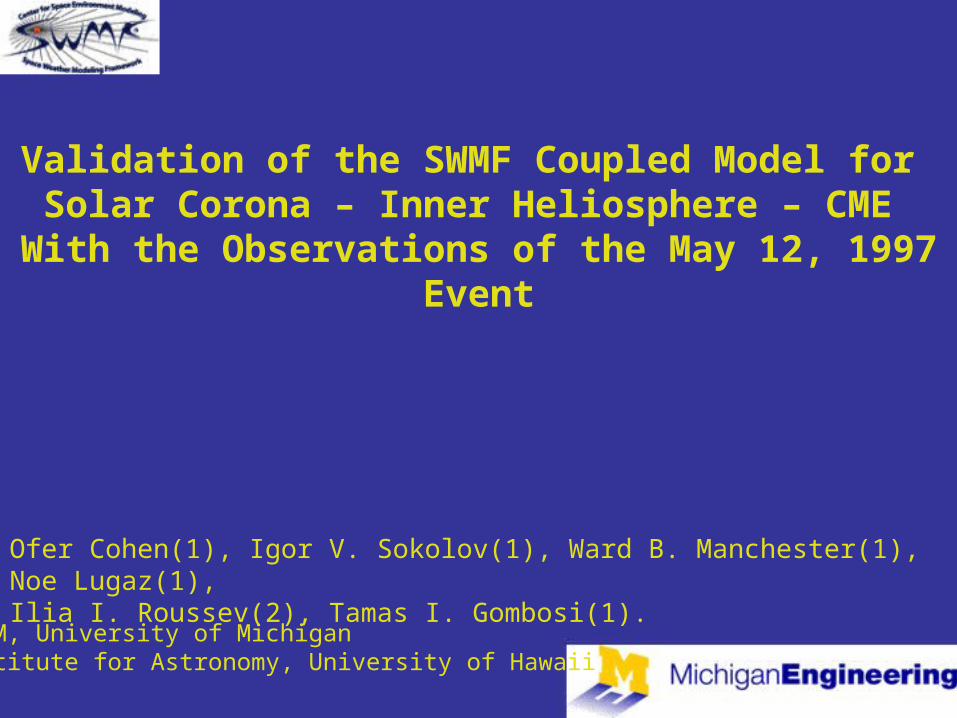
Background Solar Wind Model
€
dγ
γ −1
p
ρ
⎛
⎝ ⎜
⎞
⎠ ⎟+GM
r+u2sw
2= 0
R0
r
∫
Magnetogram DataWSA
Bernoulli integral
Self-consistent MHD Solution
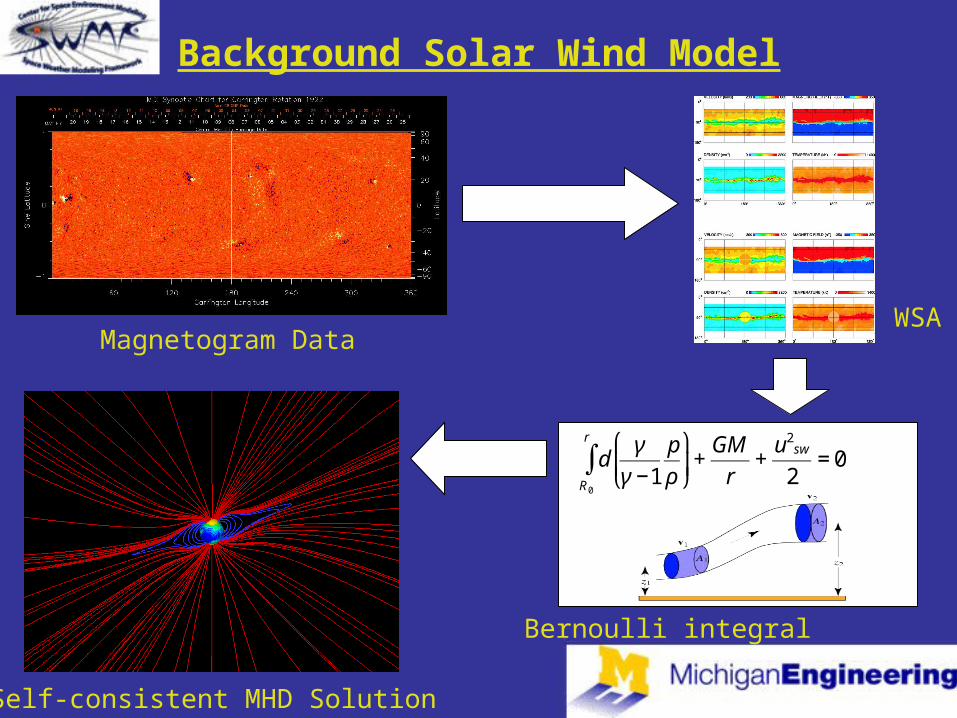
Inner HeliosphereSolar Corona
*See Sokolov’s talk on Thursday (PM) WG2 session, poster by Cohen et al.

Electron density atr=1.3Rsun
Extracted from Tomographic MKIII measurements- West-East hemispheres
Electron density atr=1.3Rsun
Model results - West-East hemispheres
Radial magnetic field atr=1.3Rsun
Model results - West-East hemispheres
Data courtesy of R. Frazin.

Solid Line: SimulationDashed Line: WIND

May 12 1997 Event
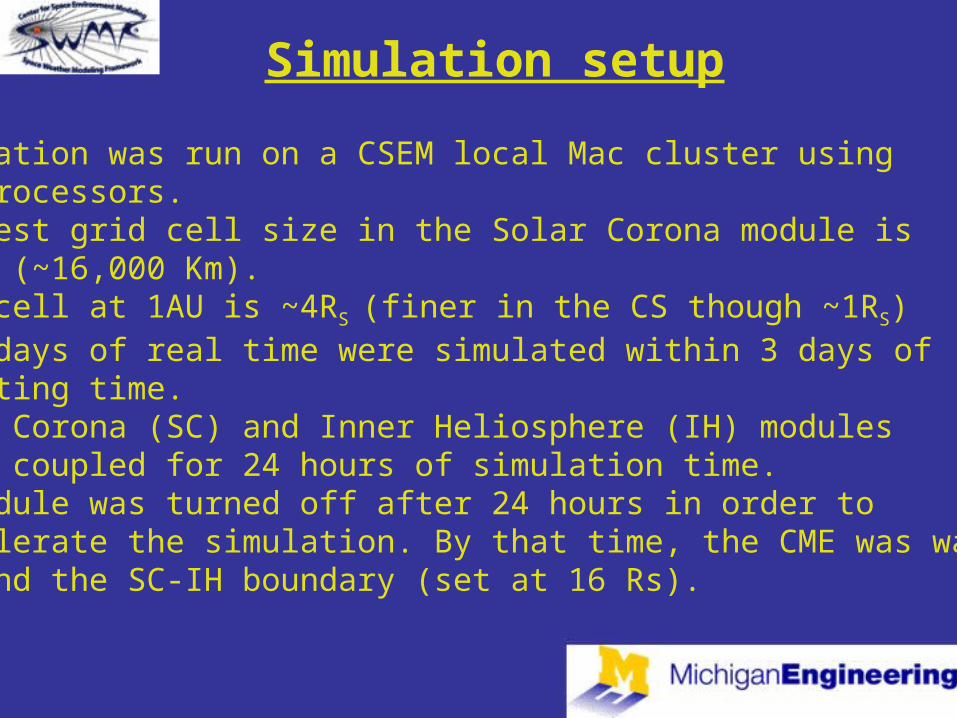
Simulation setup
- Simulation was run on a CSEM local Mac cluster using 40 processors.- Smallest grid cell size in the Solar Corona module is Rs/42 (~16,000 Km).- Grid cell at 1AU is ~4RS (finer in the CS though ~1RS)- Four days of real time were simulated within 3 days of computing time.- Solar Corona (SC) and Inner Heliosphere (IH) modules were coupled for 24 hours of simulation time.- SC module was turned off after 24 hours in order to accelerate the simulation. By that time, the CME was way beyond the SC-IH boundary (set at 16 Rs).
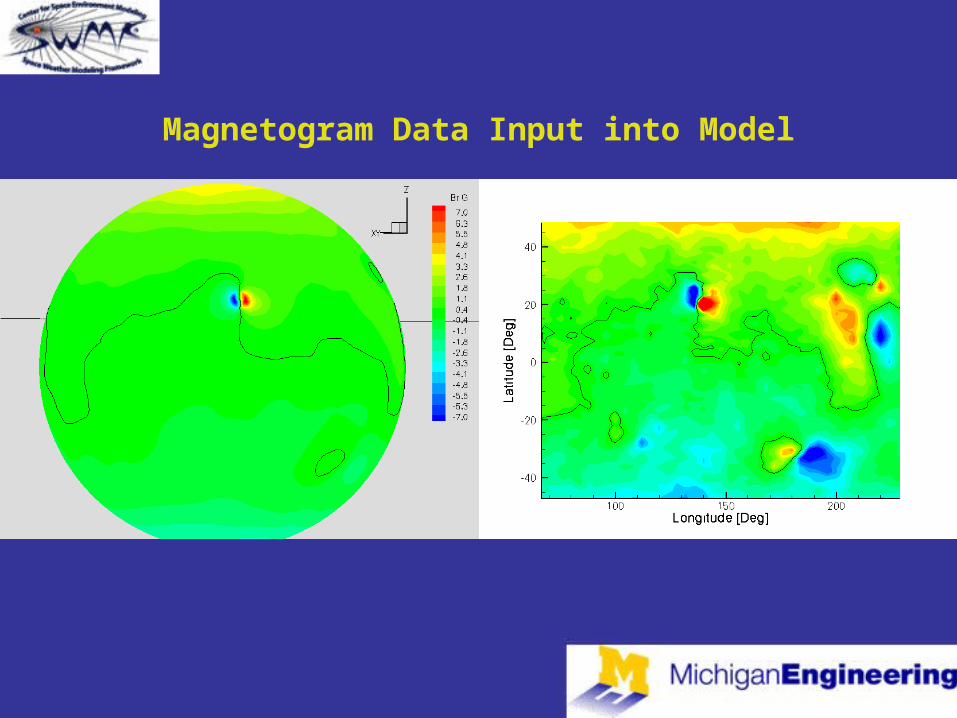
Magnetogram Data Input into Model
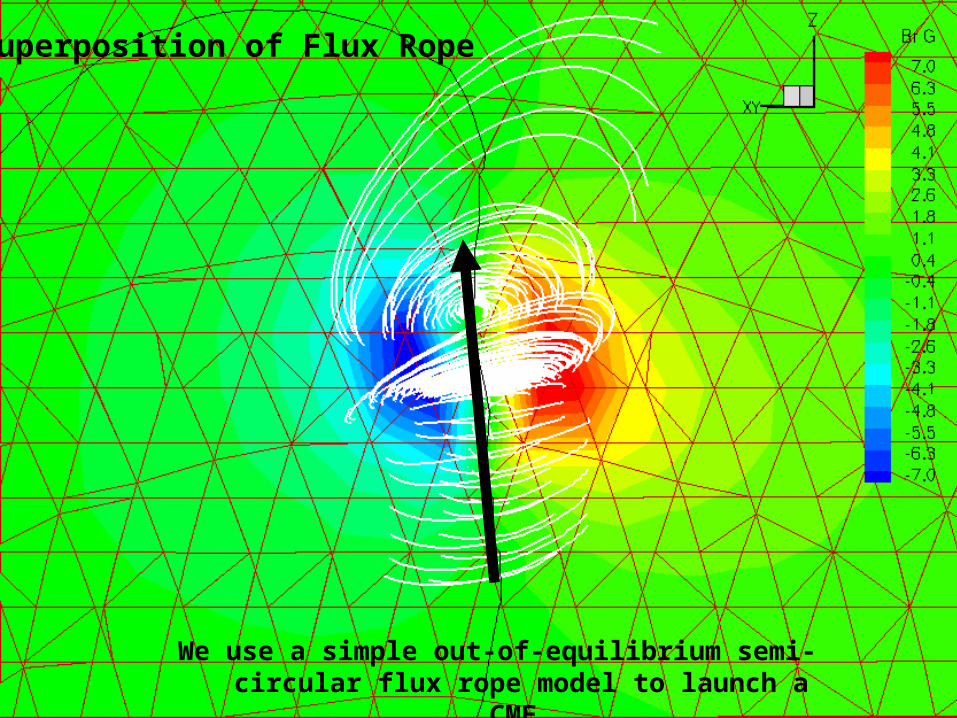
Superposition of Flux Rope
We use a simple out-of-equilibrium semi-circular flux rope model to launch a CME.
QuickTime™ and aTIFF (PackBits) decompressorare needed to see this picture.

Top view Side View
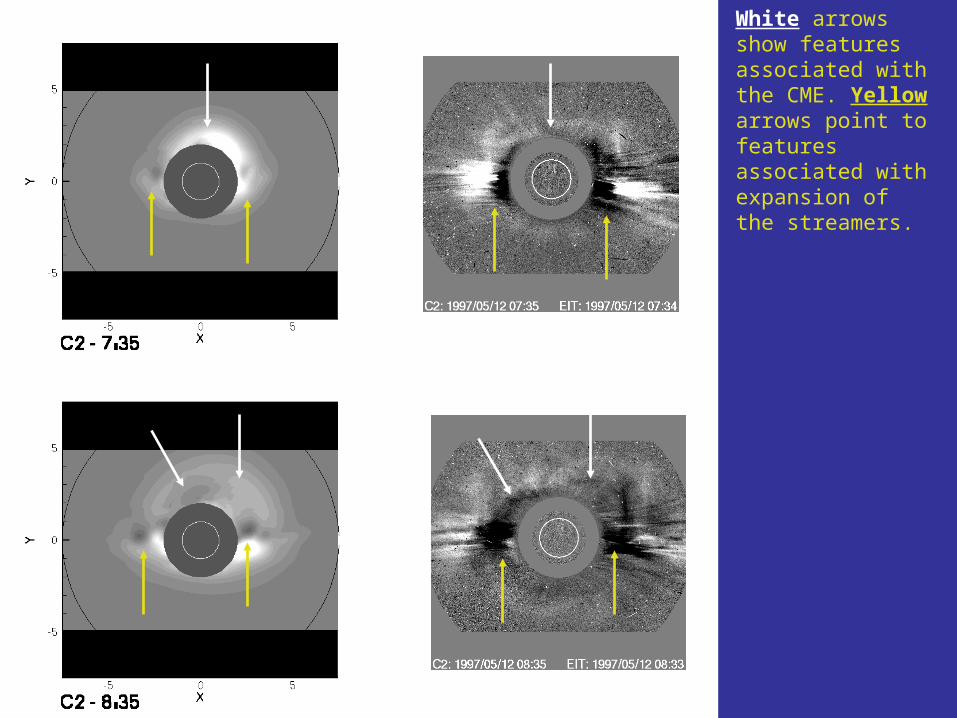
White arrows show features associated with the CME. Yellow arrows point to features associated with expansion of the streamers.
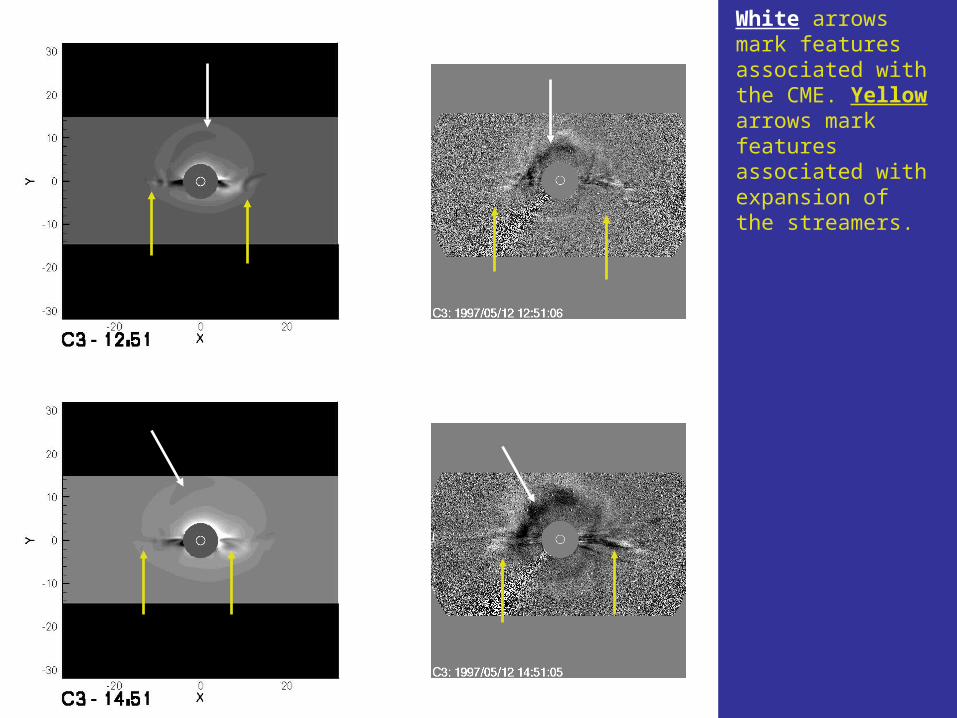
White arrows mark features associated with the CME. Yellow arrows mark features associated with expansion of the streamers.

Front View Side View
Top View
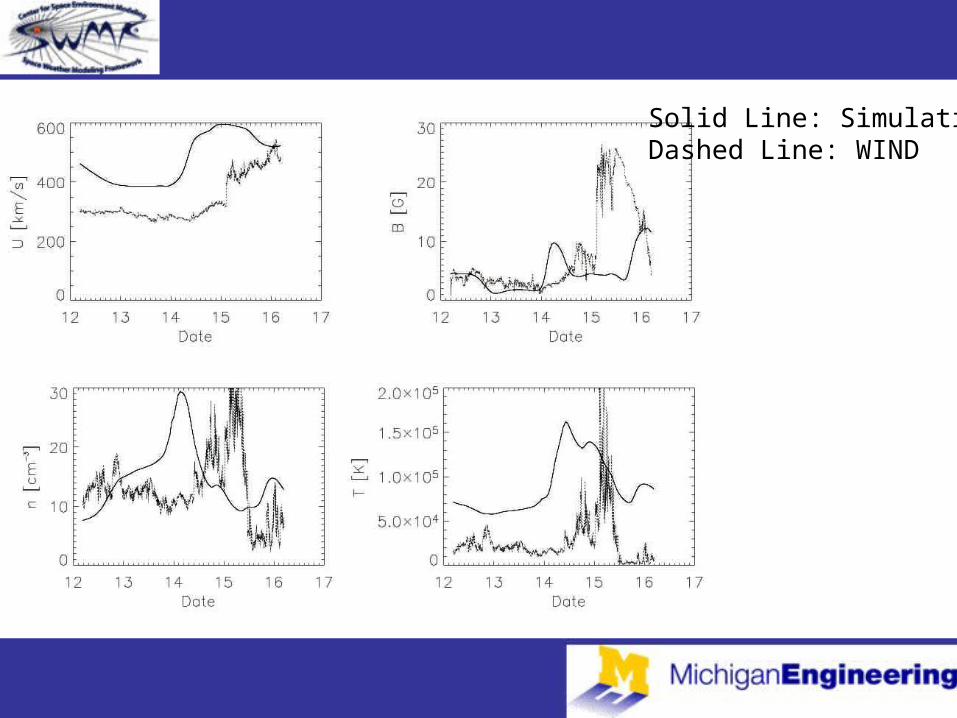
Solid Line: SimulationDashed Line: WIND

Conclusions
1. We developed a semi-empirical model for the background solar wind constrained by the WSA model.
2. Model takes as input magnetogram data from MDI.3. Simulation proves necessary to apply a scaling factor to the
magnetic field when using MDI data, otherwise the field is too weak at 1AU.• Use of a scaling factor is also important for getting the correct
magnetic connectivity for the purpose of modeling SEPs. 4. Simulation results depend on the resolution of the WSA model
fed into SC module. 5. Our experiment demonstrates that the simplified flux-rope
model can not obtain simultaneously stronger CME magnetic field and slower CME speed.

8. Flux rope geometry set up (location and orientation) can be determined from the magnetogram (center of the active region and inversion line). Therefore, the process may be automated.
9. Free magnetic energy of the flux rope may be obtained from other types of data such as vector magnetograms and observations of surface shear motions.
10.Ambient solar wind model is crucial for obtaining the correct results.