Embed Size (px)
Citation preview
STAFF SUMMARY SHEET
TO ACTION SIGNATURE (Surname), GRADEAND DATE TO ACTION SIGNATURE (Surname), GRADE AND DATE
1 DFM sig - JI
l~~. ~ra/, ~,../~ii I~
2 OFER approve <, ,,-z ..s.,, .... ~ 9 ..,.,,1~ NI
I 7
3 DFM action
B (Author /Originator)
4 9
5 10
SURNAME OF ACTION OFFICER AND GRADE SYMBOL PHONE TYPISTS SUSPENSE DATE INITIALS
Pettit, Lt Col DFM 333-4 189 tjp
SUBJECT DATE
Clearance for Material for Public Release USAFA-DF-PA- 3? g' 20140708
SUMMARY
I. PURPOSE. T o provide security and policy review on the document at Tab I prior to release to the public.
2. BACKGROU1'1D. Authors: Brian Tobin and Tim Pettit
T itle: "Supply Chain Resilience: Assessing Resi lience over the Life Cycle of Capital Equipment"
C ircle one: Abstract Tech Report X Journal Article Speech Paper Presentation Poster
Thesis/Dissertation Book Other:
Check all that apply (For Communications Purposes):
[] CRADA (Cooperative Research and Development Agreement) exists
[] Photo/ Video Opportunities [] STEM-outreach Related [] New Invention/ Discovery/ Patent
Description: Summary of work completed with AFMC and AFIT.
Release Information: Submission to the International Journal of Logistics - Research and Applications.
Previous Clearance information: (If applicable) Several works while at AFIT (Pettit et al , 20 I 0 and Pettit et al , 2013), Tobin (20 I 0) .
Recommended Distribution Statement: Distribution A: Approved for public release, distribution unlimited
3. DISCUSSION. No data on mili tary policy, processes or technologies included -- assessments of weapon systems are sanitized as ex: "Product #IO" .
4. RECOMMENDATION. Recommend approval for Distribution A.
~C/ ) #ii~~ T~MoT~ J. PE ,CZ~, USAF, PhD
Assistant Professor of Management
AF IMT 1768, 19840901, V5 PREVIOUS EDITION WILL BE USED.
International Journal of Logistics: Research and Applications Vol. XX. No. XX. date, pages
Supply Chain Resilience: Assessing Resilience over the Life Cycle of Capital Equipment
Brian P. Tobina and Timothy J. Pettitb* 0 Department of Operational Sciences, Air Force Institute o/Technology, Dayton, Ohio, USA
b Department of Management, United States Air Force Academy, Colorado Springs, Colorado, USA
(Received 16June2014; final version received XXXXX)
Abstract
Supply chain resilience is becoming an essential concept for ensuring sustainability of a company. Defined as an enterprise's ability to survive, adapt and grow in the face of turbulent change (Fiksel, 2006), supply chain resilience concepts have great potential for improving supply chain management. To evaluate the various stages of resilience over a product's life cycle, 11 products with long life cycles (e.g. capital equipment) were identified for this study. As exploratory work, each product was segmented into two phases of its life cycle: production and sustainment. This research analyzed data collected on supply chain resilience factors: vulnerabilities and capabilities for each individual product, to determine if differences exist as products progress through the life cycle. The results indicate that the supply chain resilience framework and measurement tool (Pettit, Croxton and Fiksel, 2013) provides managers with beneficial information to assist in the strategic management of their supply chain.
Keywords: resilience, risk management, supply chain management, product life cycle
The views expressed in this article are those of the authors and do not necessarily reflect the official policy or
position of the Air Force, the Department of Defense, or the U.S. Government.
1. Introduction
1. 1 Background
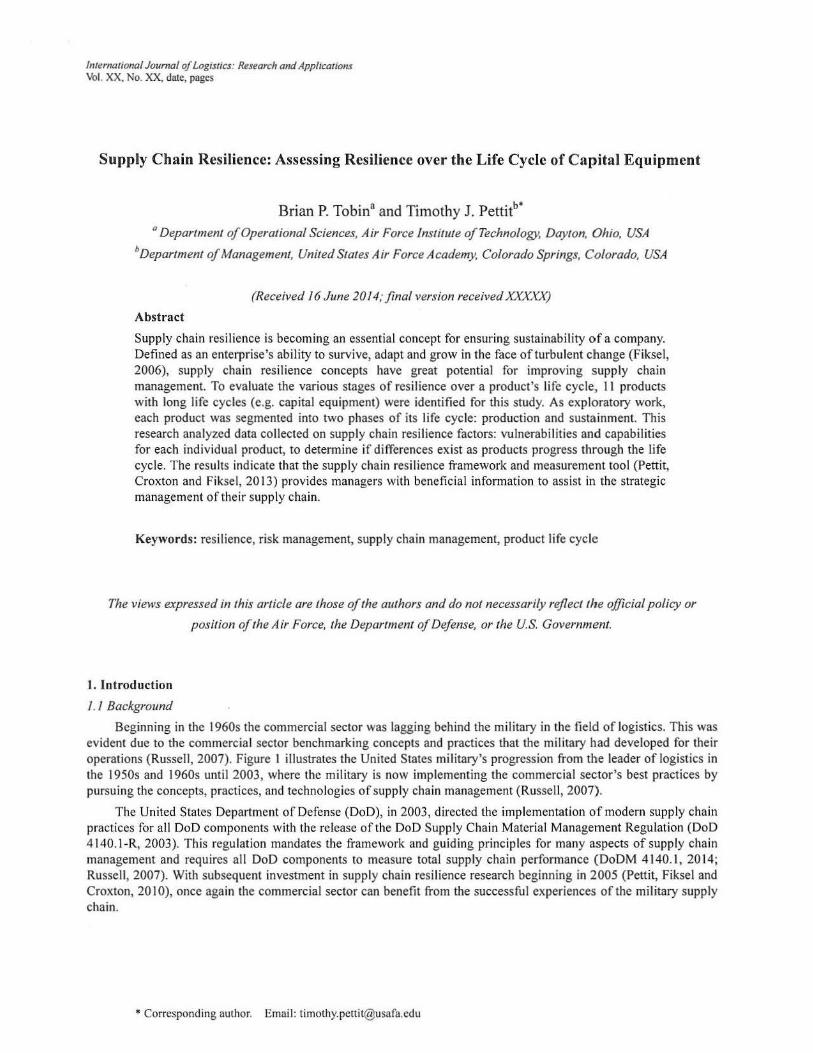
Beginning in the 1960s the commercial sector was lagging behind the military in the field of logistics. This was evident due to the commercial sector benchmarking concepts and practices that the military had developed for their operations (Russell, 2007). Figure I illustrates the United States military's progression from the leader of logistics in the 1950s and 1960s until 2003, where the military is now implementing the commercial sector's best practices by pursuing the concepts, practices, and technologies of supply chain management (Russell, 2007).
The United States Department of Defense (DoD), in 2003, directed the implementation of modern supply chain practices for all DoD components with the release of the DoD Supply Chain Material Management Regulation (DoD 4140.1 -R, 2003). This regulation mandates the framework and guiding principles for many aspects of supply chain management and requires all DoD components to measure total supply chain performance (DoDM 4140.1, 2014; Russell, 2007). With subsequent investment in supply chain resilience research beginning in 2005 (Pettit, Fiksel and Croxton, 2010), once again the commercial sector can benefit from the successful experiences of the military supply chain.
• Corresponding author. Email: [email protected]
8 . Tobin and T. Pettit International Journal of l ogistics: Research and Applications
1905 lOPnia I'S formelly dd'intd u -"tt\11 brand\ of :ne en or war peftU 'lll'I& to Che mO\>e~l'lt
and su~ply of 1rm.es"' by C.h1V!'Koay e etku .1n
T1ompctt0D011 of Tt00P1 Ottd Afottrk>t. llnsu Ctr,. MO: Jud~on Mltshlna. 190.S. US.
1970s and 1980s Sy~tr'~ approad'l to 1opsoo acttvitie's. suonc
WorldWaru t.opsuc.s mtture.s •~ c1Jmblt support of m1•ary tc .. c.H 1nd tqU"l"-~nL Mls$f\'e !----+ loa;ts;btS f~~i.'lt c .. on mountJR'\ IPPfOICh) to si.1st•m m;!ftlry ope~atlons.
1950\ Mt;o.r lnfUlOVts b't
the DtOlnrntnt of Ocft'nse to 1ctc1 ,,,,~ .. ~co
tffte:"""reu kl .,, ... 1cs
t.Tpl'\Hkon rct.iltility, ~
1990s AcJe Comtt.t Sucoon. 60ruine.;
in"t"l!td wupons S\'ntm mJnJiem<nt philOSQphy WM
cradl~·to-erave
mtnaeemtnt f~(>OftUbili:ie'
21" Century Pt:v1~.:vt
r-~1~mtntat1cn ot s.upptv<Nn mana(t"ment Strtttllt-S wtth tme>ha.$,l$ on 1td'lm;;luty lean
protesses. 4od
stntetlc: aihances.
m1lnttll\lblt1tv, aind supportabtti.tv in idc.s11n or sy~~~; c.onfitiJ-r&tion man11emenl! and llfe-cyC!e con manatement.
200.3 Supply Chain Management Revolution launched en tttc Ot:panmcnt ot Ode•"!.C In reiponsc 10 inc ~wcw·y of Oeftnse's force Transtotmauon tnittab~. Nccwonc_·Centrk \V1rltre tonctpt. 1n.O S(>ns~ ard Ruoond ope.raw.ins p-hdo~ophy.
196-0s lo,Smcs td¥ance-s to an e:nainttnnc tn.d quan0t1tt.-e lat: ... ce 1nd tn 1re:1 of nr1ttpc man..~tnL
Loctmcs suppon .tn1-'Y1~1no
tntttr•ttd Josistks support Pf"'ldplts emer1t.
1960Hnd 1970~ AdlPtJuon at m1Jnary to1rsoa to d~tnbutloo ., tht rfA·~·e s'<tot
1980s and 1990• 8usmeu loi.Utia ddiMd I'S tt'rGent..
rt~s:e~c. cus1omt t-dtrvt:n fv:IN•mcnt ptoce:s~ O'OW1 lft ln~tftCC u I
Cldft f t PnlM C ~~lt,,.IV
Clements of S.Uslnu1 lockliu: · Ocmancs for~t•nc
· suacec.c sourcina · Transpornuon - ln~cn:01v manactment • M1tena1s hlndlinc • warchousinc - Picl<•O"i • Orekr tuthnment • Custor-er ~~mcc
Figure 1: Evolution of Logistics Thought and Practice
(Adapted from Russell, 2007)
1.2 Problem Definition
Supply chain resilience has been identified as a method of enhancing traditional risk management associated with commercial supply chains both in recent literature and research (Christopher and Peck, 2004; Sheffi, 2005; Fiksel, 2006; Manuj and Mentzer, 2008; Ponomarov and Holcomb, 2009; Jtittner and Maklan 2011; Pon is and Koronis, 2012 ; Pettit, Croxton and Fiksel, 2013). This leads to the problem statement:
Do managerial tools exist to provide a method to enhance current supply chain risk management over a product's life cycle using the new concept supply chain resilience?
This research investigates literature on supply chain resilience to identify proper tools then evaluates the suitability of one such too1. Supply chain resilience has been a topic of research s ince the globalization of the supp ly chain and some major unanticipated disruptions, such as the terrorist attacks on the United States on 11 September 200 I, Hurricane Katrina from 23 August to 3 September 2005, earthquake and tsunami in Japan on 11 March 2011 , and Iceland volcanic eruption of 27 May 2011. This research will focus on the Supply Chain Resilience Assessment and Management (SCRAM) tool (Pettit, Croxton and Fiksel, 2013). The SCRAM tool is used to measure current supply chain vulnerabilities and capabilities, provide recommendations for improvements, and provide information to better prepare supply chain leadership with managing products, processes, and relationships.
1.3 Literature Reviel-1'
1.3. I Definition of Supply Chain
There are many different definitions of a supply chain in literature. Stock and Boyer noted 173 individual definitions of supply chain management in journals and books (2009). For the purpose of this research, the supply chain is defined as the network of organizations involved in the upstream and downstream flows of products, services, finances and information from the initial supplier to the ultimate customer (Christopher, 1992; Mentzer et al., 200 I; Lambert, Garcia-Dastugue and Croxton, 2005). This definition is important to the research of resilience; it must have a wide view of multi-functions and multi-firms across the supply chain to capture the dynamics of
B. Tobin and T. Pel/it International Journal of logistics: Research and Applications
turbulence and complexity.
1.3.2 Risk Management
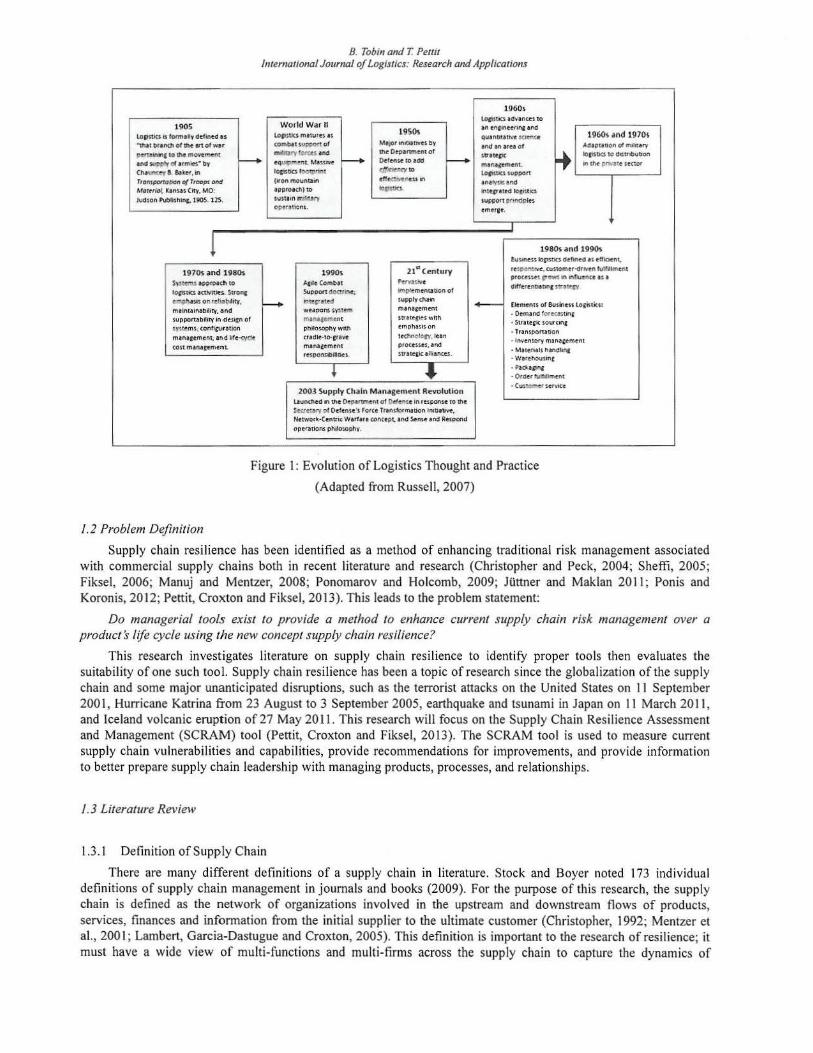
Traditional risk management involves risk analysis which includes assessing each risk in terms of its likelihood of occurrence (probability) and the estimated impact (severi ty) should the risk occur (VanderBok, et. al, 2007). A typical step by step explanation of the risk management process is shown Figure 2, illustrating a continuous circle of risk identifying, assessing, analyzing, controlling, implementing and reviewing (Manuele, 2005). Today's supply chains are much more complex and more susceptible to disruptions due to the globalized supply chains, specialized factories, centralized distribution, increased outsourcing, reduced supplier base, increased volatility of demand, and technological innovations (Cranfield University, 2002). Recent literature identifies the greatest weakness of risk management is its inability to adequately characterize low-probability, high-consequence events (Kunreutber, 2006). Pettit, Croxton and Fiksel noted that "Traditional risk management is a successful tool when potentially disruptive events can be clearly identified" (20 13:57).
1.3.3 Resilience
Step I: Identify Hazards
' Step2: Assess Risks
' Step 3: Step 6: Analyze Controls
Supervise ' and Review
I Step4:
Determine Controls
' Step 5: Implement Controls
Figure 2: Operational Risk Management Process (Adapted from: Manuele, 2005)
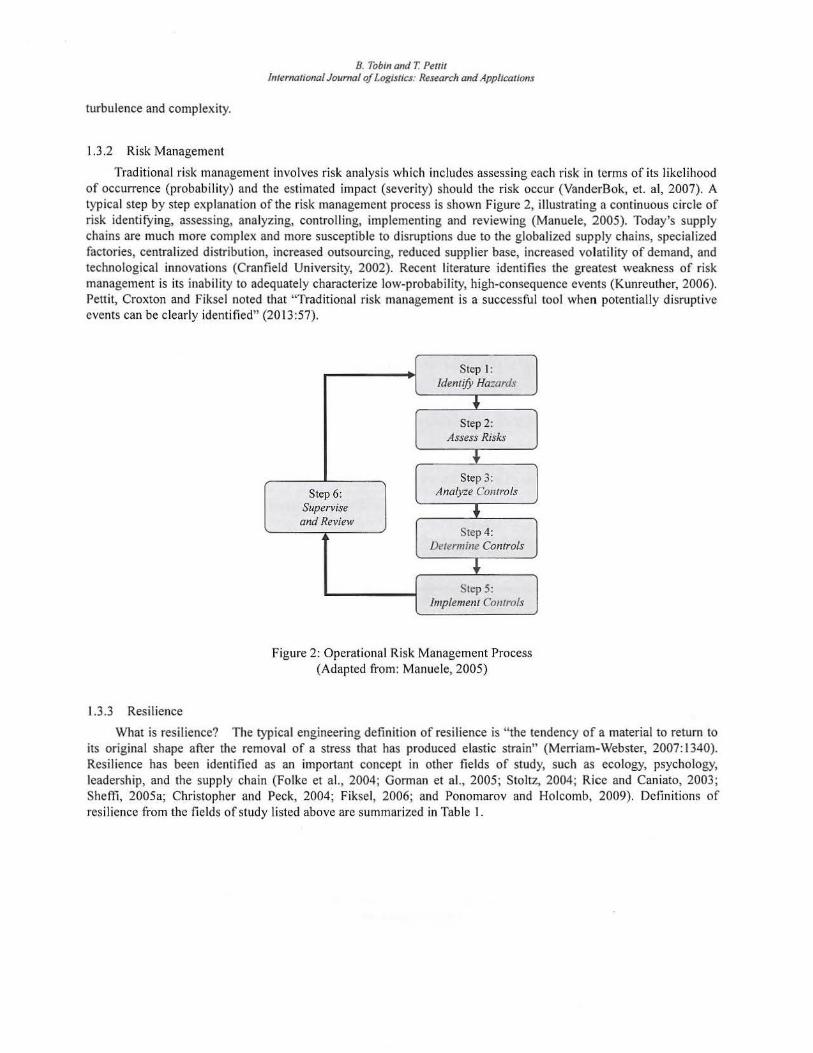
What is resilience? The typical engineering definition of resilience is "the tendency of a material to return to its original shape after the removal of a stress that has produced elastic strain" (Merriam-Webster, 2007: 1340). Resilience has been identified as an important concept in other fields of study, such as ecology, psychology, leadership, and the supp ly chain (Folke et al., 2004; Gorman et al., 2005; Stoltz, 2004; Rice and Caniato, 2003; Sheffi, 2005a; Christopher and Peck, 2004; Fiksel, 2006; and Ponomarov and Holcomb, 2009). Definitions of resilience from the fields of study listed above are summarized in Table 1.
B. Tobin and T. Peffil /nlernaliona/ Journal of Logistics: Research and Applications
Table 1. Definitions of Resilience
Source Definition Field of study
Merriam-Webster
(2007) Capability of a body to recover its size am/ shape after deformation Engineering
Folke et al. Ability to rebound from a disturbance while maintaining diversity,
(2004) integrity and ecological processes Ecology
Gorman et al.
(2005) Ability to bounce back from adversity Psychology
Stoltz (2004) Ability to bot1nce back from adversity and move forward stronger than
Leadership ever
Rice and Caniato Ability to react to an unexpected disruption and restore normal
(2003) operations Supply chain
Sheffi (2005) Co11tainme11t of disruption and recovery from it Supply chain
Christopher and Ability of a system to return to its original state or move to a 11ew, more Supply chain
Peck (2004) desirable state after being disturbed
Fiksel (2006) Capacity for complex industrial systems to survive, adapt a11d grow in the
Supply chain face of turbulent change
Ponomarov and Capability to prepare for unexpected events, respond to disruptions, and
Holcomb (2009) recover by maintaining co11tl11uity of operatio11s at the desired level of Supply chain
1.3.4 Why Resilience?
"Supply chain resilience no longer implies merely the ability to manage risk. It now assumes that the ability to manage risk means being better positioned than competitors to deal with- and even gain advantage from-<lisruptions" (Sheffi, 2005a: I). Why the interest in supply chain resi lience? According to Christopher and Peck, "in an age of lengthening supply chains serving globe-spanning operations, there are frequent reminders that we live in an unpredictable and changing world 2004: l). Fiksel added, "the old methods of risk management are no longer effective in a global economy that is tightly connected and unpredictable" (The Ohio State University, 2008: I). Fiksel also stated "companies must cope with a continuous stream of surprises, ranging from industrial accidents to economic shocks to natural catastrophes" and "resilience is about configuring company assets, including both human and economic capital, in a way that maximizes the capacity of the enterprise to survive, adapt and grow in the face of turbulent change" (The Ohio State University, 2008: 1 ).
The study of supply chain resilience was spurred by the disruptions in the United Kingdom's (UK) transportation network due to fuel protests in 2000 and by the UK's beef market facing an outbreak of Foot and Mouth Disease in 200 I (Peck, 2005). Additionally, there are many examples of disruptions that demonstrate the importance of resilience. For example, a lightning bolt that, in March 2000, struck a Philips semiconductor plant in Albuquerque, New Mexico, created a 10-minute blaze that contaminated millions of chips and subsequently delayed deliveries to its two largest customers: Finland's Nokia and Sweden's Ericsson. The resulting supply chain disruption contributed to Ericsson to leaving the mobile phone business due to the losses it sustained, but Nokia prevailed because the company recognized the magnitude of the disruption early on and took immediate action because it was resilient (Sheffi, 2005b). Also, the 2002 longshoreman union lockout at the Los Angeles/Long Beach ports interrupted transshipments and deliveries to many US-based firms. Port operations and schedules did not return to
8 . Tobin and T. Pettit International Journal of Logistics: Research and Applications
normal until six months after the str ike ended. This I 0-day strike did not interrupt Dell Computer's operations like it d id for many of the other country's retailers and manufacturers. Dell was aware that its lean, high-speed business model left it vulnerable. Dick Hunter, in charge of Dell 's United States supply chain, stated "when a labor problem or an earthquake or a SARS epidemic breaks out, we've got to react quicker than anyone else" (Breen, 2004:86). Dell recognized its vulnerabilities and took steps to make sure they, as a firm, are resilient. In a world of turbulent change, resilience is a key competency, since even the most carefully designed supply chain is susceptible to unforeseen factors. Businesses must be prepared to cope with a continuous stream of challenges, ranging from human errors to technological failures to natural disasters. The ability to manage the risk of uncertainty is a challenge and that businesses are always changing and change introduces risk, and this requires resilience. Sheffi stated, "Some organizations cope far better than others with both the prospect and the manifestation of unquantifiable risk. They don't have in common a secret formula or even many of the same processes for dealing with risk, but they share a critical trait: resilience" (2005a: 1 ).
1.3.5 Resil ience Framework
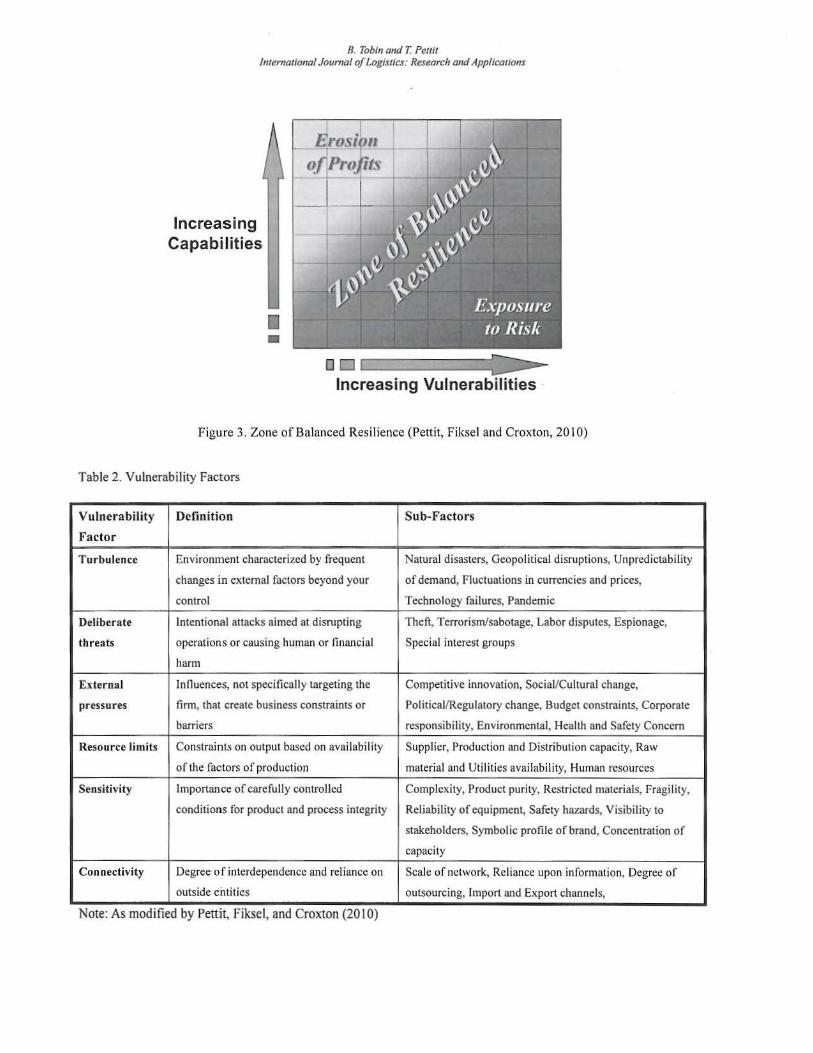
Since the UK's fue l protests in 2000 and the many other major disruptions around the globe, there have been many who have investigated supply chain resilience to define its characteristics and impacts. A review of extant literature identified vulnerabilities as one of the characteristics of supply chain resilience (Peck, 2005; Sheffi, 2005b; Ponomarov and Holcomb, 2009). Pettit, Fiksel and Croxton defined supply chain vulnerabilities as "fundamental factors that make an enterprise susceptible to disruptions" (20 I 0:6). They are categorized as Turbulence, Deliberate threats, External pressures, Resource limits, Sensitivity, Connectivity and Supplier/Customer disruptions.
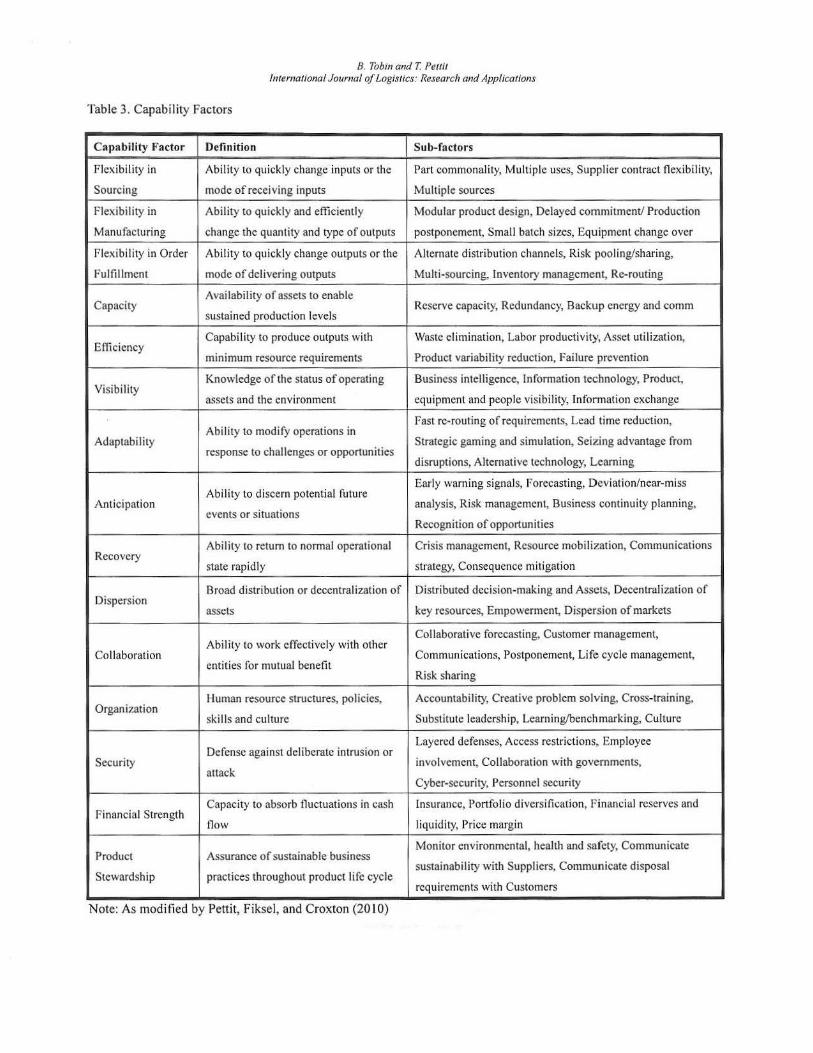
The other characteristic that literature identified in supply chain resilience is capabilities (Cranfield, 2003; Fiksel, 2006, Peck, 2005; Sheffi, 2005; Ponomarov and Holcomb, 2009). Pettit, Fiksel and Croxton defined supply chain capabilities as the "attributes that enable an enterprise to anticipate and overcome disruptions" (20 I 0:6). Capabilities are categorized as Flexibility in sourcing, Flexibility in order fulfillment, Capacity, Efficiency, Visibiliry, Adaptability, Recovery, Dispersion, Collaboration, Organization, Market position, Security and Financial strength.
1.3.6 How to Measure Resilience
Many scholars agree that supply chain resilience is essential in today's global environment (Christopher and Peck, 2004; Sheffi, 2005b; Ponomarov and Holcomb, 2009; Pettit, Fiksel, and Croxton 2010). However, the ability to measure supply chain resilience without using traditional risk management techniques had been lacking in literature. Based on the framework of Pettit, Fiksel and Croxton (2010), the Supply Chain Resilience Assessment and Management (SCRAM) tool was created (Pettit, Croxton and Fiksel, 2013 ).
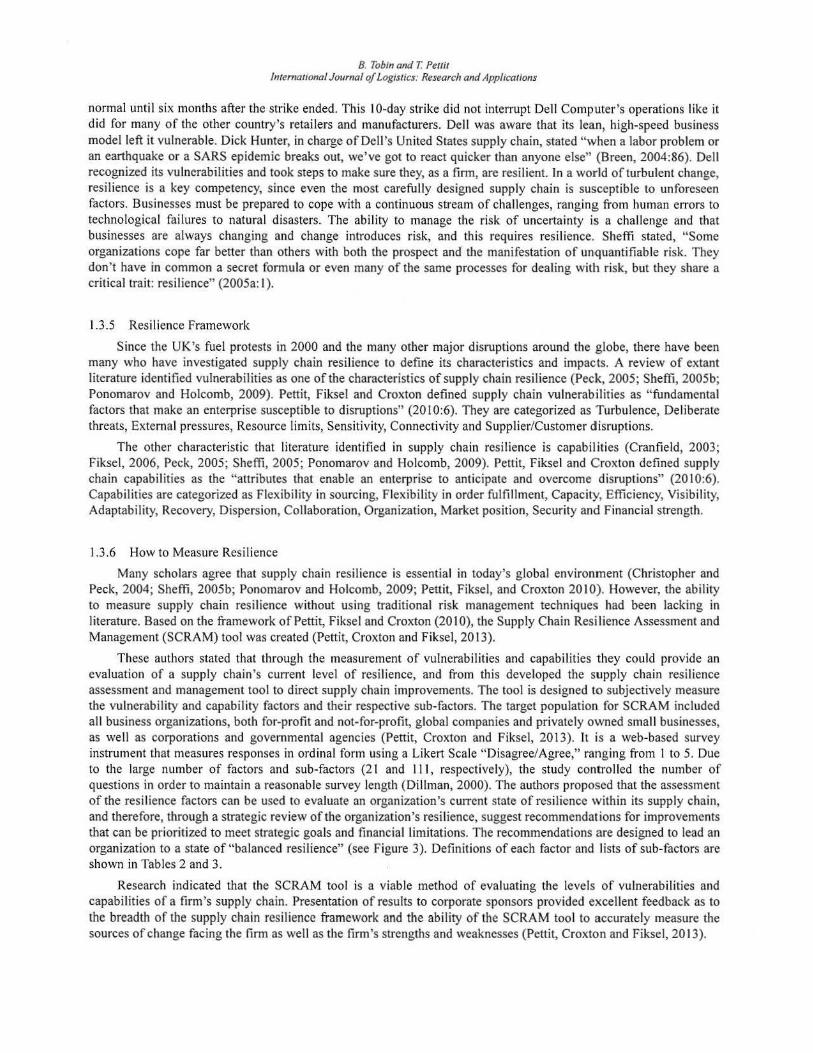
These authors stated that through the measurement of vulnerabilities and capabilities they could provide an evaluation of a supply chain 's current level of resilience, and from this developed the supply chain resilience assessment and management tool to direct supply chain improvements. The tool is designed to subjectively measure the vulnerability and capability factors and their respective sub-factors. The target population for SCRAM included all business organizations, both for-profit and not-for-profit, global companies and privately owned small businesses, as well as corporations and governmental agencies (Pettit, Croxton and Fiksel, 2013). It is a web-based survey instrument that measures responses in ord inal form using a Likert Scale "Disagree/Agree," ranging from 1 to 5. Due to the large number of factors and sub-factors (21 and 11 1, respectively), the study controlled the number of questions in order to maintain a reasonable survey length (Dillman, 2000). The authors proposed that the assessment of the resilience factors can be used to evaluate an organization's current state of resilience within its supply chain, and therefore, through a strategic review of the organization's resilience, suggest recommendations for improvements that can be prioritized to meet strategic goals and financial limitations. The recommendations are designed to lead an organization to a state of "balanced resilience" (see Figure 3). Definitions of each factor and lists of sub-factors are shown in Tables 2 and 3.
Research indicated that the SCRAM tool is a viable method of evaluating the levels of vulnerabilities and capabilities of a firm's supply chain. Presentation of results to corporate sponsors provided excellent feedback as to the breadth of the supply chain resilience framework and the ability of the SCRAM tool to accurately measure the sources of change facing the firm as well as the firm's strengths and weaknesses (Pettit, Croxton and Fiksel, 2013).
B. Tobin and T. Pettit International Journal of logistics: Research and Applications
Increasing Capabilities
•
.I rOSl f ll
o fj'_rt>jits
- -~
Increasing Vulnerabilities ·
Figure 3. Zone of Balanced Resil ience (Pettit, Fiksel and Croxton, 201 0)
Table 2. Vulnerability Factors
Vulnerability Definition Sub-Factors
Factor
T urbulence Environment characterized by frequent Natural disasters, Geopolitical disruptions, Unpredictabil ity
changes in external factors beyond your of demand, Fluctuations in currencies and prices,
control Technology failures, Pandemic
Deliberate Intentional attacks aimed at disrupting Theft, Terrorism/sabotage, Labor disputes, Espionage,
threats operations or causing human or financial Special interest groups
harm
External Influences, not specifically targeting the Competitive innovation, Social/Cultural change,
pressures firm, that create business constraints or Political/Regulatory change, Budget constraints, Corporate
barriers responsibility, Environmental, Health and Safety Concern
Resource limits Constraints on output based on availability Supplier, Production and Distribution capacity, Raw
of the factors of production material and Utilities availability, Human resources
Sensitivity Importance of carefully controlled Complexity, Product purity, Restricted materials, Fragility,
conditions for product and process integrity Reliability of equipment, Safety hazards, Visibility to
stakeholders, Symbolic profile of brand, Concentration of
capacity
Connectivity Degree of interdependence and reliance on Scale of network, Reliance upon information, Degree of
outside entities outsourcing, Import and Export channels,
Note: As modified by Pettit, f1ksel, and Croxton (20 I 0)
8. Tobin and T. Pellir International Journal of Logistics: Research and Applications
Table 3. Capability Factors
Capabili ty Factor Definition Sub-factors
Flexibility in Ability to quickly change inputs or the Part commonality, Multiple uses, Supplier contract flexibility,
Sourcing mode of receiving inputs Multiple sources
Flexibility in Ability to quickly and efficiently Modular product design, Delayed commitment/ Production
Manufacturing change the quantity and type of outputs postponement, Small batch sizes, Equipment change over
Flexibility in Order Ability to quickly change outputs or the Alternate distribution channels, Risk pooling/sharing,
Fulfillment mode of delivering outputs Multi-sourcing, Inventory management, Re-routing
Capacity Availability of assets to enable
Reserve capacity, Redundancy, Backup energy and comm sustained production levels
Efficiency Capability to produce outputs with Waste elimination, Labor productivity, Asset utilization,
minimum resource requirements Product variabil ity reduction, Failure prevention
Visibility Knowledge of the status of operating Business intelligence, Information technology, Product,
assets and the environment equipment and people visibility, Information exchange
Ability to modify operations in Fast re-routing of requirements, Lead time reduction,
Adaptability Strategic gaming and simulation, Seizing advantage from response to challenges or opportunities
disruptions, Alternative technology, Learning
Ability to discern potential future Early warning signals, Forecasting, Deviation/near-miss
Anticipation analysis, Risk management, Business continuity planning, events or situations
Recognition of opportunities
Recovery Ability to return to normal operational Crisis management, Resource mobilization, Communications
state rapidly strategy, Consequence mitigation
Broad distribution or decentralization of Distributed decision-making and Assets, Decentralization of Dispersion
key resources, Empowerment, Dispersion of markets assets
Ability to work effectively with other Collaborative forecasting, Customer management,
Collaboration Communications, Postponement, Life cycle management, entities for mutual benefit
Risk sharing
Organi1..ation I luman resource structures, policies, Accountability, Creative problem solving, Cross-training,
skills and culture Substitute leadership, Learning/benchmarking, Culture
Defense against deliberate intrusion or Layered defenses, Access restrictions. Employee
Security involvement, Collaboration with governments, attack
Cyber-security, Personnel security
Capacity to absorb fluctuations in cash Insurance, Portfolio diversification, Financial reserves and Financial Strength
flow liquidity, Price margin
Product Assurance of sustainable business Monitor environmental, health and safety, Communicate
Stewardship practices throughout product life cycle sustainability with Suppliers, Communicate disposal
requirements with Customers
Note: As modified by Pettit, Fiksel, and Croxton (20 I 0)
8 . Tobin and T Pellit International Journal of Logistics: Research and Applications
1.4 Research Questions
To date, research conducted utilizing resilience assessment tools to measure vulnerabilities and capabilities of a supply chain have not been applied across various stage of the product life cycle. This indicates the oppo1tunity for the following research question to be investigated:
Research Question: Is the SCRAM tool able to measure supply chain vulnerabilities and capabilities within the product life cycle framework and provide useful feedback?
To answer the research question, the following investigative questions will be addressed:
Question I: Will the SCRAM tool identify an overage of capabilities compared to vulnerabilities in selected products at a current point in time in the weapon system life cycle?
Question ~: Will the SCRAM tool identify an underage of capabilities compared to vulnerabilities in selected weapon system at a current point in time in the weapon system life cycle?
Question 3: Do supply chain vulnerabilities and capabilities vary across different phases of the product life cycle?
2. Method
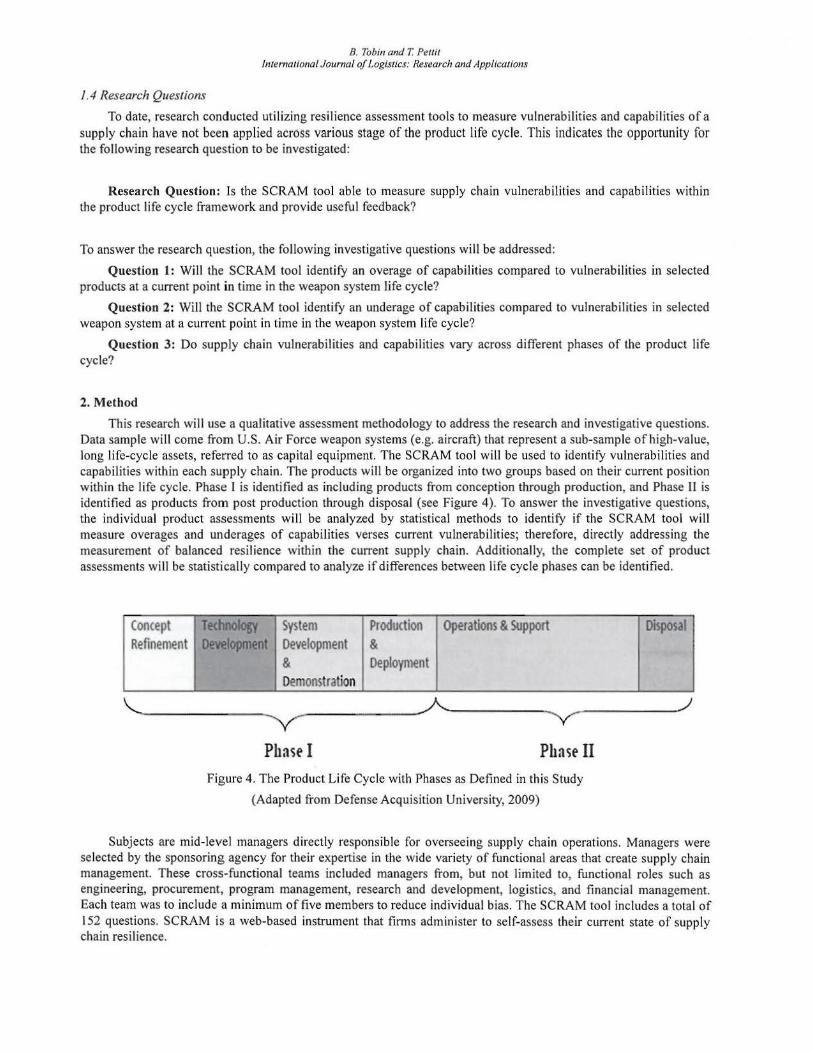
This research will use a qualitative assessment methodology to address the research and investigative questions. Data sample will come from U.S. Air Force weapon systems (e.g. aircraft) that represent a sub-sample of high-value, long life-cycle assets, referred to as capital equipment. The SCRAM tool will be used to identify vulnerabilities and capabilities within each supply chain. The products will be organized into two groups based on their current position within the life cycle. Phase I is identified as including products from conception through production, and Phase II is identified as products from post production through disposal (see Figure 4). To answer the investigative questions, the individual product assessments will be analyzed by statistical methods to identify if the SCRAM tool will measure overages and underages of capabilities verses current vulnerabilities; therefore, directly addressing the measurement of balanced resilience within the current supply chain. Additionally, the complete set of product assessments will be statistically compared to analyze if differences between life cycle phases can be identified.
Concept Refinement
Technology System Production Operations & support Disposal Development Development &
& Deployment Demonstration _____ _,)
Phase I Phase Il Figure 4. The Product Li fe Cycle with Phases as Defined in this Study
(Adapted from Defense Acquisition University, 2009)
Subjects are mid-level managers directly responsible for overseeing supply chain operations. Managers were selected by the sponsoring agency for their expertise in the wide variety of functional areas that create supply chain management. These cross-functional teams included managers from, but not limited to, functional roles such as engineering, procurement, program management, research and development, logistics, and financial management. Each team was to include a minimum of five members to reduce individual bias. The SCRAM tool includes a total of 152 questions. SCRAM is a web-based instrument that firms administer to self-assess their current state of supply chain resilience.
B. Tobin and T. Pel/it International Journal of Logistics: Research and Applications
3. Results
3.1 Participant Flow
The population for this study includes supply chain managers of capital equipment, defined as high-value, long-life equipment assets. The sample for this study comes from managers of manned and unmanned mil itary aircraft including attack, bomber, cargo, fighter, intelligence-gathering and tanker aircraft. Within the total of 450 investment programs (AFLCMC, 2013), there were 21 capital equipment supply chains identified as sample "products" by the sponsoring organization. A request letter was distributed to the leadership of these organizations, and 11 agreed to participate in the project, representing a 52% response rate.
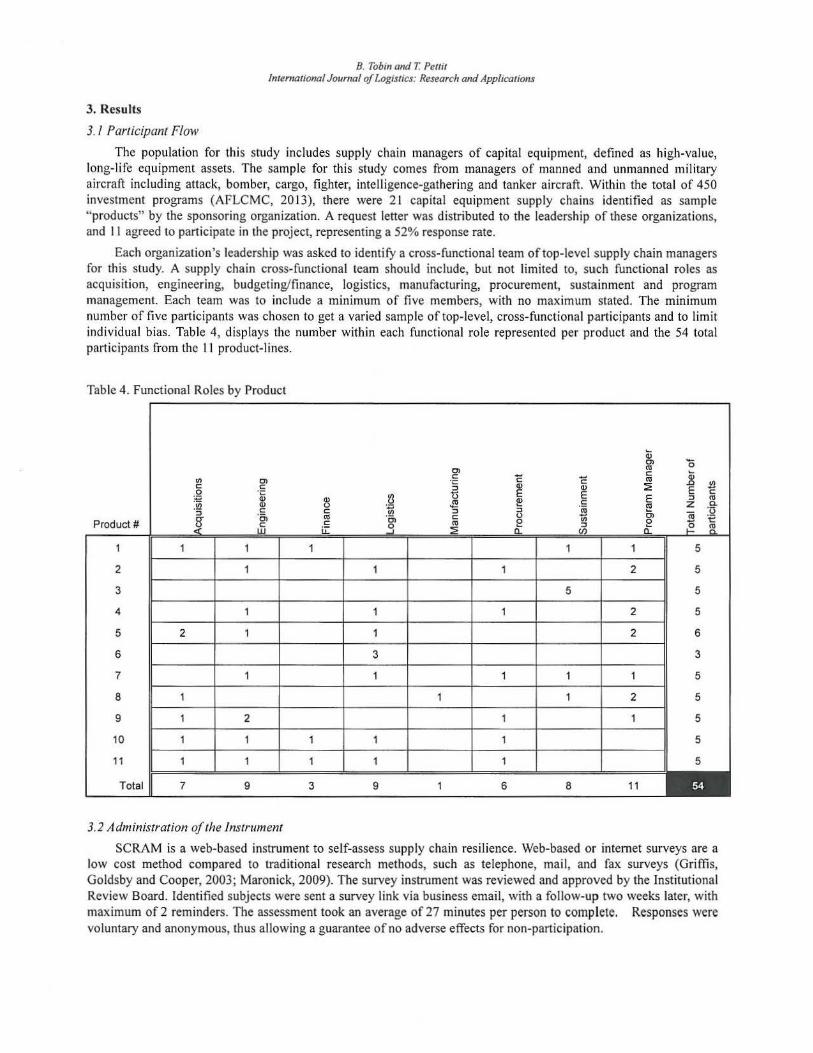
Each organization's leadership was asked to identify a cross-functional team of top-level supply chain managers for this study. A supply chain cross-functional team should include, but not limited to, such functional roles as acquisition, engineering, budgeting/finance, logistics, manufacturing, procurement, sustainment and program management. Each team was to include a minimum of five members, with no maximum stated. The minimum number of five participants was chosen to get a varied sample of top-level, cross-functional participants and to limit individual bias. Table 4, displays the number within each functional role represented per product and the 54 total participants from the 11 product-lines.
Table 4. Functional Roles by Product
Qj en 0 C1l en c: Qj
I/) en c: 'E 'E C1l ·c .0 .!!2 c: c: ;;;) Q) Q) ::1E E 0 ·c::
·~ t5 E E c:
:-2 al 8 ~ E ;;;) C1l I/) .f! c:
~ z a. ·:; c: c: ;;;) ;;;) '(ii ro ·u CT ·c;, C1l ·c;, c: (.) (;) en t Product# c: C1l e 0
~ ;; c: 0, ,:;:i Ci l!! w u: ::1E CL
1 1 1 1 1 1 5
2 1 1 1 2 5
3 5 5
4 1 1 1 2 5
5 2 1 1 2 6
6 3 3
7 1 1 1 1 1 5
8 1 1 1 2 5
9 1 2 1 1 5
10 1 1 1 1 1 5
11 1 1 1 1 1 5
Total 7 9 3 9 1 6 8 11
3.2 Administration of the Instrument
SCRAM is a web-based instrument to self-assess supply chain resilience. Web-based or internet surveys are a low cost method compared to traditional research methods, such as telephone, mail, and fax surveys (Griffis, Goldsby and Cooper, 2003; Maronick, 2009). The survey instrument was reviewed and approved by the Institutional Review Board. Identified subjects were sent a survey link via business email, with a follow-up two weeks later, with maximum of 2 reminders. The assessment took an average of 27 minutes per person to complete. Responses were voluntary and anonymous, thus allowing a guarantee of no adverse effects for non-participation.
8 . Tobin and T. Pe/lit International Journal of l ogistics: Research and Applications
3.3 Baseline Data
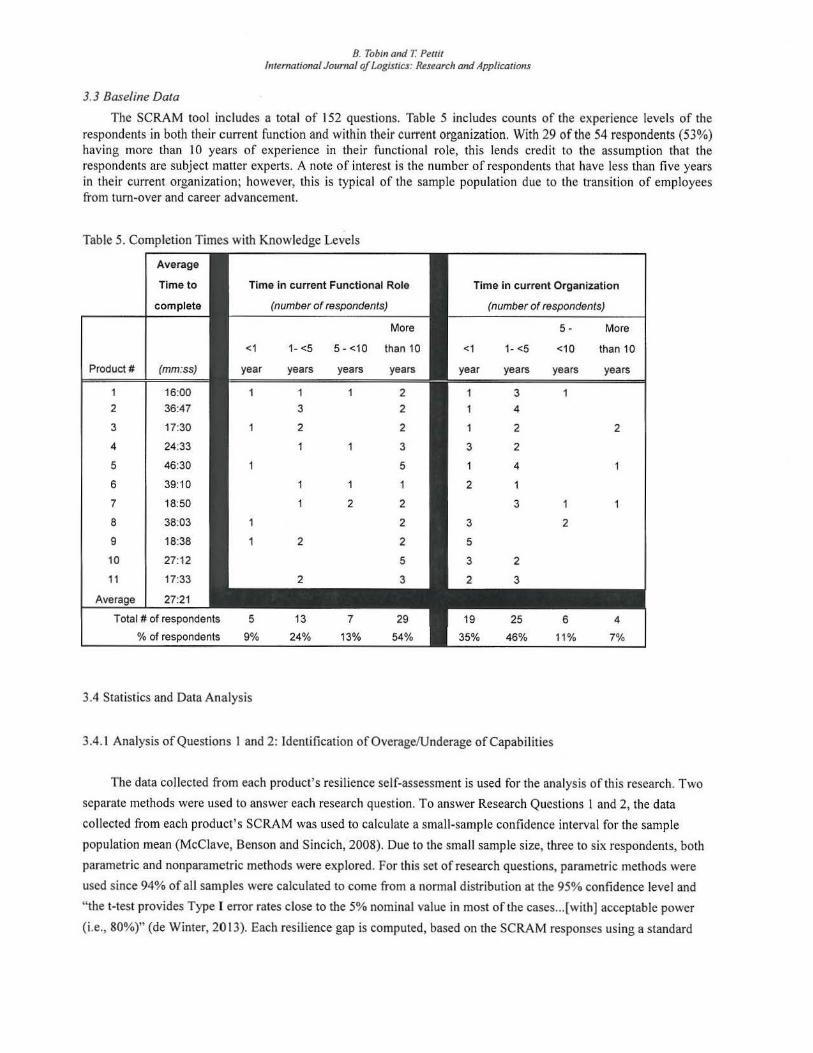
The SCRAM tool includes a total of 152 questions. Table 5 includes counts of the experience levels of the respondents in both their current function and within their current organization. With 29 of the 54 respondents (53%) having more than 10 years of experience in their functional role, this lends credit to the assumption that the respondents are subject matter experts. A note of interest is the number of respondents that have less than five years in their current organization; however, this is typical of the sample population due to the transition of employees from tum-over and career advancement.
Table 5. Completion Times with Knowledge Levels
Average
Time to Time in current Functional Role Time in current Organization
complete (number of respondents) (number of respondents)
More 5- More
<1 1- <5 5 - <10 <1 1- <5 <10 than 10
Product# (mm:ss) year years years years year years years years
1 16:00 1 2 3
2 36:47 3 2 4
3 17:30 2 2 2 2
4 24:33 3 3 2
5 46:30 5 4
6 39:10 2
7 18:50 2 2 3
8 38:03 2 3 2
9 18:38 2 2 5
10 27:12 3 2
11 17:33
Average 27:21
Total# of respondents % of respondents 9% 24% 13% 54% 35% 46% 11% 7%
3.4 Statistics and Data Analysis
3.4. l Analysis of Questions I and 2: Identification of Overage/Underage of Capabilities
The data collected from each product's resilience self-assessment is used for the analysis of this research. Two
separate methods were used to answer each research question. To answer Research Questions I and 2, the data
collected from each product's SCRAM was used to calculate a small-sample confidence interval for the sample
population mean (McClave, Benson and Sincich, 2008). Due to the small sample size, three to six respondents, both
parametric and nonparametric methods were explored. For this set of research questions, parametric methods were
used since 94% of all samples were calculated to come from a normal distribution at the 95% confidence level and
"the t-test provides Type I error rates close to the 5% nominal value in most of the cases ... [with) acceptable power
(i.e., 80%)" (de Winter, 2013). Each resilience gap is computed, based on the SCRAM responses using a standard
B. Tobin and T. Peui/ ln1ernational Journal of Logistics: Research and Applications
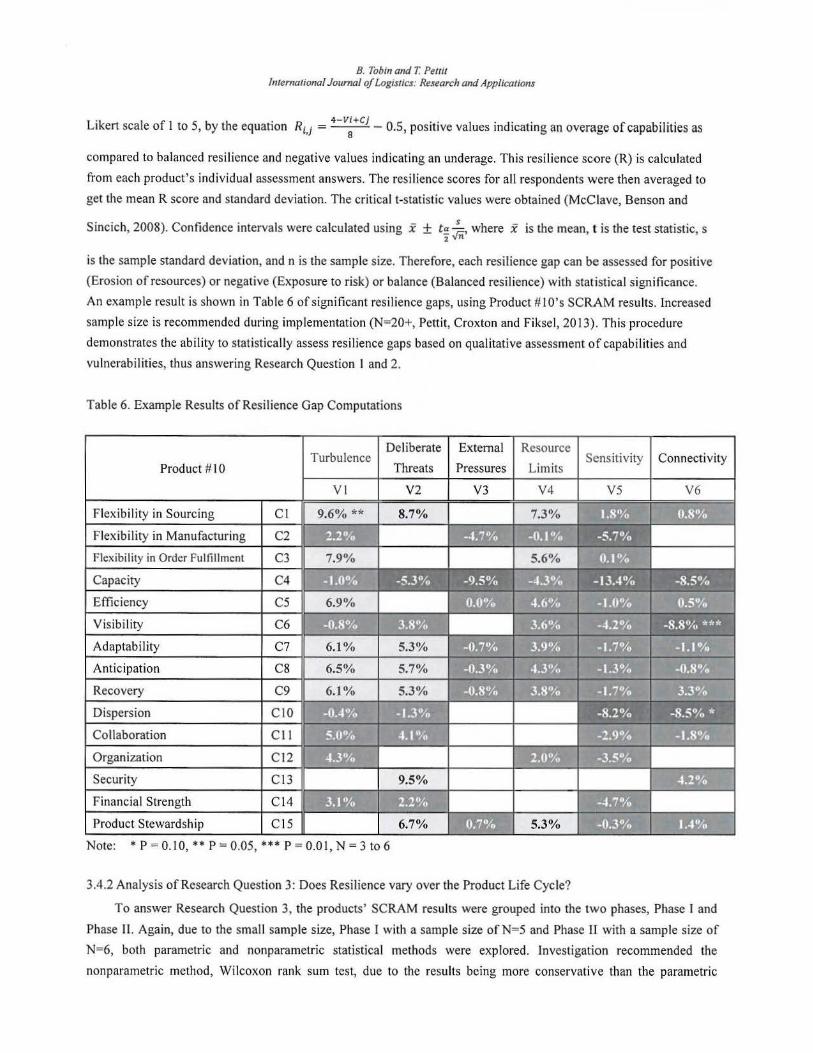
Likert scale of 1 to S, by the equation Ri,J = 4-v~+cj - 0.5, positive values indicating an overage of capabilities as
compared to balanced resilience and negative values indicating an underage. This resilience score (R) is calculated
from each product's individual assessment answers. The resilience scores for all respondents were then averaged to
get the mean R score and standard deviation. The critical t-statistic values were obtained (McCJave, Benson and
Sincich, 2008). Confidence intervals were calculated using x ± t~ ~, where x is the mean, t is the test statistic, s 2 vn
is the sample standard deviation, and n is the sample size. Therefore, each resilience gap can be assessed for positive
(Erosion of resources) or negative (Exposure to risk) or balance (Balanced resilience) with statistical significance.
An example result is shown in Table 6 of significant resilience gaps, using Product# I O's SCRAM results. Increased
sample size is recommended during implementation (N=20+, Pettit, Croxton and Fiksel, 2013). This procedure
demonstrates the ability to statistically assess resilience gaps based on qualitative assessment of capabilities and
vulnerabilities, thus answering Research Question I and 2.
Table 6. Example Results of Resilience Gap Computations
Deliberate External Turbulence
Product #JO Threats Pressures
Resource
Limits Sens itivity Connectivity
VI V2 V3 V4 vs V6
Flexibility in Sourcing Cl 9.6% ** 8.7%
Flexibility in Manufacturing C2
Flexibility in Order Fulfillment C3
Capacity C4
Efficiency cs Visibility C6
Adaptability C7
Anticipation C8
Recovery C9
Dispersion CJO
Collaboration Cl!
Organization Cl2
Security Cl3 9.5%
Financial Strength Cl4
Product Stewardship CI S 5.3%
Note: * P=0.10, ** P = O.OS, *** P = 0.01, N = 3 to6
3.4.2 Analysis of Research Question 3: Does Resilience vary over the Product Life Cycle?
To answer Research Question 3, the products' SCRAM results were grouped into the two phases, Phase I and
Phase II. Again, due to the small sample size, Phase I with a sample size ofN=S and Phase IT with a sample size of
N=6, both parametric and nonparametric statistical methods were explored. Investigation recommended the
nonparametric method, Wilcoxon rank sum test, due to the results being more conservative than the parametric
8. Tobin and T. Pel/ii International Journal of Logistics: Research and Appltcations
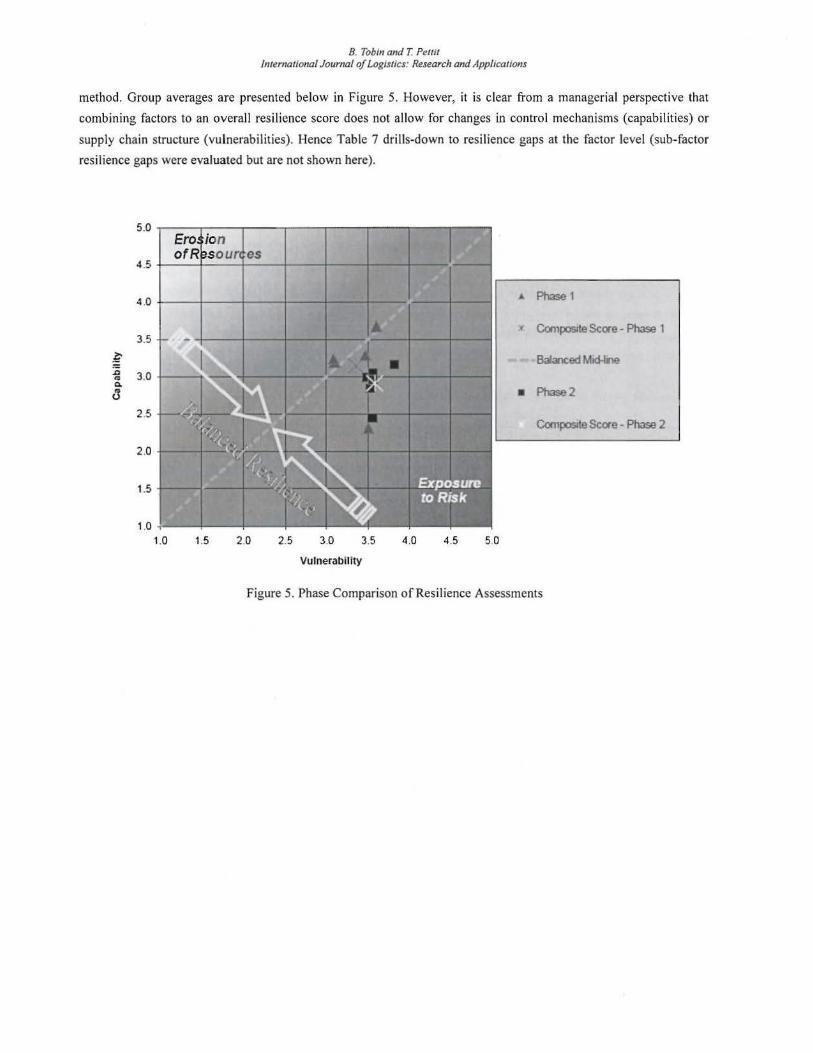
method. Group averages are presented below in Figure 5. However, it is clear from a managerial perspective that
combining factors to an overall resilience score does not allow for changes in control mechanisms (capabilities) or
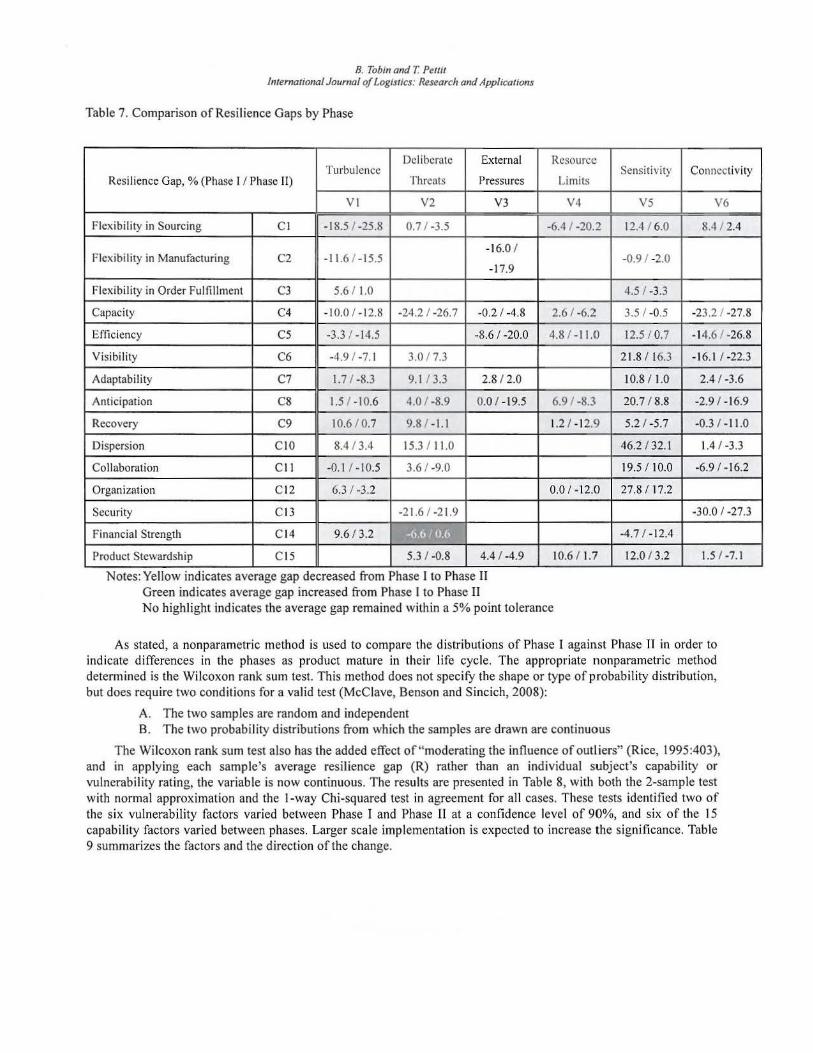
supply chain structure (vulnerabilities). Hence Table 7 drills-down to resilience gaps at the factor level (sub-factor
resilience gaps were evaluated but are not shown here).
1.0 1.5 2.0 2.5 3.0 3.5 4.0 4.5 5.0
Vulnerability
Figure 5. Phase Comparison of Resilience Assessments
8. Tobin and 7: Pel/it International Journal of logistics: Research and Applications
Table 7. Comparison of Resilience Gaps by Phase
Deliberate External Turbulence
Resilience Gap, % (Phase I I Phase II) Threats Pressures
V I V2 V3
Flexibility in Sourcing Cl -1 8.5 / -25.8 0.7 / -3.5
-16.0 I Flexibility in Manufacturing C2 - 11.6 / -15.5
- 17.9
Flexibility in Order Fulfillment C3 5.6 1 1.0
Capacity C4 -10.0 / -12.8 -24 .2 I -26. 7 -0.2 I -4.8
Efficiency cs -3.3 / -14.5 -8.6 / -20.0
Visibility C6 -4.9 / -7.1 3.0 I 7.3
Adaptability C7 1.7 I -8.3 9.1 I 3.3 2.8 / 2.0
Anticipation C8 1.5 I -1 0.6 4.0 / -8.9 0.0 1-19.5
Recovery C9 10.6 / 0.7 9.8 / -1.1
Dispersion ClO 8.4 13.4 15.3 /11.0
Collaboration Cll -0.1 I -10.5 3.6 / -9.0
Organization Cl2 6.3 / -3.2
Security C l3 -21.6 I -21.9
Financial Strength Cl4 9.6 13.2
Product Stewardship C l5 5.3 I -0.8 4.4 / -4.9
Notes: Yellow indicates average gap decreased from Phase I to Phase II Green indicates average gap increased from Phase I to Phase II
Resource
Limits
V4
-6.4 / -20.2
2.6 I -6.2
4.8 I -11.0
6.9 / -8.3
1.2 / -1 2.9
0.0 / -12.0
10.6/ 1.7
No highlight indicates the average gap remained within a 5% point tolerance
Sensitivity Connectivity
vs V6
12.4 / 6.0 8.4 / 2.4
-0.9 / -2.0
4.5 I -3.3
3.5 I -0.S -23.2 I -27.8
12.5 I 0.1 - 14.6 I -26.8
21.8 I 16.3 -1 6.1 I -22.3
10.8 I 1.0 2.4 I -3.6
20.7 / 8.8 -2.9 / -16.9
5.2 / -5.7 -0.3 / -11.0
46.2 / 32.l 1.4 I -3.3
19.5 / 10.0 -6.9 I -16.2
27.8 I 17.2
-30.0 I -27.3
-4.7/-12.4
12.0 I 3.2 l.5 / -7.1
As stated, a nonparametric method is used to compare the distributions of Phase I against Phase II in order to indicate differences in the phases as product mature in their life cycle. The appropriate nonparametric method determined is the Wilcoxon rank sum test. This method does not specify the shape or type of probability distribution, but does require two conditions for a valid test (McClave, Benson and Sincich, 2008):
A. The two samples are random and independent B. The two probability distributions from which the samples are drawn are continuous
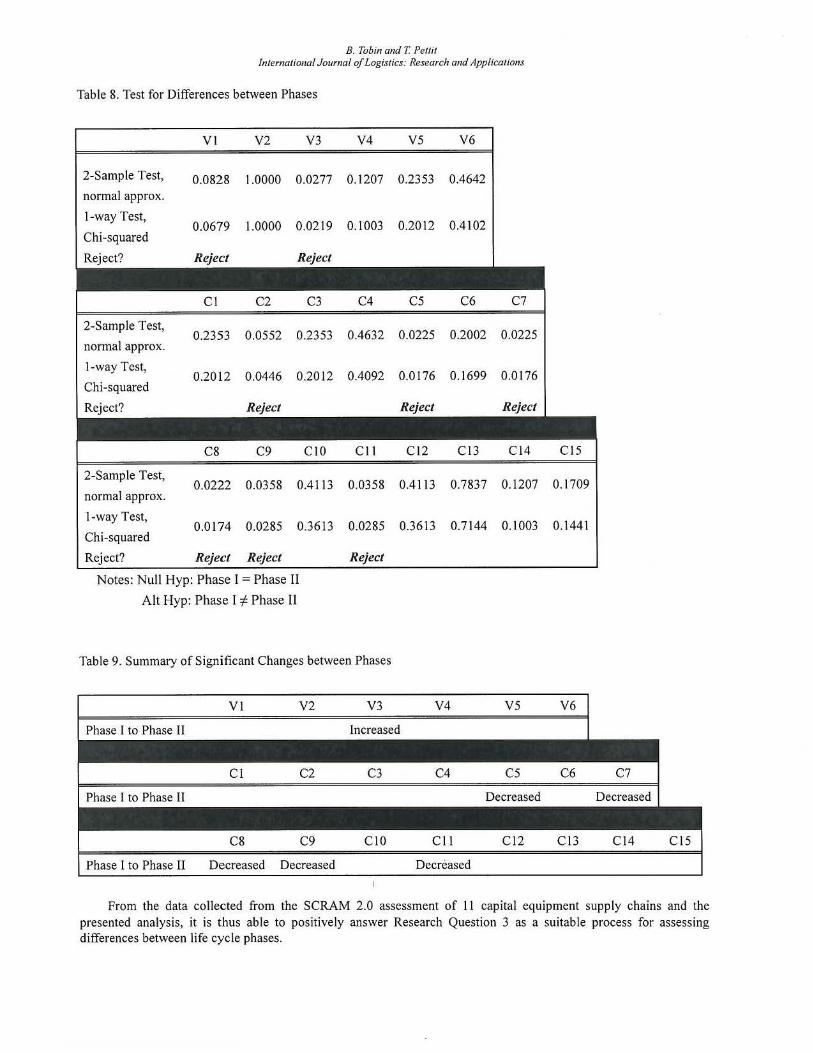
The Wilcoxon rank sum test also has the added effect of"moderating the influence of outliers" (Rice, 1995:403), and in applying each sample's average resilience gap (R) rather than an individual subject's capability or vulnerability rating, the variable is now continuous. The results are presented in Table 8, with both the 2-sample test with normal approximation and the I -way Chi-squared test in agreement for all cases. These tests identified two of the six vulnerability factors varied between Phase I and Phase ll at a confidence level of 90%, and six of the 15 capability factors varied between phases. Larger scale implementation is expected to increase the significance. Table 9 summarizes the factors and the direction of the change.
B. Tobin and T. Pel/it Jn1ema1ional Journal of Logistics: Research and Applicalions
Table 8. Test for Differences between Phases
Vl V2 V3 V4 V5 V6
2-Sample Test, 0.0828 1.0000 0.0277 0.1207 0.2353 0.4642 normal approx.
I-way Test, 0.0679 1.0000 0.0219 0.1003 0.2012 0.4102
Chi-squared
Reject? Reject Reject
Cl C2 C3 C4 C5 C6 C7
2-Sample Test, 0.2353 0.0552 0.2353 0.4632 0.0225 0.2002 0.0225
normal approx.
1-way Test, 0.2012 0.0446 0.2012 0.4092 0.0176 0.1699 0.0176
Chi-squared
Reject? Reject Reject Reject
C8 C9 CIO Cl l Cl2 C13 C14 Cl5
2-Sample Test, 0.0222 0.0358 0.4113 0.0358 0.4 113 0.7837 0.1207 0.1709
normal approx.
1-way Test, 0.0174 0.0285 0.3613 0.0285 0.3613 0.7144 0.1003 0.1441
Chi-squared
Reject? Reject Reject Reject
Notes: Null Hyp: Phase I = Phase II
Alt Hyp: Phase I -:f Phase II
Table 9. Summary of Significant Changes between Phases
Vl V2 V3 V4 V5 V6
Phase I to Phase II Increased
C8 C9 ClO Cl l Cl2 C13 Cl4 Cl5
Phase I to Phase II Decreased Decreased Decreased
From the data collected from the SCRAM 2.0 assessment of 11 capital equipment supply chains and the presented analysis, it is thus able to positively answer Research Question 3 as a suitable process for assessing differences between life cycle phases.
8. Tobin and T. Pell/I International Journal of logistics: Research and Applications
4. Discussion
Previous research presented opportunities for improvement with the supply chain risk management process for long-life, high-value assets. For these capital equipment supply chains, this research investigated literature in the field of supply chain resilience and identified the Supply Chain Resilience Assessment and Management (SCRAM) tool as an avenue for potential improvement in risk management efforts.
4.1 Research Questions
Based on the results of this study using SCRAM assessments within two well-defined phases of the product life cycle, the results support a positive answer to the overall research question: ls the SCRAM tool able to measure supply chain vulnerabilities and capabilities within the product's life cycle and provide useful feedback? Significant statistical differences were found, thus recommending this analysis process for implementation of the SCRAM tool. Though these results are not without limitations, the results show promise for the utility of supply chain resilience to enhance current supply chain risk management processes.
4.2 Managerial Implications
The SCRAM tool assessment results have shown in previous research that the assessment tool can identify an organization's current level of resilience by measuring the organization's supply chain vulnerabilities and capabilities (Pettit, Croxton and Fiksel, 2013). This research confirmed the ability to measure vulnerabilities and capabilities, and through statistical analysis, to identify an imbalance of specific vu lnerabilities and capabilities indicating resilience concerns toward either eroding profitability or operating in excessive risks. The results also extend previous research into the statistical comparison between life cycle phases of these capital equipment supply chains, which indicates that the tool can also be used to strategically plan for resilience changes as products mature. This information can provide supply chain leaders the ability to apply corrective measures based on resil ience constructs.
4.3 Future Research
There are many opportunities for improvement and future research in the field of supply chain resilience. A more targeted study of a capital equipment supply chain with a larger sample size would be beneficial. Additionally, the research could be expanded by dividing the product life cycles into more distinct phases to identify more differences as systems mature. Future research could explore the supply chain from not only the focal company's perspective, but also the suppliers and customers up and down the supply chain. Furthermore, a longitudinal study to follow multiple products as they mature will validate both the changes in resilience but also identify target portfolios of capability within specific life cycle phases. And finally, the opportunity to conduct cost analyses of supply chain resilience enhancements and their benefits would assist in future estimations of the return-on-investment for strategically managing supply chain resilience.
References
Air Force Life Cycle Management Center. (2013). A revolution in acquisition and product support. Retrieved from
www.wpatb.af.mil/shared/media/document/ AFD- 130523-047 .pdf.
Breen, B. & Aneiro, M. (2004). Living in Dell time. Fast Company, (88), 86-96.
Christopher, M. (1992). Logistics and supply chain management, London: Pitman Publishing.
Christopher, M. & Peck, H. (2004). Building the resilient supply chain. International Journal of Logistics
Management, 15(2), 1-13.
Cranfield University. (2002). Supply chain vulnerability: executive report, Bedford, UK: School of Business,
Cranfield University.
Cranfield University. (2003). Creating resilient supply chain: a practical guide. Bedford, UK: Centre for Logistics
and Supply Chain Management, Cranfield University.
Defense Acquisition University. (2009). Defense acquisition guidebook. Retrieved from
https:/ /akss.dau.m i l/dag/welcomc.asp.
8 . Tobin and T. Peuit international Journal of Logistics: Research and Applications
Department of Defense (2003), DoD supply chain materiel management regulation, DoD Regulation 4140.1.
Washington: Government Printing Office.
Department of Defense (2014). DoD supply chain materiel management procedures: operational requirements, DoD
Manual 4140.01, Volume 1. Washington: Government Printing Office.
de Winter, J.C. F. (2013). Using the Student's t-test with extremely small sample sizes. Practical Assessment,
Research & Evaluation, 18(10), 1-12.
Dillman, D. A. (2000). Mail and internet surveys: the tailored design method. New York: Wiley.
Fiksel, J. (2006). Sustainability and resilience: toward a systems approach. Sustainability: Science, Practice & Policy,
2(2), 1-8.
Folke, C., Carpenter, S., Walker, B., Scheffer, M., Elmqvist, T. & Gunderson, L. (2004). Regime shifts, resilience and
biodiversity in ecosystem management. Annual Review of Ecology, Evolution, & Systematics, 35(1), 557-581.
Gorman, C., Dale, S. S., Grossman, W., Klarreich, K., McDowell, J. & Whitaker, L. (2005). The importance of
resilience. Time Canada, 165(3), 76-79.
Griffis, S. E., Goldsby, T. J. & Cooper, M. (2003). Web based and mail surveys: a comparison of response, data and
cost. Journal of Business Logistics, 24(2), 237-258.
Kunreuther, H. (2006). Risk and reaction. Harvard International Review, 28(3), 37-42.
Jtittner, U. & Maklan, S. (2011). Supply chain resilience in the global financial crisis: an empirical study. Supply
Chain Management: an International Journal, 16(4), 246-259.
Lambert, 0 . M., Garcia-Dastugue, S. J., & Croxton, K. L. (2005). An evaluation of process-oriented supply chain
management frameworks. Journal of Business logistics, 26( 1 ), 25-51.
Manuele, F. A. (2005). Risk assessment and hierarchies of control. Professional Safety, 50(5), 33-39.
Manuj, I, & Mentzer, J. T. (2008). Global supply chain risk management strategies. international Journal of Physical
Distribution & l ogistics Management, 38(3), 192-223.
Maronick, T. (2009). The role of the internet in survey research: guidelines for researchers and experts. Journal of
Global Business and Technology, 5( 1 ), 18-15.
McClave, J. T., Benson, P. G., & Sincich, T. (2008). Statistics for business and economics. Pearson Education.
Mentzer, J. T., DeWitt, W., Keebler, J. , Soonhoong, M., Nix, N., Smith, C. & Zacharia, Z. (2001). Defining supply
chain management. Journal of Business logistics, 22(2), 1-25.
Merriam-Webster. (2007). Merriam-Webster dictionary, Springfield, MA: Merriam-Webster, Inc.
Peck, H. (2005). Drivers of supply chain vulnerability: an integrated framework. International Journal of Physical
Distribution & Logistics Management, 35(4), 210-232.
Pettit, T. J., Croxton, K. L. & Fiksel, J. (2013). Ensuring supply chain resilience: development and implementation of
an assessment tool. Journal of Business Logistics, 34(1), 46-76.
Pettit, T. J., Fiksel, J. & Croxton, K. L. (2010). Ensuring supply chain resilience: development ofa conceptual
framework. Journal of Business logistics, 3 I (I), 1-21.
Ponomarov, S. Y., & Holcomb, M. C. (2009). Understanding the concept of supply chain resilience. International
Journal of Logistics Management, 20(1), 124-143.
Pon is, S. T., & Koronis, E. (2012). Supply chain resilience: definition of concept and its fonnative elements. Journal
of Applied Business Research, 28(5), 921-930.
Rice, J. A. ( 1995). Mathematical statistics and data analysis, 2"d Ed., Belmont: Duxbury Press.
Rice Jr., J.B . & Caniato, F. (2003). Building a secure and resilient supply network. Supply Chain Management
Review, 7(5), 22-30.
8. Tobin and T. Pel/it /11/ernational Journal of logistics: Research and Applications
Russell, S. H. (2007). Supply chain management: more than integrated logistics. Air Force Journal of logistics,
3 /(2), 56-63.
Sheffi, Y. (2005a). Building a resilient supply chain. Harvard Business Review, I (8), 1-4.
Sheffi, Y. (2005b). The resilient enterprise: overcoming vulnerability for competitive advantage. Cambridge, MA:
MIT Press.
Stock, J. R., & Boyer, S. L. (2009). Developing a consensus definition of supply chain management: A qualitative
study. International Journal of Physical Distribution & Logistics Management, 39(8), 690-71 1.
Stoltz, P. G. (2004). Building resilience for uncertain times. leader to leader, Winter 2004(31), 16-20.
The Ohio State University (2009). Ohio State secures Dow Chemical to sponsor global supply chain resilience
research program. News Advisory. Retrieved from
http: //www.resi I ience. osu. edu/C FR-site/pd f/Dow _ Resi I ience. pd f.
VanderBok, R., Sauter J. A., Bryan, C. & Horan, J. (2007). Manage your supply chain risk. Manufacturing
Engineering, 138(3), 153- 161.


![Manual Tehnic - BLACK SEA SUPPLIERS chiller... · 2 Aplica\ii ]i avantaje Bicold ENGINEERING SRL ofer` o serie complet` de unit`\i pentru sistem centralizat de r`cire aer cu puteri](https://img.pdfslide.us/doc/110x75/5e656794e8068d0ecc4dfca0/manual-tehnic-black-sea-chiller-2-aplicaii-i-avantaje-bicold-engineering.jpg)