Embed Size (px)
Citation preview
Validation of the AERMOD Dispersion Model:Application to Congener-Specific Deposition from
an Incinerator in Midland, Michigan
Trinh H., Goovaerts P., Gwinn D., Demond A., Towey T.,and Adriaens P.
The University of Michigan Dioxin Exposure Study
The University of Michigan, Ann Arbor, MI, USASchool of Public Health
Institute for Social ResearchCollege of Engineering
Center for Statistical Consultation & ResearchPGeostat
August 27, 2009
University of Michigan Dioxin Exposure Study August 27, 2009Slide 2
Financial support for this study comes from The Dow ChemicalCompany through an unrestricted grant to the University ofMichigan.
The University of Michigan has complete independence to design,carry out, and report the results of the study.
The investigators report to an independent Scientific AdvisoryBoard (Dr. Linda Birnbaum, EPA; Dr. Marie Sweeney, NIOSH;Prof. Ronald Hites, Indiana University; Dr. Paolo Boffeta, IARC)
University of Michigan Dioxin Exposure Study Slide 2
University of Michigan Dioxin Exposure Study August 27, 2009Slide 3
Background
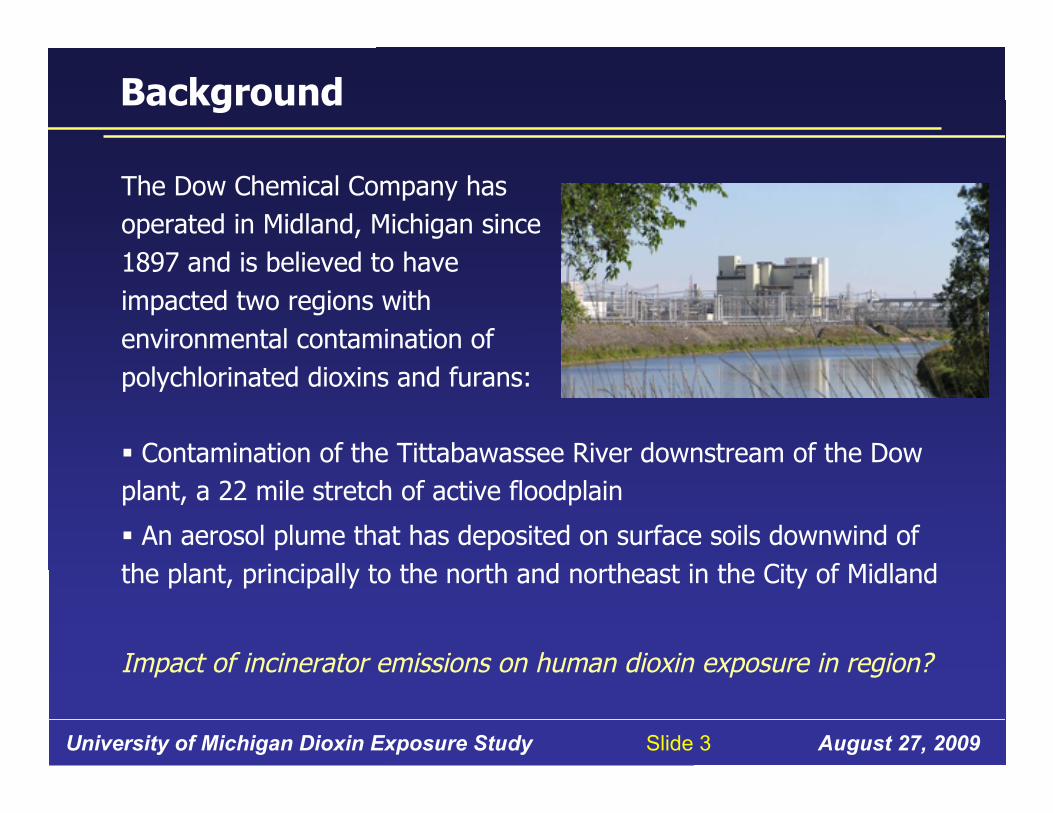
The Dow Chemical Company hasoperated in Midland, Michigan since1897 and is believed to haveimpacted two regions withenvironmental contamination ofpolychlorinated dioxins and furans:
Contamination of the Tittabawassee River downstream of the Dowplant, a 22 mile stretch of active floodplain
An aerosol plume that has deposited on surface soils downwind ofthe plant, principally to the north and northeast in the City of Midland
Impact of incinerator emissions on human dioxin exposure in region?
University of Michigan Dioxin Exposure Study August 27, 2009Slide 4
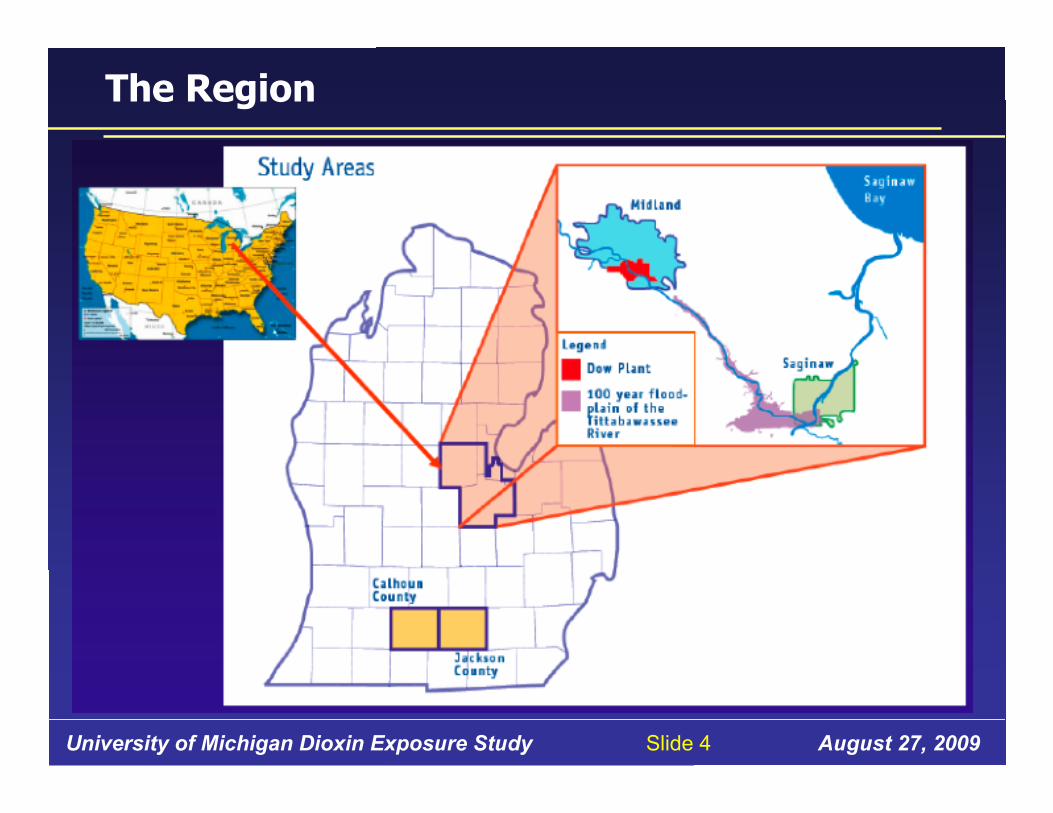
The Region
University of Michigan Dioxin Exposure Study August 27, 2009Slide 5
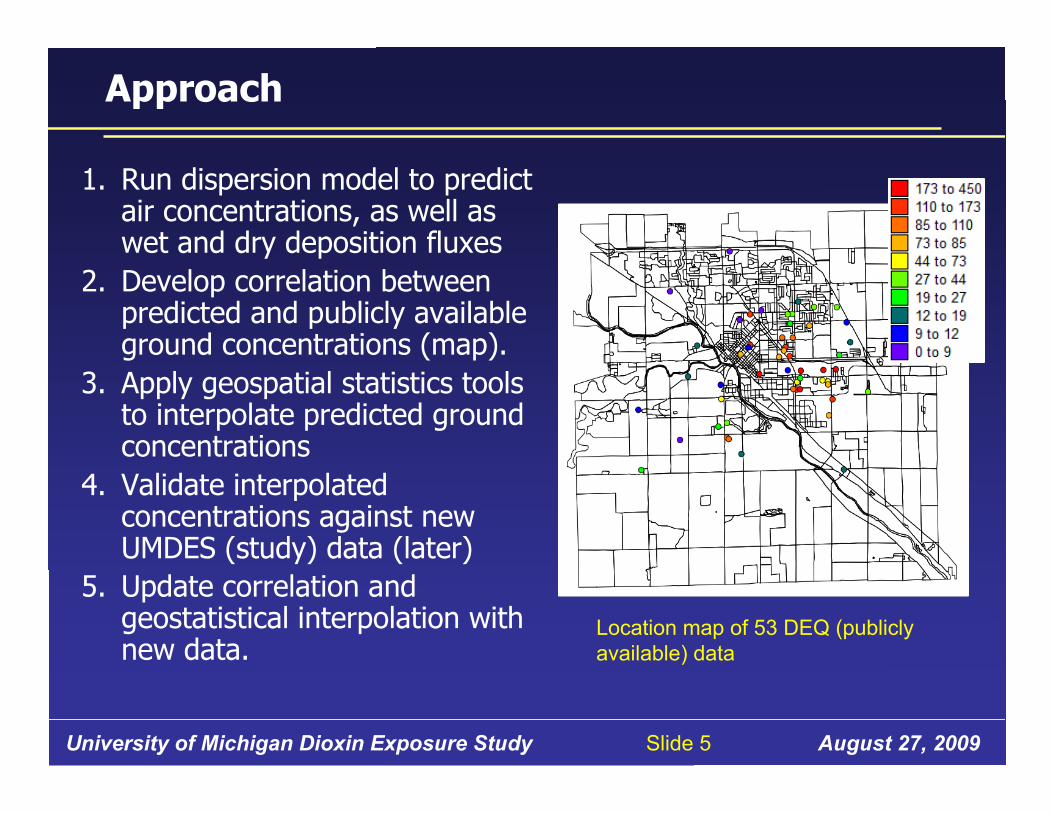
Approach
1. Run dispersion model to predictair concentrations, as well aswet and dry deposition fluxes
2. Develop correlation betweenpredicted and publicly availableground concentrations (map).
3. Apply geospatial statistics toolsto interpolate predicted groundconcentrations
4. Validate interpolatedconcentrations against newUMDES (study) data (later)
5. Update correlation andgeostatistical interpolation withnew data.
Location map of 53 DEQ (publiclyavailable) data
University of Michigan Dioxin Exposure Study August 27, 2009Slide 6
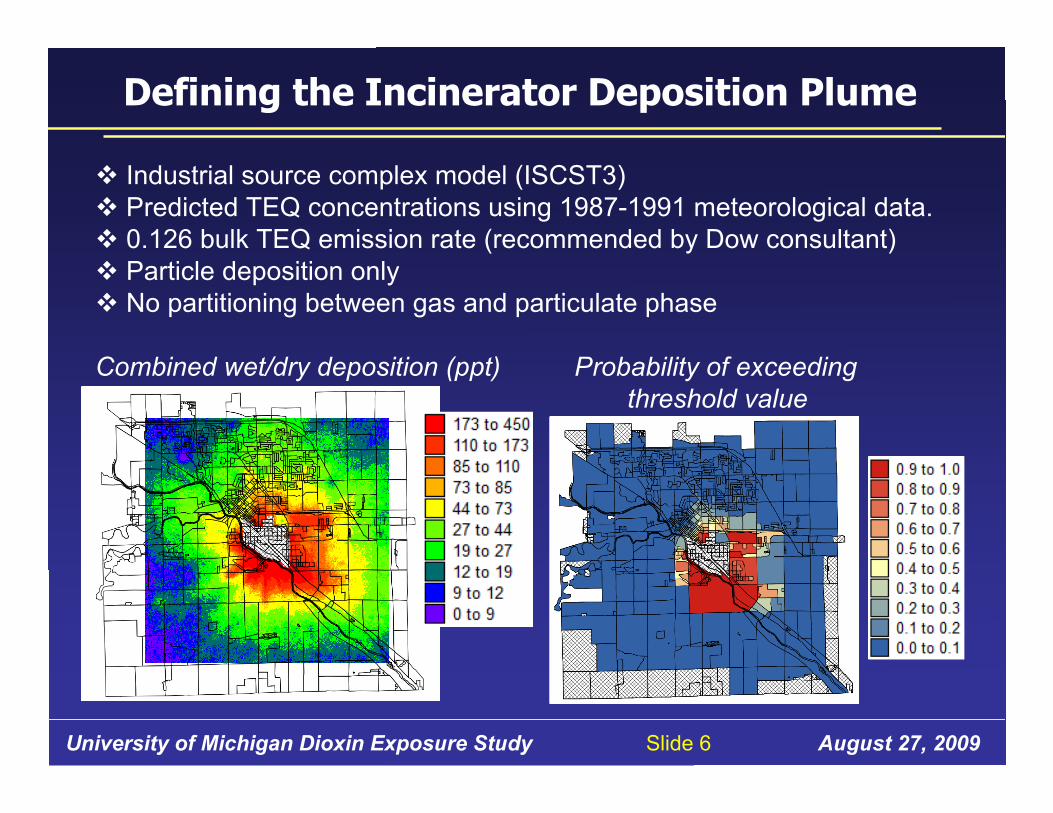
Defining the Incinerator Deposition Plume
Industrial source complex model (ISCST3) Predicted TEQ concentrations using 1987-1991 meteorological data. 0.126 bulk TEQ emission rate (recommended by Dow consultant) Particle deposition only No partitioning between gas and particulate phase
Combined wet/dry deposition (ppt) Probability of exceeding threshold value
University of Michigan Dioxin Exposure Study August 27, 2009Slide 7Slide 7
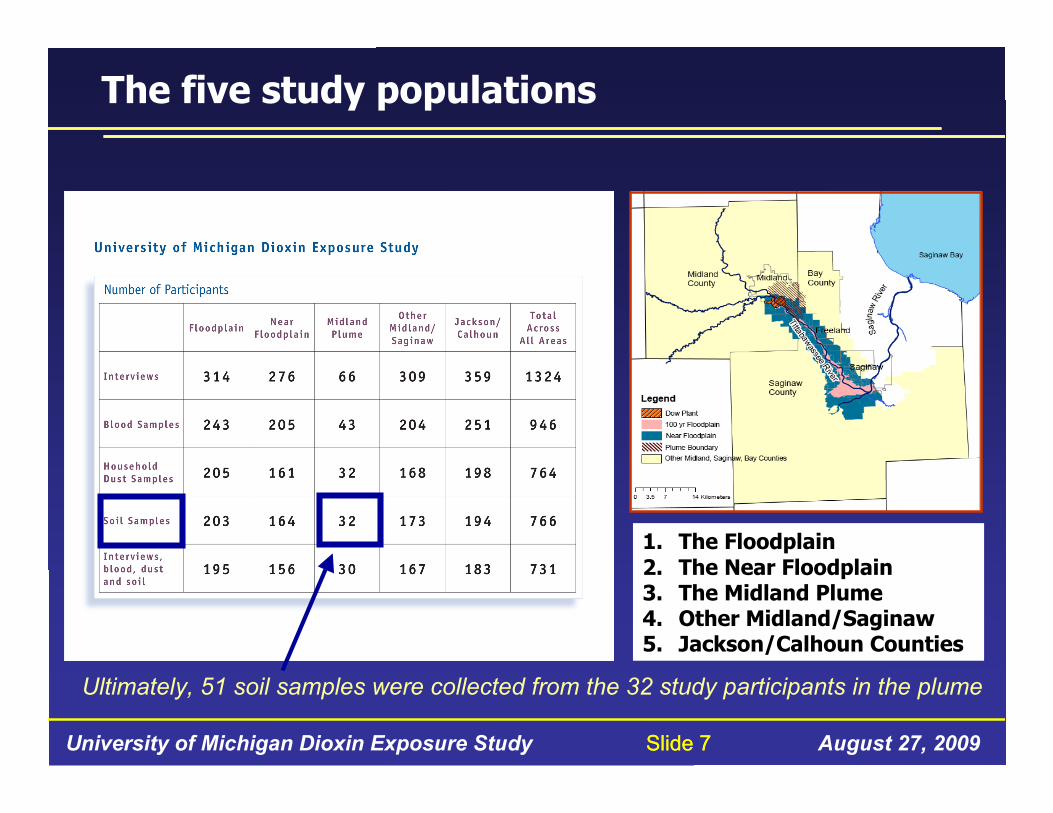
The five study populations
1. The Floodplain2. The Near Floodplain3. The Midland Plume4. Other Midland/Saginaw5. Jackson/Calhoun Counties
Ultimately, 51 soil samples were collected from the 32 study participants in the plume
University of Michigan Dioxin Exposure Study August 27, 2009Slide 8
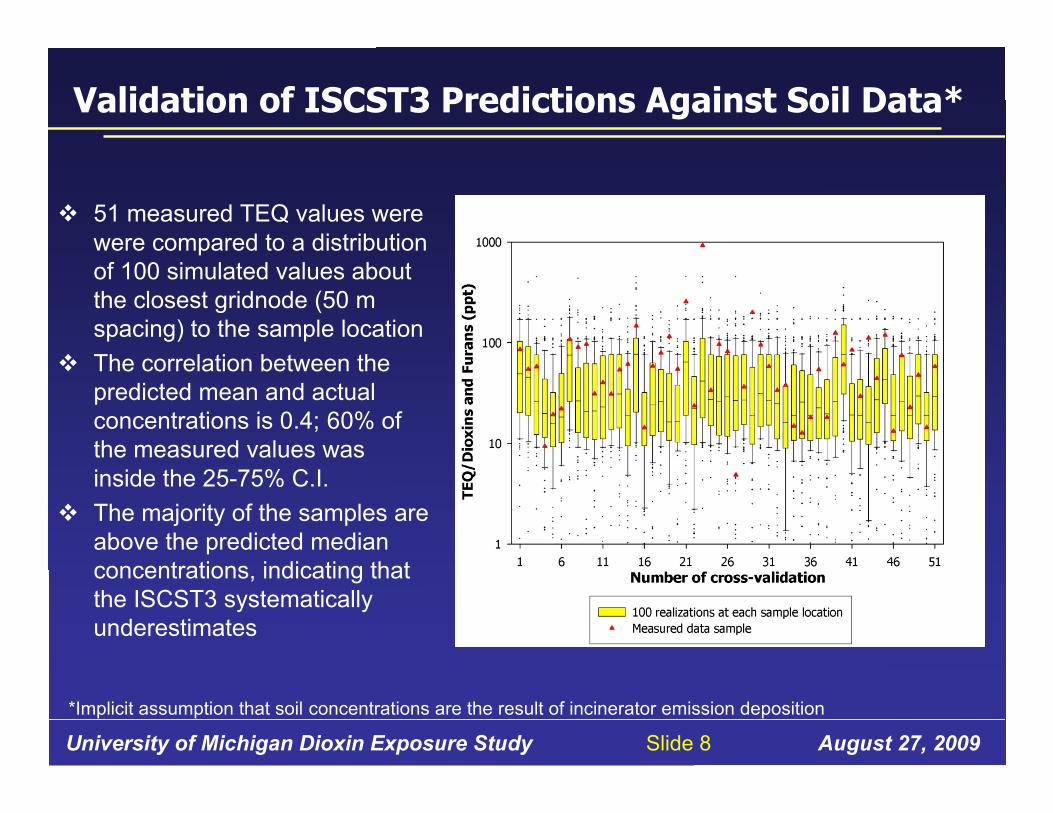
Validation of ISCST3 Predictions Against Soil Data*
51 measured TEQ values werewere compared to a distributionof 100 simulated values aboutthe closest gridnode (50 mspacing) to the sample location
The correlation between thepredicted mean and actualconcentrations is 0.4; 60% ofthe measured values wasinside the 25-75% C.I.
The majority of the samples areabove the predicted medianconcentrations, indicating thatthe ISCST3 systematicallyunderestimates
*Implicit assumption that soil concentrations are the result of incinerator emission deposition
University of Michigan Dioxin Exposure Study August 27, 2009Slide 9
AERMOD versus ISCST3
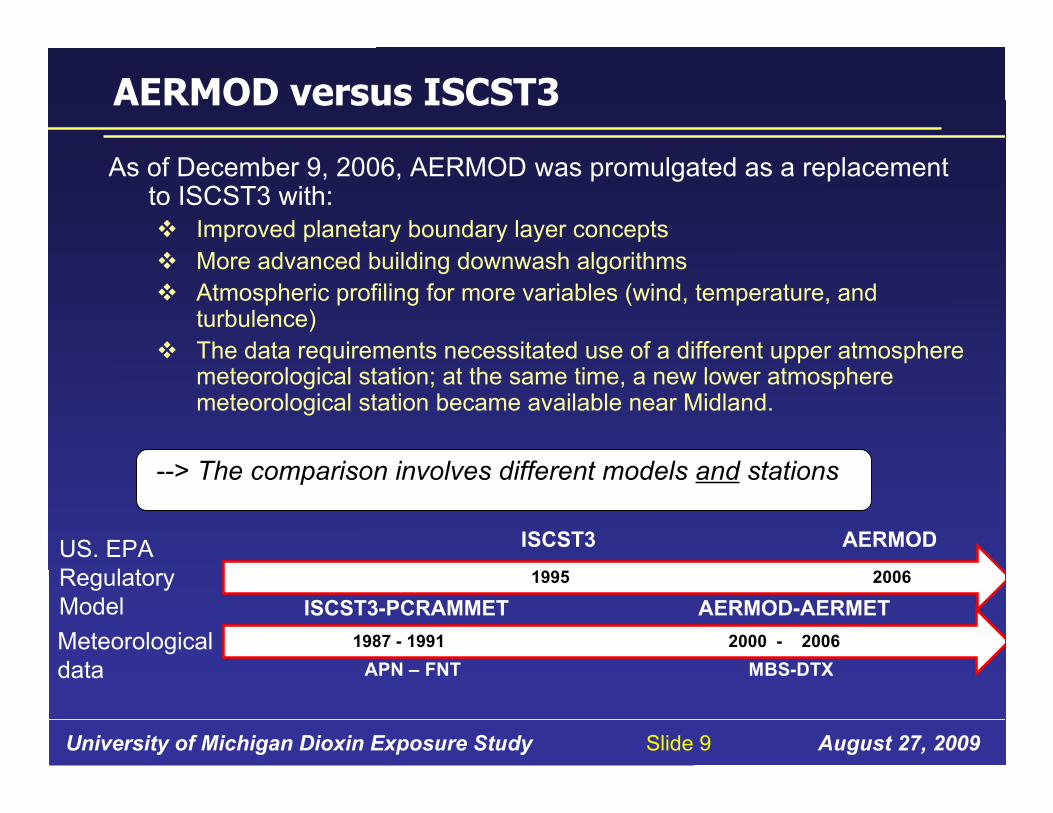
As of December 9, 2006, AERMOD was promulgated as a replacementto ISCST3 with: Improved planetary boundary layer concepts More advanced building downwash algorithms Atmospheric profiling for more variables (wind, temperature, and
turbulence) The data requirements necessitated use of a different upper atmosphere
meteorological station; at the same time, a new lower atmospheremeteorological station became available near Midland.
--> The comparison involves different models and stations
US. EPARegulatoryModel
1983 1984 1987 1991 1992 1995 1996 2000 2001 2002 2004 2006 2009
ISCST3 AERMOD
Meteorologicaldata
1983 1984 1987 - 1991 1992 1995 1996 2000 - 2006 2009
ISCST3-PCRAMMET AERMOD-AERMET
APN – FNT MBS-DTX
University of Michigan Dioxin Exposure Study August 27, 2009Slide 10
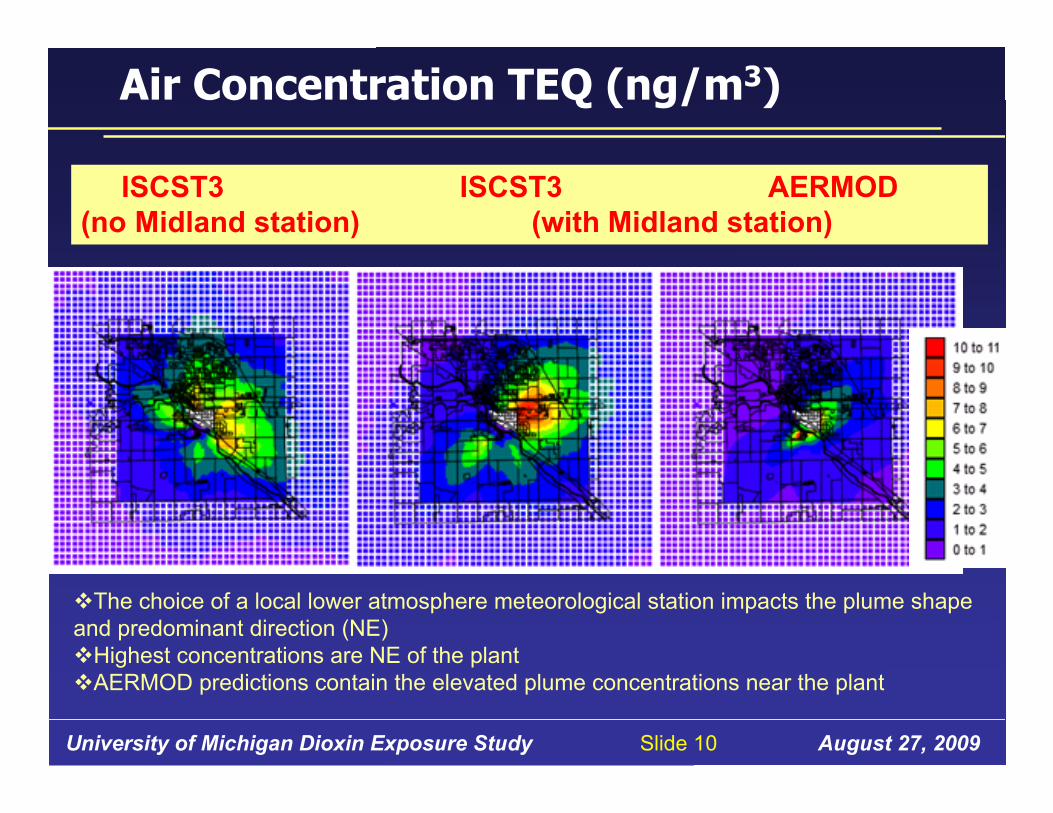
Air Concentration TEQ (ng/m3)
ISCST3 ISCST3 AERMOD(no Midland station) (with Midland station)
The choice of a local lower atmosphere meteorological station impacts the plume shapeand predominant direction (NE)Highest concentrations are NE of the plantAERMOD predictions contain the elevated plume concentrations near the plant
University of Michigan Dioxin Exposure Study August 27, 2009Slide 11
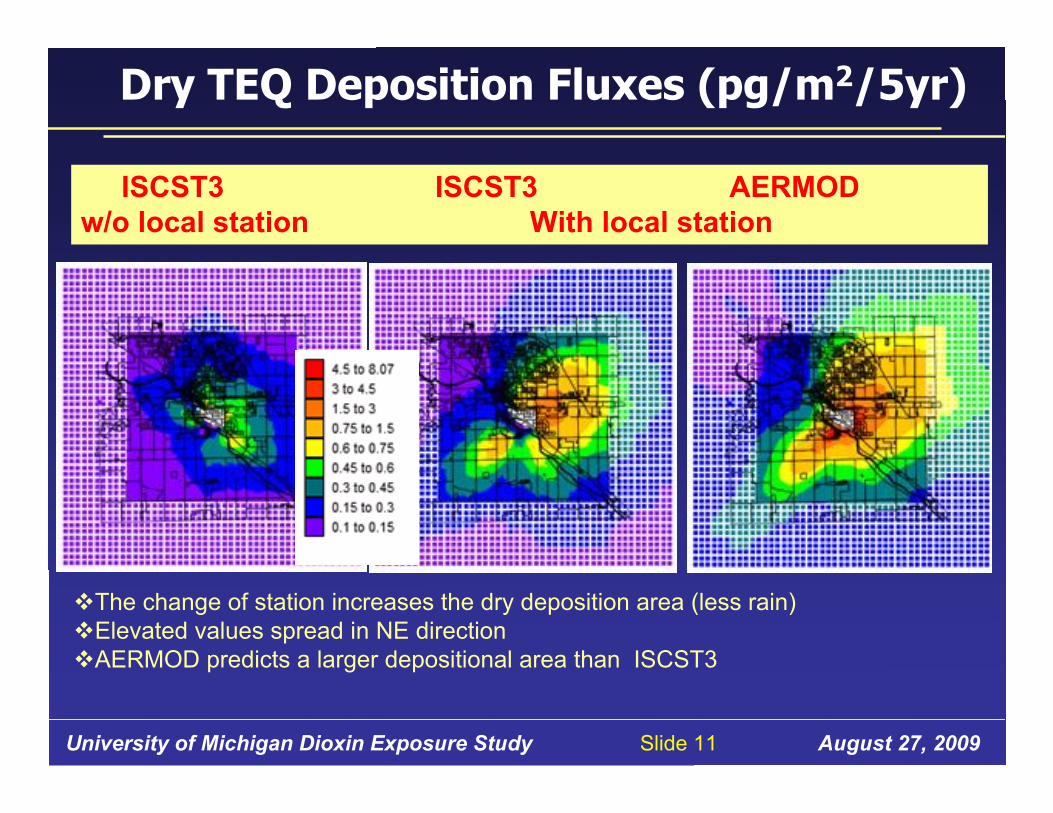
Dry TEQ Deposition Fluxes (pg/m2/5yr)
ISCST3 ISCST3 AERMODw/o local station With local station
The change of station increases the dry deposition area (less rain)Elevated values spread in NE directionAERMOD predicts a larger depositional area than ISCST3
University of Michigan Dioxin Exposure Study August 27, 2009Slide 12
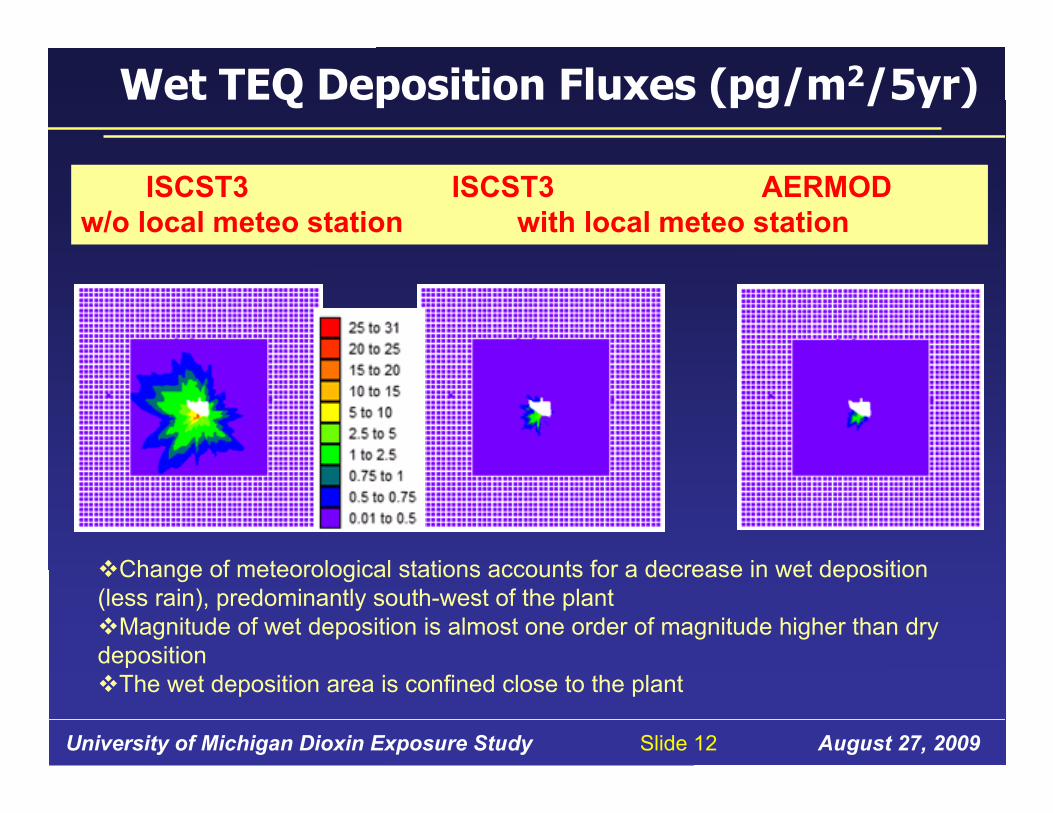
Wet TEQ Deposition Fluxes (pg/m2/5yr)
ISCST3 ISCST3 AERMODw/o local meteo station with local meteo station
Change of meteorological stations accounts for a decrease in wet deposition(less rain), predominantly south-west of the plantMagnitude of wet deposition is almost one order of magnitude higher than drydepositionThe wet deposition area is confined close to the plant
University of Michigan Dioxin Exposure Study August 27, 2009Slide 13
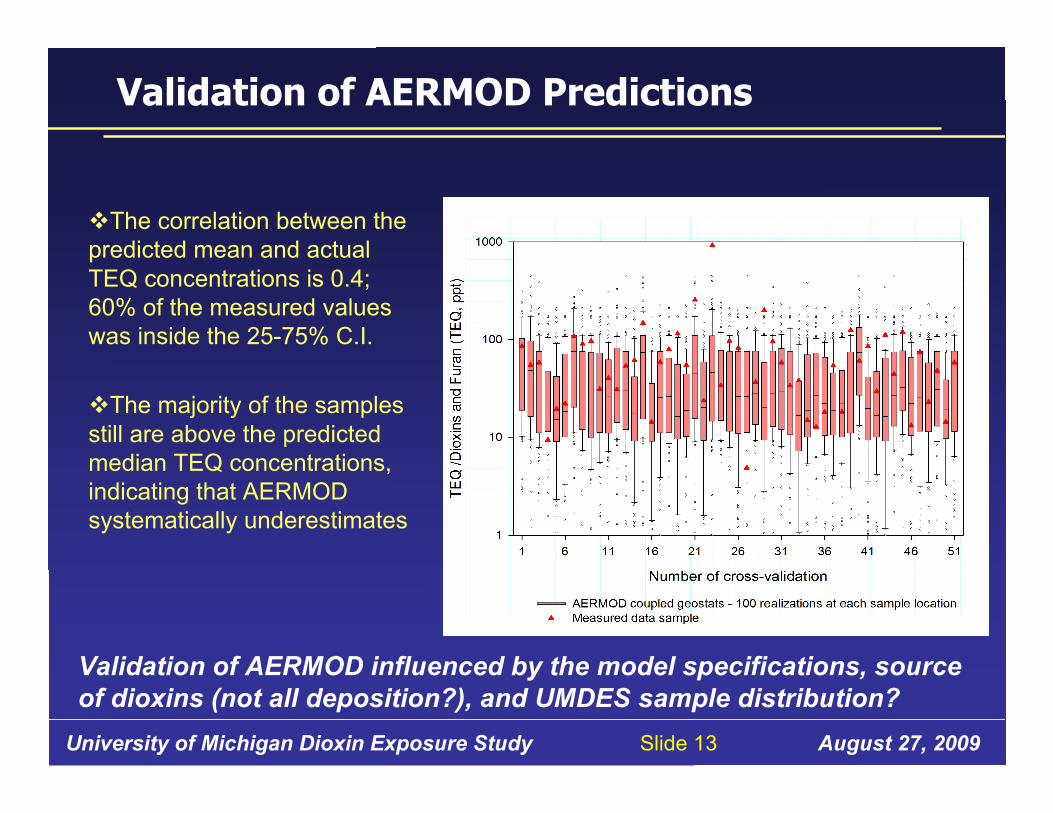
Validation of AERMOD Predictions
The correlation between thepredicted mean and actualTEQ concentrations is 0.4;60% of the measured valueswas inside the 25-75% C.I.
The majority of the samplesstill are above the predictedmedian TEQ concentrations,indicating that AERMODsystematically underestimates
Validation of AERMOD influenced by the model specifications, sourceof dioxins (not all deposition?), and UMDES sample distribution?
University of Michigan Dioxin Exposure Study August 27, 2009Slide 14
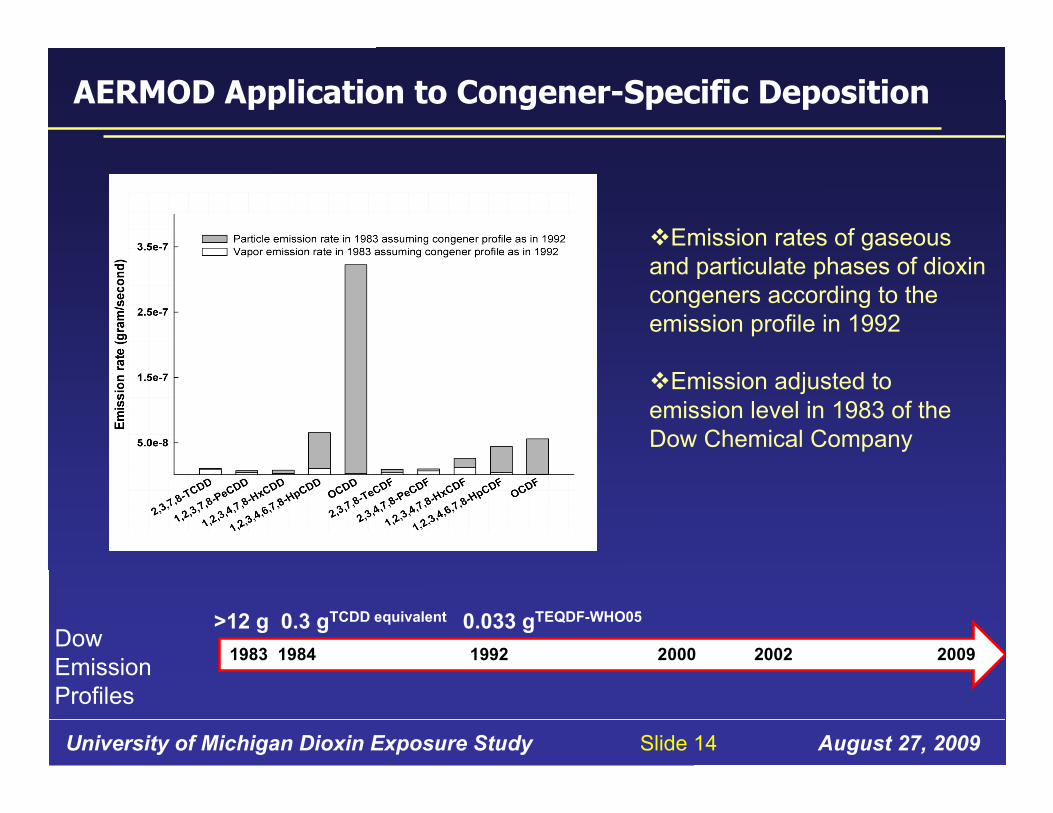
AERMOD Application to Congener-Specific Deposition
DowEmissionProfiles
1983 1984 1987 1991 1992 1995 1996 2000 2001 2002 2004 2006 2009
>12 g 0.3 gTCDD equivalent 0.033 gTEQDF-WHO05
Emission rates of gaseousand particulate phases of dioxincongeners according to theemission profile in 1992
Emission adjusted toemission level in 1983 of theDow Chemical Company
University of Michigan Dioxin Exposure Study August 27, 2009Slide 15
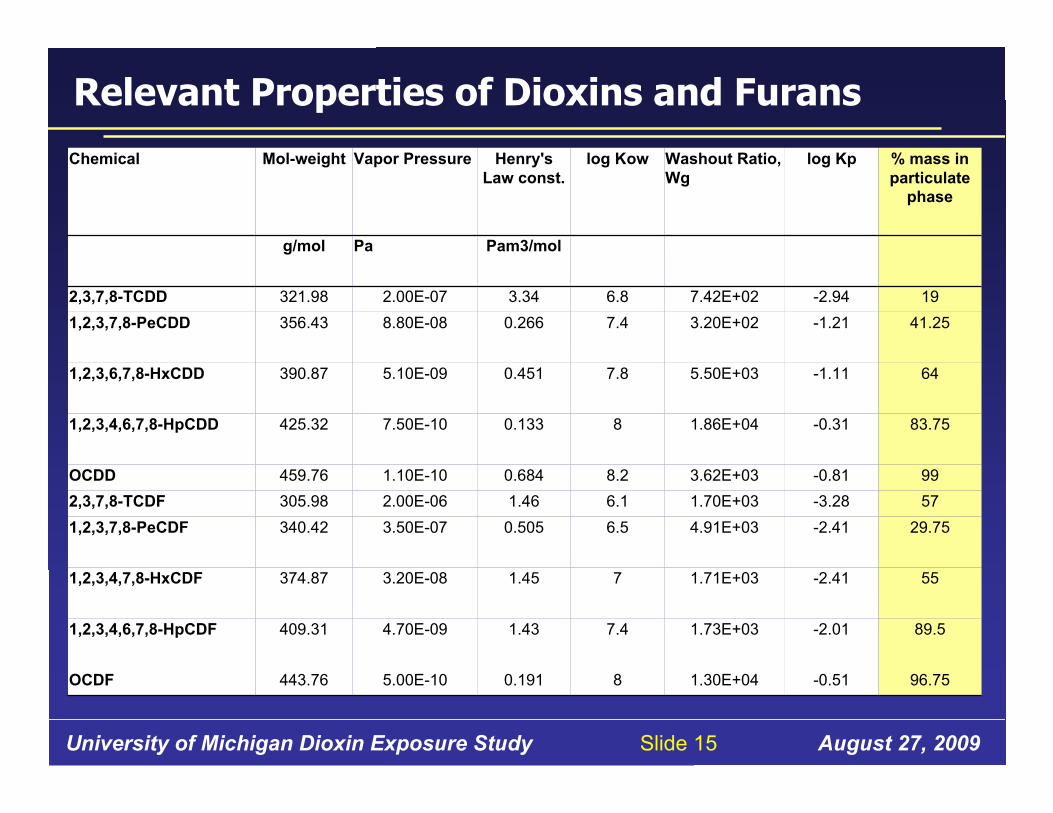
Relevant Properties of Dioxins and Furans
Chemical Mol-weight Vapor Pressure Henry'sLaw const.
log Kow Washout Ratio,Wg
log Kp % mass inparticulate
phase
g/mol Pa Pam3/mol
2,3,7,8-TCDD 321.98 2.00E-07 3.34 6.8 7.42E+02 -2.94 191,2,3,7,8-PeCDD 356.43 8.80E-08 0.266 7.4 3.20E+02 -1.21 41.25
1,2,3,6,7,8-HxCDD 390.87 5.10E-09 0.451 7.8 5.50E+03 -1.11 64
1,2,3,4,6,7,8-HpCDD 425.32 7.50E-10 0.133 8 1.86E+04 -0.31 83.75
OCDD 459.76 1.10E-10 0.684 8.2 3.62E+03 -0.81 992,3,7,8-TCDF 305.98 2.00E-06 1.46 6.1 1.70E+03 -3.28 571,2,3,7,8-PeCDF 340.42 3.50E-07 0.505 6.5 4.91E+03 -2.41 29.75
1,2,3,4,7,8-HxCDF 374.87 3.20E-08 1.45 7 1.71E+03 -2.41 55
1,2,3,4,6,7,8-HpCDF 409.31 4.70E-09 1.43 7.4 1.73E+03 -2.01 89.5
OCDF 443.76 5.00E-10 0.191 8 1.30E+04 -0.51 96.75
University of Michigan Dioxin Exposure Study August 27, 2009Slide 16
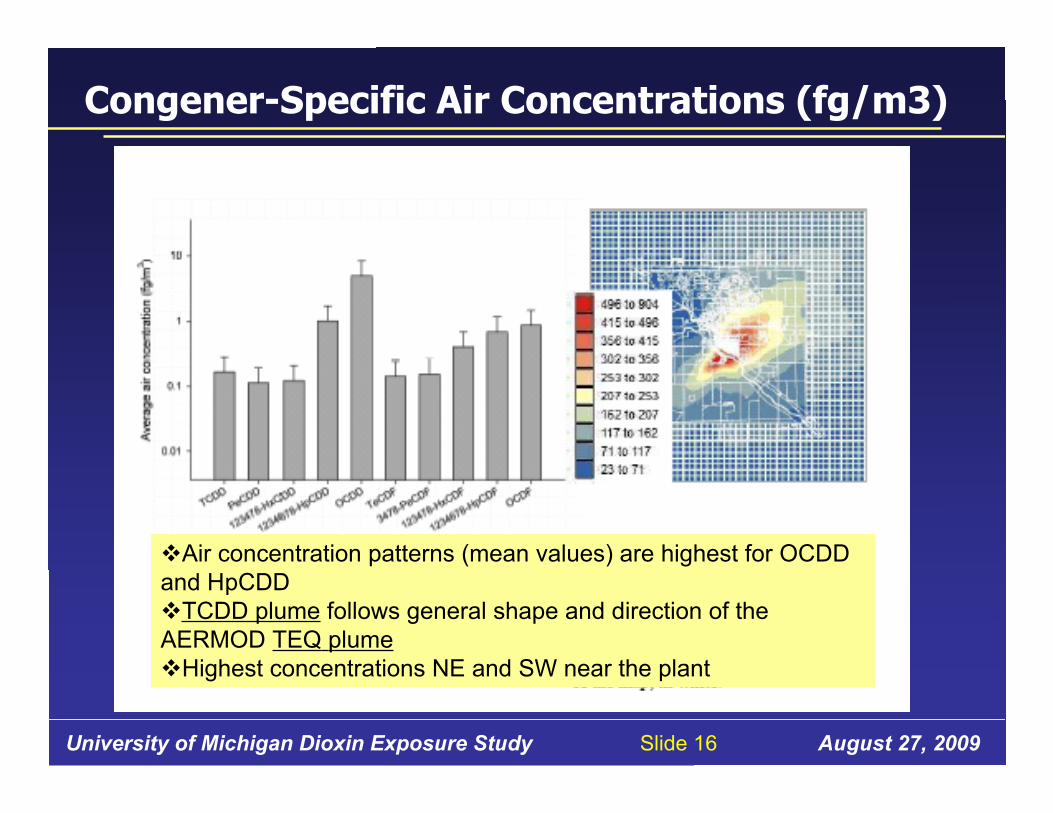
Congener-Specific Air Concentrations (fg/m3)
Air concentration patterns (mean values) are highest for OCDDand HpCDDTCDD plume follows general shape and direction of theAERMOD TEQ plumeHighest concentrations NE and SW near the plant
University of Michigan Dioxin Exposure Study August 27, 2009Slide 17
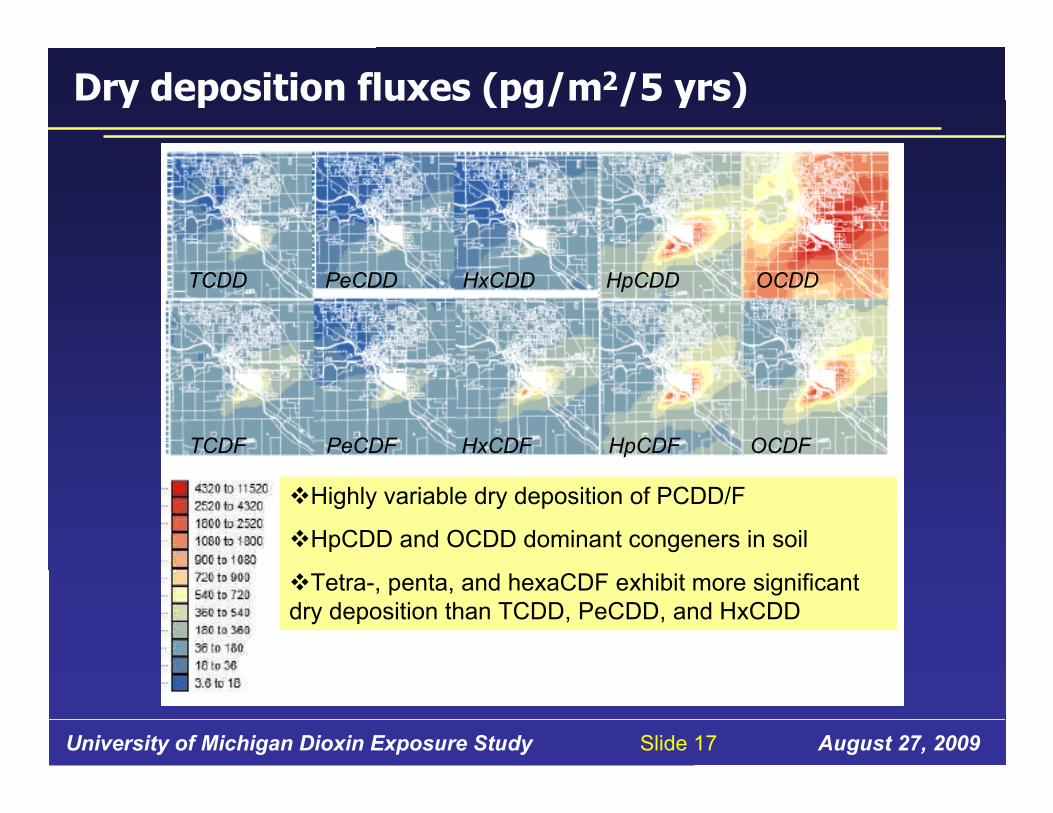
Dry deposition fluxes (pg/m2/5 yrs)
TCDD PeCDD HxCDD HpCDD OCDD
TCDF PeCDF HxCDF HpCDF OCDF
Highly variable dry deposition of PCDD/F
HpCDD and OCDD dominant congeners in soil
Tetra-, penta, and hexaCDF exhibit more significantdry deposition than TCDD, PeCDD, and HxCDD
University of Michigan Dioxin Exposure Study August 27, 2009Slide 18
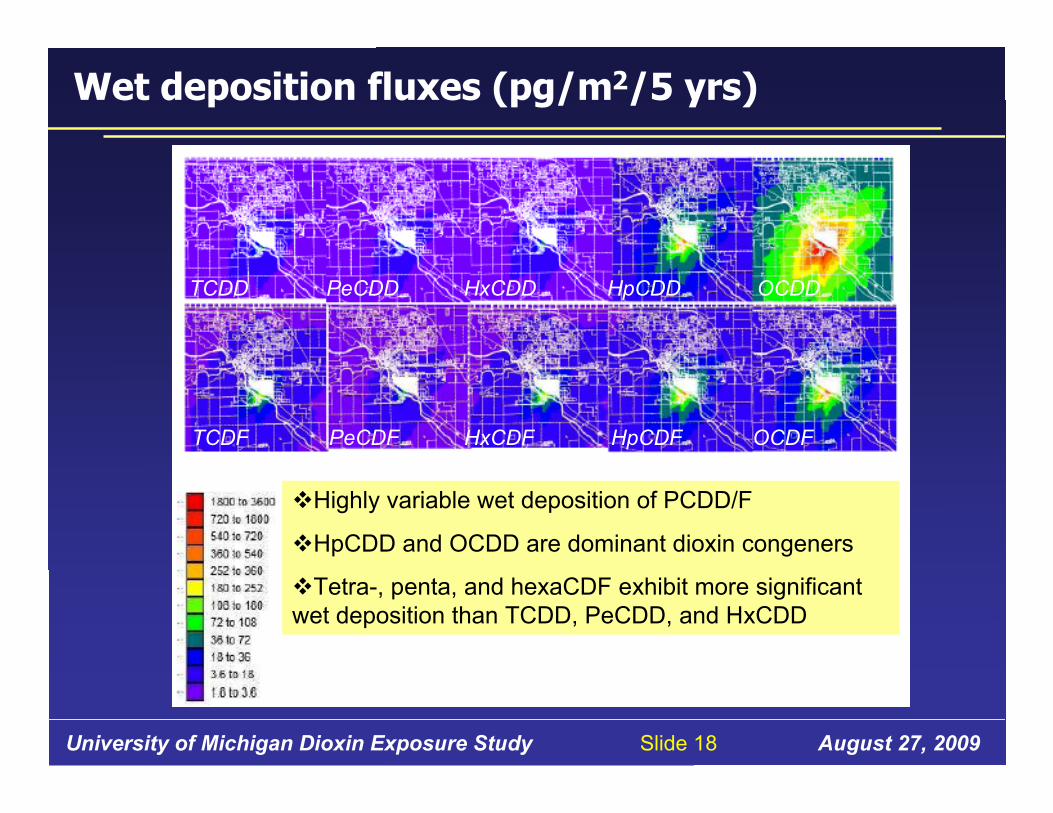
Wet deposition fluxes (pg/m2/5 yrs)
TCDD PeCDD HxCDD HpCDD OCDD
TCDF PeCDF HxCDF HpCDF OCDF
Highly variable wet deposition of PCDD/F
HpCDD and OCDD are dominant dioxin congeners
Tetra-, penta, and hexaCDF exhibit more significantwet deposition than TCDD, PeCDD, and HxCDD
University of Michigan Dioxin Exposure Study August 27, 2009Slide 19
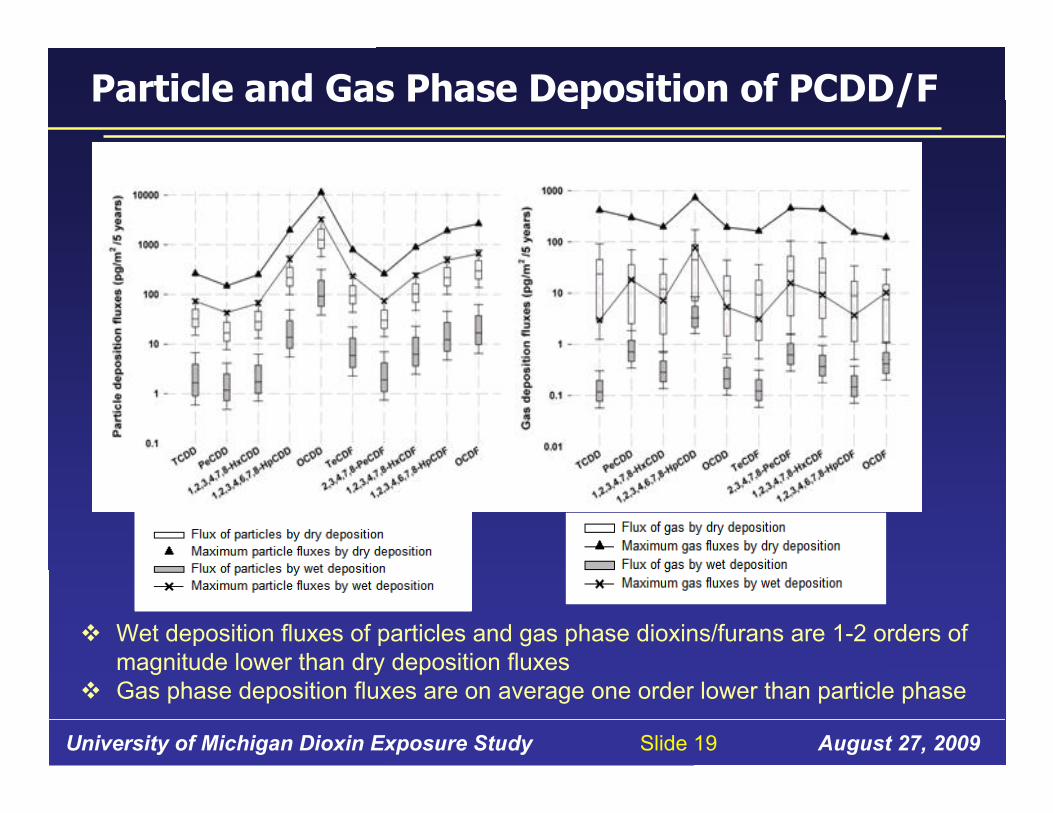
Wet deposition fluxes of particles and gas phase dioxins/furans are 1-2 orders ofmagnitude lower than dry deposition fluxes
Gas phase deposition fluxes are on average one order lower than particle phase
Particle and Gas Phase Deposition of PCDD/F
University of Michigan Dioxin Exposure Study August 27, 2009Slide 20
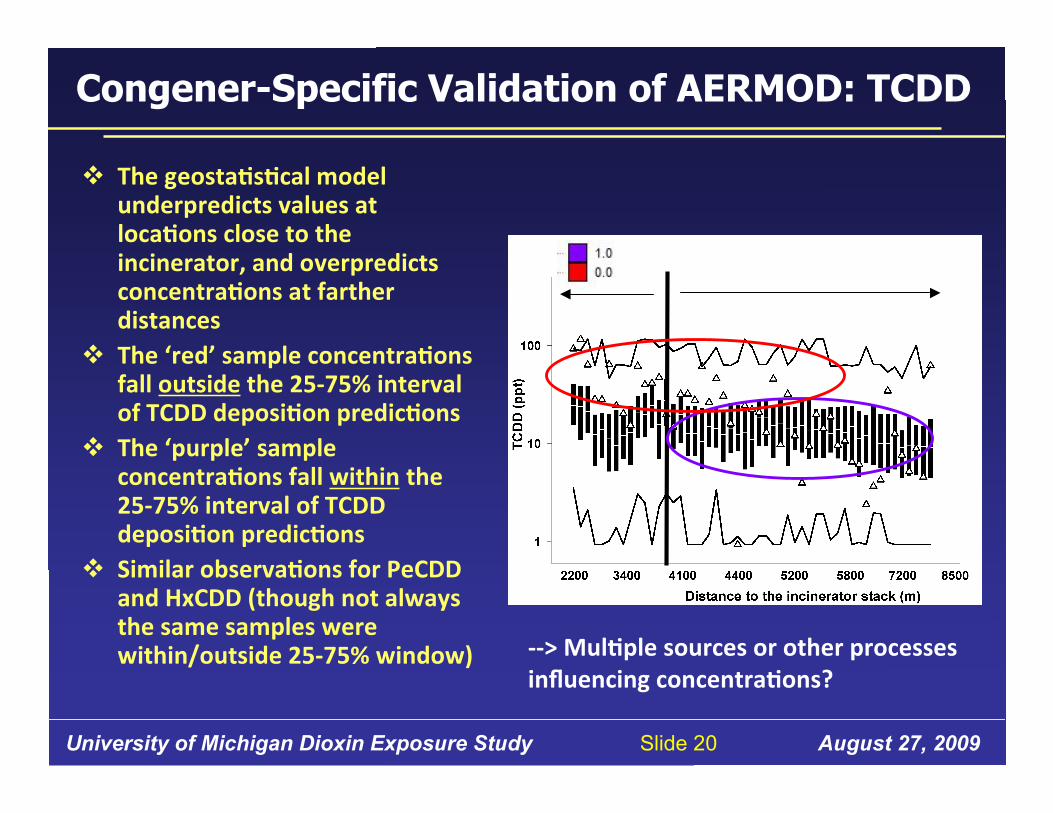
Congener-Specific Validation of AERMOD: TCDD
Thegeosta*s*calmodelunderpredictsvaluesatloca*onsclosetotheincinerator,andoverpredictsconcentra*onsatfartherdistances
The‘red’sampleconcentra*onsfalloutsidethe25‐75%intervalofTCDDdeposi*onpredic*ons
The‘purple’sampleconcentra*onsfallwithinthe25‐75%intervalofTCDDdeposi*onpredic*ons
Similarobserva*onsforPeCDDandHxCDD(thoughnotalwaysthesamesampleswerewithin/outside25‐75%window)
‐‐>Mul*plesourcesorotherprocessesinfluencingconcentra*ons?
University of Michigan Dioxin Exposure Study August 27, 2009Slide 21
Conclusions
In AERMOD, dry deposition is the main removal pathway for PCDD/F.
Differences in model predictions of air concentration are due to modelspecification and location of meteorological stations.
Wet and dry deposition fluxes predictions are governed strongly by theavailability of meteorological data, and on-site topography.
The validation of predicted AERMOD TEQ concentrations against available soildata does not improve over ISCST3, despite better process/meteorologicalspecifications in AERMOD.
Congener-specific deposition shows considerable variability, largely governedby vapor/particle distributions of the congeners
Validation of congener-specific deposition against TCDD data impacted bysamples availability and presence of multiple sources.
Caution should be exercised in the interpretation of deposition models if validationdata are limited and multiple contaminant sources are likely present


![Evaluating the impacts of SO emissions from power stations ... · measurements. Kho et al. [15] used the ISC-AERMOD dispersion model to predict air dispersion plumes from a diesel](https://img.pdfslide.us/doc/110x75/6094cd9c30fcea0f817f3a3d/evaluating-the-impacts-of-so-emissions-from-power-stations-measurements-kho.jpg)