Embed Size (px)
Citation preview
GEORGE BROWN COLLEGE
Vacuum Cooling Bread Optimizing vacuum cooling for Rudolph’s Bakery
Presented to
Rudolph’s Bakeries Ltd. George Brown College
Ontario Centres of Excellence
By: Paulo Ejay Boongaling and Kit Zhou 5/21/2008
Technical advisor: Professor John Camarda
Abstract Vacuum cooling is a rapid evaporative cooling technique, which is achieved through evaporating part of the moisture of a product by the creation of a vacuum. The vacuum cooling of breads requires that the pressure reduction rate be precisely controlled to avoid any adverse effect caused by the build up of pressure in areas of low vapour permeability. This means that the less permeable a type of bread is the slower the vacuum cooling process would have to be. As the cooling time becomes longer the advantages of using vacuuming becomes less. This paper proposes the possibility of simulating the behaviour of the pressure during vacuum cooling mathematically in order to control the pressure more precisely and to provide optimal pressure reduction rate. In addition this paper proposes two additional methods in controlling the pressure uild up; however they would require modifications to the current vacuum cooling setup at udolph’s.
bR
Table of Contents 1 List of Figures ......................................................................................................................... 4
2 List of Tables .......................................................................................................................... 4
3 Introduction............................................................................................................................. 6
3.1 Vacuum cooling ............................................................................................................... 6
3.2 Rudolph’s Bakeries Ltd.................................................................................................... 7
3.3 Rudolph’s vacuum cooler................................................................................................. 9
4 Vacuum cooling bread .......................................................................................................... 13
4.1 Mathematical modeling of pressure reduction rate ........................................................ 17
5 Experimentation.................................................................................................................... 20
5.1 Experiment guideline ..................................................................................................... 20
5.2 Proposed Experiment ..................................................................................................... 20
5.2.1 Activities ................................................................................................................. 25
5.2.2 Resource.................................................................................................................. 26
5.2.3 Cost ......................................................................................................................... 27
5.2.4 Expected outcomes ................................................................................................. 27
6 Additional suggested solutions ............................................................................................. 28
6.1 Method 1 ........................................................................................................................ 29
6.2 Method 2 ........................................................................................................................ 29
6.3 Applying and testing ...................................................................................................... 30
2
7 Conclusion ............................................................................................................................ 30
8 References............................................................................................................................. 31
3

1 List of Figures
Figure 1 - Production Timeline with conventional cooling............................................................ 8
Figure 2 - Production Timeline with vacuum cooling.................................................................... 8
Figure 3 - Vacuum Cooler ............................................................................................................ 10
Figure 4 - Cooler cycles................................................................................................................ 12
Figure 5 - Stress during vacuum cooling ...................................................................................... 14
Figure 6 - A (1 Bayrische) vs. Exponential decay function.......................................................... 18
Figure 7 - A/B vs. Exponential decay function............................................................................. 18
Figure 8 - Initial pressure reduction rate for vacuum time from 0.5 to 25 minutes...................... 20
Figure 9 - exponential decay function at corresponding process variable (valve opening).......... 22
Figure 10 - Stress of proposed solution ........................................................................................ 23
Figure 11 - Exponential decay function vs. proposed solution..................................................... 23
Figure 12 - Maximum pressure reduction rate.............................................................................. 24
Figure 13 – Decreasing maximum stress and stress of proposed solution ................................... 24
Figure 14 - Test setup ................................................................................................................... 25
Figure 15 - Projected pressure curve of 16% and 19% combined................................................ 26
Figure 16 - Cross section of landbrot bread.................................................................................. 28
Figure 17 - Switch trigger ............................................................................................................. 29
Figure 18 - Expansion restraint..................................................................................................... 29
2 List of Tables
Table 1 – Cooling Time Requirements........................................................................................... 6
4

Table 2 - Cooler Controller (Setting A)........................................................................................ 11
Table 3 - Cooler Controller (Setting B) ........................................................................................ 11
Table 4 - Control and Noise.......................................................................................................... 16
Table 5 - Applied vacuum reduction rate from 1000 to 40 mbar ................................................. 19
Table 6 - Cost of landbrot tests ..................................................................................................... 21
Table 7 - Pressure reduction rate below 229.92 mbar/min ........................................................... 22
Table 8 - Initial test runs ............................................................................................................... 25
Table 9 - Variable valve opening test ........................................................................................... 26
Table 10 - Value of bread per test................................................................................................. 27
Table 11 - Test value..................................................................................................................... 27
Table 12 - Equipment cost ............................................................................................................ 27
5
3 Introduction
3.1 Vacuum cooling
Vacuum cooling is a rapid evaporative cooling technique, which is achieved through
evaporating part of the moisture of a product by the creation of a vacuum (Sun and Zheng,
2005). In the bread baking industry, vacuum cooling takes place immediately after the breads are
removed from the oven and before packaging in order to avoid vapour condensation inside the
packaging (Sun and Wang, 2001). Usual vacuum cooling takes place in a temperature range of
98°C to 30°C (Sun and Zheng, 2006). Bread rolls, crusty breads, sausage rolls, pastries, meat
pies, biscotti bread, cakes and baked biscuits has been proven suitable for vacuum cooling. It is
now commercially used in Italy for some delicate bakery products, such as panetonni
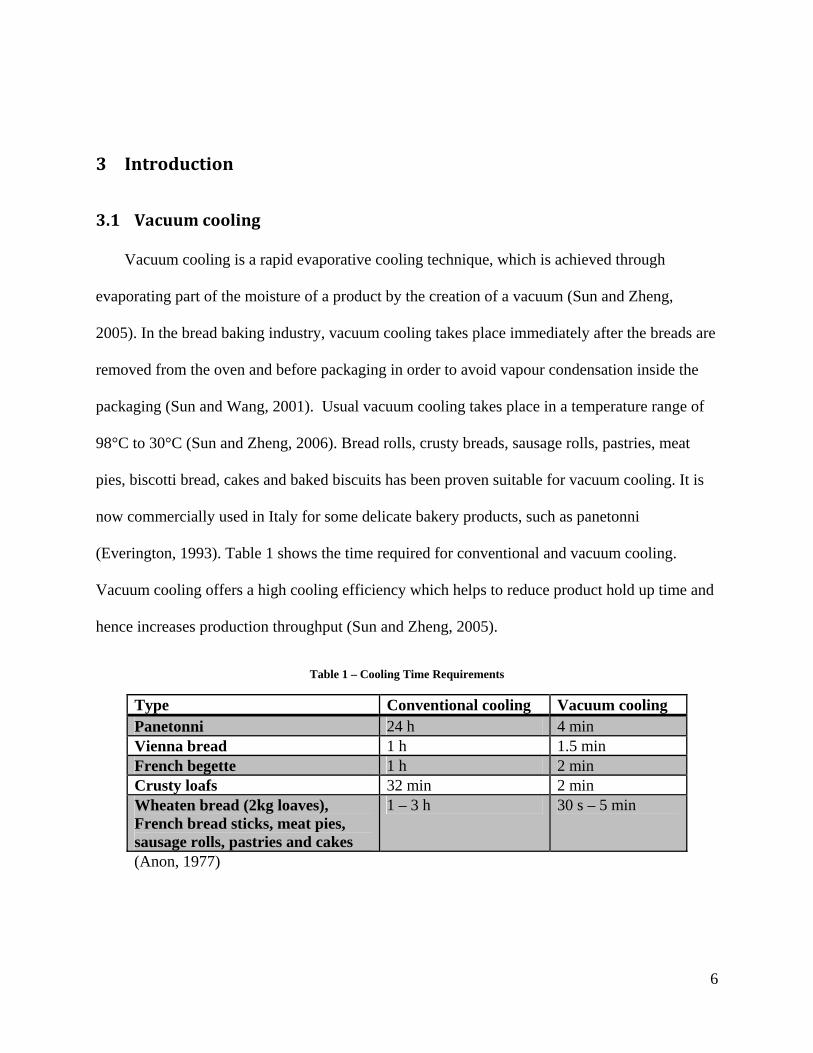
(Everington, 1993). Table 1 shows the time required for conventional and vacuum cooling.
Vacuum cooling offers a high cooling efficiency which helps to reduce product hold up time and
hence increases production throughput (Sun and Zheng, 2005).
Table 1 – Cooling Time Requirements
Type Conventional cooling Vacuum cooling Panetonni 24 h 4 min Vienna bread 1 h 1.5 min French begette 1 h 2 min Crusty loafs 32 min 2 min Wheaten bread (2kg loaves), French bread sticks, meat pies, sausage rolls, pastries and cakes
1 – 3 h 30 s – 5 min
(Anon, 1977)
6
3.2 Rudolph’s Bakeries Ltd.
Currently, Rudolph uses the conventional method to cool their breads. With conventional
cooling method, the breads are placed in a storage room where large fans that bring in cooling air
from the exterior. Cooling takes place through conductive heat transfer from the core of the
bread to its surface followed by convective heat transfer from the bread surface to the
surrounding air and usually the former is the rate-limiting step due to the inherent low thermal
conductivity of the bread (Sun and Zheng, 2005). This result in the requirement of 6 to 10 hours
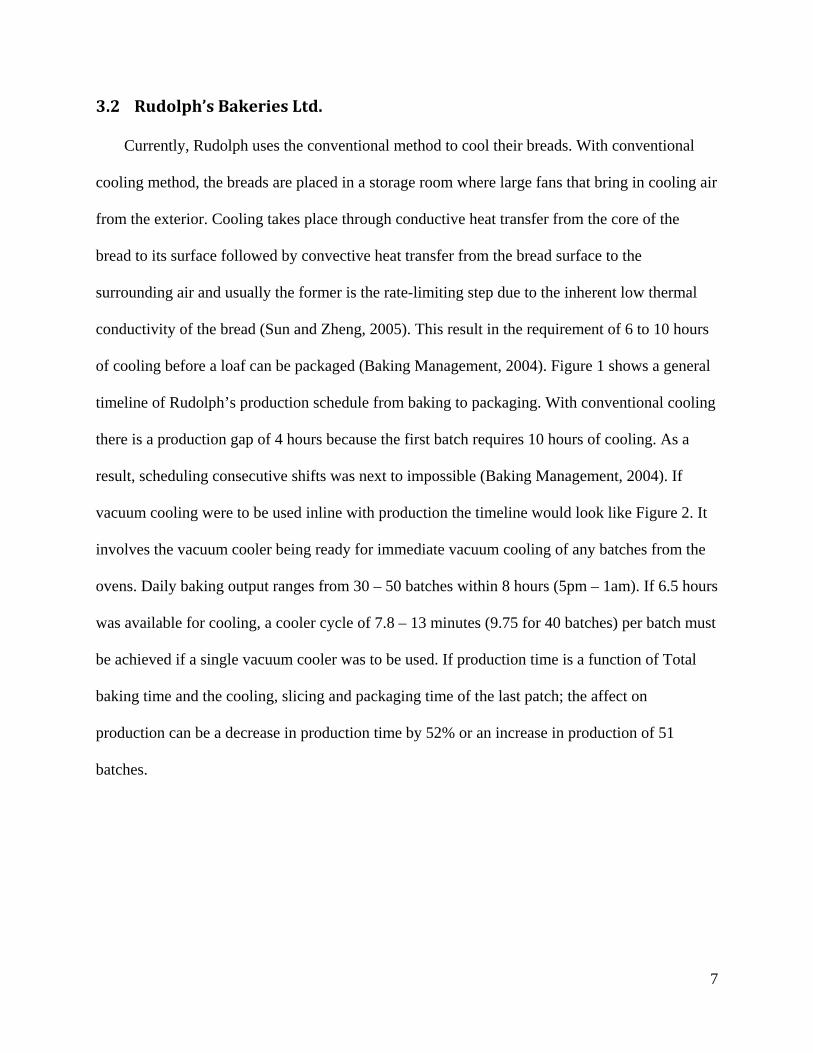
of cooling before a loaf can be packaged (Baking Management, 2004). Figure 1 shows a general
timeline of Rudolph’s production schedule from baking to packaging. With conventional cooling
there is a production gap of 4 hours because the first batch requires 10 hours of cooling. As a
result, scheduling consecutive shifts was next to impossible (Baking Management, 2004). If
vacuum cooling were to be used inline with production the timeline would look like Figure 2. It
involves the vacuum cooler being ready for immediate vacuum cooling of any batches from the
ovens. Daily baking output ranges from 30 – 50 batches within 8 hours (5pm – 1am). If 6.5 hours
was available for cooling, a cooler cycle of 7.8 – 13 minutes (9.75 for 40 batches) per batch must
be achieved if a single vacuum cooler was to be used. If production time is a function of Total
baking time and the cooling, slicing and packaging time of the last patch; the affect on
production can be a decrease in production time by 52% or an increase in production of 51
batches.
7
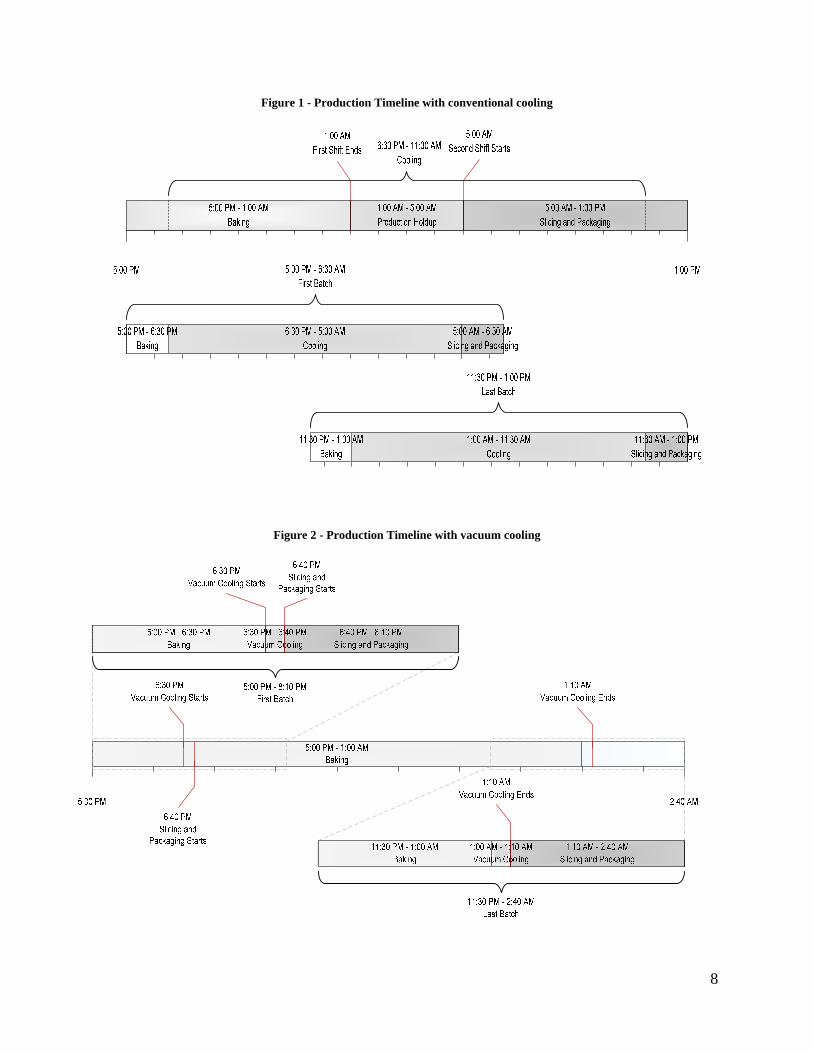
Figure 1 - Production Timeline with conventional cooling
Figure 2 - Production Timeline with vacuum cooling
8
3.3 Rudolph’s vacuum cooler
Rudolph Bakeries Limited of Toronto is in the midst of implementing vacuum cooling for
their entire specialty bread line, totalling 28 different varieties. The vacuum cooler at Rudolph’s
was designed and constructed by RF Systems of Italy. The cooler applies modulated vacuum
cooling (MVC). In MVC the pressure reduction rate can be precisely controlled. The objective of
using modulated vacuum cooling is to minimize the possible adverse effects that vacuum cooling
might exert on the texture and volume of the products since pressure can build up in areas of low
vapour permeability such as the crust on bread (Bradshaw, 1976). One of the adverse effects of
vacuum cooling is the separation of crust and crumb (Rudolph’s, 2006).
The vacuum cooler used is a typical batch type design. The vacuum chamber is designed to
hold one of Rudolph’s bread racks. The chamber is connected to the pumping system through
pumping ports situated at its top. The vacuum process is controlled by a programmable logic
controller (PLC) which operates valves and the vacuum pump. The only feedback from the
chamber is a pressure transducer which is connected to the controller. The pressure reduction
rate within the chamber is generated by an oil-sealed rotary pump. A vapour-condensing system
is incorporated into the system to assist the vacuum pump with the vacuum generation.
9
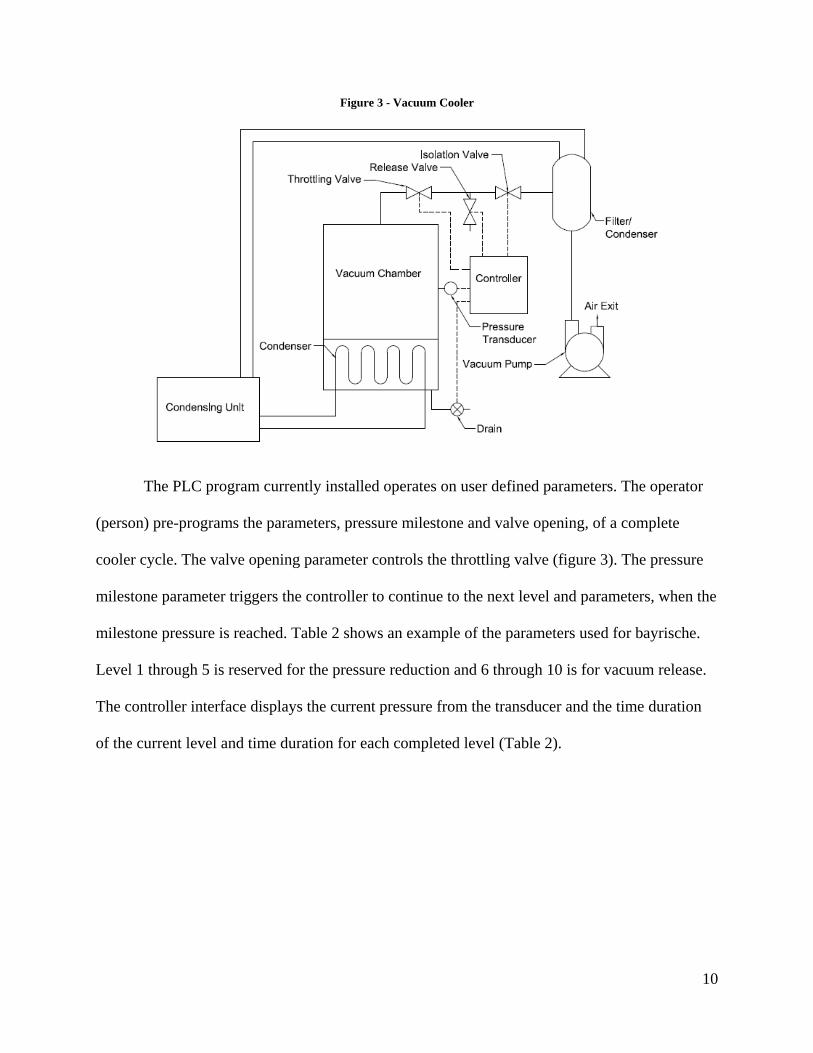
Figure 3 - Vacuum Cooler
The PLC program currently installed operates on user defined parameters. The operator
(person) pre-programs the parameters, pressure milestone and valve opening, of a complete
cooler cycle. The valve opening parameter controls the throttling valve (figure 3). The pressure
milestone parameter triggers the controller to continue to the next level and parameters, when the
milestone pressure is reached. Table 2 shows an example of the parameters used for bayrische.
Level 1 through 5 is reserved for the pressure reduction and 6 through 10 is for vacuum release.
The controller interface displays the current pressure from the transducer and the time duration
of the current level and time duration for each completed level (Table 2).
10
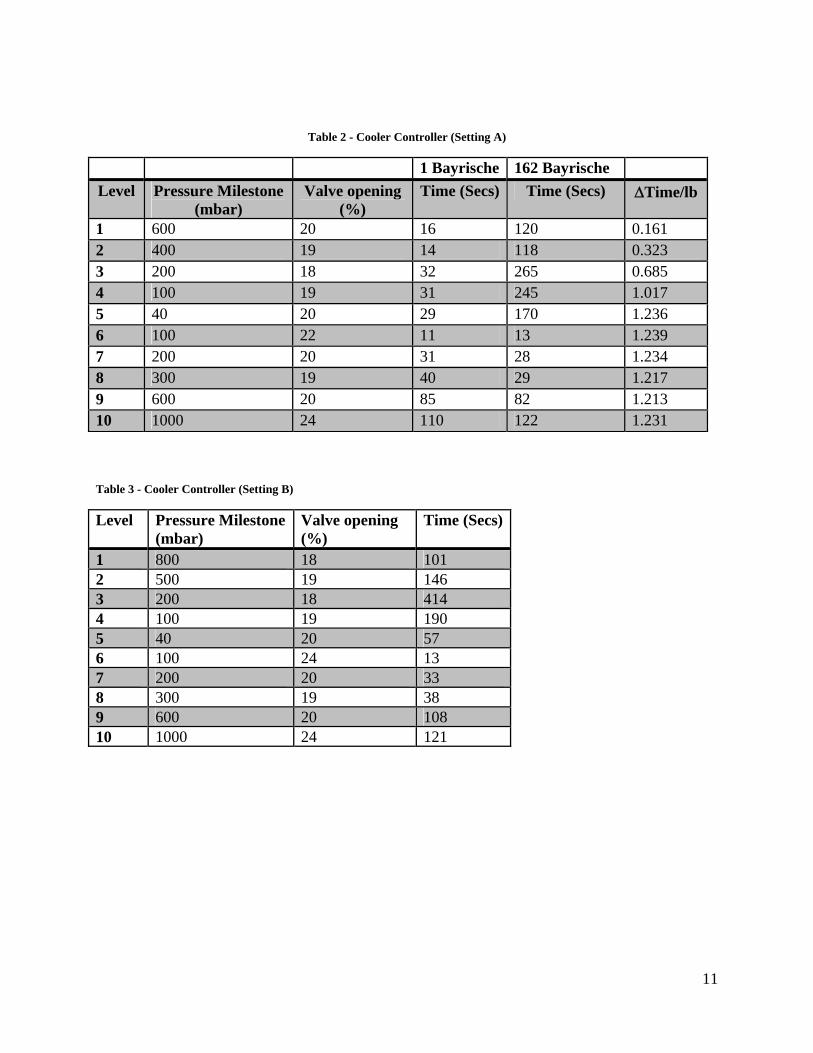
Table 2 - Cooler Controller (Setting A)
1 Bayrische 162 Bayrische Level Pressure Milestone
(mbar) Valve opening
(%) Time (Secs) Time (Secs) ΔTime/lb
1 600 20 16 120 0.161 2 400 19 14 118 0.323 3 200 18 32 265 0.685 4 100 19 31 245 1.017 5 40 20 29 170 1.236 6 100 22 11 13 1.239 7 200 20 31 28 1.234 8 300 19 40 29 1.217 9 600 20 85 82 1.213 10 1000 24 110 122 1.231
Table 3 - Cooler Controller (Setting B)
Level Pressure Milestone (mbar)
Valve opening (%)
Time (Secs)
1 800 18 101 2 500 19 146 3 200 18 414 4 100 19 190 5 40 20 57 6 100 24 13 7 200 20 33 8 300 19 38 9 600 20 108 10 1000 24 121
11
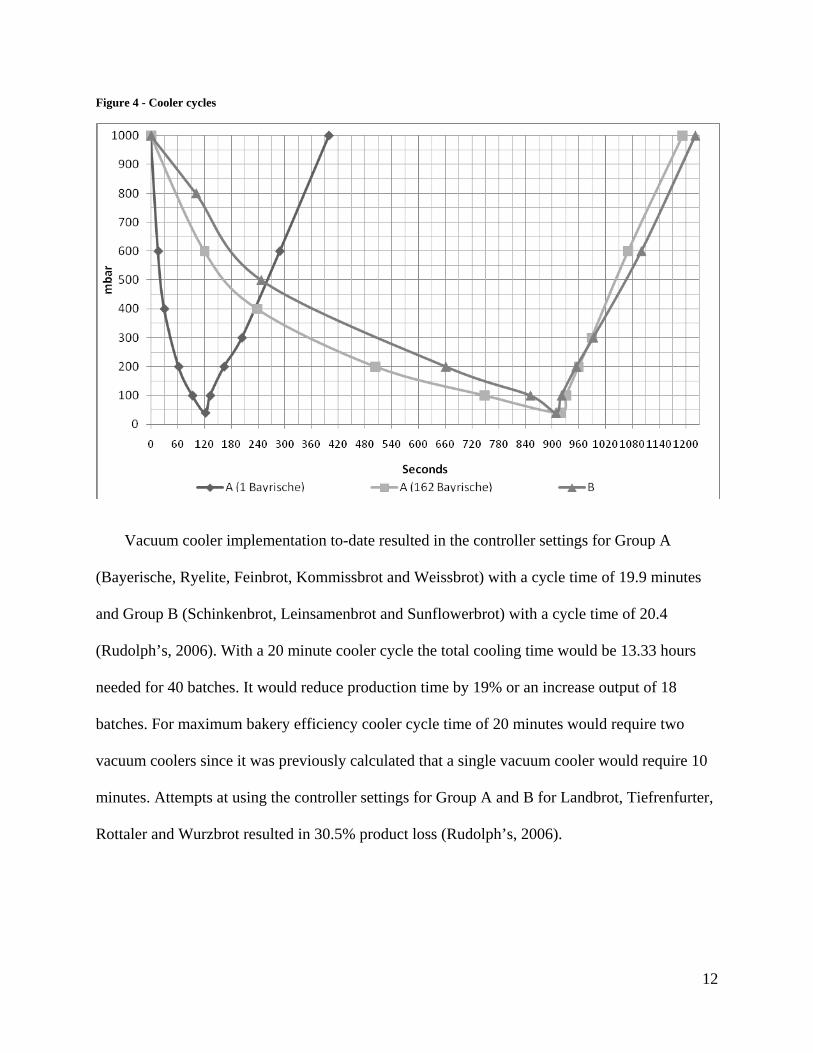
Figure 4 - Cooler cycles
Vacuum cooler implementation to-date resulted in the controller settings for Group A
(Bayerische, Ryelite, Feinbrot, Kommissbrot and Weissbrot) with a cycle time of 19.9 minutes
and Group B (Schinkenbrot, Leinsamenbrot and Sunflowerbrot) with a cycle time of 20.4
(Rudolph’s, 2006). With a 20 minute cooler cycle the total cooling time would be 13.33 hours
needed for 40 batches. It would reduce production time by 19% or an increase output of 18
batches. For maximum bakery efficiency cooler cycle time of 20 minutes would require two
vacuum coolers since it was previously calculated that a single vacuum cooler would require 10
minutes. Attempts at using the controller settings for Group A and B for Landbrot, Tiefrenfurter,
Rottaler and Wurzbrot resulted in 30.5% product loss (Rudolph’s, 2006).
12
4 Vacuum cooling bread
In general, vacuum cooling is dependant on the product porosity and pore distribution, in
which high porosity and uniform pore distribution will lead to a more rapid cooling process (Sun
and Zheng, 2005). During vacuum cooling, initial vaporization of free water occur on the surface
and inside the macro-pores of the product, followed by diffusion of water vapour through the
pore spaces to the product’s surface and then to the surrounding atmosphere (Sun and Zheng,
2005). In the case of breads, areas of low vapour permeability slow the diffusion of water vapour
and affect the speed of pressure reduction within the bread. If the speed of pressure reduction of
the cooler is greater than the speed of pressure reduction within the bread, it would cause a build
up of pressure. This pressure causes stress on the bread structure, excessive stress result in the
bread deforming and eventually tearing. When a high pressure reduction rate is applied to breads
with high porosity (i.e. White bread) the maximum stress caused by the pressure is not high
enough to cause tearing (figure 5, part 1). When the same pressure reduction rate is applied to
breads with lower porosity (i.e. Landbrot) the stress would builds up and exceed the maximum
allowable stress of the bread and tearing occurs (figure 5, part 2). Therefore a lower pressure
reduction rate must be applied to breads with low porosity so the stress does not exceed the
maximum allowable stress. The maximum allowable stress might vary for each type of bread
since their compositions are different. In addition, the vacuum release process may cause the
bread to implode/collapse if porosity and maximum allowable stress is too low (Rudolph, 2006),
again due to the stress from the build up of pressure outside the bread. The negative effect to
lower pressure reduction rate is a longer cooler cycle (figure 5, part 3).
13
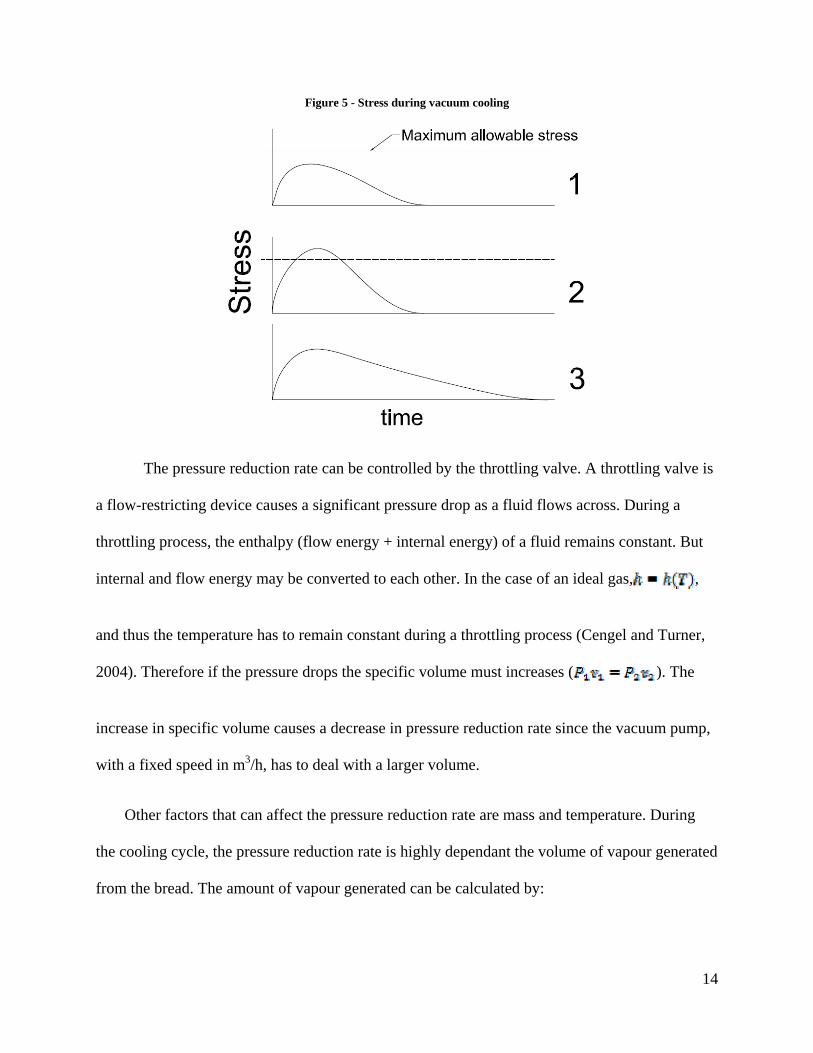
Figure 5 - Stress during vacuum cooling
The pressure reduction rate can be controlled by the throttling valve. A throttling valve is
a flow-restricting device causes a significant pressure drop as a fluid flows across. During a
throttling process, the enthalpy (flow energy + internal energy) of a fluid remains constant. But
internal and flow energy may be converted to each other. In the case of an ideal gas, ,
and thus the temperature has to remain constant during a throttling process (Cengel and Turner,
2004). Therefore if the pressure drops the specific volume must increases ( ). The
increase in specific volume causes a decrease in pressure reduction rate since the vacuum pump,
with a fixed speed in m3/h, has to deal with a larger volume.
Other factors that can affect the pressure reduction rate are mass and temperature. During
the cooling cycle, the pressure reduction rate is highly dependant the volume of vapour generated
from the bread. The amount of vapour generated can be calculated by:
14
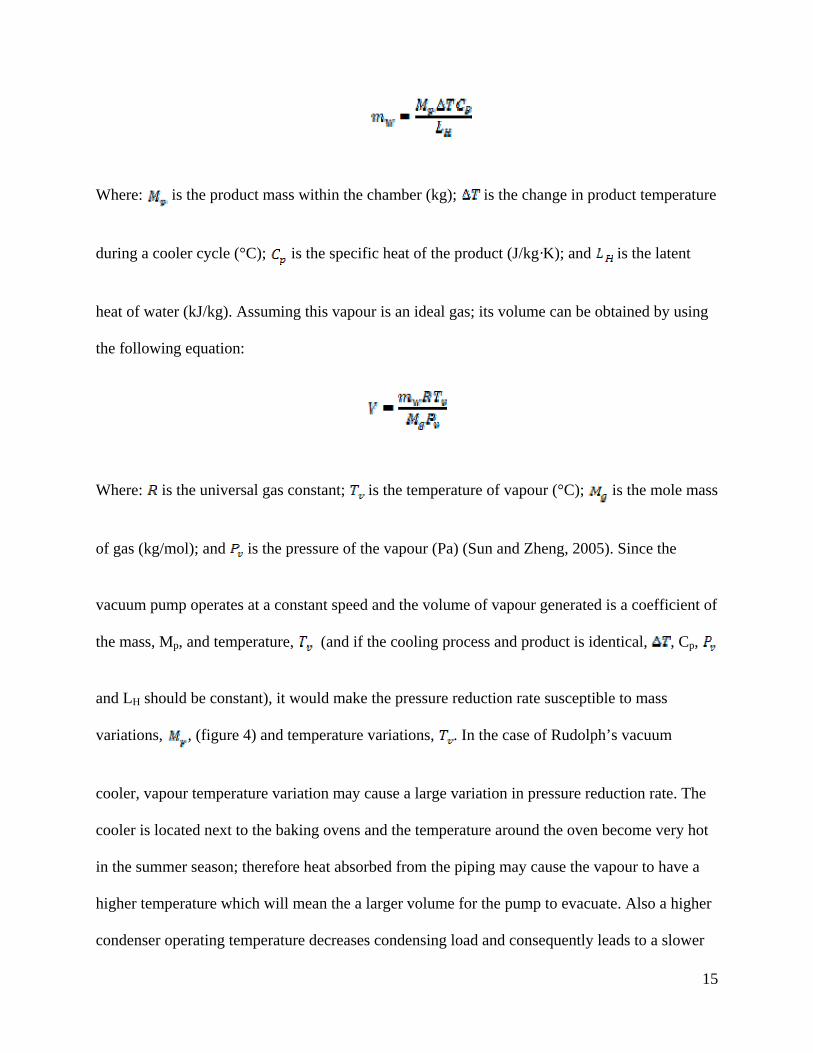
Where: is the product mass within the chamber (kg); is the change in product temperature
during a cooler cycle (°C); is the specific heat of the product (J/kg·K); and is the latent
heat of water (kJ/kg). Assuming this vapour is an ideal gas; its volume can be obtained by using
the following equation:
Where: is the universal gas constant; is the temperature of vapour (°C); is the mole mass
of gas (kg/mol); and is the pressure of the vapour (Pa) (Sun and Zheng, 2005). Since the
vacuum pump operates at a constant speed and the volume of vapour generated is a coefficient of
the mass, Mp, and temperature, (and if the cooling process and product is identical, , Cp,
and LH should be constant), it would make the pressure reduction rate susceptible to mass
variations, , (figure 4) and temperature variations, . In the case of Rudolph’s vacuum
cooler, vapour temperature variation may cause a large variation in pressure reduction rate. The
cooler is located next to the baking ovens and the temperature around the oven become very hot
in the summer season; therefore heat absorbed from the piping may cause the vapour to have a
higher temperature which will mean the a larger volume for the pump to evacuate. Also a higher
condenser operating temperature decreases condensing load and consequently leads to a slower
15
cooling process (Sun and Wang, 2003). The variation of mass can be easily control by insuring
that approximately the same mass is cooled (since time differs 1.2 seconds per lb (Table 2)),
however this makes the cooler unusable when not enough bread is available.
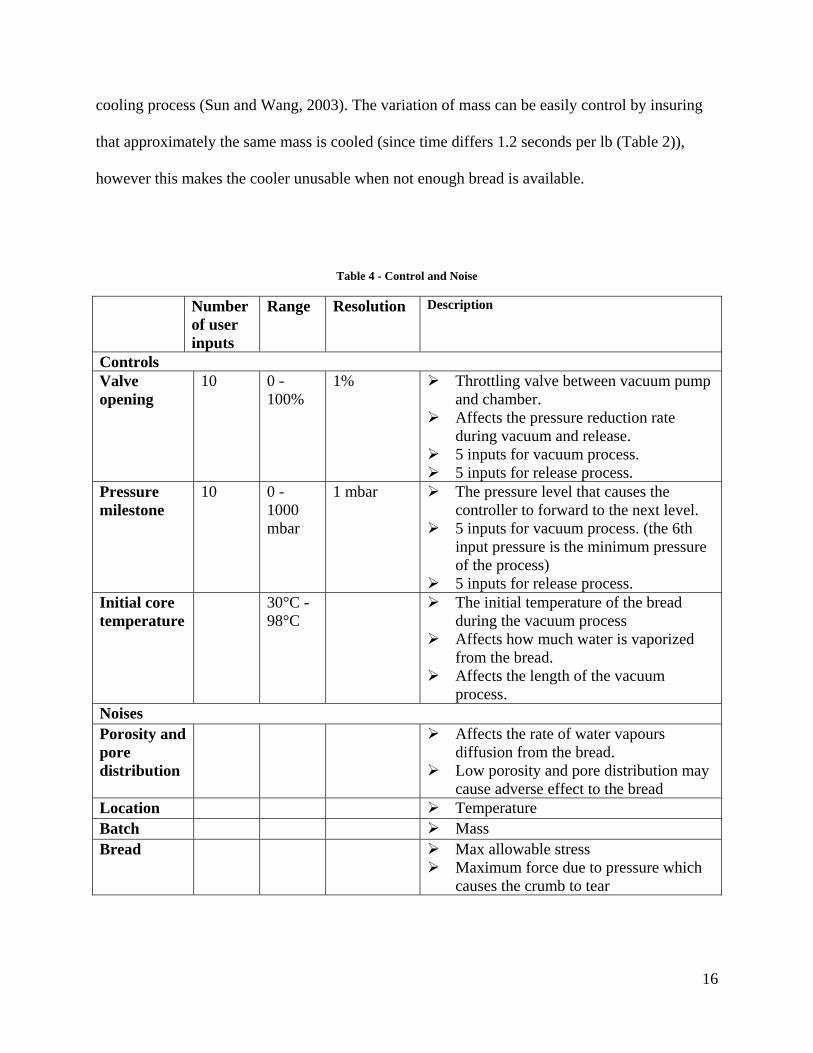
Table 4 - Control and Noise
Number of user inputs
Range Resolution Description
Controls Valve opening
10 0 - 100%
1% Throttling valve between vacuum pump and chamber.
Affects the pressure reduction rate during vacuum and release.
5 inputs for vacuum process. 5 inputs for release process.
Pressure milestone
10 0 - 1000 mbar
1 mbar The pressure level that causes the controller to forward to the next level.
5 inputs for vacuum process. (the 6th input pressure is the minimum pressure of the process)
5 inputs for release process. Initial core temperature
30°C - 98°C
The initial temperature of the bread during the vacuum process
Affects how much water is vaporized from the bread.
Affects the length of the vacuum process.
Noises Porosity and pore distribution
Affects the rate of water vapours diffusion from the bread.
Low porosity and pore distribution may cause adverse effect to the bread
Location Temperature Batch Mass Bread Max allowable stress
Maximum force due to pressure which causes the crumb to tear
16

4.1 Mathematical modeling of pressure reduction rate
The pressure reduction rate can be modelled with the following exponential decay function:
Where: is the pressure in mbar; is the time in minutes; and and are process
variables. The value of is the initial pressure and the value of represents the dependent
variable of the system or the rate of change of the pressure evacuation (Sun and Brosnan, 2003).
The value of , in our case, is 1000 mbar since vacuum cooling takes place at a temperature of
98°C. Final pressure would be 40 mbar since saturated temperature is 30°C. The value of is a
combination of throttling process, vapour temperature, and product mass. When the result from
setting A of 15.03 minutes were plotted using the exponential decay function, the curve from the
exponential decay function closely resembles the curve for setting A (figure 6, figure 7), even
though process valve varies because the valve opening settings is different throughout the
vacuum cycle, average of 19%.
17
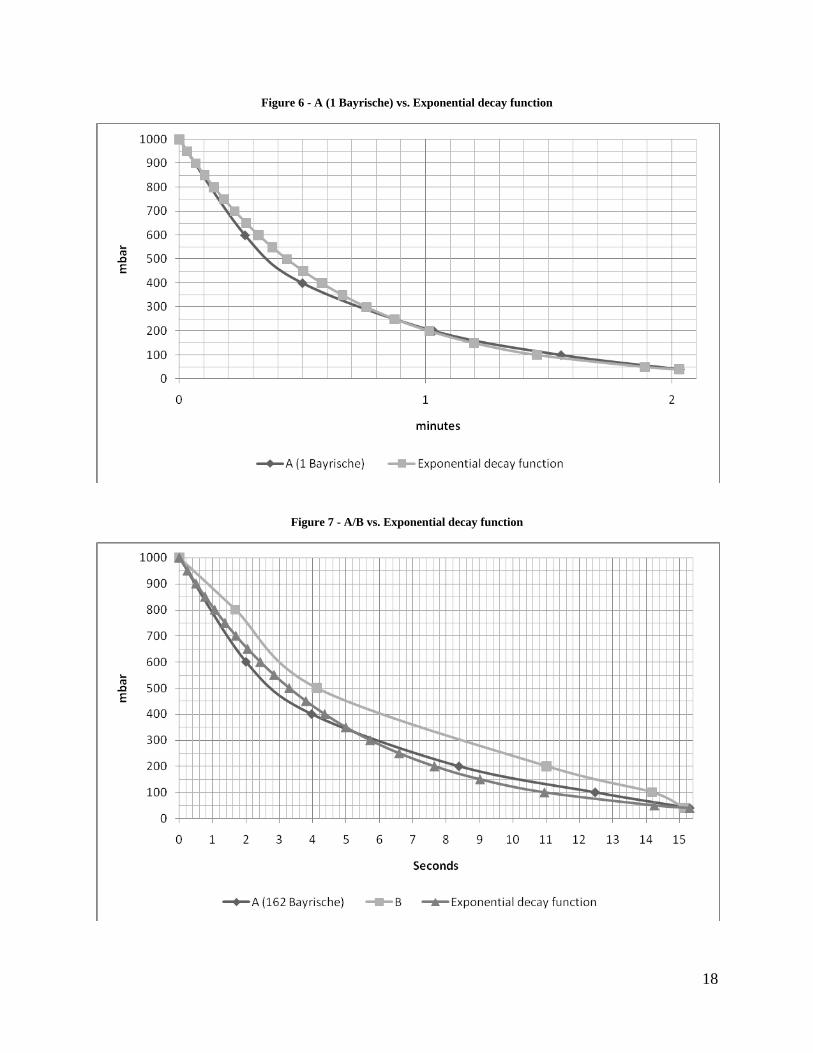
Figure 6 - A (1 Bayrische) vs. Exponential decay function
Figure 7 - A/B vs. Exponential decay function
18

To prevent any adverse effect to the structure of the bread the pressure reduction rate must
be precisely modulated to prevent pressure from building up within the bread. As the pressure
reduction rate is reduced the vacuum time increases exponentially (figure 8, using the derivative
equation of P: ). In typical vacuum cooling of bakery product the vacuum time
ranges from 0.5 to 5 minutes (Table 1) which results in at range of maximum pressure reduction
rate of 6437.75 – 643.78 mbar/min (107.30 – 10.73 mbar/sec), a decrease in speed 5793.97
mbar/min (96.57 mbar/sec) occurs within a margin of 4.5 minutes. A vacuum cooling time for
15.30 minutes, used to cool bayrische, has a maximum pressure reduction rate of 210.38
mbar/min (3.51 mbar/sec) with a decrease of 433.4 mbar/min (7.22 mbar/sec) for an addition of
10 minutes over typical vacuum cooling. Therefore the decrease in pressure reduction rate
becomes small for every interval of time added .If landbrot, with its low porosity, were to be
successfully vacuum cooled it would probably require a much longer vacuum time, for example,
to vacuum cool at an initial speed of 1 mbar/s (60 mbar/min) will require 60 minutes.. However,
having a product lost of 30% at 3.51 mbar/sec the uses of vacuum cooling on landbrot doesn’t
look promising.
Table 5 - Applied vacuum reduction rate from 1000 to 40 mbar
Pressure reduction rate, mbar min-1 t, min Process variable (B) min-1 Initial Average Final Final/Initial0.50 6.44 6437.75 1920.00 257.51 4% 5.00 0.64 643.78 192.00 25.75 4% 15.30 0.21 210.38 62.75 8.42 4%
19
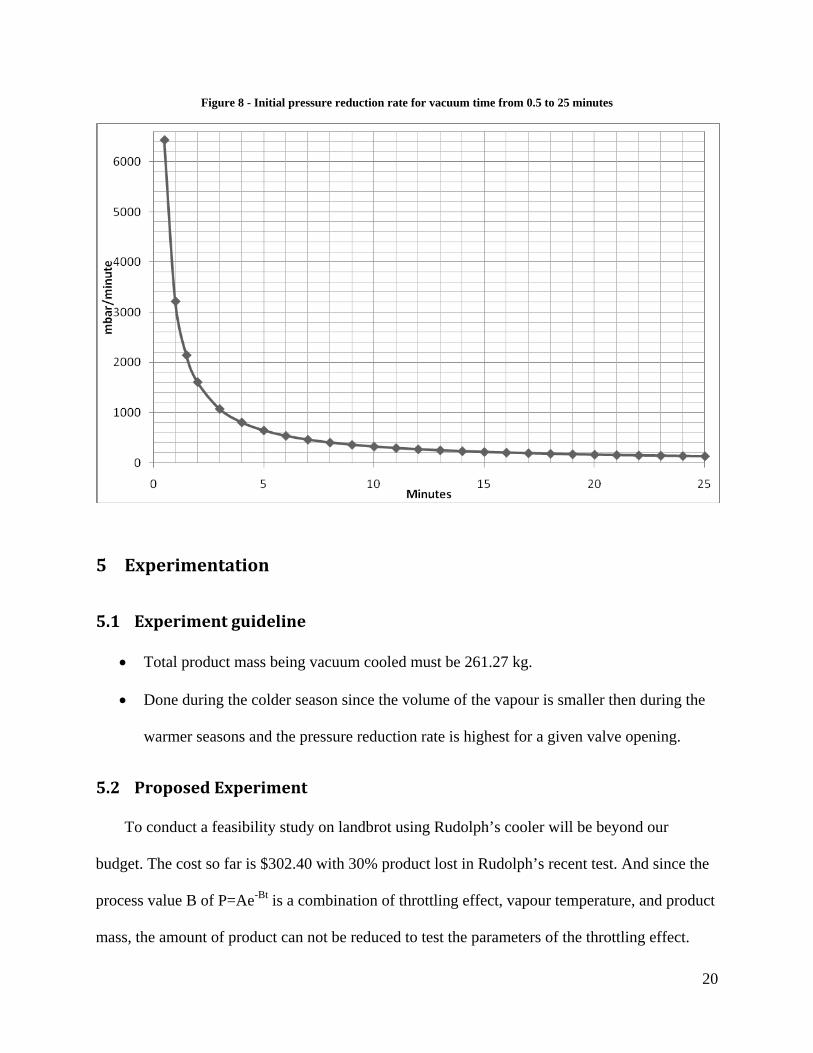
Figure 8 - Initial pressure reduction rate for vacuum time from 0.5 to 25 minutes
5 Experimentation
5.1 Experiment guideline
• Total product mass being vacuum cooled must be 261.27 kg.
• Done during the colder season since the volume of the vapour is smaller then during the
warmer seasons and the pressure reduction rate is highest for a given valve opening.
5.2 Proposed Experiment
To conduct a feasibility study on landbrot using Rudolph’s cooler will be beyond our
budget. The cost so far is $302.40 with 30% product lost in Rudolph’s recent test. And since the
process value B of P=Ae-Bt is a combination of throttling effect, vapour temperature, and product
mass, the amount of product can not be reduced to test the parameters of the throttling effect.
20
Therefore we are assuming that landbrot bread can be vacuum cooled. We will instead be
suggesting the following experiment to improve its cooling time.
Table 6 - Cost of landbrot tests
Size of loaf in lb loaves per test Value per lb Value per loaf Value per test 30% lost
18 32 $ 1.75 $ 31.50 $ 1,008.00 $ 302.40
The vacuum cooling with constant process variables for low porous breads will probably
provide no production advantage for Rudolph because if vacuum cooling time increases so does
the number of cooler required (one vacuum cooler required for every 10 minutes of cooling
time). With vacuum cooling the pressure reduction rate decays as it reduces pressure, in general,
nothing is done to compensate for it because vacuum cooling occurs within 5 minutes or less.
For vacuum cooling to be used on low porous bread the decay must be slowed or eliminated so
cooling time can be shortened. In the case of Rudolph’s vacuum cooler the throttling valve must
be gradually increased to keep a constant pressure reduction rate.
The first step is to discover if the pressure reduction rate curve can be plotted and
interpolated mathematically, as seen before we might be able to plot them. The reason for trying
to predict vacuum reduction rate mathematically is for cost saving. In addition to plotting and
interpolating mathematically, the following question must be answered for this proposed solution
to be valid: does the pressure reduction rate exhibit the same rate of an exponential decay curve
at a given pressure and process variable (valve opening). For example, if the vacuum starts at
20% from 1000 mbar to 400 mbar the pressure reduction rate would be the same that of the 20%
curve but when the open is change to 24% at 400 mbar the pressure reduction rate would be that
of the 24% at 400 mbar.
21
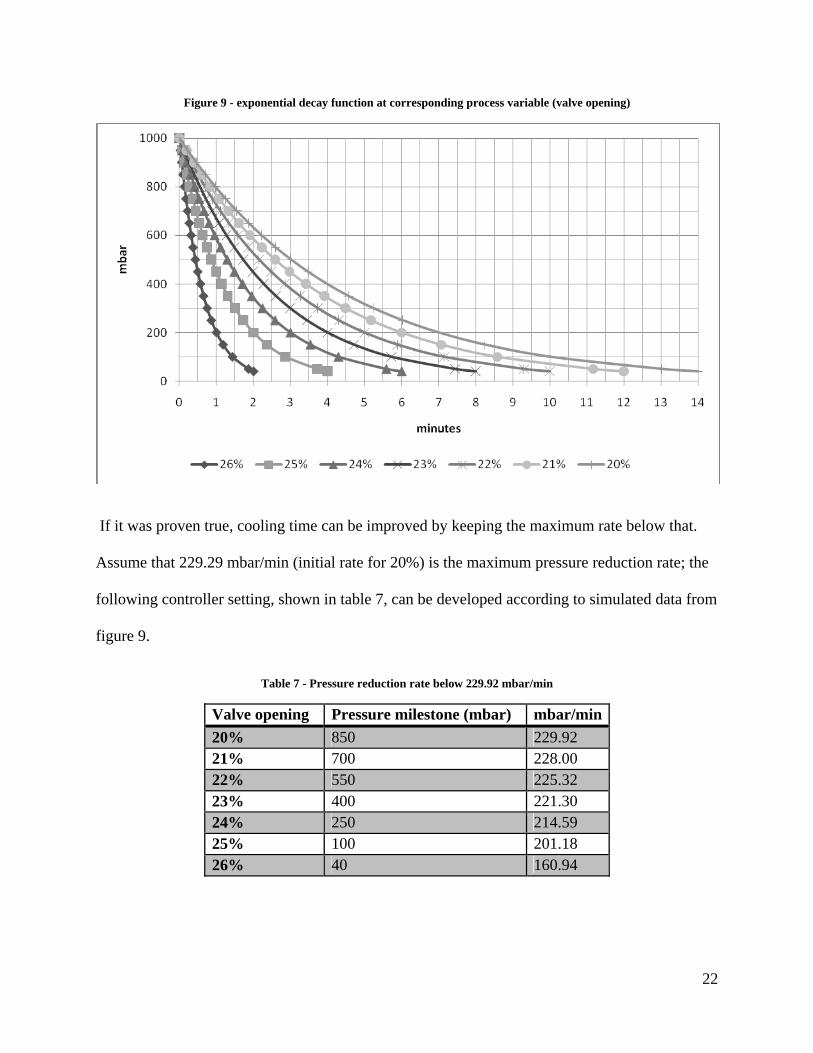
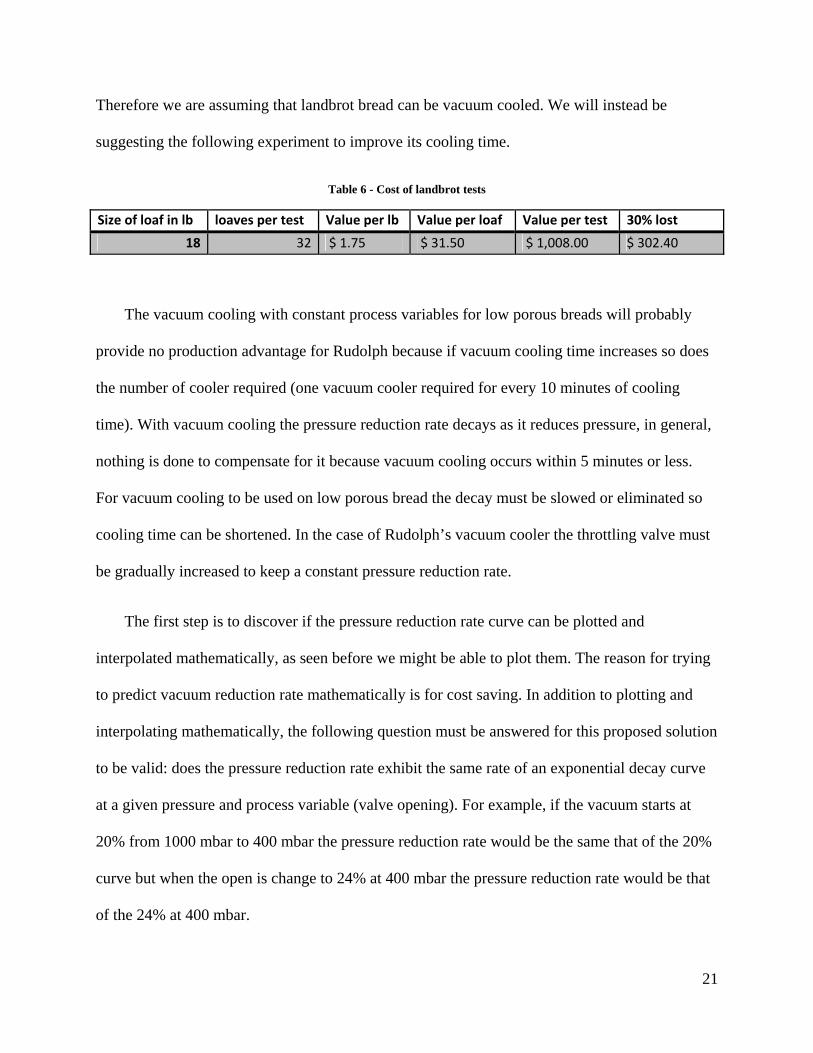
Figure 9 - exponential decay function at corresponding process variable (valve opening)
If it was proven true, cooling time can be improved by keeping the maximum rate below that.
Assume that 229.29 mbar/min (initial rate for 20%) is the maximum pressure reduction rate; the
following controller setting, shown in table 7, can be developed according to simulated data from
figure 9.
Table 7 - Pressure reduction rate below 229.92 mbar/min
Valve opening Pressure milestone (mbar) mbar/min 20% 850 229.92 21% 700 228.00 22% 550 225.32 23% 400 221.30 24% 250 214.59 25% 100 201.18 26% 40 160.94
22
The stress of the pressure on the bread would be kept close to the maximum allowable stress of
the bread (figure 10) but would never go beyond so no averse affect would be done to the bread.
Figure 10 - Stress of proposed solution
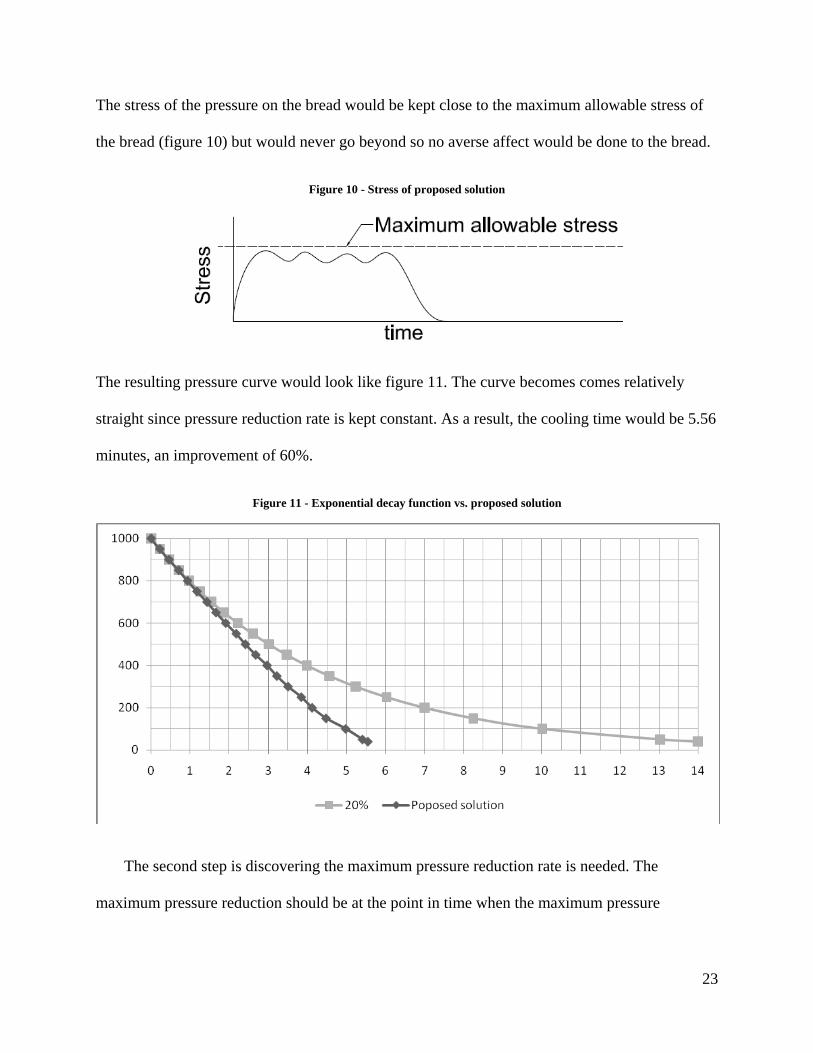
The resulting pressure curve would look like figure 11. The curve becomes comes relatively
straight since pressure reduction rate is kept constant. As a result, the cooling time would be 5.56
minutes, an improvement of 60%.
Figure 11 - Exponential decay function vs. proposed solution
The second step is discovering the maximum pressure reduction rate is needed. The
maximum pressure reduction should be at the point in time when the maximum pressure
23
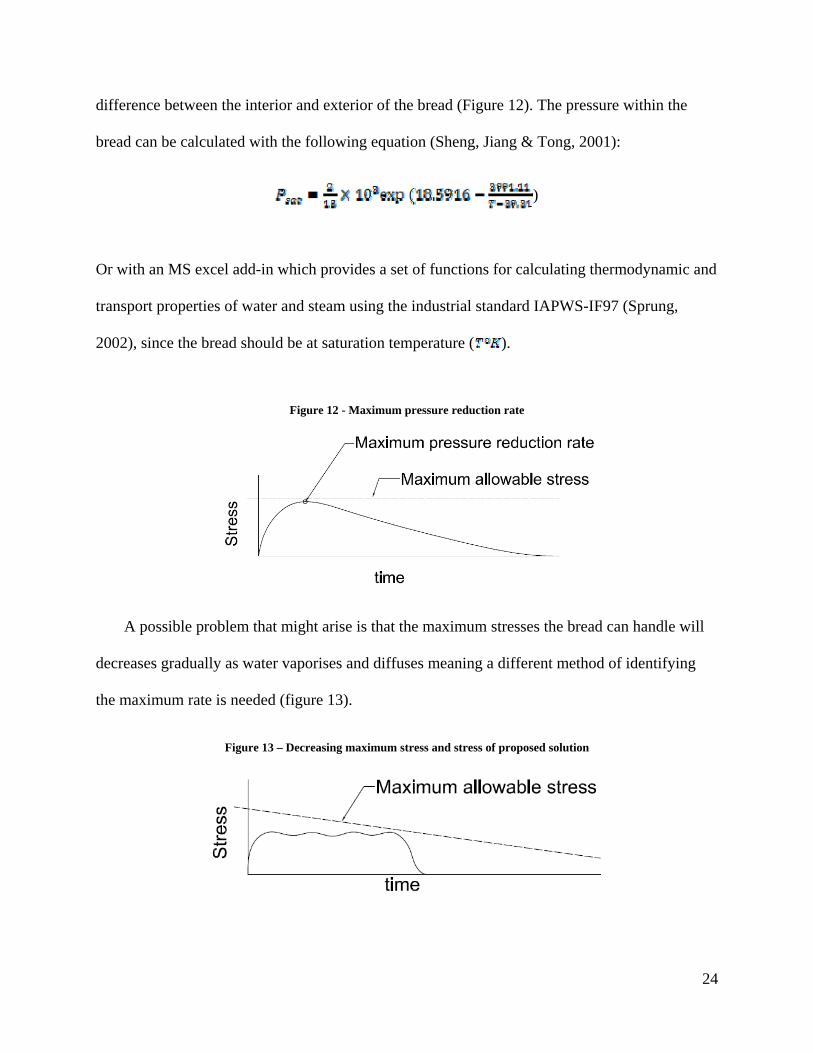
difference between the interior and exterior of the bread (Figure 12). The pressure within the
bread can be calculated with the following equation (Sheng, Jiang & Tong, 2001):
)
Or with an MS excel add-in which provides a set of functions for calculating thermodynamic and
transport properties of water and steam using the industrial standard IAPWS-IF97 (Sprung,
2002), since the bread should be at saturation temperature ( ).
Figure 12 - Maximum pressure reduction rate
A possible problem that might arise is that the maximum stresses the bread can handle will
decreases gradually as water vaporises and diffuses meaning a different method of identifying
the maximum rate is needed (figure 13).
Figure 13 – Decreasing maximum stress and stress of proposed solution
24
5.2.1 Activities
To keep cost down we will be using the result from Rudolph’s previous research so no
wasted product is produced. We will be doing our test on bayerische bread since some
parameters are already known.
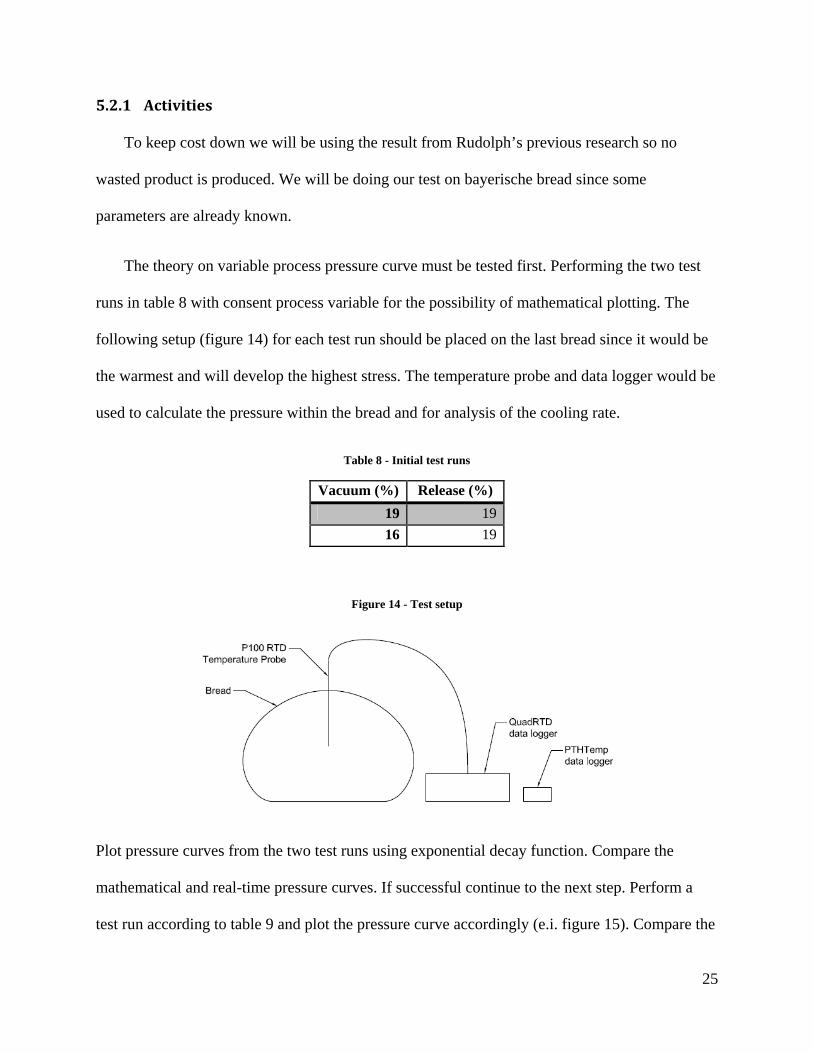
The theory on variable process pressure curve must be tested first. Performing the two test
runs in table 8 with consent process variable for the possibility of mathematical plotting. The
following setup (figure 14) for each test run should be placed on the last bread since it would be
the warmest and will develop the highest stress. The temperature probe and data logger would be
used to calculate the pressure within the bread and for analysis of the cooling rate.
Table 8 - Initial test runs
Vacuum (%) Release (%) 19 1916 19
Figure 14 - Test setup
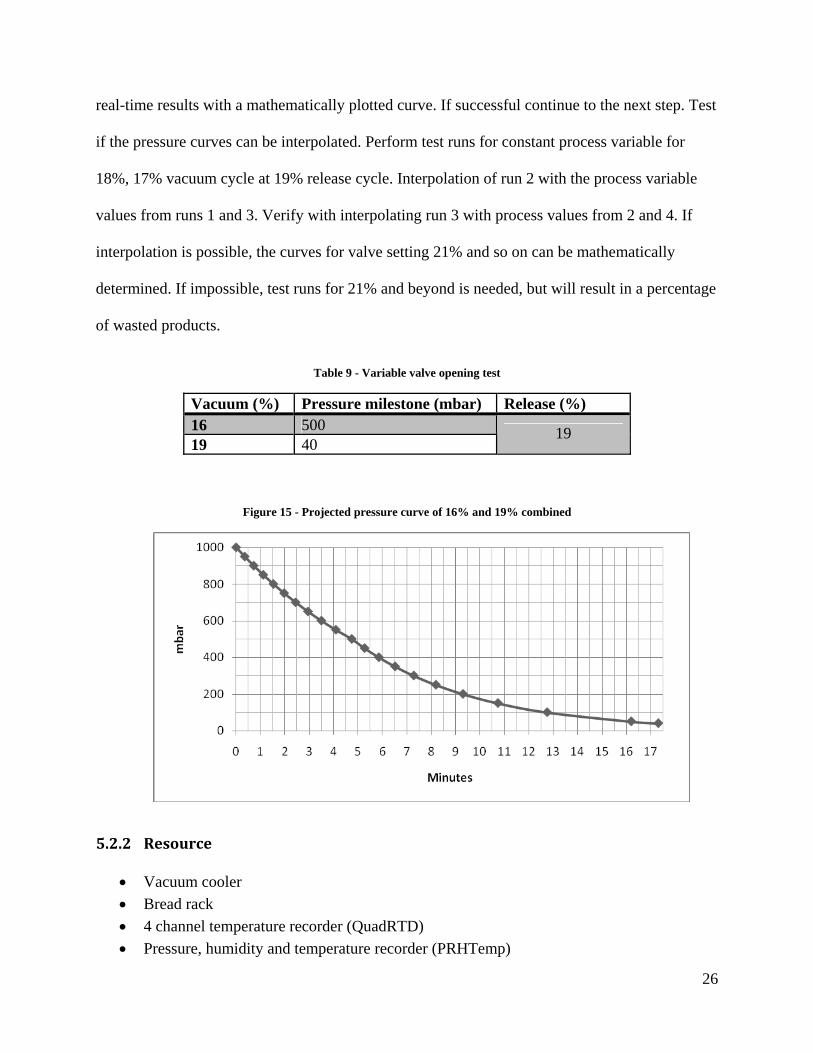
Plot pressure curves from the two test runs using exponential decay function. Compare the
mathematical and real-time pressure curves. If successful continue to the next step. Perform a
test run according to table 9 and plot the pressure curve accordingly (e.i. figure 15). Compare the
25
real-time results with a mathematically plotted curve. If successful continue to the next step. Test
if the pressure curves can be interpolated. Perform test runs for constant process variable for
18%, 17% vacuum cycle at 19% release cycle. Interpolation of run 2 with the process variable
values from runs 1 and 3. Verify with interpolating run 3 with process values from 2 and 4. If
interpolation is possible, the curves for valve setting 21% and so on can be mathematically
determined. If impossible, test runs for 21% and beyond is needed, but will result in a percentage
of wasted products.
Table 9 - Variable valve opening test
Vacuum (%) Pressure milestone (mbar) Release (%) 16 500 19 40
19
Figure 15 - Projected pressure curve of 16% and 19% combined
5.2.2 Resource
• Vacuum cooler • Bread rack • 4 channel temperature recorder (QuadRTD) • Pressure, humidity and temperature recorder (PRHTemp)
26
• Laptop
5.2.3 Cost
5.2.3.1 Test runs
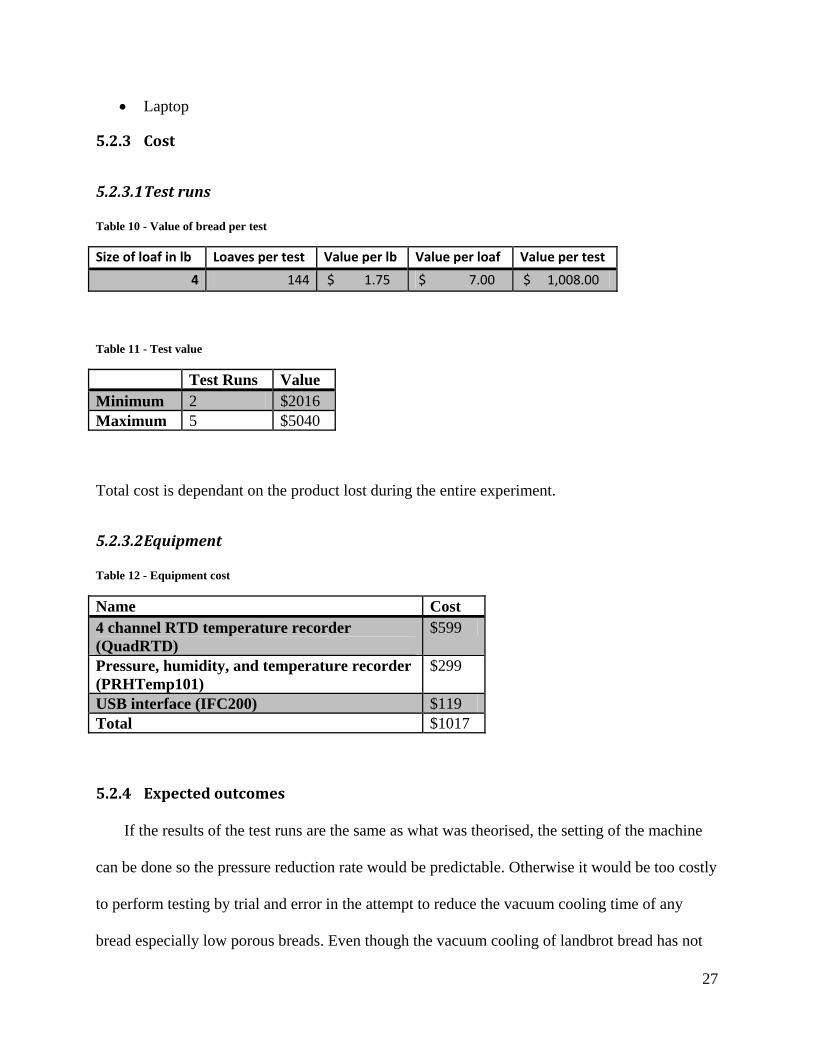
Table 10 - Value of bread per test
r test Value per lb Value per loaf Value per test Size of loaf in lb Loaves pe
144 $ 1.75 $ 7.00 $ 1,008.00 4
Table 11 - Test value
t Runs Value TesMinimum 2 $2016 Maximum 5 $5040
Total cost is dependant on the product lost during the entire experiment.
5.2.3.2 Equipment
Cost
Table 12 - Equipment cost
Name 4 channel RTD temperature recorder (QuadRTD)
$599
Pressure, humidity, and temperature recorder $299 (PRHTemp101) USB interface (IFC200) $119 Total $1017
5.2.4 Expected outcomes
If the results of the test runs are the same as what was theorised, the setting of the machine
can be done so the pressure reduction rate would be predictable. Otherwise it would be too costly
to perform testing by trial and error in the attempt to reduce the vacuum cooling time of any
bread especially low porous breads. Even though the vacuum cooling of landbrot bread has not
27
yet been proven possible, the testing of this proposed experiment would still provide Rudolph
with some benefits of the reduced cooling times. In addition, the experiment would provide
insight to the cooling behaviour.
6 Additional suggested solutions
ize the possible adverse effects that vacuum
cool
o
brot bread
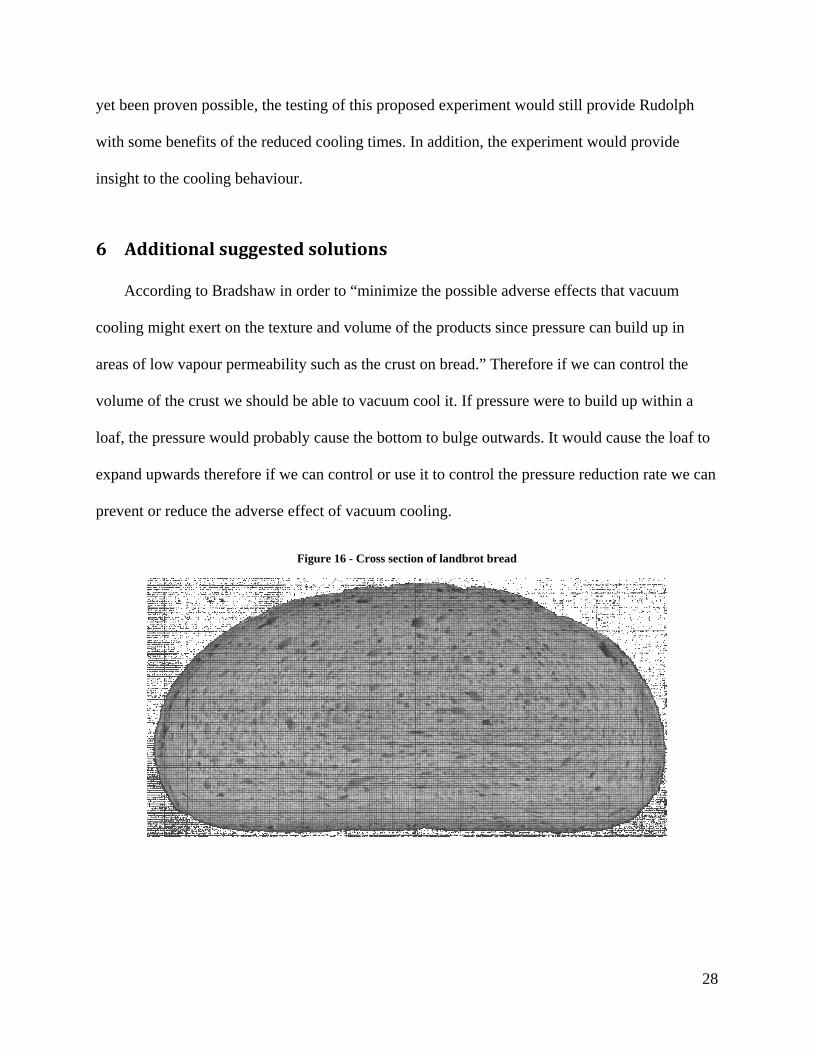
According to Bradshaw in order to “minim
ing might exert on the texture and volume of the products since pressure can build up in
areas of low vapour permeability such as the crust on bread.” Therefore if we can control the
volume of the crust we should be able to vacuum cool it. If pressure were to build up within a
loaf, the pressure would probably cause the bottom to bulge outwards. It would cause the loaf t
expand upwards therefore if we can control or use it to control the pressure reduction rate we can
prevent or reduce the adverse effect of vacuum cooling.
Figure 16 - Cross section of land
28
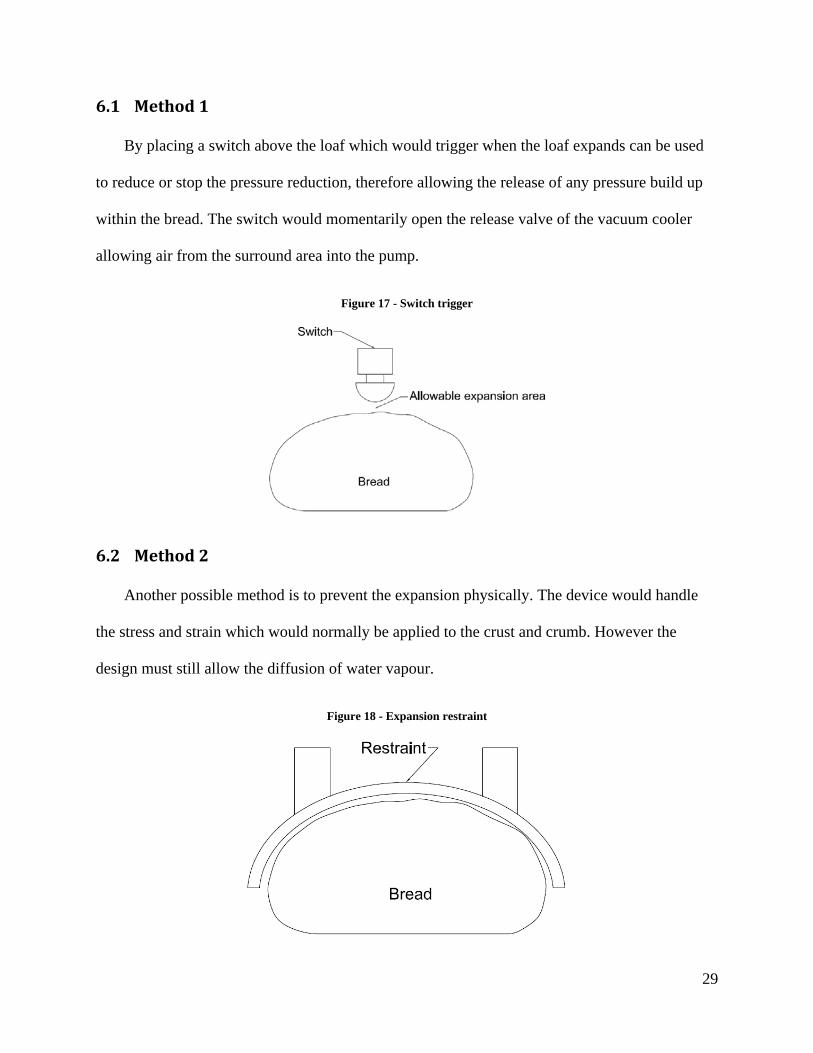
6.1 Method 1
By placing a switch above the loaf which would trigger when the loaf expands can be used
to reduce or stop the pressure reduction, therefore allowing the release of any pressure build up
within the bread. The switch would momentarily open the release valve of the vacuum cooler
allowing air from the surround area into the pump.
Figure 17 - Switch trigger
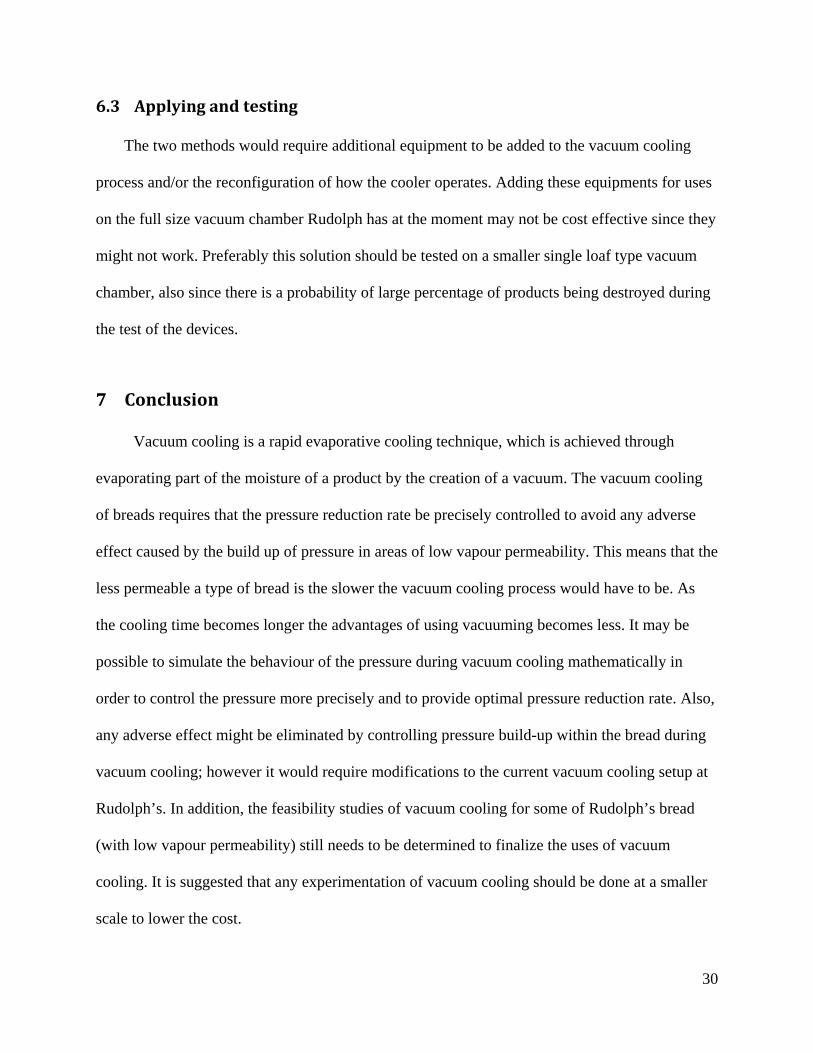
6.2 Method 2
Another possible method is to prevent the expansion physically. The device would handle
the stress and strain which would normally be applied to the crust and crumb. However the
design must still allow the diffusion of water vapour.
Figure 18 - Expansion restraint
29
6.3 Applying and testing
The two methods would require additional equipment to be added to the vacuum cooling
process and/or the reconfiguration of how the cooler operates. Adding these equipments for uses
on the full size vacuum chamber Rudolph has at the moment may not be cost effective since they
might not work. Preferably this solution should be tested on a smaller single loaf type vacuum
chamber, also since there is a probability of large percentage of products being destroyed during
the test of the devices.
7 Conclusion
Vacuum cooling is a rapid evaporative cooling technique, which is achieved through
evaporating part of the moisture of a product by the creation of a vacuum. The vacuum cooling
of breads requires that the pressure reduction rate be precisely controlled to avoid any adverse
effect caused by the build up of pressure in areas of low vapour permeability. This means that the
less permeable a type of bread is the slower the vacuum cooling process would have to be. As
the cooling time becomes longer the advantages of using vacuuming becomes less. It may be
possible to simulate the behaviour of the pressure during vacuum cooling mathematically in
order to control the pressure more precisely and to provide optimal pressure reduction rate. Also,
any adverse effect might be eliminated by controlling pressure build-up within the bread during
vacuum cooling; however it would require modifications to the current vacuum cooling setup at
Rudolph’s. In addition, the feasibility studies of vacuum cooling for some of Rudolph’s bread
(with low vapour permeability) still needs to be determined to finalize the uses of vacuum
cooling. It is suggested that any experimentation of vacuum cooling should be done at a smaller
scale to lower the cost.
30
8 References
Anon (1977). Bakery products cooled in minutes instead of hours. Modulated vacuum cooling is
the key. Food Engineering, 49, 90 – 91.
Baking Management. (2004, September). Rudolph’s pushes technology’s limit with vacuum
cooling. Retrieved 23 January 2008, from http://bakingmanagement.bakery-
net.com/article/7135.
Bradshaw W. (1976). Modulated vacuum cooling for bakery products. Bakery Digest, 50, 26 –
31.
Brosnan T., Sun D-W. (2003). Influence of Modulated Vacuum Cooling on the Cooling Rate,
Mass Loss and Vase Life of Cut Lily Flowers. Biosystems Engineering, 86.1, 45 – 49.
Cengel Y. A., Turner R. H. (2004). Fundamental of Thermo-Fluid Sciences. New York:
McGraw-Hill.
Cheng, H. P., Hsueh C. F. (2007). Multi-stage vacuum cooling process of cabbage. Journal of
Food Engineering, 79, 37 – 46.
Jin, T.X. (2007). Experimental investigation of the temperature variation in the vacuum chamber
during vacuum cooling. Journal of Food Engineering, 78, 333 – 339.
McDonald, K., Sun, D-W. (2000). Vacuum cooling technology for the food processing industry:
a review. Journal of Food Engineering, 45, 55 – 65.
31
32
Rudolph’s Specialty Bakeries limited (2006). Vacuum cooling of Bread: scientific research and
experimental development activities description. Toronto: Author.
Spang, B. (2002). Water97_v13.xla – Excel Add-In for Properties of Water and Steam
in SI-Units. Hamburg, Germany. Version 1.3.
Sun, D-W., Wang, L. (2001). Rapid cooling of porous and moisture foods by using vacuum
cooling technology. Trends in Food Science & Technology, 12, 174 – 184.
Sun, D-W., Wang, L. (2003). Experimental investigation of performance of vacuum cooling for
commercial large cooked meat joints. Journal of Food Engineering, 61, 527 – 532.
Sun, D-W., Zheng L. (2005). Vacuum Cooling of Foods. Emerging technologies for food
processing. Comp. Sun, D-W. Dublin: Elsevier Ltd, 579 – 602.
Sun, D-W., Zheng L. (2006). Vacuum cooling for the agri-food industry: Past, present and
future. Journal of Food Engineering, 77.2, 203 – 214.