Embed Size (px)
Citation preview
Longitudinal Surveys of Australian Youth (LSAY)
2015 cohort: wave 3 (2017) – frequency tables
National Centre for Vocational Education Research
LONGITUDINAL SURVEYS OFAUSTRALIAN YOUTH TECHNICAL PAPER 96B
The views and opinions expressed in this document are those of the author/project
team and do not necessarily reflect the views of the Australian Government or state and territory governments.
Publisher’s noteRecruitment of a top-up sample of Year 12 students was conducted in 2017 to ensure that future waves of the survey remain representative of the 15-year-old population in 2015. The output presented in this document includes 251 respondents recruited as part of the top-up activity who also completed an LSAY interview in wave 3 (2017). Additional information is available from the LSAY Y15 user guide <www.lsay.edu.au/publications/search-for-lsay-publications/lsay-2015-cohort-user-guide>.
© Commonwealth of Australia, 2019
With the exception of the Commonwealth Coat of Arms, the Department’s logo, any material protected by a trade mark and where otherwise noted all material presented in this document is provided under a Creative Commons Attribution 3.0 Australia <creativecommons.org/licenses/by/3.0/au> licence.
The details of the relevant licence conditions are available on the Creative Commons website (accessible using the links provided) as is the full legal code for the CC BY 3.0 AU licence <creativecommons.org/licenses/by/3.0/legalcode>.
The Creative Commons licence conditions do not apply to all logos, graphic design, artwork and photographs. Requests and enquiries concerning other reproduction and rights should be directed to the National Centre for Vocational Education Research (NCVER).
This document should be attributed as NCVER 2017, Longitudinal Surveys of Australian Youth (LSAY) 2015 cohort: wave 3 (2017) — frequency tables, NCVER, Adelaide.
This work has been produced by NCVER through the Longitudinal Surveys of Australian Youth (LSAY) Program, on behalf of the Australian Government and state and territory governments, with funding provided through the Australian Department of Education and Training.
COVER IMAGE: GETTY IMAGES/iStock
Published by NCVER, ABN 87 007 967 311
TD/TNC 135.05
Level 5, 60 Light Square, Adelaide, SA 5000PO Box 8288 Station Arcade, Adelaide SA 5000, Australia
Phone +61 8 8230 8400 Email [email protected] Web <https://www.ncver.edu.au> <http://www.lsay.edu.au>Follow us: <https://twitter.com/ncver>
ContentsSample items 4
Section A: School 8
Section B: Transition from school 20
Section C: Post-school study 25
Section D: Work 67
Section E: Job history 85
Section F: Job search activity 88
Section FA: Gig work 97
Section FB: Volunteering and unpaid care 101
Section G: Not in the labour force 107
Section H: Living arrangements 108
Section J: General attitudes 129
Section K: Data linkage 139
Interview variables 148
NCVER 3
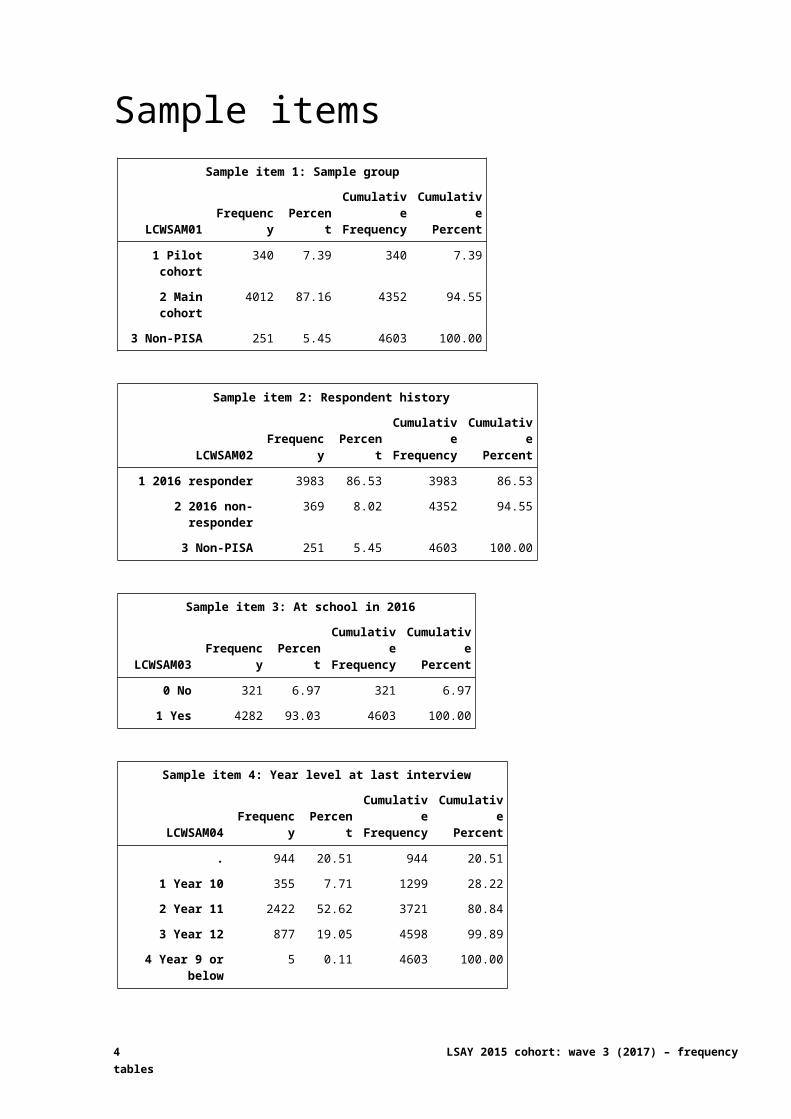
Sample itemsSample item 1: Sample group
LCWSAM01 Frequency PercentCumulativeFrequency
CumulativePercent
1 Pilot cohort 340 7.39 340 7.39
2 Main cohort 4012 87.16 4352 94.55
3 Non-PISA 251 5.45 4603 100.00
Sample item 2: Respondent history
LCWSAM02 Frequency PercentCumulativeFrequency
CumulativePercent
1 2016 responder 3983 86.53 3983 86.53
2 2016 non-responder 369 8.02 4352 94.55
3 Non-PISA 251 5.45 4603 100.00
Sample item 3: At school in 2016
LCWSAM03 Frequency PercentCumulativeFrequency
CumulativePercent
0 No 321 6.97 321 6.97
1 Yes 4282 93.03 4603 100.00
Sample item 4: Year level at last interview
LCWSAM04 Frequency PercentCumulativeFrequency
CumulativePercent
. 944 20.51 944 20.51
1 Year 10 355 7.71 1299 28.22
2 Year 11 2422 52.62 3721 80.84
3 Year 12 877 19.05 4598 99.89
4 Year 9 or below 5 0.11 4603 100.00
Sample item 5: Year level when left school
LCWSAM05 Frequency PercentCumulativeFrequency
CumulativePercent
. 4389 95.35 4389 95.35
3 Year 12 214 4.65 4603 100.00
4 LSAY 2015 cohort: wave 3 (2017) – frequency tables
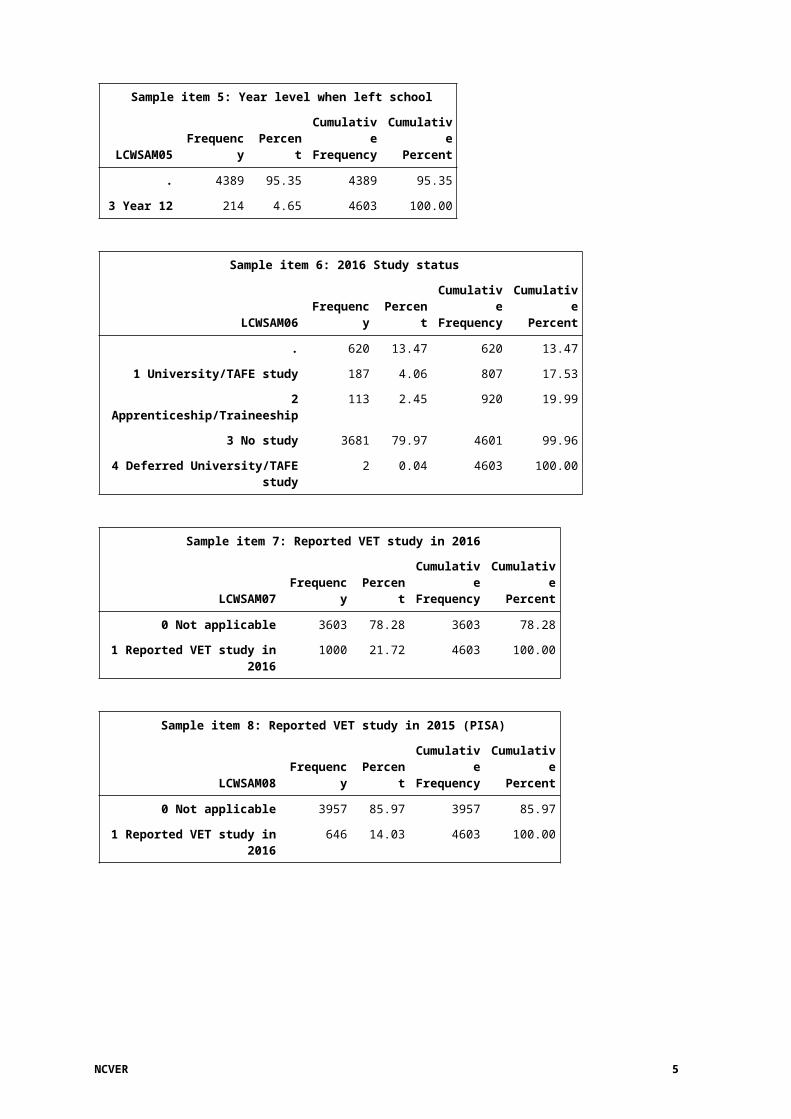
Sample item 6: 2016 Study status
LCWSAM06 Frequency PercentCumulativeFrequency
CumulativePercent
. 620 13.47 620 13.47
1 University/TAFE study 187 4.06 807 17.53
2 Apprenticeship/Traineeship 113 2.45 920 19.99
3 No study 3681 79.97 4601 99.96
4 Deferred University/TAFE study 2 0.04 4603 100.00
Sample item 7: Reported VET study in 2016
LCWSAM07 Frequency PercentCumulativeFrequency
CumulativePercent
0 Not applicable 3603 78.28 3603 78.28
1 Reported VET study in 2016 1000 21.72 4603 100.00
Sample item 8: Reported VET study in 2015 (PISA)
LCWSAM08 Frequency PercentCumulativeFrequency
CumulativePercent
0 Not applicable 3957 85.97 3957 85.97
1 Reported VET study in 2016 646 14.03 4603 100.00
Sample item 9: Had job at last interview
LCWSAM09 Frequency PercentCumulativeFrequency
CumulativePercent
0 No 2846 61.83 2846 61.83
1 Yes 1757 38.17 4603 100.00
Sample item 10: 2017 Sample state (PISA sample)
LCWSAM10 Frequency PercentCumulativeFrequency
CumulativePercent
. 251 5.45 251 5.45
1 NSW 1056 22.94 1307 28.39
2 VIC 801 17.40 2108 45.80
3 QLD 812 17.64 2920 63.44
4 SA 486 10.56 3406 74.00
5 WA 608 13.21 4014 87.20
6 TAS 255 5.54 4269 92.74
7 NT 124 2.69 4393 95.44
8 ACT 210 4.56 4603 100.00
NCVER 5
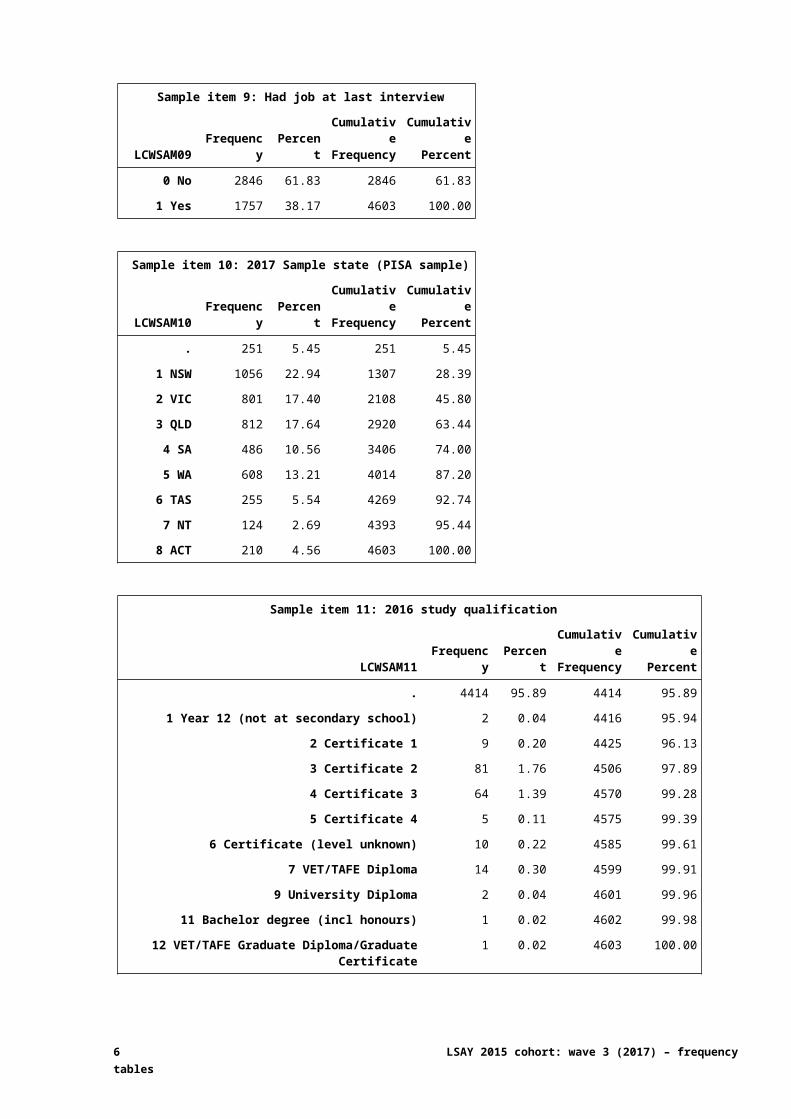
Sample item 11: 2016 study qualification
LCWSAM11 Frequency PercentCumulativeFrequency
CumulativePercent
. 4414 95.89 4414 95.89
1 Year 12 (not at secondary school) 2 0.04 4416 95.94
2 Certificate 1 9 0.20 4425 96.13
3 Certificate 2 81 1.76 4506 97.89
4 Certificate 3 64 1.39 4570 99.28
5 Certificate 4 5 0.11 4575 99.39
6 Certificate (level unknown) 10 0.22 4585 99.61
7 VET/TAFE Diploma 14 0.30 4599 99.91
9 University Diploma 2 0.04 4601 99.96
11 Bachelor degree (incl honours) 1 0.02 4602 99.98
12 VET/TAFE Graduate Diploma/Graduate Certificate
1 0.02 4603 100.00
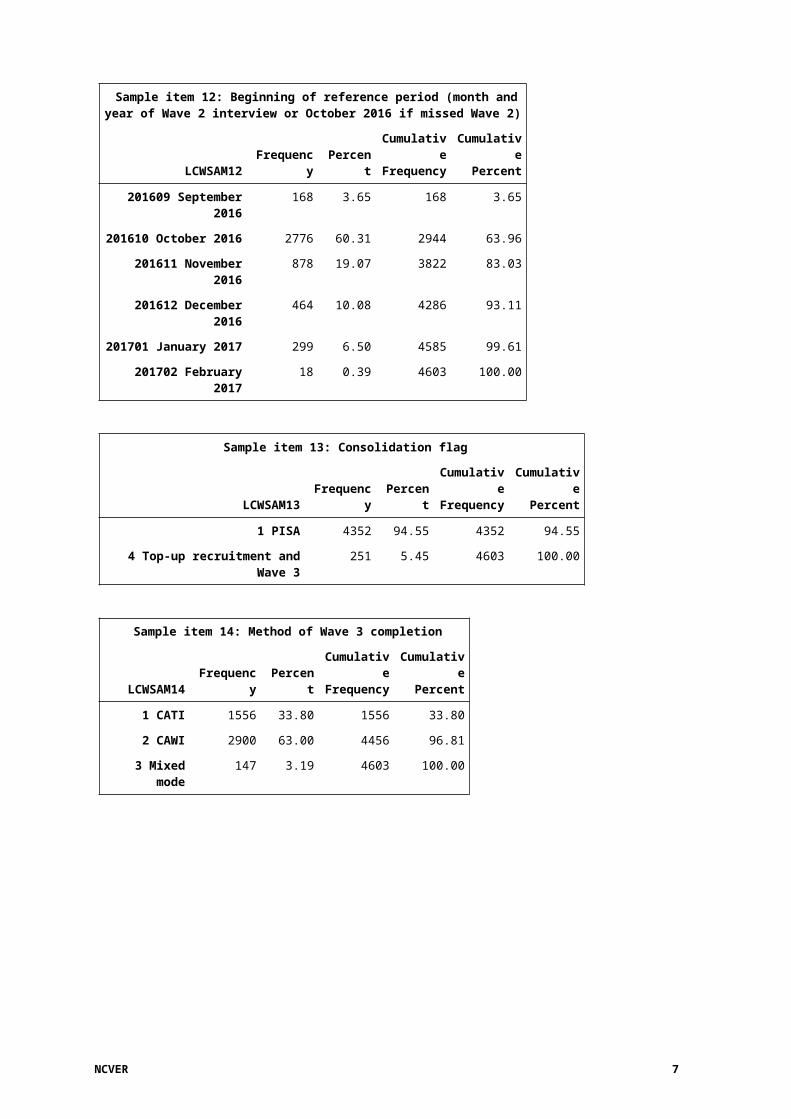
Sample item 12: Beginning of reference period (month and year of Wave 2 interview or October 2016 if missed Wave 2)
LCWSAM12 Frequency PercentCumulativeFrequency
CumulativePercent
201609 September 2016 168 3.65 168 3.65
201610 October 2016 2776 60.31 2944 63.96
201611 November 2016 878 19.07 3822 83.03
201612 December 2016 464 10.08 4286 93.11
201701 January 2017 299 6.50 4585 99.61
201702 February 2017 18 0.39 4603 100.00
Sample item 13: Consolidation flag
LCWSAM13 Frequency PercentCumulativeFrequency
CumulativePercent
1 PISA 4352 94.55 4352 94.55
4 Top-up recruitment and Wave 3 251 5.45 4603 100.00
Sample item 14: Method of Wave 3 completion
LCWSAM14 Frequency PercentCumulativeFrequency
CumulativePercent
1 CATI 1556 33.80 1556 33.80
2 CAWI 2900 63.00 4456 96.81
3 Mixed mode 147 3.19 4603 100.00
6 LSAY 2015 cohort: wave 3 (2017) – frequency tables
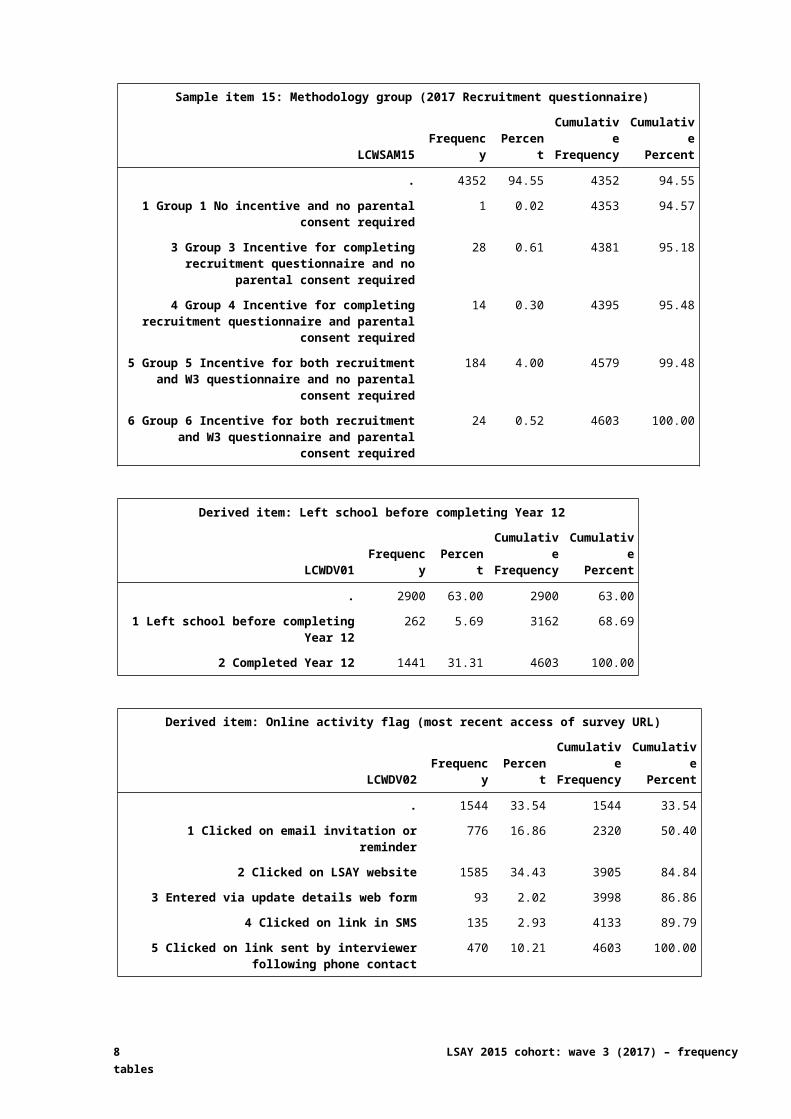
Sample item 15: Methodology group (2017 Recruitment questionnaire)
LCWSAM15 Frequency PercentCumulativeFrequency
CumulativePercent
. 4352 94.55 4352 94.55
1 Group 1 No incentive and no parental consent required
1 0.02 4353 94.57
3 Group 3 Incentive for completing recruitment questionnaire and no parental consent required
28 0.61 4381 95.18
4 Group 4 Incentive for completing recruitment questionnaire and parental consent required
14 0.30 4395 95.48
5 Group 5 Incentive for both recruitment and W3 questionnaire and no parental consent required
184 4.00 4579 99.48
6 Group 6 Incentive for both recruitment and W3 questionnaire and parental consent required
24 0.52 4603 100.00
Derived item: Left school before completing Year 12
LCWDV01 Frequency PercentCumulativeFrequency
CumulativePercent
. 2900 63.00 2900 63.00
1 Left school before completing Year 12 262 5.69 3162 68.69
2 Completed Year 12 1441 31.31 4603 100.00
Derived item: Online activity flag (most recent access of survey URL)
LCWDV02 Frequency PercentCumulativeFrequency
CumulativePercent
. 1544 33.54 1544 33.54
1 Clicked on email invitation or reminder 776 16.86 2320 50.40
2 Clicked on LSAY website 1585 34.43 3905 84.84
3 Entered via update details web form 93 2.02 3998 86.86
4 Clicked on link in SMS 135 2.93 4133 89.79
5 Clicked on link sent by interviewer following phone contact
470 10.21 4603 100.00
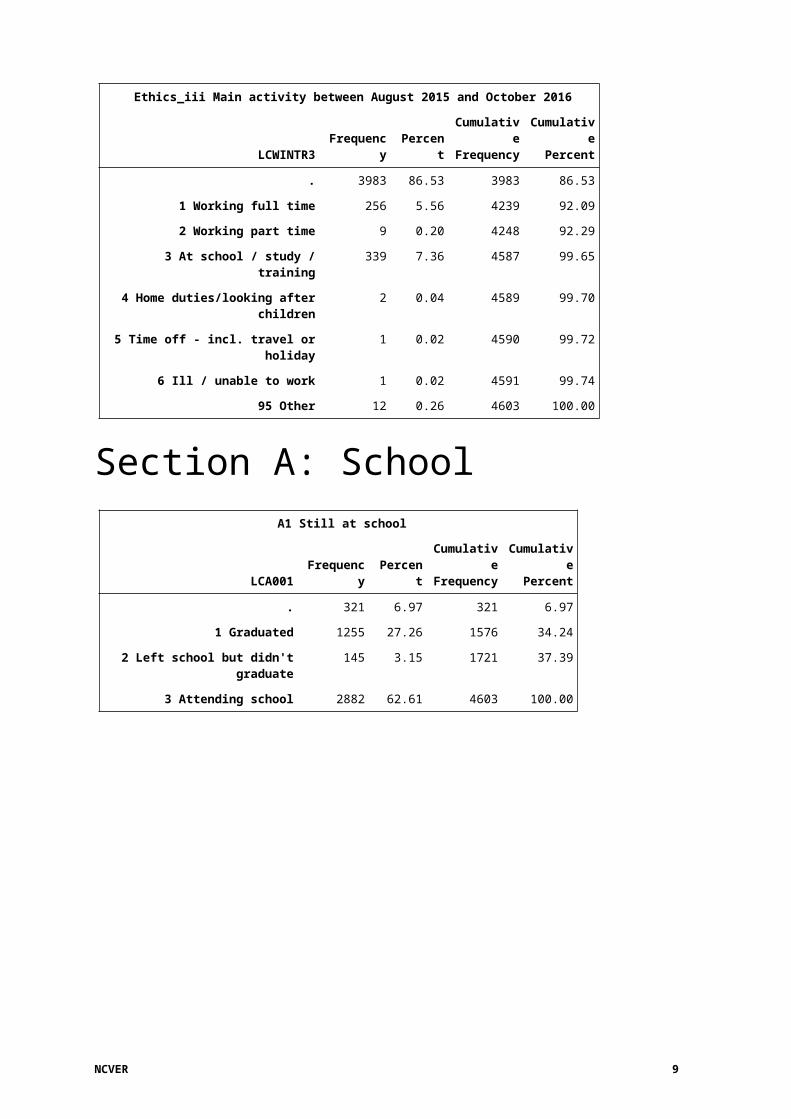
Ethics_iii Main activity between August 2015 and October 2016
LCWINTR3 Frequency PercentCumulativeFrequency
CumulativePercent
. 3983 86.53 3983 86.53
1 Working full time 256 5.56 4239 92.09
2 Working part time 9 0.20 4248 92.29
3 At school / study / training 339 7.36 4587 99.65
4 Home duties/looking after children 2 0.04 4589 99.70
5 Time off - incl. travel or holiday 1 0.02 4590 99.72
6 Ill / unable to work 1 0.02 4591 99.74
95 Other 12 0.26 4603 100.00
NCVER 7
Section A: School A1 Still at school
LCA001 Frequency PercentCumulativeFrequency
CumulativePercent
. 321 6.97 321 6.97
1 Graduated 1255 27.26 1576 34.24
2 Left school but didn't graduate 145 3.15 1721 37.39
3 Attending school 2882 62.61 4603 100.00
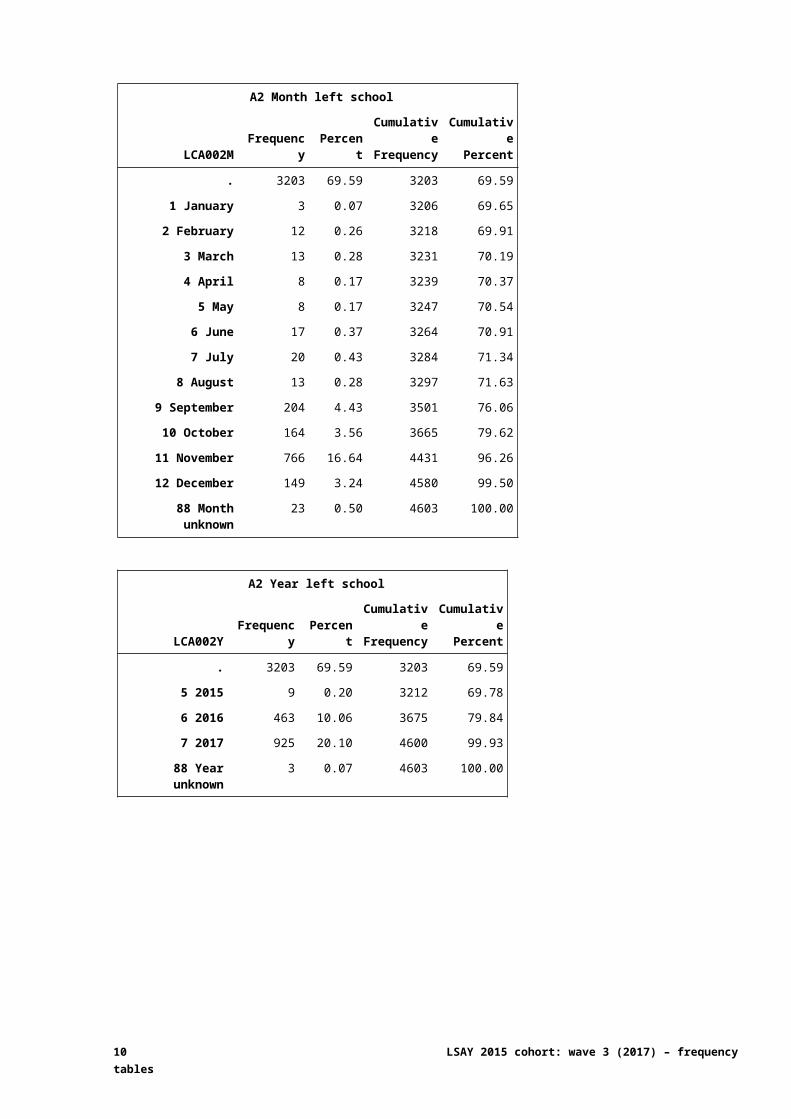
A2 Month left school
LCA002M Frequency PercentCumulativeFrequency
CumulativePercent
. 3203 69.59 3203 69.59
1 January 3 0.07 3206 69.65
2 February 12 0.26 3218 69.91
3 March 13 0.28 3231 70.19
4 April 8 0.17 3239 70.37
5 May 8 0.17 3247 70.54
6 June 17 0.37 3264 70.91
7 July 20 0.43 3284 71.34
8 August 13 0.28 3297 71.63
9 September 204 4.43 3501 76.06
10 October 164 3.56 3665 79.62
11 November 766 16.64 4431 96.26
12 December 149 3.24 4580 99.50
88 Month unknown 23 0.50 4603 100.00
A2 Year left school
LCA002Y Frequency PercentCumulativeFrequency
CumulativePercent
. 3203 69.59 3203 69.59
5 2015 9 0.20 3212 69.78
6 2016 463 10.06 3675 79.84
7 2017 925 20.10 4600 99.93
88 Year unknown 3 0.07 4603 100.00
8 LSAY 2015 cohort: wave 3 (2017) – frequency tables
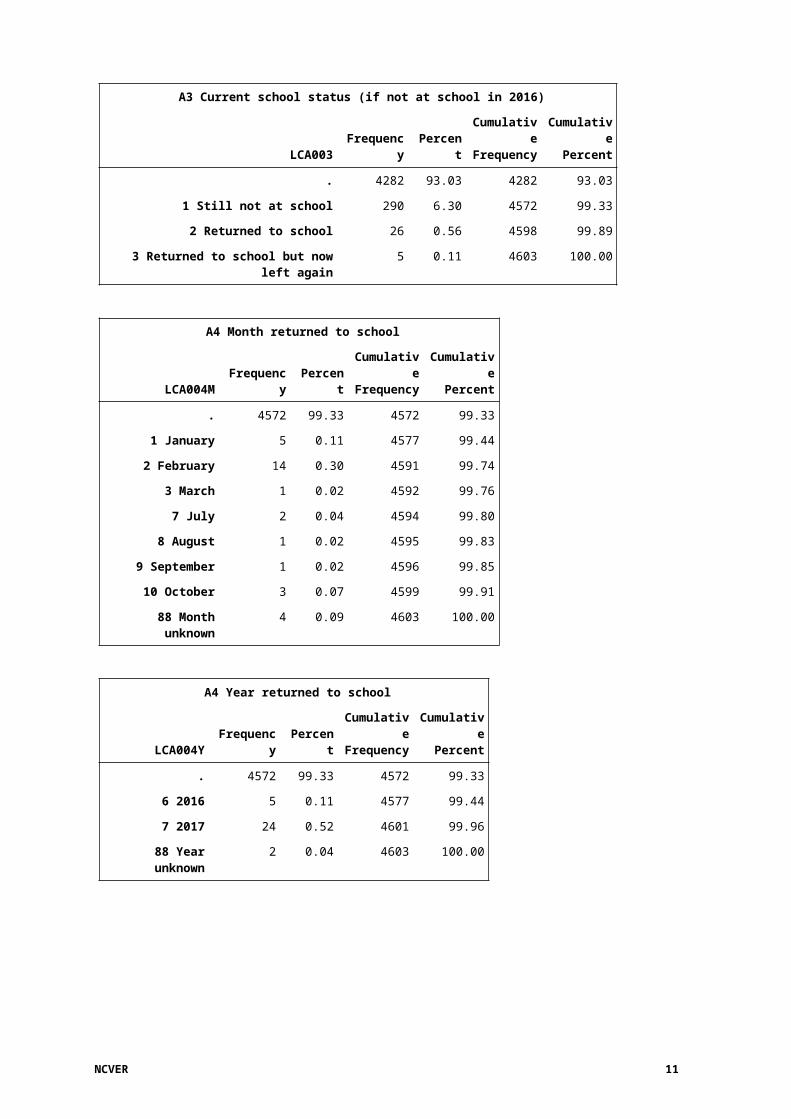
A3 Current school status (if not at school in 2016)
LCA003 Frequency PercentCumulativeFrequency
CumulativePercent
. 4282 93.03 4282 93.03
1 Still not at school 290 6.30 4572 99.33
2 Returned to school 26 0.56 4598 99.89
3 Returned to school but now left again 5 0.11 4603 100.00
A4 Month returned to school
LCA004M Frequency PercentCumulativeFrequency
CumulativePercent
. 4572 99.33 4572 99.33
1 January 5 0.11 4577 99.44
2 February 14 0.30 4591 99.74
3 March 1 0.02 4592 99.76
7 July 2 0.04 4594 99.80
8 August 1 0.02 4595 99.83
9 September 1 0.02 4596 99.85
10 October 3 0.07 4599 99.91
88 Month unknown 4 0.09 4603 100.00
A4 Year returned to school
LCA004Y Frequency PercentCumulativeFrequency
CumulativePercent
. 4572 99.33 4572 99.33
6 2016 5 0.11 4577 99.44
7 2017 24 0.52 4601 99.96
88 Year unknown 2 0.04 4603 100.00
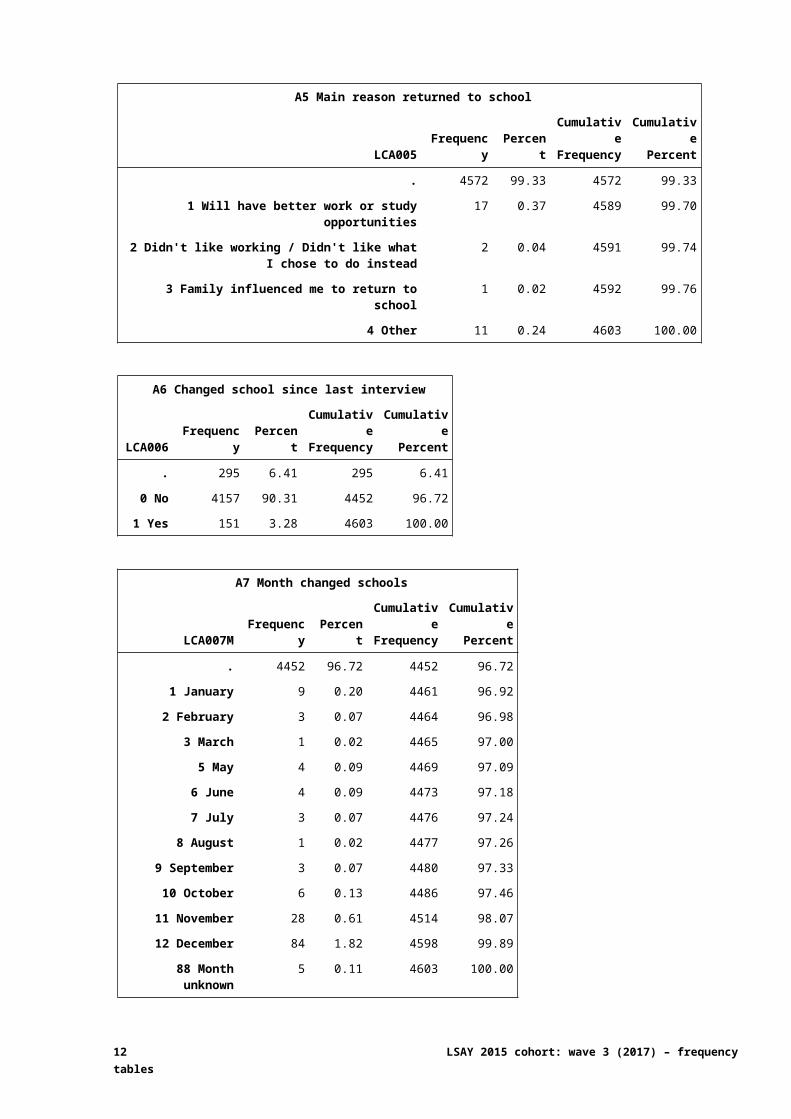
A5 Main reason returned to school
LCA005 Frequency PercentCumulativeFrequency
CumulativePercent
. 4572 99.33 4572 99.33
1 Will have better work or study opportunities 17 0.37 4589 99.70
2 Didn't like working / Didn't like what I chose to do instead
2 0.04 4591 99.74
3 Family influenced me to return to school 1 0.02 4592 99.76
4 Other 11 0.24 4603 100.00
NCVER 9
A6 Changed school since last interview
LCA006 Frequency PercentCumulativeFrequency
CumulativePercent
. 295 6.41 295 6.41
0 No 4157 90.31 4452 96.72
1 Yes 151 3.28 4603 100.00
A7 Month changed schools
LCA007M Frequency PercentCumulativeFrequency
CumulativePercent
. 4452 96.72 4452 96.72
1 January 9 0.20 4461 96.92
2 February 3 0.07 4464 96.98
3 March 1 0.02 4465 97.00
5 May 4 0.09 4469 97.09
6 June 4 0.09 4473 97.18
7 July 3 0.07 4476 97.24
8 August 1 0.02 4477 97.26
9 September 3 0.07 4480 97.33
10 October 6 0.13 4486 97.46
11 November 28 0.61 4514 98.07
12 December 84 1.82 4598 99.89
88 Month unknown 5 0.11 4603 100.00
A7 Year changed schools
LCA007Y Frequency PercentCumulativeFrequency
CumulativePercent
. 4452 96.72 4452 96.72
5 2015 5 0.11 4457 96.83
6 2016 124 2.69 4581 99.52
7 2017 22 0.48 4603 100.00
A8 ACARA code of current/most recent school
LCA008 Frequency PercentCumulativeFrequency
CumulativePercent
. 4452 96.72 4452 96.72
ACARA school code 151 3.28 4603 100.00
10 LSAY 2015 cohort: wave 3 (2017) – frequency tables
A8 Derived state of current/most recent school
LCA008X Frequency PercentCumulativeFrequency
CumulativePercent
. 4452 96.72 4452 96.72
1 NSW 14 0.30 4466 97.02
2 VIC 28 0.61 4494 97.63
3 QLD 14 0.30 4508 97.94
4 SA 16 0.35 4524 98.28
5 WA 8 0.17 4532 98.46
6 TAS 53 1.15 4585 99.61
7 NT 5 0.11 4590 99.72
8 ACT 13 0.28 4603 100.00
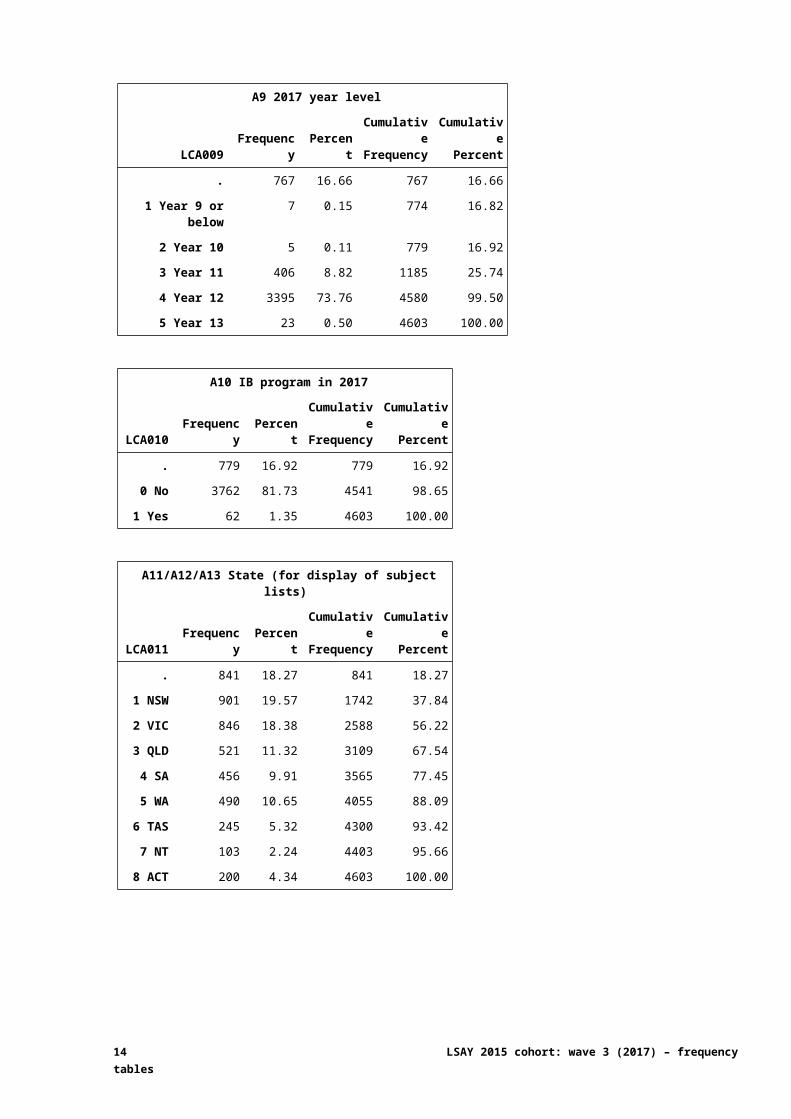
A9 2017 year level
LCA009 Frequency PercentCumulativeFrequency
CumulativePercent
. 767 16.66 767 16.66
1 Year 9 or below 7 0.15 774 16.82
2 Year 10 5 0.11 779 16.92
3 Year 11 406 8.82 1185 25.74
4 Year 12 3395 73.76 4580 99.50
5 Year 13 23 0.50 4603 100.00
A10 IB program in 2017
LCA010 Frequency PercentCumulativeFrequency
CumulativePercent
. 779 16.92 779 16.92
0 No 3762 81.73 4541 98.65
1 Yes 62 1.35 4603 100.00
NCVER 11
A11/A12/A13 State (for display of subject lists)
LCA011 Frequency PercentCumulativeFrequency
CumulativePercent
. 841 18.27 841 18.27
1 NSW 901 19.57 1742 37.84
2 VIC 846 18.38 2588 56.22
3 QLD 521 11.32 3109 67.54
4 SA 456 9.91 3565 77.45
5 WA 490 10.65 4055 88.09
6 TAS 245 5.32 4300 93.42
7 NT 103 2.24 4403 95.66
8 ACT 200 4.34 4603 100.00
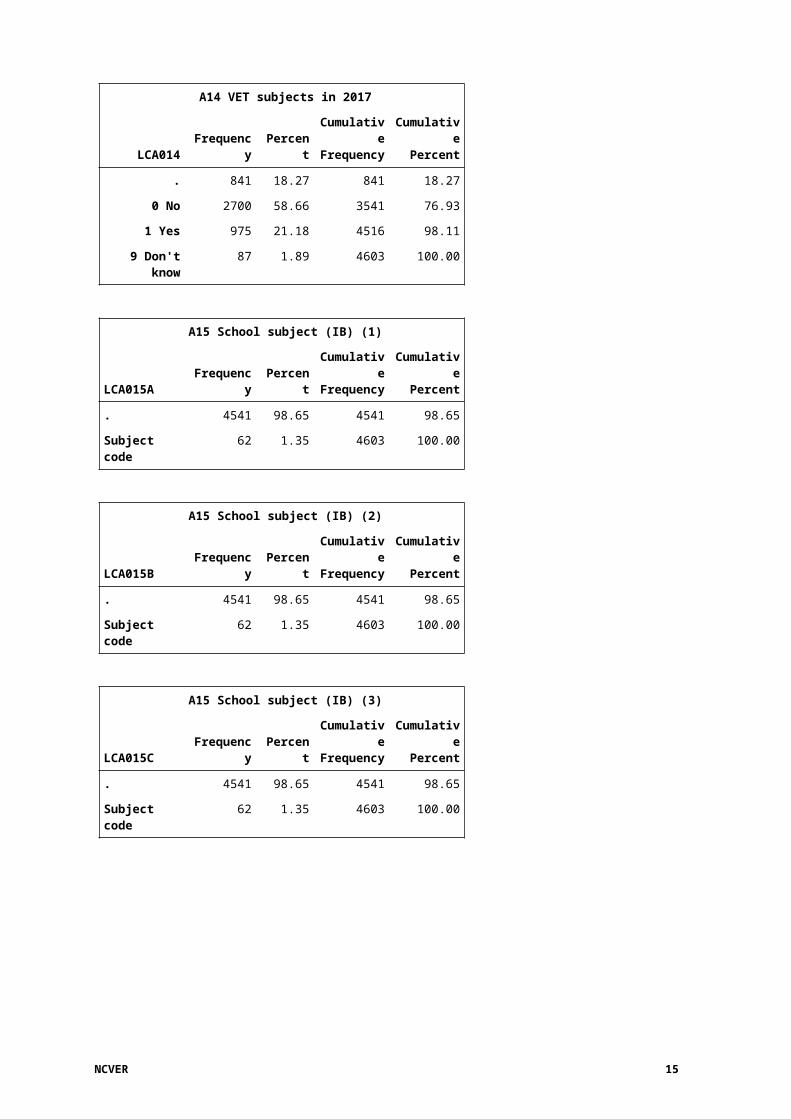
A14 VET subjects in 2017
LCA014 Frequency PercentCumulativeFrequency
CumulativePercent
. 841 18.27 841 18.27
0 No 2700 58.66 3541 76.93
1 Yes 975 21.18 4516 98.11
9 Don't know 87 1.89 4603 100.00
A15 School subject (IB) (1)
LCA015A Frequency PercentCumulativeFrequency
CumulativePercent
. 4541 98.65 4541 98.65
Subject code 62 1.35 4603 100.00
A15 School subject (IB) (2)
LCA015B Frequency PercentCumulativeFrequency
CumulativePercent
. 4541 98.65 4541 98.65
Subject code 62 1.35 4603 100.00
A15 School subject (IB) (3)
LCA015C Frequency PercentCumulativeFrequency
CumulativePercent
. 4541 98.65 4541 98.65
Subject code 62 1.35 4603 100.00
12 LSAY 2015 cohort: wave 3 (2017) – frequency tables

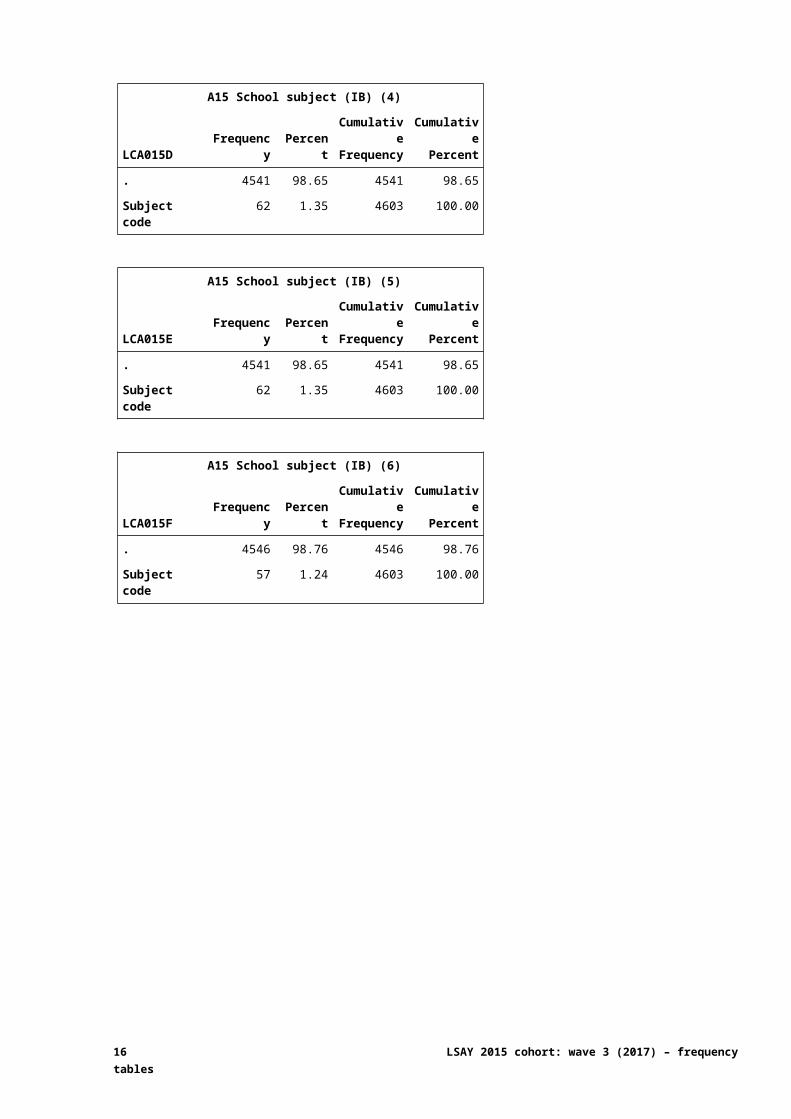
A15 School subject (IB) (4)
LCA015D Frequency PercentCumulativeFrequency
CumulativePercent
. 4541 98.65 4541 98.65
Subject code 62 1.35 4603 100.00
A15 School subject (IB) (5)
LCA015E Frequency PercentCumulativeFrequency
CumulativePercent
. 4541 98.65 4541 98.65
Subject code 62 1.35 4603 100.00
A15 School subject (IB) (6)
LCA015F Frequency PercentCumulativeFrequency
CumulativePercent
. 4546 98.76 4546 98.76
Subject code 57 1.24 4603 100.00
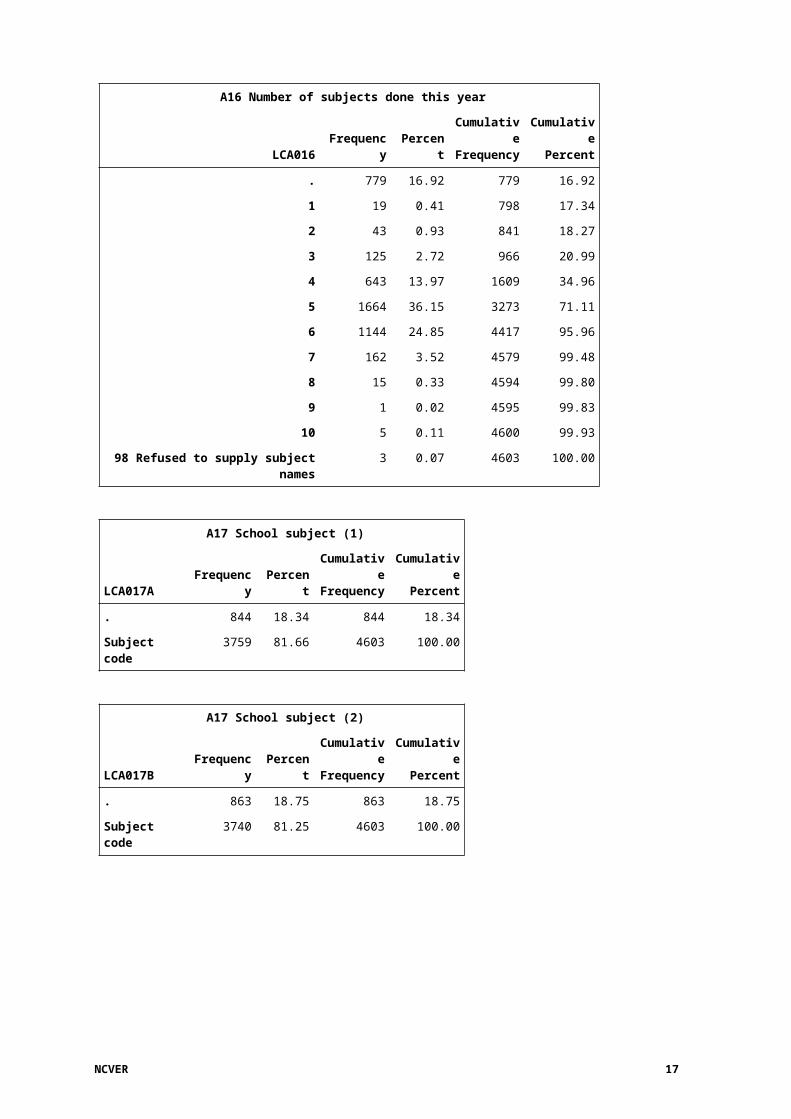
A16 Number of subjects done this year
LCA016 Frequency PercentCumulativeFrequency
CumulativePercent
. 779 16.92 779 16.92
1 19 0.41 798 17.34
2 43 0.93 841 18.27
3 125 2.72 966 20.99
4 643 13.97 1609 34.96
5 1664 36.15 3273 71.11
6 1144 24.85 4417 95.96
7 162 3.52 4579 99.48
8 15 0.33 4594 99.80
9 1 0.02 4595 99.83
10 5 0.11 4600 99.93
98 Refused to supply subject names 3 0.07 4603 100.00
A17 School subject (1)
LCA017A Frequency PercentCumulativeFrequency
CumulativePercent
. 844 18.34 844 18.34
Subject code 3759 81.66 4603 100.00
NCVER 13
A17 School subject (2)
LCA017B Frequency PercentCumulativeFrequency
CumulativePercent
. 863 18.75 863 18.75
Subject code 3740 81.25 4603 100.00
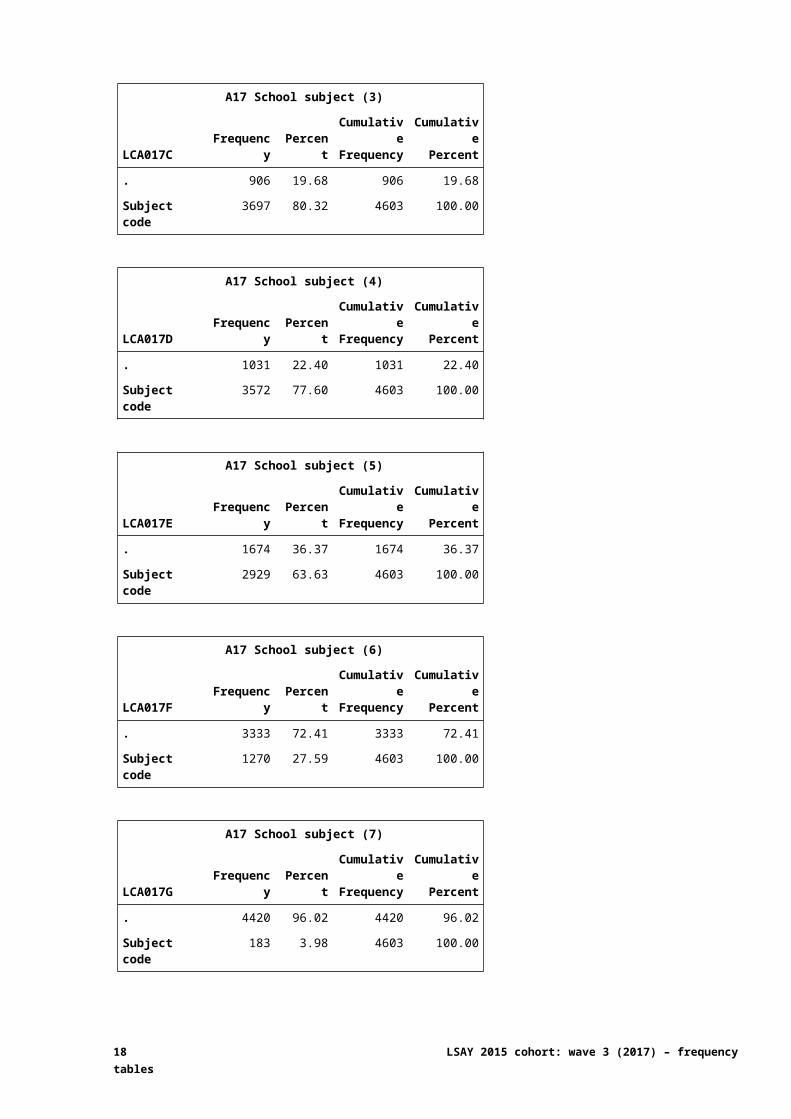
A17 School subject (3)
LCA017C Frequency PercentCumulativeFrequency
CumulativePercent
. 906 19.68 906 19.68
Subject code 3697 80.32 4603 100.00
A17 School subject (4)
LCA017D Frequency PercentCumulativeFrequency
CumulativePercent
. 1031 22.40 1031 22.40
Subject code 3572 77.60 4603 100.00
A17 School subject (5)
LCA017E Frequency PercentCumulativeFrequency
CumulativePercent
. 1674 36.37 1674 36.37
Subject code 2929 63.63 4603 100.00
A17 School subject (6)
LCA017F Frequency PercentCumulativeFrequency
CumulativePercent
. 3333 72.41 3333 72.41
Subject code 1270 27.59 4603 100.00
A17 School subject (7)
LCA017G Frequency PercentCumulativeFrequency
CumulativePercent
. 4420 96.02 4420 96.02
Subject code 183 3.98 4603 100.00
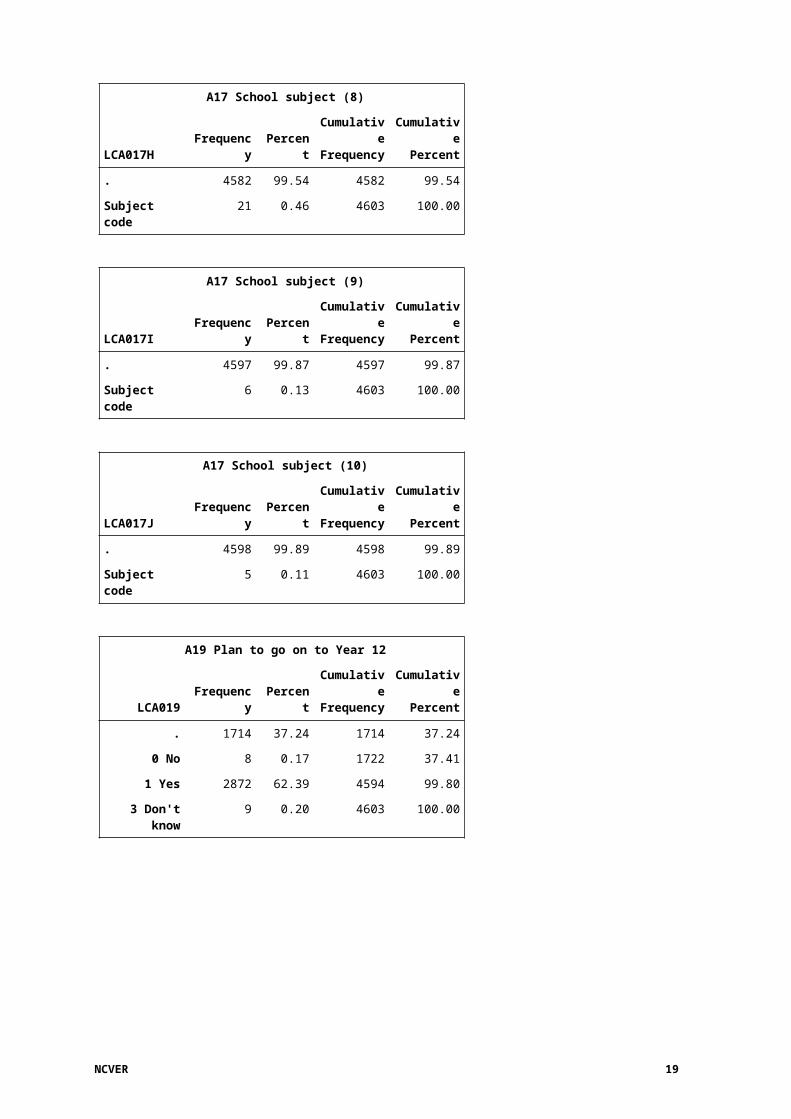
A17 School subject (8)
LCA017H Frequency PercentCumulativeFrequency
CumulativePercent
. 4582 99.54 4582 99.54
Subject code 21 0.46 4603 100.00
14 LSAY 2015 cohort: wave 3 (2017) – frequency tables
A17 School subject (9)
LCA017I Frequency PercentCumulativeFrequency
CumulativePercent
. 4597 99.87 4597 99.87
Subject code 6 0.13 4603 100.00
A17 School subject (10)
LCA017J Frequency PercentCumulativeFrequency
CumulativePercent
. 4598 99.89 4598 99.89
Subject code 5 0.11 4603 100.00
A19 Plan to go on to Year 12
LCA019 Frequency PercentCumulativeFrequency
CumulativePercent
. 1714 37.24 1714 37.24
0 No 8 0.17 1722 37.41
1 Yes 2872 62.39 4594 99.80
3 Don't know 9 0.20 4603 100.00
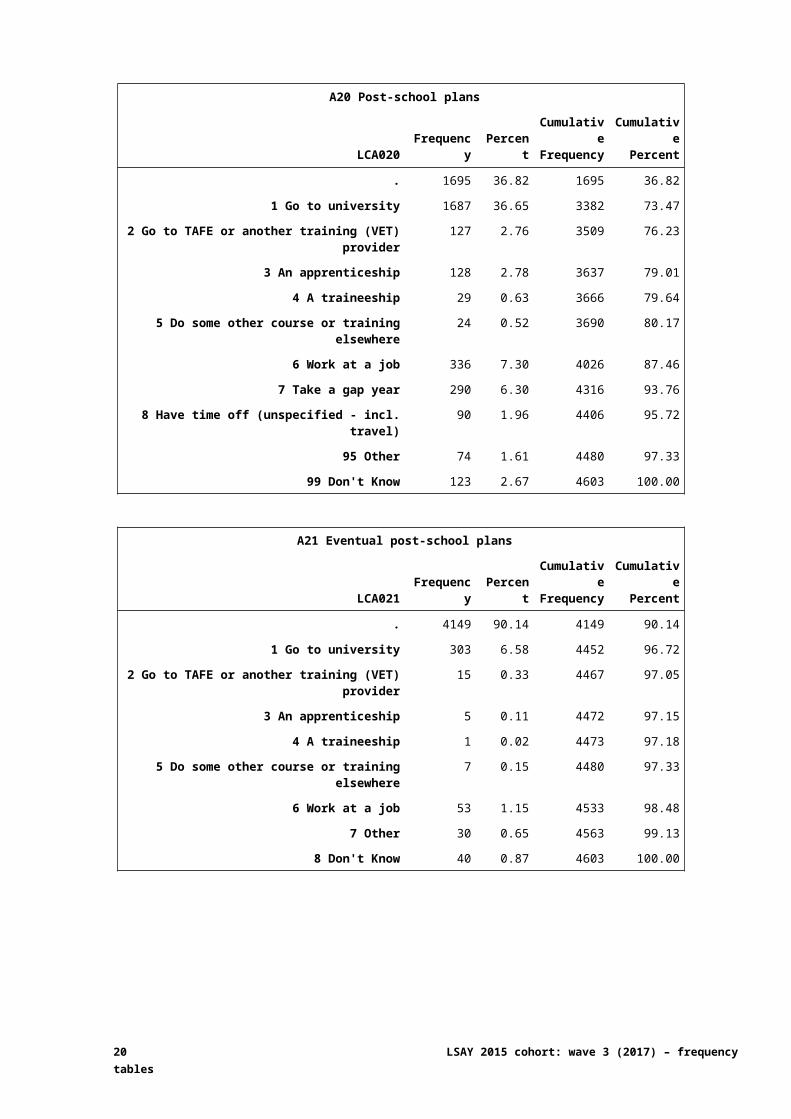
A20 Post-school plans
LCA020 Frequency PercentCumulativeFrequency
CumulativePercent
. 1695 36.82 1695 36.82
1 Go to university 1687 36.65 3382 73.47
2 Go to TAFE or another training (VET) provider 127 2.76 3509 76.23
3 An apprenticeship 128 2.78 3637 79.01
4 A traineeship 29 0.63 3666 79.64
5 Do some other course or training elsewhere 24 0.52 3690 80.17
6 Work at a job 336 7.30 4026 87.46
7 Take a gap year 290 6.30 4316 93.76
8 Have time off (unspecified - incl. travel) 90 1.96 4406 95.72
95 Other 74 1.61 4480 97.33
99 Don't Know 123 2.67 4603 100.00
NCVER 15
A21 Eventual post-school plans
LCA021 Frequency PercentCumulativeFrequency
CumulativePercent
. 4149 90.14 4149 90.14
1 Go to university 303 6.58 4452 96.72
2 Go to TAFE or another training (VET) provider 15 0.33 4467 97.05
3 An apprenticeship 5 0.11 4472 97.15
4 A traineeship 1 0.02 4473 97.18
5 Do some other course or training elsewhere 7 0.15 4480 97.33
6 Work at a job 53 1.15 4533 98.48
7 Other 30 0.65 4563 99.13
8 Don't Know 40 0.87 4603 100.00
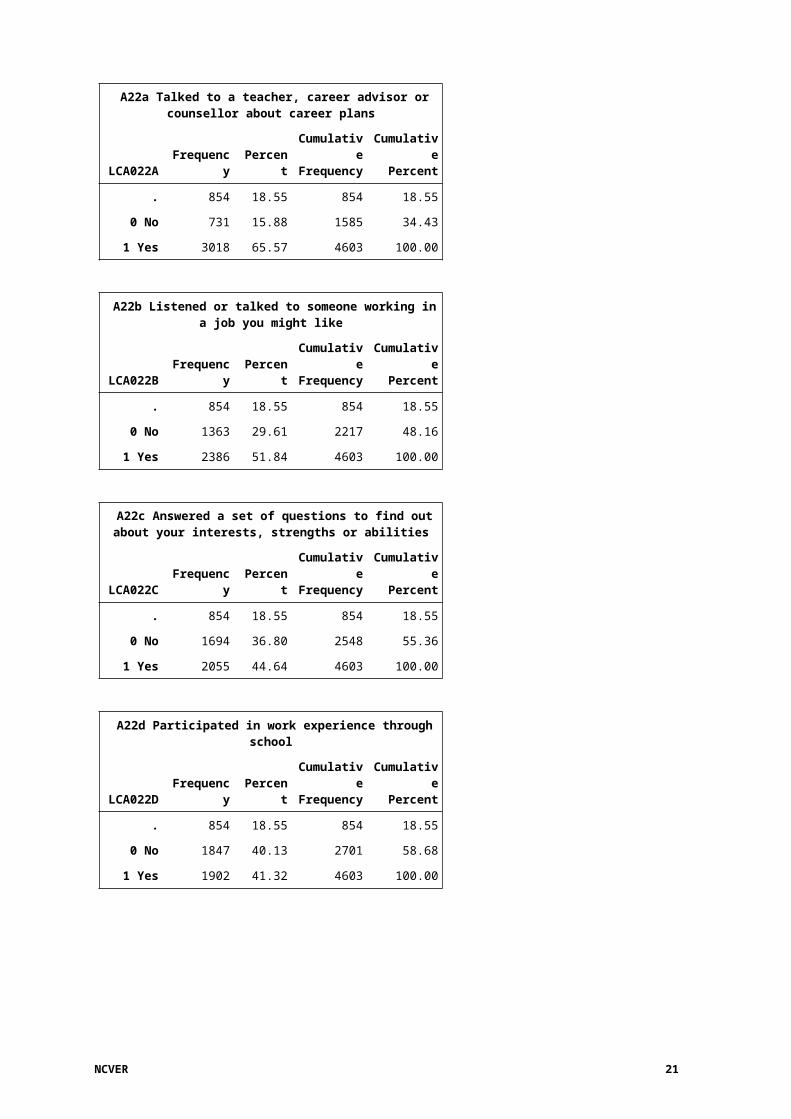
A22a Talked to a teacher, career advisor or counsellor about career plans
LCA022A Frequency PercentCumulativeFrequency
CumulativePercent
. 854 18.55 854 18.55
0 No 731 15.88 1585 34.43
1 Yes 3018 65.57 4603 100.00
A22b Listened or talked to someone working in a job you might like
LCA022B Frequency PercentCumulativeFrequency
CumulativePercent
. 854 18.55 854 18.55
0 No 1363 29.61 2217 48.16
1 Yes 2386 51.84 4603 100.00
A22c Answered a set of questions to find out about your interests, strengths or abilities
LCA022C Frequency PercentCumulativeFrequency
CumulativePercent
. 854 18.55 854 18.55
0 No 1694 36.80 2548 55.36
1 Yes 2055 44.64 4603 100.00
A22d Participated in work experience through school
LCA022D Frequency PercentCumulativeFrequency
CumulativePercent
. 854 18.55 854 18.55
0 No 1847 40.13 2701 58.68
1 Yes 1902 41.32 4603 100.00
16 LSAY 2015 cohort: wave 3 (2017) – frequency tables
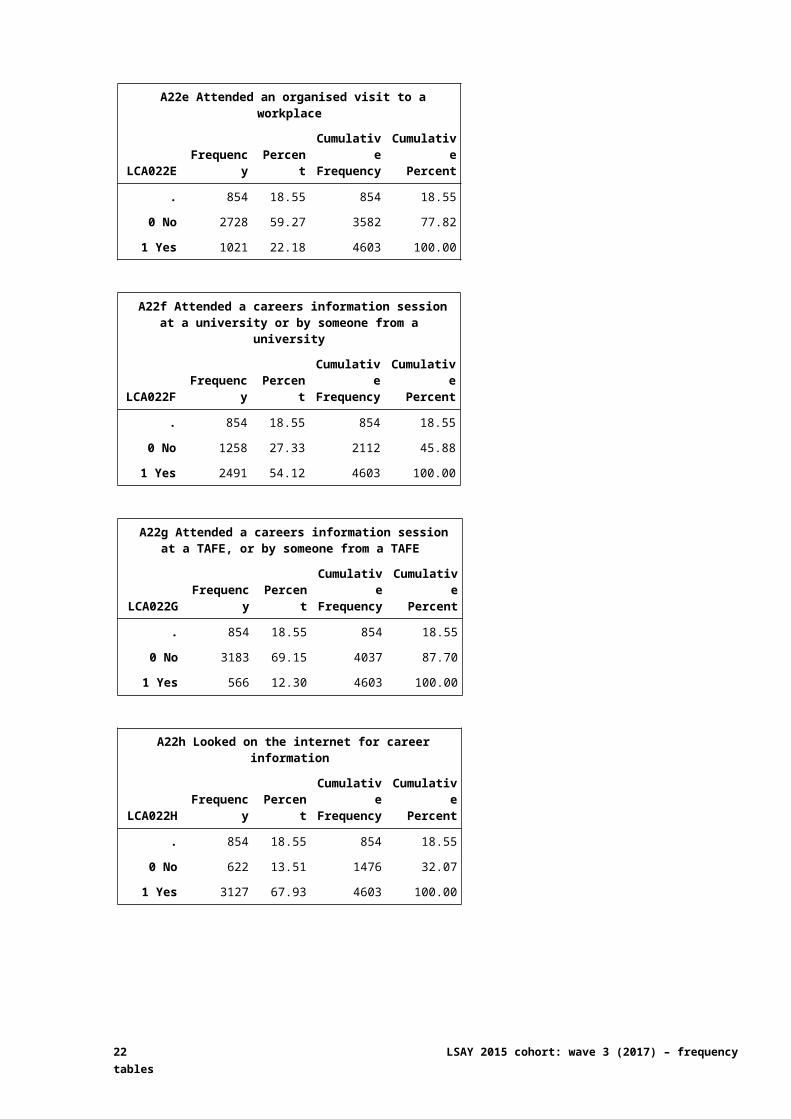
A22e Attended an organised visit to a workplace
LCA022E Frequency PercentCumulativeFrequency
CumulativePercent
. 854 18.55 854 18.55
0 No 2728 59.27 3582 77.82
1 Yes 1021 22.18 4603 100.00
A22f Attended a careers information session at a university or by someone from a university
LCA022F Frequency PercentCumulativeFrequency
CumulativePercent
. 854 18.55 854 18.55
0 No 1258 27.33 2112 45.88
1 Yes 2491 54.12 4603 100.00
A22g Attended a careers information session at a TAFE, or by someone from a TAFE
LCA022G Frequency PercentCumulativeFrequency
CumulativePercent
. 854 18.55 854 18.55
0 No 3183 69.15 4037 87.70
1 Yes 566 12.30 4603 100.00
A22h Looked on the internet for career information
LCA022H Frequency PercentCumulativeFrequency
CumulativePercent
. 854 18.55 854 18.55
0 No 622 13.51 1476 32.07
1 Yes 3127 67.93 4603 100.00
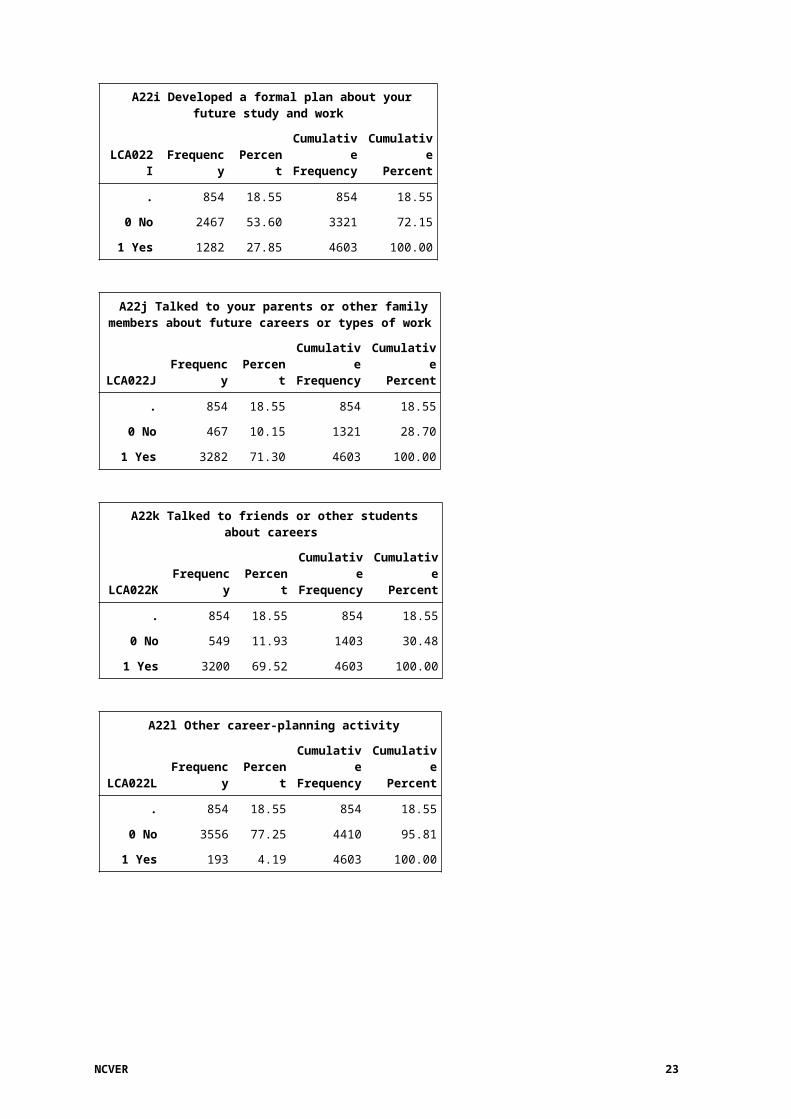
A22i Developed a formal plan about your future study and work
LCA022I Frequency PercentCumulativeFrequency
CumulativePercent
. 854 18.55 854 18.55
0 No 2467 53.60 3321 72.15
1 Yes 1282 27.85 4603 100.00
NCVER 17
A22j Talked to your parents or other family members about future careers or types of work
LCA022J Frequency PercentCumulativeFrequency
CumulativePercent
. 854 18.55 854 18.55
0 No 467 10.15 1321 28.70
1 Yes 3282 71.30 4603 100.00
A22k Talked to friends or other students about careers
LCA022K Frequency PercentCumulativeFrequency
CumulativePercent
. 854 18.55 854 18.55
0 No 549 11.93 1403 30.48
1 Yes 3200 69.52 4603 100.00
A22l Other career-planning activity
LCA022L Frequency PercentCumulativeFrequency
CumulativePercent
. 854 18.55 854 18.55
0 No 3556 77.25 4410 95.81
1 Yes 193 4.19 4603 100.00
18 LSAY 2015 cohort: wave 3 (2017) – frequency tables
A23 Most important source of career information (if more than one source)
LCA023 Frequency PercentCumulativeFrequency
CumulativePercent
. 1011 21.96 1011 21.96
1 Talked to a teacher, career advisor or counsellor at your school about your career plans
837 18.18 1848 40.15
2 Listened or talked to someone working in a job you might like
439 9.54 2287 49.68
3 Answered a set of questions to find out about your interests, strengths or abilities
39 0.85 2326 50.53
4 Participated in work experience through school 229 4.98 2555 55.51
5 Attended an organised visit to a workplace 36 0.78 2591 56.29
6 Attended a careers information session at a university, or by someone from a university
694 15.08 3285 71.37
7 Attended a careers information session at a TAFE, or by someone from a TAFE
35 0.76 3320 72.13
8 Looked on the internet for career information 446 9.69 3766 81.82
9 Developed a formal plan about your future study and work
28 0.61 3794 82.42
10 Talked to your parents or other family members about future careers or types of work
513 11.14 4307 93.57
11 Talked to friends or other students about careers
127 2.76 4434 96.33
99 Don't know 169 3.67 4603 100.00
NCVER 19
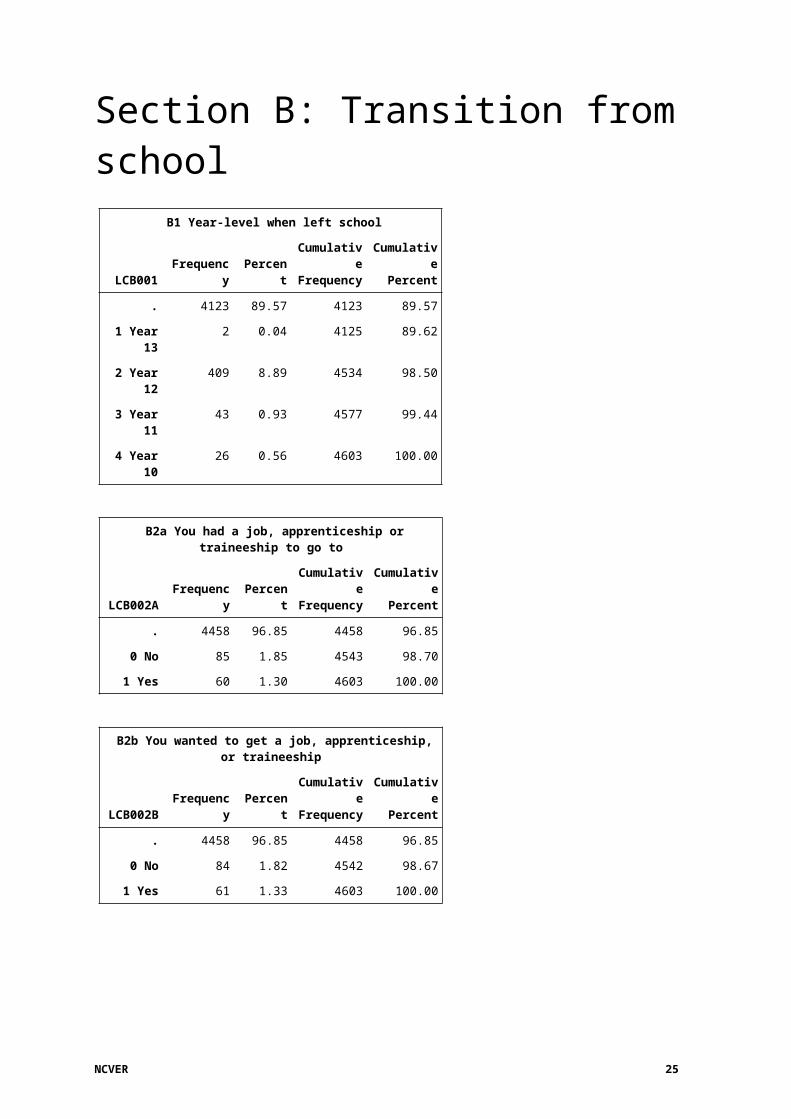
Section B: Transition from school
B1 Year-level when left school
LCB001 Frequency PercentCumulativeFrequency
CumulativePercent
. 4123 89.57 4123 89.57
1 Year 13 2 0.04 4125 89.62
2 Year 12 409 8.89 4534 98.50
3 Year 11 43 0.93 4577 99.44
4 Year 10 26 0.56 4603 100.00
B2a You had a job, apprenticeship or traineeship to go to
LCB002A Frequency PercentCumulativeFrequency
CumulativePercent
. 4458 96.85 4458 96.85
0 No 85 1.85 4543 98.70
1 Yes 60 1.30 4603 100.00
B2b You wanted to get a job, apprenticeship, or traineeship
LCB002B Frequency PercentCumulativeFrequency
CumulativePercent
. 4458 96.85 4458 96.85
0 No 84 1.82 4542 98.67
1 Yes 61 1.33 4603 100.00
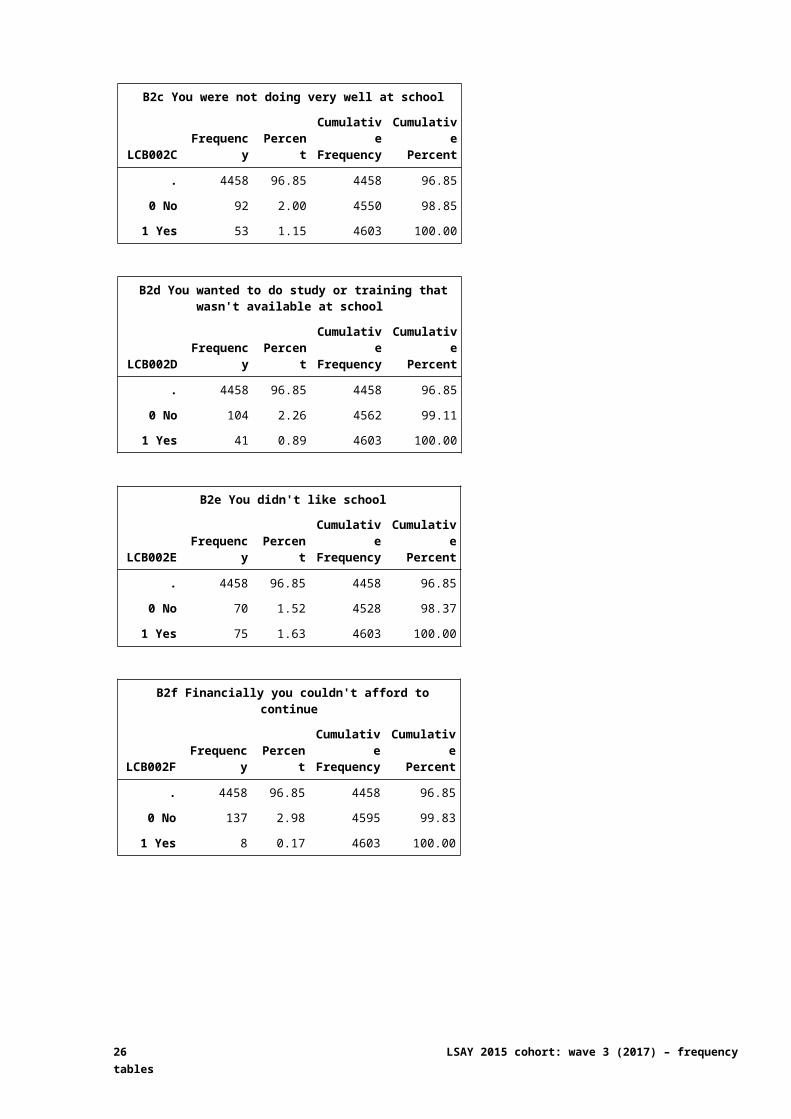
B2c You were not doing very well at school
LCB002C Frequency PercentCumulativeFrequency
CumulativePercent
. 4458 96.85 4458 96.85
0 No 92 2.00 4550 98.85
1 Yes 53 1.15 4603 100.00
20 LSAY 2015 cohort: wave 3 (2017) – frequency tables
B2d You wanted to do study or training that wasn't available at school
LCB002D Frequency PercentCumulativeFrequency
CumulativePercent
. 4458 96.85 4458 96.85
0 No 104 2.26 4562 99.11
1 Yes 41 0.89 4603 100.00
B2e You didn't like school
LCB002E Frequency PercentCumulativeFrequency
CumulativePercent
. 4458 96.85 4458 96.85
0 No 70 1.52 4528 98.37
1 Yes 75 1.63 4603 100.00
B2f Financially you couldn't afford to continue
LCB002F Frequency PercentCumulativeFrequency
CumulativePercent
. 4458 96.85 4458 96.85
0 No 137 2.98 4595 99.83
1 Yes 8 0.17 4603 100.00
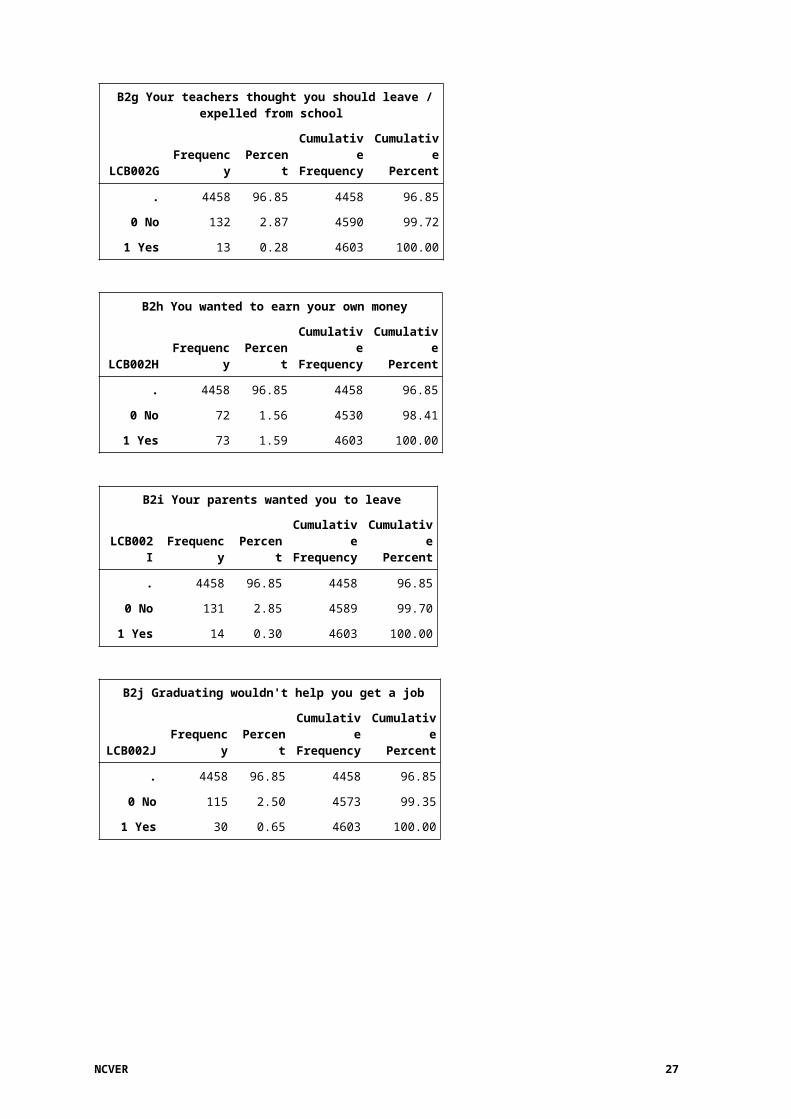
B2g Your teachers thought you should leave / expelled from school
LCB002G Frequency PercentCumulativeFrequency
CumulativePercent
. 4458 96.85 4458 96.85
0 No 132 2.87 4590 99.72
1 Yes 13 0.28 4603 100.00
B2h You wanted to earn your own money
LCB002H Frequency PercentCumulativeFrequency
CumulativePercent
. 4458 96.85 4458 96.85
0 No 72 1.56 4530 98.41
1 Yes 73 1.59 4603 100.00
NCVER 21
B2i Your parents wanted you to leave
LCB002I Frequency PercentCumulativeFrequency
CumulativePercent
. 4458 96.85 4458 96.85
0 No 131 2.85 4589 99.70
1 Yes 14 0.30 4603 100.00
B2j Graduating wouldn't help you get a job
LCB002J Frequency PercentCumulativeFrequency
CumulativePercent
. 4458 96.85 4458 96.85
0 No 115 2.50 4573 99.35
1 Yes 30 0.65 4603 100.00
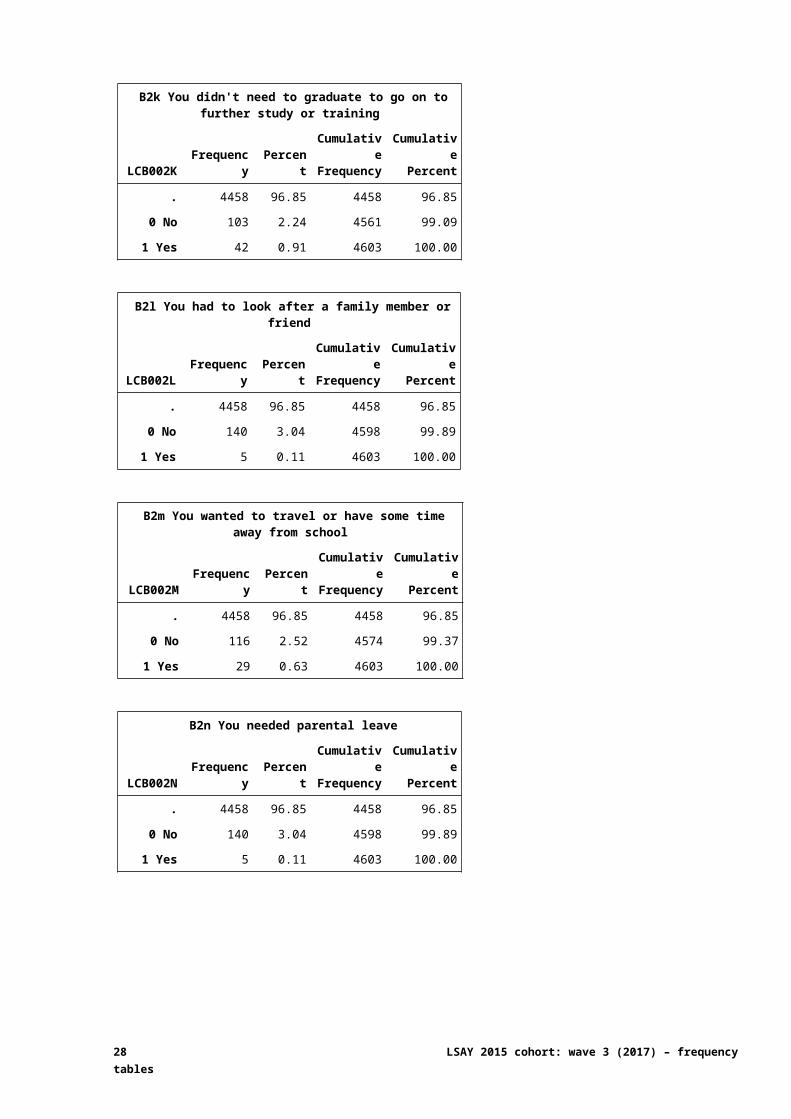
B2k You didn't need to graduate to go on to further study or training
LCB002K Frequency PercentCumulativeFrequency
CumulativePercent
. 4458 96.85 4458 96.85
0 No 103 2.24 4561 99.09
1 Yes 42 0.91 4603 100.00
B2l You had to look after a family member or friend
LCB002L Frequency PercentCumulativeFrequency
CumulativePercent
. 4458 96.85 4458 96.85
0 No 140 3.04 4598 99.89
1 Yes 5 0.11 4603 100.00
B2m You wanted to travel or have some time away from school
LCB002M Frequency PercentCumulativeFrequency
CumulativePercent
. 4458 96.85 4458 96.85
0 No 116 2.52 4574 99.37
1 Yes 29 0.63 4603 100.00
22 LSAY 2015 cohort: wave 3 (2017) – frequency tables
B2n You needed parental leave
LCB002N Frequency PercentCumulativeFrequency
CumulativePercent
. 4458 96.85 4458 96.85
0 No 140 3.04 4598 99.89
1 Yes 5 0.11 4603 100.00
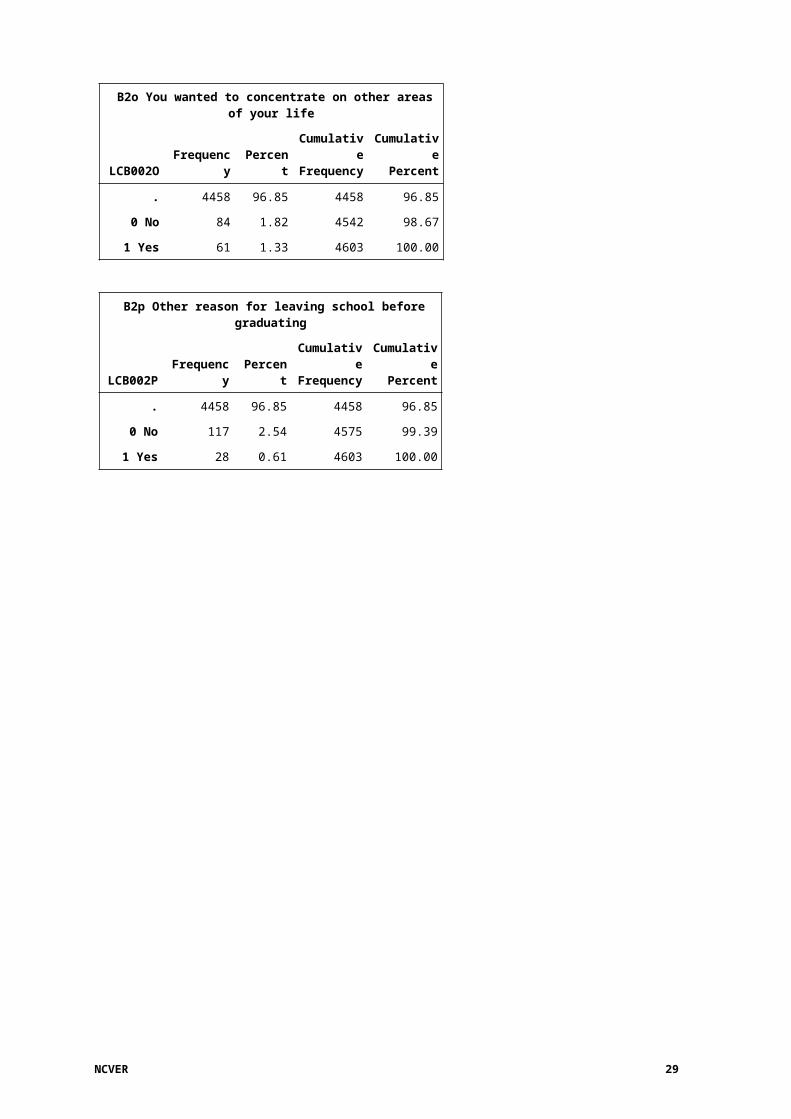
B2o You wanted to concentrate on other areas of your life
LCB002O Frequency PercentCumulativeFrequency
CumulativePercent
. 4458 96.85 4458 96.85
0 No 84 1.82 4542 98.67
1 Yes 61 1.33 4603 100.00
B2p Other reason for leaving school before graduating
LCB002P Frequency PercentCumulativeFrequency
CumulativePercent
. 4458 96.85 4458 96.85
0 No 117 2.54 4575 99.39
1 Yes 28 0.61 4603 100.00
NCVER 23

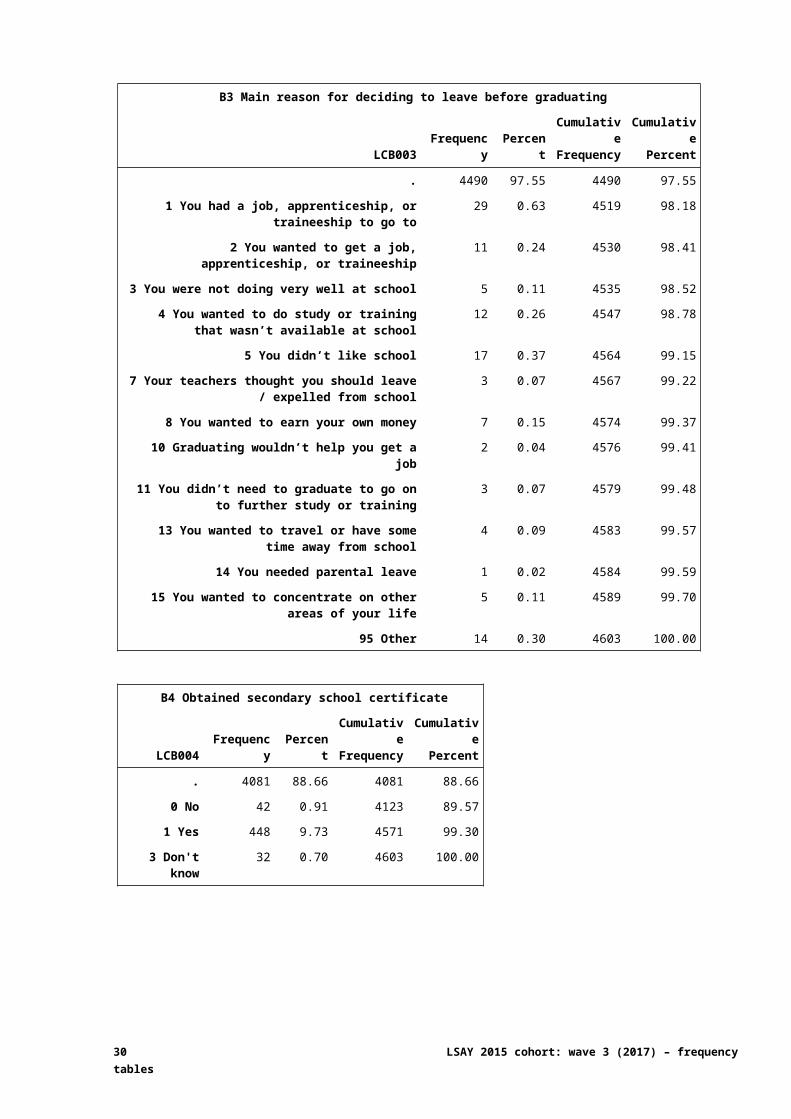
B3 Main reason for deciding to leave before graduating
LCB003 Frequency PercentCumulativeFrequency
CumulativePercent
. 4490 97.55 4490 97.55
1 You had a job, apprenticeship, or traineeship to go to
29 0.63 4519 98.18
2 You wanted to get a job, apprenticeship, or traineeship
11 0.24 4530 98.41
3 You were not doing very well at school 5 0.11 4535 98.52
4 You wanted to do study or training that wasn’t available at school
12 0.26 4547 98.78
5 You didn’t like school 17 0.37 4564 99.15
7 Your teachers thought you should leave / expelled from school
3 0.07 4567 99.22
8 You wanted to earn your own money 7 0.15 4574 99.37
10 Graduating wouldn’t help you get a job 2 0.04 4576 99.41
11 You didn’t need to graduate to go on to further study or training
3 0.07 4579 99.48
13 You wanted to travel or have some time away from school
4 0.09 4583 99.57
14 You needed parental leave 1 0.02 4584 99.59
15 You wanted to concentrate on other areas of your life
5 0.11 4589 99.70
95 Other 14 0.30 4603 100.00
B4 Obtained secondary school certificate
LCB004 Frequency PercentCumulativeFrequency
CumulativePercent
. 4081 88.66 4081 88.66
0 No 42 0.91 4123 89.57
1 Yes 448 9.73 4571 99.30
3 Don't know 32 0.70 4603 100.00
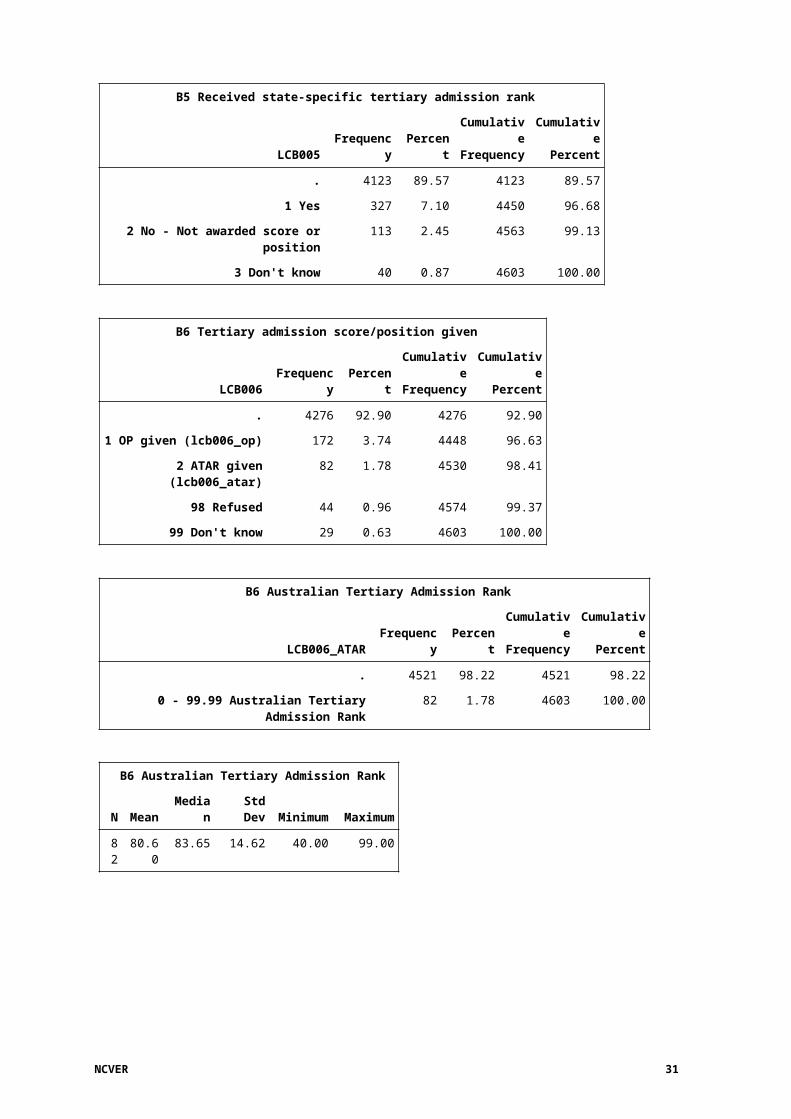
B5 Received state-specific tertiary admission rank
LCB005 Frequency PercentCumulativeFrequency
CumulativePercent
. 4123 89.57 4123 89.57
1 Yes 327 7.10 4450 96.68
2 No - Not awarded score or position 113 2.45 4563 99.13
3 Don't know 40 0.87 4603 100.00
24 LSAY 2015 cohort: wave 3 (2017) – frequency tables
B6 Tertiary admission score/position given
LCB006 Frequency PercentCumulativeFrequency
CumulativePercent
. 4276 92.90 4276 92.90
1 OP given (lcb006_op) 172 3.74 4448 96.63
2 ATAR given (lcb006_atar) 82 1.78 4530 98.41
98 Refused 44 0.96 4574 99.37
99 Don't know 29 0.63 4603 100.00
B6 Australian Tertiary Admission Rank
LCB006_ATAR Frequency PercentCumulativeFrequency
CumulativePercent
. 4521 98.22 4521 98.22
0 - 99.99 Australian Tertiary Admission Rank 82 1.78 4603 100.00
B6 Australian Tertiary Admission Rank
N Mean Median Std Dev Minimum Maximum
82 80.60 83.65 14.62 40.00 99.00
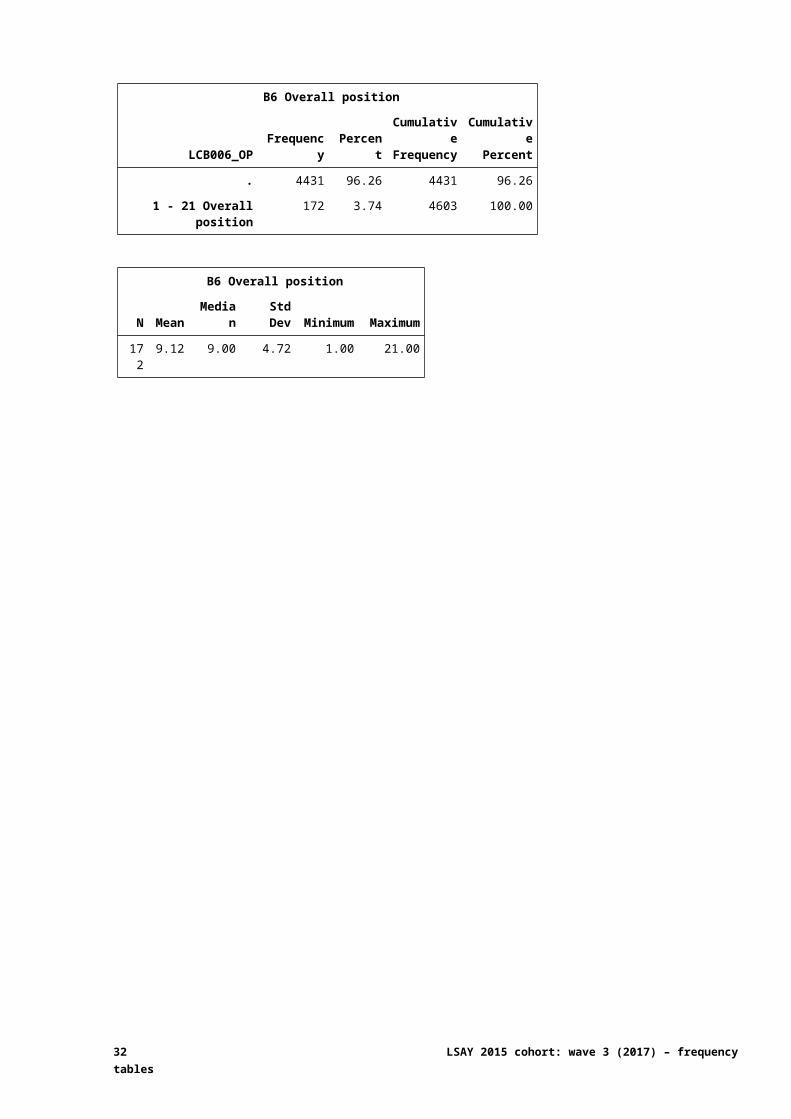
B6 Overall position
LCB006_OP Frequency PercentCumulativeFrequency
CumulativePercent
. 4431 96.26 4431 96.26
1 - 21 Overall position 172 3.74 4603 100.00
B6 Overall position
N Mean Median Std Dev Minimum Maximum
172 9.12 9.00 4.72 1.00 21.00
NCVER 25
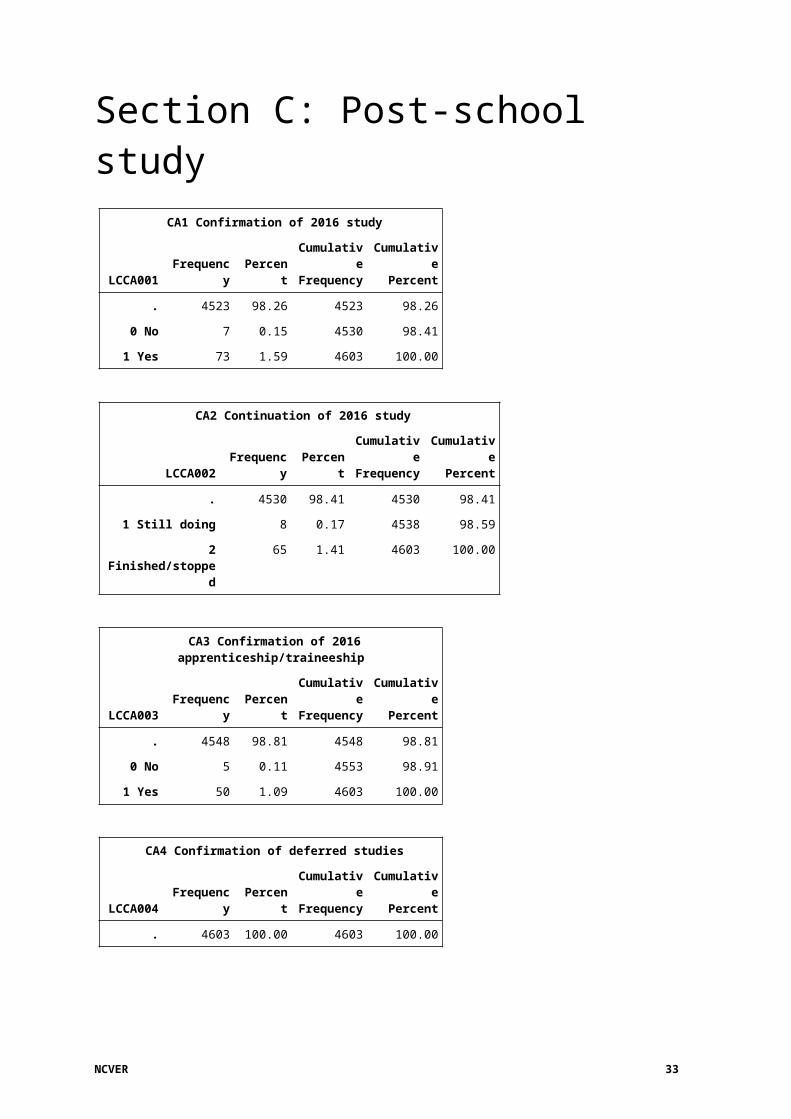
Section C: Post-school study CA1 Confirmation of 2016 study
LCCA001 Frequency PercentCumulativeFrequency
CumulativePercent
. 4523 98.26 4523 98.26
0 No 7 0.15 4530 98.41
1 Yes 73 1.59 4603 100.00
CA2 Continuation of 2016 study
LCCA002 Frequency PercentCumulativeFrequency
CumulativePercent
. 4530 98.41 4530 98.41
1 Still doing 8 0.17 4538 98.59
2 Finished/stopped 65 1.41 4603 100.00
CA3 Confirmation of 2016 apprenticeship/traineeship
LCCA003 Frequency PercentCumulativeFrequency
CumulativePercent
. 4548 98.81 4548 98.81
0 No 5 0.11 4553 98.91
1 Yes 50 1.09 4603 100.00
CA4 Confirmation of deferred studies
LCCA004 Frequency PercentCumulativeFrequency
CumulativePercent
. 4603 100.00 4603 100.00
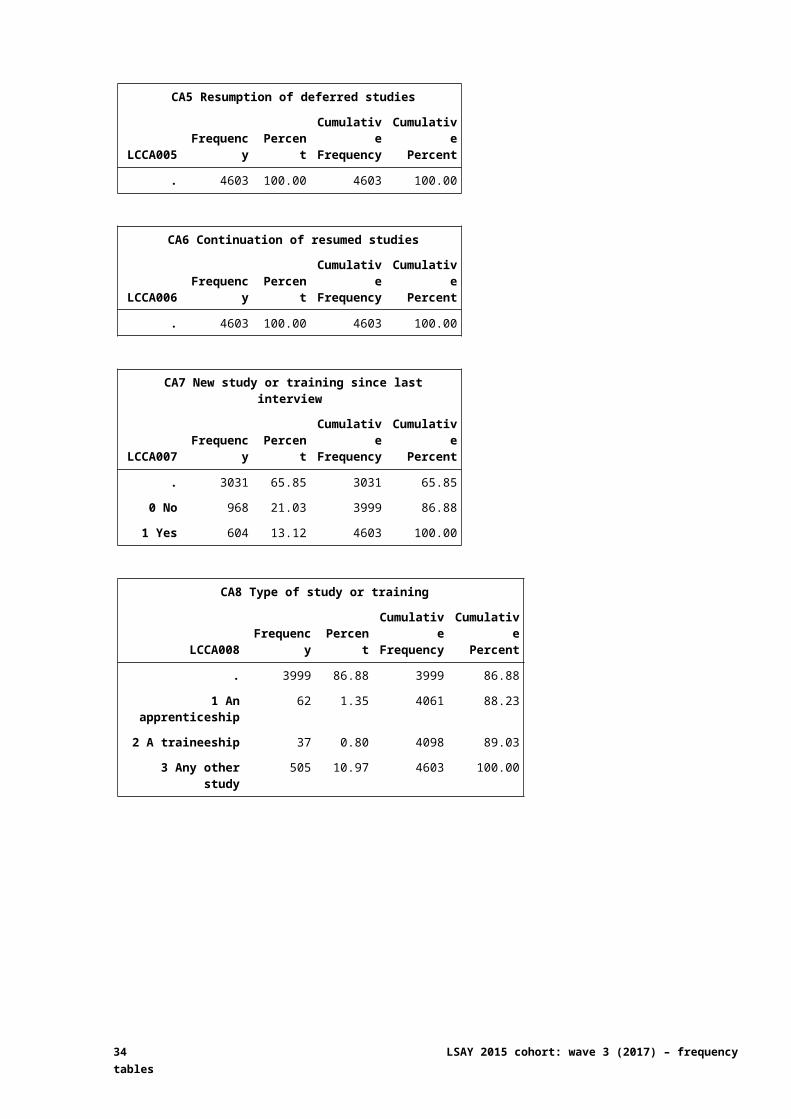
CA5 Resumption of deferred studies
LCCA005 Frequency PercentCumulativeFrequency
CumulativePercent
. 4603 100.00 4603 100.00
CA6 Continuation of resumed studies
LCCA006 Frequency PercentCumulativeFrequency
CumulativePercent
. 4603 100.00 4603 100.00
26 LSAY 2015 cohort: wave 3 (2017) – frequency tables
CA7 New study or training since last interview
LCCA007 Frequency PercentCumulativeFrequency
CumulativePercent
. 3031 65.85 3031 65.85
0 No 968 21.03 3999 86.88
1 Yes 604 13.12 4603 100.00
CA8 Type of study or training
LCCA008 Frequency PercentCumulativeFrequency
CumulativePercent
. 3999 86.88 3999 86.88
1 An apprenticeship 62 1.35 4061 88.23
2 A traineeship 37 0.80 4098 89.03
3 Any other study 505 10.97 4603 100.00
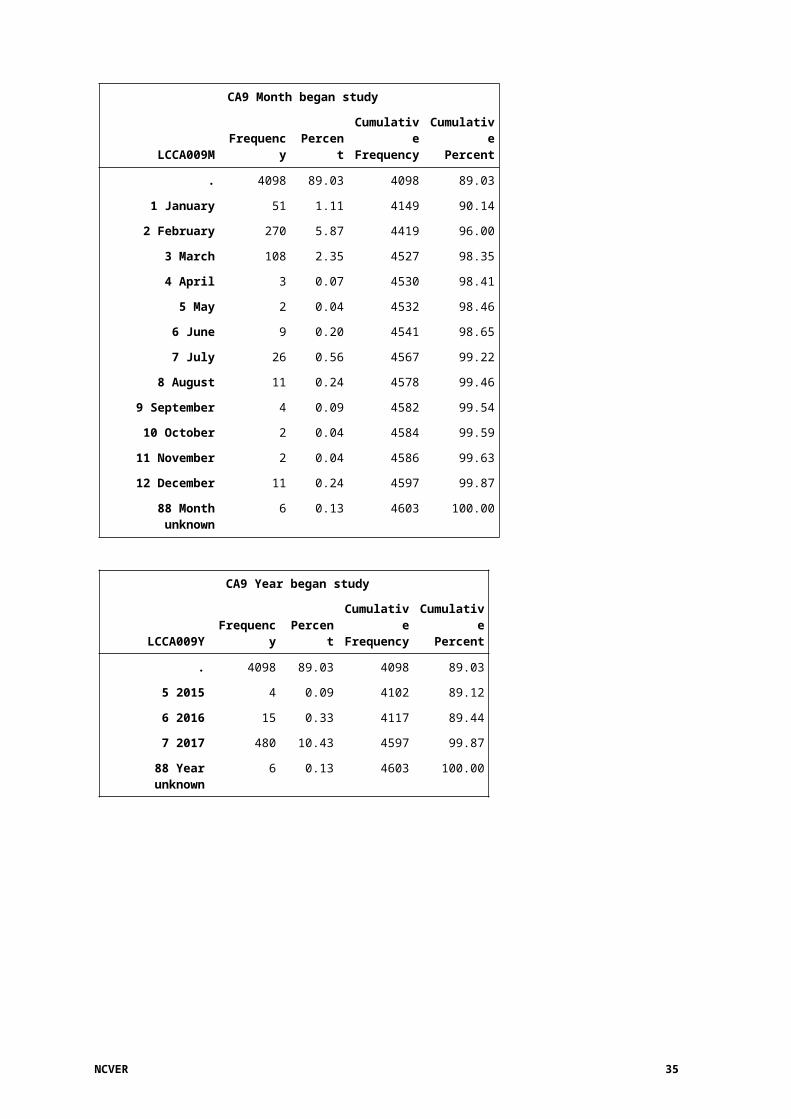
CA9 Month began study
LCCA009M Frequency PercentCumulativeFrequency
CumulativePercent
. 4098 89.03 4098 89.03
1 January 51 1.11 4149 90.14
2 February 270 5.87 4419 96.00
3 March 108 2.35 4527 98.35
4 April 3 0.07 4530 98.41
5 May 2 0.04 4532 98.46
6 June 9 0.20 4541 98.65
7 July 26 0.56 4567 99.22
8 August 11 0.24 4578 99.46
9 September 4 0.09 4582 99.54
10 October 2 0.04 4584 99.59
11 November 2 0.04 4586 99.63
12 December 11 0.24 4597 99.87
88 Month unknown 6 0.13 4603 100.00
CA9 Year began study
LCCA009Y Frequency PercentCumulativeFrequency
CumulativePercent
. 4098 89.03 4098 89.03
5 2015 4 0.09 4102 89.12
6 2016 15 0.33 4117 89.44
7 2017 480 10.43 4597 99.87
88 Year unknown 6 0.13 4603 100.00
NCVER 27
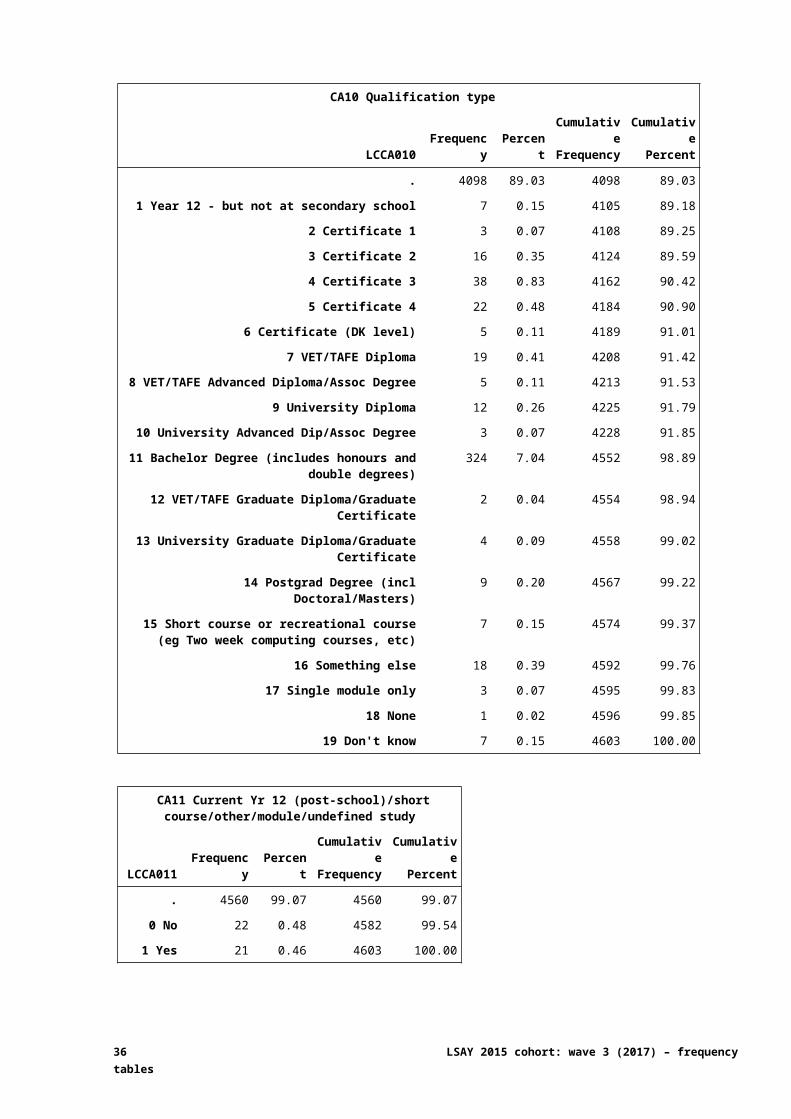
CA10 Qualification type
LCCA010 Frequency PercentCumulativeFrequency
CumulativePercent
. 4098 89.03 4098 89.03
1 Year 12 - but not at secondary school 7 0.15 4105 89.18
2 Certificate 1 3 0.07 4108 89.25
3 Certificate 2 16 0.35 4124 89.59
4 Certificate 3 38 0.83 4162 90.42
5 Certificate 4 22 0.48 4184 90.90
6 Certificate (DK level) 5 0.11 4189 91.01
7 VET/TAFE Diploma 19 0.41 4208 91.42
8 VET/TAFE Advanced Diploma/Assoc Degree 5 0.11 4213 91.53
9 University Diploma 12 0.26 4225 91.79
10 University Advanced Dip/Assoc Degree 3 0.07 4228 91.85
11 Bachelor Degree (includes honours and double degrees)
324 7.04 4552 98.89
12 VET/TAFE Graduate Diploma/Graduate Certificate
2 0.04 4554 98.94
13 University Graduate Diploma/Graduate Certificate
4 0.09 4558 99.02
14 Postgrad Degree (incl Doctoral/Masters) 9 0.20 4567 99.22
15 Short course or recreational course (eg Two week computing courses, etc)
7 0.15 4574 99.37
16 Something else 18 0.39 4592 99.76
17 Single module only 3 0.07 4595 99.83
18 None 1 0.02 4596 99.85
19 Don't know 7 0.15 4603 100.00
CA11 Current Yr 12 (post-school)/short course/other/module/undefined study
LCCA011 Frequency PercentCumulativeFrequency
CumulativePercent
. 4560 99.07 4560 99.07
0 No 22 0.48 4582 99.54
1 Yes 21 0.46 4603 100.00
28 LSAY 2015 cohort: wave 3 (2017) – frequency tables
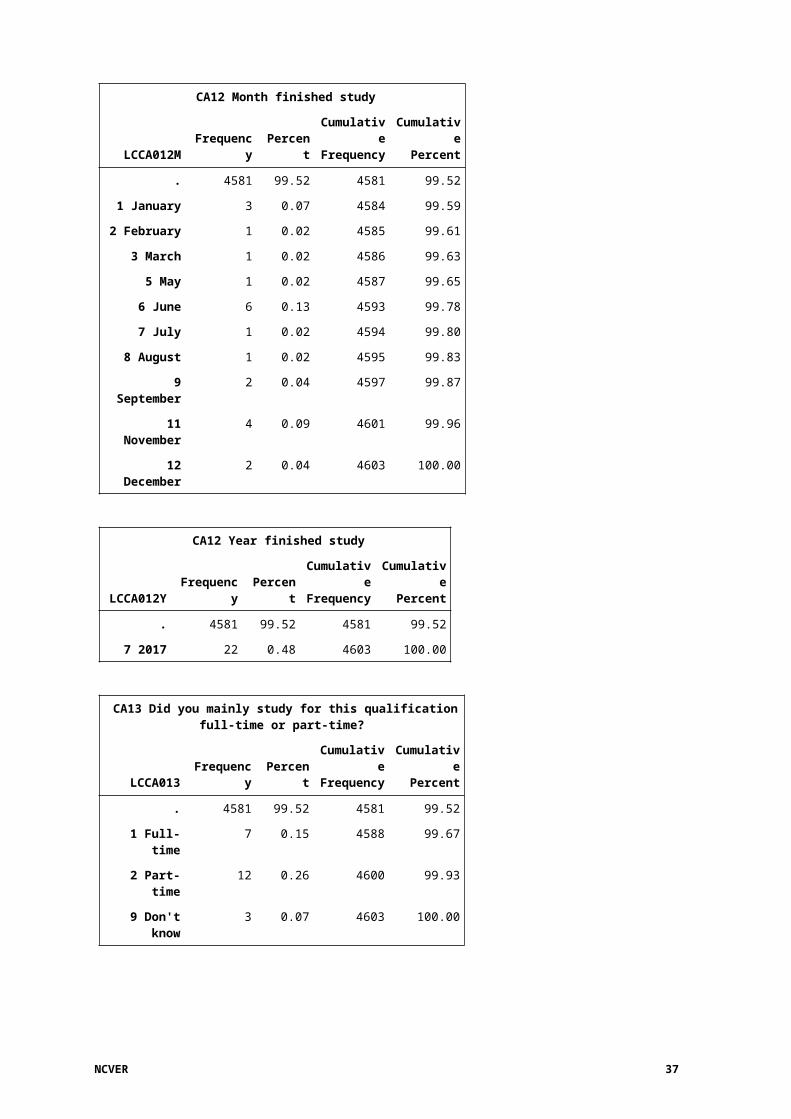
CA12 Month finished study
LCCA012M Frequency PercentCumulativeFrequency
CumulativePercent
. 4581 99.52 4581 99.52
1 January 3 0.07 4584 99.59
2 February 1 0.02 4585 99.61
3 March 1 0.02 4586 99.63
5 May 1 0.02 4587 99.65
6 June 6 0.13 4593 99.78
7 July 1 0.02 4594 99.80
8 August 1 0.02 4595 99.83
9 September 2 0.04 4597 99.87
11 November 4 0.09 4601 99.96
12 December 2 0.04 4603 100.00
CA12 Year finished study
LCCA012Y Frequency PercentCumulativeFrequency
CumulativePercent
. 4581 99.52 4581 99.52
7 2017 22 0.48 4603 100.00
CA13 Did you mainly study for this qualification full-time or part-time?
LCCA013 Frequency PercentCumulativeFrequency
CumulativePercent
. 4581 99.52 4581 99.52
1 Full-time 7 0.15 4588 99.67
2 Part-time 12 0.26 4600 99.93
9 Don't know 3 0.07 4603 100.00
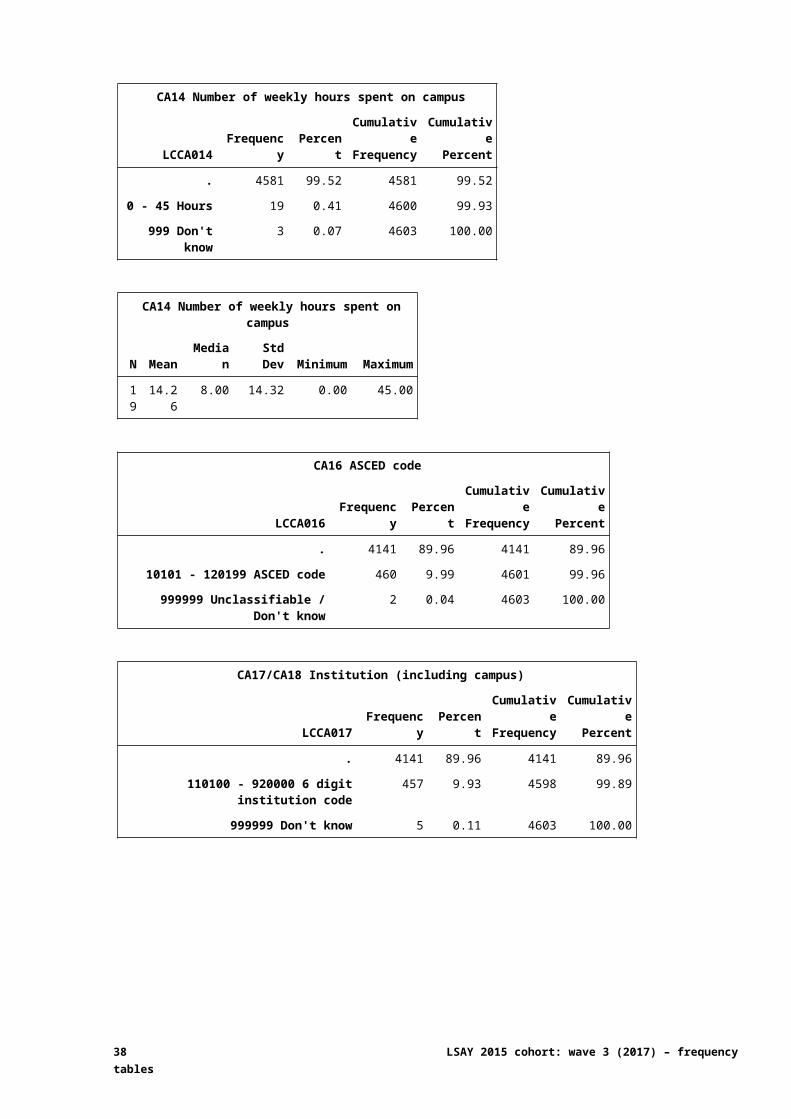
CA14 Number of weekly hours spent on campus
LCCA014 Frequency PercentCumulativeFrequency
CumulativePercent
. 4581 99.52 4581 99.52
0 - 45 Hours 19 0.41 4600 99.93
999 Don't know 3 0.07 4603 100.00
CA14 Number of weekly hours spent on campus
N Mean Median Std Dev Minimum Maximum
19 14.26 8.00 14.32 0.00 45.00
NCVER 29
CA16 ASCED code
LCCA016 Frequency PercentCumulativeFrequency
CumulativePercent
. 4141 89.96 4141 89.96
10101 - 120199 ASCED code 460 9.99 4601 99.96
999999 Unclassifiable / Don't know 2 0.04 4603 100.00
CA17/CA18 Institution (including campus)
LCCA017 Frequency PercentCumulativeFrequency
CumulativePercent
. 4141 89.96 4141 89.96
110100 - 920000 6 digit institution code 457 9.93 4598 99.89
999999 Don't know 5 0.11 4603 100.00
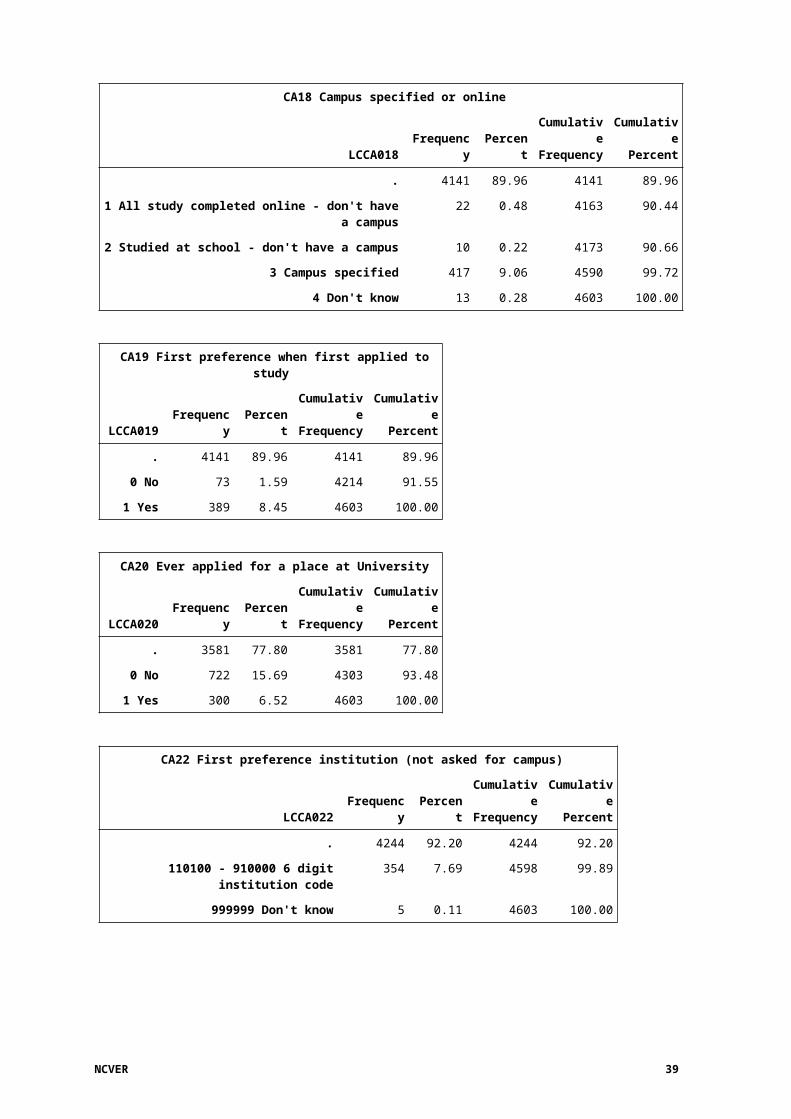
CA18 Campus specified or online
LCCA018 Frequency PercentCumulativeFrequency
CumulativePercent
. 4141 89.96 4141 89.96
1 All study completed online - don't have a campus 22 0.48 4163 90.44
2 Studied at school - don't have a campus 10 0.22 4173 90.66
3 Campus specified 417 9.06 4590 99.72
4 Don't know 13 0.28 4603 100.00
CA19 First preference when first applied to study
LCCA019 Frequency PercentCumulativeFrequency
CumulativePercent
. 4141 89.96 4141 89.96
0 No 73 1.59 4214 91.55
1 Yes 389 8.45 4603 100.00
CA20 Ever applied for a place at University
LCCA020 Frequency PercentCumulativeFrequency
CumulativePercent
. 3581 77.80 3581 77.80
0 No 722 15.69 4303 93.48
1 Yes 300 6.52 4603 100.00
30 LSAY 2015 cohort: wave 3 (2017) – frequency tables
CA22 First preference institution (not asked for campus)
LCCA022 Frequency PercentCumulativeFrequency
CumulativePercent
. 4244 92.20 4244 92.20
110100 - 910000 6 digit institution code 354 7.69 4598 99.89
999999 Don't know 5 0.11 4603 100.00
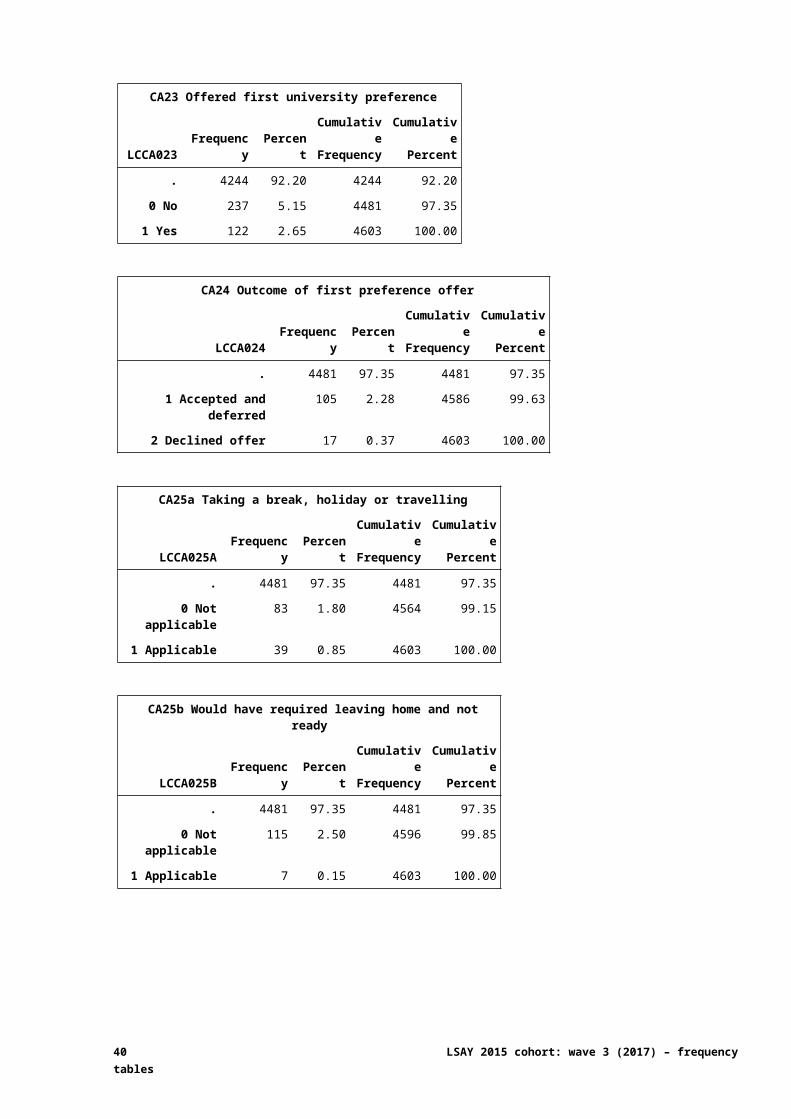
CA23 Offered first university preference
LCCA023 Frequency PercentCumulativeFrequency
CumulativePercent
. 4244 92.20 4244 92.20
0 No 237 5.15 4481 97.35
1 Yes 122 2.65 4603 100.00
CA24 Outcome of first preference offer
LCCA024 Frequency PercentCumulativeFrequency
CumulativePercent
. 4481 97.35 4481 97.35
1 Accepted and deferred 105 2.28 4586 99.63
2 Declined offer 17 0.37 4603 100.00
CA25a Taking a break, holiday or travelling
LCCA025A Frequency PercentCumulativeFrequency
CumulativePercent
. 4481 97.35 4481 97.35
0 Not applicable 83 1.80 4564 99.15
1 Applicable 39 0.85 4603 100.00
CA25b Would have required leaving home and not ready
LCCA025B Frequency PercentCumulativeFrequency
CumulativePercent
. 4481 97.35 4481 97.35
0 Not applicable 115 2.50 4596 99.85
1 Applicable 7 0.15 4603 100.00
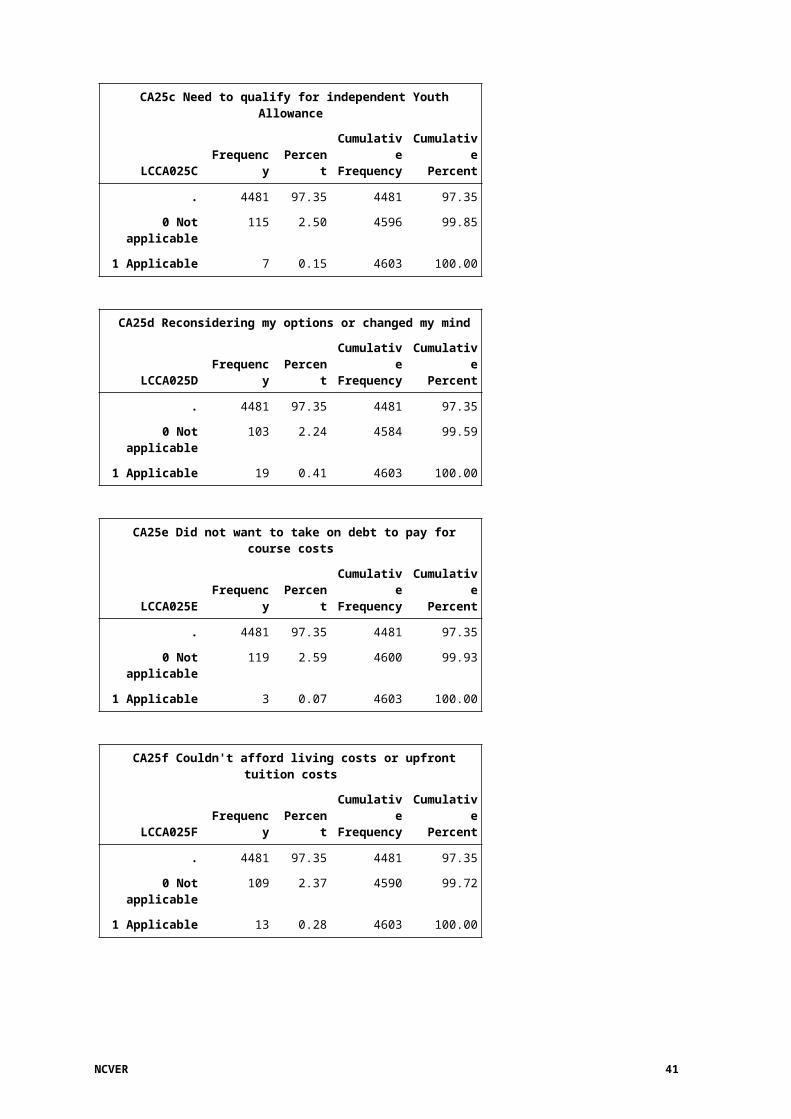
CA25c Need to qualify for independent Youth Allowance
LCCA025C Frequency PercentCumulativeFrequency
CumulativePercent
. 4481 97.35 4481 97.35
0 Not applicable 115 2.50 4596 99.85
1 Applicable 7 0.15 4603 100.00
NCVER 31
CA25d Reconsidering my options or changed my mind
LCCA025D Frequency PercentCumulativeFrequency
CumulativePercent
. 4481 97.35 4481 97.35
0 Not applicable 103 2.24 4584 99.59
1 Applicable 19 0.41 4603 100.00
CA25e Did not want to take on debt to pay for course costs
LCCA025E Frequency PercentCumulativeFrequency
CumulativePercent
. 4481 97.35 4481 97.35
0 Not applicable 119 2.59 4600 99.93
1 Applicable 3 0.07 4603 100.00
CA25f Couldn't afford living costs or upfront tuition costs
LCCA025F Frequency PercentCumulativeFrequency
CumulativePercent
. 4481 97.35 4481 97.35
0 Not applicable 109 2.37 4590 99.72
1 Applicable 13 0.28 4603 100.00
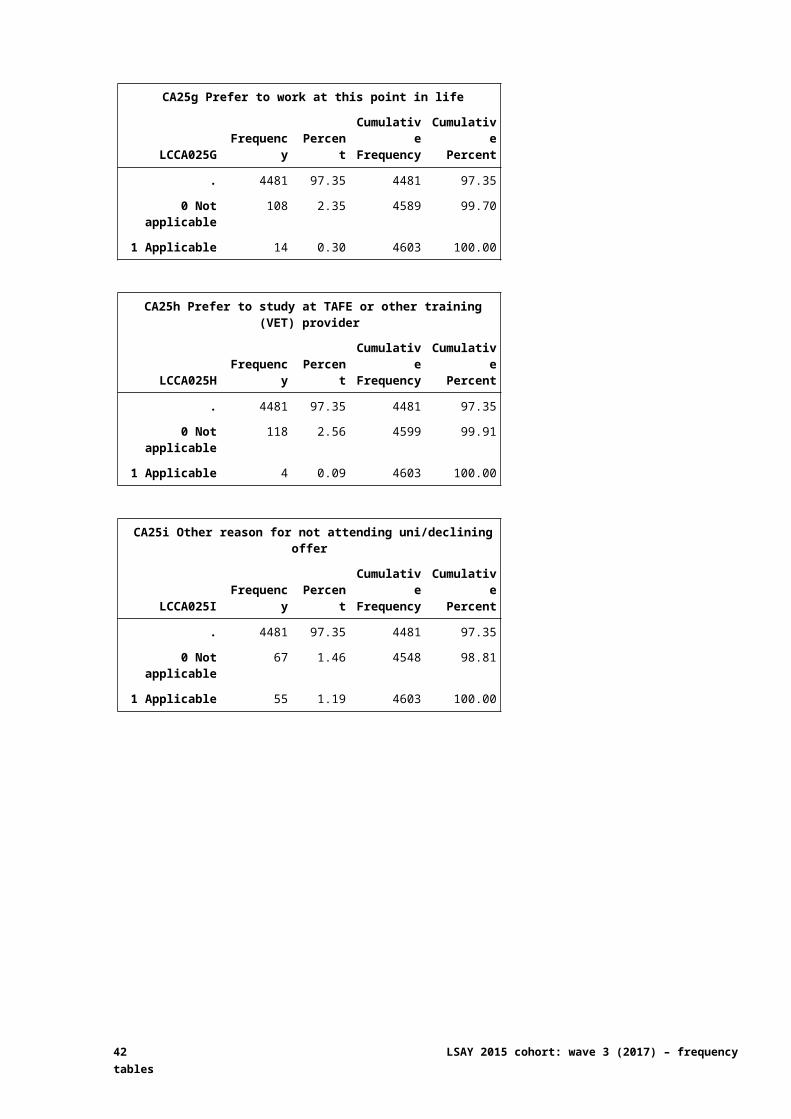
CA25g Prefer to work at this point in life
LCCA025G Frequency PercentCumulativeFrequency
CumulativePercent
. 4481 97.35 4481 97.35
0 Not applicable 108 2.35 4589 99.70
1 Applicable 14 0.30 4603 100.00
CA25h Prefer to study at TAFE or other training (VET) provider
LCCA025H Frequency PercentCumulativeFrequency
CumulativePercent
. 4481 97.35 4481 97.35
0 Not applicable 118 2.56 4599 99.91
1 Applicable 4 0.09 4603 100.00
CA25i Other reason for not attending uni/declining offer
LCCA025I Frequency PercentCumulativeFrequency
CumulativePercent
. 4481 97.35 4481 97.35
0 Not applicable 67 1.46 4548 98.81
1 Applicable 55 1.19 4603 100.00
32 LSAY 2015 cohort: wave 3 (2017) – frequency tables
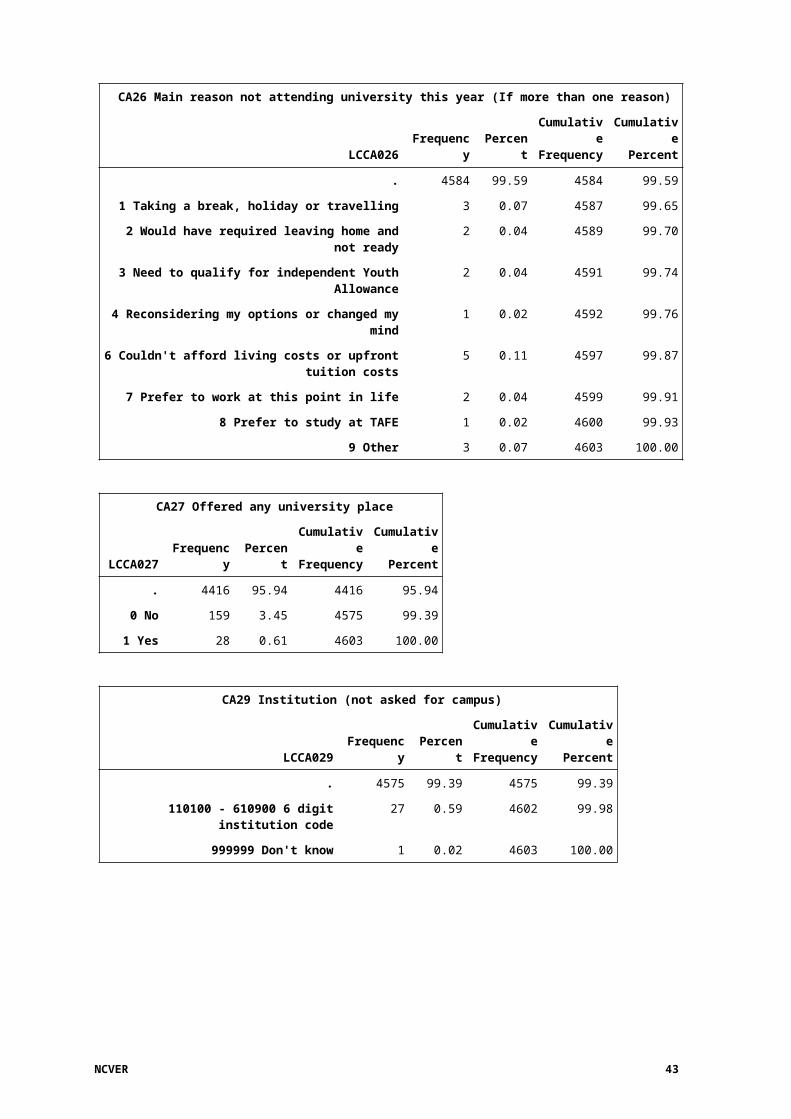
CA26 Main reason not attending university this year (If more than one reason)
LCCA026 Frequency PercentCumulativeFrequency
CumulativePercent
. 4584 99.59 4584 99.59
1 Taking a break, holiday or travelling 3 0.07 4587 99.65
2 Would have required leaving home and not ready 2 0.04 4589 99.70
3 Need to qualify for independent Youth Allowance 2 0.04 4591 99.74
4 Reconsidering my options or changed my mind 1 0.02 4592 99.76
6 Couldn't afford living costs or upfront tuition costs
5 0.11 4597 99.87
7 Prefer to work at this point in life 2 0.04 4599 99.91
8 Prefer to study at TAFE 1 0.02 4600 99.93
9 Other 3 0.07 4603 100.00
CA27 Offered any university place
LCCA027 Frequency PercentCumulativeFrequency
CumulativePercent
. 4416 95.94 4416 95.94
0 No 159 3.45 4575 99.39
1 Yes 28 0.61 4603 100.00
CA29 Institution (not asked for campus)
LCCA029 Frequency PercentCumulativeFrequency
CumulativePercent
. 4575 99.39 4575 99.39
110100 - 610900 6 digit institution code 27 0.59 4602 99.98
999999 Don't know 1 0.02 4603 100.00
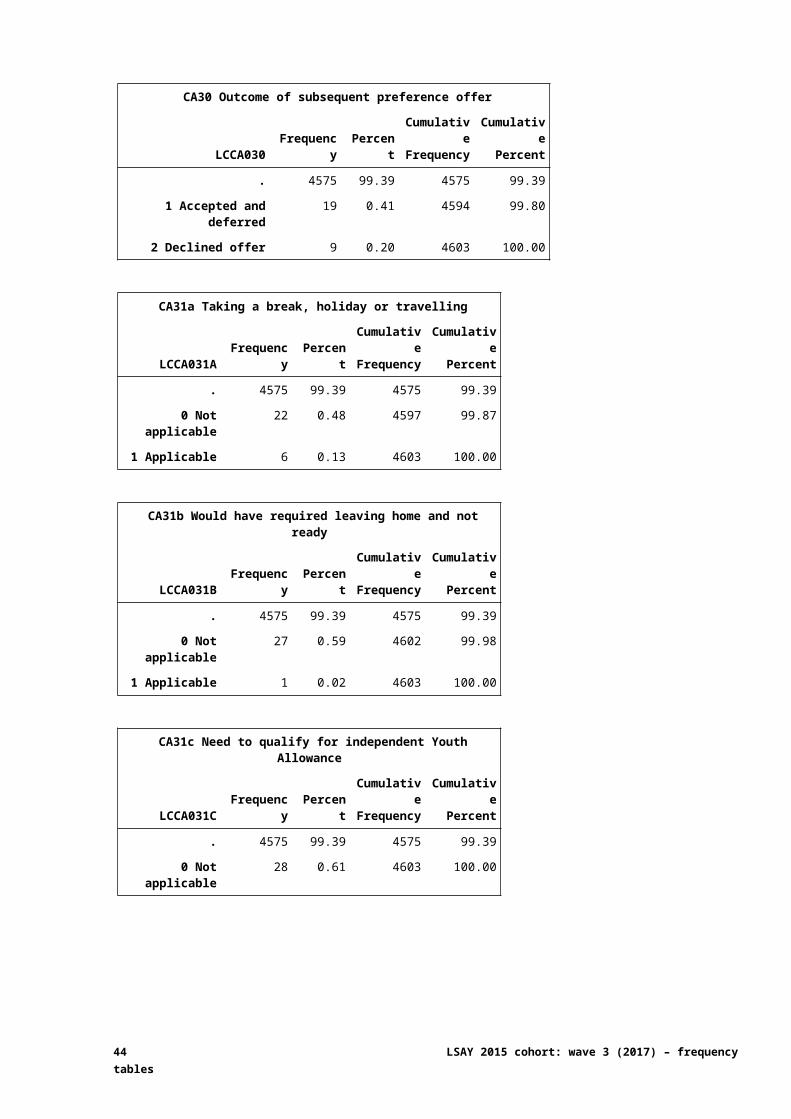
CA30 Outcome of subsequent preference offer
LCCA030 Frequency PercentCumulativeFrequency
CumulativePercent
. 4575 99.39 4575 99.39
1 Accepted and deferred 19 0.41 4594 99.80
2 Declined offer 9 0.20 4603 100.00
CA31a Taking a break, holiday or travelling
LCCA031A Frequency PercentCumulativeFrequency
CumulativePercent
. 4575 99.39 4575 99.39
0 Not applicable 22 0.48 4597 99.87
1 Applicable 6 0.13 4603 100.00
NCVER 33
CA31b Would have required leaving home and not ready
LCCA031B Frequency PercentCumulativeFrequency
CumulativePercent
. 4575 99.39 4575 99.39
0 Not applicable 27 0.59 4602 99.98
1 Applicable 1 0.02 4603 100.00
CA31c Need to qualify for independent Youth Allowance
LCCA031C Frequency PercentCumulativeFrequency
CumulativePercent
. 4575 99.39 4575 99.39
0 Not applicable 28 0.61 4603 100.00
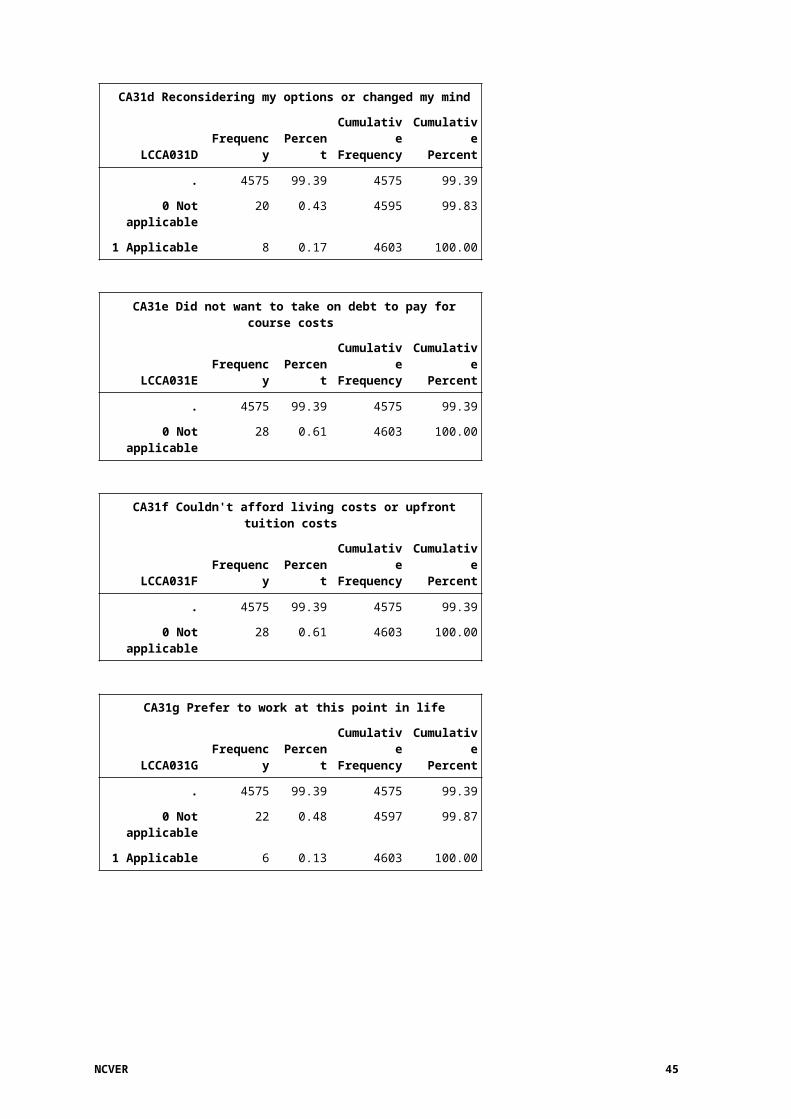
CA31d Reconsidering my options or changed my mind
LCCA031D Frequency PercentCumulativeFrequency
CumulativePercent
. 4575 99.39 4575 99.39
0 Not applicable 20 0.43 4595 99.83
1 Applicable 8 0.17 4603 100.00
CA31e Did not want to take on debt to pay for course costs
LCCA031E Frequency PercentCumulativeFrequency
CumulativePercent
. 4575 99.39 4575 99.39
0 Not applicable 28 0.61 4603 100.00
CA31f Couldn't afford living costs or upfront tuition costs
LCCA031F Frequency PercentCumulativeFrequency
CumulativePercent
. 4575 99.39 4575 99.39
0 Not applicable 28 0.61 4603 100.00
CA31g Prefer to work at this point in life
LCCA031G Frequency PercentCumulativeFrequency
CumulativePercent
. 4575 99.39 4575 99.39
0 Not applicable 22 0.48 4597 99.87
1 Applicable 6 0.13 4603 100.00
34 LSAY 2015 cohort: wave 3 (2017) – frequency tables
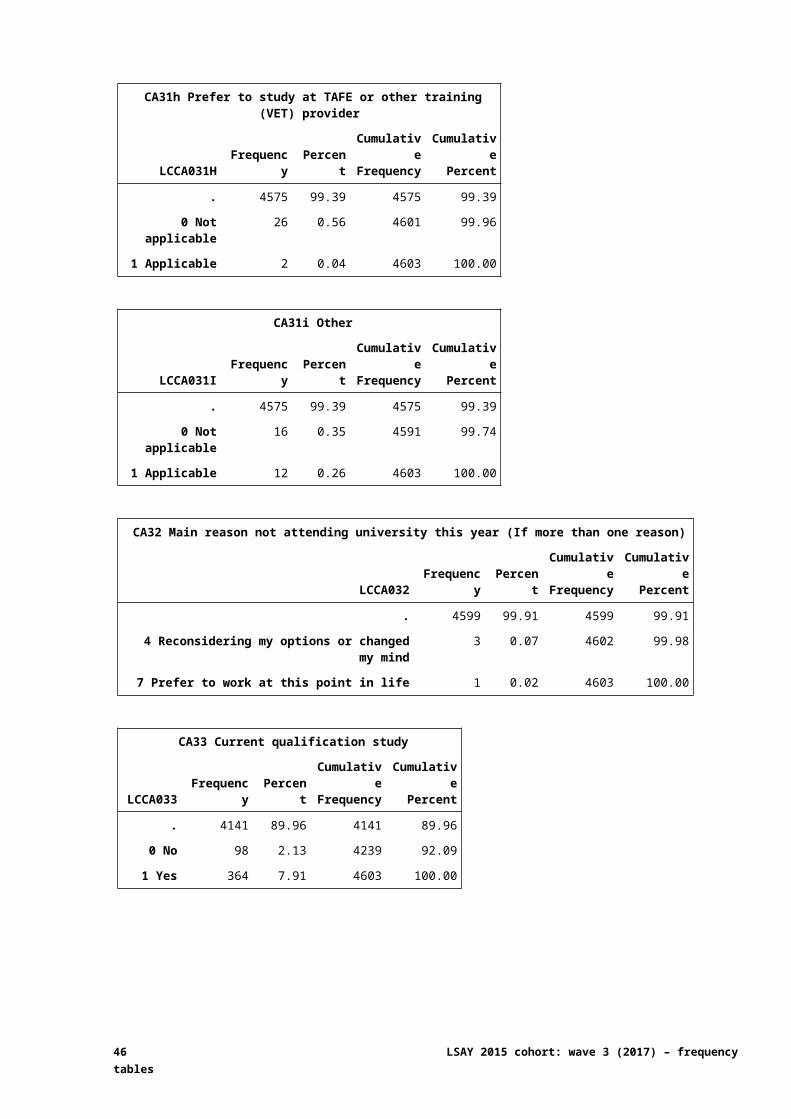
CA31h Prefer to study at TAFE or other training (VET) provider
LCCA031H Frequency PercentCumulativeFrequency
CumulativePercent
. 4575 99.39 4575 99.39
0 Not applicable 26 0.56 4601 99.96
1 Applicable 2 0.04 4603 100.00
CA31i Other
LCCA031I Frequency PercentCumulativeFrequency
CumulativePercent
. 4575 99.39 4575 99.39
0 Not applicable 16 0.35 4591 99.74
1 Applicable 12 0.26 4603 100.00
CA32 Main reason not attending university this year (If more than one reason)
LCCA032 Frequency PercentCumulativeFrequency
CumulativePercent
. 4599 99.91 4599 99.91
4 Reconsidering my options or changed my mind 3 0.07 4602 99.98
7 Prefer to work at this point in life 1 0.02 4603 100.00
CA33 Current qualification study
LCCA033 Frequency PercentCumulativeFrequency
CumulativePercent
. 4141 89.96 4141 89.96
0 No 98 2.13 4239 92.09
1 Yes 364 7.91 4603 100.00
NCVER 35
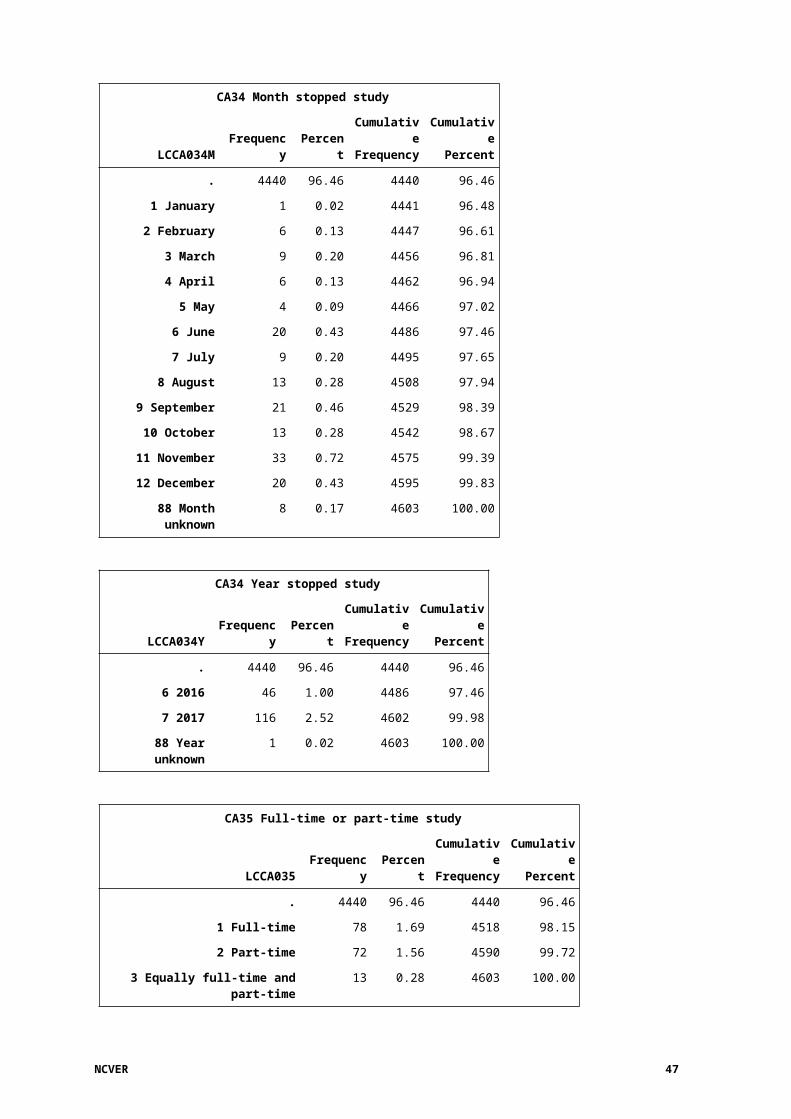
CA34 Month stopped study
LCCA034M Frequency PercentCumulativeFrequency
CumulativePercent
. 4440 96.46 4440 96.46
1 January 1 0.02 4441 96.48
2 February 6 0.13 4447 96.61
3 March 9 0.20 4456 96.81
4 April 6 0.13 4462 96.94
5 May 4 0.09 4466 97.02
6 June 20 0.43 4486 97.46
7 July 9 0.20 4495 97.65
8 August 13 0.28 4508 97.94
9 September 21 0.46 4529 98.39
10 October 13 0.28 4542 98.67
11 November 33 0.72 4575 99.39
12 December 20 0.43 4595 99.83
88 Month unknown 8 0.17 4603 100.00
CA34 Year stopped study
LCCA034Y Frequency PercentCumulativeFrequency
CumulativePercent
. 4440 96.46 4440 96.46
6 2016 46 1.00 4486 97.46
7 2017 116 2.52 4602 99.98
88 Year unknown 1 0.02 4603 100.00
CA35 Full-time or part-time study
LCCA035 Frequency PercentCumulativeFrequency
CumulativePercent
. 4440 96.46 4440 96.46
1 Full-time 78 1.69 4518 98.15
2 Part-time 72 1.56 4590 99.72
3 Equally full-time and part-time 13 0.28 4603 100.00
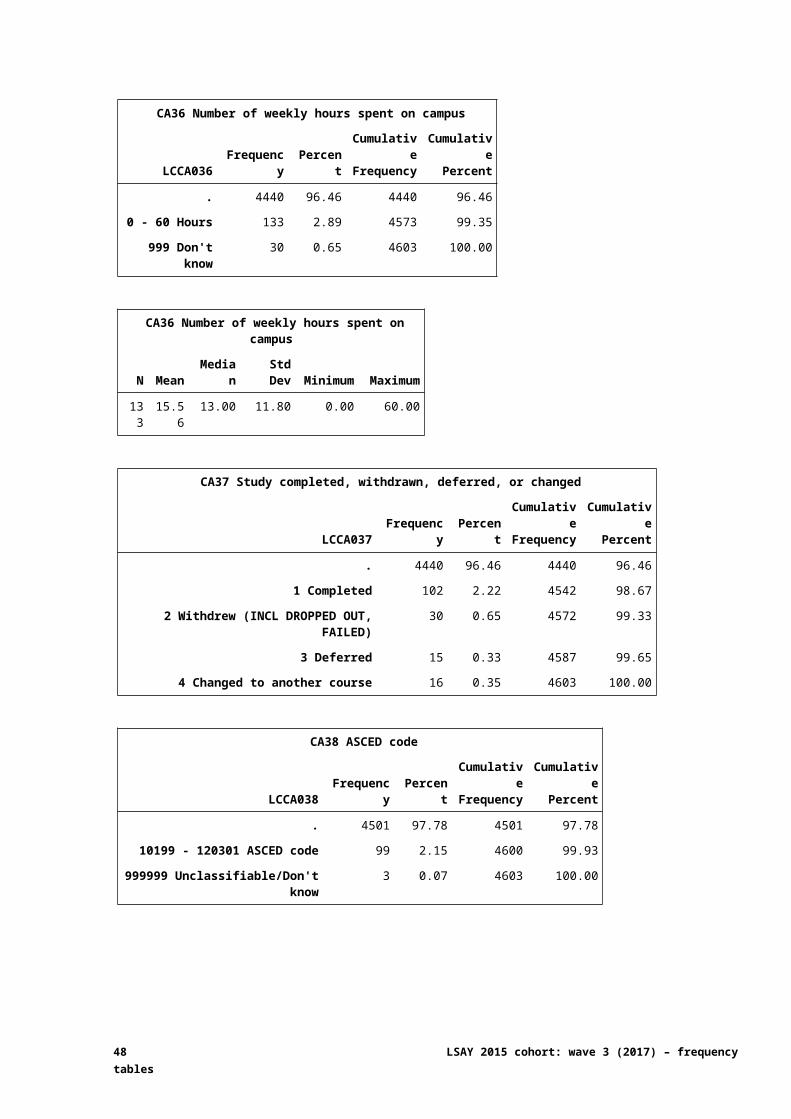
CA36 Number of weekly hours spent on campus
LCCA036 Frequency PercentCumulativeFrequency
CumulativePercent
. 4440 96.46 4440 96.46
0 - 60 Hours 133 2.89 4573 99.35
999 Don't know 30 0.65 4603 100.00
36 LSAY 2015 cohort: wave 3 (2017) – frequency tables
CA36 Number of weekly hours spent on campus
N Mean Median Std Dev Minimum Maximum
133 15.56 13.00 11.80 0.00 60.00
CA37 Study completed, withdrawn, deferred, or changed
LCCA037 Frequency PercentCumulativeFrequency
CumulativePercent
. 4440 96.46 4440 96.46
1 Completed 102 2.22 4542 98.67
2 Withdrew (INCL DROPPED OUT, FAILED) 30 0.65 4572 99.33
3 Deferred 15 0.33 4587 99.65
4 Changed to another course 16 0.35 4603 100.00
CA38 ASCED code
LCCA038 Frequency PercentCumulativeFrequency
CumulativePercent
. 4501 97.78 4501 97.78
10199 - 120301 ASCED code 99 2.15 4600 99.93
999999 Unclassifiable/Don't know 3 0.07 4603 100.00
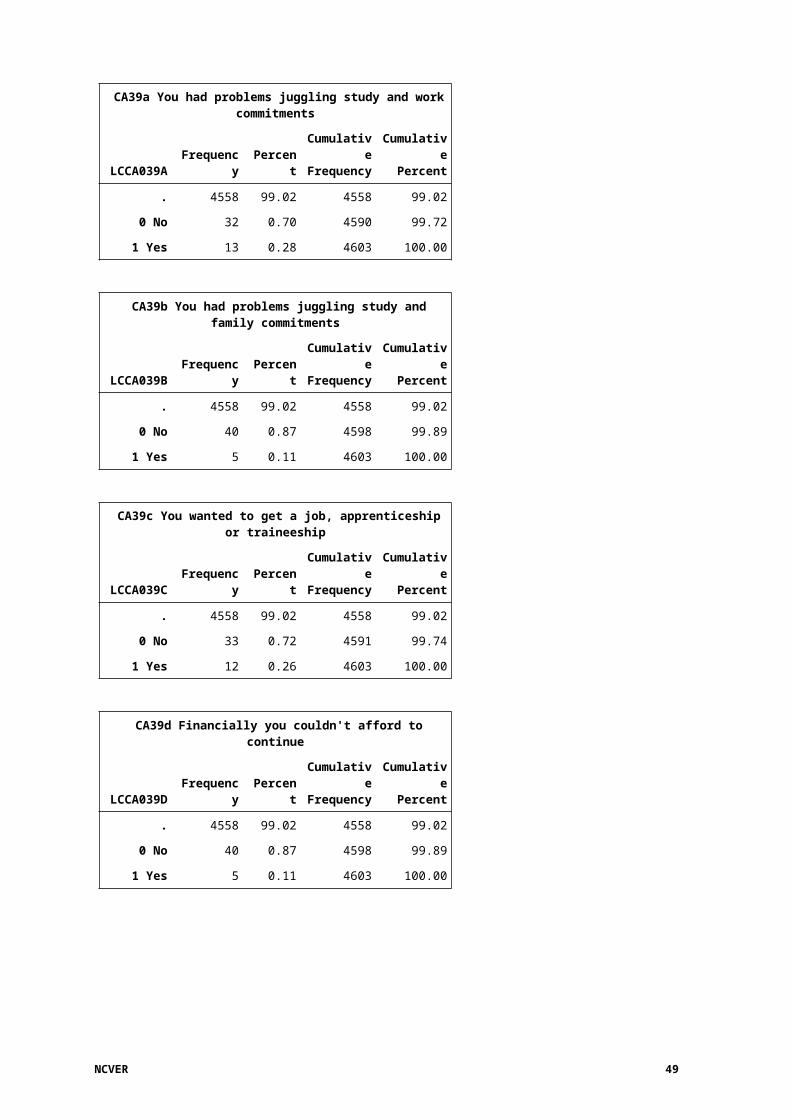
CA39a You had problems juggling study and work commitments
LCCA039A Frequency PercentCumulativeFrequency
CumulativePercent
. 4558 99.02 4558 99.02
0 No 32 0.70 4590 99.72
1 Yes 13 0.28 4603 100.00
CA39b You had problems juggling study and family commitments
LCCA039B Frequency PercentCumulativeFrequency
CumulativePercent
. 4558 99.02 4558 99.02
0 No 40 0.87 4598 99.89
1 Yes 5 0.11 4603 100.00
NCVER 37
CA39c You wanted to get a job, apprenticeship or traineeship
LCCA039C Frequency PercentCumulativeFrequency
CumulativePercent
. 4558 99.02 4558 99.02
0 No 33 0.72 4591 99.74
1 Yes 12 0.26 4603 100.00
CA39d Financially you couldn't afford to continue
LCCA039D Frequency PercentCumulativeFrequency
CumulativePercent
. 4558 99.02 4558 99.02
0 No 40 0.87 4598 99.89
1 Yes 5 0.11 4603 100.00
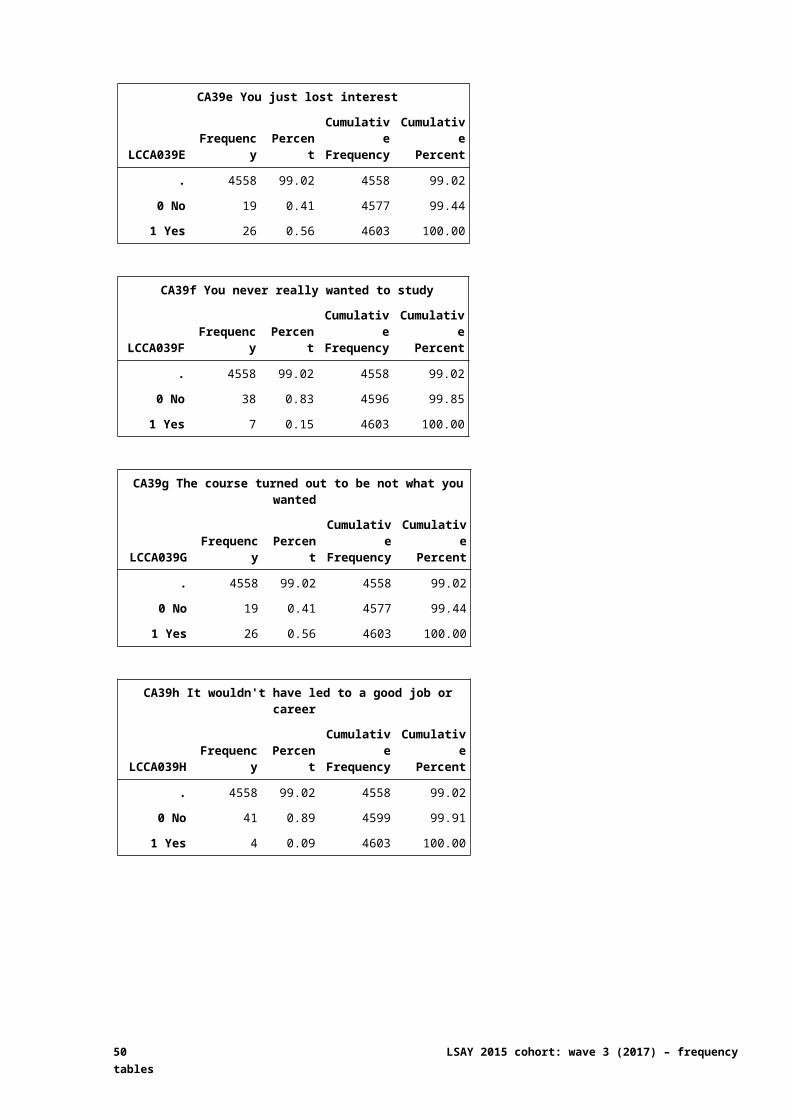
CA39e You just lost interest
LCCA039E Frequency PercentCumulativeFrequency
CumulativePercent
. 4558 99.02 4558 99.02
0 No 19 0.41 4577 99.44
1 Yes 26 0.56 4603 100.00
CA39f You never really wanted to study
LCCA039F Frequency PercentCumulativeFrequency
CumulativePercent
. 4558 99.02 4558 99.02
0 No 38 0.83 4596 99.85
1 Yes 7 0.15 4603 100.00
CA39g The course turned out to be not what you wanted
LCCA039G Frequency PercentCumulativeFrequency
CumulativePercent
. 4558 99.02 4558 99.02
0 No 19 0.41 4577 99.44
1 Yes 26 0.56 4603 100.00
CA39h It wouldn't have led to a good job or career
LCCA039H Frequency PercentCumulativeFrequency
CumulativePercent
. 4558 99.02 4558 99.02
0 No 41 0.89 4599 99.91
1 Yes 4 0.09 4603 100.00
38 LSAY 2015 cohort: wave 3 (2017) – frequency tables
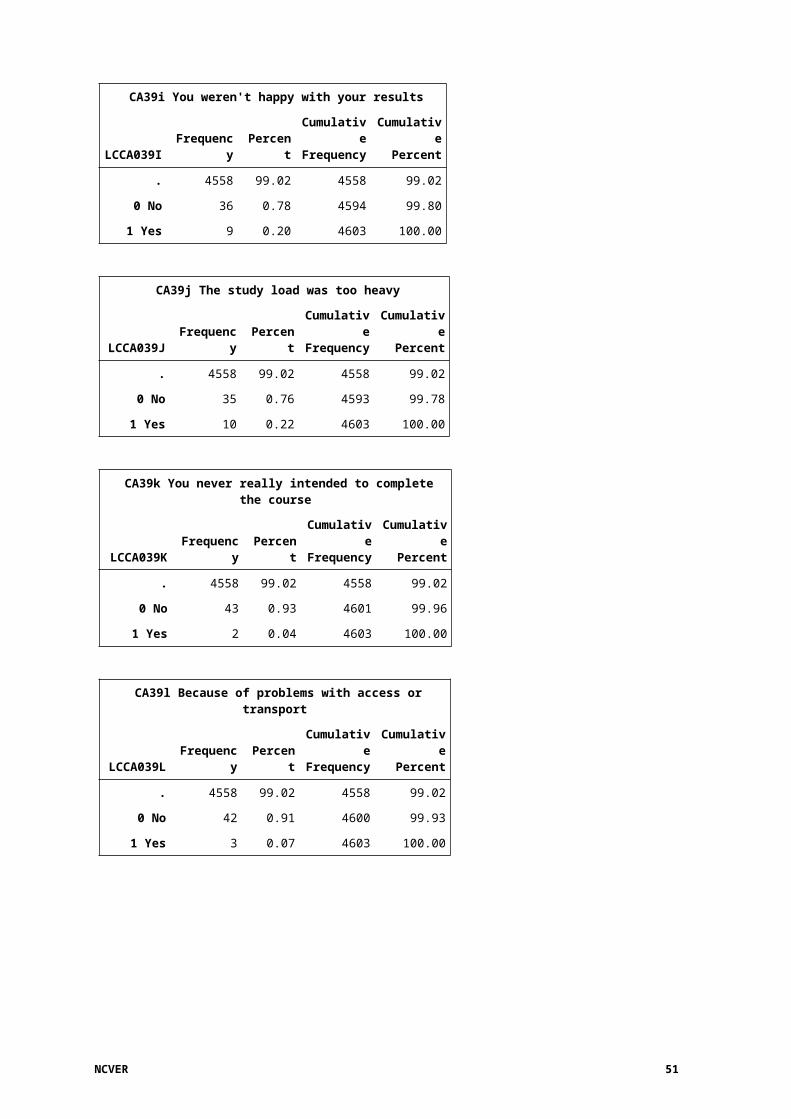
CA39i You weren't happy with your results
LCCA039I Frequency PercentCumulativeFrequency
CumulativePercent
. 4558 99.02 4558 99.02
0 No 36 0.78 4594 99.80
1 Yes 9 0.20 4603 100.00
CA39j The study load was too heavy
LCCA039J Frequency PercentCumulativeFrequency
CumulativePercent
. 4558 99.02 4558 99.02
0 No 35 0.76 4593 99.78
1 Yes 10 0.22 4603 100.00
CA39k You never really intended to complete the course
LCCA039K Frequency PercentCumulativeFrequency
CumulativePercent
. 4558 99.02 4558 99.02
0 No 43 0.93 4601 99.96
1 Yes 2 0.04 4603 100.00
CA39l Because of problems with access or transport
LCCA039L Frequency PercentCumulativeFrequency
CumulativePercent
. 4558 99.02 4558 99.02
0 No 42 0.91 4600 99.93
1 Yes 3 0.07 4603 100.00
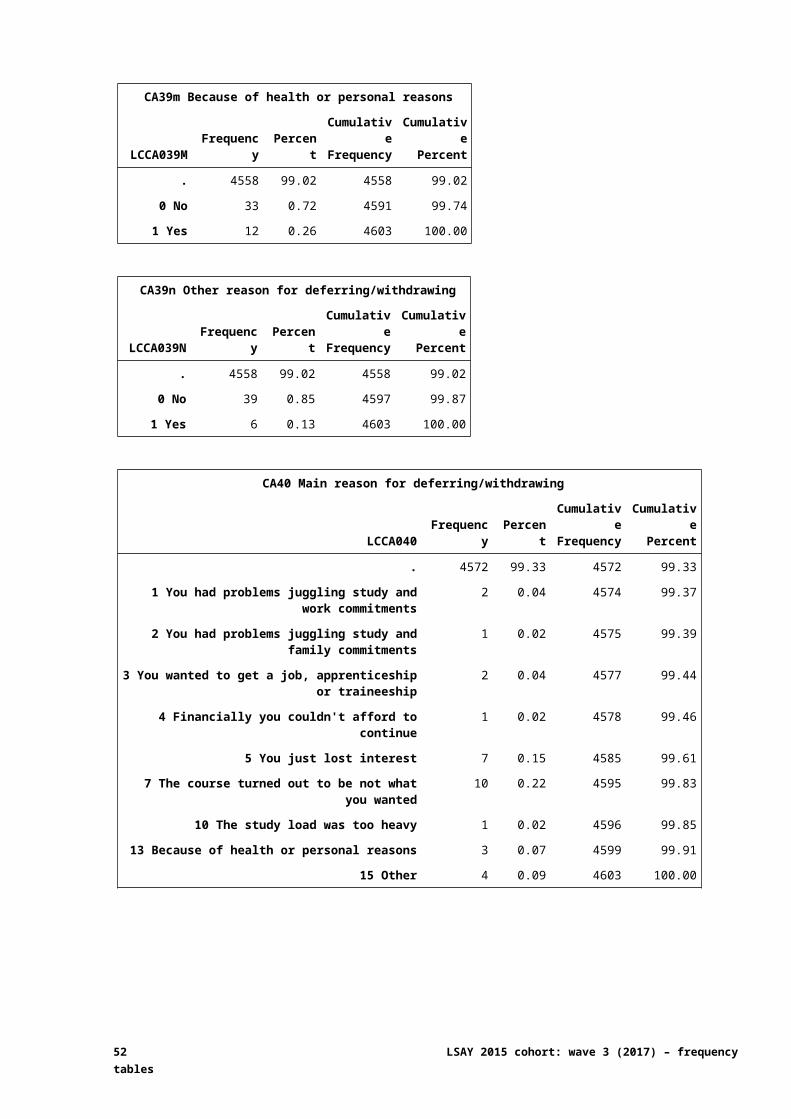
CA39m Because of health or personal reasons
LCCA039M Frequency PercentCumulativeFrequency
CumulativePercent
. 4558 99.02 4558 99.02
0 No 33 0.72 4591 99.74
1 Yes 12 0.26 4603 100.00
CA39n Other reason for deferring/withdrawing
LCCA039N Frequency PercentCumulativeFrequency
CumulativePercent
. 4558 99.02 4558 99.02
0 No 39 0.85 4597 99.87
1 Yes 6 0.13 4603 100.00
NCVER 39
CA40 Main reason for deferring/withdrawing
LCCA040 Frequency PercentCumulativeFrequency
CumulativePercent
. 4572 99.33 4572 99.33
1 You had problems juggling study and work commitments
2 0.04 4574 99.37
2 You had problems juggling study and family commitments
1 0.02 4575 99.39
3 You wanted to get a job, apprenticeship or traineeship
2 0.04 4577 99.44
4 Financially you couldn't afford to continue 1 0.02 4578 99.46
5 You just lost interest 7 0.15 4585 99.61
7 The course turned out to be not what you wanted 10 0.22 4595 99.83
10 The study load was too heavy 1 0.02 4596 99.85
13 Because of health or personal reasons 3 0.07 4599 99.91
15 Other 4 0.09 4603 100.00
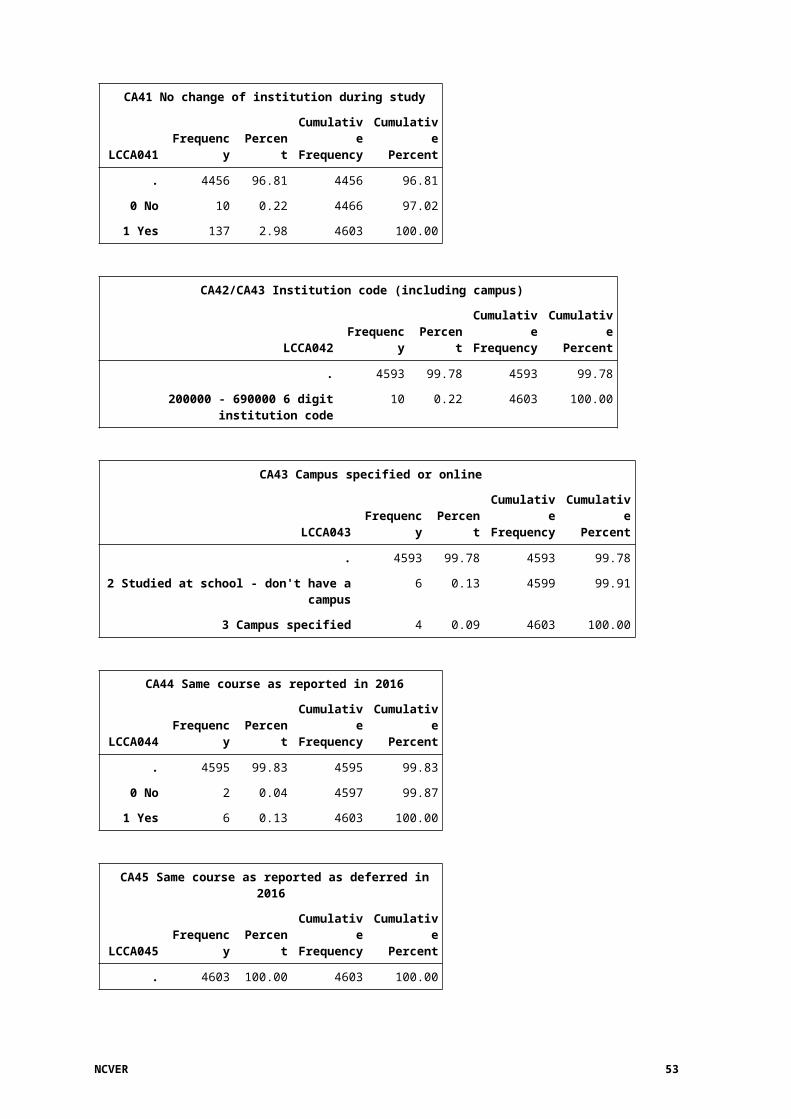
CA41 No change of institution during study
LCCA041 Frequency PercentCumulativeFrequency
CumulativePercent
. 4456 96.81 4456 96.81
0 No 10 0.22 4466 97.02
1 Yes 137 2.98 4603 100.00
CA42/CA43 Institution code (including campus)
LCCA042 Frequency PercentCumulativeFrequency
CumulativePercent
. 4593 99.78 4593 99.78
200000 - 690000 6 digit institution code 10 0.22 4603 100.00
CA43 Campus specified or online
LCCA043 Frequency PercentCumulativeFrequency
CumulativePercent
. 4593 99.78 4593 99.78
2 Studied at school - don't have a campus 6 0.13 4599 99.91
3 Campus specified 4 0.09 4603 100.00
40 LSAY 2015 cohort: wave 3 (2017) – frequency tables
CA44 Same course as reported in 2016
LCCA044 Frequency PercentCumulativeFrequency
CumulativePercent
. 4595 99.83 4595 99.83
0 No 2 0.04 4597 99.87
1 Yes 6 0.13 4603 100.00
CA45 Same course as reported as deferred in 2016
LCCA045 Frequency PercentCumulativeFrequency
CumulativePercent
. 4603 100.00 4603 100.00
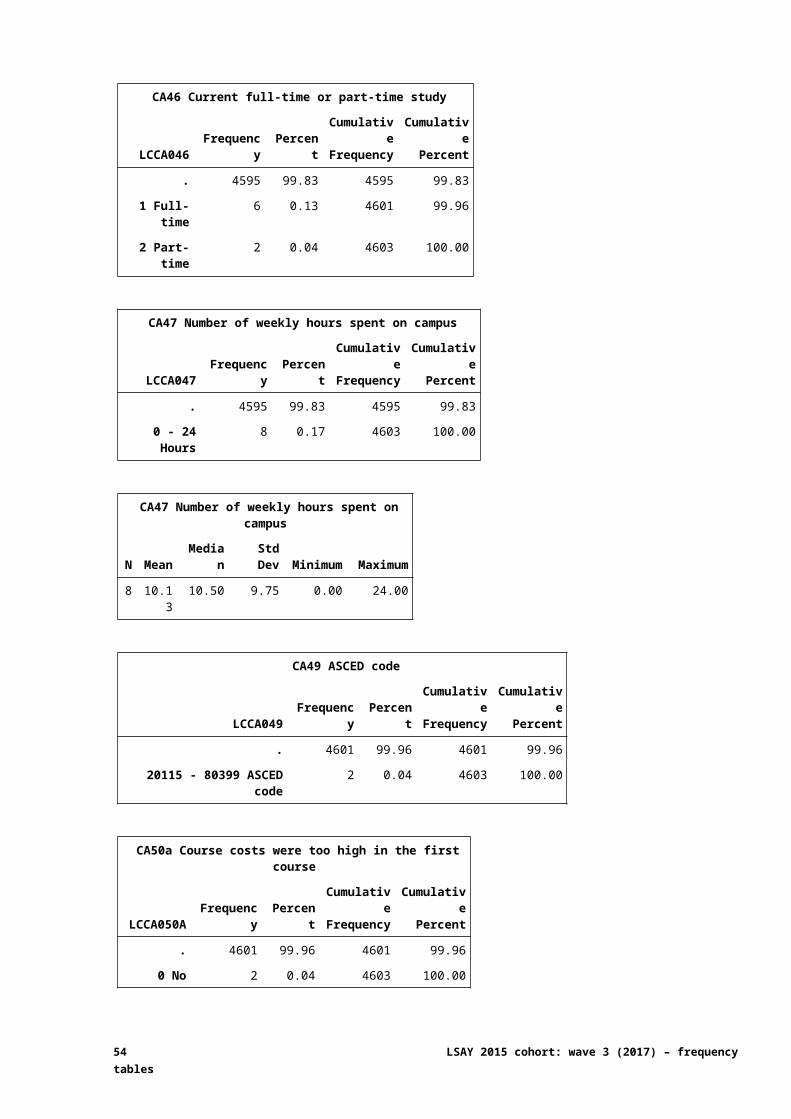
CA46 Current full-time or part-time study
LCCA046 Frequency PercentCumulativeFrequency
CumulativePercent
. 4595 99.83 4595 99.83
1 Full-time 6 0.13 4601 99.96
2 Part-time 2 0.04 4603 100.00
CA47 Number of weekly hours spent on campus
LCCA047 Frequency PercentCumulativeFrequency
CumulativePercent
. 4595 99.83 4595 99.83
0 - 24 Hours 8 0.17 4603 100.00
CA47 Number of weekly hours spent on campus
N Mean Median Std Dev Minimum Maximum
8 10.13 10.50 9.75 0.00 24.00
CA49 ASCED code
LCCA049 Frequency PercentCumulativeFrequency
CumulativePercent
. 4601 99.96 4601 99.96
20115 - 80399 ASCED code 2 0.04 4603 100.00
CA50a Course costs were too high in the first course
LCCA050A Frequency PercentCumulativeFrequency
CumulativePercent
. 4601 99.96 4601 99.96
0 No 2 0.04 4603 100.00
NCVER 41
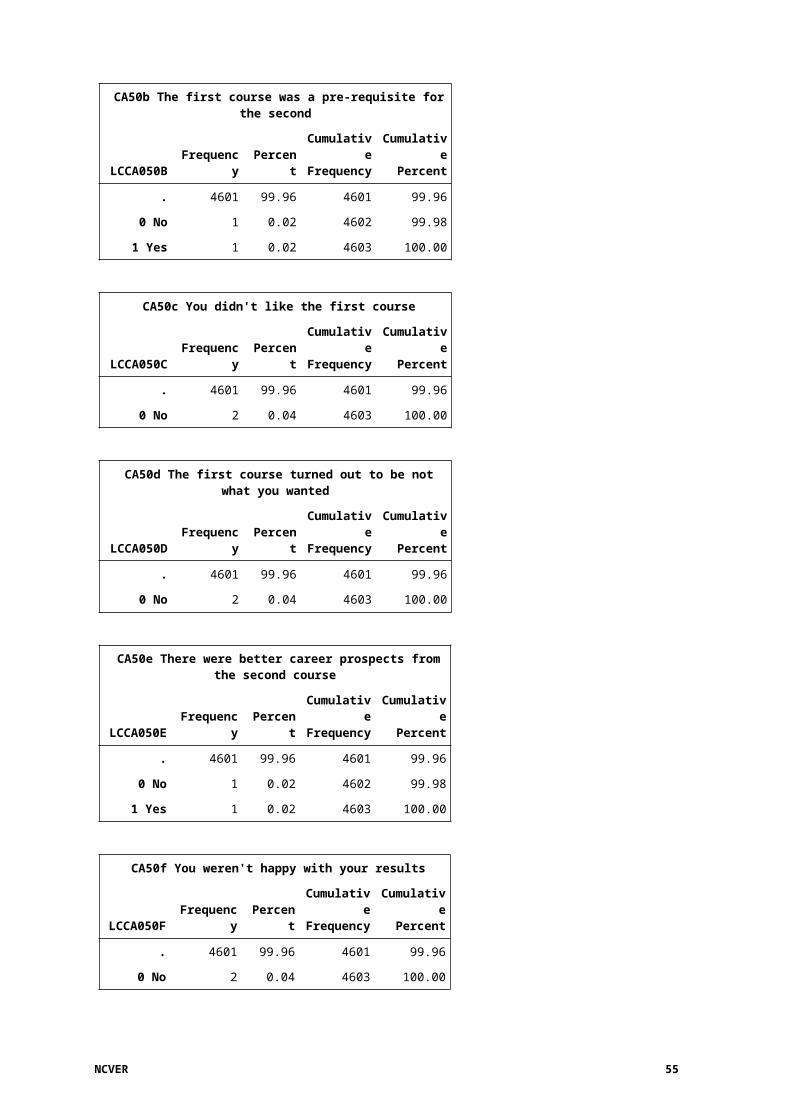
CA50b The first course was a pre-requisite for the second
LCCA050B Frequency PercentCumulativeFrequency
CumulativePercent
. 4601 99.96 4601 99.96
0 No 1 0.02 4602 99.98
1 Yes 1 0.02 4603 100.00
CA50c You didn't like the first course
LCCA050C Frequency PercentCumulativeFrequency
CumulativePercent
. 4601 99.96 4601 99.96
0 No 2 0.04 4603 100.00
CA50d The first course turned out to be not what you wanted
LCCA050D Frequency PercentCumulativeFrequency
CumulativePercent
. 4601 99.96 4601 99.96
0 No 2 0.04 4603 100.00
CA50e There were better career prospects from the second course
LCCA050E Frequency PercentCumulativeFrequency
CumulativePercent
. 4601 99.96 4601 99.96
0 No 1 0.02 4602 99.98
1 Yes 1 0.02 4603 100.00
CA50f You weren't happy with your results
LCCA050F Frequency PercentCumulativeFrequency
CumulativePercent
. 4601 99.96 4601 99.96
0 No 2 0.04 4603 100.00
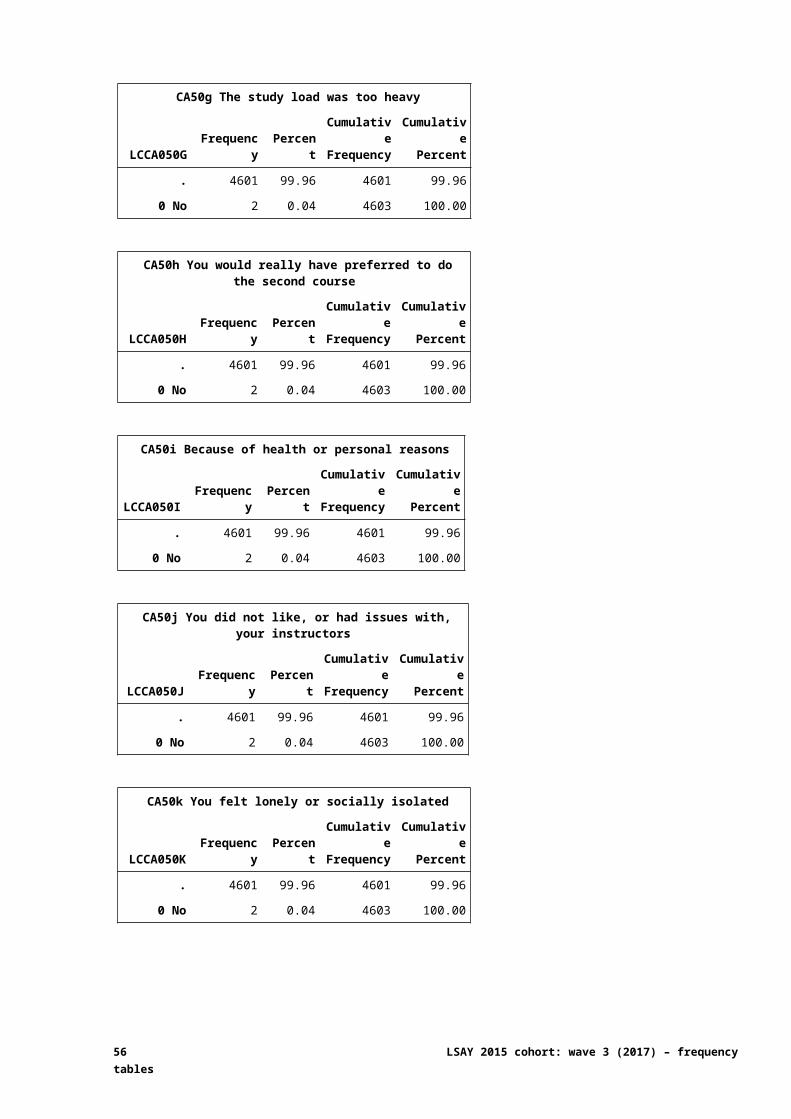
CA50g The study load was too heavy
LCCA050G Frequency PercentCumulativeFrequency
CumulativePercent
. 4601 99.96 4601 99.96
0 No 2 0.04 4603 100.00
42 LSAY 2015 cohort: wave 3 (2017) – frequency tables
CA50h You would really have preferred to do the second course
LCCA050H Frequency PercentCumulativeFrequency
CumulativePercent
. 4601 99.96 4601 99.96
0 No 2 0.04 4603 100.00
CA50i Because of health or personal reasons
LCCA050I Frequency PercentCumulativeFrequency
CumulativePercent
. 4601 99.96 4601 99.96
0 No 2 0.04 4603 100.00
CA50j You did not like, or had issues with, your instructors
LCCA050J Frequency PercentCumulativeFrequency
CumulativePercent
. 4601 99.96 4601 99.96
0 No 2 0.04 4603 100.00
CA50k You felt lonely or socially isolated
LCCA050K Frequency PercentCumulativeFrequency
CumulativePercent
. 4601 99.96 4601 99.96
0 No 2 0.04 4603 100.00
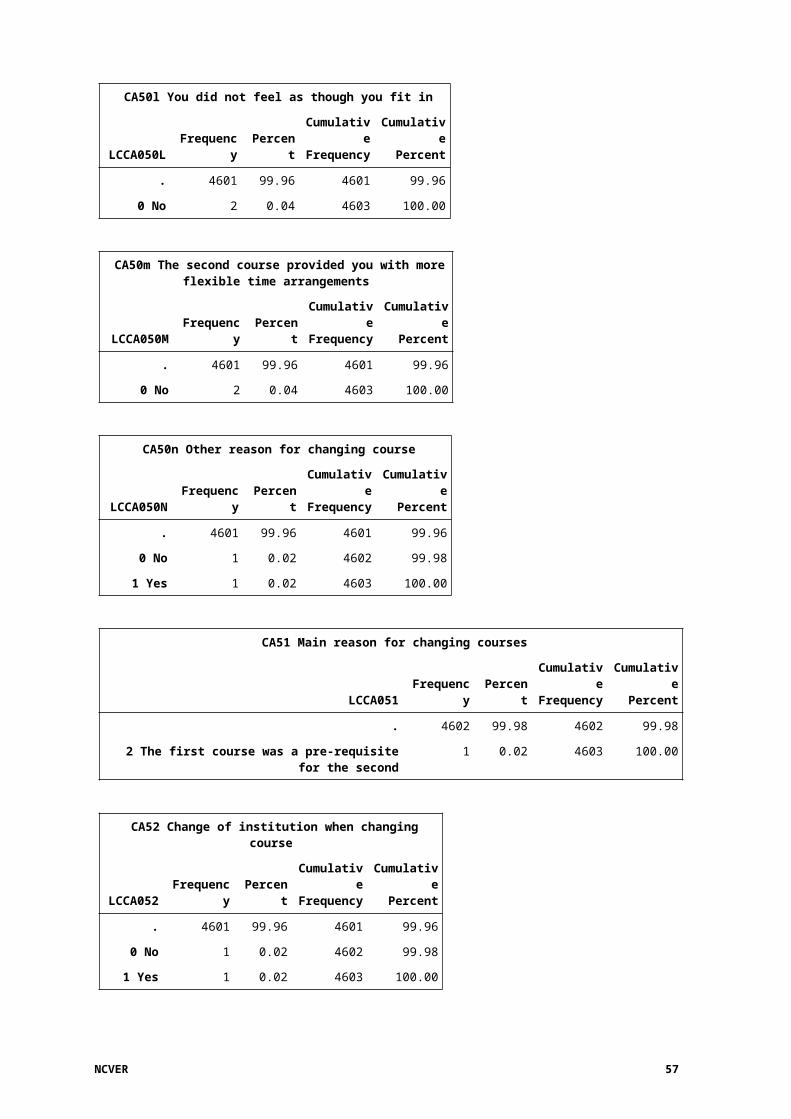
CA50l You did not feel as though you fit in
LCCA050L Frequency PercentCumulativeFrequency
CumulativePercent
. 4601 99.96 4601 99.96
0 No 2 0.04 4603 100.00
CA50m The second course provided you with more flexible time arrangements
LCCA050M Frequency PercentCumulativeFrequency
CumulativePercent
. 4601 99.96 4601 99.96
0 No 2 0.04 4603 100.00
NCVER 43
CA50n Other reason for changing course
LCCA050N Frequency PercentCumulativeFrequency
CumulativePercent
. 4601 99.96 4601 99.96
0 No 1 0.02 4602 99.98
1 Yes 1 0.02 4603 100.00
CA51 Main reason for changing courses
LCCA051 Frequency PercentCumulativeFrequency
CumulativePercent
. 4602 99.98 4602 99.98
2 The first course was a pre-requisite for the second
1 0.02 4603 100.00
CA52 Change of institution when changing course
LCCA052 Frequency PercentCumulativeFrequency
CumulativePercent
. 4601 99.96 4601 99.96
0 No 1 0.02 4602 99.98
1 Yes 1 0.02 4603 100.00
CA53/CA54 Institution (including campus)
LCCA053 Frequency PercentCumulativeFrequency
CumulativePercent
. 4602 99.98 4602 99.98
690000 6 digit institution code 1 0.02 4603 100.00
CA54 Campus specified or online
LCCA054 Frequency PercentCumulativeFrequency
CumulativePercent
. 4602 99.98 4602 99.98
3 Campus specified 1 0.02 4603 100.00
CA55 Month began current study
LCCA055M Frequency PercentCumulativeFrequency
CumulativePercent
. 4601 99.96 4601 99.96
1 January 1 0.02 4602 99.98
8 August 1 0.02 4603 100.00
44 LSAY 2015 cohort: wave 3 (2017) – frequency tables
CA55 Year began current study
LCCA055Y Frequency PercentCumulativeFrequency
CumulativePercent
. 4601 99.96 4601 99.96
7 2017 2 0.04 4603 100.00
CA56 No change of institution since last interview
LCCA056 Frequency PercentCumulativeFrequency
CumulativePercent
. 4597 99.87 4597 99.87
1 Yes 6 0.13 4603 100.00
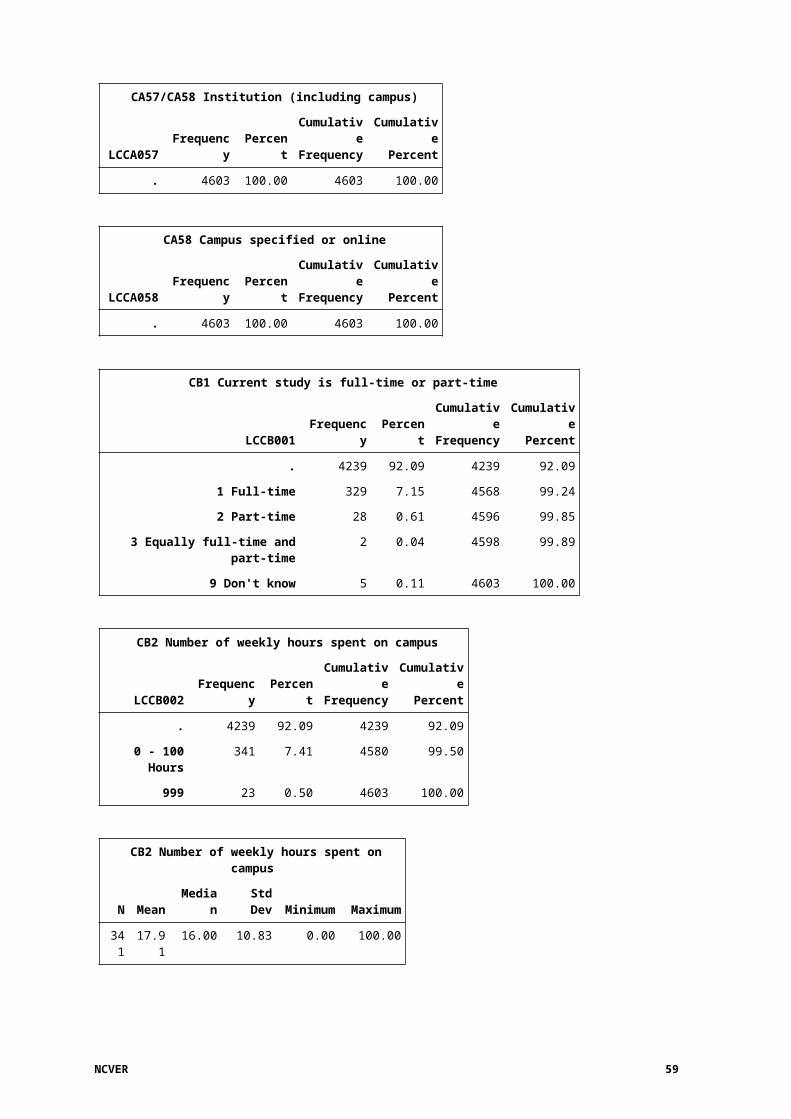
CA57/CA58 Institution (including campus)
LCCA057 Frequency PercentCumulativeFrequency
CumulativePercent
. 4603 100.00 4603 100.00
CA58 Campus specified or online
LCCA058 Frequency PercentCumulativeFrequency
CumulativePercent
. 4603 100.00 4603 100.00
CB1 Current study is full-time or part-time
LCCB001 Frequency PercentCumulativeFrequency
CumulativePercent
. 4239 92.09 4239 92.09
1 Full-time 329 7.15 4568 99.24
2 Part-time 28 0.61 4596 99.85
3 Equally full-time and part-time 2 0.04 4598 99.89
9 Don't know 5 0.11 4603 100.00
CB2 Number of weekly hours spent on campus
LCCB002 Frequency PercentCumulativeFrequency
CumulativePercent
. 4239 92.09 4239 92.09
0 - 100 Hours 341 7.41 4580 99.50
999 23 0.50 4603 100.00
CB2 Number of weekly hours spent on campus
N Mean Median Std Dev Minimum Maximum
341 17.91 16.00 10.83 0.00 100.00
NCVER 45
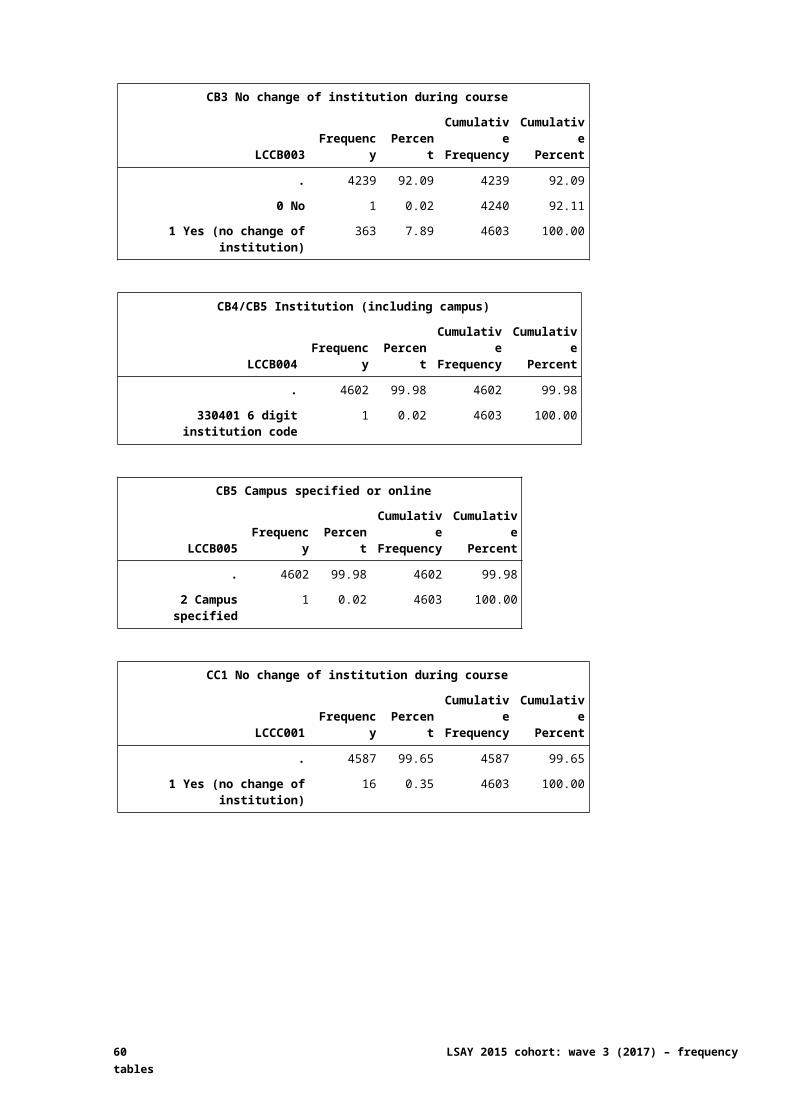
CB3 No change of institution during course
LCCB003 Frequency PercentCumulativeFrequency
CumulativePercent
. 4239 92.09 4239 92.09
0 No 1 0.02 4240 92.11
1 Yes (no change of institution) 363 7.89 4603 100.00
CB4/CB5 Institution (including campus)
LCCB004 Frequency PercentCumulativeFrequency
CumulativePercent
. 4602 99.98 4602 99.98
330401 6 digit institution code 1 0.02 4603 100.00
CB5 Campus specified or online
LCCB005 Frequency PercentCumulativeFrequency
CumulativePercent
. 4602 99.98 4602 99.98
2 Campus specified 1 0.02 4603 100.00
CC1 No change of institution during course
LCCC001 Frequency PercentCumulativeFrequency
CumulativePercent
. 4587 99.65 4587 99.65
1 Yes (no change of institution) 16 0.35 4603 100.00
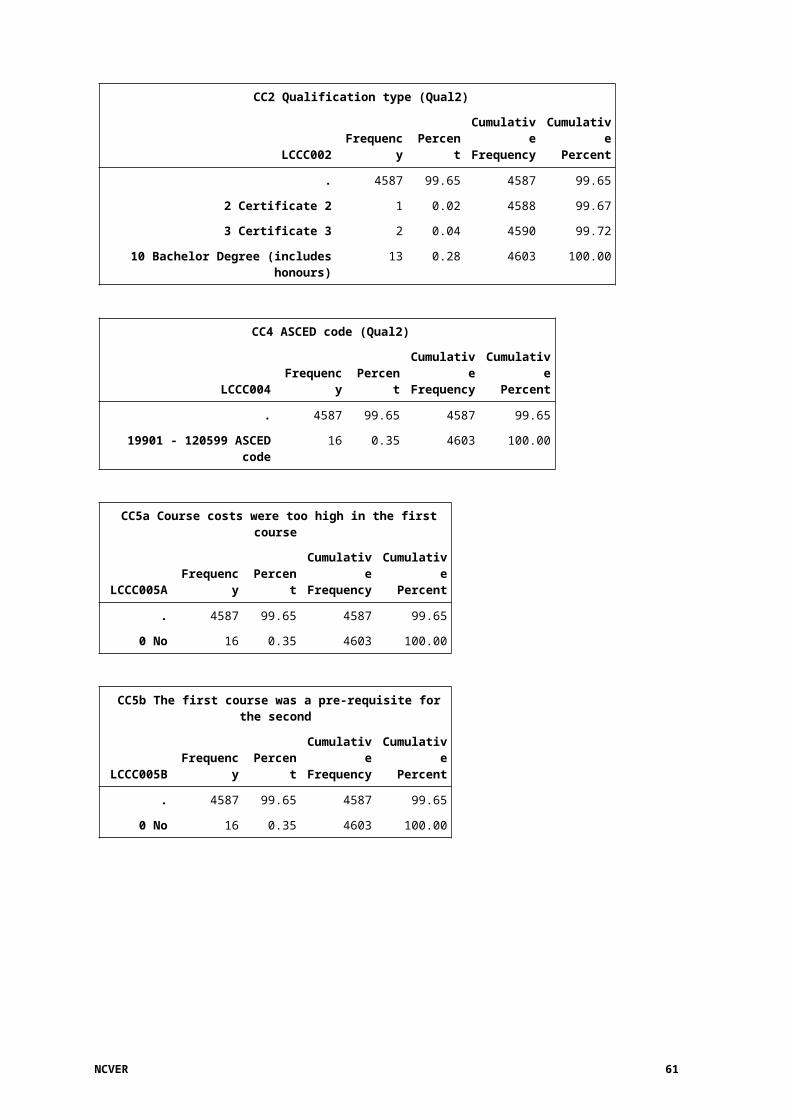
CC2 Qualification type (Qual2)
LCCC002 Frequency PercentCumulativeFrequency
CumulativePercent
. 4587 99.65 4587 99.65
2 Certificate 2 1 0.02 4588 99.67
3 Certificate 3 2 0.04 4590 99.72
10 Bachelor Degree (includes honours) 13 0.28 4603 100.00
CC4 ASCED code (Qual2)
LCCC004 Frequency PercentCumulativeFrequency
CumulativePercent
. 4587 99.65 4587 99.65
19901 - 120599 ASCED code 16 0.35 4603 100.00
46 LSAY 2015 cohort: wave 3 (2017) – frequency tables
CC5a Course costs were too high in the first course
LCCC005A Frequency PercentCumulativeFrequency
CumulativePercent
. 4587 99.65 4587 99.65
0 No 16 0.35 4603 100.00
CC5b The first course was a pre-requisite for the second
LCCC005B Frequency PercentCumulativeFrequency
CumulativePercent
. 4587 99.65 4587 99.65
0 No 16 0.35 4603 100.00
CC5c You didn't like the first course
LCCC005C Frequency PercentCumulativeFrequency
CumulativePercent
. 4587 99.65 4587 99.65
0 No 6 0.13 4593 99.78
1 Yes 10 0.22 4603 100.00
CC5d The first course turned out to be not what you wanted
LCCC005D Frequency PercentCumulativeFrequency
CumulativePercent
. 4587 99.65 4587 99.65
0 No 8 0.17 4595 99.83
1 Yes 8 0.17 4603 100.00
CC5e There were better career prospects from the second course
LCCC005E Frequency PercentCumulativeFrequency
CumulativePercent
. 4587 99.65 4587 99.65
0 No 10 0.22 4597 99.87
1 Yes 6 0.13 4603 100.00
CC5f You weren't happy with your results
LCCC005F Frequency PercentCumulativeFrequency
CumulativePercent
. 4587 99.65 4587 99.65
0 No 15 0.33 4602 99.98
1 Yes 1 0.02 4603 100.00
NCVER 47
CC5g The study load was too heavy
LCCC005G Frequency PercentCumulativeFrequency
CumulativePercent
. 4587 99.65 4587 99.65
0 No 15 0.33 4602 99.98
1 Yes 1 0.02 4603 100.00
CC5h You would really have preferred to do the second course
LCCC005H Frequency PercentCumulativeFrequency
CumulativePercent
. 4587 99.65 4587 99.65
0 No 8 0.17 4595 99.83
1 Yes 8 0.17 4603 100.00
CC5i Because of health or personal reasons
LCCC005I Frequency PercentCumulativeFrequency
CumulativePercent
. 4587 99.65 4587 99.65
0 No 16 0.35 4603 100.00
CC5j You did not like, or had issues with, your instructors
LCCC005J Frequency PercentCumulativeFrequency
CumulativePercent
. 4587 99.65 4587 99.65
0 No 15 0.33 4602 99.98
1 Yes 1 0.02 4603 100.00
CC5k You felt lonely or socially isolated
LCCC005K Frequency PercentCumulativeFrequency
CumulativePercent
. 4587 99.65 4587 99.65
0 No 14 0.30 4601 99.96
1 Yes 2 0.04 4603 100.00
CC5l You did not feel as though you fit in
LCCC005L Frequency PercentCumulativeFrequency
CumulativePercent
. 4587 99.65 4587 99.65
0 No 15 0.33 4602 99.98
1 Yes 1 0.02 4603 100.00
48 LSAY 2015 cohort: wave 3 (2017) – frequency tables
CC5m The second course provided you with more flexible time arrangements
LCCC005M Frequency PercentCumulativeFrequency
CumulativePercent
. 4587 99.65 4587 99.65
0 No 15 0.33 4602 99.98
1 Yes 1 0.02 4603 100.00
CC5n Other reason for changing course
LCCC005N Frequency PercentCumulativeFrequency
CumulativePercent
. 4587 99.65 4587 99.65
0 No 12 0.26 4599 99.91
1 Yes 4 0.09 4603 100.00
CC6 Main reason for changing courses
LCCC006 Frequency PercentCumulativeFrequency
CumulativePercent
. 4593 99.78 4593 99.78
3 You didn't like the first course 4 0.09 4597 99.87
4 The first course turned out to be not what you wanted
2 0.04 4599 99.91
5 There were better career prospects from the second course
2 0.04 4601 99.96
95 Other 2 0.04 4603 100.00
CC7 Change of institution when changing course
LCCC007 Frequency PercentCumulativeFrequency
CumulativePercent
. 4587 99.65 4587 99.65
0 No 11 0.24 4598 99.89
1 Yes 5 0.11 4603 100.00
CC8/CC9 Institution (including campus)
LCCC008 Frequency PercentCumulativeFrequency
CumulativePercent
. 4598 99.89 4598 99.89
211001 - 630902 6 digit institution code 5 0.11 4603 100.00
NCVER 49
CC9 Campus specified or online
LCCC009 Frequency PercentCumulativeFrequency
CumulativePercent
. 4598 99.89 4598 99.89
1 All study completed online - don't have a campus 1 0.02 4599 99.91
95 Campus specified 4 0.09 4603 100.00
CC10 Currently doing (Qual2)
LCCC010 Frequency PercentCumulativeFrequency
CumulativePercent
. 4587 99.65 4587 99.65
1 Yes 16 0.35 4603 100.00
CC11 Qual2 is full-time or part-time
LCCC011 Frequency PercentCumulativeFrequency
CumulativePercent
. 4587 99.65 4587 99.65
1 Full-time 13 0.28 4600 99.93
2 Part-time 2 0.04 4602 99.98
99 Don't know 1 0.02 4603 100.00
CC12 Number of weekly hours spent on campus
LCCC012 Frequency PercentCumulativeFrequency
CumulativePercent
. 4587 99.65 4587 99.65
4 - 30 Hours 13 0.28 4600 99.93
999 Don't know 3 0.07 4603 100.00
CC12 Number of weekly hours spent on campus
N Mean Median Std Dev Minimum Maximum
13 14.54 16.00 7.71 4.00 30.00
CC13 Still at Qual2 institution
LCCC013 Frequency PercentCumulativeFrequency
CumulativePercent
. 4587 99.65 4587 99.65
1 Yes 16 0.35 4603 100.00
50 LSAY 2015 cohort: wave 3 (2017) – frequency tables
CC14/CC15 Institution (including campus)
LCCC014 Frequency PercentCumulativeFrequency
CumulativePercent
. 4603 100.00 4603 100.00
CC15 Campus specified or online
LCCC015 Frequency PercentCumulativeFrequency
CumulativePercent
. 4603 100.00 4603 100.00
CC16 Month stopped Qual2
LCCC016M Frequency PercentCumulativeFrequency
CumulativePercent
. 4603 100.00 4603 100.00
CC16 Year stopped Qual2
LCCC016Y Frequency PercentCumulativeFrequency
CumulativePercent
. 4603 100.00 4603 100.00
CC17 Qual2 was full-time or part-time
LCCC017 Frequency PercentCumulativeFrequency
CumulativePercent
. 4603 100.00 4603 100.00
CC18 Number of weekly hours spent on campus
LCCC018 Frequency PercentCumulativeFrequency
CumulativePercent
. 4603 100.00 4603 100.00
CC19 Outcome of Qual2
LCCC019 Frequency PercentCumulativeFrequency
CumulativePercent
. 4603 100.00 4603 100.00
CC20 ASCED code (completed Qual2)
LCCC020 Frequency PercentCumulativeFrequency
CumulativePercent
. 4603 100.00 4603 100.00
NCVER 51
CD1 Month started apprenticeship/traineeship
LCCD001M Frequency PercentCumulativeFrequency
CumulativePercent
. 4504 97.85 4504 97.85
1 January 18 0.39 4522 98.24
2 February 17 0.37 4539 98.61
3 March 7 0.15 4546 98.76
4 April 6 0.13 4552 98.89
5 May 2 0.04 4554 98.94
6 June 7 0.15 4561 99.09
7 July 7 0.15 4568 99.24
8 August 4 0.09 4572 99.33
9 September 5 0.11 4577 99.44
10 October 8 0.17 4585 99.61
11 November 8 0.17 4593 99.78
12 December 8 0.17 4601 99.96
88 Month unknown 2 0.04 4603 100.00
CD1 Year started apprenticeship/traineeship
LCCD001Y Frequency PercentCumulativeFrequency
CumulativePercent
. 4504 97.85 4504 97.85
5 2015 3 0.07 4507 97.91
6 2016 23 0.50 4530 98.41
7 2017 73 1.59 4603 100.00
CD2 Certificate level
LCCD002 Frequency PercentCumulativeFrequency
CumulativePercent
. 4504 97.85 4504 97.85
1 Cert level 1 6 0.13 4510 97.98
2 Cert level 2 15 0.33 4525 98.31
3 Cert level 3 56 1.22 4581 99.52
4 Cert level 4 6 0.13 4587 99.65
5 Certificate (unknown level) 10 0.22 4597 99.87
6 Diploma 1 0.02 4598 99.89
95 Something else 5 0.11 4603 100.00
52 LSAY 2015 cohort: wave 3 (2017) – frequency tables
CD3 ASCED code
LCCD003 Frequency PercentCumulativeFrequency
CumulativePercent
. 4504 97.85 4504 97.85
30503 - 110303 ASCED code 97 2.11 4601 99.96
999999 Unclassifiable/Don't know 2 0.04 4603 100.00
CD4 Classes/off-the-job training at TAFE
LCCD004 Frequency PercentCumulativeFrequency
CumulativePercent
. 4504 97.85 4504 97.85
0 No 25 0.54 4529 98.39
1 Yes 63 1.37 4592 99.76
3 Don't know 11 0.24 4603 100.00
CD5 Provider of off-the-job training
LCCD005 Frequency PercentCumulativeFrequency
CumulativePercent
. 4578 99.46 4578 99.46
1 Employer/group employer 11 0.24 4589 99.70
2 Non-TAFE training (VET) organisation 7 0.15 4596 99.85
95 Other 7 0.15 4603 100.00
CD6 Type of employer
LCCD006 Frequency PercentCumulativeFrequency
CumulativePercent
. 4504 97.85 4504 97.85
1 Group training organisation 22 0.48 4526 98.33
2 Particular Employer 64 1.39 4590 99.72
99 Don't know 13 0.28 4603 100.00
CD7 Current apprenticeship/traineeship
LCCD007 Frequency PercentCumulativeFrequency
CumulativePercent
. 4504 97.85 4504 97.85
0 No 20 0.43 4524 98.28
1 Yes 79 1.72 4603 100.00
NCVER 53
CD7A Continuing apprenticeship/traineeship
LCCD007A Frequency PercentCumulativeFrequency
CumulativePercent
. 4553 98.91 4553 98.91
0 No 22 0.48 4575 99.39
1 Yes 28 0.61 4603 100.00
CD8 Current apprenticeship/traineeship is full-time or part-time
LCCD008 Frequency PercentCumulativeFrequency
CumulativePercent
. 4496 97.68 4496 97.68
1 Full-time 88 1.91 4584 99.59
2 Part-time 19 0.41 4603 100.00
CD9 No change of employer
LCCD009 Frequency PercentCumulativeFrequency
CumulativePercent
. 4496 97.68 4496 97.68
0 No 9 0.20 4505 97.87
1 Yes 98 2.13 4603 100.00
CD10 Type of employer
LCCD010 Frequency PercentCumulativeFrequency
CumulativePercent
. 4594 99.80 4594 99.80
1 Group training company 1 0.02 4595 99.83
2 Particular Employer 7 0.15 4602 99.98
99 Don't know 1 0.02 4603 100.00
CD11 Month changed employer
LCCD011M Frequency PercentCumulativeFrequency
CumulativePercent
. 4594 99.80 4594 99.80
3 March 2 0.04 4596 99.85
4 April 1 0.02 4597 99.87
5 May 3 0.07 4600 99.93
7 July 1 0.02 4601 99.96
8 August 1 0.02 4602 99.98
11 November 1 0.02 4603 100.00
54 LSAY 2015 cohort: wave 3 (2017) – frequency tables
CD11 Year changed employer
LCCD011Y Frequency PercentCumulativeFrequency
CumulativePercent
. 4594 99.80 4594 99.80
7 2017 9 0.20 4603 100.00
CD12 Circumstances of changing employer
LCCD012 Frequency PercentCumulativeFrequency
CumulativePercent
. 4594 99.80 4594 99.80
1 It was your choice 4 0.09 4598 99.89
2 You had to leave because the employer was going out of business
2 0.04 4600 99.93
3 You were laid off or forced to change for some other reason
3 0.07 4603 100.00
CD13a You got a better job
LCCD013A Frequency PercentCumulativeFrequency
CumulativePercent
. 4599 99.91 4599 99.91
0 No 1 0.02 4600 99.93
1 Yes 3 0.07 4603 100.00
CD13b You didn't get on with your boss or other people at work
LCCD013B Frequency PercentCumulativeFrequency
CumulativePercent
. 4599 99.91 4599 99.91
0 No 3 0.07 4602 99.98
1 Yes 1 0.02 4603 100.00
CD13c You weren't happy with the on-the-job training
LCCD013C Frequency PercentCumulativeFrequency
CumulativePercent
. 4599 99.91 4599 99.91
0 No 4 0.09 4603 100.00
CD13d Problems with travelling or transport
LCCD013D Frequency PercentCumulativeFrequency
CumulativePercent
. 4599 99.91 4599 99.91
0 No 4 0.09 4603 100.00
NCVER 55
CD13e Health or personal reasons
LCCD013E Frequency PercentCumulativeFrequency
CumulativePercent
. 4599 99.91 4599 99.91
0 No 4 0.09 4603 100.00
CD13f The pay was too low
LCCD013F Frequency PercentCumulativeFrequency
CumulativePercent
. 4599 99.91 4599 99.91
0 No 4 0.09 4603 100.00
CD13g Other factor in deciding to change employer
LCCD013G Frequency PercentCumulativeFrequency
CumulativePercent
. 4599 99.91 4599 99.91
0 No 4 0.09 4603 100.00
CD14 Main reason changed employer
LCCD014 Frequency PercentCumulativeFrequency
CumulativePercent
. 4603 100.00 4603 100.00
CD15 Month stopped apprenticeship/traineeship
LCCD015M Frequency PercentCumulativeFrequency
CumulativePercent
. 4561 99.09 4561 99.09
1 January 6 0.13 4567 99.22
2 February 2 0.04 4569 99.26
3 March 1 0.02 4570 99.28
4 April 1 0.02 4571 99.30
5 May 1 0.02 4572 99.33
6 June 3 0.07 4575 99.39
7 July 3 0.07 4578 99.46
8 August 8 0.17 4586 99.63
9 September 2 0.04 4588 99.67
10 October 5 0.11 4593 99.78
11 November 4 0.09 4597 99.87
12 December 6 0.13 4603 100.00
56 LSAY 2015 cohort: wave 3 (2017) – frequency tables
CD15 Year stopped apprenticeship/traineeship
LCCD015Y Frequency PercentCumulativeFrequency
CumulativePercent
. 4561 99.09 4561 99.09
5 2015 1 0.02 4562 99.11
6 2016 8 0.17 4570 99.28
7 2017 33 0.72 4603 100.00
CD16 Circumstances of ending apprenticeship/traineeship
LCCD016 Frequency PercentCumulativeFrequency
CumulativePercent
. 4561 99.09 4561 99.09
1 Finished 25 0.54 4586 99.63
2 Withdrew 8 0.17 4594 99.80
4 Stopped for some other reason 9 0.20 4603 100.00
CD17 Reason apprenticeship/traineeship ended (for other reason)
LCCD017 Frequency PercentCumulativeFrequency
CumulativePercent
. 4594 99.80 4594 99.80
1 Chose to stop 5 0.11 4599 99.91
2 Going out of business 1 0.02 4600 99.93
3 Laid off/forced to stop 3 0.07 4603 100.00
CD18a You got a better job
LCCD018A Frequency PercentCumulativeFrequency
CumulativePercent
. 4590 99.72 4590 99.72
0 No 10 0.22 4600 99.93
1 Yes 3 0.07 4603 100.00
CD18b The pay was too low
LCCD018B Frequency PercentCumulativeFrequency
CumulativePercent
. 4590 99.72 4590 99.72
0 No 9 0.20 4599 99.91
1 Yes 4 0.09 4603 100.00
NCVER 57

CD18c You weren't happy with the job prospects in that industry
LCCD018C Frequency PercentCumulativeFrequency
CumulativePercent
. 4590 99.72 4590 99.72
0 No 10 0.22 4600 99.93
1 Yes 3 0.07 4603 100.00
CD18d You didn't like the type of work
LCCD018D Frequency PercentCumulativeFrequency
CumulativePercent
. 4590 99.72 4590 99.72
0 No 10 0.22 4600 99.93
1 Yes 3 0.07 4603 100.00
CD18e You didn't get on with your boss or other people at work
LCCD018E Frequency PercentCumulativeFrequency
CumulativePercent
. 4590 99.72 4590 99.72
0 No 12 0.26 4602 99.98
1 Yes 1 0.02 4603 100.00
CD18f You weren't happy with the on-the-job training
LCCD018F Frequency PercentCumulativeFrequency
CumulativePercent
. 4590 99.72 4590 99.72
0 No 13 0.28 4603 100.00
CD18g You weren't happy with the off-the-job training
LCCD018G Frequency PercentCumulativeFrequency
CumulativePercent
. 4590 99.72 4590 99.72
0 No 13 0.28 4603 100.00
CD18h You found the study too difficult
LCCD018H Frequency PercentCumulativeFrequency
CumulativePercent
. 4590 99.72 4590 99.72
0 No 12 0.26 4602 99.98
1 Yes 1 0.02 4603 100.00
58 LSAY 2015 cohort: wave 3 (2017) – frequency tables
CD18i Problems with travelling or transport
LCCD018I Frequency PercentCumulativeFrequency
CumulativePercent
. 4590 99.72 4590 99.72
0 No 11 0.24 4601 99.96
1 Yes 2 0.04 4603 100.00
CD18j Health or personal reasons
LCCD018J Frequency PercentCumulativeFrequency
CumulativePercent
. 4590 99.72 4590 99.72
0 No 9 0.20 4599 99.91
1 Yes 4 0.09 4603 100.00
CD18k You were always feeling rushed and pressed for time on the job
LCCD018K Frequency PercentCumulativeFrequency
CumulativePercent
. 4590 99.72 4590 99.72
0 No 11 0.24 4601 99.96
1 Yes 2 0.04 4603 100.00
CD18l You had problems juggling work and family commitments
LCCD018L Frequency PercentCumulativeFrequency
CumulativePercent
. 4590 99.72 4590 99.72
0 No 9 0.20 4599 99.91
1 Yes 4 0.09 4603 100.00
CD18m Because of parental responsibilities
LCCD018M Frequency PercentCumulativeFrequency
CumulativePercent
. 4590 99.72 4590 99.72
0 No 12 0.26 4602 99.98
1 Yes 1 0.02 4603 100.00
NCVER 59
CD18n Other factor in deciding to stop your apprenticeship/traineeship
LCCD018N Frequency PercentCumulativeFrequency
CumulativePercent
. 4590 99.72 4590 99.72
0 No 11 0.24 4601 99.96
1 Yes 2 0.04 4603 100.00
CD19 And what was your main reason for stopping?
LCCD019 Frequency PercentCumulativeFrequency
CumulativePercent
. 4595 99.83 4595 99.83
2 The pay was too low 1 0.02 4596 99.85
4 You didn’t like the type of work 2 0.04 4598 99.89
5 You didn’t get on with your boss or other people at work
1 0.02 4599 99.91
8 You found the study too difficult 1 0.02 4600 99.93
11 You were always feeling rushed and pressed for time on the job
1 0.02 4601 99.96
12 You had problems juggling work and family commitments
1 0.02 4602 99.98
95 Other 1 0.02 4603 100.00
CD20 No change of employer
LCCD020 Frequency PercentCumulativeFrequency
CumulativePercent
. 4561 99.09 4561 99.09
0 No 3 0.07 4564 99.15
1 Yes 39 0.85 4603 100.00
CD21 Type of employer changed to
LCCD021 Frequency PercentCumulativeFrequency
CumulativePercent
. 4600 99.93 4600 99.93
2 Particular Employer 2 0.04 4602 99.98
99 Don't know 1 0.02 4603 100.00
60 LSAY 2015 cohort: wave 3 (2017) – frequency tables
CD22 Month changed employer
LCCD022M Frequency PercentCumulativeFrequency
CumulativePercent
. 4600 99.93 4600 99.93
2 February 1 0.02 4601 99.96
5 May 1 0.02 4602 99.98
6 June 1 0.02 4603 100.00
CD22 Year changed employer
LCCD022Y Frequency PercentCumulativeFrequency
CumulativePercent
. 4600 99.93 4600 99.93
6 2016 2 0.04 4602 99.98
7 2017 1 0.02 4603 100.00
C81 Current study or training (not elsewhere reported)
LCC081 Frequency PercentCumulativeFrequency
CumulativePercent
. 4392 95.42 4392 95.42
1 An apprenticeship 8 0.17 4400 95.59
2 A traineeship 7 0.15 4407 95.74
3 Other study or training at university/TAFE/other educational institution
40 0.87 4447 96.61
4 None of these 156 3.39 4603 100.00
C82 Current apprenticeship/traineeship is full-time or part-time
LCC082 Frequency PercentCumulativeFrequency
CumulativePercent
. 4588 99.67 4588 99.67
1 Full-time 12 0.26 4600 99.93
2 Part-time 3 0.07 4603 100.00
C83 Full-time or part-time study
LCC083 Frequency PercentCumulativeFrequency
CumulativePercent
. 4563 99.13 4563 99.13
1 Full-time 24 0.52 4587 99.65
2 Part-time 15 0.33 4602 99.98
3 Equally full-time and part-time 1 0.02 4603 100.00
NCVER 61
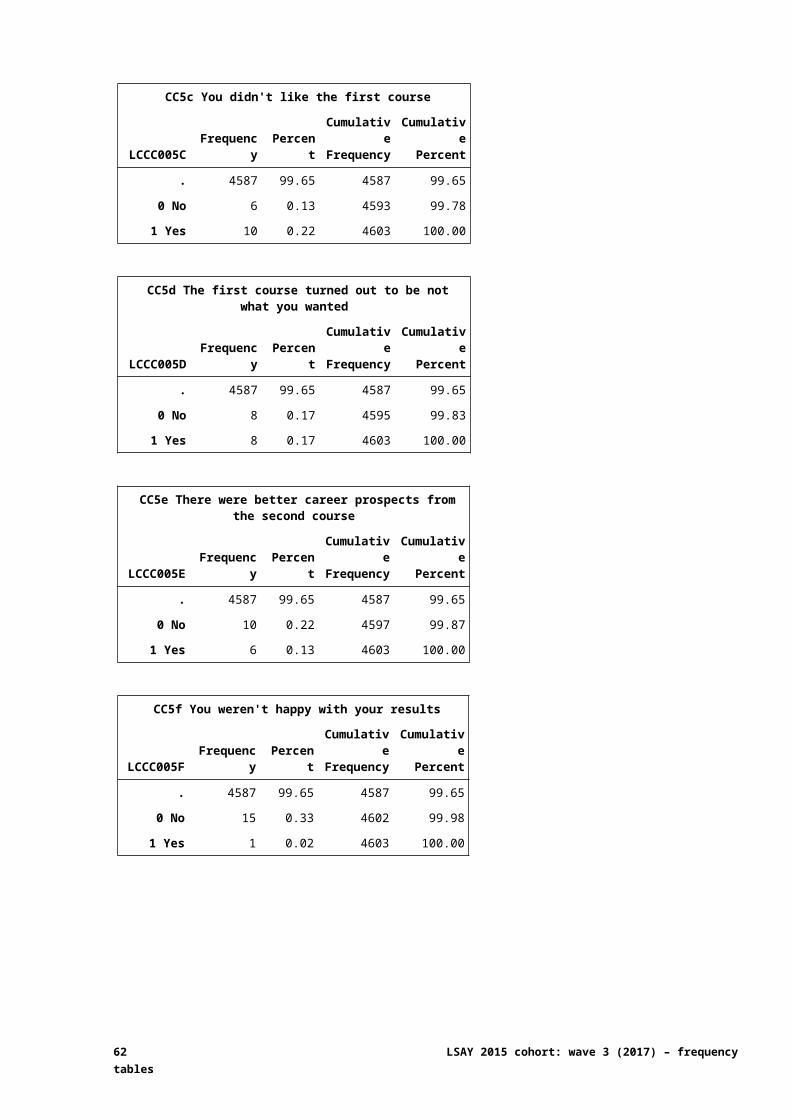
C84 Type of qualification
LCC084 Frequency PercentCumulativeFrequency
CumulativePercent
. 4548 98.81 4548 98.81
1 Year 12 - but not at secondary school 1 0.02 4549 98.83
2 Certificate 1 2 0.04 4551 98.87
3 Certificate 2 7 0.15 4558 99.02
4 Certificate 3 11 0.24 4569 99.26
5 Certificate 4 6 0.13 4575 99.39
6 Certificate (DK level) 2 0.04 4577 99.44
7 VET/TAFE Diploma 8 0.17 4585 99.61
9 University Diploma 1 0.02 4586 99.63
11 Bachelor Degree (includes honours) 9 0.20 4595 99.83
12 VET/TAFE Graduate Diploma or VET/TAFE Graduate Certificate
1 0.02 4596 99.85
15 Short course or recreational course 1 0.02 4597 99.87
17 Single module only 1 0.02 4598 99.89
19 Don't know 4 0.09 4602 99.98
95 Something else 1 0.02 4603 100.00
C85/C86 Institution (including campus)
LCC085 Frequency PercentCumulativeFrequency
CumulativePercent
. 4564 99.15 4564 99.15
130101 - 810101 6 digit institution code 37 0.80 4601 99.96
999999 Don't know 2 0.04 4603 100.00
C86 Campus specified or online
LCC086 Frequency PercentCumulativeFrequency
CumulativePercent
. 4564 99.15 4564 99.15
1 All study completed online - don't have a campus 5 0.11 4569 99.26
95 Campus specified 30 0.65 4599 99.91
99 Don't know 4 0.09 4603 100.00
C88 ASCED code
LCC088 Frequency PercentCumulativeFrequency
CumulativePercent
. 4549 98.83 4549 98.83
10199 - 120199 ASCED code 53 1.15 4602 99.98
999999 Unclassifiable/Don't know 1 0.02 4603 100.00
62 LSAY 2015 cohort: wave 3 (2017) – frequency tables
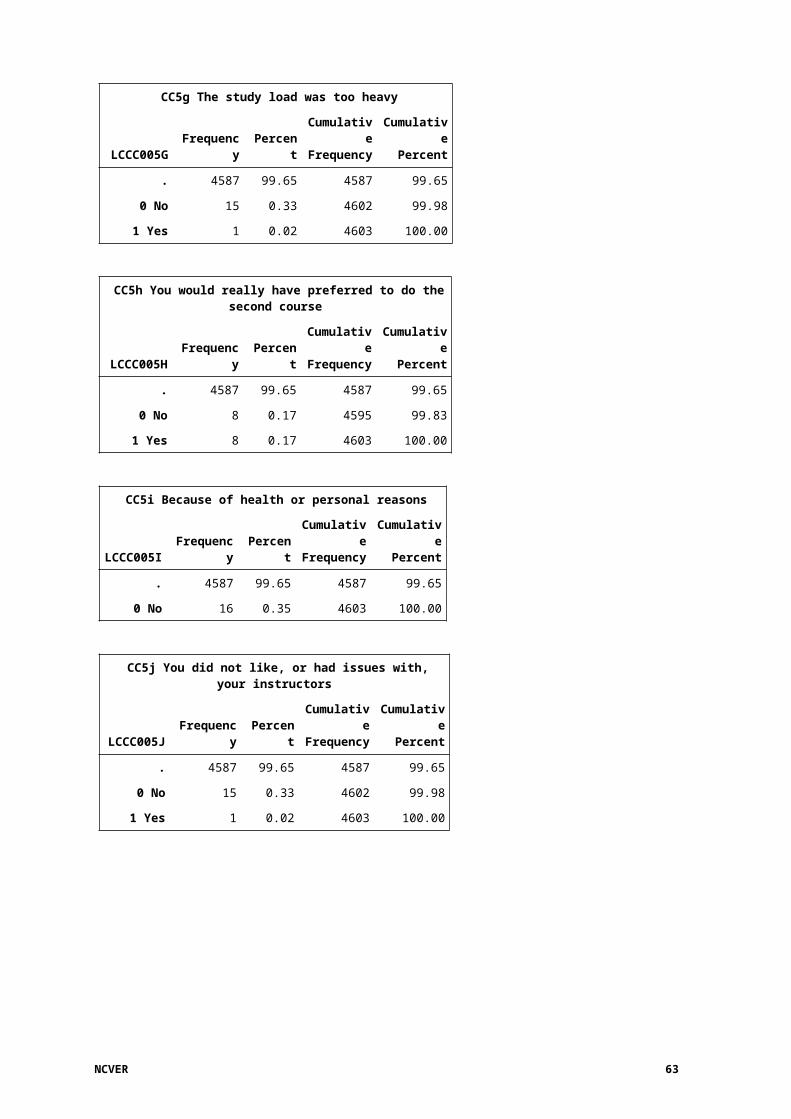
C89 Classes/off-the-job training provided by a TAFE college or a similar training (VET) provider
LCC089 Frequency PercentCumulativeFrequency
CumulativePercent
. 4588 99.67 4588 99.67
1 TAFE college 5 0.11 4593 99.78
2 Other training (VET) provider 7 0.15 4600 99.93
3 Neither of these 2 0.04 4602 99.98
99 Don't know 1 0.02 4603 100.00
C90 Provider of off-the-job training
LCC090 Frequency PercentCumulativeFrequency
CumulativePercent
. 4601 99.96 4601 99.96
1 Employer/group employer 2 0.04 4603 100.00
C91 Type of employer
LCC091 Frequency PercentCumulativeFrequency
CumulativePercent
. 4588 99.67 4588 99.67
1 Group training organisation 4 0.09 4592 99.76
2 Particular Employer 8 0.17 4600 99.93
99 Don't know 3 0.07 4603 100.00
C92 Month began apprenticeship/traineeship/study
LCC092M Frequency PercentCumulativeFrequency
CumulativePercent
. 4548 98.81 4548 98.81
1 January 7 0.15 4555 98.96
2 February 11 0.24 4566 99.20
3 March 5 0.11 4571 99.30
6 June 4 0.09 4575 99.39
7 July 7 0.15 4582 99.54
8 August 6 0.13 4588 99.67
9 September 4 0.09 4592 99.76
10 October 1 0.02 4593 99.78
11 November 3 0.07 4596 99.85
12 December 5 0.11 4601 99.96
88 Month unknown 2 0.04 4603 100.00
NCVER 63
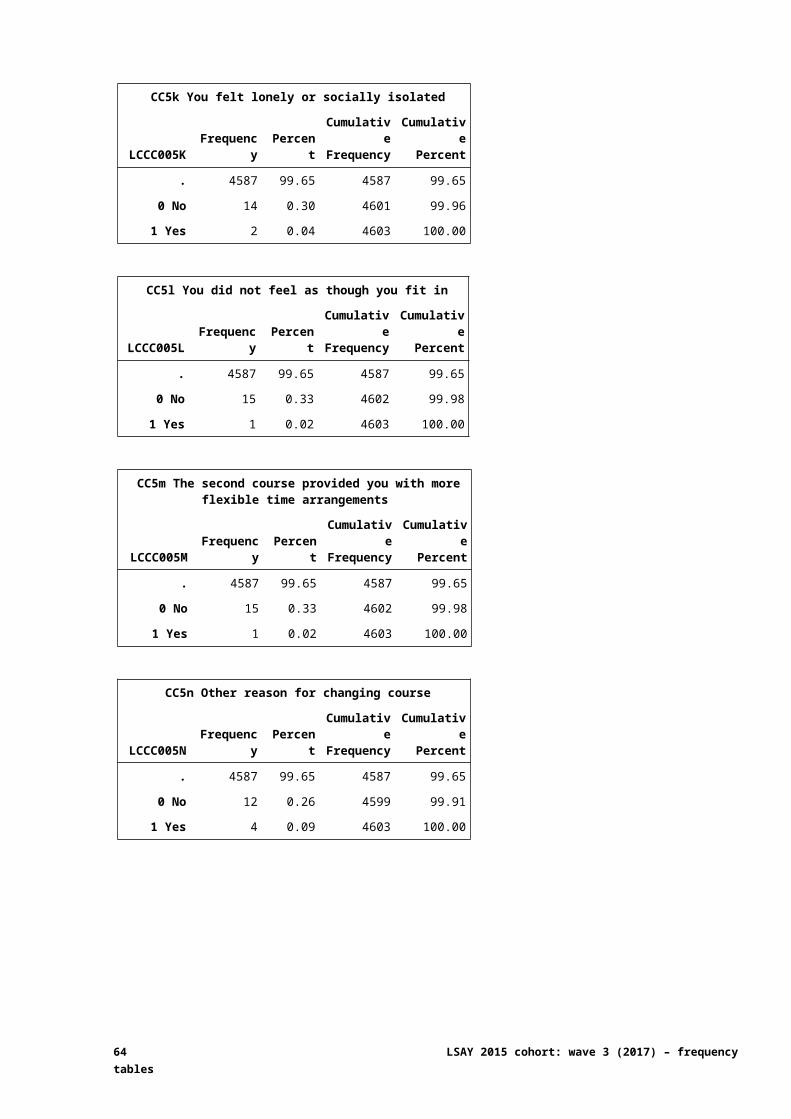
C92 Year began apprenticeship/traineeship/study
LCC092Y Frequency PercentCumulativeFrequency
CumulativePercent
. 4548 98.81 4548 98.81
5 2015 1 0.02 4549 98.83
6 2016 3 0.07 4552 98.89
7 2017 40 0.87 4592 99.76
88 Year unknown 11 0.24 4603 100.00
C93 Currently receiving Youth Allowance/Abstudy
LCC093 Frequency PercentCumulativeFrequency
CumulativePercent
. 4448 96.63 4448 96.63
0 No 125 2.72 4573 99.35
1 Yes 21 0.46 4594 99.80
9 Don't know 9 0.20 4603 100.00
C94 Fortnightly YA/Abstudy
LCC094 Frequency PercentCumulativeFrequency
CumulativePercent
. 4582 99.54 4582 99.54
50 to 1300 dollars 16 0.35 4598 99.89
9999 Don't know 5 0.11 4603 100.00
C94 Fortnightly YA/Abstudy
N Mean Median Std Dev Minimum Maximum
16 396.75 258.50 331.06 50.00 1300.00
C95a No course fees (excluding HECS-HELP/FEE-HELP)
LCC095A Frequency PercentCumulativeFrequency
CumulativePercent
. 4568 99.24 4568 99.24
0 No 29 0.63 4597 99.87
1 Yes 6 0.13 4603 100.00
C95b Respondent pays course fees (excluding HECS-HELP/FEE-HELP)
LCC095B Frequency PercentCumulativeFrequency
CumulativePercent
. 4568 99.24 4568 99.24
0 No 24 0.52 4592 99.76
1 Yes 11 0.24 4603 100.00
64 LSAY 2015 cohort: wave 3 (2017) – frequency tables
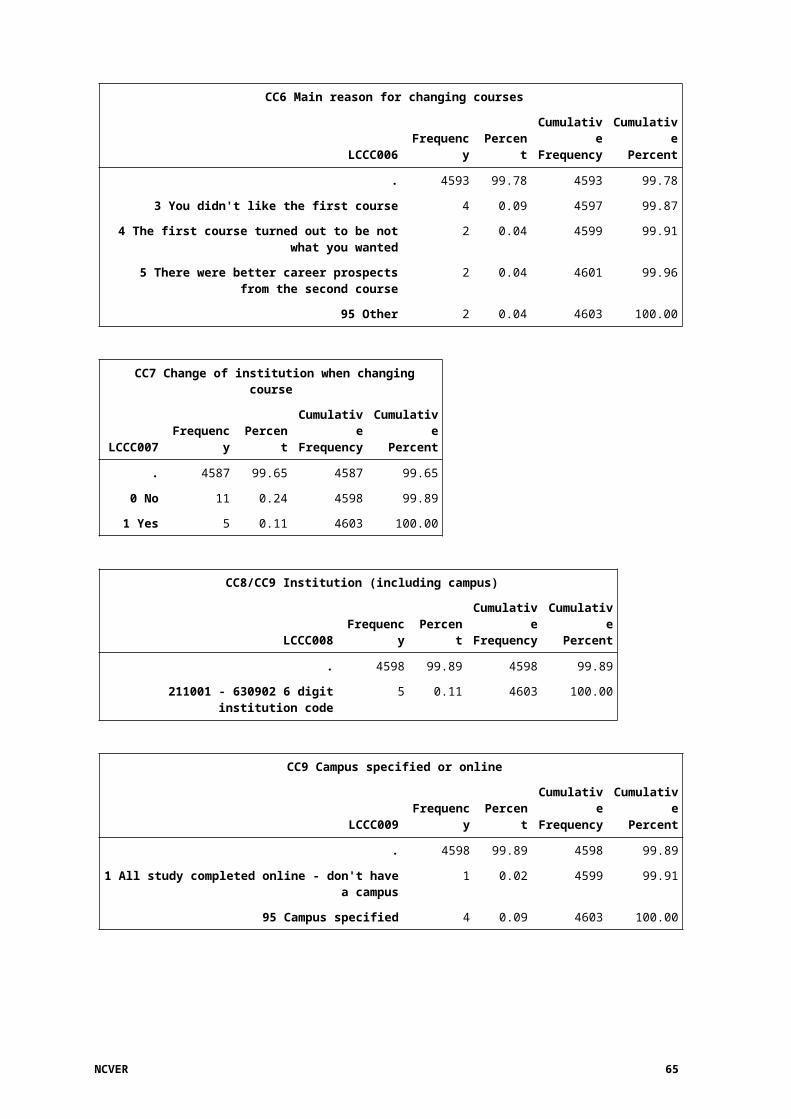
C95c Parents/family pay course fees (excluding HECS-HELP/FEE-HELP)
LCC095C Frequency PercentCumulativeFrequency
CumulativePercent
. 4568 99.24 4568 99.24
0 No 26 0.56 4594 99.80
1 Yes 9 0.20 4603 100.00
C95d Employer pays course fees (excluding HECS-HELP/FEE-HELP)
LCC095D Frequency PercentCumulativeFrequency
CumulativePercent
. 4568 99.24 4568 99.24
0 No 34 0.74 4602 99.98
1 Yes 1 0.02 4603 100.00
C95e Government pays course fees (excluding HECS-HELP/FEE-HELP)
LCC095E Frequency PercentCumulativeFrequency
CumulativePercent
. 4568 99.24 4568 99.24
0 No 27 0.59 4595 99.83
1 Yes 8 0.17 4603 100.00
C95f Other source of course fees (excluding HECS-HELP/FEE-HELP)
LCC095F Frequency PercentCumulativeFrequency
CumulativePercent
. 4568 99.24 4568 99.24
0 No 35 0.76 4603 100.00
C96 Commonwealth Supported or full-fee place
LCC096 Frequency PercentCumulativeFrequency
CumulativePercent
. 4593 99.78 4593 99.78
1 Commonwealth Supported (HECS or HELP) 10 0.22 4603 100.00
C97 Payment for Commonwealth Supported course
LCC097 Frequency PercentCumulativeFrequency
CumulativePercent
. 4593 99.78 4593 99.78
1 HECS-HELP loan 9 0.20 4602 99.98
3 Up-front payment 1 0.02 4603 100.00
NCVER 65
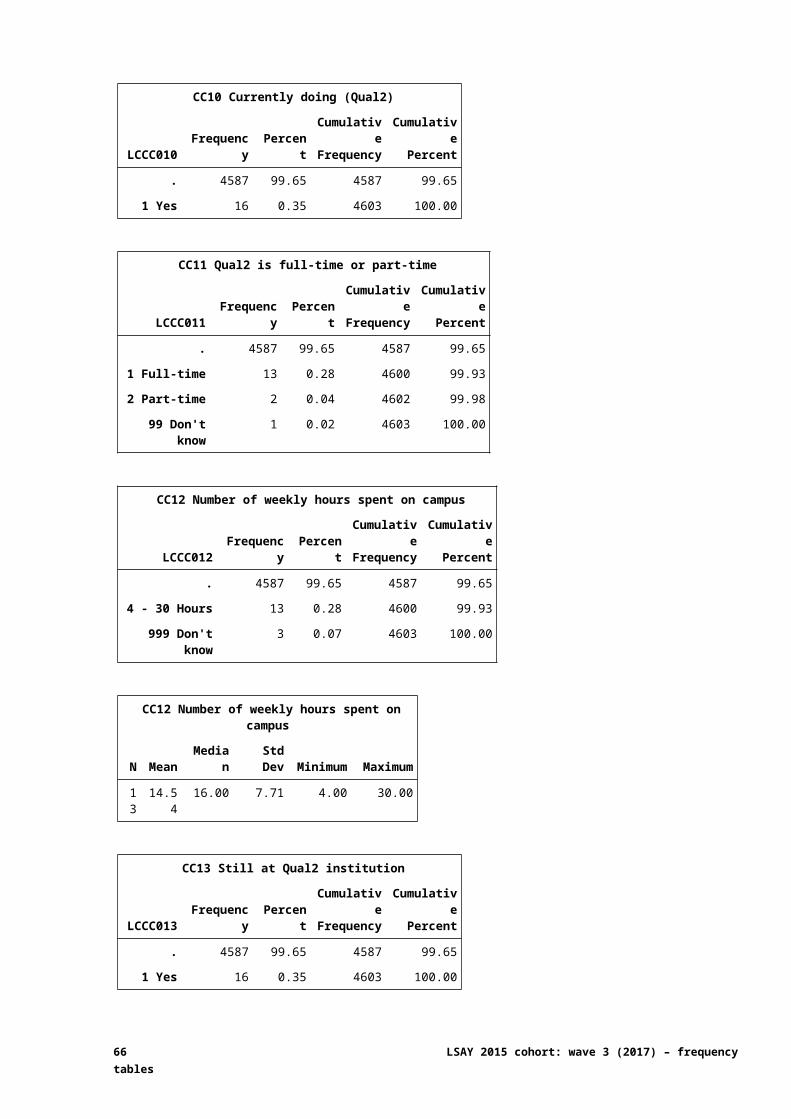
C98a Paying for course with FEE-HELP loan
LCC098A Frequency PercentCumulativeFrequency
CumulativePercent
. 4585 99.61 4585 99.61
0 No 11 0.24 4596 99.85
1 Yes 7 0.15 4603 100.00
C98b Paying for course with up-front payment
LCC098B Frequency PercentCumulativeFrequency
CumulativePercent
. 4585 99.61 4585 99.61
0 No 11 0.24 4596 99.85
1 Yes 7 0.15 4603 100.00
C98c Paying for course with payment scheme offered by the course provider
LCC098C Frequency PercentCumulativeFrequency
CumulativePercent
. 4585 99.61 4585 99.61
0 No 11 0.24 4596 99.85
1 Yes 7 0.15 4603 100.00
C98d Employer is paying for course
LCC098D Frequency PercentCumulativeFrequency
CumulativePercent
. 4585 99.61 4585 99.61
0 No 11 0.24 4596 99.85
1 Yes 7 0.15 4603 100.00
C98e Paying for course with a scholarship
LCC098E Frequency PercentCumulativeFrequency
CumulativePercent
. 4585 99.61 4585 99.61
0 No 11 0.24 4596 99.85
1 Yes 7 0.15 4603 100.00
66 LSAY 2015 cohort: wave 3 (2017) – frequency tables
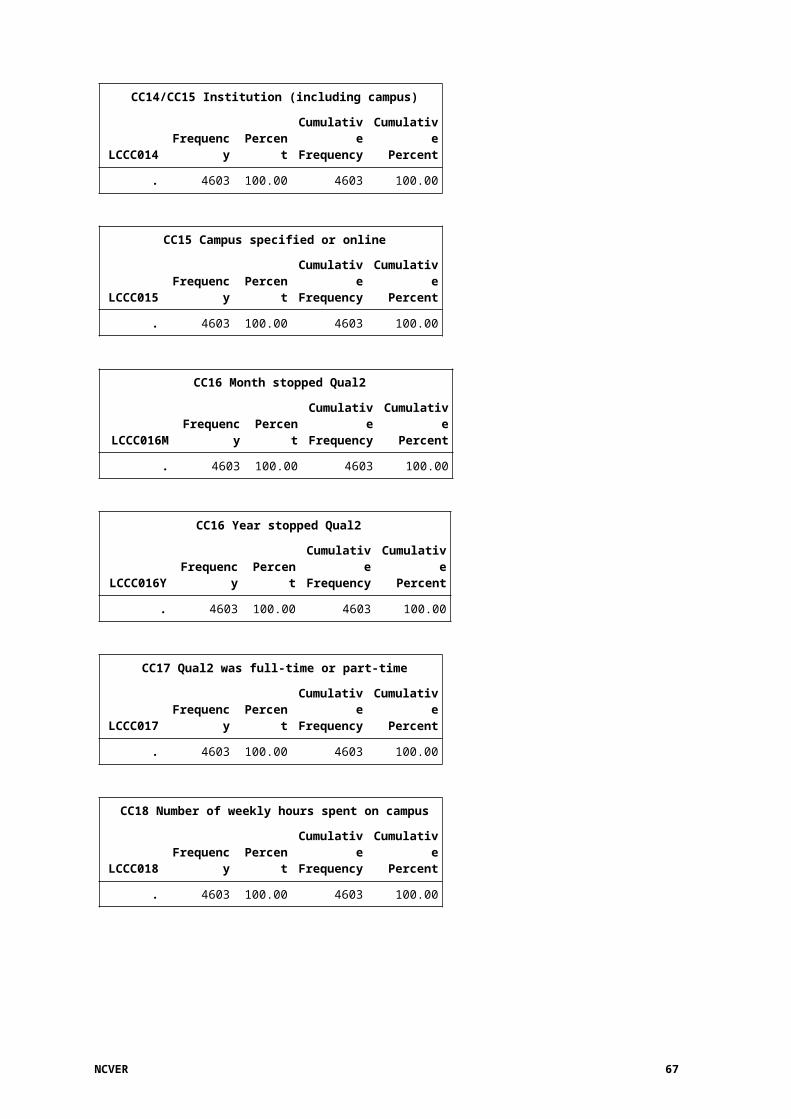
C99a Talked to careers guidance officer
LCC099A Frequency PercentCumulativeFrequency
CumulativePercent
. 2908 63.18 2908 63.18
0 Not applicable 1053 22.88 3961 86.05
1 Applicable 642 13.95 4603 100.00
C99b Aptitude questionnaire
LCC099B Frequency PercentCumulativeFrequency
CumulativePercent
. 2908 63.18 2908 63.18
0 Not applicable 1211 26.31 4119 89.49
1 Applicable 484 10.51 4603 100.00
C99c Received information on how to apply for a job
LCC099C Frequency PercentCumulativeFrequency
CumulativePercent
. 2908 63.18 2908 63.18
0 Not applicable 996 21.64 3904 84.81
1 Applicable 699 15.19 4603 100.00
C99d Received information about further study
LCC099D Frequency PercentCumulativeFrequency
CumulativePercent
. 2908 63.18 2908 63.18
0 Not applicable 791 17.18 3699 80.36
1 Applicable 904 19.64 4603 100.00
C99e Used on-line career website or career planning tool
LCC099E Frequency PercentCumulativeFrequency
CumulativePercent
. 2908 63.18 2908 63.18
0 Not applicable 1276 27.72 4184 90.90
1 Applicable 419 9.10 4603 100.00
C99f Have not received careers guidance or advice (None of these)
LCC099F Frequency PercentCumulativeFrequency
CumulativePercent
. 2908 63.18 2908 63.18
0 Not applicable 1271 27.61 4179 90.79
1 Applicable 424 9.21 4603 100.00
NCVER 67
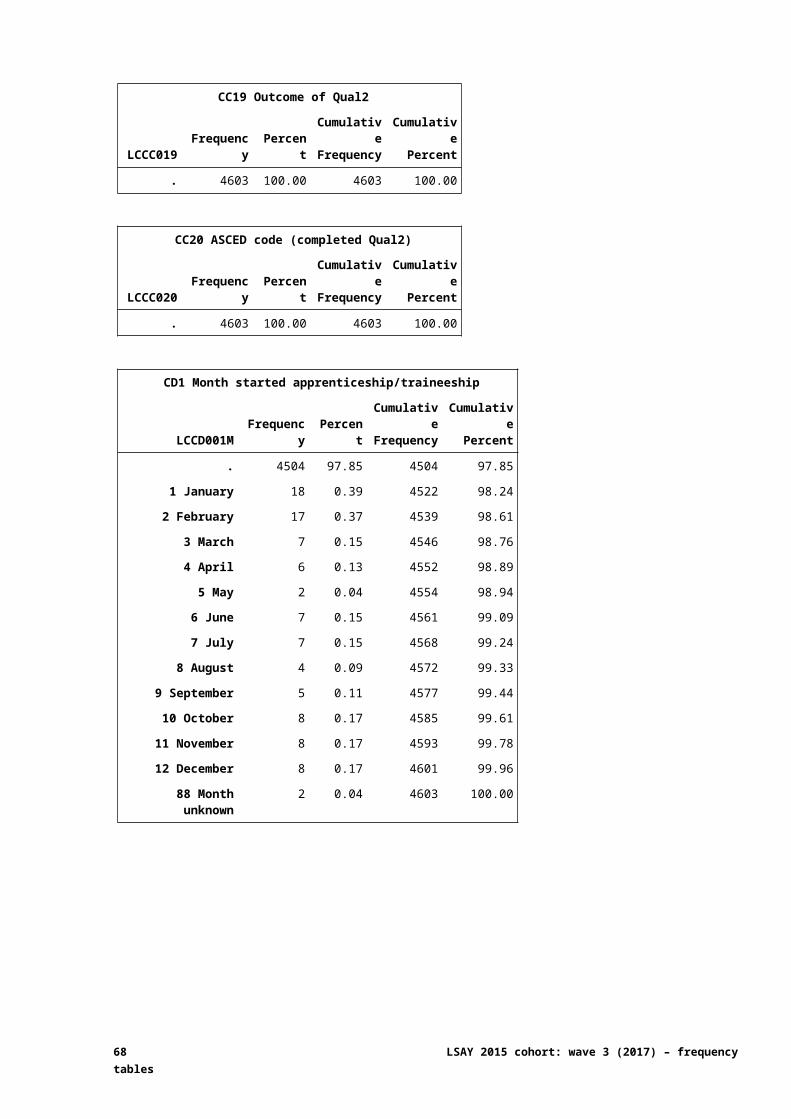
Section D: Work D1 Currently work in a job / business / farm
LCD001 Frequency PercentCumulativeFrequency
CumulativePercent
. 122 2.65 122 2.65
0 No 1793 38.95 1915 41.60
1 Yes 2524 54.83 4439 96.44
3 Waiting to start job 164 3.56 4603 100.00
D2 Away from job/business due to holidays/sickness/other reason
LCD002 Frequency PercentCumulativeFrequency
CumulativePercent
. 2810 61.05 2810 61.05
0 No 1758 38.19 4568 99.24
1 Yes 35 0.76 4603 100.00
D3 Is this a job that you do ONLY during school holidays?
LCD003 Frequency PercentCumulativeFrequency
CumulativePercent
. 2980 64.74 2980 64.74
0 No 1495 32.48 4475 97.22
1 Yes 128 2.78 4603 100.00
D4 Is this a seasonal job, meaning a job that you only do at certain times of the year?
LCD004 Frequency PercentCumulativeFrequency
CumulativePercent
. 3667 79.67 3667 79.67
0 No 823 17.88 4490 97.55
1 Yes 113 2.45 4603 100.00
D5 More than one job
LCD005 Frequency PercentCumulativeFrequency
CumulativePercent
. 1922 41.76 1922 41.76
0 No 2262 49.14 4184 90.90
1 Yes 419 9.10 4603 100.00
68 LSAY 2015 cohort: wave 3 (2017) – frequency tables
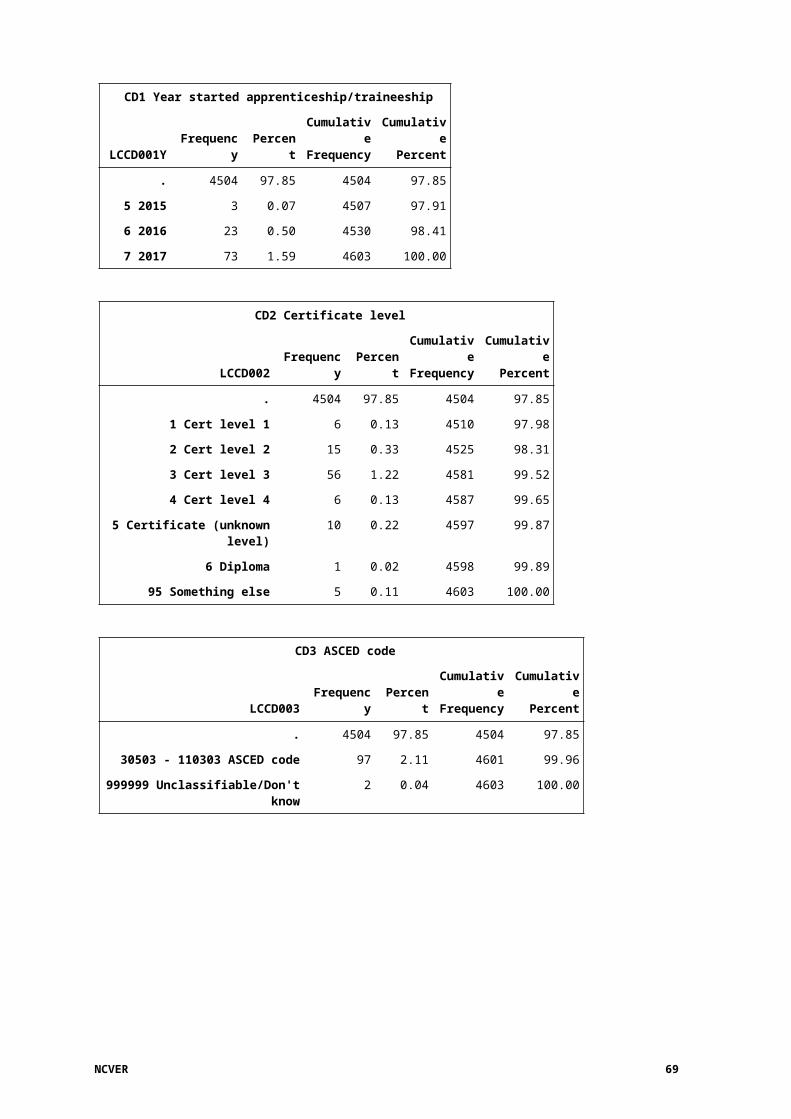
D6 Month finished job
LCD006M Frequency PercentCumulativeFrequency
CumulativePercent
. 4303 93.48 4303 93.48
1 January 38 0.83 4341 94.31
2 February 40 0.87 4381 95.18
3 March 22 0.48 4403 95.66
4 April 14 0.30 4417 95.96
5 May 17 0.37 4434 96.33
6 June 17 0.37 4451 96.70
7 July 21 0.46 4472 97.15
8 August 17 0.37 4489 97.52
9 September 14 0.30 4503 97.83
10 October 13 0.28 4516 98.11
11 November 15 0.33 4531 98.44
12 December 34 0.74 4565 99.17
87 Didn't have a job at the last interview 8 0.17 4573 99.35
88 Month unknown 30 0.65 4603 100.00
D6 Year finished job
LCD006Y Frequency PercentCumulativeFrequency
CumulativePercent
. 4303 93.48 4303 93.48
15 2015 1 0.02 4304 93.50
16 2016 77 1.67 4381 95.18
17 2017 195 4.24 4576 99.41
87 Didn't have a job at the last interview 8 0.17 4584 99.59
88 Don't know 19 0.41 4603 100.00
D7 What was the main reason you left that job?
LCD007 Frequency PercentCumulativeFrequency
CumulativePercent
. 4311 93.66 4311 93.66
1 Was only a school holiday job/student vacation job
17 0.37 4328 94.03
2 Job ended/temporary job/seasonal work 32 0.70 4360 94.72
3 Got laid off/sacked/retrenched 9 0.20 4369 94.92
4 Not satisfied with job 39 0.85 4408 95.76
5 Went to live somewhere else 19 0.41 4427 96.18
6 Reasons to do with study 132 2.87 4559 99.04
7 To get another job/better job 12 0.26 4571 99.30
95 Other 32 0.70 4603 100.00
NCVER 69
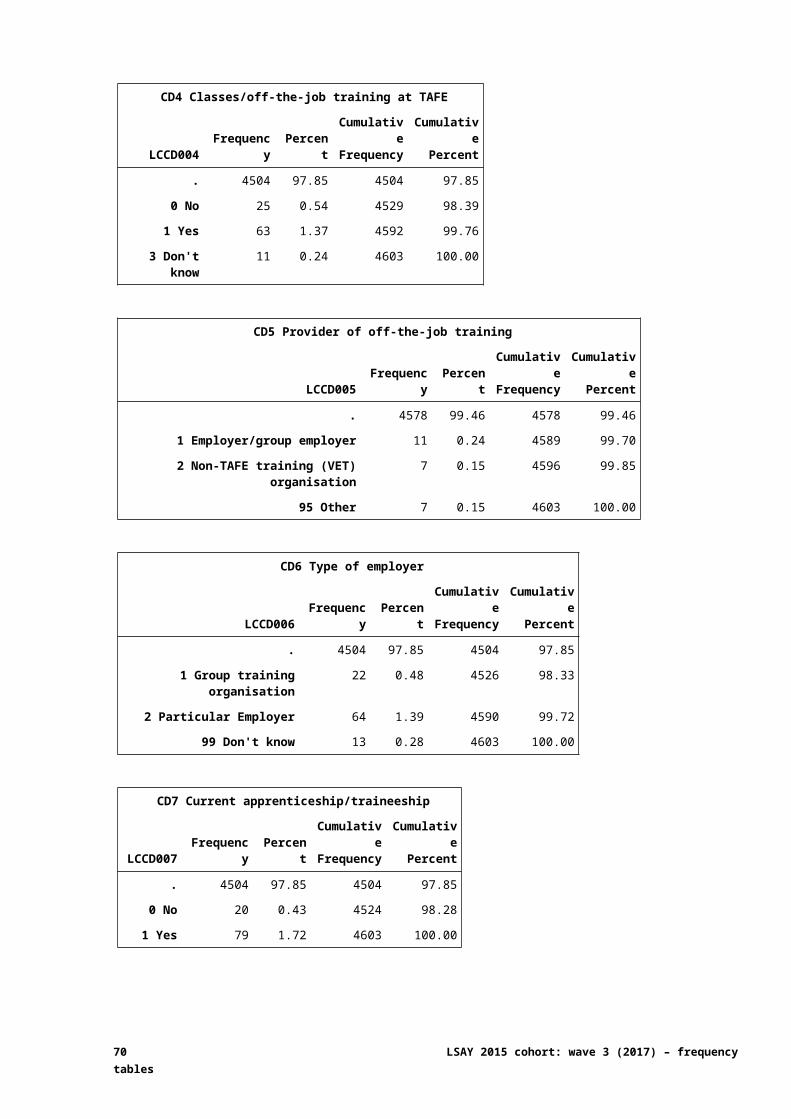
D8 Still have job reported at last interview
LCD008 Frequency PercentCumulativeFrequency
CumulativePercent
. 3146 68.35 3146 68.35
0 No 308 6.69 3454 75.04
1 Yes (including company changed name) 1145 24.88 4599 99.91
3 Didn't have a job at the last interview 4 0.09 4603 100.00
D9 Month finished job
LCD009M Frequency PercentCumulativeFrequency
CumulativePercent
. 4295 93.31 4295 93.31
1 January 43 0.93 4338 94.24
2 February 27 0.59 4365 94.83
3 March 31 0.67 4396 95.50
4 April 17 0.37 4413 95.87
5 May 18 0.39 4431 96.26
6 June 19 0.41 4450 96.68
7 July 18 0.39 4468 97.07
8 August 16 0.35 4484 97.41
9 September 15 0.33 4499 97.74
10 October 19 0.41 4518 98.15
11 November 32 0.70 4550 98.85
12 December 35 0.76 4585 99.61
88 Month unknown 18 0.39 4603 100.00
D9 Year finished job
LCD009Y Frequency PercentCumulativeFrequency
CumulativePercent
. 4295 93.31 4295 93.31
6 2016 94 2.04 4389 95.35
7 2017 207 4.50 4596 99.85
88 Year unknown 7 0.15 4603 100.00
70 LSAY 2015 cohort: wave 3 (2017) – frequency tables
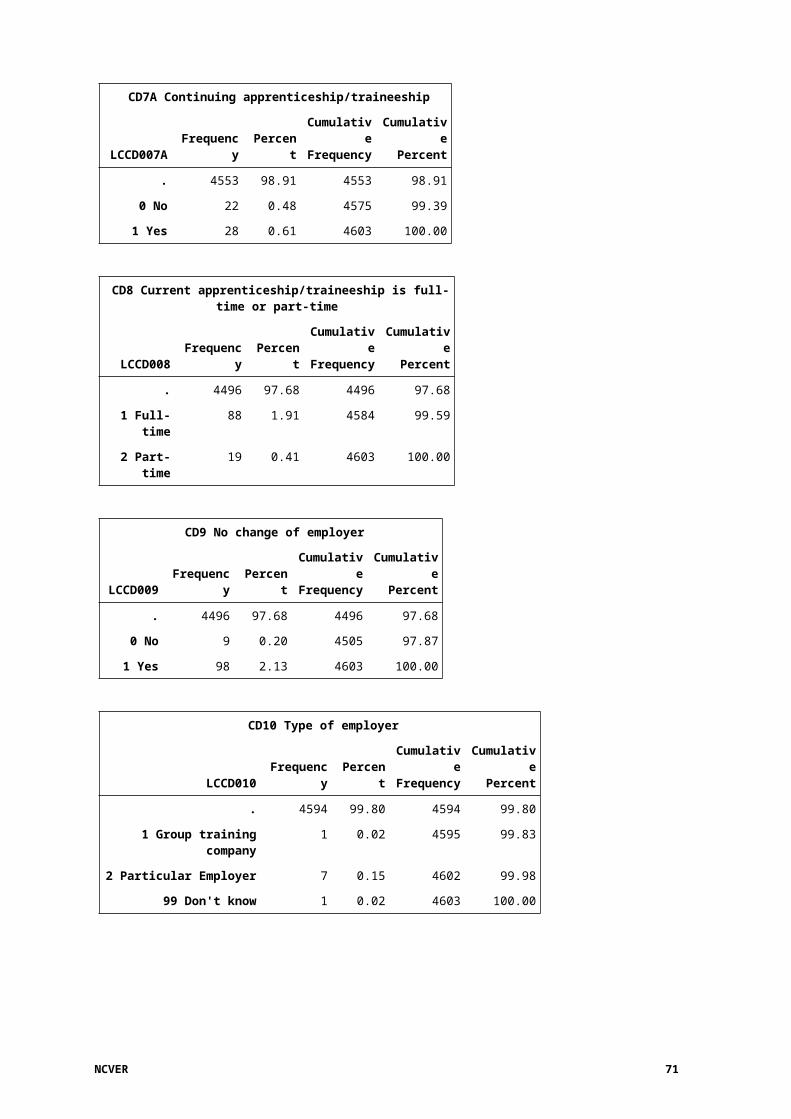
D10 What was the main reason you left that job?
LCD010 Frequency PercentCumulativeFrequency
CumulativePercent
. 4295 93.31 4295 93.31
1 Was only a school holiday job/student vacation job
10 0.22 4305 93.53
2 Job ended/temporary job/seasonal work 6 0.13 4311 93.66
3 Got laid off/sacked/retrenched 58 1.26 4369 94.92
4 Not satisfied with job 73 1.59 4442 96.50
5 Went to live somewhere else 12 0.26 4454 96.76
6 Reasons to do with study 44 0.96 4498 97.72
7 To get another job/better job 87 1.89 4585 99.61
95 Other 18 0.39 4603 100.00
D11 Hours worked
LCD011 Frequency PercentCumulativeFrequency
CumulativePercent
. 3284 71.34 3284 71.34
1 - 100 Hours 1224 26.59 4508 97.94
999 Don't know 95 2.06 4603 100.00
D11 Hours worked
N Mean Median Std Dev Minimum Maximum
1224 15.67 11.00 13.14 1.00 100.00
D12 Hours worked at main job
LCD012 Frequency PercentCumulativeFrequency
CumulativePercent
. 4386 95.29 4386 95.29
2 - 70 Hours 202 4.39 4588 99.67
999 Don't know 15 0.33 4603 100.00
D12 Hours worked at main job
N Mean Median Std Dev Minimum Maximum
202 15.87 12.00 11.69 2.00 70.00
NCVER 71
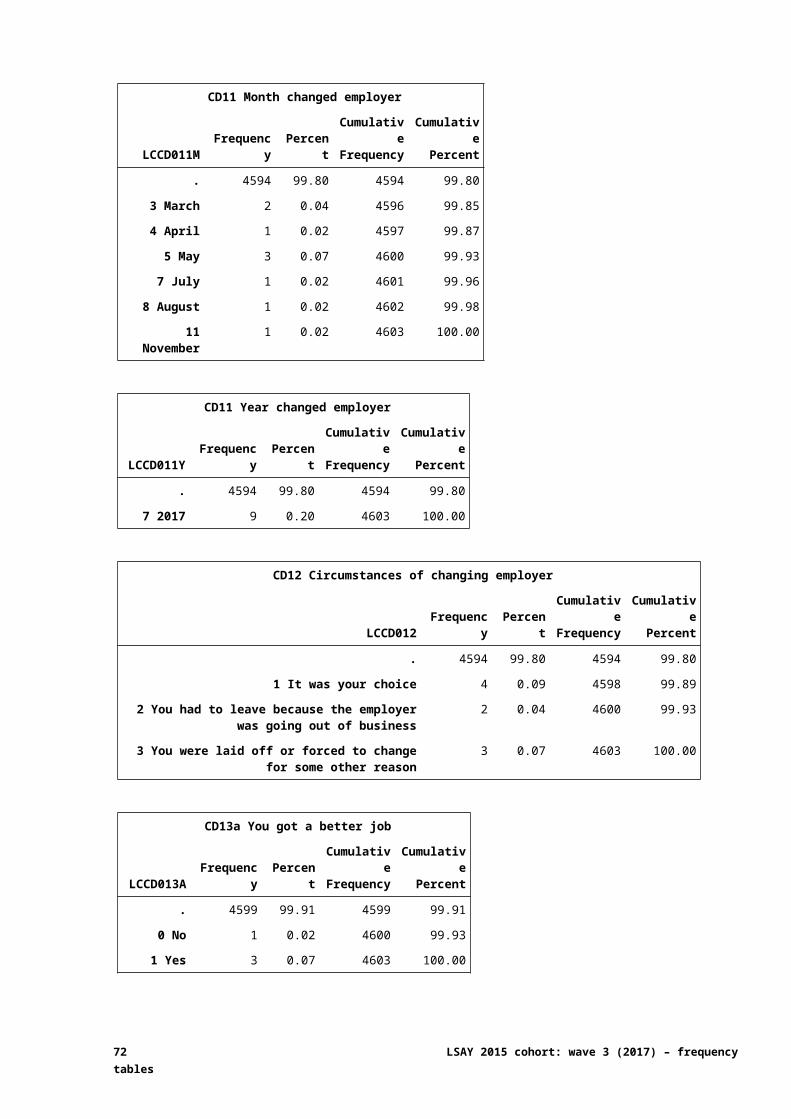
D13 Hours worked
LCD013 Frequency PercentCumulativeFrequency
CumulativePercent
. 3458 75.12 3458 75.12
1 - 60 Hours 1091 23.70 4549 98.83
999 Don't know 54 1.17 4603 100.00
D13 Hours worked
N Mean Median Std Dev Minimum Maximum
1091 11.72 9.00 9.50 1.00 60.00
D14 Wages/salary/self-employed
LCD014 Frequency PercentCumulativeFrequency
CumulativePercent
. 1922 41.76 1922 41.76
1 Wages/salary 2512 54.57 4434 96.33
2 Self-employed 72 1.56 4506 97.89
3 Other way 97 2.11 4603 100.00
D15 How much is your usual pay from that job?
LCD015 Frequency PercentCumulativeFrequency
CumulativePercent
. 1922 41.76 1922 41.76
1 Amount specified (lcd015x) 2331 50.64 4253 92.40
9999999 Don't know 350 7.60 4603 100.00
D15(x) Amount specified
LCD015X Frequency PercentCumulativeFrequency
CumulativePercent
. 2272 49.36 2272 49.36
5 to 55000 dollars 2331 50.64 4603 100.00
D15(x) Amount specified
N Mean Median Std Dev Minimum Maximum
2331 322.53 20.00 2783.92 5.00 55000.00
72 LSAY 2015 cohort: wave 3 (2017) – frequency tables
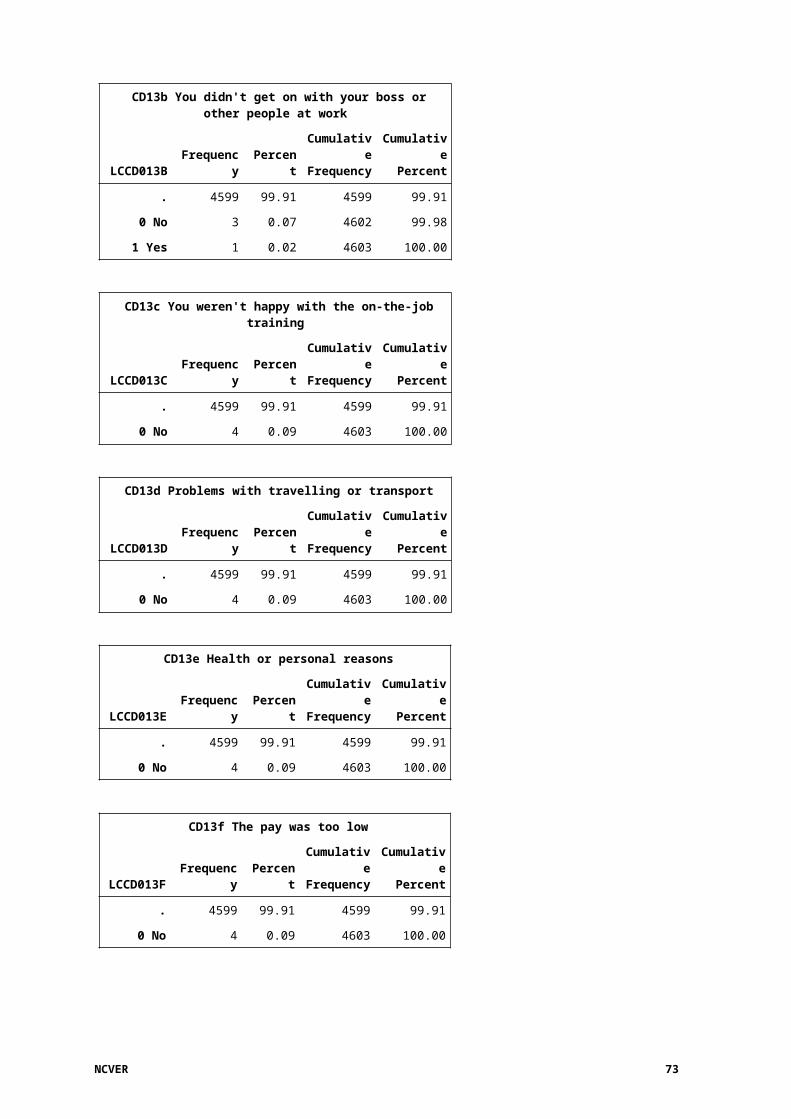
D16 What period does that cover?
LCD016 Frequency PercentCumulativeFrequency
CumulativePercent
. 2272 49.36 2272 49.36
1 Hourly 1337 29.05 3609 78.41
2 Weekly 738 16.03 4347 94.44
3 Fortnightly 174 3.78 4521 98.22
4 Four weeks 8 0.17 4529 98.39
5 Calendar month 4 0.09 4533 98.48
6 Quarterly 1 0.02 4534 98.50
7 Yearly 17 0.37 4551 98.87
8 Per occasion/task/session 30 0.65 4581 99.52
95 Other 22 0.48 4603 100.00
D17 And was that amount before tax or after tax?
LCD017 Frequency PercentCumulativeFrequency
CumulativePercent
. 2272 49.36 2272 49.36
1 Before tax 1142 24.81 3414 74.17
2 After tax 733 15.92 4147 90.09
99 Don't know 456 9.91 4603 100.00
D18 Which of these categories best describes your job?
LCD018 Frequency PercentCumulativeFrequency
CumulativePercent
. 1994 43.32 1994 43.32
1 Fixed-term 102 2.22 2096 45.54
2 Casual 2027 44.04 4123 89.57
3 Permanent or ongoing 358 7.78 4481 97.35
95 Other 97 2.11 4578 99.46
99 Don't know 25 0.54 4603 100.00
D19 Entitled to holiday/sick pay
LCD019 Frequency PercentCumulativeFrequency
CumulativePercent
. 1994 43.32 1994 43.32
0 No 1878 40.80 3872 84.12
1 Yes 533 11.58 4405 95.70
99 Don't know 198 4.30 4603 100.00
NCVER 73
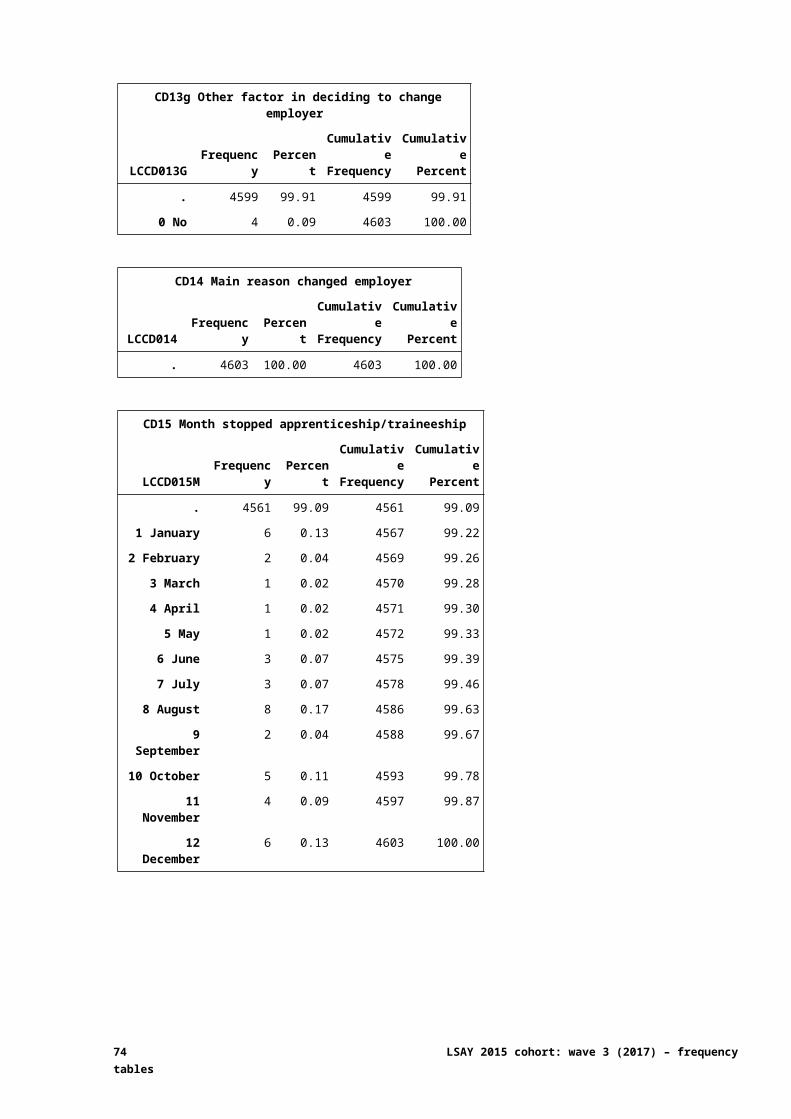
D20a The kind of work you do
LCD020A Frequency PercentCumulativeFrequency
CumulativePercent
. 3610 78.43 3610 78.43
0 13 0.28 3623 78.71
1 5 0.11 3628 78.82
2 13 0.28 3641 79.10
3 24 0.52 3665 79.62
4 46 1.00 3711 80.62
5 110 2.39 3821 83.01
6 109 2.37 3930 85.38
7 194 4.21 4124 89.59
8 221 4.80 4345 94.39
9 89 1.93 4434 96.33
10 160 3.48 4594 99.80
98 Not applicable 9 0.20 4603 100.00
D20b Opportunities to use your skills and experience
LCD020B Frequency PercentCumulativeFrequency
CumulativePercent
. 3610 78.43 3610 78.43
0 8 0.17 3618 78.60
1 21 0.46 3639 79.06
2 25 0.54 3664 79.60
3 40 0.87 3704 80.47
4 58 1.26 3762 81.73
5 115 2.50 3877 84.23
6 129 2.80 4006 87.03
7 172 3.74 4178 90.77
8 173 3.76 4351 94.53
9 89 1.93 4440 96.46
10 151 3.28 4591 99.74
98 Not applicable 12 0.26 4603 100.00
74 LSAY 2015 cohort: wave 3 (2017) – frequency tables
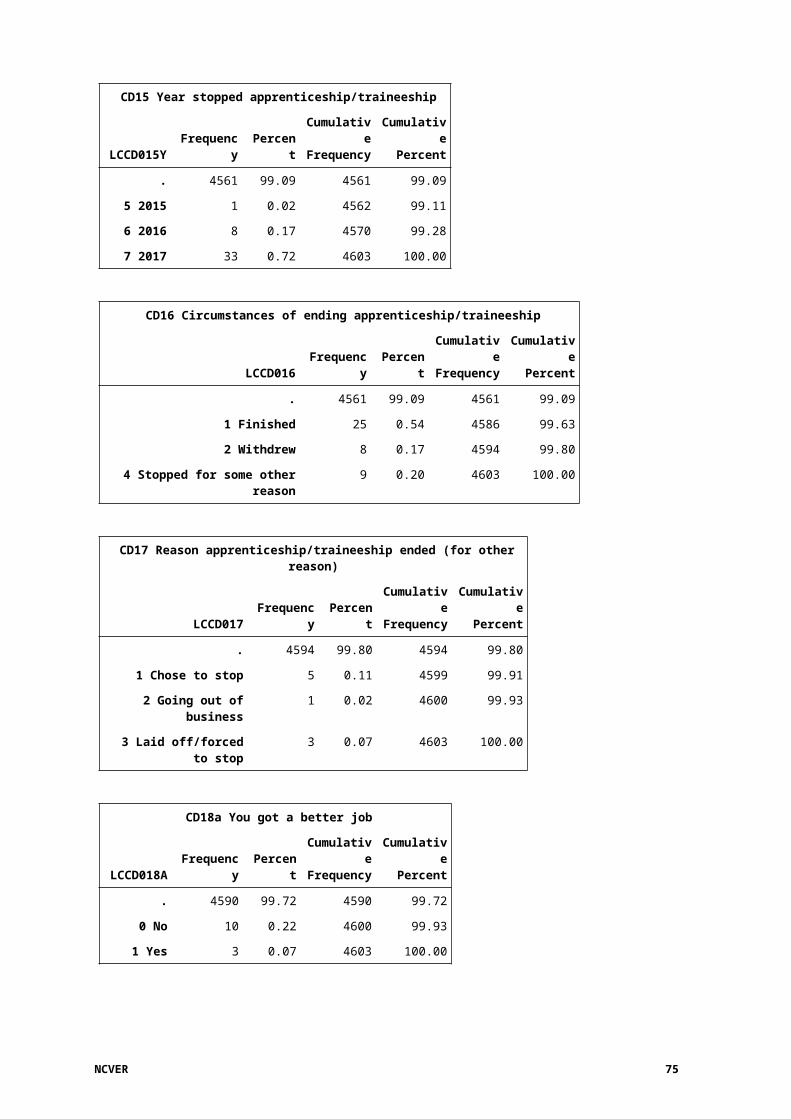
D20c Your immediate boss or supervisor
LCD020C Frequency PercentCumulativeFrequency
CumulativePercent
. 3610 78.43 3610 78.43
0 15 0.33 3625 78.75
1 16 0.35 3641 79.10
2 24 0.52 3665 79.62
3 32 0.70 3697 80.32
4 25 0.54 3722 80.86
5 82 1.78 3804 82.64
6 69 1.50 3873 84.14
7 121 2.63 3994 86.77
8 159 3.45 4153 90.22
9 140 3.04 4293 93.27
10 296 6.43 4589 99.70
98 Not applicable 14 0.30 4603 100.00
D20d Other people you work with
LCD020D Frequency PercentCumulativeFrequency
CumulativePercent
. 3610 78.43 3610 78.43
1 2 0.04 3612 78.47
2 7 0.15 3619 78.62
3 7 0.15 3626 78.77
4 16 0.35 3642 79.12
5 55 1.19 3697 80.32
6 75 1.63 3772 81.95
7 137 2.98 3909 84.92
8 247 5.37 4156 90.29
9 190 4.13 4346 94.42
10 235 5.11 4581 99.52
98 Not applicable 22 0.48 4603 100.00
NCVER 75
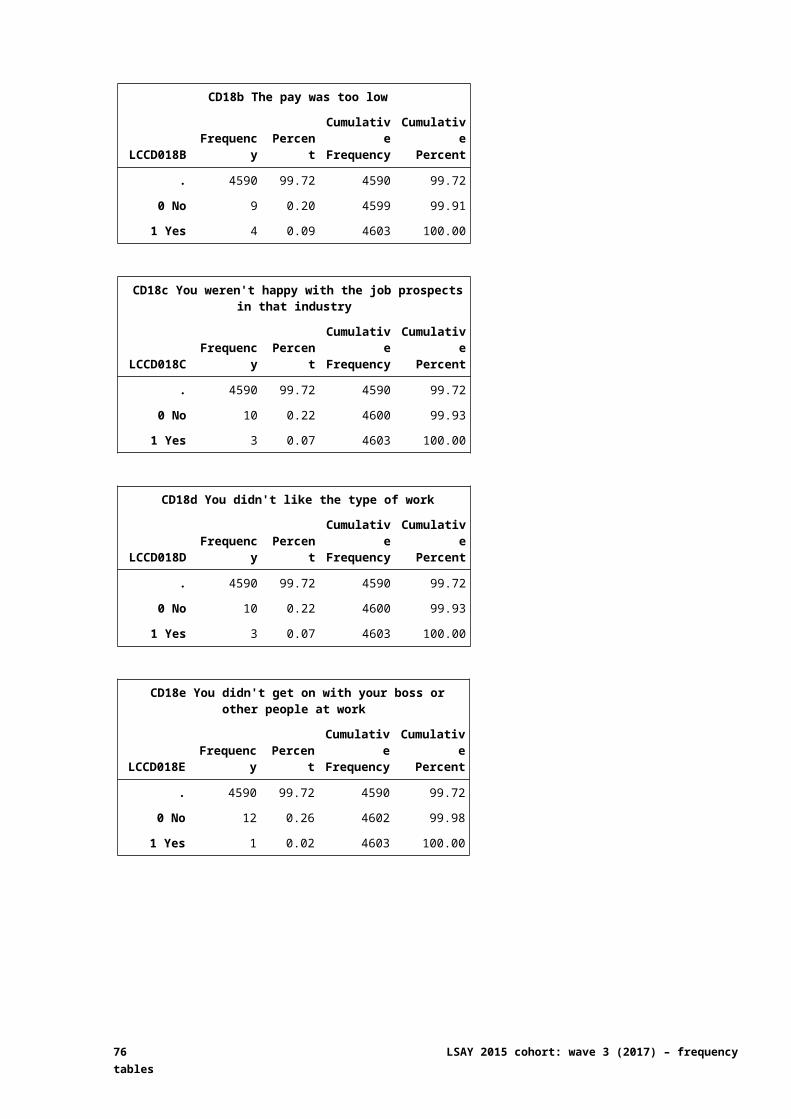
D20e The pay you get
LCD020E Frequency PercentCumulativeFrequency
CumulativePercent
. 3610 78.43 3610 78.43
0 17 0.37 3627 78.80
1 14 0.30 3641 79.10
2 27 0.59 3668 79.69
3 35 0.76 3703 80.45
4 51 1.11 3754 81.56
5 90 1.96 3844 83.51
6 115 2.50 3959 86.01
7 183 3.98 4142 89.98
8 157 3.41 4299 93.40
9 114 2.48 4413 95.87
10 173 3.76 4586 99.63
98 Not applicable 17 0.37 4603 100.00
D20f Opportunities for training
LCD020F Frequency PercentCumulativeFrequency
CumulativePercent
. 3610 78.43 3610 78.43
0 33 0.72 3643 79.14
1 15 0.33 3658 79.47
2 39 0.85 3697 80.32
3 72 1.56 3769 81.88
4 60 1.30 3829 83.18
5 119 2.59 3948 85.77
6 114 2.48 4062 88.25
7 116 2.52 4178 90.77
8 151 3.28 4329 94.05
9 71 1.54 4400 95.59
10 165 3.58 4565 99.17
98 Not applicable 38 0.83 4603 100.00
76 LSAY 2015 cohort: wave 3 (2017) – frequency tables
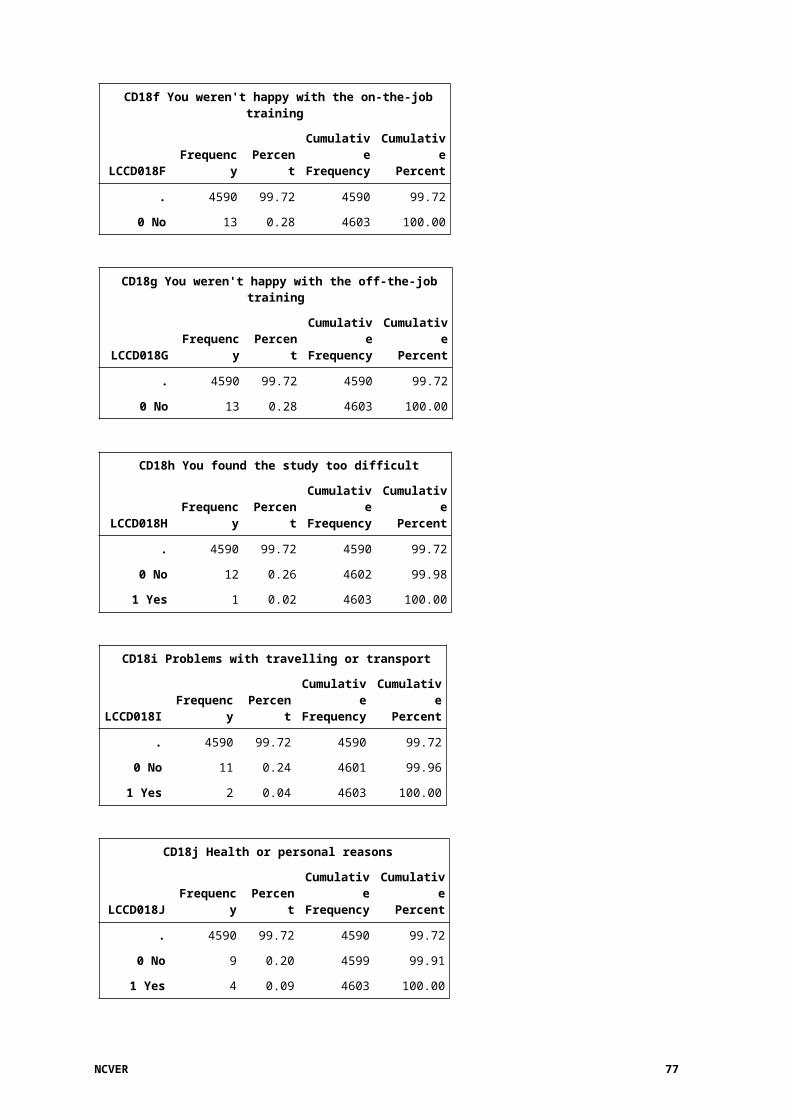
D20g Recognition you get for tasks well done
LCD020G Frequency PercentCumulativeFrequency
CumulativePercent
. 3610 78.43 3610 78.43
0 31 0.67 3641 79.10
1 14 0.30 3655 79.40
2 30 0.65 3685 80.06
3 65 1.41 3750 81.47
4 63 1.37 3813 82.84
5 103 2.24 3916 85.07
6 96 2.09 4012 87.16
7 152 3.30 4164 90.46
8 160 3.48 4324 93.94
9 87 1.89 4411 95.83
10 164 3.56 4575 99.39
98 Not applicable 28 0.61 4603 100.00
D20h Your opportunities for promotion
LCD020H Frequency PercentCumulativeFrequency
CumulativePercent
. 3610 78.43 3610 78.43
0 58 1.26 3668 79.69
1 30 0.65 3698 80.34
2 45 0.98 3743 81.32
3 83 1.80 3826 83.12
4 77 1.67 3903 84.79
5 144 3.13 4047 87.92
6 85 1.85 4132 89.77
7 98 2.13 4230 91.90
8 99 2.15 4329 94.05
9 34 0.74 4363 94.79
10 105 2.28 4468 97.07
98 Not applicable 135 2.93 4603 100.00
NCVER 77
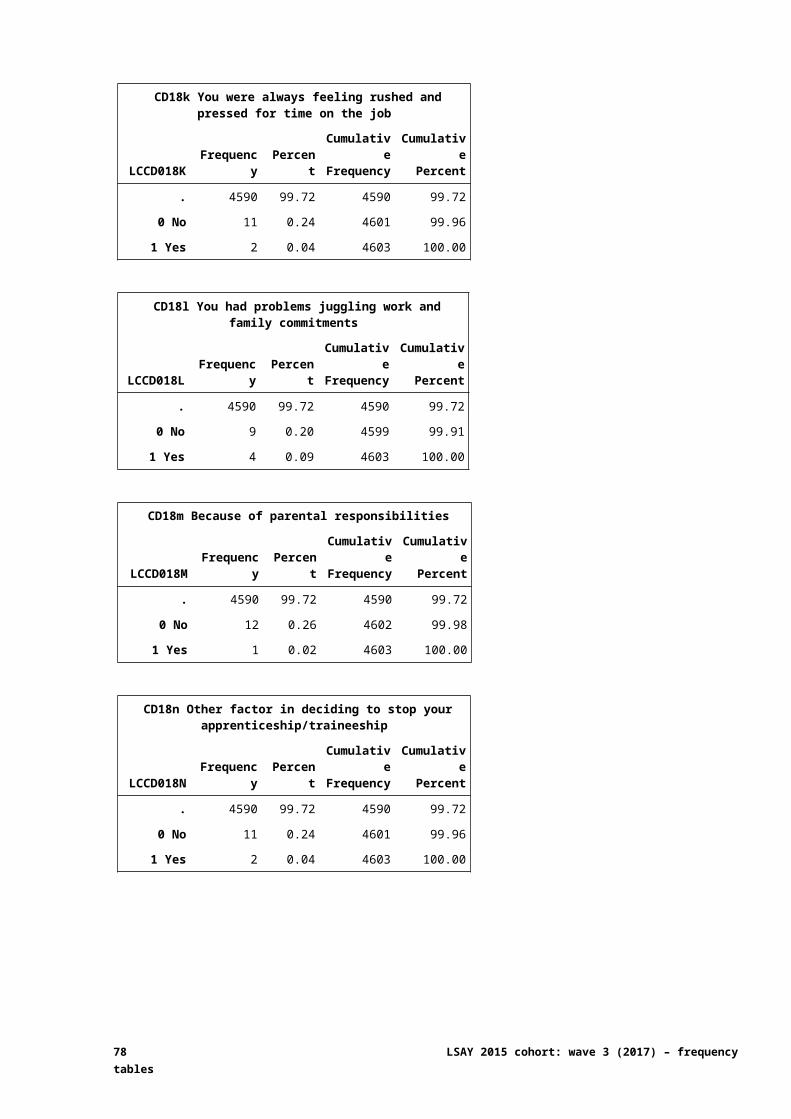
D20i The flexibility you have to balance work and non-work commitments
LCD020I Frequency PercentCumulativeFrequency
CumulativePercent
. 3610 78.43 3610 78.43
0 8 0.17 3618 78.60
1 4 0.09 3622 78.69
2 25 0.54 3647 79.23
3 23 0.50 3670 79.73
4 35 0.76 3705 80.49
5 82 1.78 3787 82.27
6 73 1.59 3860 83.86
7 142 3.08 4002 86.94
8 187 4.06 4189 91.01
9 128 2.78 4317 93.79
10 267 5.80 4584 99.59
98 Not applicable 19 0.41 4603 100.00
D21 How do you feel about your job overall?
LCD021 Frequency PercentCumulativeFrequency
CumulativePercent
. 3441 74.76 3441 74.76
0 4 0.09 3445 74.84
1 7 0.15 3452 74.99
2 28 0.61 3480 75.60
3 18 0.39 3498 75.99
4 41 0.89 3539 76.88
5 93 2.02 3632 78.91
6 135 2.93 3767 81.84
7 216 4.69 3983 86.53
8 253 5.50 4236 92.03
9 165 3.58 4401 95.61
10 202 4.39 4603 100.00
D22 ANZSCO code (first edition)
LCD022 Frequency PercentCumulativeFrequency
CumulativePercent
. 1922 41.76 1922 41.76
0 Don't know 5 0.11 1927 41.86
1200 - 8999 ANZSCO 4 digit code 2653 57.64 4580 99.50
9000 Inadequate description 23 0.50 4603 100.00
78 LSAY 2015 cohort: wave 3 (2017) – frequency tables
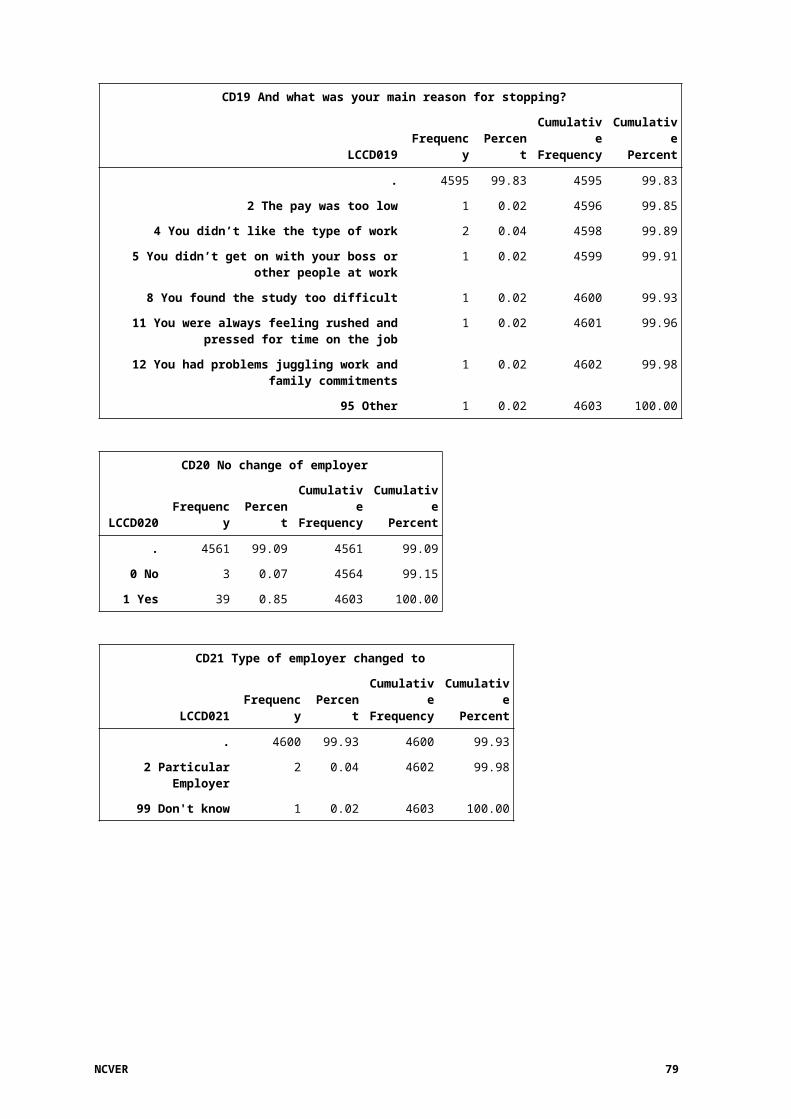
D24 ANZSIC code (2006 revision)
LCD024 Frequency PercentCumulativeFrequency
CumulativePercent
. 3067 66.63 3067 66.63
10 - 967 ANZSIC code 1528 33.20 4595 99.83
999 Unclassifiable/Don't know 8 0.17 4603 100.00
D25 Month began job
LCD025M Frequency PercentCumulativeFrequency
CumulativePercent
. 3067 66.63 3067 66.63
1 January 139 3.02 3206 69.65
2 February 132 2.87 3338 72.52
3 March 118 2.56 3456 75.08
4 April 98 2.13 3554 77.21
5 May 97 2.11 3651 79.32
6 June 95 2.06 3746 81.38
7 July 111 2.41 3857 83.79
8 August 127 2.76 3984 86.55
9 September 131 2.85 4115 89.40
10 October 113 2.45 4228 91.85
11 November 165 3.58 4393 95.44
12 December 122 2.65 4515 98.09
88 Month unknown 88 1.91 4603 100.00
D25 Year began job
LCD025Y Frequency PercentCumulativeFrequency
CumulativePercent
. 3067 66.63 3067 66.63
5 2015 250 5.43 3317 72.06
6 2016 393 8.54 3710 80.60
7 2017 817 17.75 4527 98.35
88 Year unknown 76 1.65 4603 100.00
NCVER 79
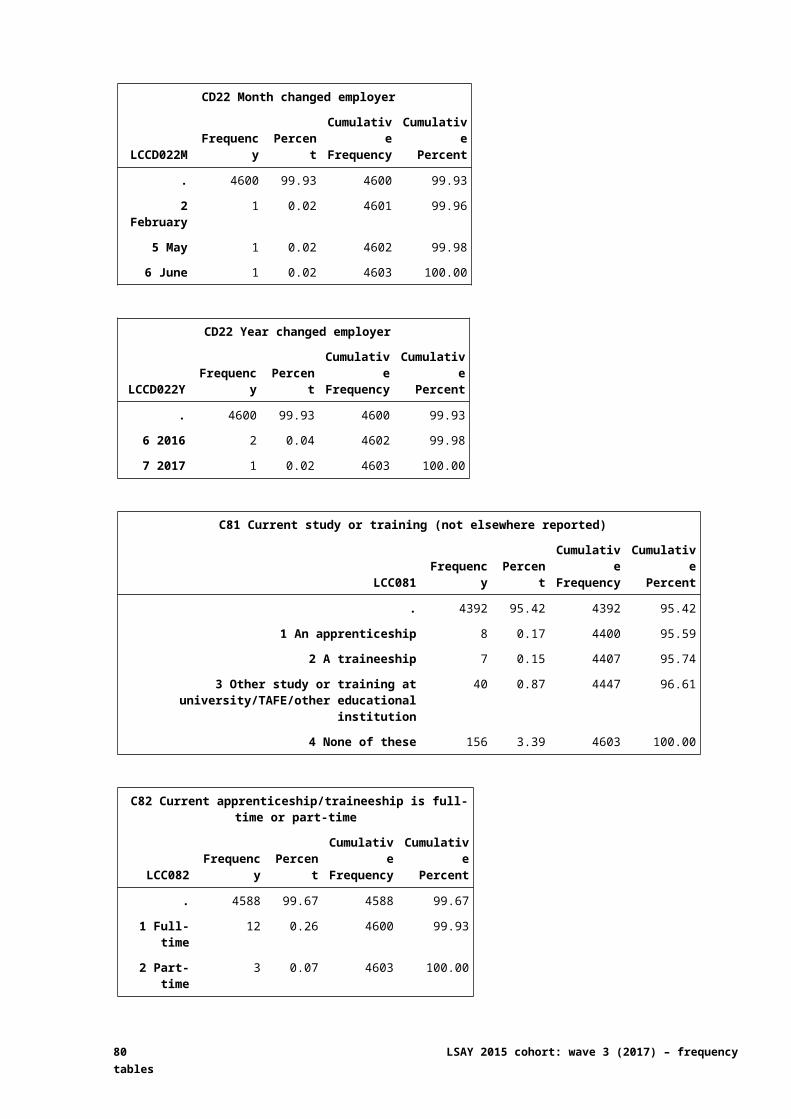
D26 How did you get this job?
LCD026 Frequency PercentCumulativeFrequency
CumulativePercent
. 3107 67.50 3107 67.50
1 Through Centrelink as a registered jobseeker 6 0.13 3113 67.63
2 Through an employment agency 22 0.48 3135 68.11
3 Job was advertised in a newspaper/on noticeboards
69 1.50 3204 69.61
4 Job was advertised on the internet 311 6.76 3515 76.36
5 Through a friend or relative 556 12.08 4071 88.44
6 Employer approached me 80 1.74 4151 90.18
7 Wrote to/phoned/approached employer to ask if any jobs available
264 5.74 4415 95.92
8 Advertised or tendered for work, including on the internet
22 0.48 4437 96.39
9 Through school / work experience 75 1.63 4512 98.02
95 Other 91 1.98 4603 100.00
D27 Weekly hours worked
LCD027 Frequency PercentCumulativeFrequency
CumulativePercent
. 4184 90.90 4184 90.90
2 - 85 Hours 371 8.06 4555 98.96
999 Don't know 48 1.04 4603 100.00
D27 Weekly hours worked
N Mean Median Std Dev Minimum Maximum
371 19.70 16.00 13.01 2.00 85.00
D28 Prefer different work hours
LCD028 Frequency PercentCumulativeFrequency
CumulativePercent
. 2254 48.97 2254 48.97
1 More hours 763 16.58 3017 65.54
2 Less hours 93 2.02 3110 67.56
3 Happy with current hours 1493 32.44 4603 100.00
80 LSAY 2015 cohort: wave 3 (2017) – frequency tables
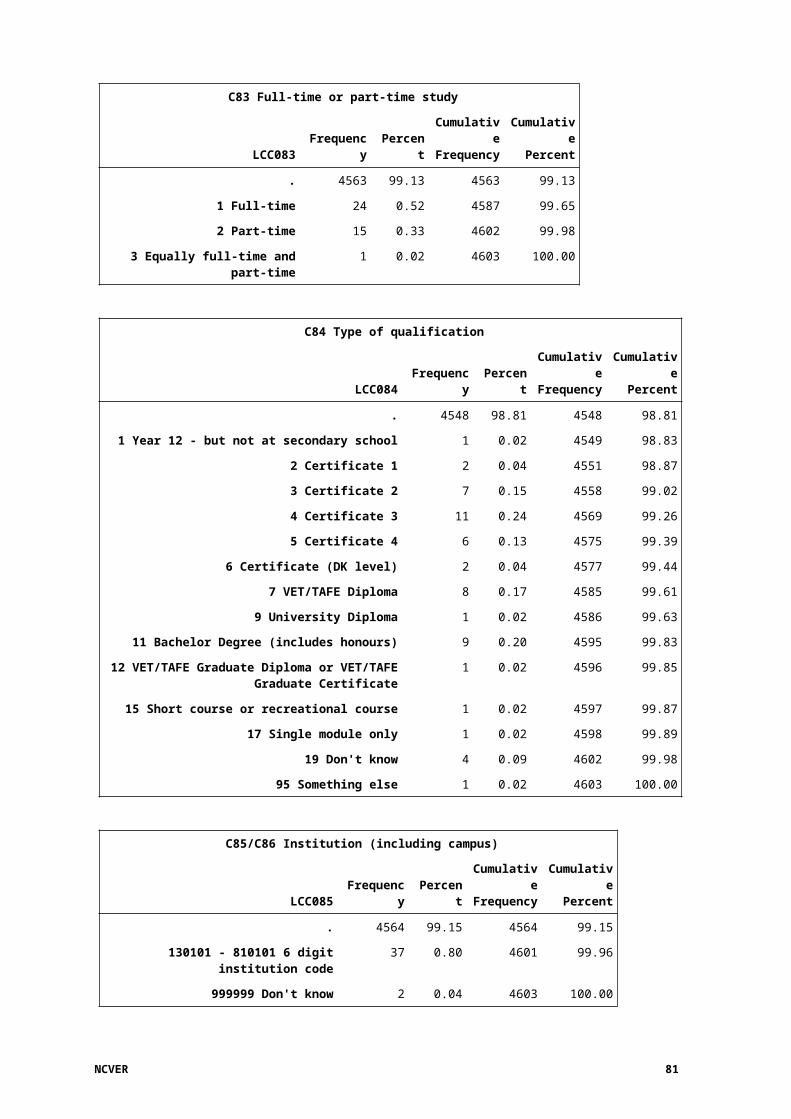
D29 Preferred weekly hours
LCD029 Frequency PercentCumulativeFrequency
CumulativePercent
. 3747 81.40 3747 81.40
2 - 60 Hours 800 17.38 4547 98.78
999 Don't know 56 1.22 4603 100.00
D29 Preferred weekly hours
N Mean Median Std Dev Minimum Maximum
800 19.04 16.00 10.70 2.00 60.00
D30 Are you looking for work at all at the moment - either an extra job or a new job?
LCD030 Frequency PercentCumulativeFrequency
CumulativePercent
. 1922 41.76 1922 41.76
0 No 1741 37.82 3663 79.58
1 Yes 940 20.42 4603 100.00
D31 Are you looking for an extra job, or do you want to change jobs?
LCD031 Frequency PercentCumulativeFrequency
CumulativePercent
. 3663 79.58 3663 79.58
1 Additional job 450 9.78 4113 89.35
2 Change jobs 490 10.65 4603 100.00
D32 Number of (other) jobs since last interview
LCD032 Frequency PercentCumulativeFrequency
CumulativePercent
0 - 8 Jobs 4502 97.81 4502 97.81
99 Don't know 101 2.19 4603 100.00
D33a No employment since last interview
LCD033A Frequency PercentCumulativeFrequency
CumulativePercent
. 1513 32.87 1513 32.87
0 Not applicable 3059 66.46 4572 99.33
1 Applicable 31 0.67 4603 100.00
NCVER 81
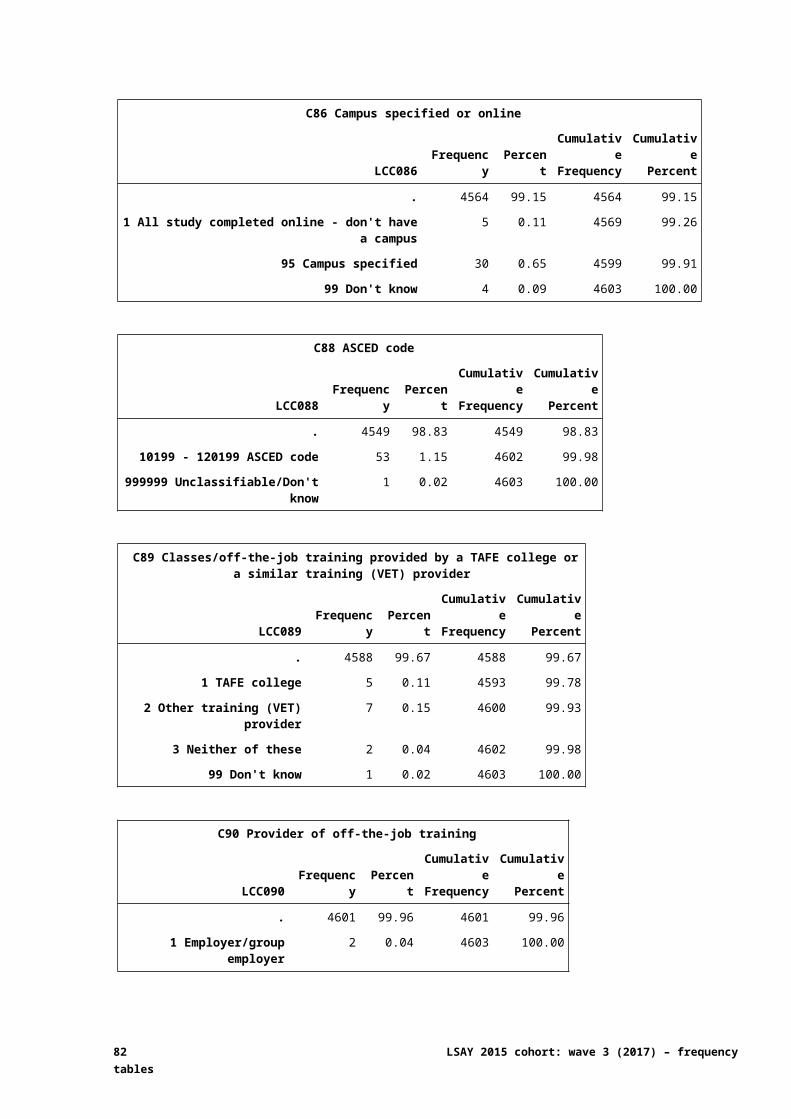
D33b Employment in July 2016
LCD033B Frequency PercentCumulativeFrequency
CumulativePercent
. 1513 32.87 1513 32.87
0 Not applicable 3090 67.13 4603 100.00
D33c Employment in August 2016
LCD033C Frequency PercentCumulativeFrequency
CumulativePercent
. 1513 32.87 1513 32.87
0 Not applicable 3090 67.13 4603 100.00
D33d Employment in September 2016
LCD033D Frequency PercentCumulativeFrequency
CumulativePercent
. 1513 32.87 1513 32.87
0 Not applicable 3017 65.54 4530 98.41
1 Applicable 73 1.59 4603 100.00
D33e Employment in October 2016
LCD033E Frequency PercentCumulativeFrequency
CumulativePercent
. 1513 32.87 1513 32.87
0 Not applicable 1758 38.19 3271 71.06
1 Applicable 1332 28.94 4603 100.00
D33f Employment in November 2016
LCD033F Frequency PercentCumulativeFrequency
CumulativePercent
. 1513 32.87 1513 32.87
0 Not applicable 1278 27.76 2791 60.63
1 Applicable 1812 39.37 4603 100.00
D33g Employment in December 2016
LCD033G Frequency PercentCumulativeFrequency
CumulativePercent
. 1513 32.87 1513 32.87
0 Not applicable 968 21.03 2481 53.90
1 Applicable 2122 46.10 4603 100.00
82 LSAY 2015 cohort: wave 3 (2017) – frequency tables
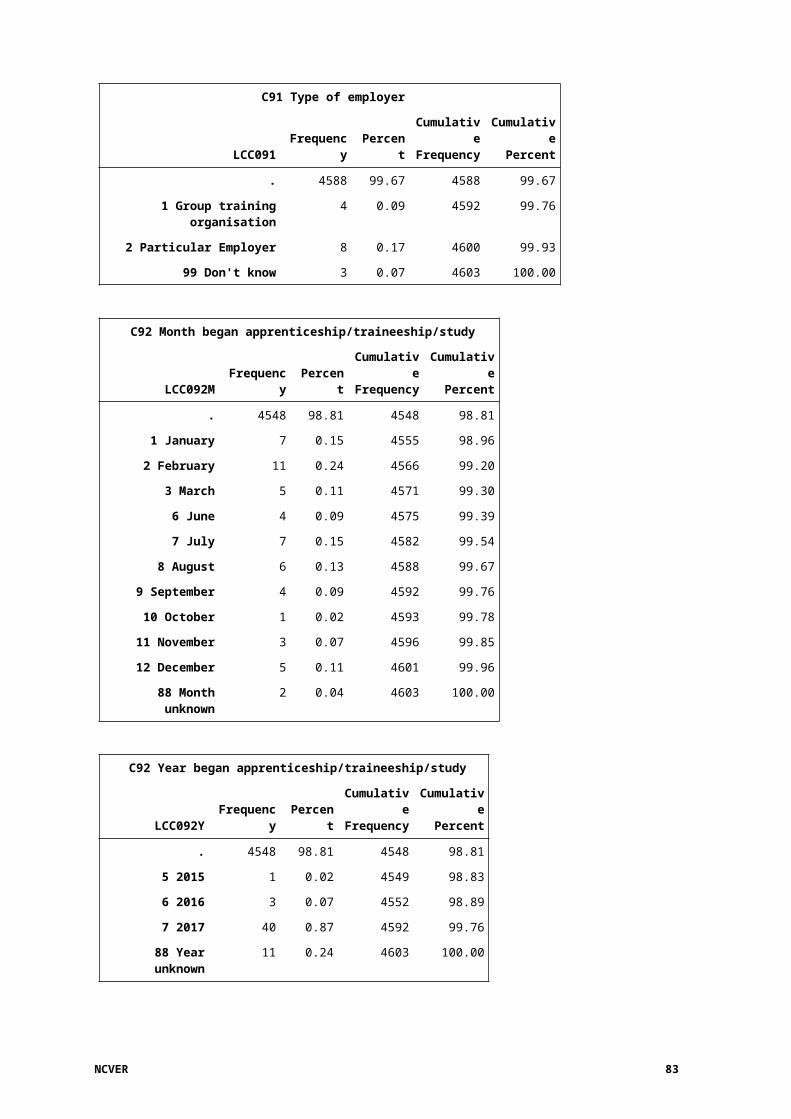
D33h Employment in January 2017
LCD033H Frequency PercentCumulativeFrequency
CumulativePercent
. 1513 32.87 1513 32.87
0 Not applicable 793 17.23 2306 50.10
1 Applicable 2297 49.90 4603 100.00
D33i Employment in February 2017
LCD033I Frequency PercentCumulativeFrequency
CumulativePercent
. 1513 32.87 1513 32.87
0 Not applicable 775 16.84 2288 49.71
1 Applicable 2315 50.29 4603 100.00
D33j Employment in March 2017
LCD033J Frequency PercentCumulativeFrequency
CumulativePercent
. 1513 32.87 1513 32.87
0 Not applicable 727 15.79 2240 48.66
1 Applicable 2363 51.34 4603 100.00
D33k Employment in April 2017
LCD033K Frequency PercentCumulativeFrequency
CumulativePercent
. 1513 32.87 1513 32.87
0 Not applicable 691 15.01 2204 47.88
1 Applicable 2399 52.12 4603 100.00
D33L Employment in May 2017
LCD033L Frequency PercentCumulativeFrequency
CumulativePercent
. 1513 32.87 1513 32.87
0 Not applicable 706 15.34 2219 48.21
1 Applicable 2384 51.79 4603 100.00
D33m Employment in June 2017
LCD033M Frequency PercentCumulativeFrequency
CumulativePercent
. 1513 32.87 1513 32.87
0 Not applicable 672 14.60 2185 47.47
1 Applicable 2418 52.53 4603 100.00
NCVER 83
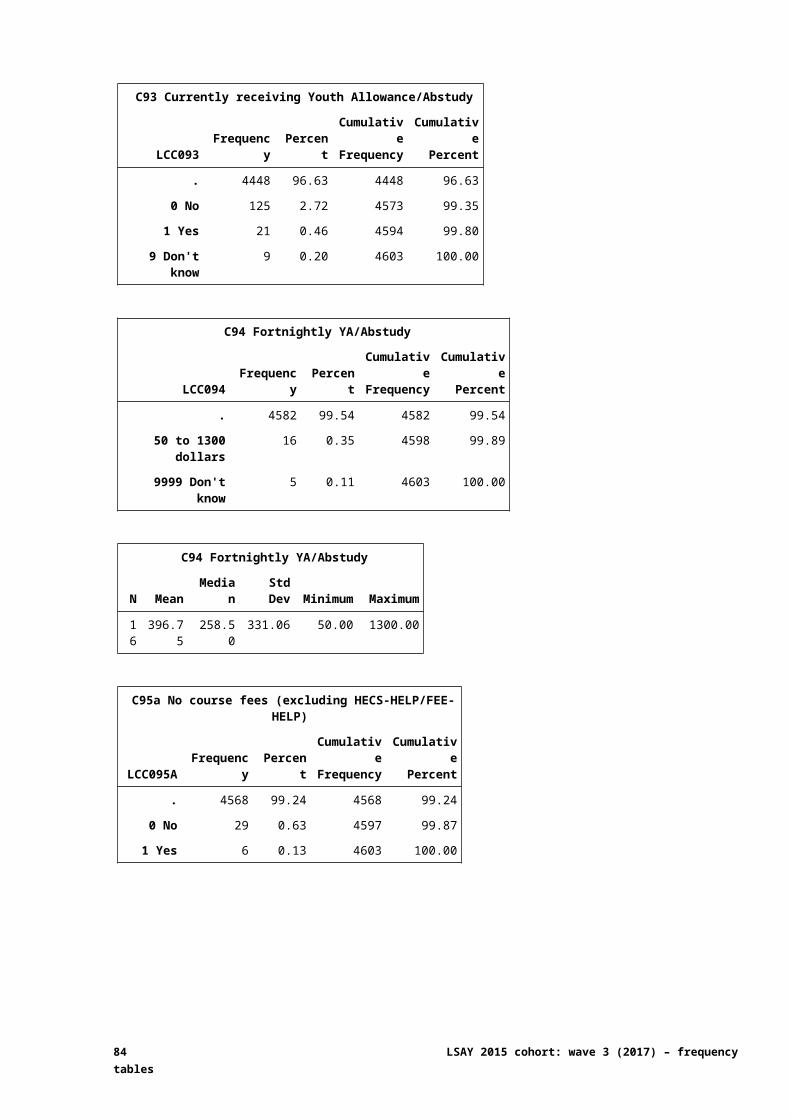
D33n Employment in July 2017
LCD033N Frequency PercentCumulativeFrequency
CumulativePercent
. 1513 32.87 1513 32.87
0 Not applicable 640 13.90 2153 46.77
1 Applicable 2450 53.23 4603 100.00
D33o Employment in August 2017
LCD033O Frequency PercentCumulativeFrequency
CumulativePercent
. 1513 32.87 1513 32.87
0 Not applicable 651 14.14 2164 47.01
1 Applicable 2439 52.99 4603 100.00
D33p Employment in September 2017
LCD033P Frequency PercentCumulativeFrequency
CumulativePercent
. 1513 32.87 1513 32.87
0 Not applicable 857 18.62 2370 51.49
1 Applicable 2233 48.51 4603 100.00
D33q Employment in October 2017
LCD033Q Frequency PercentCumulativeFrequency
CumulativePercent
. 1513 32.87 1513 32.87
0 Not applicable 2324 50.49 3837 83.36
1 Applicable 766 16.64 4603 100.00
D33r Employment in November 2017
LCD033R Frequency PercentCumulativeFrequency
CumulativePercent
. 1513 32.87 1513 32.87
0 Not applicable 2456 53.36 3969 86.23
1 Applicable 634 13.77 4603 100.00
D33s Employment in December 2017
LCD033S Frequency PercentCumulativeFrequency
CumulativePercent
. 1513 32.87 1513 32.87
0 Not applicable 2597 56.42 4110 89.29
1 Applicable 493 10.71 4603 100.00
84 LSAY 2015 cohort: wave 3 (2017) – frequency tables

D33t Employment in January 2018
LCD033T Frequency PercentCumulativeFrequency
CumulativePercent
. 1513 32.87 1513 32.87
0 Not applicable 2931 63.68 4444 96.55
1 Applicable 159 3.45 4603 100.00
D33u Employment every month up to present month
LCD033U Frequency PercentCumulativeFrequency
CumulativePercent
. 1513 32.87 1513 32.87
0 Not applicable 1413 30.70 2926 63.57
1 Applicable 1677 36.43 4603 100.00
D33x Employment in February 2018
LCD033X Frequency PercentCumulativeFrequency
CumulativePercent
. 1513 32.87 1513 32.87
0 Not applicable 3036 65.96 4549 98.83
1 Applicable 54 1.17 4603 100.00
NCVER 85
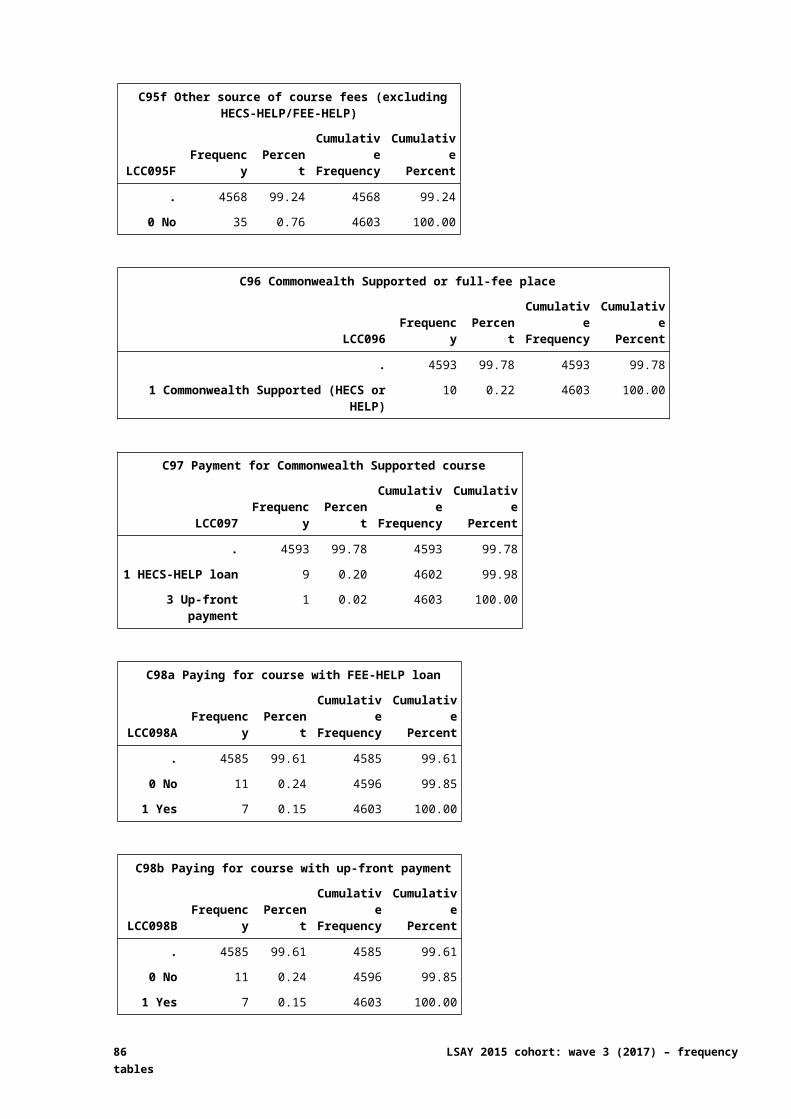
Section E: Job history E2/E3/E4 ANZSCO code (first edition)
LCE002X Frequency PercentCumulativeFrequency
CumulativePercent
. 3376 73.34 3376 73.34
0 Don't know 17 0.37 3393 73.71
1000-8999 ANZSCO 4 digit code 1186 25.77 4579 99.48
9000 Inadequate description (self employed NFI) 24 0.52 4603 100.00
E5 ANZSIC code (2006 revision)
LCE005 Frequency PercentCumulativeFrequency
CumulativePercent
. 3376 73.34 3376 73.34
10-977 ANZSIC code 1174 25.51 4550 98.85
999 Unclassifiable/Don't know 53 1.15 4603 100.00
E6 Hours worked per week
LCE006 Frequency PercentCumulativeFrequency
CumulativePercent
. 3376 73.34 3376 73.34
1 - 63 Hours 1074 23.33 4450 96.68
999 Don't know 153 3.32 4603 100.00
E6 Hours worked per week
N Mean Median Std Dev Minimum Maximum
1074 12.27 8.00 11.29 1.00 63.00
E6a Re-definition of second job as main job
LCE006A Frequency PercentCumulativeFrequency
CumulativePercent
. 4531 98.44 4531 98.44
1 Yes - redefine second 2nd job as main job 48 1.04 4579 99.48
2 No - hours vary between the 2 jobs 9 0.20 4588 99.67
3 No - just more hours at this point 15 0.33 4603 100.00
86 LSAY 2015 cohort: wave 3 (2017) – frequency tables
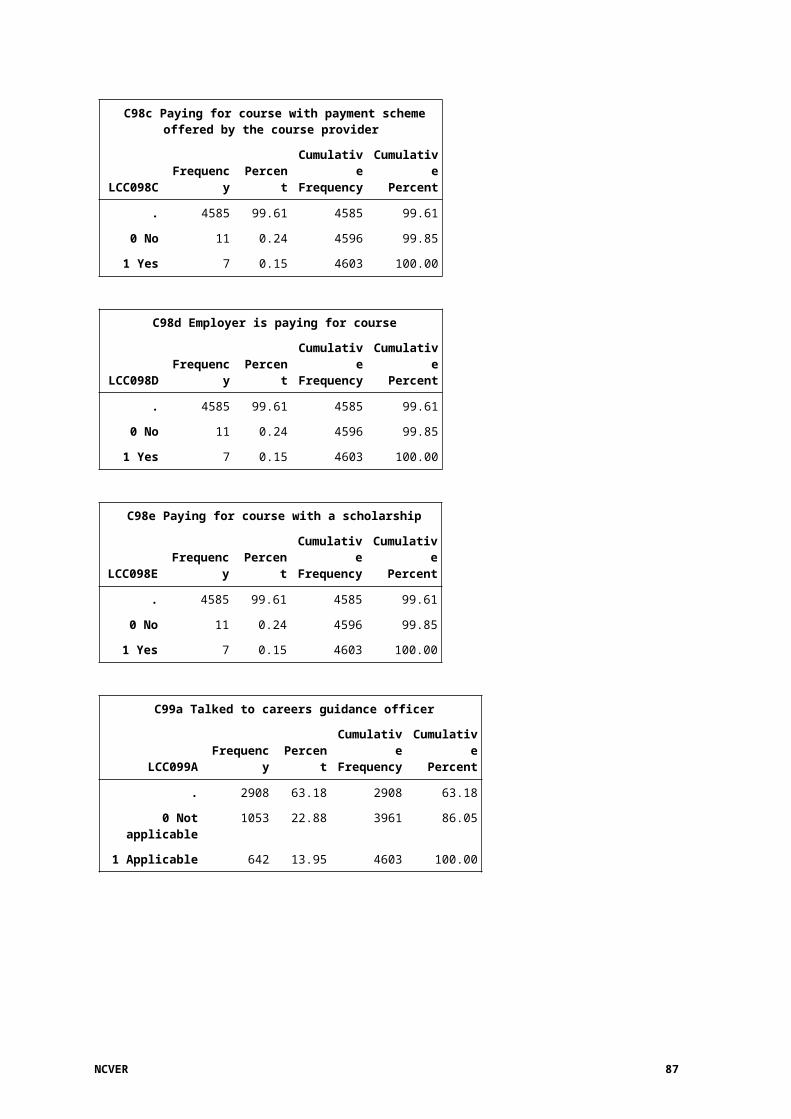
E8 Wages/Salary/Self-employed
LCE008 Frequency PercentCumulativeFrequency
CumulativePercent
. 3376 73.34 3376 73.34
1 Wages/salary 1036 22.51 4412 95.85
2 Own business 51 1.11 4463 96.96
3 Other way 77 1.67 4540 98.63
99 Don't know 63 1.37 4603 100.00
E9 How much is/was your usual pay from that job?
LCE009 Frequency PercentCumulativeFrequency
CumulativePercent
. 3376 73.34 3376 73.34
1 Amount specified (lce009x) 963 20.92 4339 94.26
9999999 Don't know 264 5.74 4603 100.00
E9(x) Amount specified
LCE009X Frequency PercentCumulativeFrequency
CumulativePercent
. 3640 79.08 3640 79.08
1 to 3000 dollars 963 20.92 4603 100.00
E9(x) Amount specified
N Mean Median Std Dev Minimum Maximum
963 109.23 20.00 224.71 1.00 3000.00
E10 What period did/does that cover?
LCE010 Frequency PercentCumulativeFrequency
CumulativePercent
. 3640 79.08 3640 79.08
1 Hourly 577 12.54 4217 91.61
2 Weekly 244 5.30 4461 96.92
3 Fortnightly 59 1.28 4520 98.20
4 Four weeks 2 0.04 4522 98.24
5 Calendar month 5 0.11 4527 98.35
6 Quarterly 1 0.02 4528 98.37
7 Yearly 5 0.11 4533 98.48
8 Per occasion/task/session 41 0.89 4574 99.37
95 Other 29 0.63 4603 100.00
NCVER 87
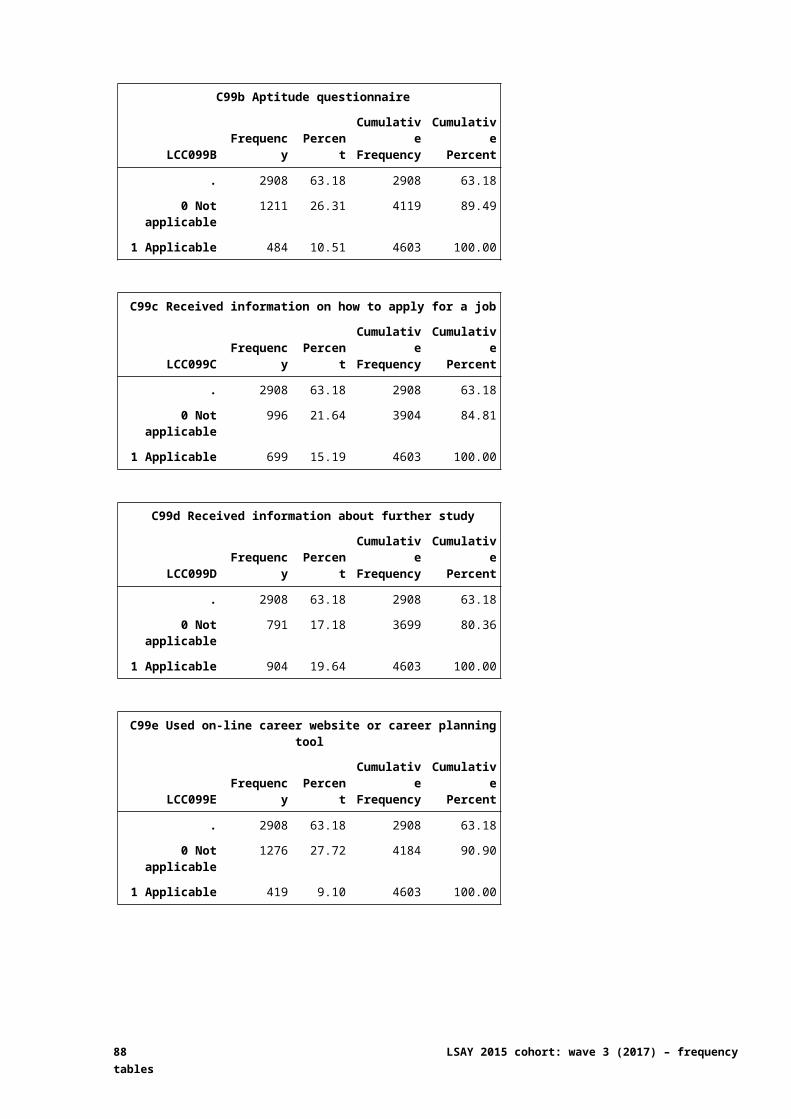
E11 And was that amount before tax or after tax?
LCE011 Frequency PercentCumulativeFrequency
CumulativePercent
. 3640 79.08 3640 79.08
1 Before tax 467 10.15 4107 89.22
2 After tax 289 6.28 4396 95.50
99 Don't know 207 4.50 4603 100.00
88 LSAY 2015 cohort: wave 3 (2017) – frequency tables
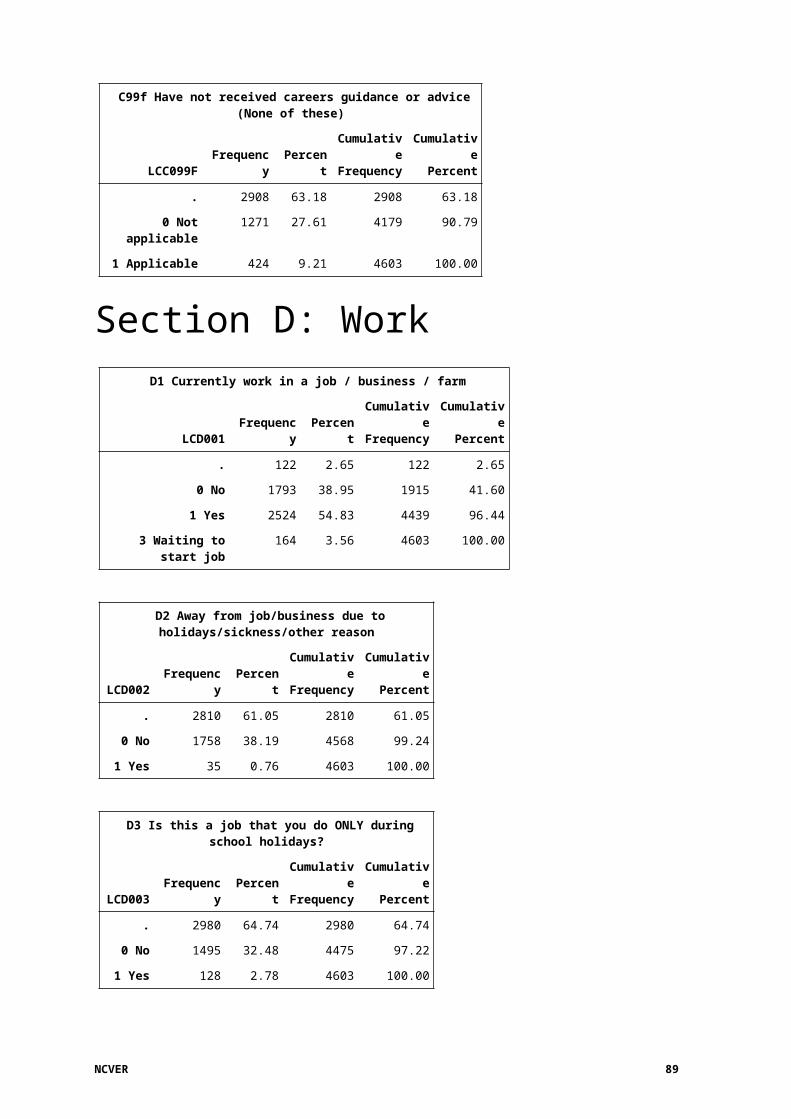
Section F: Job search activity F1 Looked for work since last interview / since October
1 2016
LCF001 Frequency PercentCumulativeFrequency
CumulativePercent
. 940 20.42 940 20.42
0 No 2157 46.86 3097 67.28
1 Yes 1506 32.72 4603 100.00
F2a Months looked for work - July 2016
LCF002A Frequency PercentCumulativeFrequency
CumulativePercent
. 2157 46.86 2157 46.86
0 Not applicable 2446 53.14 4603 100.00
F2b Months looked for work - August 2016
LCF002B Frequency PercentCumulativeFrequency
CumulativePercent
. 2157 46.86 2157 46.86
0 Not applicable 2446 53.14 4603 100.00
F2c Months looked for work - September 2016
LCF002C Frequency PercentCumulativeFrequency
CumulativePercent
. 2157 46.86 2157 46.86
0 Not applicable 2432 52.84 4589 99.70
1 Applicable 14 0.30 4603 100.00
F2d Months looked for work - October 2016
LCF002D Frequency PercentCumulativeFrequency
CumulativePercent
. 2157 46.86 2157 46.86
0 Not applicable 2024 43.97 4181 90.83
1 Applicable 422 9.17 4603 100.00
NCVER 89
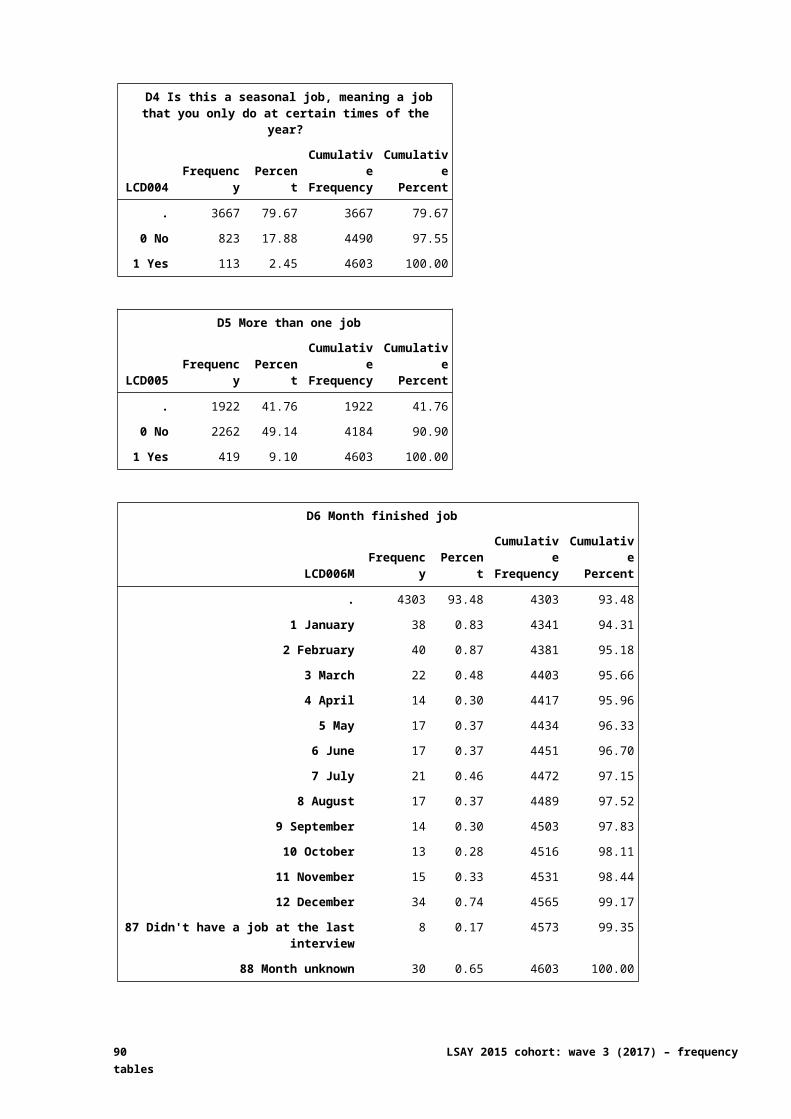
F2e Months looked for work - November 2016
LCF002E Frequency PercentCumulativeFrequency
CumulativePercent
. 2157 46.86 2157 46.86
0 Not applicable 1850 40.19 4007 87.05
1 Applicable 596 12.95 4603 100.00
F2f Months looked for work - December 2016
LCF002F Frequency PercentCumulativeFrequency
CumulativePercent
. 2157 46.86 2157 46.86
0 Not applicable 1685 36.61 3842 83.47
1 Applicable 761 16.53 4603 100.00
F2g Months looked for work - January 2017
LCF002G Frequency PercentCumulativeFrequency
CumulativePercent
. 2157 46.86 2157 46.86
0 Not applicable 1536 33.37 3693 80.23
1 Applicable 910 19.77 4603 100.00
F2h Months looked for work - February 2017
LCF002H Frequency PercentCumulativeFrequency
CumulativePercent
. 2157 46.86 2157 46.86
0 Not applicable 1615 35.09 3772 81.95
1 Applicable 831 18.05 4603 100.00
F2i Months looked for work - March 2017
LCF002I Frequency PercentCumulativeFrequency
CumulativePercent
. 2157 46.86 2157 46.86
0 Not applicable 1645 35.74 3802 82.60
1 Applicable 801 17.40 4603 100.00
F2j Months looked for work - April 2017
LCF002J Frequency PercentCumulativeFrequency
CumulativePercent
. 2157 46.86 2157 46.86
0 Not applicable 1629 35.39 3786 82.25
1 Applicable 817 17.75 4603 100.00
90 LSAY 2015 cohort: wave 3 (2017) – frequency tables
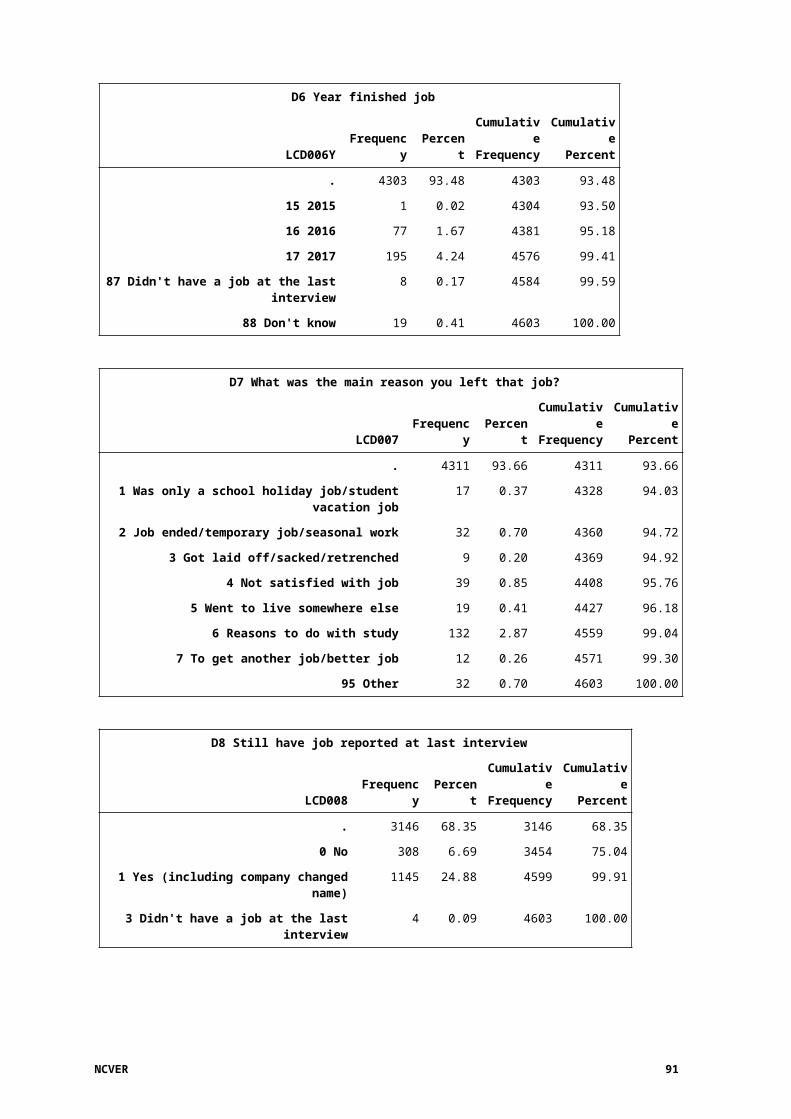
F2k Months looked for work - May 2017
LCF002K Frequency PercentCumulativeFrequency
CumulativePercent
. 2157 46.86 2157 46.86
0 Not applicable 1613 35.04 3770 81.90
1 Applicable 833 18.10 4603 100.00
F2l Months looked for work - June 2017
LCF002L Frequency PercentCumulativeFrequency
CumulativePercent
. 2157 46.86 2157 46.86
0 Not applicable 1528 33.20 3685 80.06
1 Applicable 918 19.94 4603 100.00
F2m Months looked for work - July 2017
LCF002M Frequency PercentCumulativeFrequency
CumulativePercent
. 2157 46.86 2157 46.86
0 Not applicable 1432 31.11 3589 77.97
1 Applicable 1014 22.03 4603 100.00
F2n Months looked for work - August 2017
LCF002N Frequency PercentCumulativeFrequency
CumulativePercent
. 2157 46.86 2157 46.86
0 Not applicable 1280 27.81 3437 74.67
1 Applicable 1166 25.33 4603 100.00
F2o Months looked for work - September 2017
LCF002O Frequency PercentCumulativeFrequency
CumulativePercent
. 2157 46.86 2157 46.86
0 Not applicable 1281 27.83 3438 74.69
1 Applicable 1165 25.31 4603 100.00
F2p Months looked for work - October 2017
LCF002P Frequency PercentCumulativeFrequency
CumulativePercent
. 2157 46.86 2157 46.86
0 Not applicable 2020 43.88 4177 90.75
1 Applicable 426 9.25 4603 100.00
NCVER 91
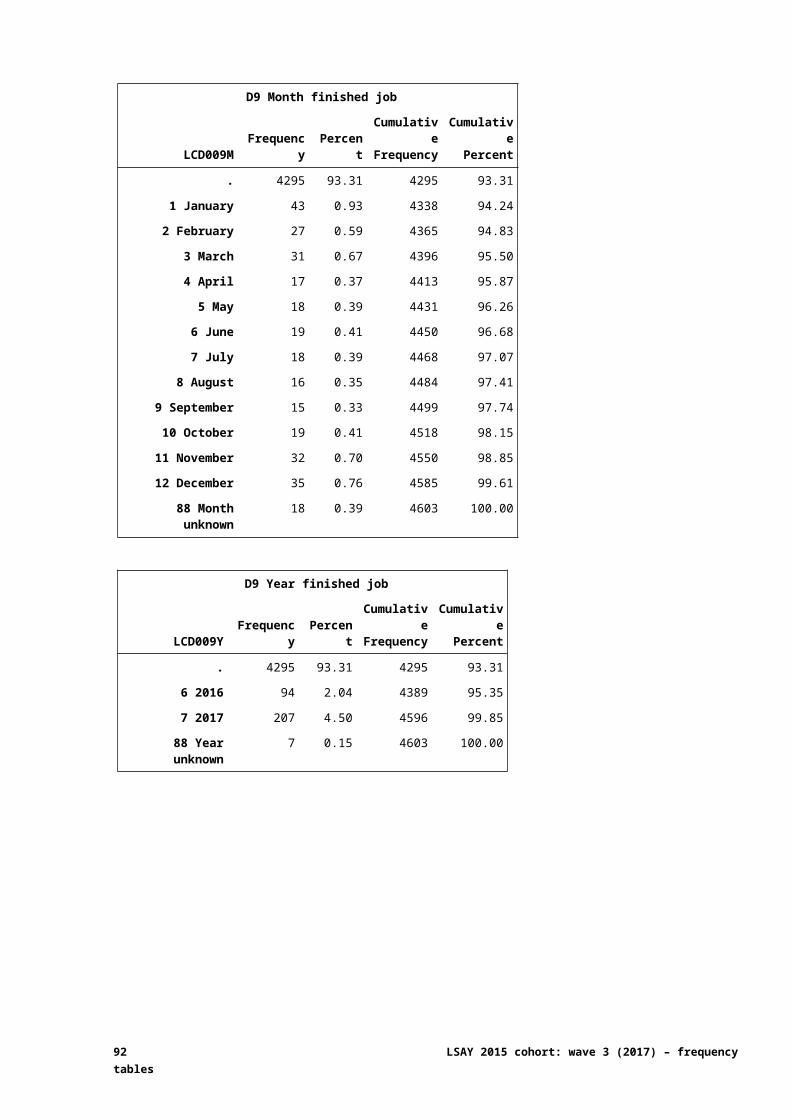
F2q Months looked for work - November 2017
LCF002Q Frequency PercentCumulativeFrequency
CumulativePercent
. 2157 46.86 2157 46.86
0 Not applicable 1985 43.12 4142 89.98
1 Applicable 461 10.02 4603 100.00
F2r Months looked for work - December 2017
LCF002R Frequency PercentCumulativeFrequency
CumulativePercent
. 2157 46.86 2157 46.86
0 Not applicable 2092 45.45 4249 92.31
1 Applicable 354 7.69 4603 100.00
F2s Months looked for work - January 2018
LCF002S Frequency PercentCumulativeFrequency
CumulativePercent
. 2157 46.86 2157 46.86
0 Not applicable 2329 50.60 4486 97.46
1 Applicable 117 2.54 4603 100.00
F2x Months looked for work - February 2018
LCF002X Frequency PercentCumulativeFrequency
CumulativePercent
. 2157 46.86 2157 46.86
0 Not applicable 2425 52.68 4582 99.54
1 Applicable 21 0.46 4603 100.00
F2t Looked for work every month up to present month
LCF002T Frequency PercentCumulativeFrequency
CumulativePercent
. 2157 46.86 2157 46.86
0 Not applicable 2031 44.12 4188 90.98
1 Applicable 415 9.02 4603 100.00
F3 At any time in the last four weeks, have you been looking for work?
LCF003 Frequency PercentCumulativeFrequency
CumulativePercent
. 3688 80.12 3688 80.12
0 No 741 16.10 4429 96.22
1 Yes 174 3.78 4603 100.00
92 LSAY 2015 cohort: wave 3 (2017) – frequency tables
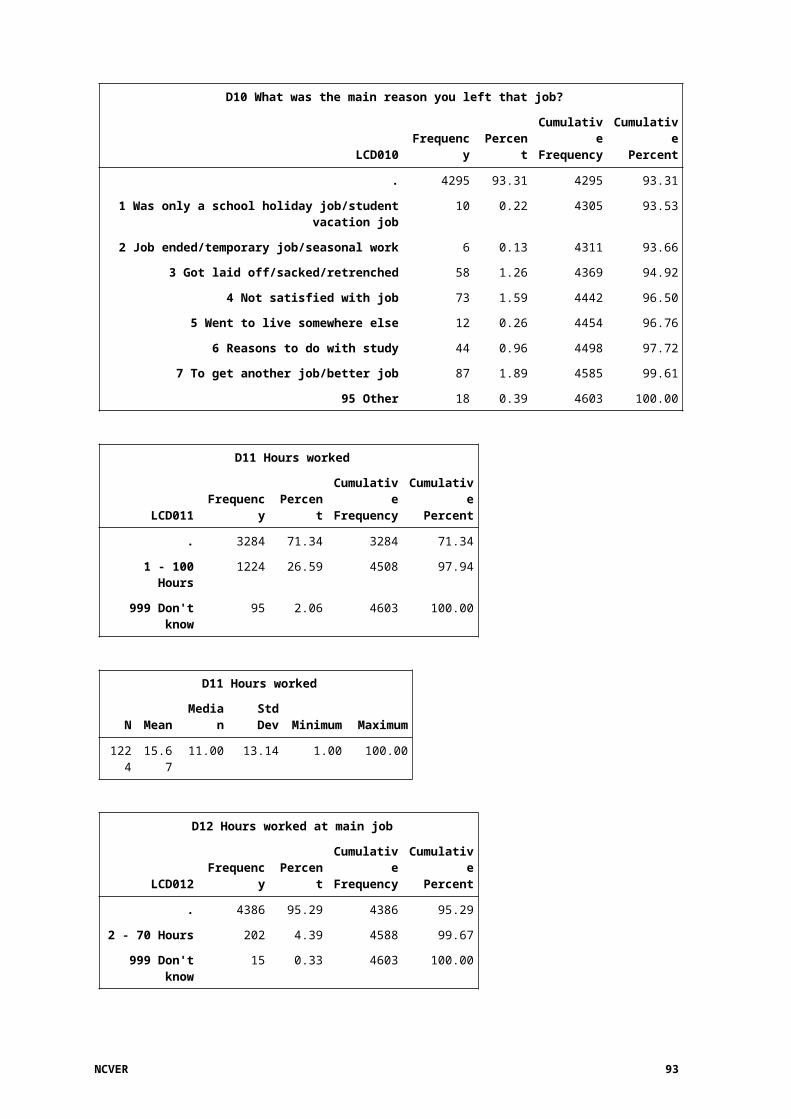
F4 How many hours per week would you like to work?
LCF004 Frequency PercentCumulativeFrequency
CumulativePercent
. 3920 85.16 3920 85.16
3 - 100 Hours 523 11.36 4443 96.52
999 Don't know 160 3.48 4603 100.00
F4 How many hours per week would you like to work?
N Mean Median Std Dev Minimum Maximum
523 22.39 20.00 12.75 4.00 100.00
F5a Been registered with Centrelink as a jobseeker
LCF005A Frequency PercentCumulativeFrequency
CumulativePercent
. 3920 85.16 3920 85.16
0 No 630 13.69 4550 98.85
1 Yes 53 1.15 4603 100.00
F5b Checked or registered with an employment agency
LCF005B Frequency PercentCumulativeFrequency
CumulativePercent
. 3920 85.16 3920 85.16
0 No 579 12.58 4499 97.74
1 Yes 104 2.26 4603 100.00
F5c Looked at advertisements for jobs in a newspaper, on a noticeboard, or on the internet
LCF005C Frequency PercentCumulativeFrequency
CumulativePercent
. 3920 85.16 3920 85.16
0 No 119 2.59 4039 87.75
1 Yes 564 12.25 4603 100.00
F5d Answered an advertisement for a job in a newspaper, on a noticeboard or on the internet
LCF005D Frequency PercentCumulativeFrequency
CumulativePercent
. 3920 85.16 3920 85.16
0 No 328 7.13 4248 92.29
1 Yes 355 7.71 4603 100.00
NCVER 93
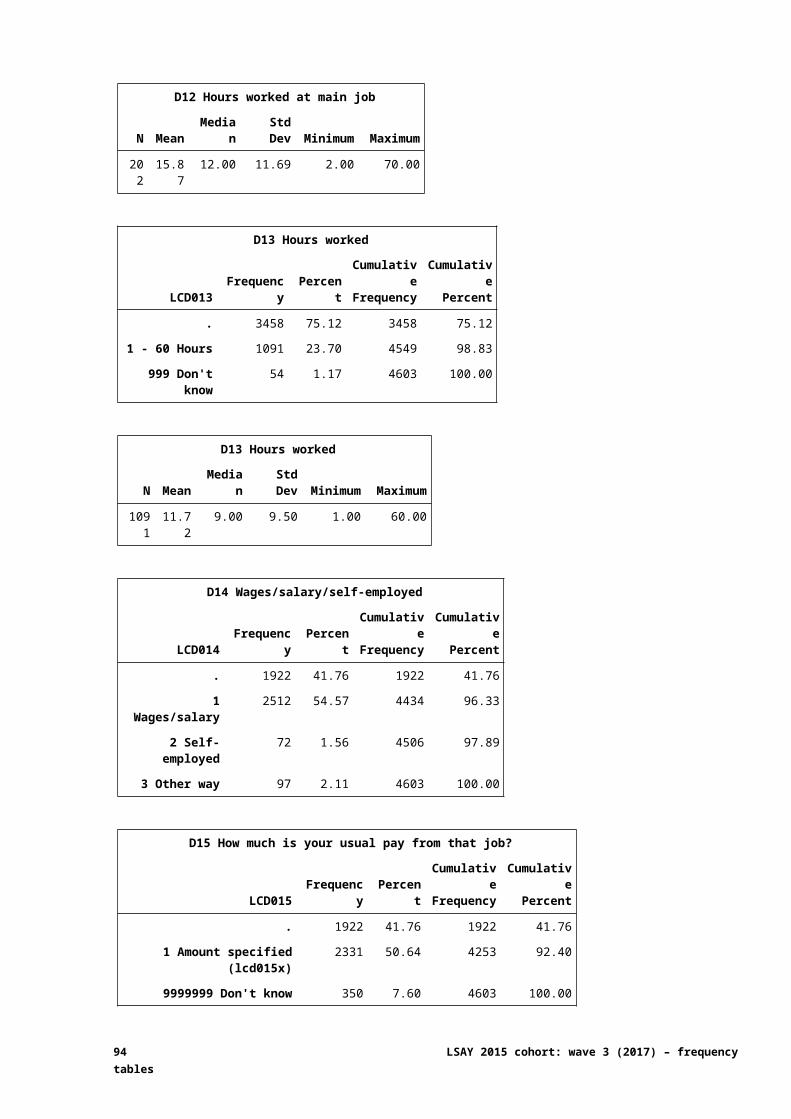
F5e Contacted friends or relatives about a job
LCF005E Frequency PercentCumulativeFrequency
CumulativePercent
. 3920 85.16 3920 85.16
0 No 295 6.41 4215 91.57
1 Yes 388 8.43 4603 100.00
F5f Written, phoned or approached an employer about a job
LCF005F Frequency PercentCumulativeFrequency
CumulativePercent
. 3920 85.16 3920 85.16
0 No 354 7.69 4274 92.85
1 Yes 329 7.15 4603 100.00
F5g Had an interview with an employer
LCF005G Frequency PercentCumulativeFrequency
CumulativePercent
. 3920 85.16 3920 85.16
0 No 517 11.23 4437 96.39
1 Yes 166 3.61 4603 100.00
F5h Advertised/tendered for work, including on the internet
LCF005H Frequency PercentCumulativeFrequency
CumulativePercent
. 3920 85.16 3920 85.16
0 No 589 12.80 4509 97.96
1 Yes 94 2.04 4603 100.00
F5i Asked school or another organisation for advice
LCF005I Frequency PercentCumulativeFrequency
CumulativePercent
. 3920 85.16 3920 85.16
0 No 505 10.97 4425 96.13
1 Yes 178 3.87 4603 100.00
94 LSAY 2015 cohort: wave 3 (2017) – frequency tables
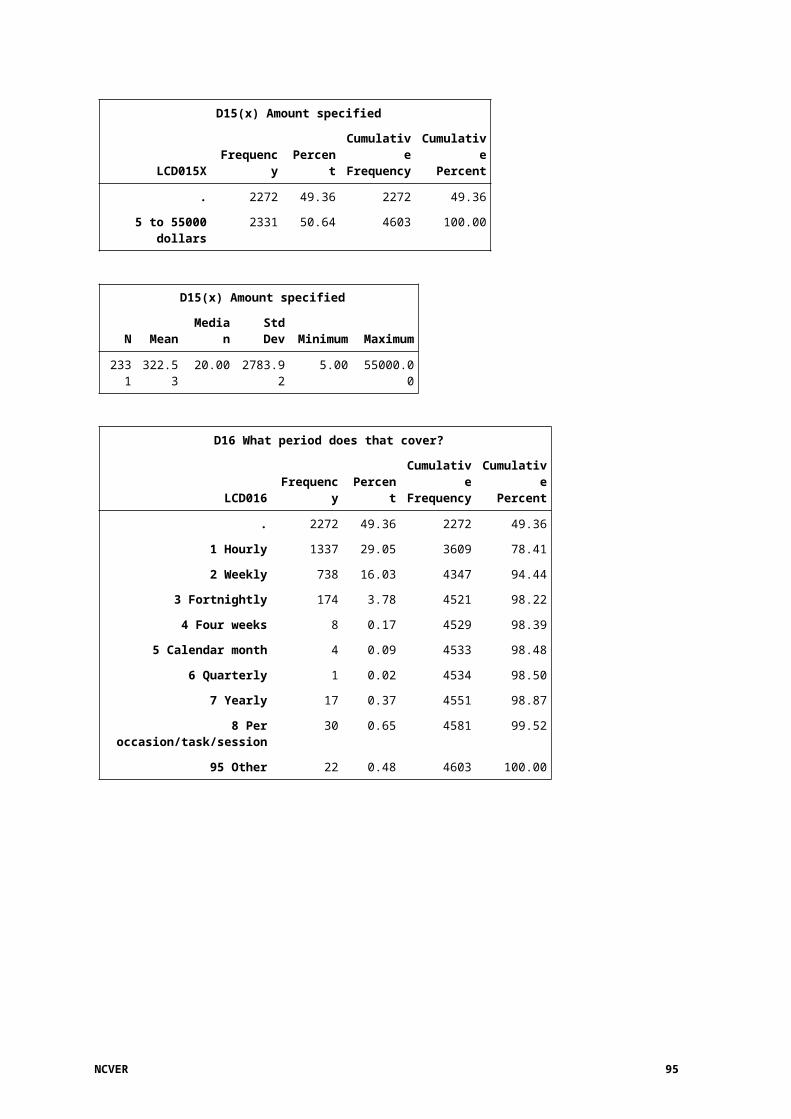
F5j Taken steps to purchase or start your own business
LCF005J Frequency PercentCumulativeFrequency
CumulativePercent
. 3920 85.16 3920 85.16
0 No 661 14.36 4581 99.52
1 Yes 22 0.48 4603 100.00
F6a A health problem or some disability
LCF006A Frequency PercentCumulativeFrequency
CumulativePercent
. 3920 85.16 3920 85.16
0 No 626 13.60 4546 98.76
1 Yes 57 1.24 4603 100.00
F6b Problems with childcare
LCF006B Frequency PercentCumulativeFrequency
CumulativePercent
. 3920 85.16 3920 85.16
0 No 679 14.75 4599 99.91
1 Yes 4 0.09 4603 100.00
F6c Not having suitable transport
LCF006C Frequency PercentCumulativeFrequency
CumulativePercent
. 3920 85.16 3920 85.16
0 No 481 10.45 4401 95.61
1 Yes 202 4.39 4603 100.00
F6d Not having enough or the right kind of education or training
LCF006D Frequency PercentCumulativeFrequency
CumulativePercent
. 3920 85.16 3920 85.16
0 No 533 11.58 4453 96.74
1 Yes 150 3.26 4603 100.00
F6e A lack of work experience
LCF006E Frequency PercentCumulativeFrequency
CumulativePercent
. 3920 85.16 3920 85.16
0 No 277 6.02 4197 91.18
1 Yes 406 8.82 4603 100.00
NCVER 95
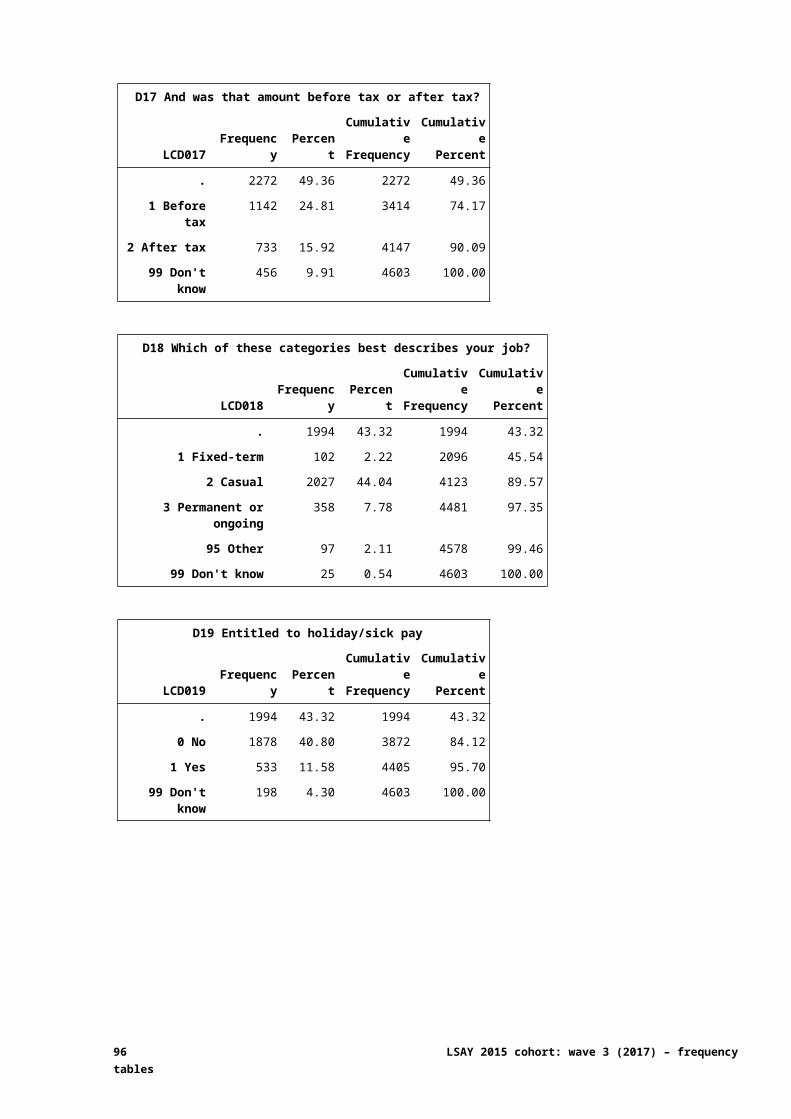
F6f Age, gender or other discrimination
LCF006F Frequency PercentCumulativeFrequency
CumulativePercent
. 3920 85.16 3920 85.16
0 No 608 13.21 4528 98.37
1 Yes 75 1.63 4603 100.00
F6g The work hours were not suitable
LCF006G Frequency PercentCumulativeFrequency
CumulativePercent
. 3920 85.16 3920 85.16
0 No 511 11.10 4431 96.26
1 Yes 172 3.74 4603 100.00
F6h There weren't enough jobs available
LCF006H Frequency PercentCumulativeFrequency
CumulativePercent
. 3920 85.16 3920 85.16
0 No 386 8.39 4306 93.55
1 Yes 297 6.45 4603 100.00
F6i Your reading and writing skills
LCF006I Frequency PercentCumulativeFrequency
CumulativePercent
. 3920 85.16 3920 85.16
0 No 673 14.62 4593 99.78
1 Yes 10 0.22 4603 100.00
F6j Your interview skills
LCF006J Frequency PercentCumulativeFrequency
CumulativePercent
. 3920 85.16 3920 85.16
0 No 616 13.38 4536 98.54
1 Yes 67 1.46 4603 100.00
F6k Your maths or numeracy skills
LCF006K Frequency PercentCumulativeFrequency
CumulativePercent
. 3920 85.16 3920 85.16
0 No 666 14.47 4586 99.63
1 Yes 17 0.37 4603 100.00
96 LSAY 2015 cohort: wave 3 (2017) – frequency tables
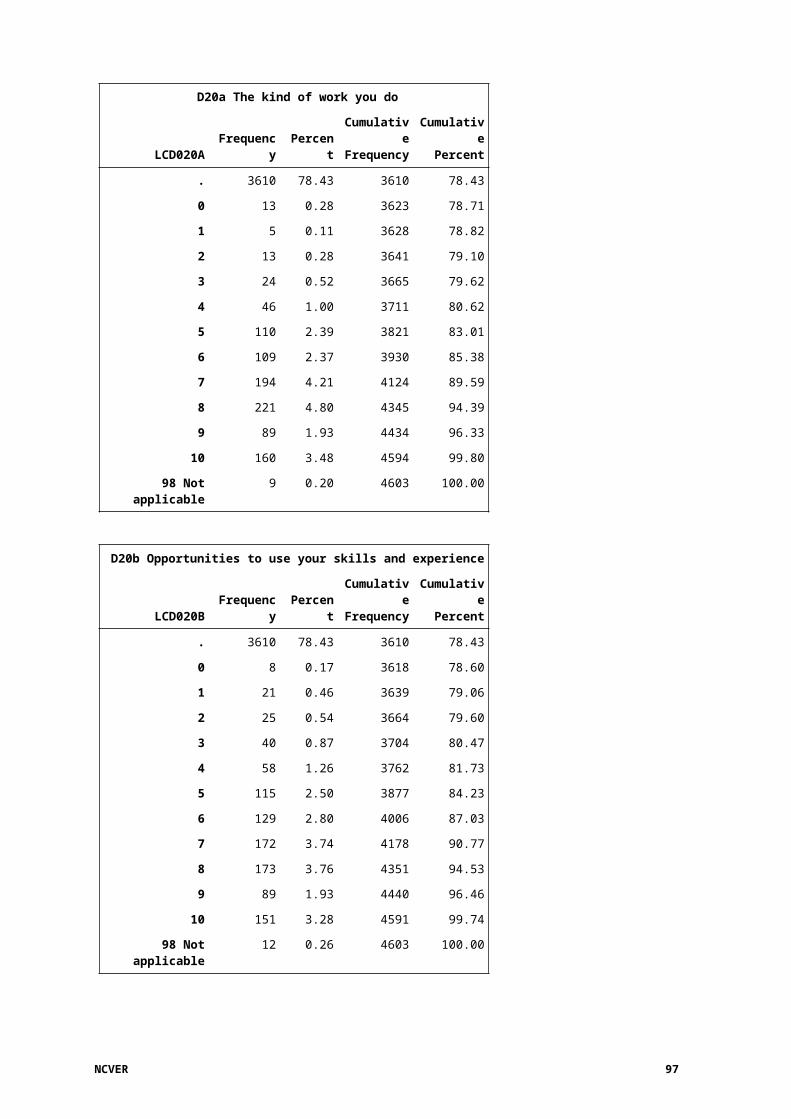
F6l A lack of confidence
LCF006L Frequency PercentCumulativeFrequency
CumulativePercent
. 3920 85.16 3920 85.16
0 No 486 10.56 4406 95.72
1 Yes 197 4.28 4603 100.00
F6m Your language or communication skills
LCF006M Frequency PercentCumulativeFrequency
CumulativePercent
. 3920 85.16 3920 85.16
0 No 654 14.21 4574 99.37
1 Yes 29 0.63 4603 100.00
F7 Since (last interview/1 October 2016) have you refused a job that was offered to you?
LCF007 Frequency PercentCumulativeFrequency
CumulativePercent
. 1022 22.20 1022 22.20
0 No 3513 76.32 4535 98.52
1 Yes 68 1.48 4603 100.00
F8 Why did you refuse?
LCF008 Frequency PercentCumulativeFrequency
CumulativePercent
. 4535 98.52 4535 98.52
1 Wages offered were too low 4 0.09 4539 98.61
2 Work was not interesting 10 0.22 4549 98.83
3 Location was not convenient 7 0.15 4556 98.98
4 Work would not match my level of qualifications 1 0.02 4557 99.00
5 Work would require too few hours 2 0.04 4559 99.04
6 Work would require too many hours 8 0.17 4567 99.22
7 Waiting for a better job offer 10 0.22 4577 99.44
8 There was no contract length offered or contract length was too short
1 0.02 4578 99.46
9 Saw no possibilities for advancement 2 0.04 4580 99.50
95 Other 23 0.50 4603 100.00
NCVER 97
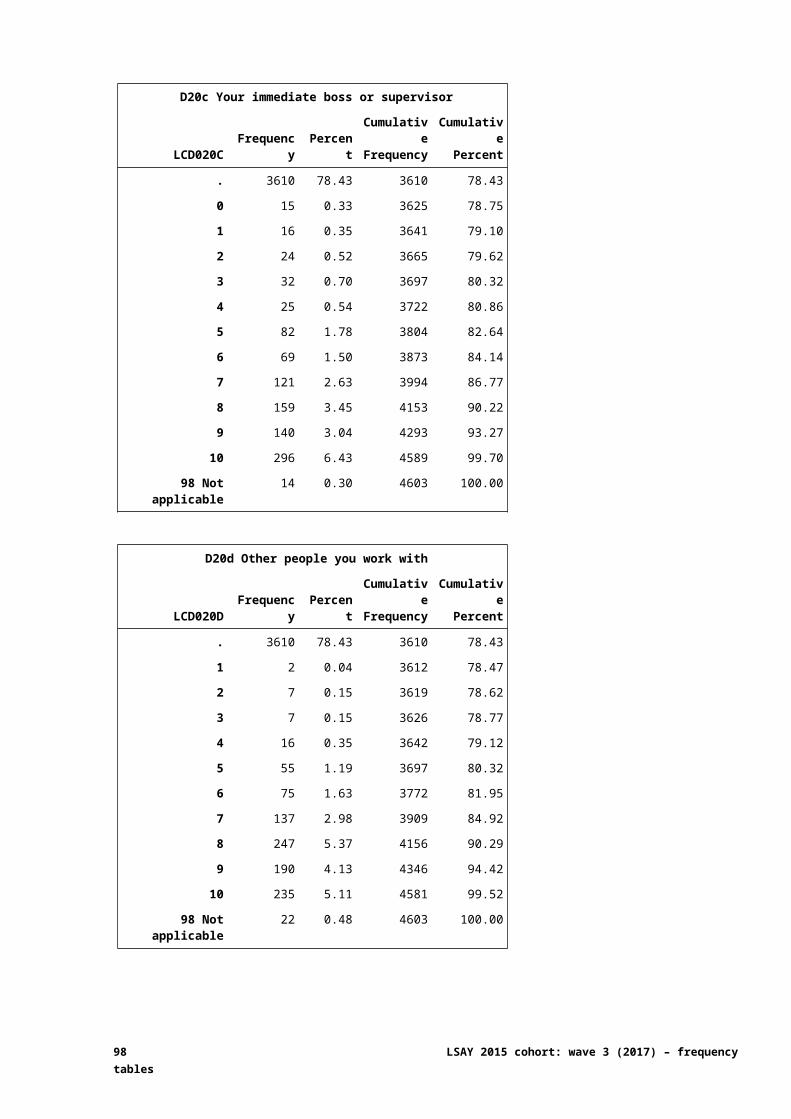
Section FA: Gig work FA1 Since your last interview / 1 October 2016 have you
earned money by taking on GIG jobs?
LCFA001 Frequency PercentCumulativeFrequency
CumulativePercent
0 No 4260 92.55 4260 92.55
1 Yes 343 7.45 4603 100.00
FA2 Has (gig work mentioned at FA1) already been mentioned?
LCFA002 Frequency PercentCumulativeFrequency
CumulativePercent
. 4356 94.63 4356 94.63
0 No 153 3.32 4509 97.96
1 Yes 94 2.04 4603 100.00
FA3a Gig jobs or tasks - shopping for or delivering household items
LCFA003A Frequency PercentCumulativeFrequency
CumulativePercent
. 4354 94.59 4354 94.59
0 Not applicable 241 5.24 4595 99.83
1 Applicable 8 0.17 4603 100.00
FA3b Gig jobs or tasks - performing tasks online
LCFA003B Frequency PercentCumulativeFrequency
CumulativePercent
. 4354 94.59 4354 94.59
0 Not applicable 201 4.37 4555 98.96
1 Applicable 48 1.04 4603 100.00
FA3c Gig jobs or tasks - cleaning / laundry
LCFA003C Frequency PercentCumulativeFrequency
CumulativePercent
. 4354 94.59 4354 94.59
0 Not applicable 233 5.06 4587 99.65
1 Applicable 16 0.35 4603 100.00
98 LSAY 2015 cohort: wave 3 (2017) – frequency tables
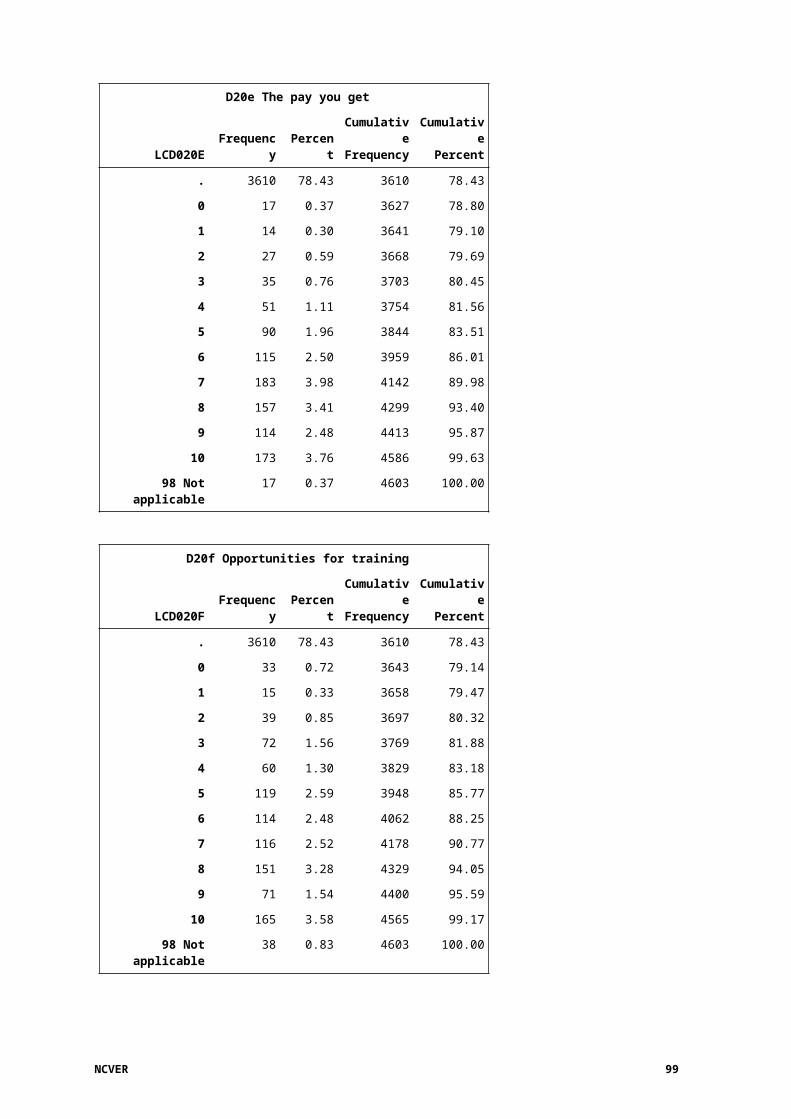
FA3d Gig jobs or tasks - ride hailing app
LCFA003D Frequency PercentCumulativeFrequency
CumulativePercent
. 4354 94.59 4354 94.59
0 Not applicable 247 5.37 4601 99.96
1 Applicable 2 0.04 4603 100.00
FA3e Gig jobs or tasks - other
LCFA003E Frequency PercentCumulativeFrequency
CumulativePercent
. 4354 94.59 4354 94.59
0 Not applicable 52 1.13 4406 95.72
1 Applicable 197 4.28 4603 100.00
F4 Which of the following statements best describes the income you´ve earned from this work?
LCFA004 Frequency PercentCumulativeFrequency
CumulativePercent
. 4260 92.55 4260 92.55
1 It has been essential for meeting my basic needs 50 1.09 4310 93.63
2 It has been an important component of my budget, but not essential
61 1.33 4371 94.96
3 It has been nice to have, but I could live comfortably without it
232 5.04 4603 100.00
FA5a Reasons for taking on gig jobs - control your own schedule due to school, child care of other obligations
LCFA005A Frequency PercentCumulativeFrequency
CumulativePercent
. 4260 92.55 4260 92.55
0 Not applicable 272 5.91 4532 98.46
1 Applicable 71 1.54 4603 100.00
FA5b Reasons for taking on gig jobs - fills in gaps or fluctuations in other sources of income
LCFA005B Frequency PercentCumulativeFrequency
CumulativePercent
. 4260 92.55 4260 92.55
0 Not applicable 243 5.28 4503 97.83
1 Applicable 100 2.17 4603 100.00
NCVER 99

FA5c Reasons for taking on gig jobs - gain work experience for future job opportunities
LCFA005C Frequency PercentCumulativeFrequency
CumulativePercent
. 4260 92.55 4260 92.55
0 Not applicable 195 4.24 4455 96.78
1 Applicable 148 3.22 4603 100.00
FA5d Reasons for taking on gig jobs - for fun, or to do something with your spare time
LCFA005D Frequency PercentCumulativeFrequency
CumulativePercent
. 4260 92.55 4260 92.55
0 Not applicable 109 2.37 4369 94.92
1 Applicable 234 5.08 4603 100.00
FA5e Reasons for taking on gig jobs - there have not been many other job opportunities in your area
LCFA005E Frequency PercentCumulativeFrequency
CumulativePercent
. 4260 92.55 4260 92.55
0 Not applicable 260 5.65 4520 98.20
1 Applicable 83 1.80 4603 100.00
FA5f Reasons for taking on gig jobs - other reason
LCFA005F Frequency PercentCumulativeFrequency
CumulativePercent
. 4260 92.55 4260 92.55
0 Not applicable 277 6.02 4537 98.57
1 Applicable 66 1.43 4603 100.00
FA6 How much have you usually received from this type of work?
LCFA006 Frequency PercentCumulativeFrequency
CumulativePercent
. 4354 94.59 4354 94.59
0.10 to 4500 dollars 249 5.41 4603 100.00
FA6 How much have you usually received from this type of work?
N Mean Median Std Dev Minimum Maximum
249 121.93 50.00 373.60 0.10 4500.00
100 LSAY 2015 cohort: wave 3 (2017) – frequency tables
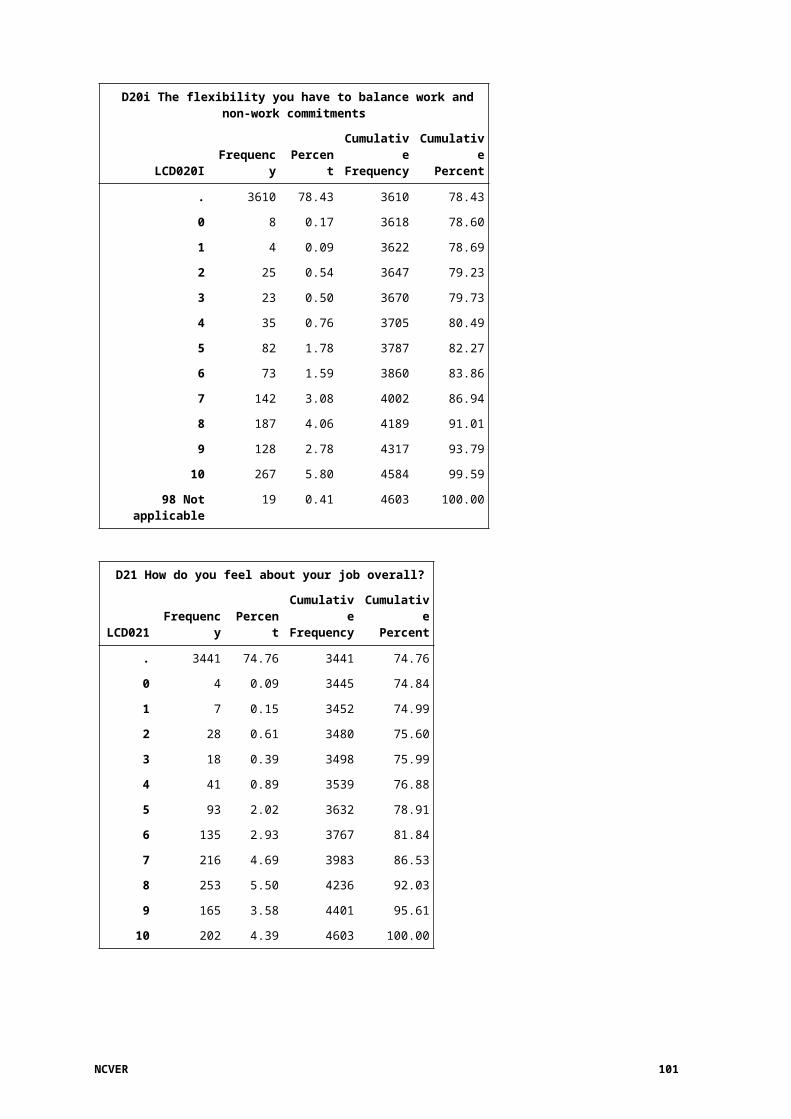
FA7 What period does that cover?
LCFA007 Frequency PercentCumulativeFrequency
CumulativePercent
. 4354 94.59 4354 94.59
1 Per occasion / task /session 141 3.06 4495 97.65
2 Hourly 50 1.09 4545 98.74
3 Weekly 23 0.50 4568 99.24
4 Fortnightly 8 0.17 4576 99.41
5 Four weeks 1 0.02 4577 99.44
6 Calendar month 4 0.09 4581 99.52
7 Quarterly 3 0.07 4584 99.59
8 Yearly 10 0.22 4594 99.80
95 Other 9 0.20 4603 100.00
NCVER 101
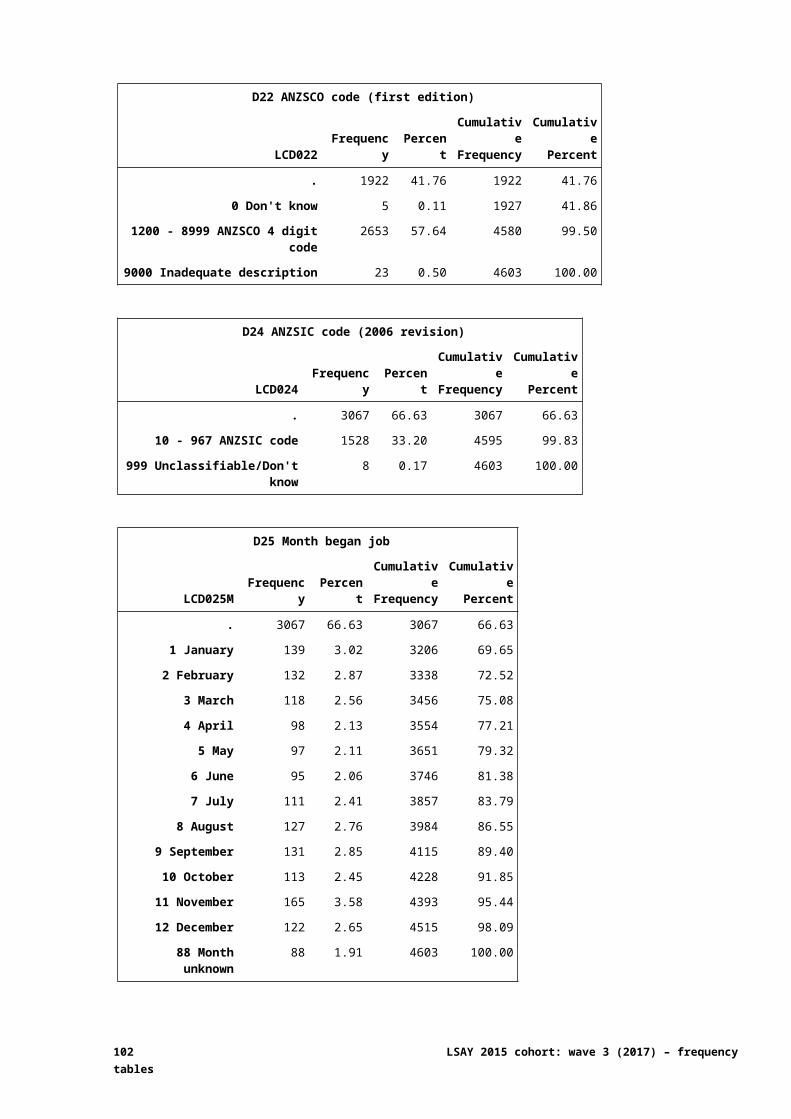
Section FB: Volunteering and unpaid care
FB1 Since last interview / 1 October 2016 have you volunteered for a sports team, charity, religious
organisation, or any other organisation?
LCFB001 Frequency PercentCumulativeFrequency
CumulativePercent
0 No 2751 59.77 2751 59.77
1 Yes 1852 40.23 4603 100.00
FB2 Since last interview / 1 October 2016 have you spent any time providing unpaid care for others?
LCFB002 Frequency PercentCumulativeFrequency
CumulativePercent
0 No 3181 69.11 3181 69.11
1 Yes 1422 30.89 4603 100.00
FB3a Months provided care for others - July 2016
LCFB003A Frequency PercentCumulativeFrequency
CumulativePercent
. 3181 69.11 3181 69.11
0 Not applicable 1422 30.89 4603 100.00
FB3b Months provided care for others - August 2016
LCFB003B Frequency PercentCumulativeFrequency
CumulativePercent
. 3181 69.11 3181 69.11
0 Not applicable 1422 30.89 4603 100.00
FB3c Months provided care for others - September 2016
LCFB003C Frequency PercentCumulativeFrequency
CumulativePercent
. 3181 69.11 3181 69.11
0 Not applicable 1404 30.50 4585 99.61
1 Applicable 18 0.39 4603 100.00
102 LSAY 2015 cohort: wave 3 (2017) – frequency tables
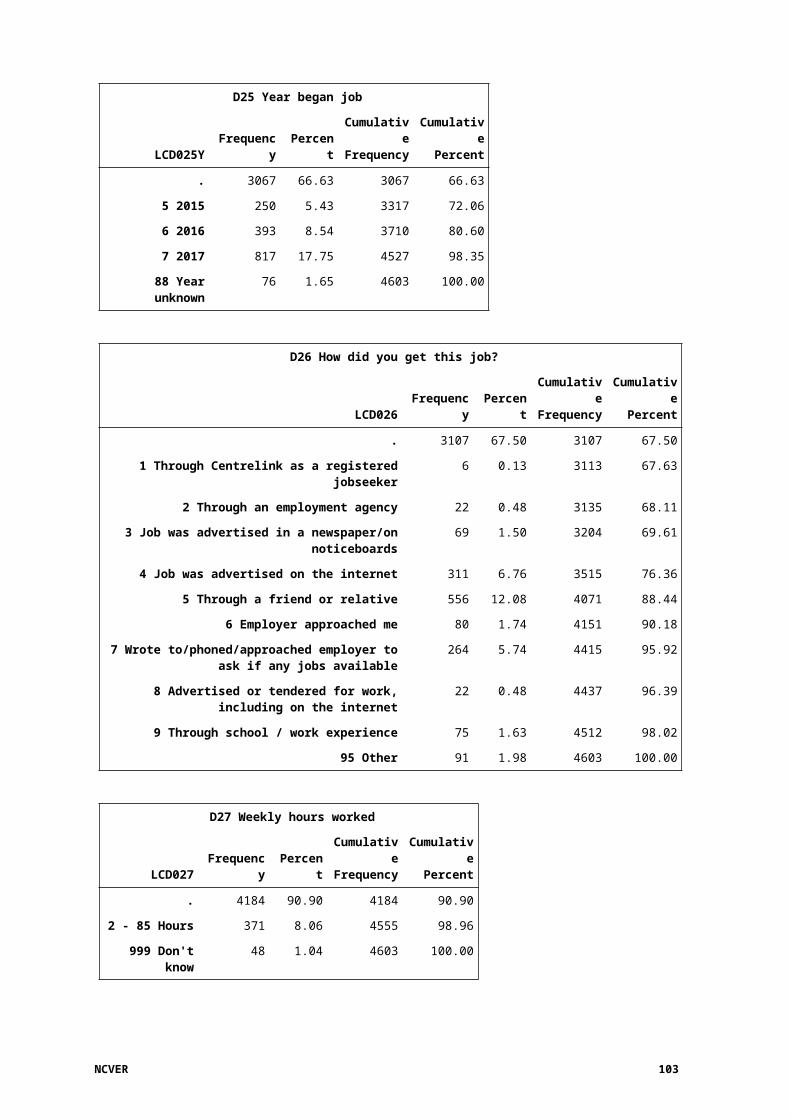
FB3d Months provided care for others - October 2016
LCFB003D Frequency PercentCumulativeFrequency
CumulativePercent
. 3181 69.11 3181 69.11
0 Not applicable 943 20.49 4124 89.59
1 Applicable 479 10.41 4603 100.00
FB3e Months provided care for others - November 2016
LCFB003E Frequency PercentCumulativeFrequency
CumulativePercent
. 3181 69.11 3181 69.11
0 Not applicable 779 16.92 3960 86.03
1 Applicable 643 13.97 4603 100.00
FB3f Months provided care for others - December 2016
LCFB003F Frequency PercentCumulativeFrequency
CumulativePercent
. 3181 69.11 3181 69.11
0 Not applicable 607 13.19 3788 82.29
1 Applicable 815 17.71 4603 100.00
FB3g Months provided care for others - January 2017
LCFB003G Frequency PercentCumulativeFrequency
CumulativePercent
. 3181 69.11 3181 69.11
0 Not applicable 505 10.97 3686 80.08
1 Applicable 917 19.92 4603 100.00
FB3h Months provided care for others - February 2017
LCFB003H Frequency PercentCumulativeFrequency
CumulativePercent
. 3181 69.11 3181 69.11
0 Not applicable 531 11.54 3712 80.64
1 Applicable 891 19.36 4603 100.00
FB3i Months provided care for others - March 2017
LCFB003I Frequency PercentCumulativeFrequency
CumulativePercent
. 3181 69.11 3181 69.11
0 Not applicable 541 11.75 3722 80.86
1 Applicable 881 19.14 4603 100.00
NCVER 103
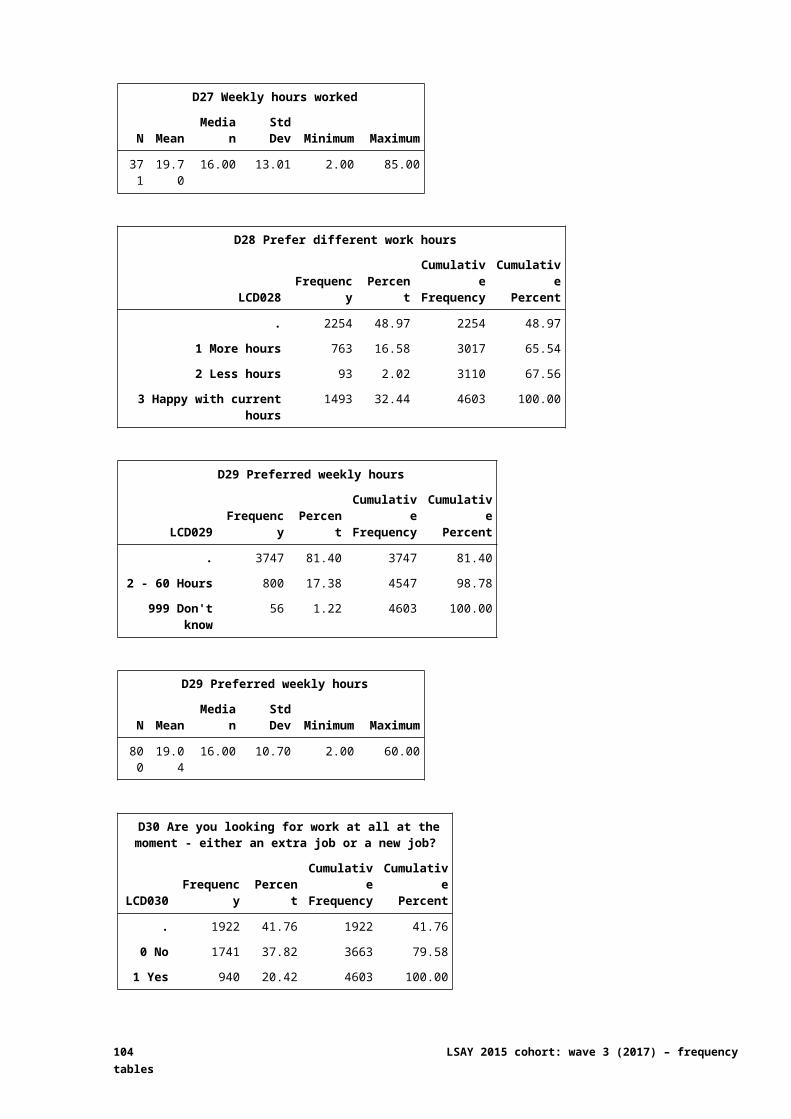
FB3j Months provided care for others - April 2017
LCFB003J Frequency PercentCumulativeFrequency
CumulativePercent
. 3181 69.11 3181 69.11
0 Not applicable 528 11.47 3709 80.58
1 Applicable 894 19.42 4603 100.00
FB3k Months provided care for others - May 2017
LCFB003K Frequency PercentCumulativeFrequency
CumulativePercent
. 3181 69.11 3181 69.11
0 Not applicable 549 11.93 3730 81.03
1 Applicable 873 18.97 4603 100.00
FB3l Months provided care for others - June 2017
LCFB003L Frequency PercentCumulativeFrequency
CumulativePercent
. 3181 69.11 3181 69.11
0 Not applicable 507 11.01 3688 80.12
1 Applicable 915 19.88 4603 100.00
FB3m Months provided care for others - July 2017
LCFB003M Frequency PercentCumulativeFrequency
CumulativePercent
. 3181 69.11 3181 69.11
0 Not applicable 488 10.60 3669 79.71
1 Applicable 934 20.29 4603 100.00
FB3n Months provided care for others - August 2017
LCFB003N Frequency PercentCumulativeFrequency
CumulativePercent
. 3181 69.11 3181 69.11
0 Not applicable 515 11.19 3696 80.30
1 Applicable 907 19.70 4603 100.00
FB3o Months provided care for others - September 2017
LCFB003O Frequency PercentCumulativeFrequency
CumulativePercent
. 3181 69.11 3181 69.11
0 Not applicable 626 13.60 3807 82.71
1 Applicable 796 17.29 4603 100.00
104 LSAY 2015 cohort: wave 3 (2017) – frequency tables
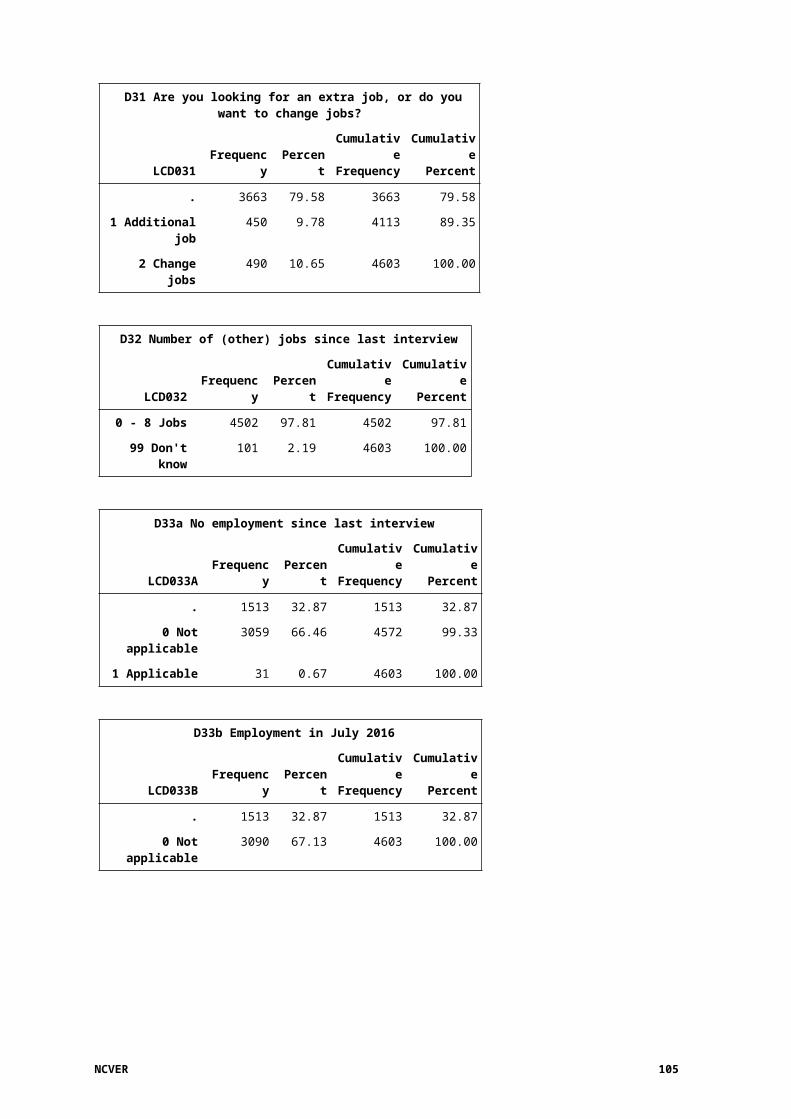
FB3p Months provided care for others - October 2017
LCFB003P Frequency PercentCumulativeFrequency
CumulativePercent
. 3181 69.11 3181 69.11
0 Not applicable 1109 24.09 4290 93.20
1 Applicable 313 6.80 4603 100.00
FB3q Months provided care for others - November 2017
LCFB003Q Frequency PercentCumulativeFrequency
CumulativePercent
. 3181 69.11 3181 69.11
0 Not applicable 1169 25.40 4350 94.50
1 Applicable 253 5.50 4603 100.00
FB3r Months provided care for others - December 2017
LCFB003R Frequency PercentCumulativeFrequency
CumulativePercent
. 3181 69.11 3181 69.11
0 Not applicable 1245 27.05 4426 96.15
1 Applicable 177 3.85 4603 100.00
FB3s Months provided care for others - January 2018
LCFB003S Frequency PercentCumulativeFrequency
CumulativePercent
. 3181 69.11 3181 69.11
0 Not applicable 1375 29.87 4556 98.98
1 Applicable 47 1.02 4603 100.00
FB3x Months provided care for others - February 2018
LCFB003X Frequency PercentCumulativeFrequency
CumulativePercent
. 3181 69.11 3181 69.11
0 Not applicable 1408 30.59 4589 99.70
1 Applicable 14 0.30 4603 100.00
FB3t Provided care for others every month up to present month
LCFB003T Frequency PercentCumulativeFrequency
CumulativePercent
. 3181 69.11 3181 69.11
0 Not applicable 732 15.90 3913 85.01
1 Applicable 690 14.99 4603 100.00
NCVER 105
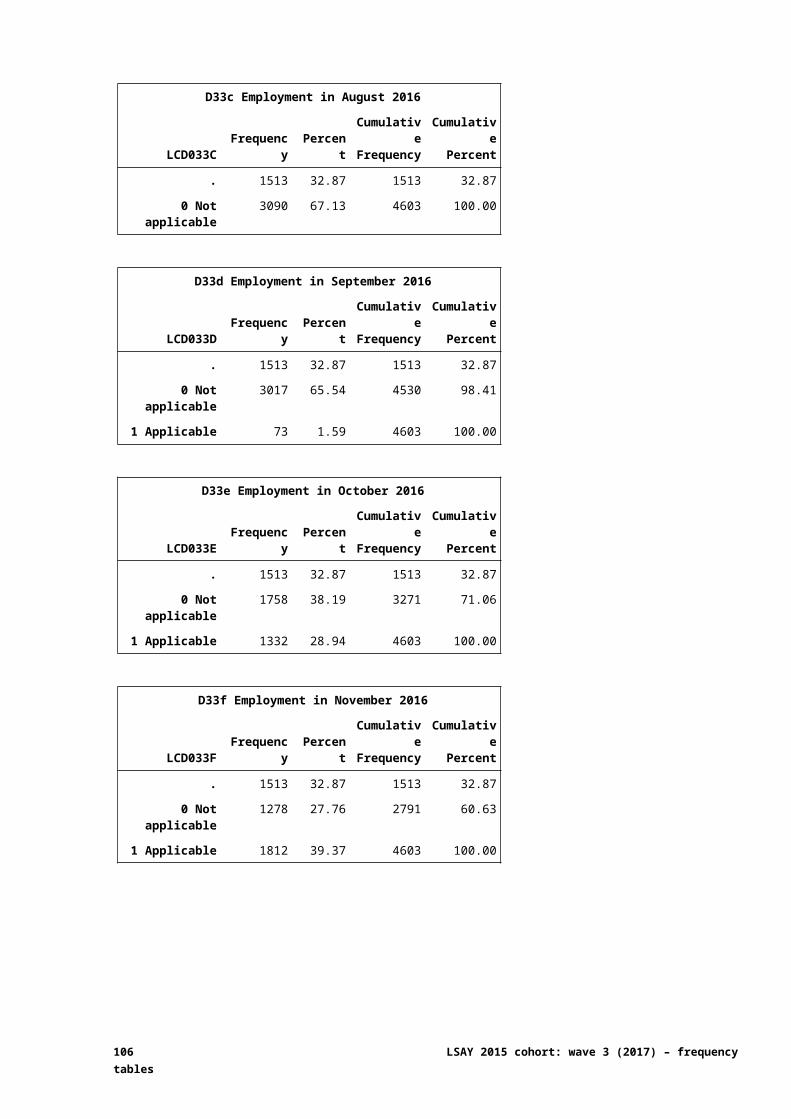
FB4a Provided care for own child
LCFB004A Frequency PercentCumulativeFrequency
CumulativePercent
. 3181 69.11 3181 69.11
0 Not applicable 1414 30.72 4595 99.83
1 Applicable 8 0.17 4603 100.00
FB4b Provided care for other child (relative)
LCFB004B Frequency PercentCumulativeFrequency
CumulativePercent
. 3181 69.11 3181 69.11
0 Not applicable 646 14.03 3827 83.14
1 Applicable 776 16.86 4603 100.00
FB4c Provided care for someone else's child
LCFB004C Frequency PercentCumulativeFrequency
CumulativePercent
. 3181 69.11 3181 69.11
0 Not applicable 1053 22.88 4234 91.98
1 Applicable 369 8.02 4603 100.00
FB4d Provided care for own parent(s)
LCFB004D Frequency PercentCumulativeFrequency
CumulativePercent
. 3181 69.11 3181 69.11
0 Not applicable 1289 28.00 4470 97.11
1 Applicable 133 2.89 4603 100.00
FB4e Provided care for other adult relative
LCFB004E Frequency PercentCumulativeFrequency
CumulativePercent
. 3181 69.11 3181 69.11
0 Not applicable 1188 25.81 4369 94.92
1 Applicable 234 5.08 4603 100.00
FB4f Provided care for other person
LCFB004F Frequency PercentCumulativeFrequency
CumulativePercent
. 3181 69.11 3181 69.11
0 Not applicable 1183 25.70 4364 94.81
1 Applicable 239 5.19 4603 100.00
106 LSAY 2015 cohort: wave 3 (2017) – frequency tables
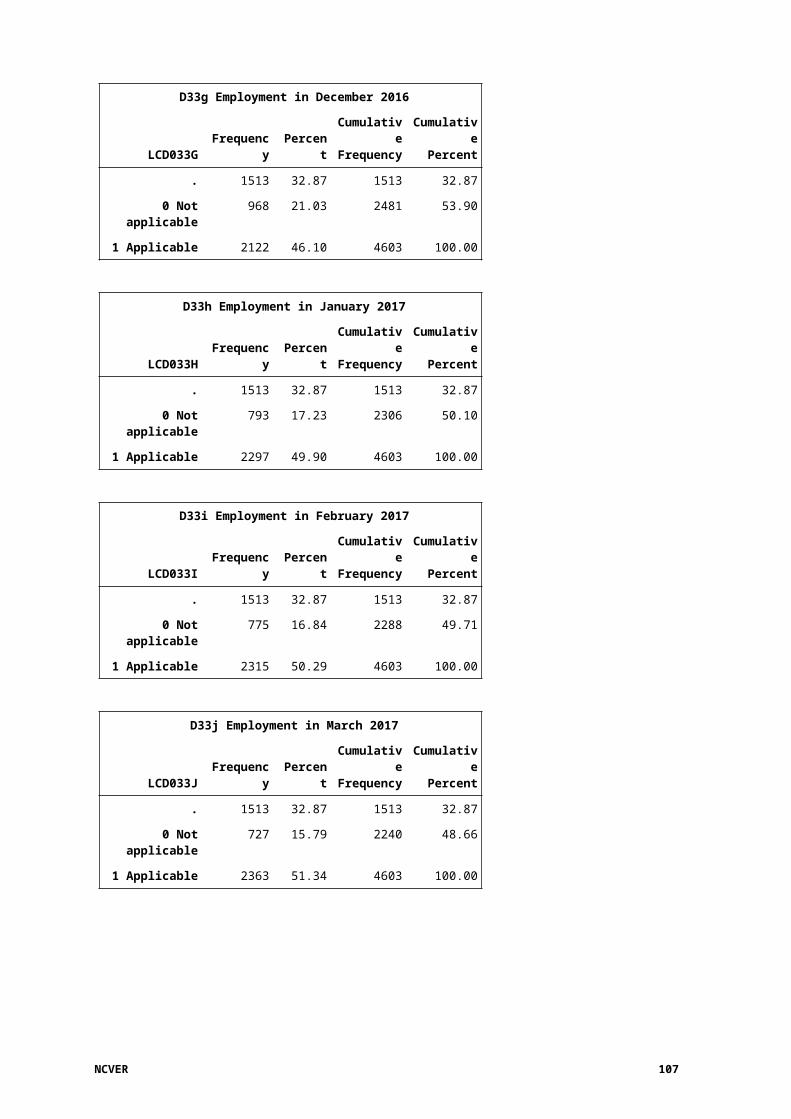
FB5 In a typical week where you have provided unpaid care to others, how many hours would you have spent providing care?
LCFB005 Frequency PercentCumulativeFrequency
CumulativePercent
. 3181 69.11 3181 69.11
1 - 168 Hours 829 18.01 4010 87.12
998 Prefer not to say 130 2.82 4140 89.94
999 Don't know 463 10.06 4603 100.00
FB5 In a typical week where you have provided unpaid care to others, how many hours would you
have spent providing care?
N Mean Median Std Dev Minimum Maximum
829 10.94 5.00 18.73 1.00 168.00
NCVER 107
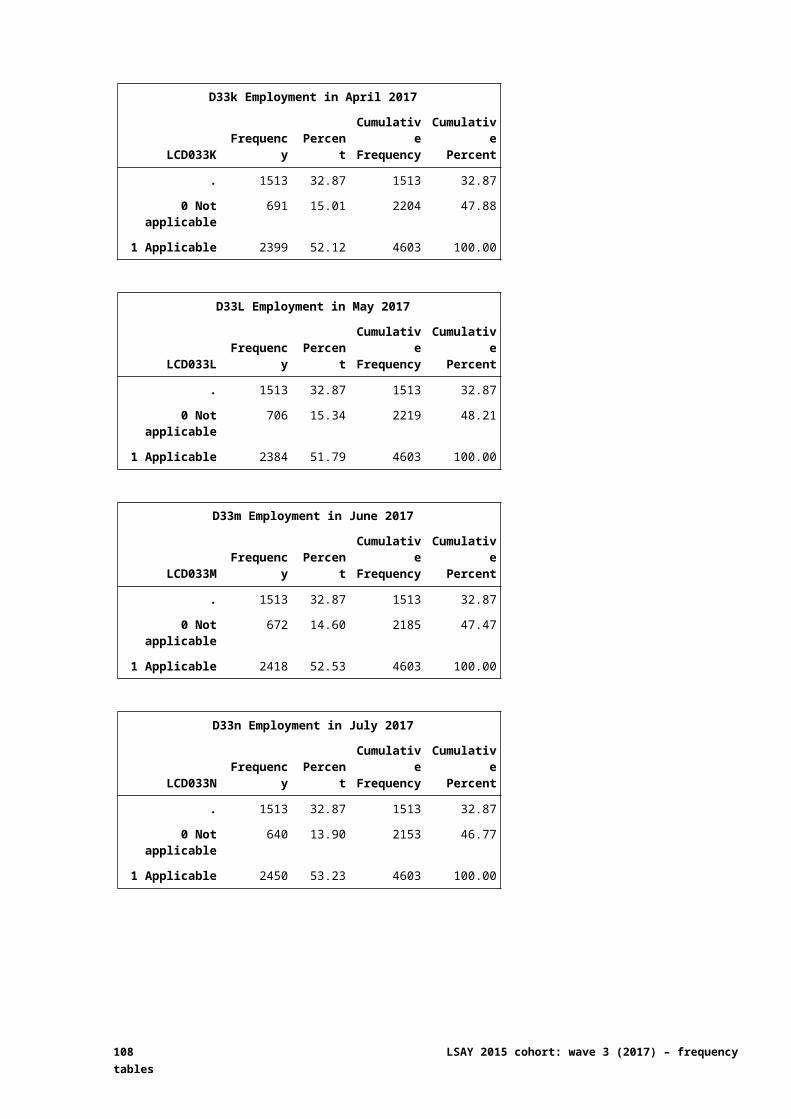
Section G: Not in the labour force
G1 Main activity
LCG001 Frequency PercentCumulativeFrequency
CumulativePercent
. 4379 95.13 4379 95.13
1 Study/training 73 1.59 4452 96.72
2 Home duties/looking after children 16 0.35 4468 97.07
3 Time off - including travel or holiday 111 2.41 4579 99.48
4 Ill/unable to work 3 0.07 4582 99.54
5 Other 21 0.46 4603 100.00
108 LSAY 2015 cohort: wave 3 (2017) – frequency tables

Section H: Living arrangements
H1 Live with parents or elsewhere
LCH001 Frequency PercentCumulativeFrequency
CumulativePercent
1 With parents, family members or guardian 4401 95.61 4401 95.61
2 Somewhere else 202 4.39 4603 100.00
H2 Type of accommodation
LCH002 Frequency PercentCumulativeFrequency
CumulativePercent
. 4401 95.61 4401 95.61
1 Shared house or flat 49 1.06 4450 96.68
2 Renting 41 0.89 4491 97.57
3 Buying 2 0.04 4493 97.61
4 Own outright 1 0.02 4494 97.63
5 Private house as a boarder 16 0.35 4510 97.98
6 University or TAFE residence 25 0.54 4535 98.52
7 Hostel or boarding house 44 0.96 4579 99.48
8 Other 24 0.52 4603 100.00
H3 Number of other people in household
LCH003 Frequency PercentCumulativeFrequency
CumulativePercent
. 69 1.50 69 1.50
1 - 15 People 4345 94.39 4414 95.89
97 I live alone 18 0.39 4432 96.29
98 Prefer not to say 171 3.71 4603 100.00
NCVER 109
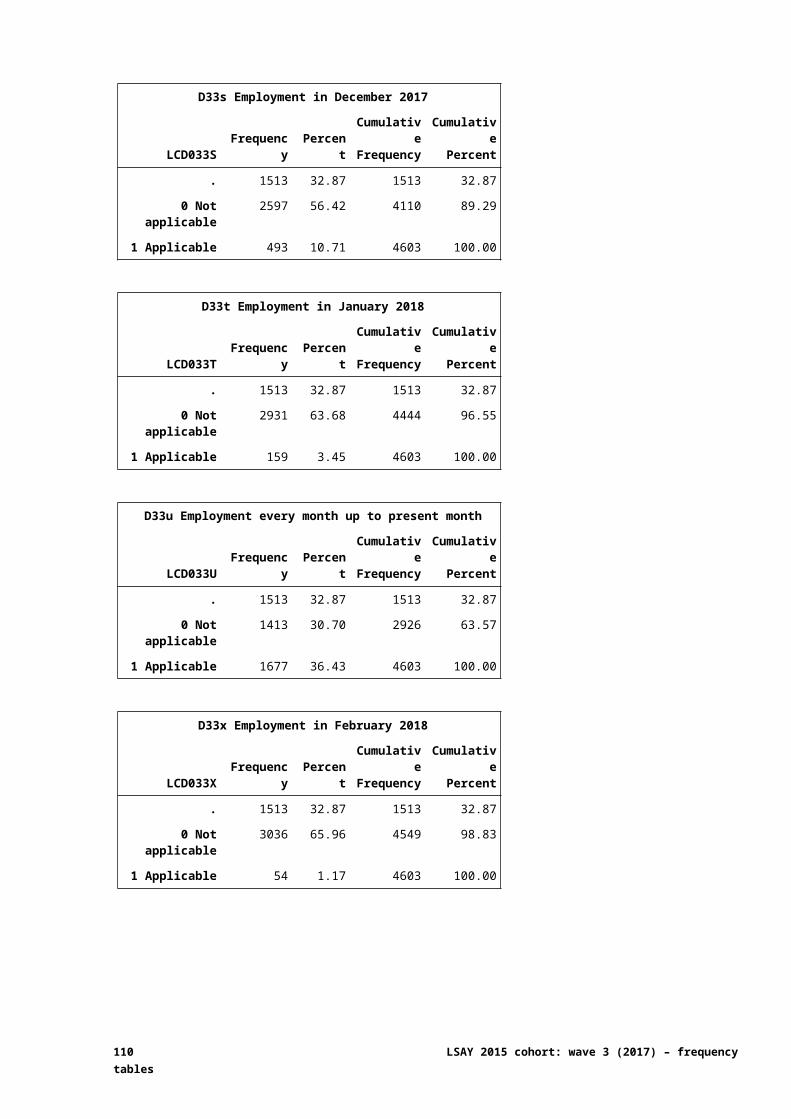
H4a Person 1 relationship to respondent
LCH004A Frequency PercentCumulativeFrequency
CumulativePercent
. 258 5.61 258 5.61
1 Mother/Stepmother 3445 74.84 3703 80.45
2 Father/Stepfather 461 10.02 4164 90.46
3 Brother/Stepbrother/Half-brother 125 2.72 4289 93.18
4 Sister/Stepsister/Half-sister 78 1.69 4367 94.87
5 Husband or wife 2 0.04 4369 94.92
6 De facto partner 14 0.30 4383 95.22
7 Own child 2 0.04 4385 95.26
8 Grandparent 69 1.50 4454 96.76
9 Unrelated person 65 1.41 4519 98.18
95 Other relationship 62 1.35 4581 99.52
98 Prefer not to say 22 0.48 4603 100.00
H4b Person 2 relationship to respondent
LCH004B Frequency PercentCumulativeFrequency
CumulativePercent
. 492 10.69 492 10.69
1 Mother/Stepmother 402 8.73 894 19.42
2 Father/Stepfather 2858 62.09 3752 81.51
3 Brother/Stepbrother/Half-brother 350 7.60 4102 89.12
4 Sister/Stepsister/Half-sister 260 5.65 4362 94.76
5 Husband or wife 1 0.02 4363 94.79
6 De facto partner 7 0.15 4370 94.94
7 Own child 1 0.02 4371 94.96
8 Grandparent 60 1.30 4431 96.26
9 Unrelated person 77 1.67 4508 97.94
95 Other relationship 73 1.59 4581 99.52
98 Prefer not to say 22 0.48 4603 100.00
110 LSAY 2015 cohort: wave 3 (2017) – frequency tables
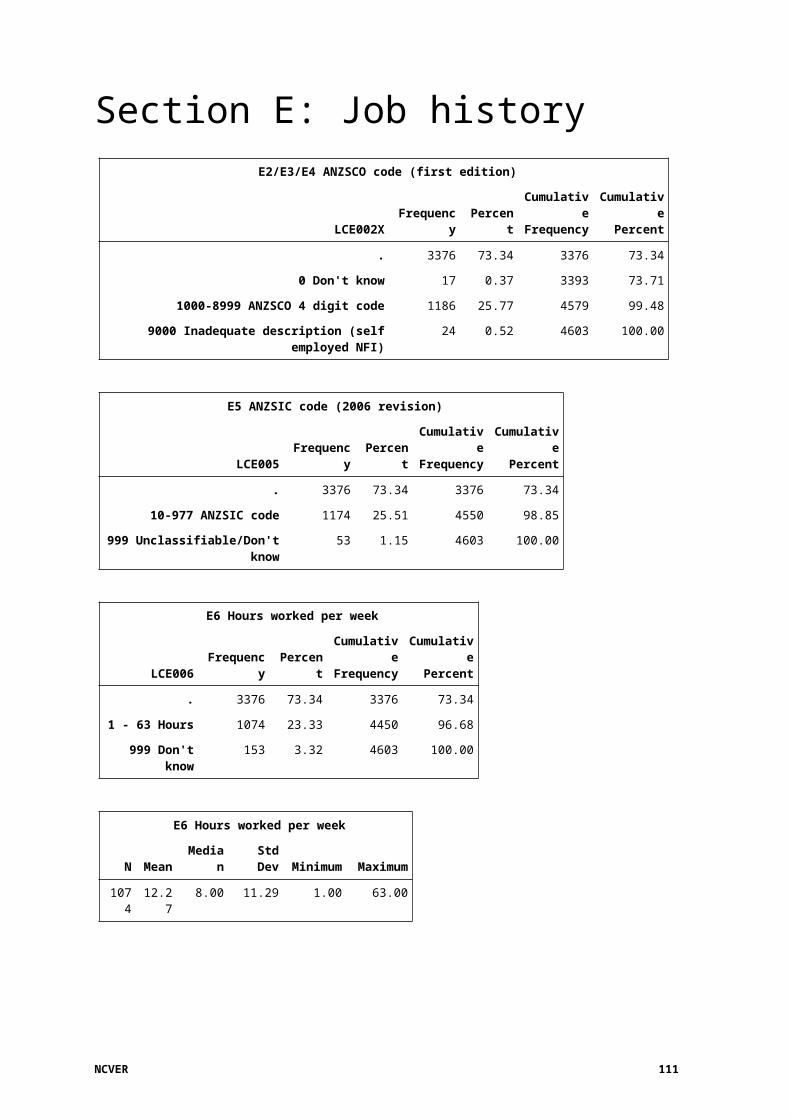
H4c Person 3 relationship to respondent
LCH004C Frequency PercentCumulativeFrequency
CumulativePercent
. 1336 29.02 1336 29.02
1 Mother/Stepmother 70 1.52 1406 30.55
2 Father/Stepfather 94 2.04 1500 32.59
3 Brother/Stepbrother/Half-brother 1700 36.93 3200 69.52
4 Sister/Stepsister/Half-sister 1175 25.53 4375 95.05
6 De facto partner 8 0.17 4383 95.22
8 Grandparent 57 1.24 4440 96.46
9 Unrelated person 55 1.19 4495 97.65
95 Other relationship 88 1.91 4583 99.57
98 Prefer not to say 20 0.43 4603 100.00
H4d Person 4 relationship to respondent
LCH004D Frequency PercentCumulativeFrequency
CumulativePercent
. 2928 63.61 2928 63.61
1 Mother/Stepmother 26 0.56 2954 64.18
2 Father/Stepfather 51 1.11 3005 65.28
3 Brother/Stepbrother/Half-brother 514 11.17 3519 76.45
4 Sister/Stepsister/Half-sister 808 17.55 4327 94.00
5 Husband or wife 1 0.02 4328 94.03
6 De facto partner 4 0.09 4332 94.11
8 Grandparent 67 1.46 4399 95.57
9 Unrelated person 64 1.39 4463 96.96
95 Other relationship 106 2.30 4569 99.26
98 Prefer not to say 34 0.74 4603 100.00
NCVER 111
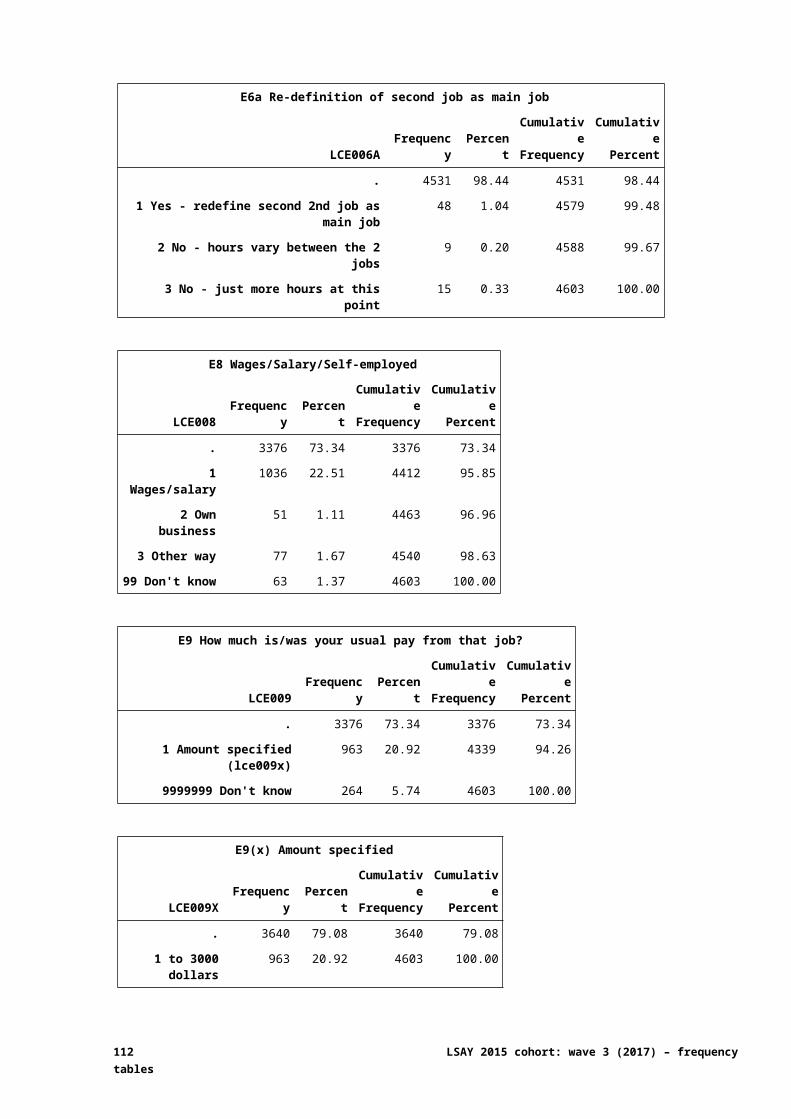
H4e Person 5 relationship to respondent
LCH004E Frequency PercentCumulativeFrequency
CumulativePercent
. 3961 86.05 3961 86.05
1 Mother/Stepmother 12 0.26 3973 86.31
2 Father/Stepfather 13 0.28 3986 86.60
3 Brother/Stepbrother/Half-brother 179 3.89 4165 90.48
4 Sister/Stepsister/Half-sister 264 5.74 4429 96.22
6 De facto partner 6 0.13 4435 96.35
7 Own child 2 0.04 4437 96.39
8 Grandparent 46 1.00 4483 97.39
9 Unrelated person 43 0.93 4526 98.33
95 Other relationship 58 1.26 4584 99.59
98 Prefer not to say 19 0.41 4603 100.00
H4f Person 6 relationship to respondent
LCH004F Frequency PercentCumulativeFrequency
CumulativePercent
. 4342 94.33 4342 94.33
1 Mother/Stepmother 7 0.15 4349 94.48
2 Father/Stepfather 5 0.11 4354 94.59
3 Brother/Stepbrother/Half-brother 59 1.28 4413 95.87
4 Sister/Stepsister/Half-sister 96 2.09 4509 97.96
6 De facto partner 2 0.04 4511 98.00
8 Grandparent 22 0.48 4533 98.48
9 Unrelated person 18 0.39 4551 98.87
95 Other relationship 41 0.89 4592 99.76
98 Prefer not to say 11 0.24 4603 100.00
112 LSAY 2015 cohort: wave 3 (2017) – frequency tables
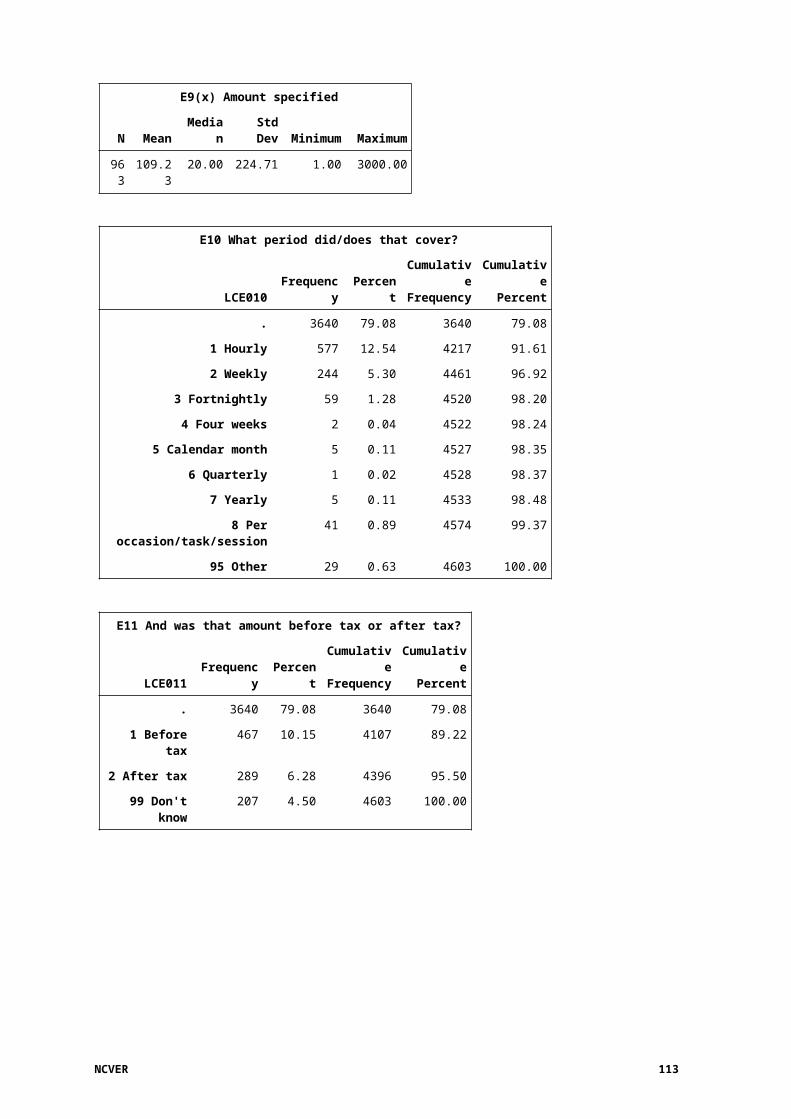
H4g Person 7 relationship to respondent
LCH004G Frequency PercentCumulativeFrequency
CumulativePercent
. 4497 97.70 4497 97.70
1 Mother/Stepmother 5 0.11 4502 97.81
2 Father/Stepfather 6 0.13 4508 97.94
3 Brother/Stepbrother/Half-brother 13 0.28 4521 98.22
4 Sister/Stepsister/Half-sister 41 0.89 4562 99.11
6 De facto partner 1 0.02 4563 99.13
8 Grandparent 11 0.24 4574 99.37
9 Unrelated person 9 0.20 4583 99.57
95 Other relationship 17 0.37 4600 99.93
98 Prefer not to say 3 0.07 4603 100.00
H4h Person 8 relationship to respondent
LCH004H Frequency PercentCumulativeFrequency
CumulativePercent
. 4552 98.89 4552 98.89
1 Mother/Stepmother 2 0.04 4554 98.94
2 Father/Stepfather 4 0.09 4558 99.02
3 Brother/Stepbrother/Half-brother 9 0.20 4567 99.22
4 Sister/Stepsister/Half-sister 16 0.35 4583 99.57
8 Grandparent 3 0.07 4586 99.63
9 Unrelated person 3 0.07 4589 99.70
95 Other relationship 11 0.24 4600 99.93
98 Prefer not to say 3 0.07 4603 100.00
H4i Person 9 relationship to respondent
LCH004I Frequency PercentCumulativeFrequency
CumulativePercent
. 4580 99.50 4580 99.50
2 Father/Stepfather 2 0.04 4582 99.54
3 Brother/Stepbrother/Half-brother 2 0.04 4584 99.59
4 Sister/Stepsister/Half-sister 8 0.17 4592 99.76
6 De facto partner 1 0.02 4593 99.78
8 Grandparent 1 0.02 4594 99.80
9 Unrelated person 2 0.04 4596 99.85
95 Other relationship 6 0.13 4602 99.98
98 Prefer not to say 1 0.02 4603 100.00
NCVER 113
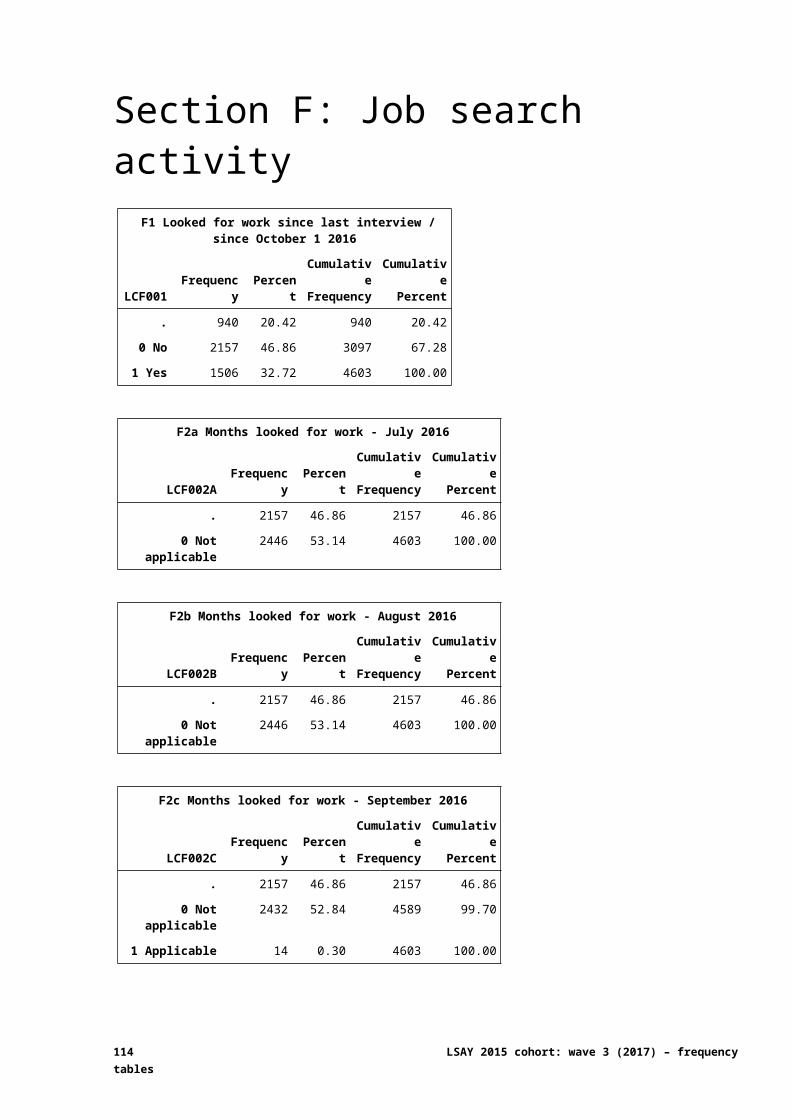
H4j Person 10 relationship to respondent
LCH004J Frequency PercentCumulativeFrequency
CumulativePercent
. 4588 99.67 4588 99.67
3 Brother/Stepbrother/Half-brother 1 0.02 4589 99.70
4 Sister/Stepsister/Half-sister 5 0.11 4594 99.80
8 Grandparent 1 0.02 4595 99.83
9 Unrelated person 2 0.04 4597 99.87
95 Other relationship 5 0.11 4602 99.98
98 Prefer not to say 1 0.02 4603 100.00
H4k Person 11 relationship to respondent
LCH004K Frequency PercentCumulativeFrequency
CumulativePercent
. 4594 99.80 4594 99.80
3 Brother/Stepbrother/Half-brother 1 0.02 4595 99.83
4 Sister/Stepsister/Half-sister 2 0.04 4597 99.87
8 Grandparent 1 0.02 4598 99.89
9 Unrelated person 2 0.04 4600 99.93
95 Other relationship 2 0.04 4602 99.98
98 Prefer not to say 1 0.02 4603 100.00
H4l Person 12 relationship to respondent
LCH004L Frequency PercentCumulativeFrequency
CumulativePercent
. 4598 99.89 4598 99.89
3 Brother/Stepbrother/Half-brother 1 0.02 4599 99.91
4 Sister/Stepsister/Half-sister 1 0.02 4600 99.93
9 Unrelated person 1 0.02 4601 99.96
95 Other relationship 1 0.02 4602 99.98
98 Prefer not to say 1 0.02 4603 100.00
H4m Person 13 relationship to respondent
LCH004M Frequency PercentCumulativeFrequency
CumulativePercent
. 4600 99.93 4600 99.93
3 Brother/Stepbrother/Half-brother 1 0.02 4601 99.96
4 Sister/Stepsister/Half-sister 1 0.02 4602 99.98
9 Unrelated person 1 0.02 4603 100.00
114 LSAY 2015 cohort: wave 3 (2017) – frequency tables
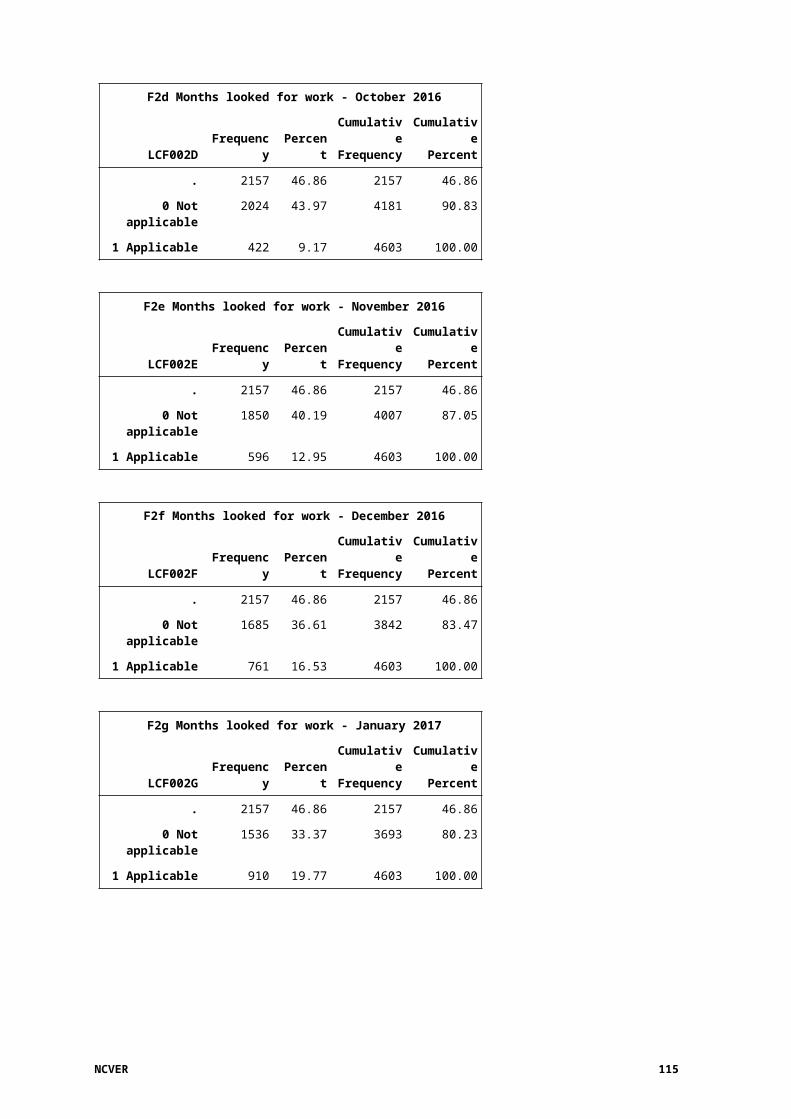
H4n Person 14 relationship to respondent
LCH004N Frequency PercentCumulativeFrequency
CumulativePercent
. 4602 99.98 4602 99.98
9 Unrelated person 1 0.02 4603 100.00
H4o Person 15 relationship to respondent
LCH004O Frequency PercentCumulativeFrequency
CumulativePercent
. 4602 99.98 4602 99.98
9 Unrelated person 1 0.02 4603 100.00
H5 Have you moved house since last interview / 1 October 2016?
LCH005 Frequency PercentCumulativeFrequency
CumulativePercent
0 No 4061 88.23 4061 88.23
1 Yes 542 11.77 4603 100.00
H6 How many times have you moved?
LCH006 Frequency PercentCumulativeFrequency
CumulativePercent
. 4061 88.23 4061 88.23
1 433 9.41 4494 97.63
2 81 1.76 4575 99.39
3 16 0.35 4591 99.74
4 6 0.13 4597 99.87
5 2 0.04 4599 99.91
6 1 0.02 4600 99.93
7 1 0.02 4601 99.96
8 1 0.02 4602 99.98
10 1 0.02 4603 100.00
H7 Are you currently receiving any government payments (apart from YA/ABStudy for study)?
LCH007 Frequency PercentCumulativeFrequency
CumulativePercent
0 No 3910 84.94 3910 84.94
1 Yes 319 6.93 4229 91.87
99 Don't know 374 8.13 4603 100.00
NCVER 115
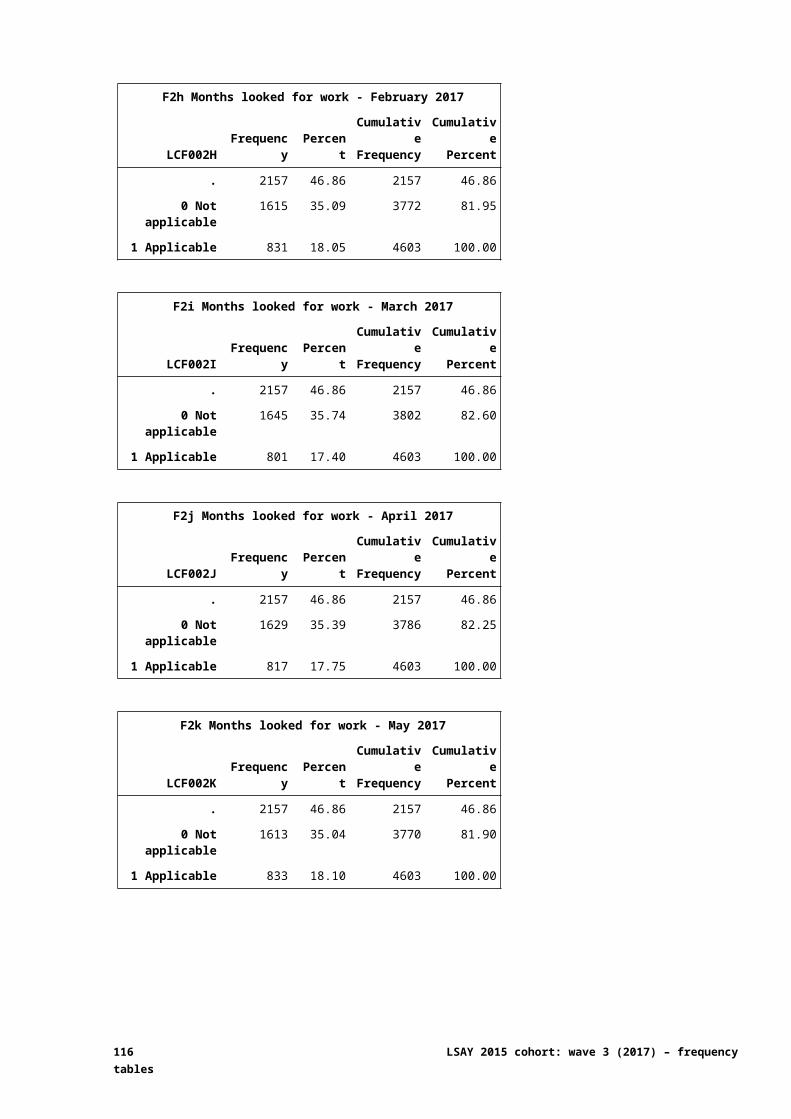
H8a Receive Youth Allowance/ABStudy
LCH008A Frequency PercentCumulativeFrequency
CumulativePercent
. 4284 93.07 4284 93.07
1 Applicable 225 4.89 4509 97.96
2 Not applicable 94 2.04 4603 100.00
H8b Receive Disability Support Pension
LCH008B Frequency PercentCumulativeFrequency
CumulativePercent
. 4284 93.07 4284 93.07
1 Applicable 14 0.30 4298 93.37
2 Not applicable 305 6.63 4603 100.00
H8c Receive Living Away from Home Allowance
LCH008C Frequency PercentCumulativeFrequency
CumulativePercent
. 4284 93.07 4284 93.07
1 Applicable 24 0.52 4308 93.59
2 Not applicable 295 6.41 4603 100.00
H8d Receive Rent assistance
LCH008D Frequency PercentCumulativeFrequency
CumulativePercent
. 4284 93.07 4284 93.07
1 Applicable 27 0.59 4311 93.66
2 Not applicable 292 6.34 4603 100.00
H8e Receive other allowance
LCH008E Frequency PercentCumulativeFrequency
CumulativePercent
. 4284 93.07 4284 93.07
1 Applicable 44 0.96 4328 94.03
2 Not applicable 275 5.97 4603 100.00
H9a Amount received for Youth Allowance/ABStudy
LCH009A Frequency PercentCumulativeFrequency
CumulativePercent
. 4378 95.11 4378 95.11
15 to 6000 dollars 152 3.30 4530 98.41
9998 Prefer not to say 73 1.59 4603 100.00
116 LSAY 2015 cohort: wave 3 (2017) – frequency tables
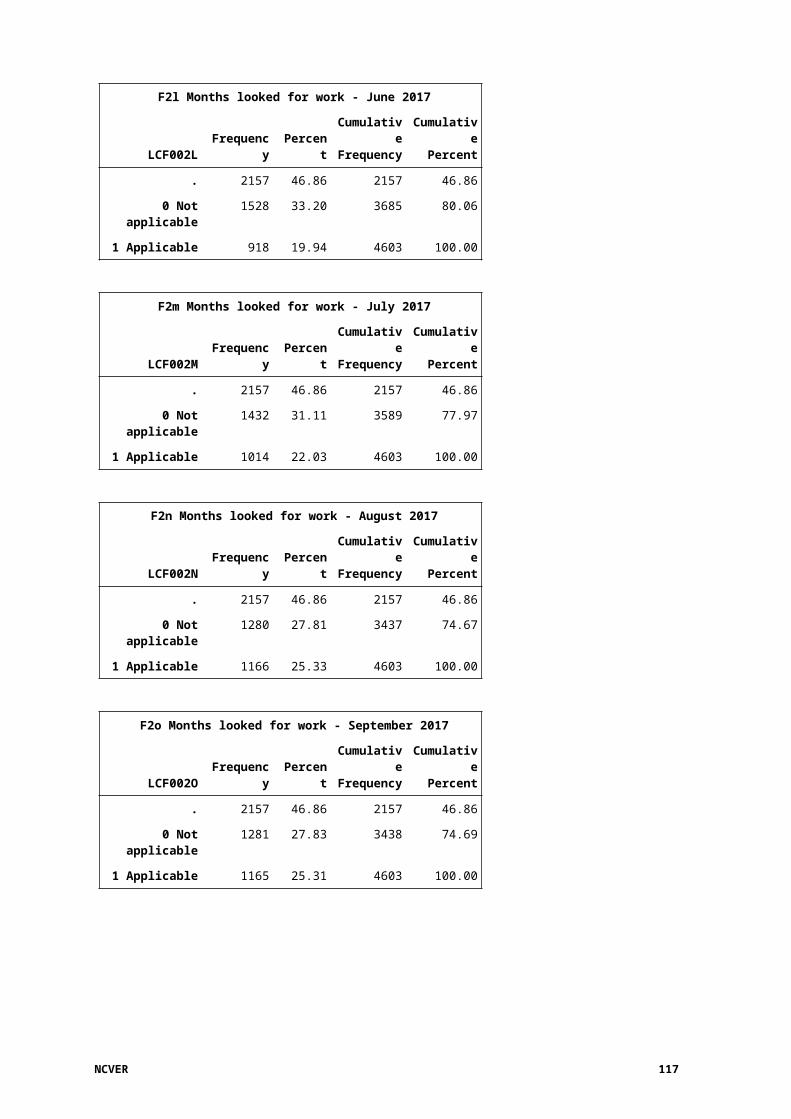
H9a Amount received for Youth Allowance/ABStudy
N Mean Median Std Dev Minimum Maximum
152 318.70 280.00 480.22 15.00 6000.00
H9b Amount received for Disability Support Pension
LCH009B Frequency PercentCumulativeFrequency
CumulativePercent
. 4589 99.70 4589 99.70
92 to 410 dollars 5 0.11 4594 99.80
9998 Prefer not to say 9 0.20 4603 100.00
H9b Amount received for Disability Support Pension
N Mean Median Std Dev Minimum Maximum
5 295.60 376.00 142.34 92.00 410.00
H9c Amount received for Living Away from Home Allowance
LCH009C Frequency PercentCumulativeFrequency
CumulativePercent
. 4579 99.48 4579 99.48
19 to 1400 dollars 13 0.28 4592 99.76
9998 Prefer not to say 11 0.24 4603 100.00
H9c Amount received for Living Away from Home Allowance
N Mean Median Std Dev Minimum Maximum
13 323.31 200.00 358.71 19.00 1400.00
H9d Amount received for Rent assistance
LCH009D Frequency PercentCumulativeFrequency
CumulativePercent
. 4576 99.41 4576 99.41
10 to 4000 dollars 20 0.43 4596 99.85
9998 Prefer not to say 7 0.15 4603 100.00
H9d Amount received for Rent assistance
N Mean Median Std Dev Minimum Maximum
20 353.00 95.00 894.27 10.00 4000.00
NCVER 117
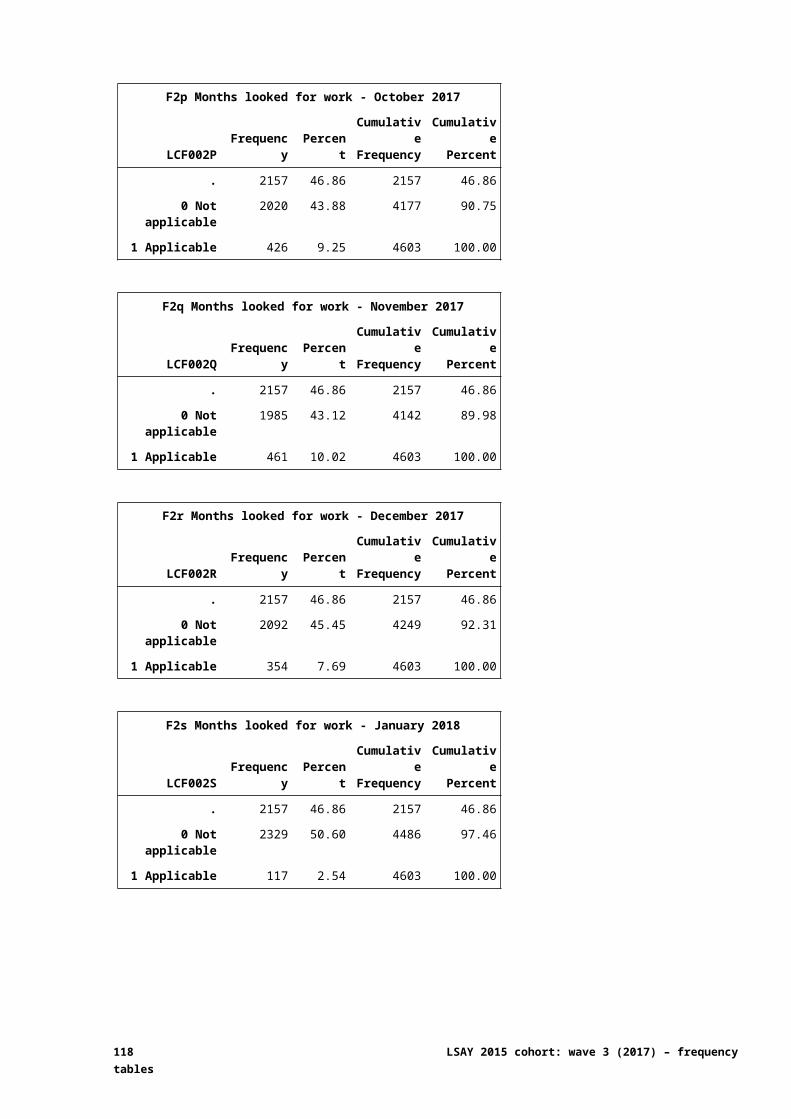
H9e Amount received for other allowance
LCH009E Frequency PercentCumulativeFrequency
CumulativePercent
. 4559 99.04 4559 99.04
7 to 8000 dollars 31 0.67 4590 99.72
9998 Prefer not to say 13 0.28 4603 100.00
H9e Amount received for other allowance
N Mean Median Std Dev Minimum Maximum
31 1110.94 300.00 2033.54 7.00 8000.00
H10a Period covered by Youth Allowance/ABStudy payment
LCH010A Frequency PercentCumulativeFrequency
CumulativePercent
. 4451 96.70 4451 96.70
1 Weekly 6 0.13 4457 96.83
2 Fortnightly 142 3.08 4599 99.91
3 Four weeks 1 0.02 4600 99.93
4 Yearly 2 0.04 4602 99.98
95 Other 1 0.02 4603 100.00
H10b Period covered by Disability Support Pension payment
LCH010B Frequency PercentCumulativeFrequency
CumulativePercent
. 4598 99.89 4598 99.89
2 Fortnightly 5 0.11 4603 100.00
H10c Period covered by Living Away from Home Allowance
LCH010C Frequency PercentCumulativeFrequency
CumulativePercent
. 4590 99.72 4590 99.72
1 Weekly 2 0.04 4592 99.76
2 Fortnightly 8 0.17 4600 99.93
3 Four weeks 1 0.02 4601 99.96
4 Yearly 1 0.02 4602 99.98
95 Other 1 0.02 4603 100.00
118 LSAY 2015 cohort: wave 3 (2017) – frequency tables
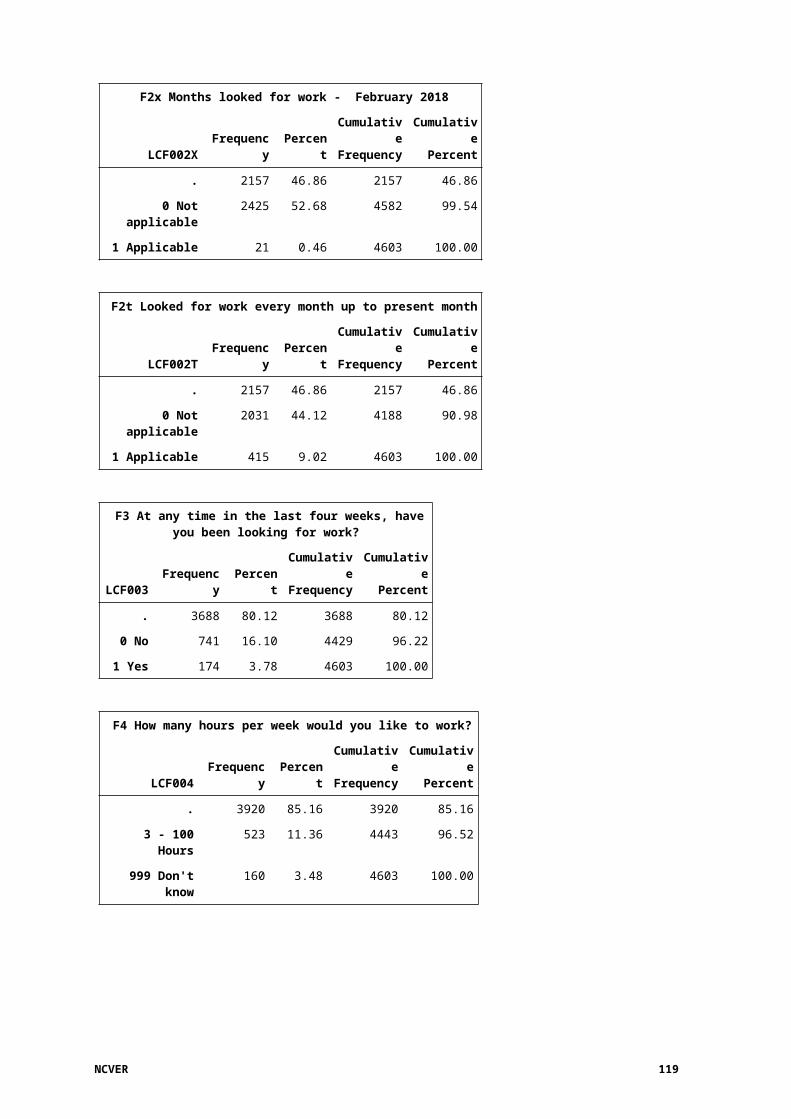
H10d Period covered by Rent assistance
LCH010D Frequency PercentCumulativeFrequency
CumulativePercent
. 4583 99.57 4583 99.57
1 Weekly 4 0.09 4587 99.65
2 Fortnightly 15 0.33 4602 99.98
95 Other 1 0.02 4603 100.00
H10e Period covered by other allowance payment
LCH010E Frequency PercentCumulativeFrequency
CumulativePercent
. 4572 99.33 4572 99.33
1 Weekly 2 0.04 4574 99.37
2 Fortnightly 14 0.30 4588 99.67
3 Four weeks 7 0.15 4595 99.83
4 Yearly 4 0.09 4599 99.91
95 Other 4 0.09 4603 100.00
H11 Have you ever experienced not having a permanent place to live?
LCH011 Frequency PercentCumulativeFrequency
CumulativePercent
0 No 4461 96.92 4461 96.92
1 Yes 142 3.08 4603 100.00
H12a Stayed with relatives due to not having a permanent place to live
LCH012A Frequency PercentCumulativeFrequency
CumulativePercent
. 4461 96.92 4461 96.92
0 Not applicable 61 1.33 4522 98.24
1 Applicable 81 1.76 4603 100.00
H12b Stayed at a friend's house due to not having a permanent place to live
LCH012B Frequency PercentCumulativeFrequency
CumulativePercent
. 4461 96.92 4461 96.92
0 Not applicable 50 1.09 4511 98.00
1 Applicable 92 2.00 4603 100.00
NCVER 119
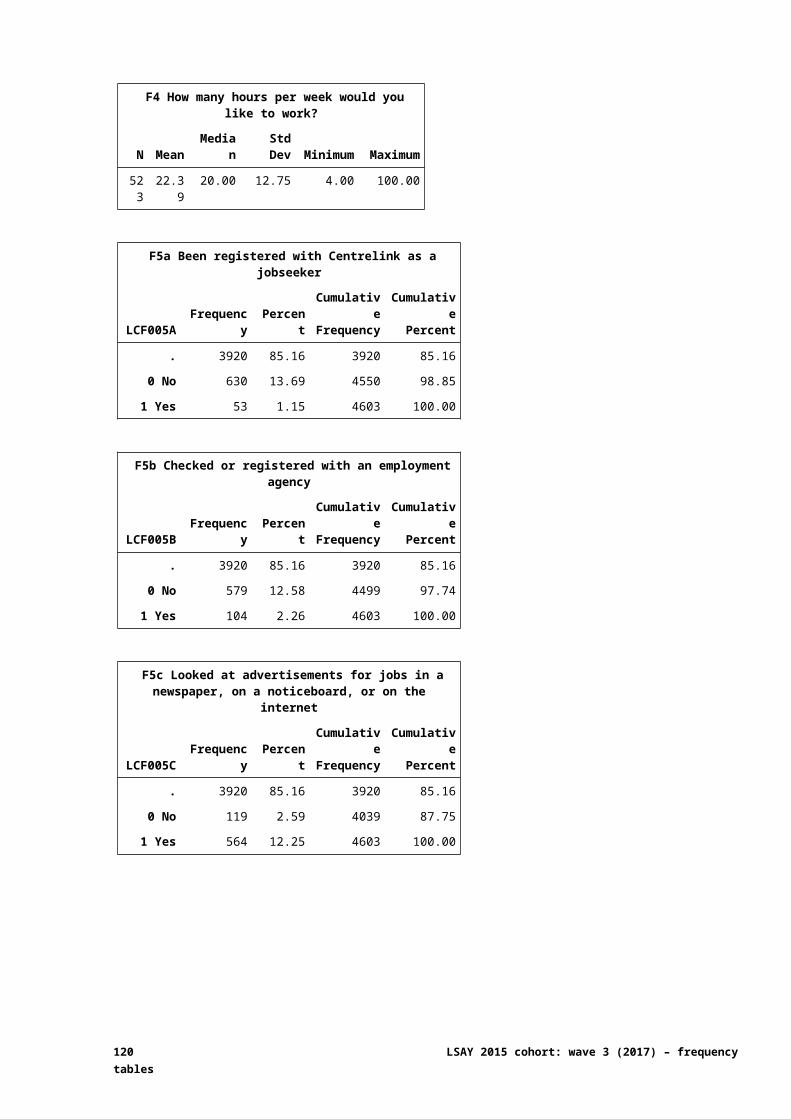
H12c Stayed in a caravan due to not having a permanent place to live
LCH012C Frequency PercentCumulativeFrequency
CumulativePercent
. 4461 96.92 4461 96.92
0 Not applicable 121 2.63 4582 99.54
1 Applicable 21 0.46 4603 100.00
H12d Stayed at a boarding house/ hostel due to not having a permanent place to live
LCH012D Frequency PercentCumulativeFrequency
CumulativePercent
. 4461 96.92 4461 96.92
0 Not applicable 127 2.76 4588 99.67
1 Applicable 15 0.33 4603 100.00
H12e Stayed in a night shelter due to not having a permanent place to live
LCH012E Frequency PercentCumulativeFrequency
CumulativePercent
. 4461 96.92 4461 96.92
0 Not applicable 139 3.02 4600 99.93
1 Applicable 3 0.07 4603 100.00
H12f Stayed in a shelter for the homeless due to not having a permanent place to live
LCH012F Frequency PercentCumulativeFrequency
CumulativePercent
. 4461 96.92 4461 96.92
0 Not applicable 139 3.02 4600 99.93
1 Applicable 3 0.07 4603 100.00
H12g Stayed at a refuge due to not having a permanent place to live
LCH012G Frequency PercentCumulativeFrequency
CumulativePercent
. 4461 96.92 4461 96.92
0 Not applicable 134 2.91 4595 99.83
1 Applicable 8 0.17 4603 100.00
120 LSAY 2015 cohort: wave 3 (2017) – frequency tables
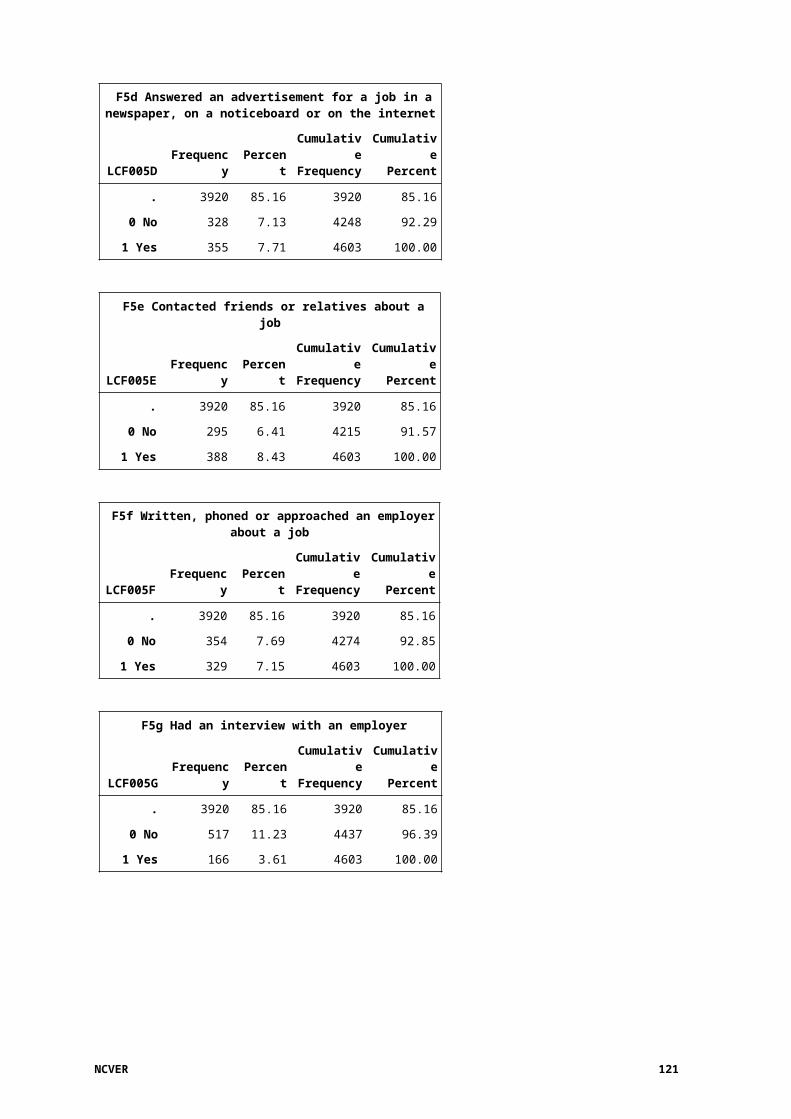
H12h Squatted in an abandoned building due to not having a permanent place to live
LCH012H Frequency PercentCumulativeFrequency
CumulativePercent
. 4461 96.92 4461 96.92
0 Not applicable 140 3.04 4601 99.96
1 Applicable 2 0.04 4603 100.00
H12i Slept rough due to not having a permanent place to live
LCH012I Frequency PercentCumulativeFrequency
CumulativePercent
. 4461 96.92 4461 96.92
0 Not applicable 123 2.67 4584 99.59
1 Applicable 19 0.41 4603 100.00
H12j Stayed in a detention centre due to not having a permanent place to live
LCH012J Frequency PercentCumulativeFrequency
CumulativePercent
. 4461 96.92 4461 96.92
0 Not applicable 141 3.06 4602 99.98
1 Applicable 1 0.02 4603 100.00
H12k Other circumstance due to not having a permanent place to live
LCH012K Frequency PercentCumulativeFrequency
CumulativePercent
. 4461 96.92 4461 96.92
0 Not applicable 133 2.89 4594 99.80
1 Applicable 9 0.20 4603 100.00
H12l None of the above
LCH012L Frequency PercentCumulativeFrequency
CumulativePercent
. 4461 96.92 4461 96.92
0 Not applicable 140 3.04 4601 99.96
1 Applicable 2 0.04 4603 100.00
NCVER 121
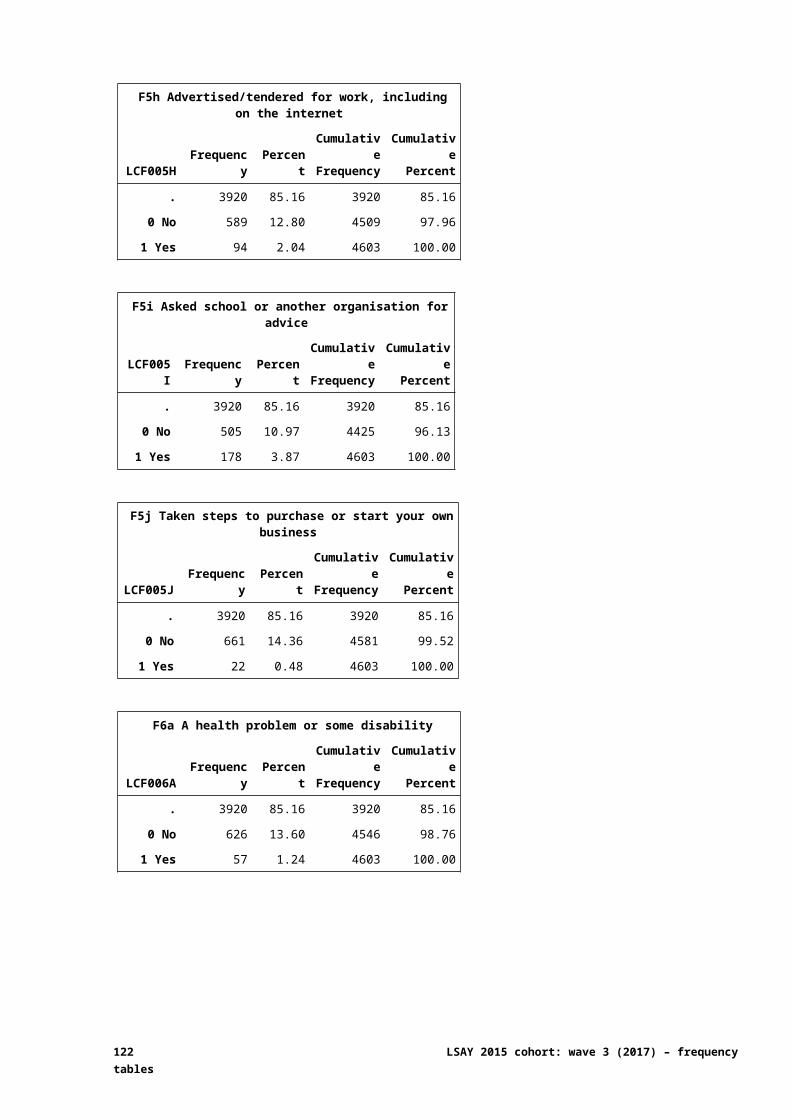
H12m No response (Prefer not to say)
LCH012M Frequency PercentCumulativeFrequency
CumulativePercent
. 4461 96.92 4461 96.92
0 Not applicable 139 3.02 4600 99.93
1 Applicable 3 0.07 4603 100.00
H13 How many times have you been without a permanent place to live?
LCH013 Frequency PercentCumulativeFrequency
CumulativePercent
. 4463 96.96 4463 96.96
1 Once 64 1.39 4527 98.35
2 Twice 28 0.61 4555 98.96
3 Three times 10 0.22 4565 99.17
4 Four times 5 0.11 4570 99.28
5 Five times or more 18 0.39 4588 99.67
98 Prefer not to say 15 0.33 4603 100.00
H14 What led you to being with a permanent place to live the most recent time?
LCH014 Frequency PercentCumulativeFrequency
CumulativePercent
. 4463 96.96 4463 96.96
1 Parent unemployment / parent became homeless / parent unable to find suitable housing
29 0.63 4492 97.59
2 Conflict with parents 27 0.59 4519 98.18
3 Family breakdown / conflict between parents 24 0.52 4543 98.70
4 Unable to be cared for by parents 9 0.20 4552 98.89
5 Emergency / Flood / House fire 4 0.09 4556 98.98
95 Other 16 0.35 4572 99.33
98 Prefer not to say 31 0.67 4603 100.00
122 LSAY 2015 cohort: wave 3 (2017) – frequency tables
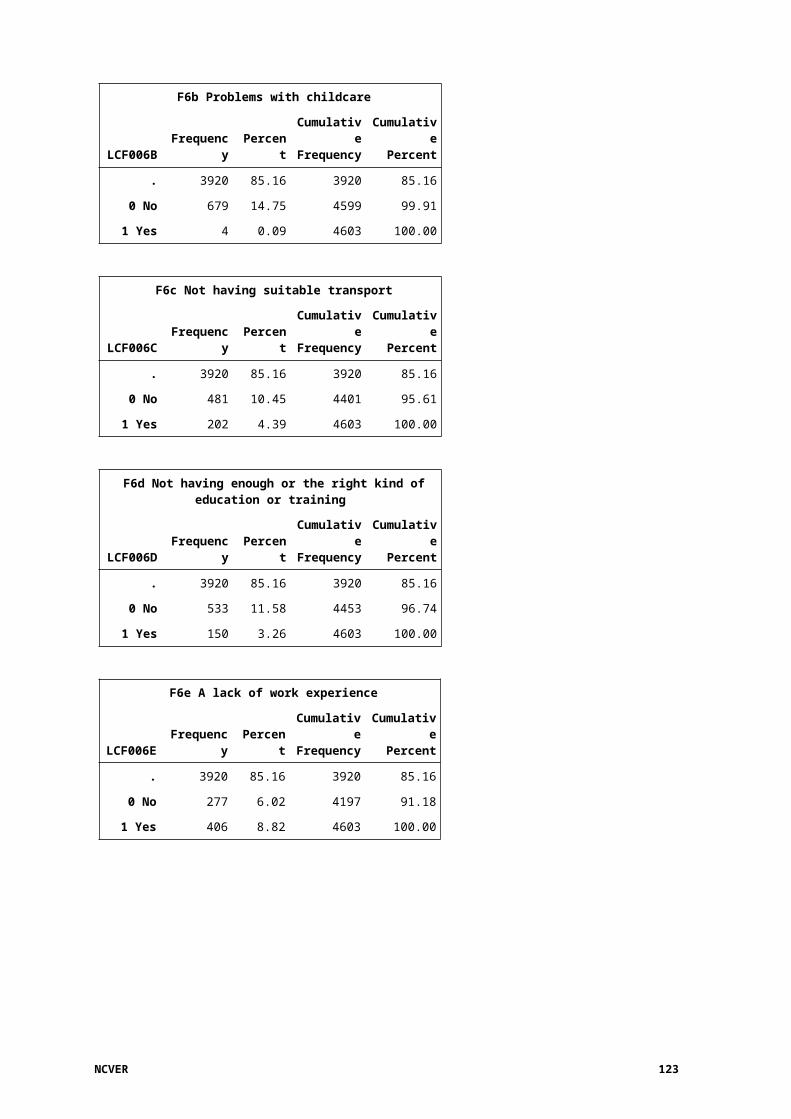
H15 When was this?
LCH015 Frequency PercentCumulativeFrequency
CumulativePercent
. 4463 96.96 4463 96.96
1 Currently 10 0.22 4473 97.18
2 Less than 12 months ago but not currently 53 1.15 4526 98.33
3 Twelve months to less than 2 years 23 0.50 4549 98.83
4 Two years to less than 5 years 20 0.43 4569 99.26
5 Five years to less than 10 years 18 0.39 4587 99.65
6 Ten years or more 9 0.20 4596 99.85
98 Prefer not to say 7 0.15 4603 100.00
H16 For how long were you without a permanent place to live the most recent time?
LCH016 Frequency PercentCumulativeFrequency
CumulativePercent
. 4463 96.96 4463 96.96
1 Less than one week 16 0.35 4479 97.31
2 One week to less than 2 weeks 21 0.46 4500 97.76
3 Two weeks to less than 1 month 20 0.43 4520 98.20
4 One month to less than 2 months 15 0.33 4535 98.52
5 Two months to less than 3 months 15 0.33 4550 98.85
6 Three months to less than 6 months 18 0.39 4568 99.24
7 Six months to less than 1 year 10 0.22 4578 99.46
8 One year or more 11 0.24 4589 99.70
98 Prefer not to say 14 0.30 4603 100.00
H17a Sought assistance from housing service providers
LCH017A Frequency PercentCumulativeFrequency
CumulativePercent
. 4463 96.96 4463 96.96
0 Not applicable 117 2.54 4580 99.50
1 Applicable 23 0.50 4603 100.00
H17b Sought assistance from crisis accommodation / supported accommodation
LCH017B Frequency PercentCumulativeFrequency
CumulativePercent
. 4463 96.96 4463 96.96
0 Not applicable 122 2.65 4585 99.61
1 Applicable 18 0.39 4603 100.00
NCVER 123
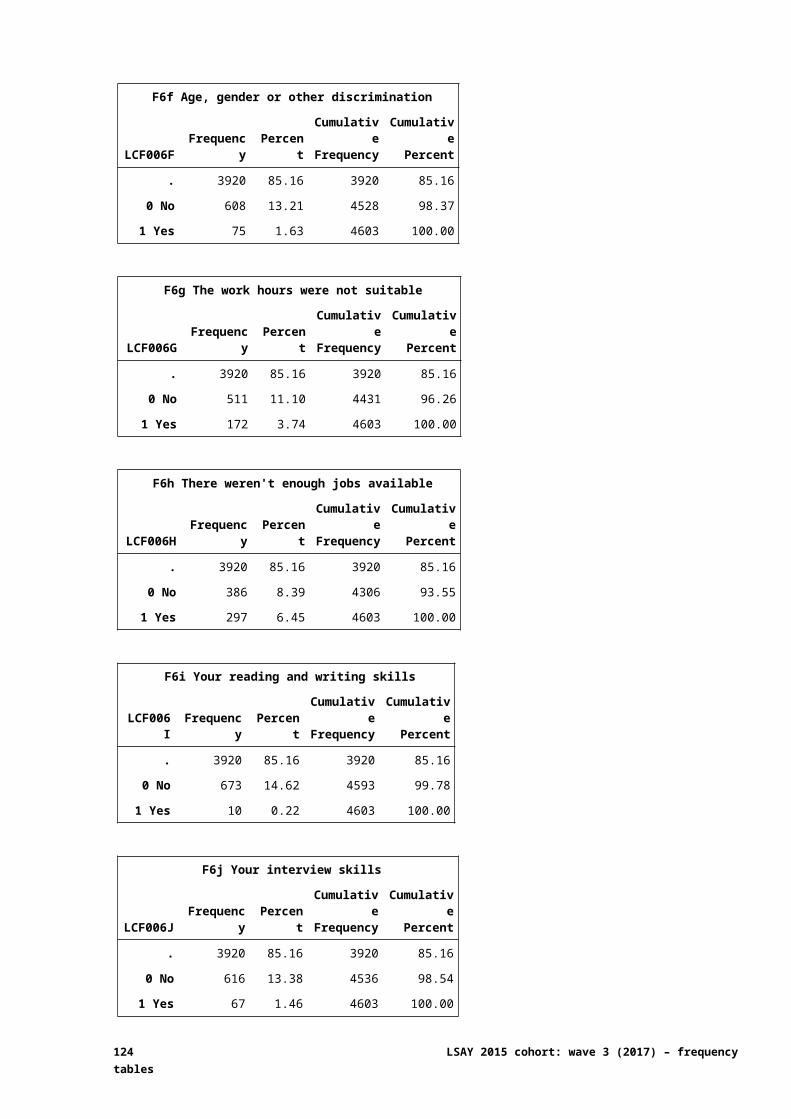
H17c Sought assistance from mental health service
LCH017C Frequency PercentCumulativeFrequency
CumulativePercent
. 4463 96.96 4463 96.96
0 Not applicable 117 2.54 4580 99.50
1 Applicable 23 0.50 4603 100.00
H17d Sought assistance from church or community organisation
LCH017D Frequency PercentCumulativeFrequency
CumulativePercent
. 4463 96.96 4463 96.96
0 Not applicable 127 2.76 4590 99.72
1 Applicable 13 0.28 4603 100.00
H17e Sought assistance from health service
LCH017E Frequency PercentCumulativeFrequency
CumulativePercent
. 4463 96.96 4463 96.96
0 Not applicable 132 2.87 4595 99.83
1 Applicable 8 0.17 4603 100.00
H17f Sought assistance from job service
LCH017F Frequency PercentCumulativeFrequency
CumulativePercent
. 4463 96.96 4463 96.96
0 Not applicable 137 2.98 4600 99.93
1 Applicable 3 0.07 4603 100.00
H17g Sought assistance from counselling service
LCH017G Frequency PercentCumulativeFrequency
CumulativePercent
. 4463 96.96 4463 96.96
0 Not applicable 115 2.50 4578 99.46
1 Applicable 25 0.54 4603 100.00
H17h Sought assistance from solicitor / legal aid
LCH017H Frequency PercentCumulativeFrequency
CumulativePercent
. 4463 96.96 4463 96.96
0 Not applicable 130 2.82 4593 99.78
1 Applicable 10 0.22 4603 100.00
124 LSAY 2015 cohort: wave 3 (2017) – frequency tables
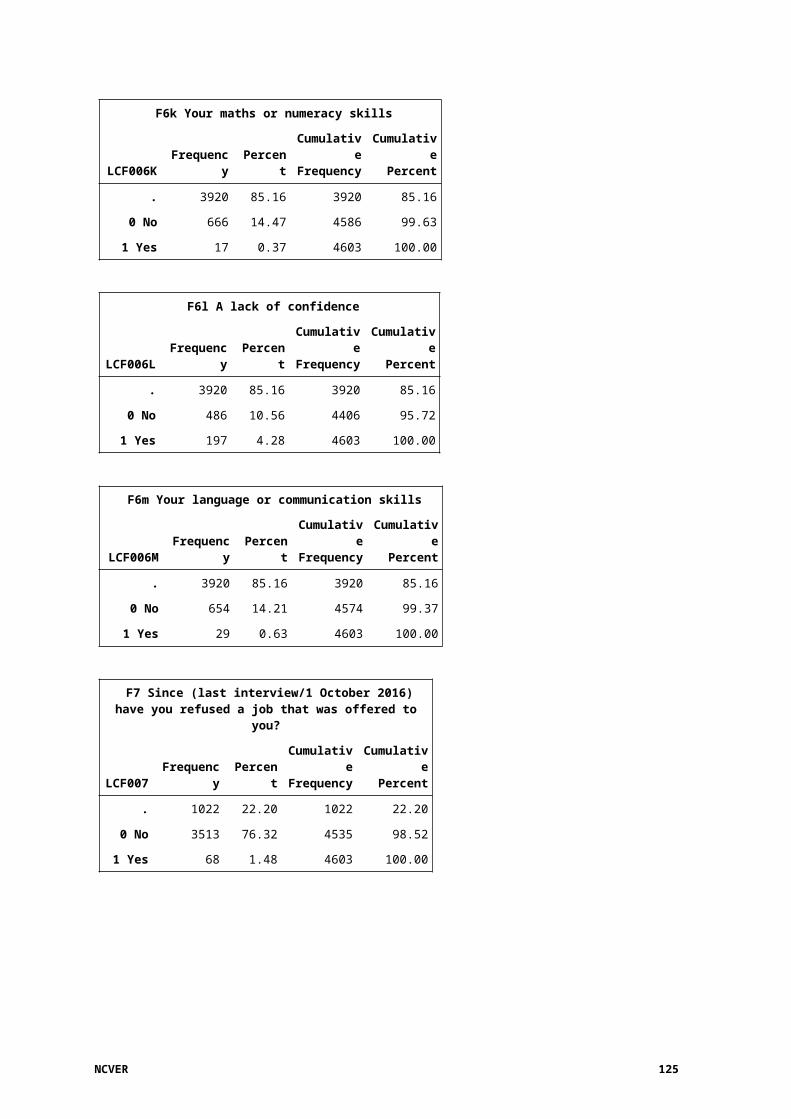
H17i Sought assistance from Member of Parliament
LCH017I Frequency PercentCumulativeFrequency
CumulativePercent
. 4463 96.96 4463 96.96
0 Not applicable 137 2.98 4600 99.93
1 Applicable 3 0.07 4603 100.00
H17j Sought assistance from hospital
LCH017J Frequency PercentCumulativeFrequency
CumulativePercent
. 4463 96.96 4463 96.96
0 Not applicable 135 2.93 4598 99.89
1 Applicable 5 0.11 4603 100.00
H17k Sought assistance from police
LCH017K Frequency PercentCumulativeFrequency
CumulativePercent
. 4463 96.96 4463 96.96
0 Not applicable 128 2.78 4591 99.74
1 Applicable 12 0.26 4603 100.00
H17l Sought assistance from other service
LCH017L Frequency PercentCumulativeFrequency
CumulativePercent
. 4463 96.96 4463 96.96
0 Not applicable 126 2.74 4589 99.70
1 Applicable 14 0.30 4603 100.00
H17m None of the above
LCH017M Frequency PercentCumulativeFrequency
CumulativePercent
. 4463 96.96 4463 96.96
0 Not applicable 83 1.80 4546 98.76
1 Applicable 57 1.24 4603 100.00
H17n Prefer not to say
LCH017N Frequency PercentCumulativeFrequency
CumulativePercent
. 4463 96.96 4463 96.96
0 Not applicable 129 2.80 4592 99.76
1 Applicable 11 0.24 4603 100.00
NCVER 125
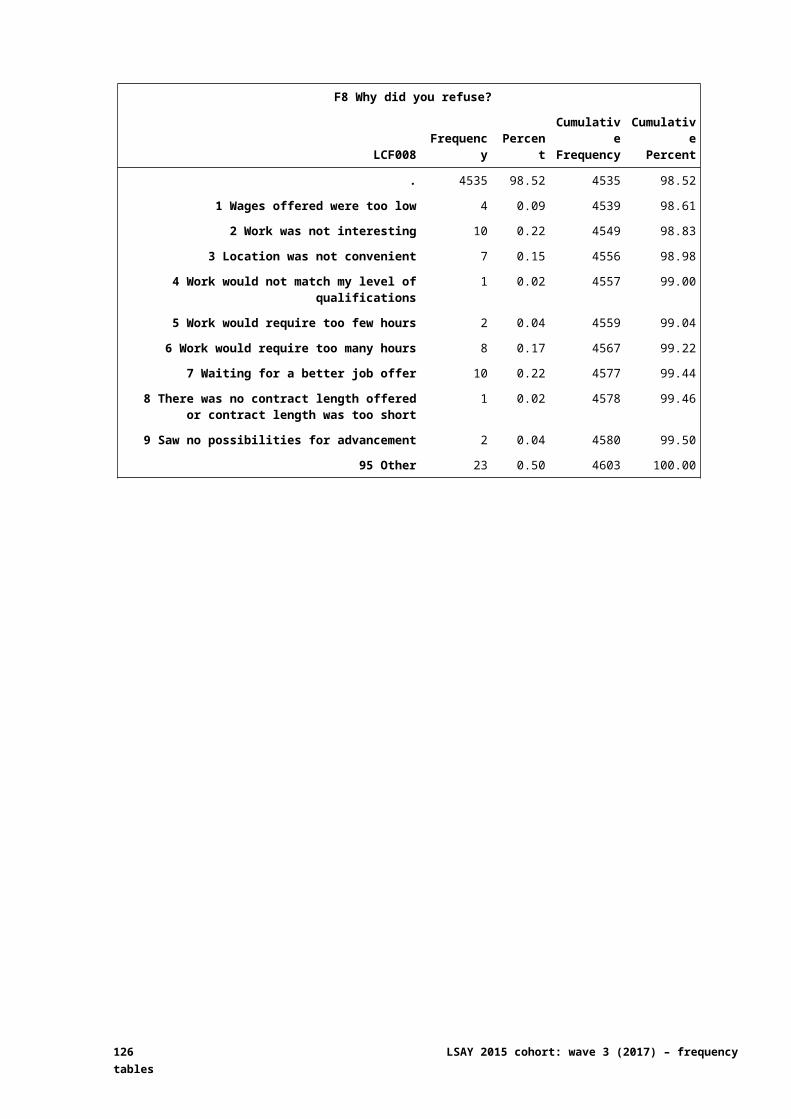
H18a Reasons for not seeking assistance from services - did not know of any
LCH018A Frequency PercentCumulativeFrequency
CumulativePercent
. 4546 98.76 4546 98.76
0 Not applicable 50 1.09 4596 99.85
1 Applicable 7 0.15 4603 100.00
H18b Reasons for not seeking assistance from services - do not trust support services
LCH018B Frequency PercentCumulativeFrequency
CumulativePercent
. 4546 98.76 4546 98.76
0 Not applicable 53 1.15 4599 99.91
1 Applicable 4 0.09 4603 100.00
H18c Reasons for not seeking assistance from services - could not find one
LCH018C Frequency PercentCumulativeFrequency
CumulativePercent
. 4546 98.76 4546 98.76
0 Not applicable 55 1.19 4601 99.96
1 Applicable 2 0.04 4603 100.00
H18d Reasons for not seeking assistance from services - service was full
LCH018D Frequency PercentCumulativeFrequency
CumulativePercent
. 4546 98.76 4546 98.76
0 Not applicable 56 1.22 4602 99.98
1 Applicable 1 0.02 4603 100.00
H18e Reasons for not seeking assistance from services - refused help
LCH018E Frequency PercentCumulativeFrequency
CumulativePercent
. 4546 98.76 4546 98.76
0 Not applicable 50 1.09 4596 99.85
1 Applicable 7 0.15 4603 100.00
126 LSAY 2015 cohort: wave 3 (2017) – frequency tables
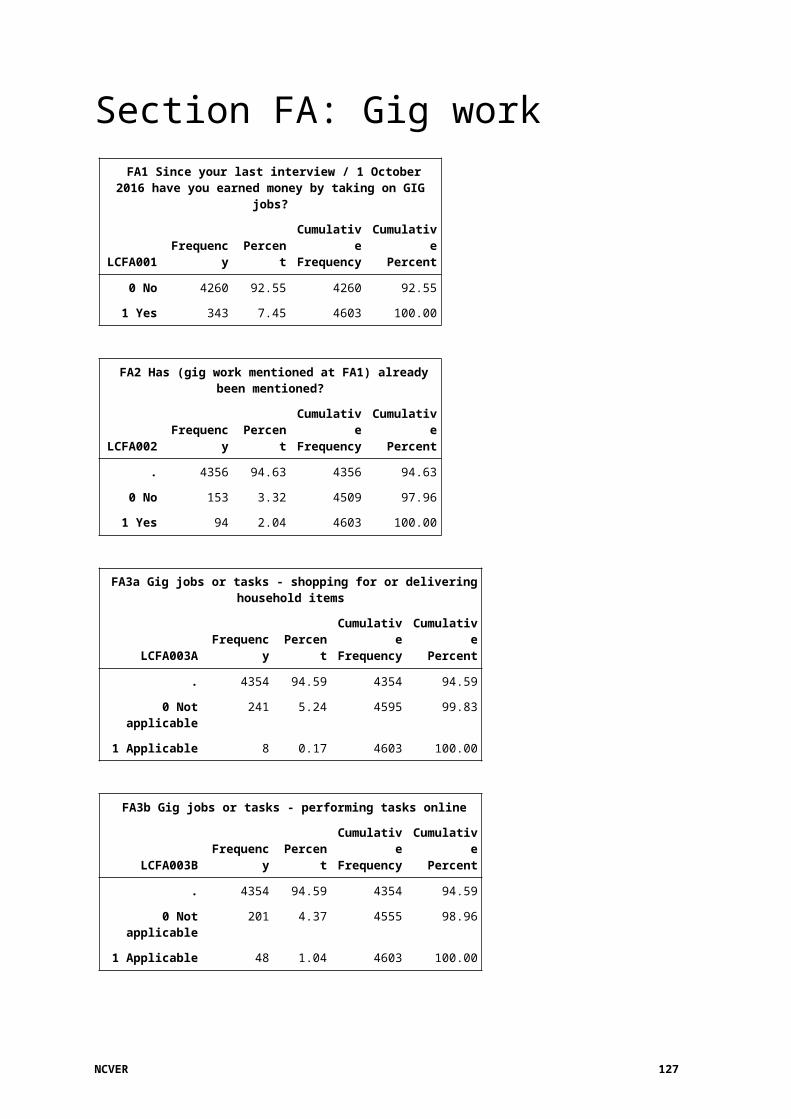
H18f Reasons for not seeking assistance from services - bad experience with service in the past
LCH018F Frequency PercentCumulativeFrequency
CumulativePercent
. 4546 98.76 4546 98.76
0 Not applicable 57 1.24 4603 100.00
H18g Reasons for not seeking assistance from services - no need / not required
LCH018G Frequency PercentCumulativeFrequency
CumulativePercent
. 4546 98.76 4546 98.76
0 Not applicable 25 0.54 4571 99.30
1 Applicable 32 0.70 4603 100.00
H18h Other reason for not seeking assistance from services
LCH018H Frequency PercentCumulativeFrequency
CumulativePercent
. 4546 98.76 4546 98.76
0 Not applicable 52 1.13 4598 99.89
1 Applicable 5 0.11 4603 100.00
H18i Prefer not to say
LCH018I Frequency PercentCumulativeFrequency
CumulativePercent
. 4546 98.76 4546 98.76
0 Not applicable 52 1.13 4598 99.89
1 Applicable 5 0.11 4603 100.00
H19a Do you feel that housing service helped you?
LCH019A Frequency PercentCumulativeFrequency
CumulativePercent
. 4580 99.50 4580 99.50
0 No 13 0.28 4593 99.78
1 Yes 10 0.22 4603 100.00
H19b Do you feel that crisis accommodation / supported accommodation helped you?
LCH019B Frequency PercentCumulativeFrequency
CumulativePercent
. 4585 99.61 4585 99.61
0 No 7 0.15 4592 99.76
1 Yes 11 0.24 4603 100.00
NCVER 127
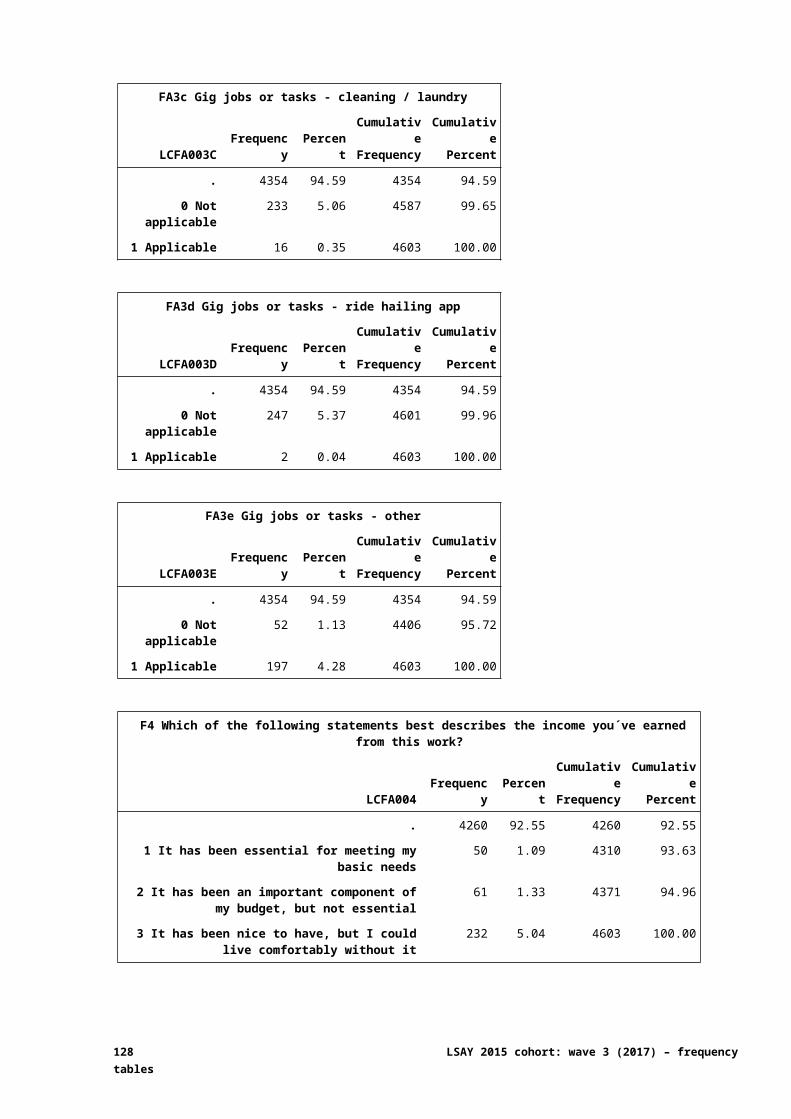
H19c Do you feel that mental health service helped you?
LCH019C Frequency PercentCumulativeFrequency
CumulativePercent
. 4580 99.50 4580 99.50
0 No 7 0.15 4587 99.65
1 Yes 16 0.35 4603 100.00
H19d Do you feel that church or community organisation helped you?
LCH019D Frequency PercentCumulativeFrequency
CumulativePercent
. 4590 99.72 4590 99.72
0 No 4 0.09 4594 99.80
1 Yes 9 0.20 4603 100.00
H19e Do you feel that health service helped you?
LCH019E Frequency PercentCumulativeFrequency
CumulativePercent
. 4595 99.83 4595 99.83
0 No 1 0.02 4596 99.85
1 Yes 7 0.15 4603 100.00
H19f Do you feel that job service helped you?
LCH019F Frequency PercentCumulativeFrequency
CumulativePercent
. 4600 99.93 4600 99.93
0 No 2 0.04 4602 99.98
1 Yes 1 0.02 4603 100.00
H19g Do you feel that counselling service helped you?
LCH019G Frequency PercentCumulativeFrequency
CumulativePercent
. 4578 99.46 4578 99.46
0 No 3 0.07 4581 99.52
1 Yes 22 0.48 4603 100.00
128 LSAY 2015 cohort: wave 3 (2017) – frequency tables
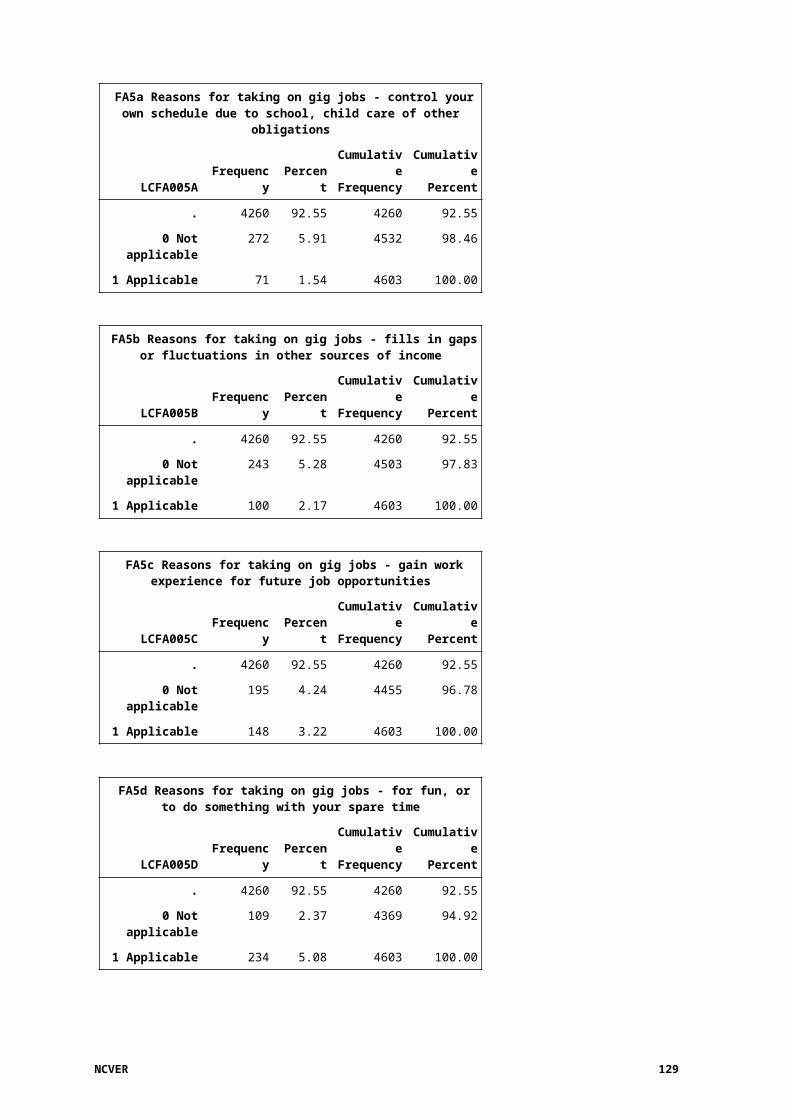
H19h Do you feel that solicitor / legal aid helped you?
LCH019H Frequency PercentCumulativeFrequency
CumulativePercent
. 4593 99.78 4593 99.78
0 No 3 0.07 4596 99.85
1 Yes 7 0.15 4603 100.00
H19i Do you feel that Member of Parliament helped you?
LCH019I Frequency PercentCumulativeFrequency
CumulativePercent
. 4600 99.93 4600 99.93
0 No 2 0.04 4602 99.98
1 Yes 1 0.02 4603 100.00
H19j Do you feel that hospital helped you?
LCH019J Frequency PercentCumulativeFrequency
CumulativePercent
. 4598 99.89 4598 99.89
1 Yes 5 0.11 4603 100.00
H19k Do you feel that the police helped you?
LCH019K Frequency PercentCumulativeFrequency
CumulativePercent
. 4591 99.74 4591 99.74
0 No 5 0.11 4596 99.85
1 Yes 7 0.15 4603 100.00
H19l Do you feel that the (other service) helped you?
LCH019L Frequency PercentCumulativeFrequency
CumulativePercent
. 4589 99.70 4589 99.70
0 No 3 0.07 4592 99.76
1 Yes 11 0.24 4603 100.00
NCVER 129
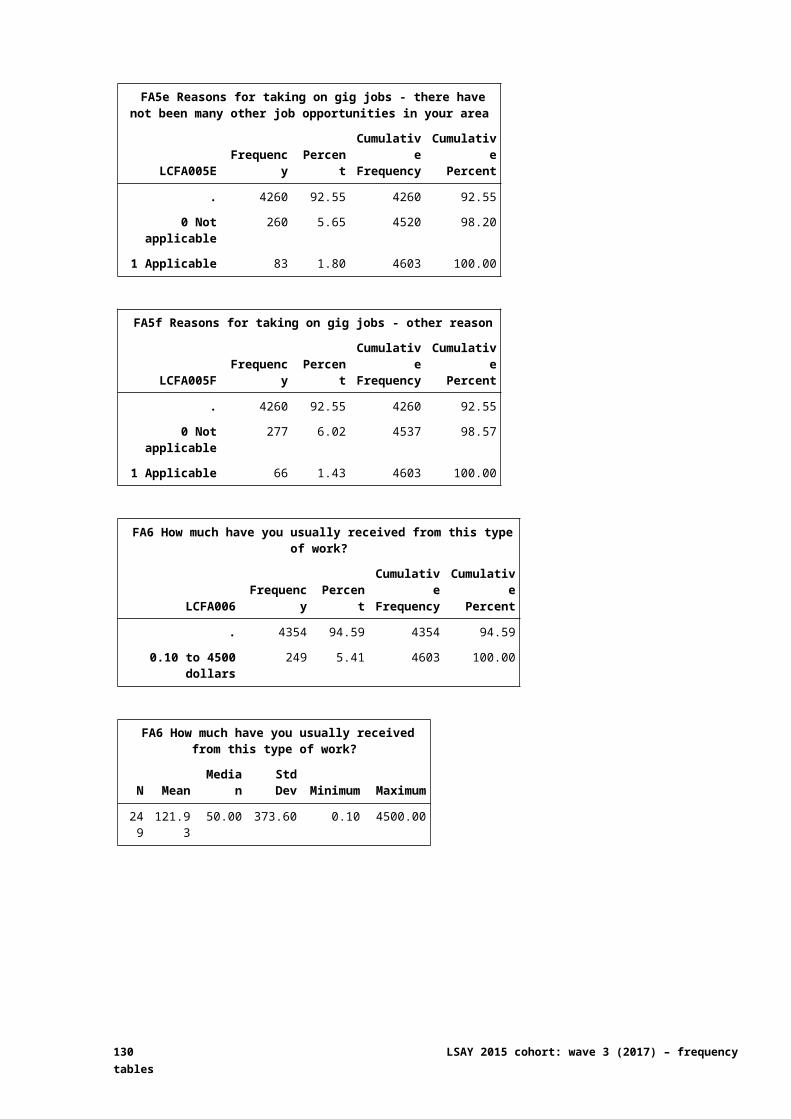
Section J: General attitudesJ1a I am good at coming up with new ideas
LCJ001A Frequency PercentCumulativeFrequency
CumulativePercent
0 - Nothing like me 21 0.46 21 0.46
1 7 0.15 28 0.61
2 27 0.59 55 1.19
3 72 1.56 127 2.76
4 141 3.06 268 5.82
5 543 11.80 811 17.62
6 690 14.99 1501 32.61
7 1271 27.61 2772 60.22
8 1109 24.09 3881 84.31
9 329 7.15 4210 91.46
10 - Exactly like me 393 8.54 4603 100.00
J1b I have a good imagination
LCJ001B Frequency PercentCumulativeFrequency
CumulativePercent
0 - Nothing like me 20 0.43 20 0.43
1 6 0.13 26 0.56
2 47 1.02 73 1.59
3 107 2.32 180 3.91
4 171 3.71 351 7.63
5 421 9.15 772 16.77
6 589 12.80 1361 29.57
7 939 20.40 2300 49.97
8 1059 23.01 3359 72.97
9 554 12.04 3913 85.01
10 - Exactly like me 690 14.99 4603 100.00
130 LSAY 2015 cohort: wave 3 (2017) – frequency tables
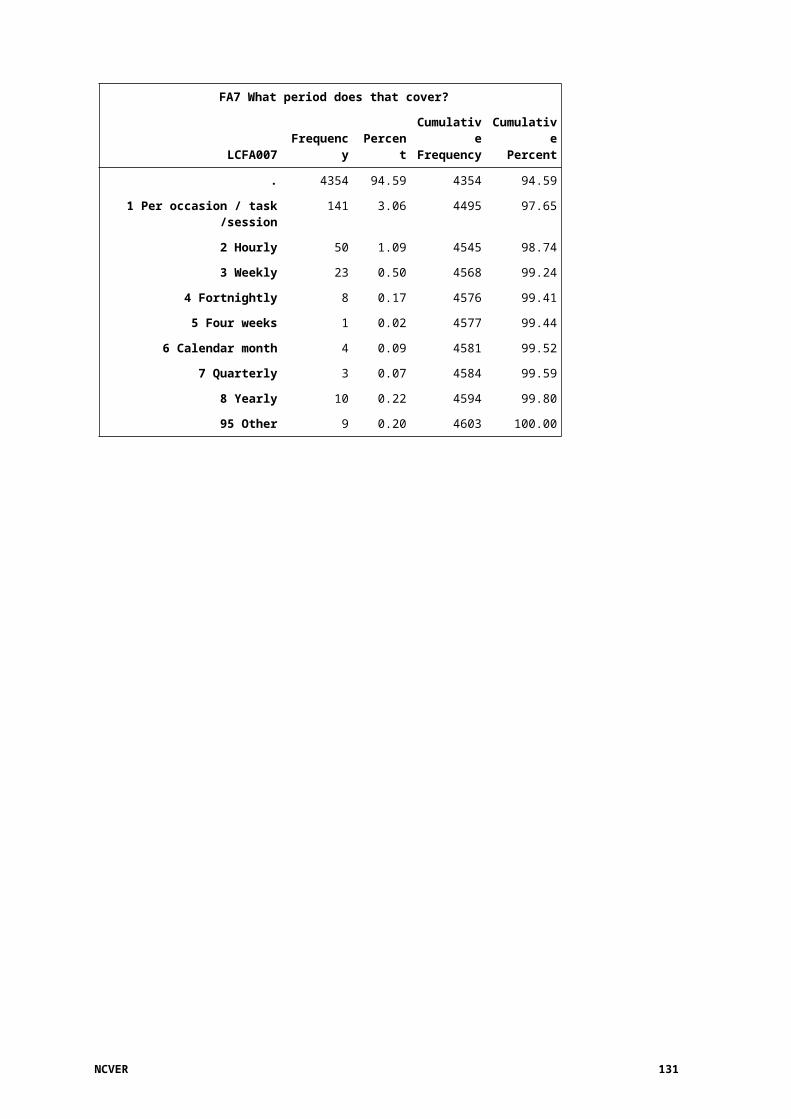
J1c I can generally see a way out of problem situations
LCJ001C Frequency PercentCumulativeFrequency
CumulativePercent
0 - Nothing like me 9 0.20 9 0.20
1 11 0.24 20 0.43
2 24 0.52 44 0.96
3 63 1.37 107 2.32
4 123 2.67 230 5.00
5 406 8.82 636 13.82
6 593 12.88 1229 26.70
7 1174 25.51 2403 52.21
8 1217 26.44 3620 78.64
9 615 13.36 4235 92.01
10 - Exactly like me 368 7.99 4603 100.00
J1d When I make decisions I am happy with them later
LCJ001D Frequency PercentCumulativeFrequency
CumulativePercent
0 - Nothing like me 18 0.39 18 0.39
1 15 0.33 33 0.72
2 48 1.04 81 1.76
3 121 2.63 202 4.39
4 230 5.00 432 9.39
5 828 17.99 1260 27.37
6 791 17.18 2051 44.56
7 1120 24.33 3171 68.89
8 925 20.10 4096 88.99
9 310 6.73 4406 95.72
10 - Exactly like me 197 4.28 4603 100.00
NCVER 131
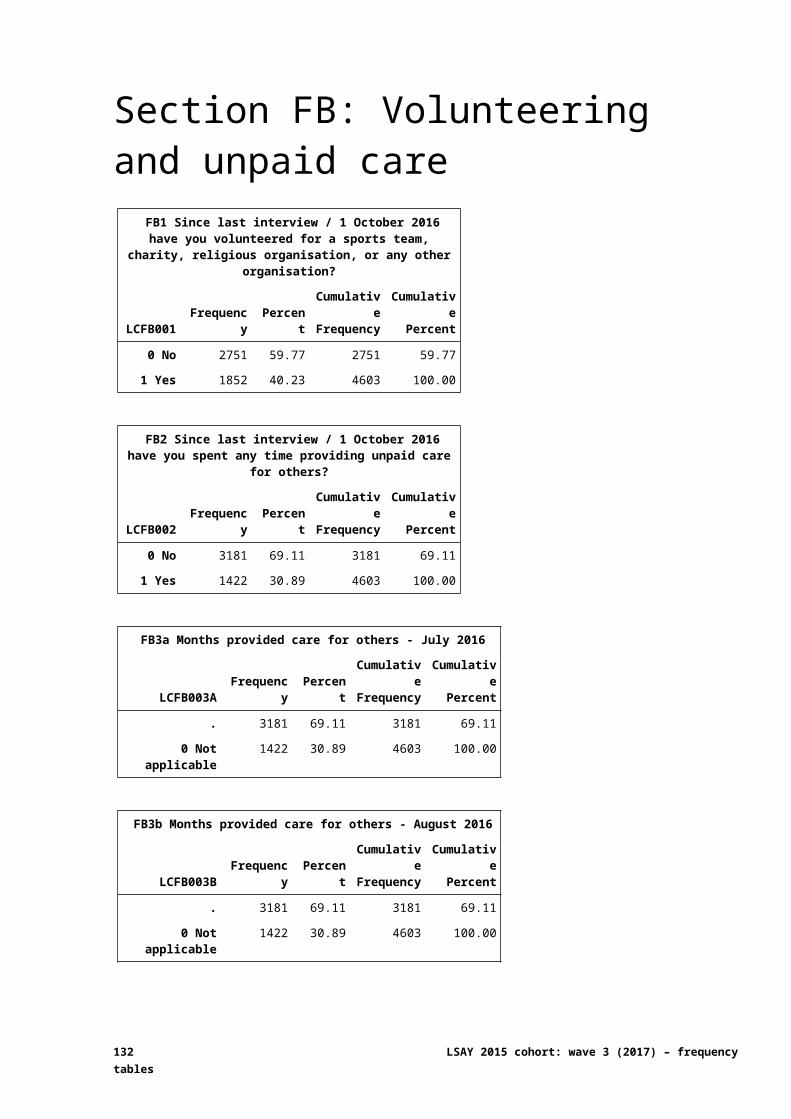
J1e I have a lot of good ideas
LCJ001E Frequency PercentCumulativeFrequency
CumulativePercent
0 - Nothing like me 13 0.28 13 0.28
1 13 0.28 26 0.56
2 27 0.59 53 1.15
3 90 1.96 143 3.11
4 190 4.13 333 7.23
5 726 15.77 1059 23.01
6 953 20.70 2012 43.71
7 1188 25.81 3200 69.52
8 882 19.16 4082 88.68
9 292 6.34 4374 95.02
10 - Exactly like me 229 4.98 4603 100.00
J1f I see problems as challenges to overcome
LCJ001F Frequency PercentCumulativeFrequency
CumulativePercent
0 - Nothing like me 36 0.78 36 0.78
1 26 0.56 62 1.35
2 81 1.76 143 3.11
3 158 3.43 301 6.54
4 287 6.24 588 12.77
5 620 13.47 1208 26.24
6 730 15.86 1938 42.10
7 968 21.03 2906 63.13
8 855 18.57 3761 81.71
9 424 9.21 4185 90.92
10 - Exactly like me 418 9.08 4603 100.00
132 LSAY 2015 cohort: wave 3 (2017) – frequency tables

J1g I compare the strengths and weaknesses of different ideas
LCJ001G Frequency PercentCumulativeFrequency
CumulativePercent
0 - Nothing like me 46 1.00 46 1.00
1 21 0.46 67 1.46
2 55 1.19 122 2.65
3 118 2.56 240 5.21
4 201 4.37 441 9.58
5 592 12.86 1033 22.44
6 589 12.80 1622 35.24
7 897 19.49 2519 54.73
8 987 21.44 3506 76.17
9 580 12.60 4086 88.77
10 - Exactly like me 517 11.23 4603 100.00
J1h I use logic to make my own decisions even if they are different from others
LCJ001H Frequency PercentCumulativeFrequency
CumulativePercent
0 - Nothing like me 14 0.30 14 0.30
1 11 0.24 25 0.54
2 17 0.37 42 0.91
3 59 1.28 101 2.19
4 112 2.43 213 4.63
5 383 8.32 596 12.95
6 507 11.01 1103 23.96
7 910 19.77 2013 43.73
8 1095 23.79 3108 67.52
9 728 15.82 3836 83.34
10 - Exactly like me 767 16.66 4603 100.00
NCVER 133
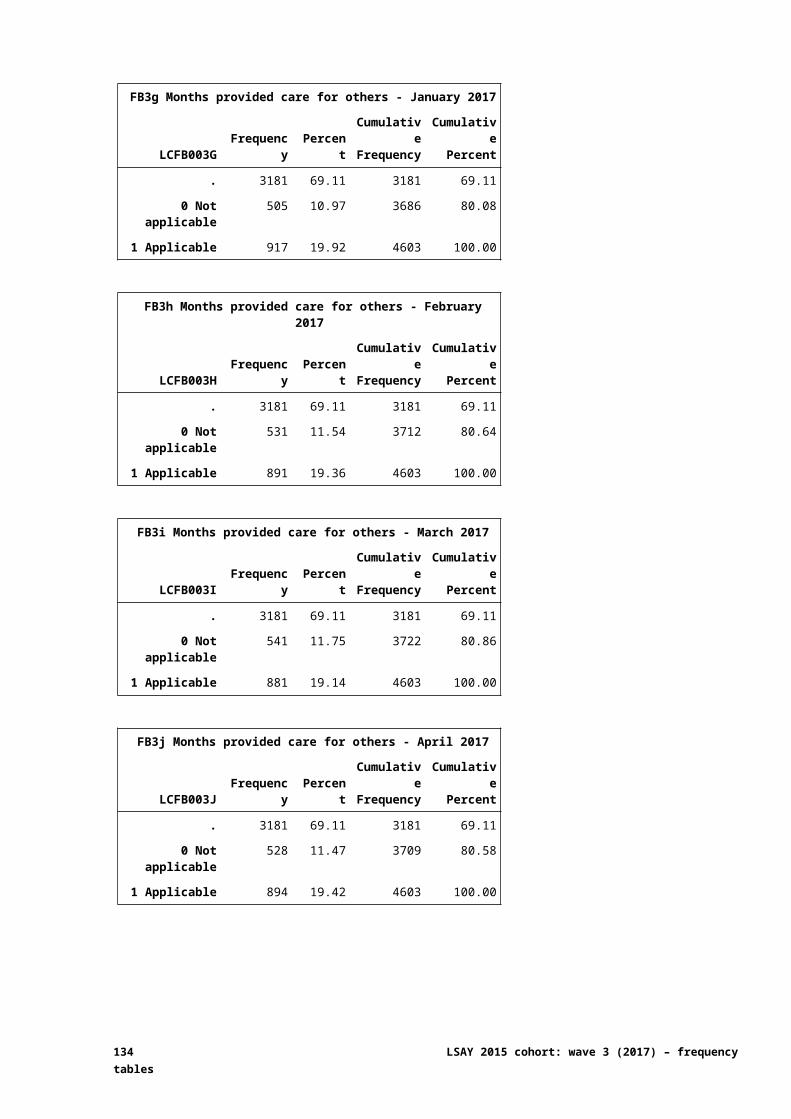
J1i I think carefully before reaching conclusions
LCJ001I Frequency PercentCumulativeFrequency
CumulativePercent
0 - Nothing like me 29 0.63 29 0.63
1 25 0.54 54 1.17
2 63 1.37 117 2.54
3 125 2.72 242 5.26
4 248 5.39 490 10.65
5 536 11.64 1026 22.29
6 685 14.88 1711 37.17
7 936 20.33 2647 57.51
8 909 19.75 3556 77.25
9 558 12.12 4114 89.38
10 - Exactly like me 489 10.62 4603 100.00
J2a I express hope about group success
LCJ002A Frequency PercentCumulativeFrequency
CumulativePercent
0 - Nothing like me 48 1.04 48 1.04
1 13 0.28 61 1.33
2 46 1.00 107 2.32
3 103 2.24 210 4.56
4 166 3.61 376 8.17
5 579 12.58 955 20.75
6 671 14.58 1626 35.32
7 1026 22.29 2652 57.61
8 1019 22.14 3671 79.75
9 473 10.28 4144 90.03
10 - Exactly like me 459 9.97 4603 100.00
134 LSAY 2015 cohort: wave 3 (2017) – frequency tables

J2b I fulfil individual roles assigned by the group
LCJ002B Frequency PercentCumulativeFrequency
CumulativePercent
0 - Nothing like me 11 0.24 11 0.24
1 2 0.04 13 0.28
2 11 0.24 24 0.52
3 29 0.63 53 1.15
4 72 1.56 125 2.72
5 260 5.65 385 8.36
6 371 8.06 756 16.42
7 863 18.75 1619 35.17
8 1198 26.03 2817 61.20
9 882 19.16 3699 80.36
10 - Exactly like me 904 19.64 4603 100.00
J2c I stay focussed on the task during group work
LCJ002C Frequency PercentCumulativeFrequency
CumulativePercent
0 - Nothing like me 22 0.48 22 0.48
1 10 0.22 32 0.70
2 42 0.91 74 1.61
3 104 2.26 178 3.87
4 163 3.54 341 7.41
5 407 8.84 748 16.25
6 573 12.45 1321 28.70
7 966 20.99 2287 49.68
8 1095 23.79 3382 73.47
9 679 14.75 4061 88.23
10 - Exactly like me 542 11.77 4603 100.00
NCVER 135
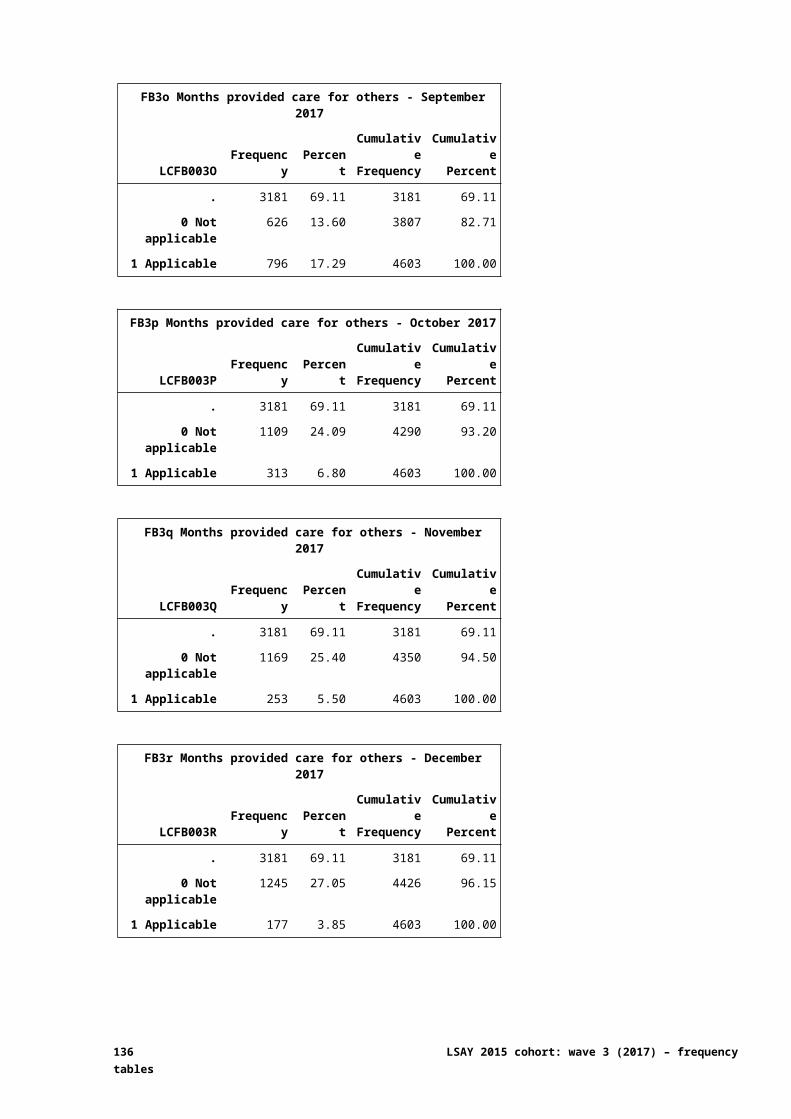
J2d I am good at presenting a talk to a group of acquaintances
LCJ002D Frequency PercentCumulativeFrequency
CumulativePercent
0 - Nothing like me 129 2.80 129 2.80
1 65 1.41 194 4.21
2 166 3.61 360 7.82
3 265 5.76 625 13.58
4 309 6.71 934 20.29
5 497 10.80 1431 31.09
6 490 10.65 1921 41.73
7 673 14.62 2594 56.35
8 735 15.97 3329 72.32
9 577 12.54 3906 84.86
10 - Exactly like me 697 15.14 4603 100.00
J2e I am good at talking one-on-one with an acquaintance
LCJ002E Frequency PercentCumulativeFrequency
CumulativePercent
0 - Nothing like me 33 0.72 33 0.72
1 23 0.50 56 1.22
2 35 0.76 91 1.98
3 75 1.63 166 3.61
4 132 2.87 298 6.47
5 275 5.97 573 12.45
6 385 8.36 958 20.81
7 737 16.01 1695 36.82
8 991 21.53 2686 58.35
9 859 18.66 3545 77.01
10 - Exactly like me 1058 22.99 4603 100.00
136 LSAY 2015 cohort: wave 3 (2017) – frequency tables
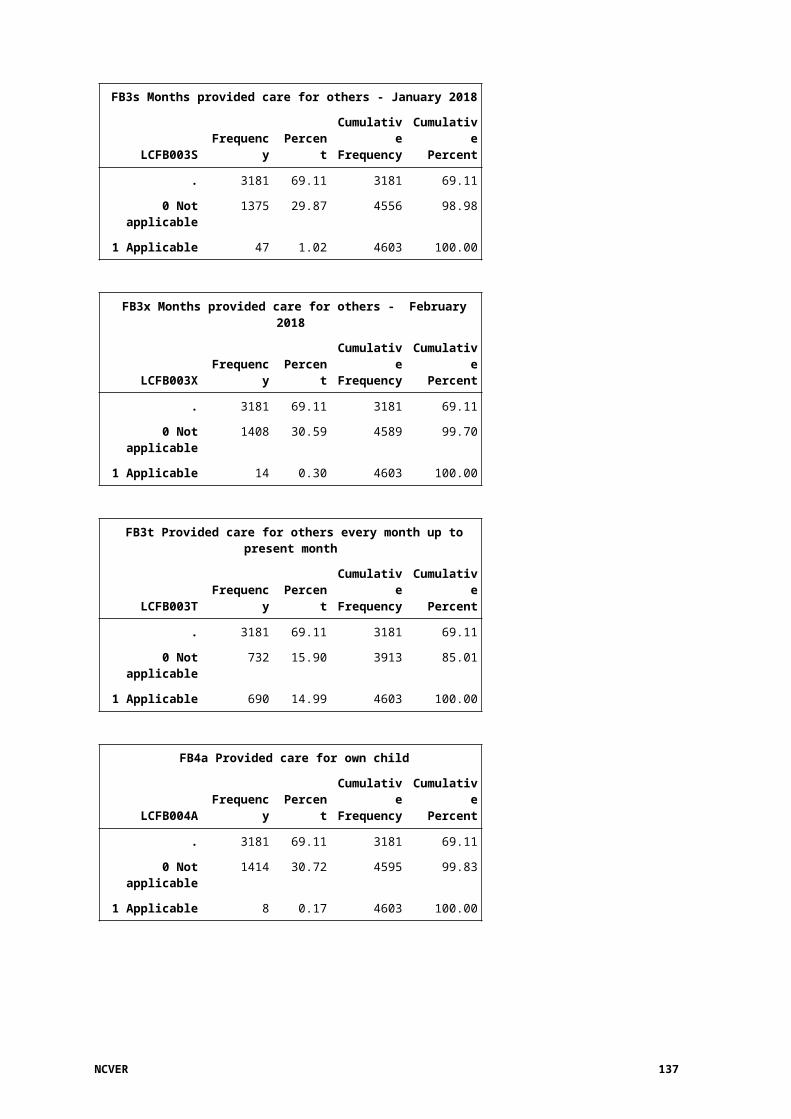
J3 Overall, how satisfied are you with life these days?
LCJ003 Frequency PercentCumulativeFrequency
CumulativePercent
0 - Not at all satisfied 32 0.70 32 0.70
1 31 0.67 63 1.37
2 70 1.52 133 2.89
3 154 3.35 287 6.24
4 216 4.69 503 10.93
5 342 7.43 845 18.36
6 511 11.10 1356 29.46
7 891 19.36 2247 48.82
8 1096 23.81 3343 72.63
9 728 15.82 4071 88.44
10 - Completely satisfied 496 10.78 4567 99.22
98 Prefer not to say 36 0.78 4603 100.00
J4 If you needed to, could you ask someone for any type of support in a time of crisis?
LCJ004 Frequency PercentCumulativeFrequency
CumulativePercent
0 No 265 5.76 265 5.76
1 Yes 4338 94.24 4603 100.00
J5a Could ask family member for support in a crisis
LCJ005A Frequency PercentCumulativeFrequency
CumulativePercent
. 265 5.76 265 5.76
0 Not applicable 311 6.76 576 12.51
1 Applicable 4027 87.49 4603 100.00
J5b Could ask friend for support in a crisis
LCJ005B Frequency PercentCumulativeFrequency
CumulativePercent
. 265 5.76 265 5.76
0 Not applicable 505 10.97 770 16.73
1 Applicable 3833 83.27 4603 100.00
NCVER 137
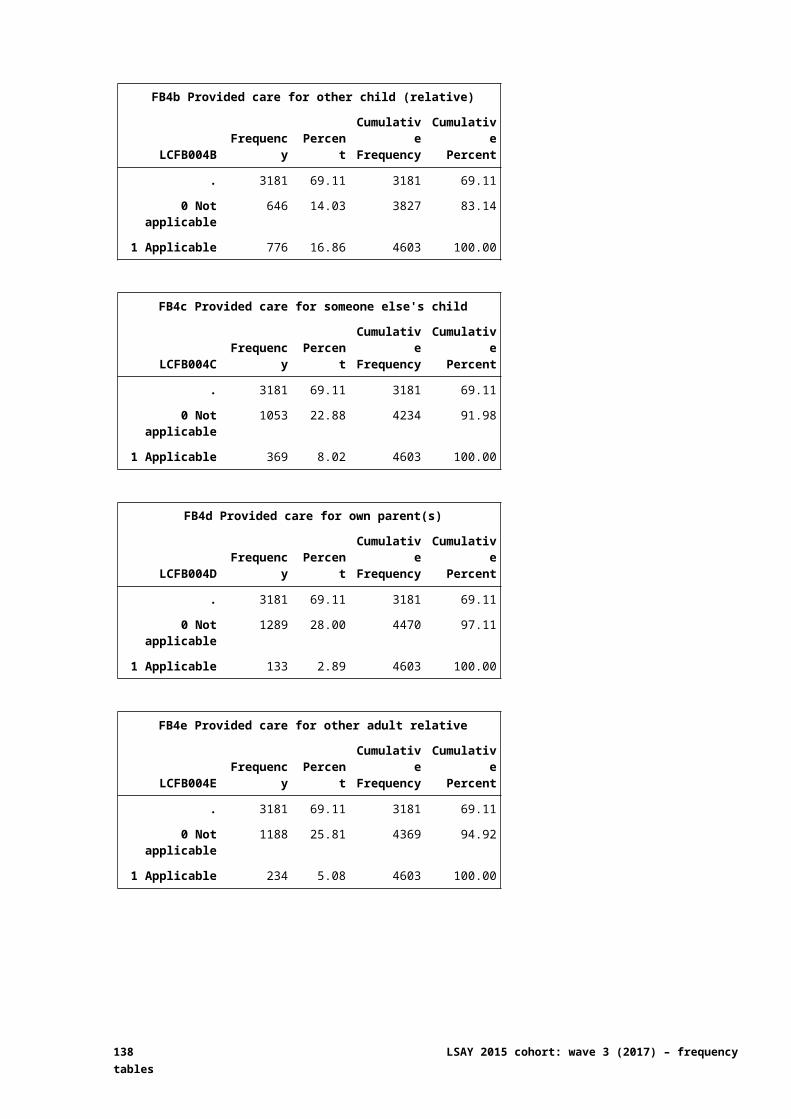
J5c Could ask neighbour for support in a crisis
LCJ005C Frequency PercentCumulativeFrequency
CumulativePercent
. 265 5.76 265 5.76
0 Not applicable 3542 76.95 3807 82.71
1 Applicable 796 17.29 4603 100.00
J5d Could ask school / school counsellor for support in a crisis
LCJ005D Frequency PercentCumulativeFrequency
CumulativePercent
. 265 5.76 265 5.76
0 Not applicable 2264 49.19 2529 54.94
1 Applicable 2074 45.06 4603 100.00
J5e Could ask work colleague for support in a crisis
LCJ005E Frequency PercentCumulativeFrequency
CumulativePercent
. 265 5.76 265 5.76
0 Not applicable 3169 68.85 3434 74.60
1 Applicable 1169 25.40 4603 100.00
J5f Could ask community, charity or religious organisation for support in a crisis
LCJ005F Frequency PercentCumulativeFrequency
CumulativePercent
. 265 5.76 265 5.76
0 Not applicable 3459 75.15 3724 80.90
1 Applicable 879 19.10 4603 100.00
J5g Could ask local council or other government services for support in a crisis
LCJ005G Frequency PercentCumulativeFrequency
CumulativePercent
. 265 5.76 265 5.76
0 Not applicable 3505 76.15 3770 81.90
1 Applicable 833 18.10 4603 100.00
138 LSAY 2015 cohort: wave 3 (2017) – frequency tables

J5h Could ask health, legal or financial professional for support in a crisis
LCJ005H Frequency PercentCumulativeFrequency
CumulativePercent
. 265 5.76 265 5.76
0 Not applicable 2995 65.07 3260 70.82
1 Applicable 1343 29.18 4603 100.00
J5i Could ask other person or service for support in a crisis
LCJ005I Frequency PercentCumulativeFrequency
CumulativePercent
. 265 5.76 265 5.76
0 Not applicable 4190 91.03 4455 96.78
1 Applicable 148 3.22 4603 100.00
NCVER 139
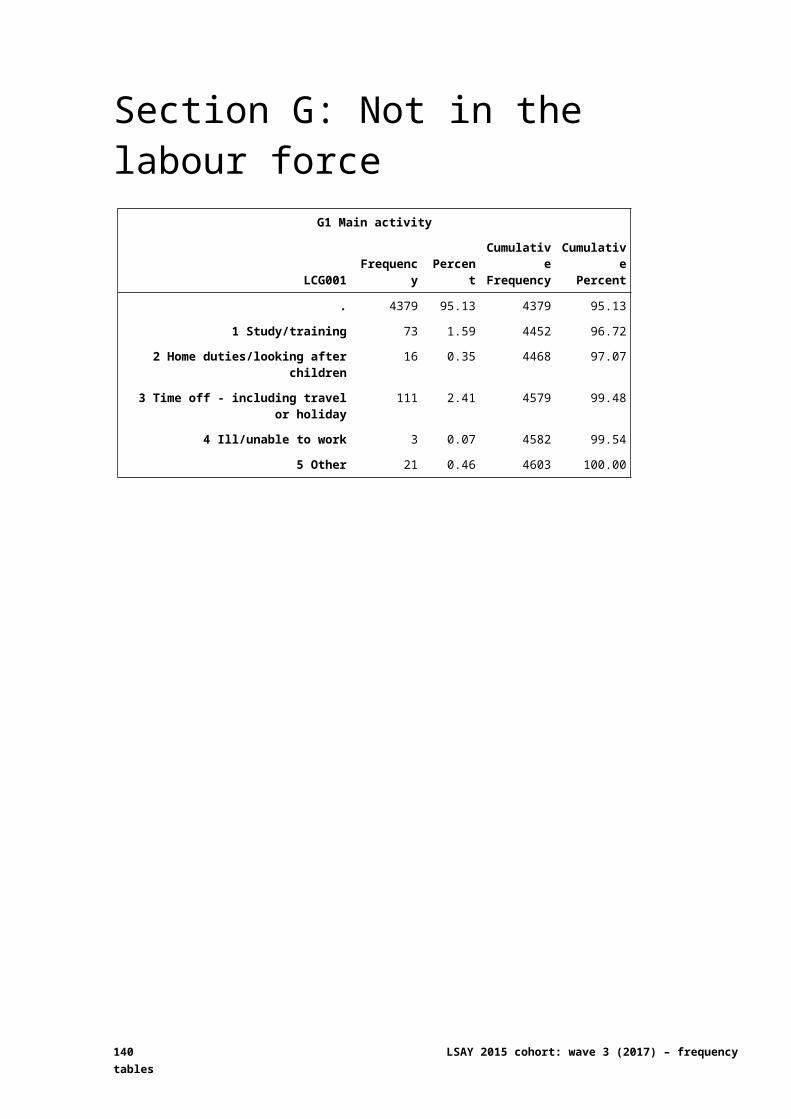
Section K: Data linkage K1 What school did you attend in Year 3?
LCK001 Frequency PercentCumulativeFrequency
CumulativePercent
. 3983 86.53 3983 86.53
1 School name provided (lck001a) 563 12.23 4546 98.76
96 Was home schooled 3 0.07 4549 98.83
97 School was not in Australia 47 1.02 4596 99.85
98 Prefer not to say 7 0.15 4603 100.00
K1(x) ACARA school code
LCK001A Frequency PercentCumulativeFrequency
CumulativePercent
. 4040 87.77 4040 87.77
ACARA school code 563 12.23 4603 100.00
State derived from K1 school
LCK001X Frequency PercentCumulativeFrequency
CumulativePercent
. 4040 87.77 4040 87.77
1 NSW 102 2.22 4142 89.98
2 VIC 145 3.15 4287 93.13
3 QLD 180 3.91 4467 97.05
4 SA 40 0.87 4507 97.91
5 WA 46 1.00 4553 98.91
6 TAS 22 0.48 4575 99.39
7 NT 14 0.30 4589 99.70
8 ACT 14 0.30 4603 100.00
K2 Were you at the same school in Year 5?
LCK002 Frequency PercentCumulativeFrequency
CumulativePercent
. 3983 86.53 3983 86.53
0 No 142 3.08 4125 89.62
1 Yes 478 10.38 4603 100.00
140 LSAY 2015 cohort: wave 3 (2017) – frequency tables
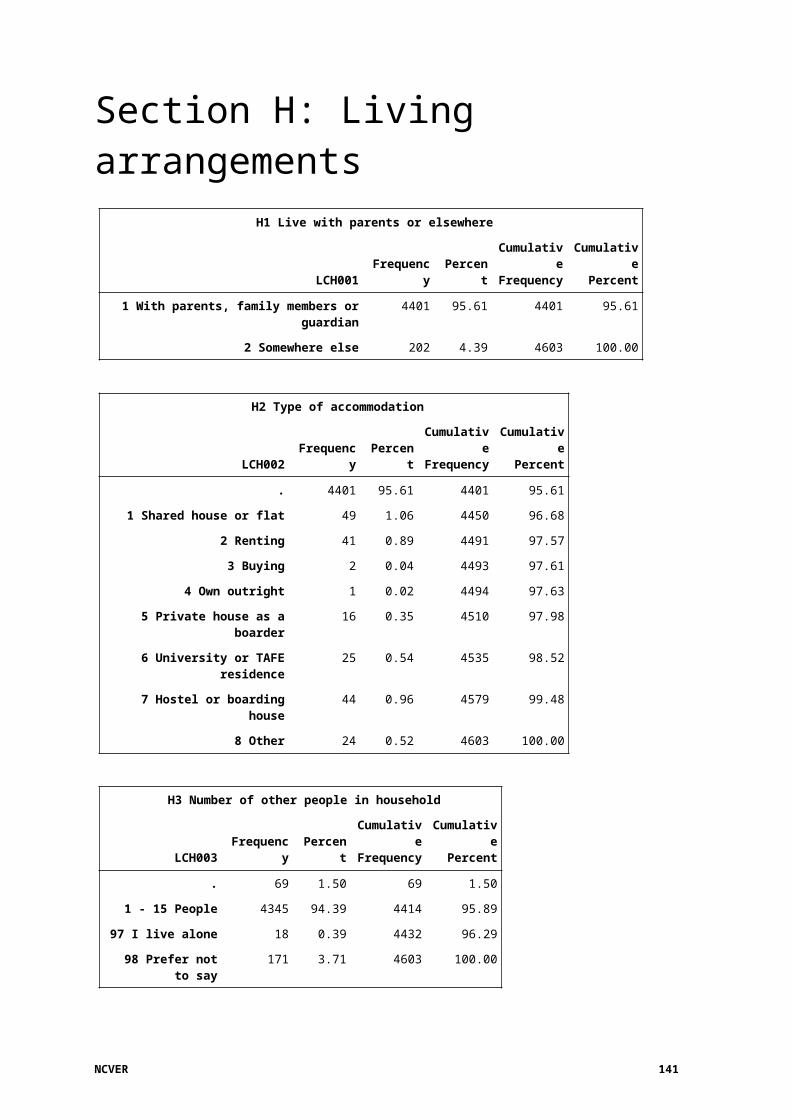
K3 What school did you attend in Grade 5?
LCK003 Frequency PercentCumulativeFrequency
CumulativePercent
. 4461 96.92 4461 96.92
1 School name provided (lck003a) 125 2.72 4586 99.63
96 Was home schooled 3 0.07 4589 99.70
97 School was not in Australia 14 0.30 4603 100.00
K3a ACARA school code
LCK003A Frequency PercentCumulativeFrequency
CumulativePercent
. 4478 97.28 4478 97.28
ACARA school code 125 2.72 4603 100.00
State derived from K3 school
LCK003X Frequency PercentCumulativeFrequency
CumulativePercent
. 4478 97.28 4478 97.28
1 NSW 23 0.50 4501 97.78
2 VIC 18 0.39 4519 98.18
3 QLD 56 1.22 4575 99.39
4 SA 7 0.15 4582 99.54
5 WA 6 0.13 4588 99.67
6 TAS 5 0.11 4593 99.78
7 NT 7 0.15 4600 99.93
8 ACT 3 0.07 4603 100.00
K4 Were you at the same school in Year 7?
LCK004 Frequency PercentCumulativeFrequency
CumulativePercent
. 3983 86.53 3983 86.53
0 No 356 7.73 4339 94.26
1 Yes 264 5.74 4603 100.00
NCVER 141
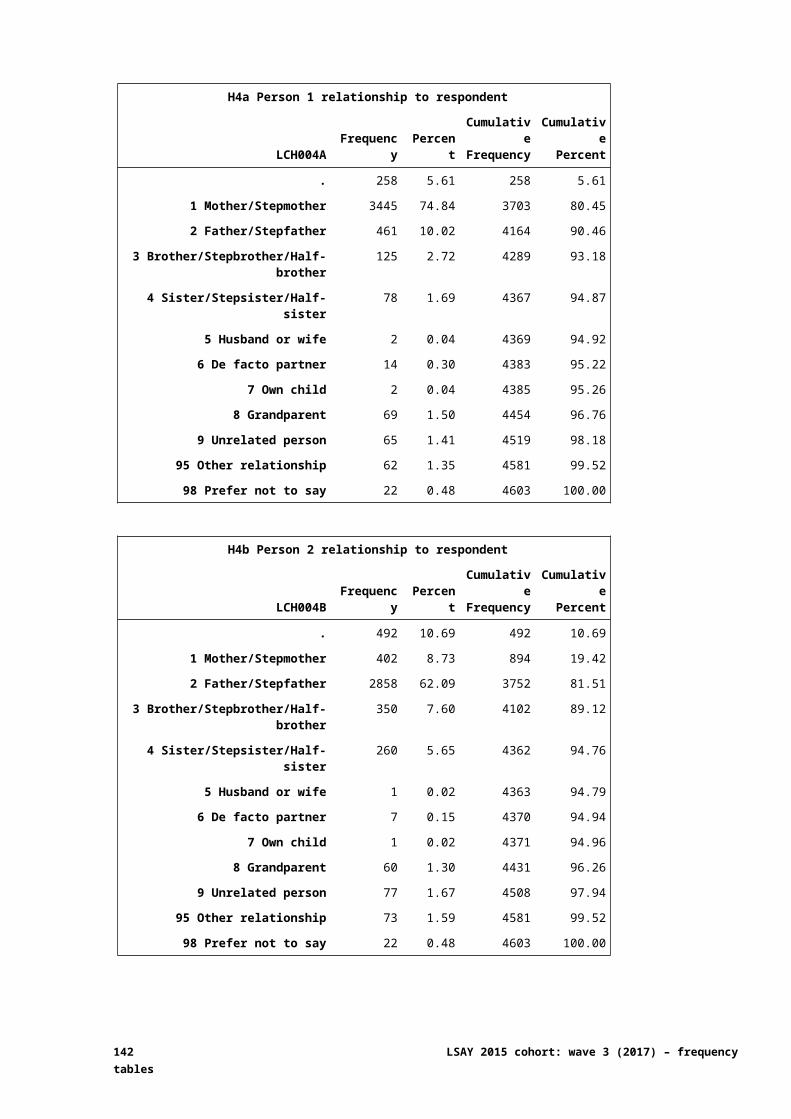
K5 What school did you attend in Year 7?
LCK005 Frequency PercentCumulativeFrequency
CumulativePercent
. 4247 92.27 4247 92.27
1 School name provided (lck005a) 336 7.30 4583 99.57
96 Was home schooled 1 0.02 4584 99.59
97 School was not in Australia 16 0.35 4600 99.93
98 Prefer not to say 3 0.07 4603 100.00
K5 ACARA school code
LCK005A Frequency PercentCumulativeFrequency
CumulativePercent
. 4267 92.70 4267 92.70
ACARA school code 336 7.30 4603 100.00
State derived from K5 school
LCK005X Frequency PercentCumulativeFrequency
CumulativePercent
. 4267 92.70 4267 92.70
1 NSW 97 2.11 4364 94.81
2 VIC 127 2.76 4491 97.57
3 QLD 45 0.98 4536 98.54
4 SA 11 0.24 4547 98.78
5 WA 18 0.39 4565 99.17
6 TAS 16 0.35 4581 99.52
7 NT 9 0.20 4590 99.72
8 ACT 13 0.28 4603 100.00
K6 And in Year 9 - were you at (school at A6/A8)?
LCK006 Frequency PercentCumulativeFrequency
CumulativePercent
. 4158 90.33 4158 90.33
0 No 116 2.52 4274 92.85
1 Yes 329 7.15 4603 100.00
142 LSAY 2015 cohort: wave 3 (2017) – frequency tables
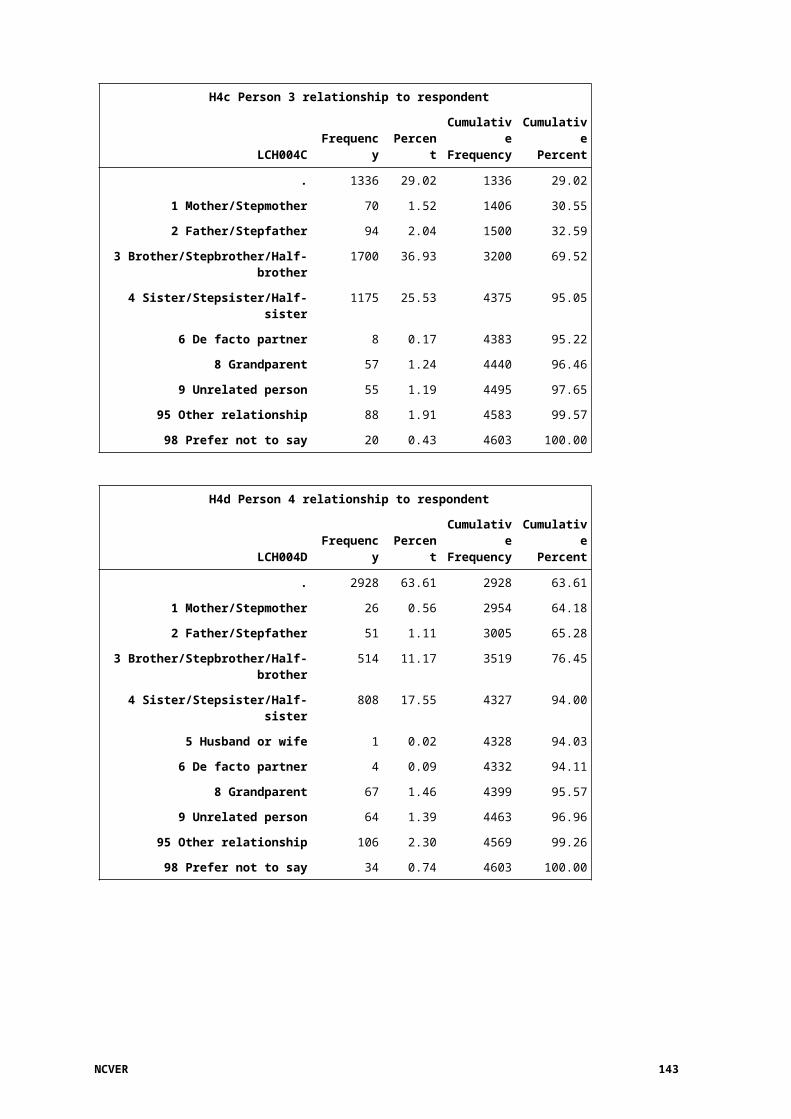
K7 What school did you attend in Year 9?
LCK007 Frequency PercentCumulativeFrequency
CumulativePercent
. 4312 93.68 4312 93.68
1 School name provided (lck007a) 287 6.24 4599 99.91
96 Was home schooled 1 0.02 4600 99.93
97 School was not in Australia 3 0.07 4603 100.00
K7 ACARA school code
LCK007A Frequency PercentCumulativeFrequency
CumulativePercent
. 4316 93.76 4316 93.76
ACARA school code 287 6.24 4603 100.00
State derived from K7 school
LCK007X Frequency PercentCumulativeFrequency
CumulativePercent
. 4316 93.76 4316 93.76
1 NSW 64 1.39 4380 95.16
2 VIC 31 0.67 4411 95.83
3 QLD 119 2.59 4530 98.41
4 SA 26 0.56 4556 98.98
5 WA 23 0.50 4579 99.48
6 TAS 9 0.20 4588 99.67
7 NT 6 0.13 4594 99.80
8 ACT 9 0.20 4603 100.00
K8 Have you ever done any VET study - at school, TAFE or another training organisation?
LCK008 Frequency PercentCumulativeFrequency
CumulativePercent
. 1164 25.29 1164 25.29
0 No 2898 62.96 4062 88.25
1 Yes 429 9.32 4491 97.57
99 Don't know 112 2.43 4603 100.00
NCVER 143
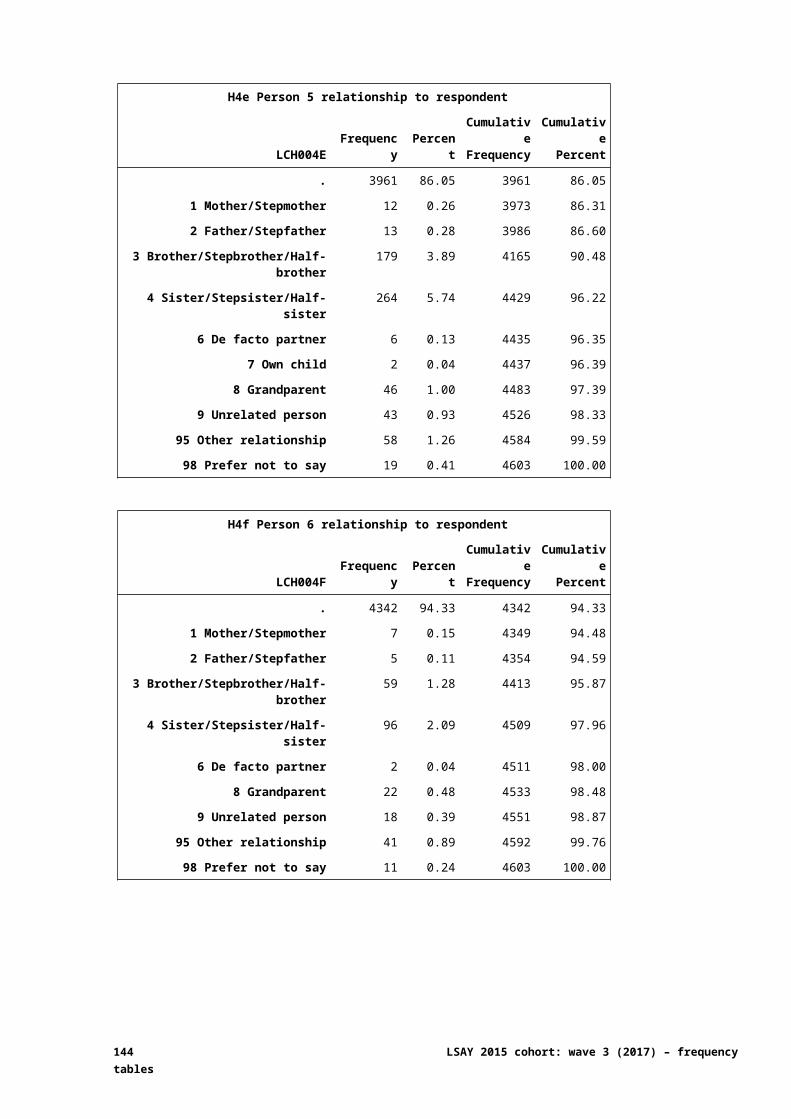
K9a NAPLAN data linkage permission to NSW Board of Studies, Teaching and Educational Standards
LCK009A Frequency PercentCumulativeFrequency
CumulativePercent
. 3983 86.53 3983 86.53
0 No 24 0.52 4007 87.05
1 Yes 93 2.02 4100 89.07
99 Not asked regarding this state 503 10.93 4603 100.00
K9b NAPLAN data linkage permission to VIC Curriculum and Assessment Authority
LCK009B Frequency PercentCumulativeFrequency
CumulativePercent
. 3983 86.53 3983 86.53
0 No 34 0.74 4017 87.27
1 Yes 113 2.45 4130 89.72
99 Not asked regarding this state 473 10.28 4603 100.00
K9c NAPLAN data linkage permission to QLD Curriculum and Assessment Authority
LCK009C Frequency PercentCumulativeFrequency
CumulativePercent
. 3983 86.53 3983 86.53
0 No 35 0.76 4018 87.29
1 Yes 162 3.52 4180 90.81
99 Not asked regarding this state 423 9.19 4603 100.00
K9d NAPLAN data linkage permission to SA Department for Education and Child Development
LCK009D Frequency PercentCumulativeFrequency
CumulativePercent
. 3983 86.53 3983 86.53
0 No 11 0.24 3994 86.77
1 Yes 40 0.87 4034 87.64
99 Not asked regarding this state 569 12.36 4603 100.00
144 LSAY 2015 cohort: wave 3 (2017) – frequency tables
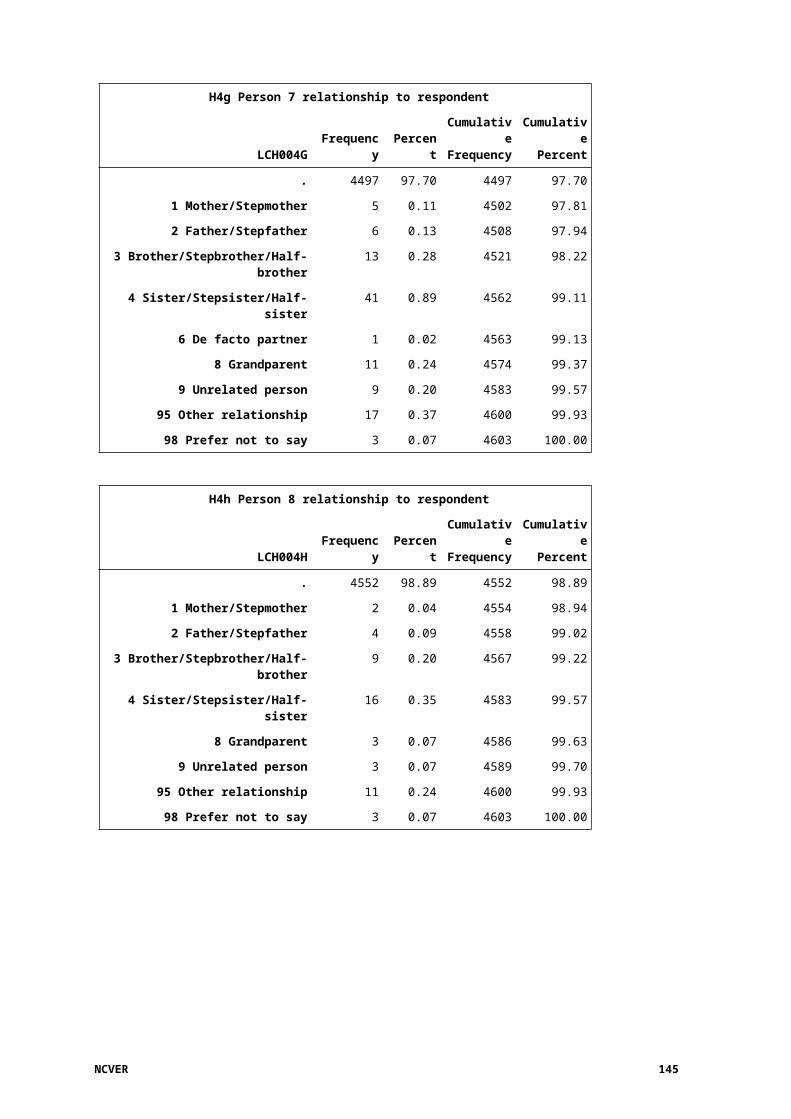
K9e NAPLAN data linkage permission to WA School Curriculum and Standards Authority
LCK009E Frequency PercentCumulativeFrequency
CumulativePercent
. 3983 86.53 3983 86.53
0 No 8 0.17 3991 86.70
1 Yes 41 0.89 4032 87.60
99 Not asked regarding this state 571 12.40 4603 100.00
K9f NAPLAN data linkage permission to TAS Department of Education
LCK009F Frequency PercentCumulativeFrequency
CumulativePercent
. 3983 86.53 3983 86.53
0 No 7 0.15 3990 86.68
1 Yes 17 0.37 4007 87.05
99 Not asked regarding this state 596 12.95 4603 100.00
K9g NAPLAN data linkage permission to NT Department of Education
LCK009G Frequency PercentCumulativeFrequency
CumulativePercent
. 3983 86.53 3983 86.53
0 No 2 0.04 3985 86.57
1 Yes 15 0.33 4000 86.90
99 Not asked regarding this state 603 13.10 4603 100.00
K9h NAPLAN data linkage permission to ACT Education and Training Directorate
LCK009H Frequency PercentCumulativeFrequency
CumulativePercent
. 3983 86.53 3983 86.53
0 No 3 0.07 3986 86.60
1 Yes 17 0.37 4003 86.97
99 Not asked regarding this state 600 13.03 4603 100.00
K10a Subject results data linkage permission to NSW Board of Studies
LCK010A Frequency PercentCumulativeFrequency
CumulativePercent
. 3983 86.53 3983 86.53
0 No 32 0.70 4015 87.23
1 Yes 85 1.85 4100 89.07
99 Not asked regarding this state 503 10.93 4603 100.00
NCVER 145
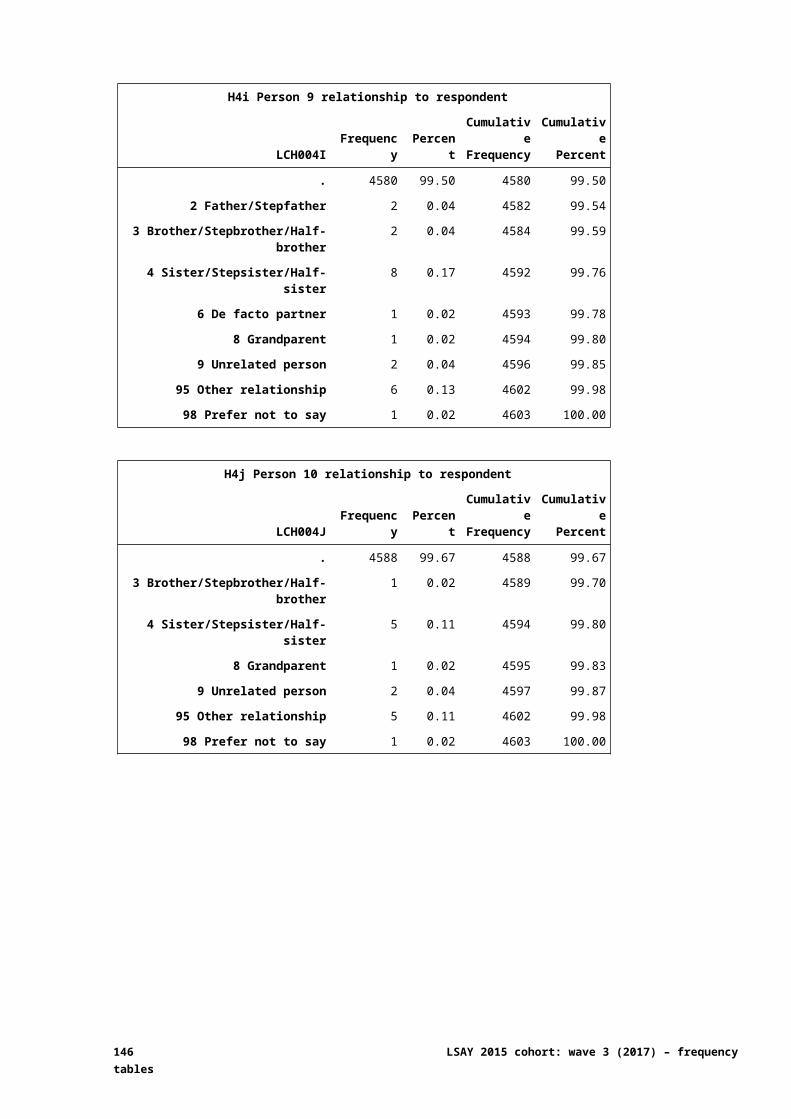
K10b Subject results data linkage permission to VIC Curriculum and Assessment Authority
LCK010B Frequency PercentCumulativeFrequency
CumulativePercent
. 3983 86.53 3983 86.53
0 No 47 1.02 4030 87.55
1 Yes 100 2.17 4130 89.72
99 Not asked regarding this state 473 10.28 4603 100.00
K10c Subject results data linkage permission to QLD Curriculum and Assessment Authority
LCK010C Frequency PercentCumulativeFrequency
CumulativePercent
. 3983 86.53 3983 86.53
0 No 43 0.93 4026 87.46
1 Yes 154 3.35 4180 90.81
99 Not asked regarding this state 423 9.19 4603 100.00
K10d Subject results data linkage permission to SACE Board of South Australia
LCK010D Frequency PercentCumulativeFrequency
CumulativePercent
. 3983 86.53 3983 86.53
0 No 13 0.28 3996 86.81
1 Yes 38 0.83 4034 87.64
99 Not asked regarding this state 569 12.36 4603 100.00
K10e Subject results data linkage permission to WA School Curriculum and Standards Authority
LCK010E Frequency PercentCumulativeFrequency
CumulativePercent
. 3983 86.53 3983 86.53
0 No 8 0.17 3991 86.70
1 Yes 41 0.89 4032 87.60
99 Not asked regarding this state 571 12.40 4603 100.00
K10f Subject results data linkage permission to TAS Office of Assessment Standards and Certification
LCK010F Frequency PercentCumulativeFrequency
CumulativePercent
. 3983 86.53 3983 86.53
0 No 7 0.15 3990 86.68
1 Yes 17 0.37 4007 87.05
99 Not asked regarding this state 596 12.95 4603 100.00
146 LSAY 2015 cohort: wave 3 (2017) – frequency tables
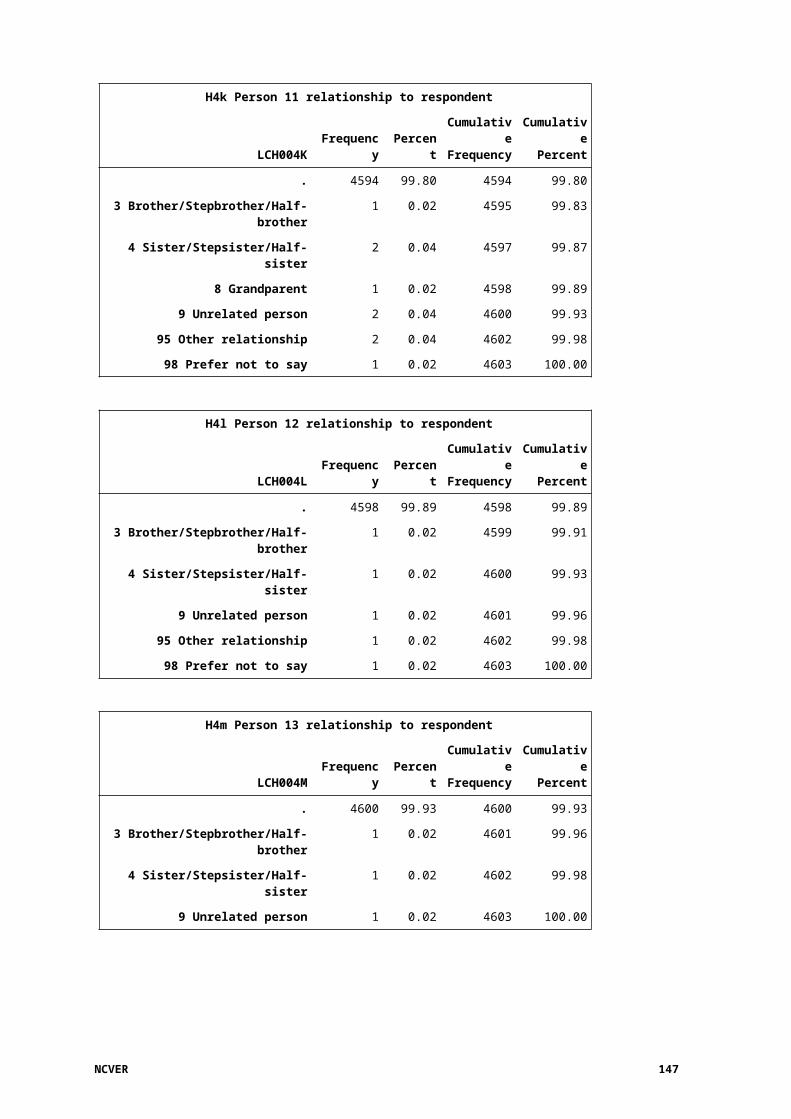
K10g Subject results data linkage permission to NT Board of Studies
LCK010G Frequency PercentCumulativeFrequency
CumulativePercent
. 3983 86.53 3983 86.53
0 No 5 0.11 3988 86.64
1 Yes 12 0.26 4000 86.90
99 Not asked regarding this state 603 13.10 4603 100.00
K10h Subject results data linkage permission to ACT Board of Senior Secondary Studies
LCK010H Frequency PercentCumulativeFrequency
CumulativePercent
. 3983 86.53 3983 86.53
0 No 5 0.11 3988 86.64
1 Yes 15 0.33 4003 86.97
99 Not asked regarding this state 600 13.03 4603 100.00
K11 Data linkage permission given to use USI for VET records
LCK011 Frequency PercentCumulativeFrequency
CumulativePercent
. 2659 57.77 2659 57.77
0 No 391 8.49 3050 66.26
1 Yes 1553 33.74 4603 100.00
K12 You might already have a USI
LCK012 Frequency PercentCumulativeFrequency
CumulativePercent
. 3833 83.27 3833 83.27
1 Yes, I can provide my USI 426 9.25 4259 92.53
2 No, I cannot provide my USI 344 7.47 4603 100.00
K13 Please enter your USI
LCK013 Frequency PercentCumulativeFrequency
CumulativePercent
. 4177 90.75 4177 90.75
1 USI provided 394 8.56 4571 99.30
2 Invalid code entered 27 0.59 4598 99.89
99 Invalid USI but validated during interview 5 0.11 4603 100.00
NCVER 147
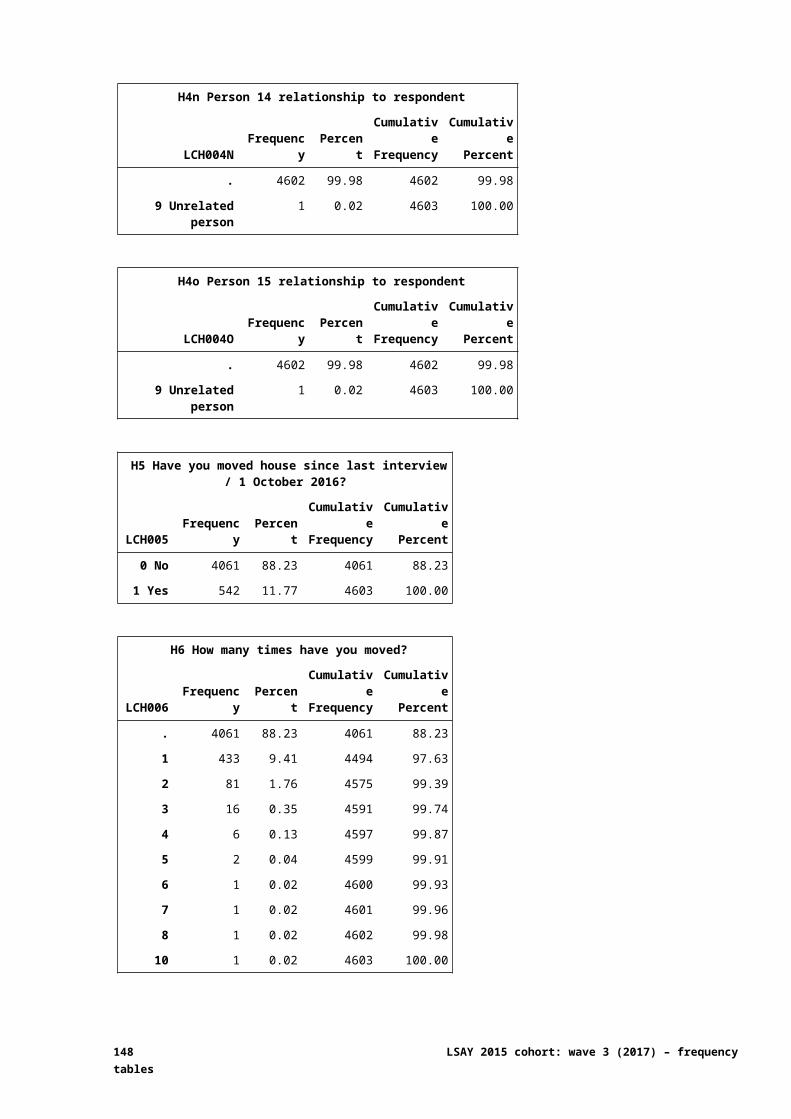
K14 Data linkage permission given to use contact details to retrieve USI
LCK014 Frequency PercentCumulativeFrequency
CumulativePercent
. 4232 91.94 4232 91.94
0 No 64 1.39 4296 93.33
1 Yes 307 6.67 4603 100.00
K15 Data linkage permission given to use contact details to retrieve USI
LCK015 Frequency PercentCumulativeFrequency
CumulativePercent
. 3820 82.99 3820 82.99
0 No 24 0.52 3844 83.51
1 Yes 758 16.47 4602 99.98
98 No response 1 0.02 4603 100.00
148 LSAY 2015 cohort: wave 3 (2017) – frequency tables
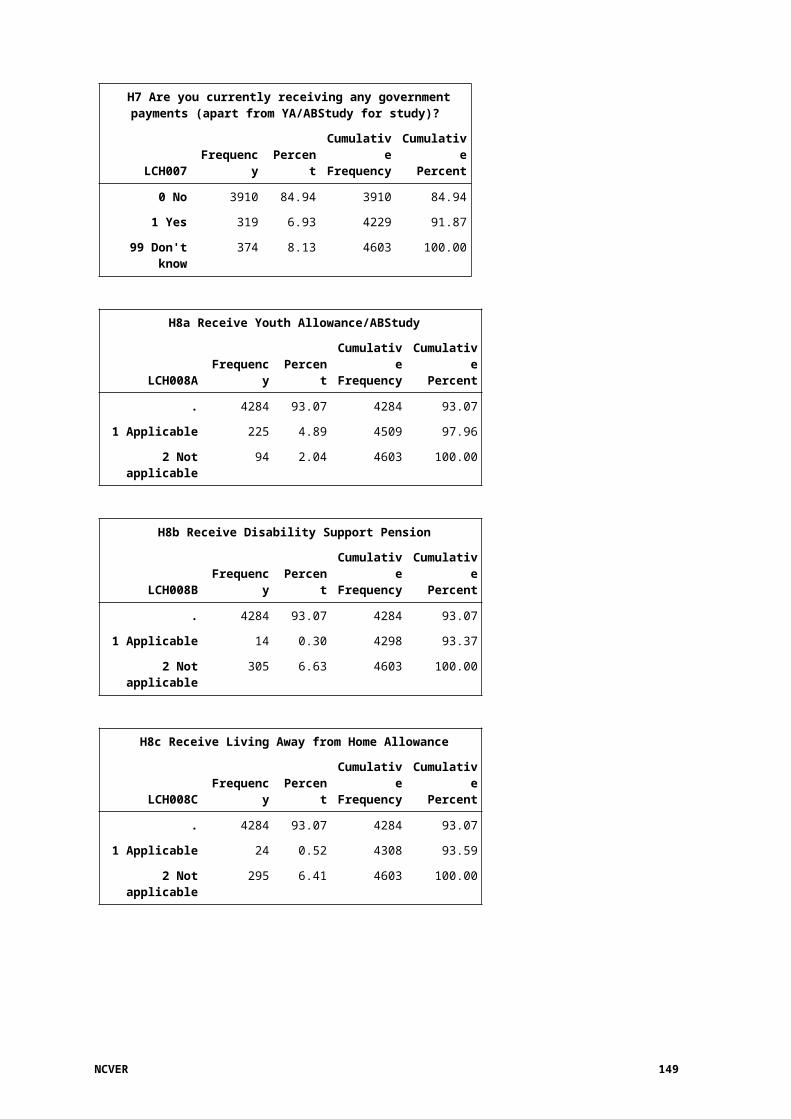
Interview variablesInterviewed in 2017
IN2017 Frequency PercentCumulativeFrequency
CumulativePercent
1 Yes 4603 100.00 4603 100.00
Home postcode 2017
PC2017 Frequency PercentCumulativeFrequency
CumulativePercent
. 16 0.35 16 0.35
4 digit postcode 4587 99.65 4603 100.00
NCVER 149