Embed Size (px)
Citation preview

UV-induced modification of stress distribution in optical fibers and its contribution to Bragg
grating birefringence N. Belhadj1, Y. Park2, S. LaRochelle1, K. Dossou3, and J. Azaña2
1 Centre d’optique, photonique et laser (COPL), Département de génie électrique et de génie informatique, Université Laval, Québec (Québec) Canada G1V 0A6
2Institut national de la recherche scientifique (INRS) - Energie, Matériaux et Télécommunications, Varennes (Québec), Canada J3X 1S2
3Department of Mathematical Sciences, University of Technology, Sydney, Broadway, NSW 2007, Australia *Corresponding author:[email protected]
Abstract: This paper discusses the importance of stress-induced contributions to the photo-induced birefringence observed in fiber Bragg gratings. Optical tomography measurements are performed in exposed and unexposed fibers to extract the stress profiles induced by UV-writing of fiber Bragg gratings for various exposure levels. A photoelastic analysis and a high-order isoparametric finite elements method are then used to calculate the birefringence caused by stress profile modifications. The results are compared to the birefringence directly measured by spectral analysis of a chirped fiber grating with multiple phase-shifts. We can therefore estimate the fraction of the photo-induced birefringence due to stress-induced anisotropy following UV exposure.
©2008 Optical Society of America
OCIS codes: (060.0060) Fiber optics and optical communications; (060.3738) Fiber Bragg gratings, photosensitivity; (060.2300) Fiber measurements; (060.2340) Fiber optics components; (060.2430) Fibers single-mode.
References:
1. T. Erdogan and V. Mizrahi, “Characterization of UV-induced birefringence in photosensitive Ge-doped silica optical fibers,” J. Opt. Soc. Am. B 11, 2100-2105 (1994).
2. A. M. Vengsarkar, Q. Zhong, D. Inniss, W. A. Reed, P. J. Lemaire, and S. G. Kosinski, “Birefringence reduction in side-written photoinduced fiber devices by a dual-exposure method,” Opt. Lett. 19, 1260-1262 (1994).
3. D. Inniss, Q. Zhong, A. M. Vengsarkar, W. A. Reed, S. G. Kosinski, and P. J. Lemaire, “Atomic force microscopy study of UV-induced anisotropy in hydrogen-loaded germanosilicate fibers,” Appl. Phys. Lett. 65, 1528-1530, (1994).
4. H. Renner, “Effective-index increase, form birefringence and transition losses in UV-side-illuminated photosensitive fibers,” Opt. Express 9, 546-560 (2001).
5. N. Belhadj, K. Dossou, X. Daxhelet, S. LaRochelle, S. Lacroix, and M. Fontaine, “A comparative study of numerical methods for the calculation of the birefringence of UV-illuminated fibers,” OSA Technical Digest: Conference on Bragg Gratings, Photosensitivity and Poling in Glass Waveguides, Monterey, California, USA, September 1-3, (paper MD20) 112-114 (2003).
6. N. Belhadj, S. LaRochelle, and K. Dossou, “Form birefringence in UV-exposed photosensitive fibers computed using a higher order finite element method,” Opt. Express 12, 1720-1726 (2004).
7. N. Belhadj, S. LaRochelle, and K. Dossou, “Analysis of birefringence and eigen-axes orientation resulting from the interplay between initial and form birefringence in UV-illuminated fibre,” IEEE-LEOS Annual Meeting 2006, Montreal, Canada, October 29- November 2, Paper TuX 2, (2006).
8. K. Dossou, S. LaRochelle, and M. Fontaine, “Numerical Analysis of the Contribution of the transverse asymmetry in the photo-induced index change profile to the birefringence of optical fiber,” J. Lightwave Technol. 20, 1463-1469 ( 2002).
9. J. Canning, H. J. Deyerl, H. R. Sorensen, and M. Kristensen, “Ultraviolet-induced birefringence in hydrogen-loaded optical fiber,” J. Appl. Phys. 97, 53104, (2005).
#94963 - $15.00 USD Received 11 Apr 2008; revised 26 May 2008; accepted 26 May 2008; published 29 May 2008
(C) 2008 OSA 9 June 2008 / Vol. 16, No. 12 / OPTICS EXPRESS 8727
10. M. Douay, W. X. Xie, T. Taunay, P. Bernage, P. Niay, P. Cordier, B. Poumellec, L. Dong, J. F. Bayon, H. Poignant, and E. Delevaque, “Densification involved in the UV-based photosensitivity of silica glasses and optical fibers,” J. Lightwave Technol. 15, 1329-1342 (1997).
11. P. St.-J. Russell, P. and D. P. Hand, “Rocking filter formation in photosensitive high birefringence optical fibres,” Electron. Lett.26, 1846-1848, (1990).
12. P. Y. Fonjallaz, H. G. Limberger, R. P. Salathe, F. Cochet, and B. Leuenberger, “Tension increase correlated to refractive-index change in fibers containing UV-written Bragg gratings,” Opt. Lett. 20, 1346-1348 (1995).
13. F. Dürr, H. G. Limberger, R. P. Salathé, F. Hindle, M. Douay, E. Fertein and C. Przygodzki, , “Tomographic measurement of femtosecond-laser induced stress changes in optical fibers,” Appl. Phys. Lett. 84, 4983-4985, (2004).
14. H. G. Limberger, C. Ban, R. P. Salathé, S. A Slattery and D. N. Nokogosyan, “Absence of UV-induced stress in Bragg gratings recorded by high-intensity 264 nm laser pulses in a hydrogenated standard telecom fiber,” Opt. Express 15, 5610-5615 (2007).
15. H. Renner, “Impact of UV-induced mode-field deformation on residual stress birefringence in single mode fibers,” Opt. Commun. 244, 131–135, (2005).
16. K. Dossou and M. Fontaine, “A high order isoparametric finite element method for the computation of wave guide modes,” Comput. Methods Appl. Mech. Eng., 194, 837-858, (2005).
17. Y. Park, T. -J Ahn, Y. H. Kim, W. T. Han, U. -C. Paek and D. Y. Kim, “Measurement method for profiling the residual stress and the strain-optic coefficient of an optical fiber,” App. Opt. 41, 21-26, (2002).
18. Y. Park, S. Choi, U. -C. Peak, K. Oh, and D. Y. Kim, “Measurement method for profiling the residual stress of an optical fiber: detailed analysis of off-focusing and beam-deflection effects,” App. Opt. 42, 1182-1190, (2003).
19. L. Dong, G. Qi, M. Marro, V. Bhatia, L. L. Hepburn, M. Swan, A. Collier, and D. L. Weidman, “Suppression of Cladding Mode Coupling Loss in Fiber Bragg Gratings,” J. Lightwave Technol. 18, 1583-1590 (2000).
20. A. E. Puro and K. -J. E. Kell, “Complete determination of stress in fiber preforms of arbitrary cross section,” J. Lightwave Technol. 10, 1010-1014 (1992).
21. J. Sakai, and T. Kimura, "Birefringence caused by thermal stress in elliptically deformed core optical fibers," J. Quantum Electron. 18, 1899-1909, (1982).
22. G. Brochu and S. LaRochelle, “Fabrication of erbium-ytterbium distributed multi-wavelength fiber lasers by writing the superstructured fiber Bragg grating resonator in a single writing laser scan,” Proc. SPIE 67960Z, 1–11 (2007).
23. Y. Park, U.-C. Paek, and D. Y. Kim, “Complete determination of the stress tensor of a polarization-maintaining fiber by photoelastic tomography,” Opt. Lett. 27, 1217-1219 (2002).
24. Y. Park, U.-C. Paek, and D. Y. Kim, “Determination of stress-induced intrinsic birefringence in a single-mode fiber by measurement of the two-dimensional stress profile,” Opt. Lett. 27, 1291-1293 (2002).
25. T. Abe, Y. Mitsunaga, and H. Koga, “Photoelastic computer tomography: a novel measurement method for axial residual stress profile in optical fibers,” J. Opt. Soc. Am. A 3, 133- (1986).
26. A. C. Kak and M. Slaney, Principles of Computerized Tomographic Imaging (Society for Industrial and Applied Mathematics, Philadelphia, Pa., 2001), Chap. 3.
27. Y. Park, U.-C. Paek and D. Y. Kim, “Characterization of a Stress-Applied Polarization-Maintaining (PM) Fiber Through Photoelastic Tomography,” J. Lightwave Technol. 21, 997- (2003)..
28. U.-C. Paek and C. R. Kurkjian, “Calculation of Cooling Rate and Induced Stresses in Drawing of Optical Fibers,” J. Am. Ceram. Soc. 58, 330-335 (1975).
29. S. Timoshenko and J. N. Goodier, Theory of Elasticity, 3rd ed. New York: McGraw-Hill, 1970. 30. H. Aben and C. Guillemet, Photoelasticity of Glass. Berlin, Germany: Springer-Verlag, 1993.
1. Introduction
The study of the origin of photo-induced birefringence and its contributing factors in UV-exposed optical fibers is important to determine the polarization behavior of in-fiber Bragg gratings [1-8]. Previous studies have identified three main contributions to photo-induced birefringence of gratings: orientation and state of polarization of the UV writing beam [1], transverse gradient in the UV-induced index change profile [2, 3] and modification of glass stress profiles from the asymmetric glass densification in the photosensitive regions of the exposed fiber. Other factors can also influence photo-induced birefringence such as fiber type [1, 6], initial intrinsic fiber birefringence [7], hydrogenation [9] and laser writing beam wavelength and operation regime.
Dependence of the induced birefringence on the polarization of the writing beam is attributed to the preferential bleaching of defects having their dipole moments aligned with
#94963 - $15.00 USD Received 11 Apr 2008; revised 26 May 2008; accepted 26 May 2008; published 29 May 2008
(C) 2008 OSA 9 June 2008 / Vol. 16, No. 12 / OPTICS EXPRESS 8728

the polarization of the UV writing beam [11]. It was experimentally shown [1] that a UV polarization in the incidence plane along the optical fiber axis can reduce the photo-induced birefringence by up to an order of magnitude depending on the fiber type when compared to the orthogonal orientation. Given that the writing process requires an interference pattern to be created along the fiber axis, the angle of incidence of the UV-writing beams depends on the writing beam wavelength and phase mask period. For a 244 nm UV-beam and 1.06 μm mask period the angle of diffraction of the ±1 orders is about ±13.3° to obtain a Bragg grating reflecting in the C-band (in this case near 1.542 μm). Consequently small transverse polarization components cannot be totally avoided.
The asymmetry of the index change in the transverse plane is related to the one-sided exposure geometry commonly used when writing Bragg gratings. Because of the strong UV-light absorption across the photosensitive core, a strong transverse gradient in the UV dose reaching the defects develops and henceforth in the refractive index change adopts a similar profile [2]. Initially thought to be the dominant process to explain the induced birefringence, early numerical studies concentrated on this phenomenon called form birefringence [4-8]. Since then however, thorough quantification using vectorial and semi-vectorial computation methods has revealed that this asymmetry cannot account alone for the large observed values of photo-induced birefringence in photo-inscribed gratings.
The last identified contribution to photo-induced birefringence is associated with an asymmetric stress distribution caused by UV-induced densification of the glass in the photosensitive regions of the fiber (see [10] and the references therein). Axial stress increase has been observed in the photosensitive regions of fiber Bragg gratings written using XeCl Excimer laser [12]. Asymmetrical increase in axial core stress was characterized in standard SMF-28 fiber irradiated with 800 nm weakly focused pulses of a femtosecond-laser [13]. Strong and asymmetric stress changes were observed also in the core and in the cladding of a non-hydrogenate SMF-28 fiber exposed to high-intensity 264 nm femtosecond pulses [14]. However, the stress distribution induced by CW frequency-doubled argon ion laser beams, typically 100 mW at 244 nm, has never been characterized. This laser source is often used for the writing of high precision and complex fiber Bragg gratings in which polarization properties are of the utmost importance. It is reasonable to postulate that an asymmetrical stress distribution can generate a refractive index anisotropy that can be responsible for part of the observed photo-induced birefringence. Furthermore, in [15] it was shown that in the presence of form birefringence, even an axisymmetric stress distribution could contribute to the total photo-induced birefringence because of the shift of the asymmetry of the optical mode. It is therefore important to develop a fiber model and numerical tools that consider simultaneously all these effects.
In previous work [5-7], we used a highly accurate vectorial finite element mode solver [16] considering isotropic refractive index distributions having an asymmetric profile. In this paper, we extend our investigation to quantify the photo-induced stress contribution to the UV-induced birefringence in Bragg gratings using the same numerical method and considering an anisotropic dielectric tensor. Modifications to the stress distribution of an optical fiber are measured using an accurate optical tomography technique [17,18] before and after Bragg grating inscription in a cladding-mode-suppressed fiber [19] with a frequency-doubled argon-ion laser. By writing chirped fiber Bragg gratings with phase-shifts, we are also able to determine the total photo-induced birefringence from direct spectral measurement of the grating response. Section II presents the experimental results including sample preparation, spectral characterization and tomographic measurements. Complete stress distributions of the UV-exposed and unexposed fiber are determined from axial stress component in Section III by using an appropriate algorithm [20]. The dielectric tensor perturbation of the fiber is then derived by use of the thermoelastic formulation presented in [21] and the results are introduced in the mode solver to calculate the resulting birefringence.
#94963 - $15.00 USD Received 11 Apr 2008; revised 26 May 2008; accepted 26 May 2008; published 29 May 2008
(C) 2008 OSA 9 June 2008 / Vol. 16, No. 12 / OPTICS EXPRESS 8729

In Section IV, we evaluate the fraction of the total birefringence caused by stress-induced anisotropy for various UV-exposure levels before we conclude.
2. Experiment
In this Section, we first describe the writing and spectral characterization of the fiber Bragg grating samples. We also introduce all the parameters of the photosensitive specialty fiber that will be useful for the numerical analysis. Finally, we describe the non-destructive tomographic setup and present the measurement results.
2.1 Sample preparation
Specialty optical fibers with cladding-mode-suppression (CMSF) are frequently used in fiber Bragg grating fabrication. These fibers are characterized by the presence of a photosensitive inner cladding that decreases the grating losses created by coupling to cladding modes [19]. The enhanced photosensitivity of these specialty fibers allows fiber Bragg grating fabrication without Hydrogen loading. This eliminates one parameter from this study, namely hydrogen diffusion and its associated dynamics. The use of CMSF therefore simplifies the interpretation of the presented stress measurement results. Note that specialty fibers are commonly used to write fiber Bragg gratings. The CMSF used for this experiment is the UVS-INT fiber manufactured by CorActive. Before UV-illumination, the fiber is assumed to have circularly symmetric step-index profile with a core radius rco=3.05μm and an index nco=1.4565, a photosensitive inner cladding with a radius of τ =6.25μm and an index ncl=1.444, and an outer cladding with a radius of rcl=62.5μm and the same index ncl=1.444. These values have been obtained from the fiber manufacturer.
We wrote the gratings in a non hydrogenated CMSF by phase-mask scanning with a 244 nm frequency-doubled Argon-ion laser. To minimize the birefringence induced by the orientation of the UV polarization, the incident beam was polarized, before the phase mask, in the plane of incidence along the optical fiber axis. The UV power was 70mW and the beam width was around 1.1mm. The beam was focused by two cylindrical lenses (f=15cm and f=5cm) to produce an elliptical spot on the fiber with the major axis (approximately 400μm) aligned along the optical fiber axis. The core fiber position was manually optimized to be close to the maximum focus of the f=5cm lens; the beam was more loosely focused in the other direction. The phase-mask was a chirped phase-mask with a mean period of
1.059m mμΛ = , a mask period chirp of 0.625 nm.cm-1 and multiple π phase shifts separated by
2.18 mm (spacing of 50 GHz in the grating spectral response) [22]. During UV-beam scanning of the fiber, we used a decreasing multiple-step speed profile to vary the exposure level and create phase-shifted gratings of different strengths. The length of each segment was 2.18 mm (the phase-shifts were located in the middle of each segment) and thus the total grating length was L=17.44 mm (see Fig. 1).
#94963 - $15.00 USD Received 11 Apr 2008; revised 26 May 2008; accepted 26 May 2008; published 29 May 2008
(C) 2008 OSA 9 June 2008 / Vol. 16, No. 12 / OPTICS EXPRESS 8730

Fig. 1. The UV-beam scanning speed profile.
Using an optical vector analyzer (LUNA Technologies), we measured the complex spectral response of the grating in transmission and reflection. We calculated the eigenvalues of the Jones matrix to extract the birefringence from the polarization dependent spectral response. The grating spectrum had a -3dB bandwidth of about 3.2 nm and a depth that varied from -18 to -33 dB. The deepest side of the grating corresponds to the lowest wavelengths and the slowest speed. As shown in Fig. 2-a, seven of the eight phase-shifts gave rise to double transmission peaks thus indicating an important birefringence. For each phase-shift, we estimated the total birefringence by considering the wavelength shift Δλ between the transmission peaks of each eigen-mode as can be seen in Fig. 2-b. In particular, the birefringence Δneff, defined as the effective index difference between the two orthogonally polarized eigen-modes, was estimated using the following equation:
2effm
nλΔΔ =
Λ (1)
The estimated birefringence ranged between 0.64x10⁻⁴ and 0.9x10⁻⁴. A detailed comparison of the measured values to the simulation results will be made in section IV.
(a) (b)
Fig. 2. The measured reflectivity, R, and transmission, T, spectra (a) and the modulus of the transmission Jones matrix eigen-values, ρ1 and ρ2, as a function of wavelength (b).
#94963 - $15.00 USD Received 11 Apr 2008; revised 26 May 2008; accepted 26 May 2008; published 29 May 2008
(C) 2008 OSA 9 June 2008 / Vol. 16, No. 12 / OPTICS EXPRESS 8731

2.2 Phase measurement and stress profiles
The stress distribution of a dielectric material can be characterized by measuring the phase retardation between orthogonal polarization states of light transmitted through the sample. For a material with a cylindrical geometry like an optical fiber, the preferred orientation for the chosen orthogonal polarization states are parallel and perpendicular to the optical fiber axis. We used a polarization microscope with a built-in phase compensator that was developed specifically to measure stress-induced phase retardations in optical fibers [17-18]. For circularly symmetric stress profiles, the axial stress, σzz, is deduced from a single transverse projected phase retardation profile measurement using Abel transform [17]. To characterize a non axisymmetric stress distribution, optical tomographic measurement of the stress-induced phase retardation is necessary [23, 24]. The axial stress profile can then be obtained using an inverse-Radon transform of the multiple projected transverse phase retardation profiles, with various projection angles from 0° to 180° [25]. In the well-known ‘filtered backprojection’ algorithm has been used for the implementation of the transformation [25, 26]. To evaluate the stress modifications in the UV-exposed fibers, single transverse projected phase retardation profiles and tomographic measurements were performed on the pristine fiber in a first step and on the fiber grating in a second step. In this section, we briefly describe the measurement procedure and present the experimental results obtained on both fiber samples. We then present the axial stress profiles calculated from the tomographic phase retardation measurements. In the following section, we will discuss how to obtain the other stress tensor elements and the dielectric tensor from the σzz result.
The optical tomographic stress measurement setup used a collimated CW 405 nm laser diode that was circularly polarized by a quarter waveplate in order to neutralize the power variation of a rotating polarizer. A detailed description of the measurement setup and of the experimental procedure is given in [17] and [18]. The phase image resolution was theoretically estimated to be ~0.6 μm based on diffraction-limited resolution of the optical microscope system. Note that this optical resolution has been experimentally confirmed to be equivalent to the stress image resolution of the polarization microscope [18]. Axial stress distribution profiles in the fiber transverse plane were obtained from 50 projection angles.
2.1 Phase retardation and stress distribution in the pristine fiber
The initial phase retardation was investigated on a 4-mm long pristine fiber section by taking 17 single transverse projected phase retardation measurements every 0.25 mm. A two-dimensional (2-D) color graph of these measurements is presented in Fig. 3-a. The measured phase retardation is symmetric with respect to the fiber axis and its distribution is invariant along this axis. A transversal cut of the measured retardation phase is presented in Fig. 3-b. The phase retardation distribution presents a central lobe located in the core region (between -3.05 and 3.05 μm) and two lateral lobes on both sides. The inner photosensitive cladding is located on the sides of the central lobe and the minimum phase retardation is reached just after the photosensitive inner cladding.
#94963 - $15.00 USD Received 11 Apr 2008; revised 26 May 2008; accepted 26 May 2008; published 29 May 2008
(C) 2008 OSA 9 June 2008 / Vol. 16, No. 12 / OPTICS EXPRESS 8732

3-D and 2-D representations of the calculated axial-stress distribution profile on the fiber cross-section are presented in Fig. 4-a and b, respectively. Five concentric annular regions with azimuthally symmetric axial stress can be identified in Fig. 4-b. The photosensitive core has a 3.05μm radius and is followed by the photosensitive inner cladding with a 3.2μm width. This structure is surrounded by a dark blue ring corresponding to a cladding region with a low stress of about -40 MPa and about 6.5μm width. Finally, we notice two other outer concentric cladding regions separated by what seems to be a circular stress relaxation region at their border (Fig. 4-a). In these two outer claddings, the axial stress increases gradually from 0 to 10 MPa at the external cladding border and it reaches –9MPa in the relaxation region.
2.3 Phase retardation and stress distribution in the grating
Along the grating, the variation of the phase retardation was investigated by taking 77 single transversal projected phase retardation profiles at intervals of 0.25 mm along a 19 mm long section to completely cover the grating region. Fig. 5-a and -b show the stress-induced phase retardation profile measured for one of the projection angles and as a function of the position along the grating. When the beam is only transmitted through the three outer claddings, the phase retardation does not present any profile change. However, the phase retardation undergoes an important increase when the beam goes through the UV-exposed core and the photosensitive inner cladding. This gradual increase of the phase retardation along the grating occurs in eight levels corresponding to the multiple-step profile of the scanning speed, with the slower speeds corresponding to the higher levels of phase retardation.
(a) (b)
Fig. 3. 2-D color graph of the phase retardation profile (φ) measured along 4 mm in a pristine fiber (a). Transversal cut of the phase retardation profile (b).
(a) (b)
Fig. 4. 3-D (a) and 2-D (b)representations of the axial stress in the pristine fiber cross-section.
#94963 - $15.00 USD Received 11 Apr 2008; revised 26 May 2008; accepted 26 May 2008; published 29 May 2008
(C) 2008 OSA 9 June 2008 / Vol. 16, No. 12 / OPTICS EXPRESS 8733
(a) (b)
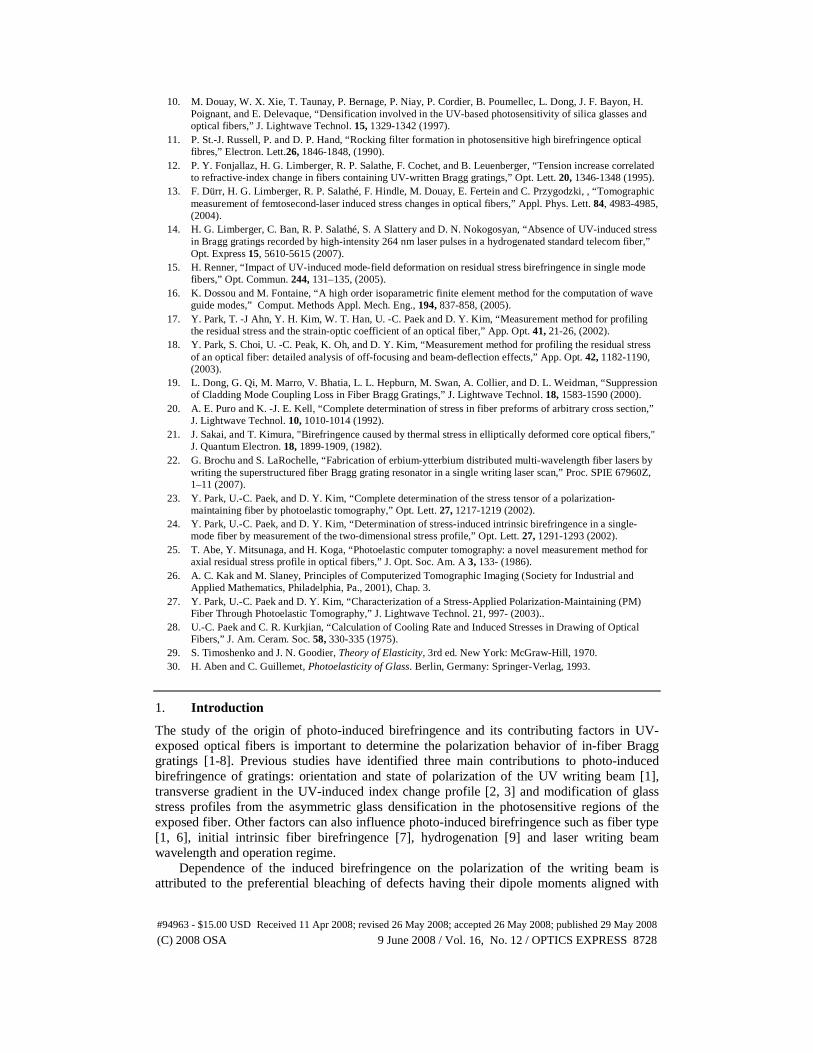
Fig. 5. Phase retardation profile measured along the grating and plotted in a 3-D (a) and 2-D (b) color graphs.
2-D axial stress profiles were also calculated from the phase retardation measurements obtained for each of the eight exposure levels. The results are presented in Fig. 6 starting with the high scanning speed segment corresponding to the lowest UV exposure (i), and ending with the segment with the highest exposure (viii). In all cases, the axial-stress variations are confined to the photosensitive regions and a gradual increase is clearly observed from section (i) to section (viii). In these representations the x axis is the axis parallel to the incident UV-laser writing beam. The maximum axial-stress increase occurred in the photosensitive inner cladding on the UV-beam trajectory on both sides of the core following a crescent-shaped profile. The left side of this profile is slightly longer than the right side; however the stress peak in the right side is slightly higher than that in the left side. That indicates that the UV-beam was probably focused slightly towards the right of the fiber axis. The two sides of the crescent-shaped stress profile become joined by their lower ends as the UV exposure level is increased (i.e. progress from (i) to (viii)), which seems to indicate that the UV-beam trajectory was also slightly shifted towards the bottom of the fiber.
3. Calculation of stress and dielectric tensors
In this section, we apply the formalism presented in [21] that allows the determination of the dielectric tensor of an anisotropic medium in the presence of stress. In [21], the authors examine the change of the dielectric tensor created by thermoelastic stress. The same analysis can be applied here even though the origin of the stress field is different. We determine in advance all stress components from the axial stress distribution according to the algorithm presented in [20]. The birefringence is then calculated using a highly accurate vectorial finite element mode solver that takes into account the anisotropic refractive index distribution. The birefringence caused by the photo-induced stress is compared to the total birefringence in the UV-inscribed grating computed from (1).
3.1 Stress-tensor
Once the axial-stress σzz has been determined, it can be shown that all stress tensor elements are linked by a scalar field, namely the stress function, F, through the following partial differential equation with its associated boundary conditions at the surface of the fiber [20]:
( )
2 2
2 2 2
1 1
, 0, 0cl
cl
zz
r rr r
F dF F
r r dr rdF
F rdr
σ χθ
θ=
=
⎧∂ ∂+ + = −⎪ ∂ ∂⎪⎨⎪ = =⎪⎩
(2)
where r and θ are the cylindrical coordinates, z the axial direction and χ an arbitrary harmonic function satisfying the condition 2 0χ∇ = . This equation can be solved by using the harmonic expansion method, which yields integral solutions [20, 27].
#94963 - $15.00 USD Received 11 Apr 2008; revised 26 May 2008; accepted 26 May 2008; published 29 May 2008
(C) 2008 OSA 9 June 2008 / Vol. 16, No. 12 / OPTICS EXPRESS 8734

σzz (MPa)
Fig. 6. Tomographic images of the axial-stress corresponding to the eight exposure levels.
After determining the stress function, the stress tensor elements ( ), ,rr rθθ θσ σ σ in cylindrical
coordinates can be determined from:
#94963 - $15.00 USD Received 11 Apr 2008; revised 26 May 2008; accepted 26 May 2008; published 29 May 2008
(C) 2008 OSA 9 June 2008 / Vol. 16, No. 12 / OPTICS EXPRESS 8735

2
2 2
2
2
2
2
1 1
1 1
rr
r
dF F
r dr r
F
r
dF F
r d r r
θθ
θ
σθ
σ
σθ θ
∂= +∂
∂=∂
∂= −∂ ∂
(3)
Considering zero axial strain condition, all other stress tensor elements are null. Using this method, we determine the stress tensors of the fiber before UV-exposure and for each exposure level in the grating. Strictly speaking the axial strain component is different from zero. However, when considering only the strain components generated by the photoinduced stresses, the axial strain can be considered to be zero (plane strain) as in [20] and in [21].
The residual stresses in optical fibers are permanently induced by three major factors during fiber drawing process [28]: the thermal stress, due to differential thermal expansion for fiber composition materials, the mechanically induced stress, and the frozen-in stress. In Fig. 7-a, the stress tensor elements of the CMSF fiber are presented. All stress tensor elements exhibit almost axisymmetric distribution and the shear element is close to zero over the cross section. The diagonal elements of the stress distributions are not identical but they are very similar. The stress values of each element are almost zero in both external cladding regions, they are close to -50 MPa in the lowest stress cladding area and rapidly increase in the photosensitive inner cladding to reach zero in the core.
After exposure, we expect that the stress tensor elements will change mostly in the photosensitive regions where a non-axisymmetric σzz distribution appears. The tensor elements of the higher level exposure region in the grating is presented in Fig. 7-b. The shear element varies between -5 and 5 MPa in the photosensitive regions. The highest stress values are reached for the axial stress σzz with 120 MPa in the inner photosensitive cladding. For the radial stress σrr, we observe two lobes located symmetrically with respect to the core along the x-axis and a depression area is visible above the core along the y-axis. In contrast, the two lobes are located along the y-axis for the azimuthal stress σθθ and the depression area is located before the core along the x-axis.
3.2 Dielectric tensor
The dielectric tensor ε is expressed by a three-dimensional matrix. When a cylindrical dielectric glass waveguide, i.e. an optical fiber, undergoes small perturbations, the dielectric tensor can be written as [21]:
[ ] [ ] [ ]iε ε δε= + (4)
where [ ]δε denotes the dielectric perturbation tensor and [ ] [ ]20i n Iε = denotes the dielectric
tensor of the unperturbed system with 0n being its refractive index (n0=nco in the core and
n0=ncl in the cladding) and [ ]I being the 3x3 unit matrix. The dielectric perturbation tensor
will be computed here from the stress tensor as explained below. In the general case, it is possible to find a coordinate system in which the shear stress
elements are equal to zero. In this case, the diagonal elements, ( ), ,rr zzθθσ σ σ� � �, are called
principal stress elements. The principal stress elements are solution of the following third-degree equation [29]:
( ) ( ) ( )2 2 0rr rr r zzθθ θθ θσ σ σ σ σ σ σ σ σ⎡ ⎤− + + − − =⎣ ⎦� �
(5)
#94963 - $15.00 USD Received 11 Apr 2008; revised 26 May 2008; accepted 26 May 2008; published 29 May 2008
(C) 2008 OSA 9 June 2008 / Vol. 16, No. 12 / OPTICS EXPRESS 8736

In [21], the solutions of Eq. (5) are approximated by:
rr rr
zz zz
θθ θθ
σ σ δσσ σ δσσ σ
= −= +=
�
�
�
(6)
where ( )
2r
rr
θ
θθ
σδσσ σ
−−
�
.
(a)
(b)
Fig. 7. Profiles of the non-zero elements of the stress tensor in the CMSF cross-section in a pristine fiber sample (a) and a UV-exposed fiber (grating, section viii) (b).
#94963 - $15.00 USD Received 11 Apr 2008; revised 26 May 2008; accepted 26 May 2008; published 29 May 2008
(C) 2008 OSA 9 June 2008 / Vol. 16, No. 12 / OPTICS EXPRESS 8737
(a)
(b)
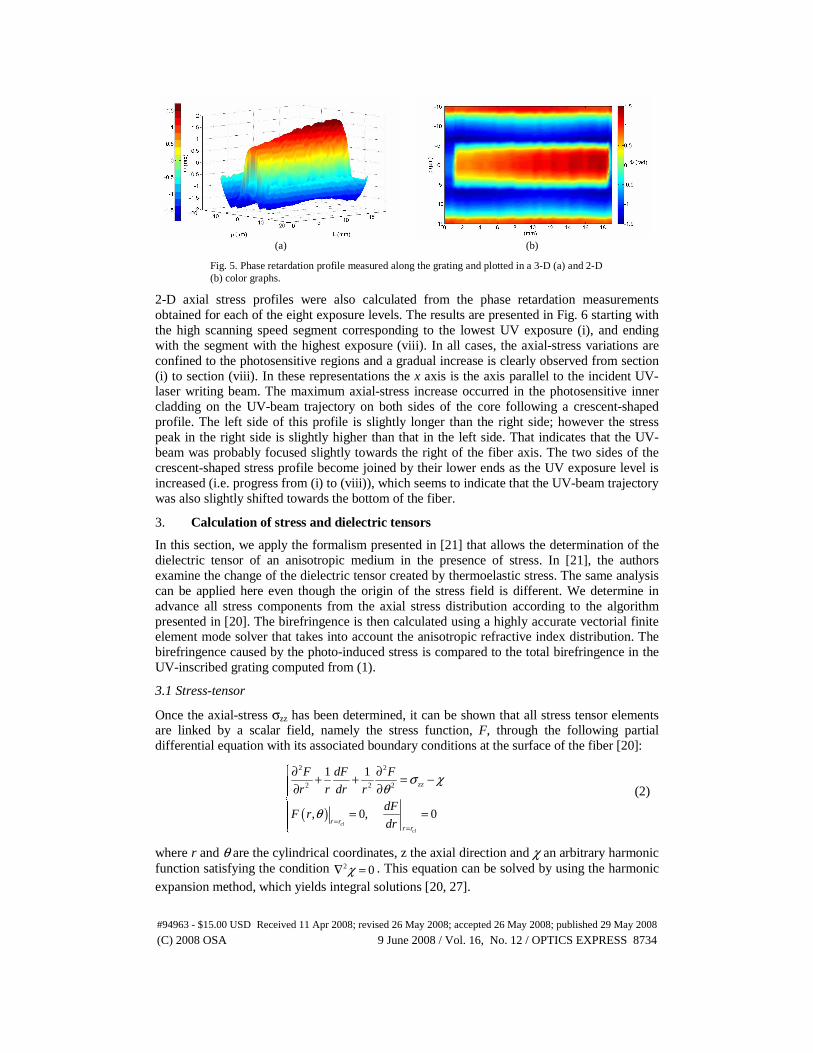
Fig. 8. The dielectric perturbation tensor elements of the unexposed CMSF (a) and of the region with the highest UV exposure level (section viii) in the fiber grating (b).
The principal refractive indices corresponding to the principal stress elements can be obtained through the usual photoelastic effect formulation as follows [29]:
#94963 - $15.00 USD Received 11 Apr 2008; revised 26 May 2008; accepted 26 May 2008; published 29 May 2008
(C) 2008 OSA 9 June 2008 / Vol. 16, No. 12 / OPTICS EXPRESS 8738
( )( )( )
0 1 2
0 1 2
0 1 2
rr rr zz
rr zz
zz zz rr
n n C C
n n C C
n n C C
θθ
θθ θθ
θθ
σ σ σσ σ σσ σ σ
= + + +
= + + +
= + + +
� � � �
� � � �
� � � �
(7)
For lack of better values related to doped silica, we use C1=-0.65x10⁻⁶ MPa and C2= -4.22x10⁻⁶ which are respectively the direct and lateral photoelastic constants of pure silica given in [30].
Finally, the dielectric perturbation tensor elements in the Cartesian coordinates system are obtained from (7) using the appropriate coordinate system transformations [21]. The elements of the dielectric perturbation tensor induced by the residual stress of the unexposed fiber are presented in Fig. 8-a. The diagonal elements of the dielectric perturbation tensor are vanishing everywhere except in the lower stress cladding ring where they reach 10-3. Slight perturbations, with values smaller than 10-4, are also observed in the shear element. The computed dielectric perturbation tensor element of the higher level exposure region (section viii) of the grating is presented Fig. 8-b. Material anisotropy and asymmetry is observed in photosensitive regions. The diagonal elements are negative in the core and in the inner cladding. In the lowest stress cladding ring, the perturbations are the same as in the unexposed fiber case. The shear elements of the exposed fiber are four times more important than those of the unexposed sample.
4. Results
To compute the resulting effective indices, the use of a vectorial method is necessary because of the anisotropic dielectric tensor. Therefore, we use a high-order finite element method (HFEM) with curvilinear elements at the interfaces and boundaries [16]. The accuracy of this method was previously verified in [5]. The effective indices of the orthogonally polarized fundamental eigen-modes were computed in the pristine fiber and in the grating. For the pristine CMSF fiber, with an ideal step-index profile, the calculation of the effective index, using a very accurate semi-analytical method based on Bessel function expansions of the longitudinal components Ez and Hz, gave neff=1.4504697142858 at 1550 nm while with the HFEM resulted in neff=1.4504697071256, which represents a precision of 7.16x10⁻⁹. The mesh used to reach this precision has 27092 nodes and 3600 element (Fig. 9) and the mesh density decreases from the core to the external cladding border. This reduction occurs in nine steps corresponding to nine concentric circles. These circles separate the physical surface, such as core- inner photosensitive cladding- lowest stress cladding area and outer cladding, and divide each physical surface in two or three mesh regions. On the circle, the triangular elements have a curvilinear side. Gradual meshing improves the accuracy of calculation. The density of elements is important in the core and the inner cladding because of the large variation of the dielectric perturbation tensor in these two regions. The mesh that we use considers a cladding radius eight times larger than that of the core (this choice did not affect the results and saved a lot of calculation time).
#94963 - $15.00 USD Received 11 Apr 2008; revised 26 May 2008; accepted 26 May 2008; published 29 May 2008
(C) 2008 OSA 9 June 2008 / Vol. 16, No. 12 / OPTICS EXPRESS 8739
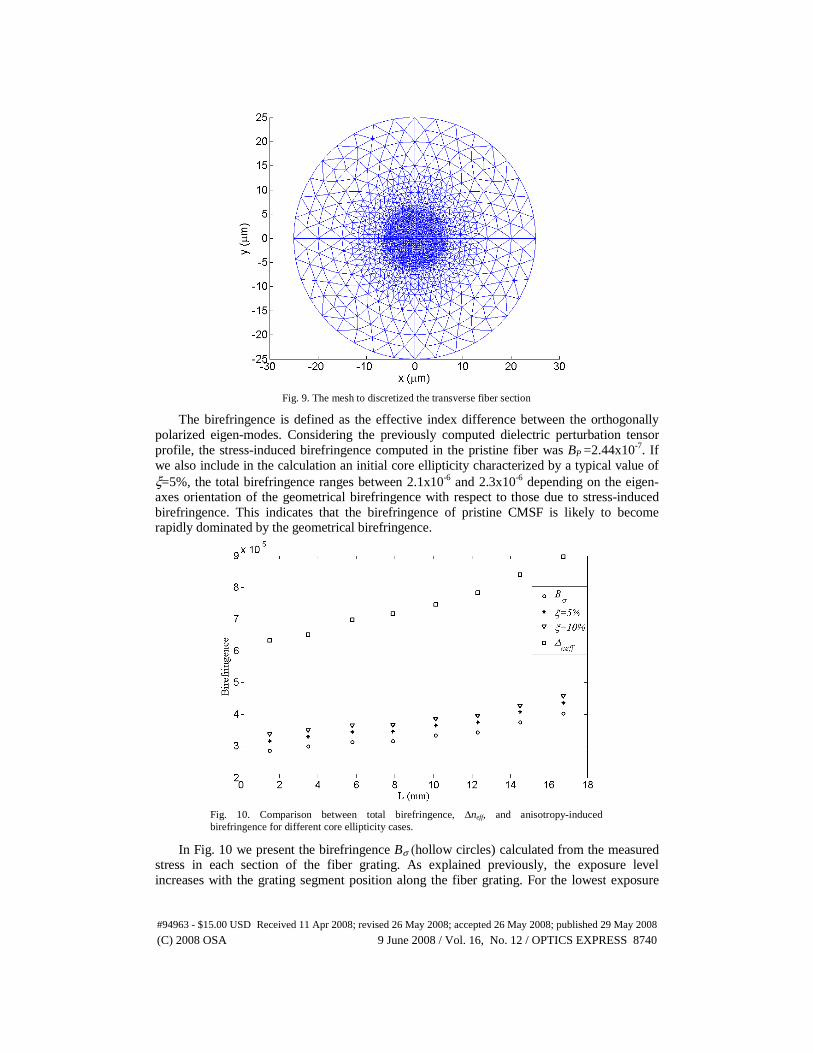
Fig. 9. The mesh to discretized the transverse fiber section
The birefringence is defined as the effective index difference between the orthogonally polarized eigen-modes. Considering the previously computed dielectric perturbation tensor profile, the stress-induced birefringence computed in the pristine fiber was BP =2.44x10⁻⁷. If we also include in the calculation an initial core ellipticity characterized by a typical value of ξ=5%, the total birefringence ranges between 2.1x10⁻⁶ and 2.3x10⁻⁶ depending on the eigen-axes orientation of the geometrical birefringence with respect to those due to stress-induced birefringence. This indicates that the birefringence of pristine CMSF is likely to become rapidly dominated by the geometrical birefringence.
Fig. 10. Comparison between total birefringence, Δneff, and anisotropy-induced birefringence for different core ellipticity cases.
In Fig. 10 we present the birefringence Bσ (hollow circles) calculated from the measured stress in each section of the fiber grating. As explained previously, the exposure level increases with the grating segment position along the fiber grating. For the lowest exposure
#94963 - $15.00 USD Received 11 Apr 2008; revised 26 May 2008; accepted 26 May 2008; published 29 May 2008
(C) 2008 OSA 9 June 2008 / Vol. 16, No. 12 / OPTICS EXPRESS 8740
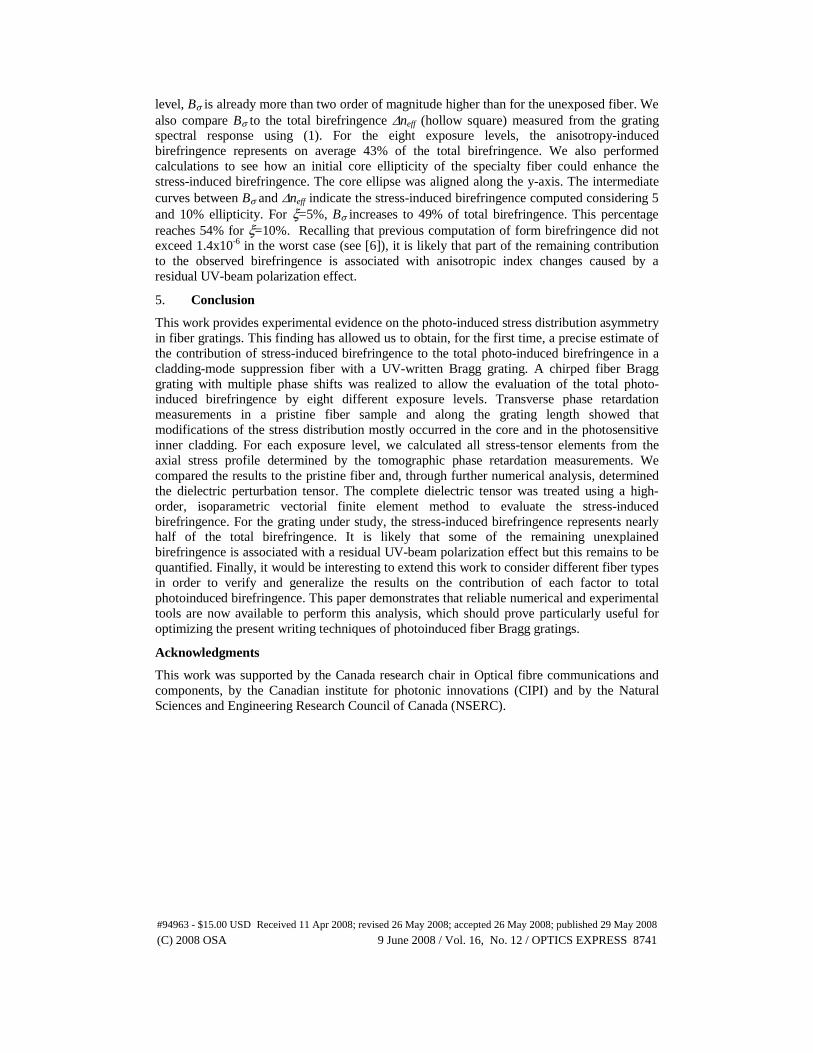
level, Bσ is already more than two order of magnitude higher than for the unexposed fiber. We also compare Bσ to the total birefringence Δneff (hollow square) measured from the grating spectral response using (1). For the eight exposure levels, the anisotropy-induced birefringence represents on average 43% of the total birefringence. We also performed calculations to see how an initial core ellipticity of the specialty fiber could enhance the stress-induced birefringence. The core ellipse was aligned along the y-axis. The intermediate curves between Bσ and Δneff indicate the stress-induced birefringence computed considering 5 and 10% ellipticity. For ξ=5%, Bσ increases to 49% of total birefringence. This percentage reaches 54% for ξ=10%. Recalling that previous computation of form birefringence did not exceed 1.4x10⁻⁶ in the worst case (see [6]), it is likely that part of the remaining contribution to the observed birefringence is associated with anisotropic index changes caused by a residual UV-beam polarization effect.
5. Conclusion
This work provides experimental evidence on the photo-induced stress distribution asymmetry in fiber gratings. This finding has allowed us to obtain, for the first time, a precise estimate of the contribution of stress-induced birefringence to the total photo-induced birefringence in a cladding-mode suppression fiber with a UV-written Bragg grating. A chirped fiber Bragg grating with multiple phase shifts was realized to allow the evaluation of the total photo-induced birefringence by eight different exposure levels. Transverse phase retardation measurements in a pristine fiber sample and along the grating length showed that modifications of the stress distribution mostly occurred in the core and in the photosensitive inner cladding. For each exposure level, we calculated all stress-tensor elements from the axial stress profile determined by the tomographic phase retardation measurements. We compared the results to the pristine fiber and, through further numerical analysis, determined the dielectric perturbation tensor. The complete dielectric tensor was treated using a high-order, isoparametric vectorial finite element method to evaluate the stress-induced birefringence. For the grating under study, the stress-induced birefringence represents nearly half of the total birefringence. It is likely that some of the remaining unexplained birefringence is associated with a residual UV-beam polarization effect but this remains to be quantified. Finally, it would be interesting to extend this work to consider different fiber types in order to verify and generalize the results on the contribution of each factor to total photoinduced birefringence. This paper demonstrates that reliable numerical and experimental tools are now available to perform this analysis, which should prove particularly useful for optimizing the present writing techniques of photoinduced fiber Bragg gratings.
Acknowledgments
This work was supported by the Canada research chair in Optical fibre communications and components, by the Canadian institute for photonic innovations (CIPI) and by the Natural Sciences and Engineering Research Council of Canada (NSERC).
#94963 - $15.00 USD Received 11 Apr 2008; revised 26 May 2008; accepted 26 May 2008; published 29 May 2008
(C) 2008 OSA 9 June 2008 / Vol. 16, No. 12 / OPTICS EXPRESS 8741