Embed Size (px)
Citation preview
Effect of Laser Induced Crystallinity Modification on Degradation and
Drug Release of Biodegradable Polymer
Shan-Ting Hsu
Submitted in partial fulfillment of the requirements for the degree of
Doctor of Philosophy in the Graduate School of Arts and Sciences
COLUMBIA UNIVERSITY
2013

© 2013 Shan-Ting Hsu
All rights reserved
ABSTRACT
Effect of Laser Induced Crystallinity Modification on Degradation and Drug Release of
Biodegradable Polymer
Shan-Ting Hsu
Biodegradable polymers such as poly(L-lactic acid) (PLLA) are promising in drug delivery
applications. In biodegradable polymer-based drug delivery systems, drugs are released at a
rate determined by polymer degradation. Polymer degradation exhibits an undesirable
induction period, during which a limited amount of embedded drug is released. As a
semi-crystalline polymer, PLLA degradation and drug release are affected by its crystallinity.
Control over PLLA crystallinity tailors drug release over time, and provides a potential solution
to shorten the induction period of polymer degradation and drug release.
The work presented in this thesis first investigates the crystalline morphology and crystallinity
developed during the PLLA film formation processes. Solvent casting, spin coating, and
subsequent annealing are conducted. The resulting morphology, crystallinity, molecular order,
conformation, and intermolecular interaction are examined using optical microscopy, wide-angle
X-ray diffraction, and Fourier transform infrared spectroscopy. Solvent casting produces
category 1 spherulites, and annealing the spin coated films leads to category 2 spherulites.
Crystal structure of the two kinds of films shows distinct features. The results advance the
understanding of PLLA crystal structures, which is essential for its medical applications.
Control over crystallinity allows for modification of PLLA degradation and drug release over
time. Laser irradiation is used in this study to induce surface melting and resolidification. The
high cooling rate of the laser treatment coupled with the slow polymer crystallization kinetics
leads to reduced surface crystallinity after the laser irradiation. Effects of laser irradiation on
the surface morphology, crystallinity, and chemical modifications are investigated via optical
microscopy, wide-angle X-ray diffraction, and X-ray photoelectron spectroscopy. The effect of
laser crystallinity modifications and drug loading concentration on PLLA biodegradation and
drug release is investigated. Degradation is characterized through molecular weight by gel
permeation chromatography. Drug release is measured by spectrophotometry. A finite
element model is developed to numerically examine the spatial and temporal temperature
profiles, as well as chemical modifications in the PLLA matrix after the laser treatment. Effect
of laser crystallinity modification on biodegradation and drug release is also numerically
investigated based on PLLA hydrolysis and diffusion mechanisms.
It has been demonstrated that laser irradiation reduces PLLA crystallinity. A working window
of laser fluence levels exists within which crystallinity is decreased while no appreciable
chemical modification is observed. The working window is enlarged for the higher crystalline
polymer as a result of the cage effect. The degradation and drug release tests show that the
addition of drug accelerates polymer degradation and drug release rate, because the porous
structure after drug release favors water penetration and hydrolysis based degradation. With a
low drug concentration, the slow polymer degradation kinetics results in an induction period of
drug release. The induction period is shortened by the laser treatment. It is demonstrated that
laser treated PLLA, with lower surface crystallinity, has a higher initial degradation rate while
the subsequent degradation is not modified. Because of the accelerated initial degradation, the
induction period of drug release is therefore shortened, while the drug release rate is kept
unmodified, which is desired in drug delivery applications.
i
Table of Contents
Chapter 1: Introduction ................................................................................................................... 1
1.1 Polymer Structure and Requirements for Crystallization ....................................... 1
1.2 Polymer Crystallization and Amorphization ........................................................... 3
1.2.1 Polymer Crystallization .................................................................................. 4
1.2.1.1 Polymer Crystalline Morphology ........................................................... 4
1.2.1.2 Polymer Crystallization Kinetics ............................................................ 5
1.2.2 Polymer Amorphization .................................................................................. 7
1.2.2.1 Polymer Amorphization Process ................................................................. 7
1.2.2.2 Polymer Amorphization Kinetics ............................................................ 8
1.3 Polymer Controlled Drug Release System .............................................................. 9
1.3.1 Mechanisms of Drug Release from Polymer Matrix .................................... 10
1.3.1.1 Diffusion Controlled Mechanism ......................................................... 10
1.3.1.2 Swelling Controlled Mechanism ........................................................... 11
1.3.1.3 Degradation Controlled Mechanism ..................................................... 11
1.3.2 Degradation of Biodegradable Polymer in Physiological Environments ..... 13
1.4 Factors Determining Polymer Degradation and Drug Release ............................. 14
1.4.1 Polymer Crystallinity .................................................................................... 14
1.4.2 Addition of Drug and Small Molecules ........................................................ 15
1.4.3 Irradiation ...................................................................................................... 17
1.4.3.1 γ-Irradiation ........................................................................................... 17
1.4.3.2 Laser Surface Irradiation ....................................................................... 18
1.4.4 Degradation and Drug Release Environment ............................................... 18
ii
1.5 Experimental Considerations ................................................................................ 20
1.5.1 Sample Preparation ....................................................................................... 20
1.5.1.1 Solvent-Involved Sample Formation Process ....................................... 20
1.5.1.2 Solvent-Free Sample Formation Process .............................................. 21
1.5.2 Laser System ................................................................................................. 23
1.5.3 Material Characterization .............................................................................. 25
1.5.3.1 Wide-Angle X-ray Diffraction .............................................................. 26
1.5.3.2 Gel Permeation Chromatography ......................................................... 27
1.5.3.3 Differential Scanning Calorimetry ........................................................ 30
1.6 Research Objectives and Organization of the Proposal ........................................ 31
Chapter 2: Effect of Film Formation Method and Annealing on Morphology and Crystal
Structure of Poly(L-Lactic Acid) Films ........................................................................................ 34
2.1 Introduction ........................................................................................................... 34
2.2 Background ........................................................................................................... 36
2.2.1 Nucleation and Crystallization ...................................................................... 37
2.2.2 Mobility of Polymer Molecules in Solution and Melt .................................. 37
2.2.3 Structure of Spherulites................................................................................. 39
2.3 Materials and Methods .......................................................................................... 40
2.3.1 Sample Preparation and Annealing ............................................................... 40
2.3.2 Characterization ............................................................................................ 40
2.4 Results and Discussion .......................................................................................... 41
2.4.1 Morphology................................................................................................... 41
2.4.2 Molecular Order ............................................................................................ 45
iii
2.4.3 Conformation of Molecules and Intermolecular Interaction ........................ 54
2.5 Conclusions ........................................................................................................... 60
Chapter 3: Effect of Excimer Laser Irradiation on Crystallinity and Chemical Bonding of
Biodegradable Polymer ................................................................................................................. 62
3.1 Introduction ........................................................................................................... 62
3.2 Background ........................................................................................................... 64
3.2.1 Melting and Crystallization........................................................................... 64
3.2.2 Interaction between Photons and Polymers .................................................. 65
3.2.3 Dissociation Quantum Yield ......................................................................... 66
3.3 Numerical Model ................................................................................................... 67
3.4 Materials and Methods .......................................................................................... 71
3.5 Results and Discussion .......................................................................................... 71
3.5.1 Effects of Laser Irradiation on Morphology ................................................. 71
3.5.2 Decrease of Crystallinity by Laser Irradiation .............................................. 73
3.5.3 Chemical Modifications ................................................................................ 78
3.5.3.1 Modifications of Chemical Bonds ........................................................ 78
3.5.3.2 Effect of Radical Mobility on the Amount of Chemical Modifications 83
3.6 Conclusions ........................................................................................................... 88
Chapter 4: Effect of Laser Induced Crystallinity Modification on Biodegradation Profile of
Poly(L-Lactic Acid) ....................................................................................................................... 90
4.1 Introduction ........................................................................................................... 90
4.2 Background ........................................................................................................... 92
4.2.1 Laser Melting of Polymer ............................................................................. 92
iv
4.2.2 Biodegradation of Polyester .......................................................................... 92
4.3 Numerical Model ................................................................................................... 95
4.4 Materials and Methods .......................................................................................... 98
4.5 Results and Discussion .......................................................................................... 99
4.5.1 Effect of Laser Irradiation on Crystallinity and Chemical Modifications .... 99
4.5.2 Effect of Laser Irradiation on Degradation ................................................. 101
4.5.2.1 Modification of Morphology .............................................................. 101
4.5.2.2 Modification of Crystallinity .............................................................. 104
4.5.2.3 Modification of Molecular Weight and Mass ..................................... 106
4.5.3 Concentration of Species during Degradation ............................................ 113
4.6 Conclusions ......................................................................................................... 115
Chapter 5: Effect of Drug Loading and Laser Surface Melting on Polymer Biodegradation and
Drug Release Profile ................................................................................................................... 116
5.1 Introduction ......................................................................................................... 116
5.2 Background ......................................................................................................... 119
5.2.1 Effect of Additives on Polymer Mobility .................................................... 119
5.2.2 Biodegradation of Polyester ........................................................................ 119
5.2.3 Drug Release from Biodegradable Polymers .............................................. 120
5.3 Numerical Model ................................................................................................. 121
5.4 Materials and Methods ........................................................................................ 125
5.5 Results and Discussion ........................................................................................ 127
5.5.1 Effect of Drug Loading on Chain Mobility and Polymer Crystallinity ...... 127
5.5.2 Effect of Drug Concentration on Polymer Degradation and Drug Release 132
v
5.5.2.1 Polymer Degradation during Drug Release ........................................ 132
5.5.2.2 Drug Release ....................................................................................... 136
5.5.2.3 Polymer Crystallization during Drug Release .................................... 140
5.5.3 Laser Modification of Polymer Degradation and Drug Release Profile ..... 142
5.5.3.1 Laser Modification of Polymer Crystallinity ...................................... 142
5.5.3.2 Polymer Degradation during Drug Release ........................................ 144
5.5.3.3 Drug Release ....................................................................................... 146
5.5.3.4 Polymer Crystallization during Drug Release .................................... 147
5.6 Conclusions ......................................................................................................... 148
Chapter 6: Conclusions ............................................................................................................... 150
6.1 Effect of Sample Formation Process on Morphology and Crystal Structure of
Biodegradable Polymer ....................................................................................... 150
6.2 Laser Crystallinity Modification of Biodegradable Polymer .............................. 151
6.3 Modification of Polymer Biodegradation by Laser Melting ............................... 152
6.4 Effect of Drug Loading on Degradation and Drug Release of Biodegradable
Polymer ............................................................................................................... 153
6.5 Shortening of Induction Period of Drug Release by Laser Melting .................... 154
6.6 Future Work ......................................................................................................... 155
References ................................................................................................................................... 157
Appendix ..................................................................................................................................... 171
A.1 Calculation of Polymer Crystallinity from Wide Angle X-Ray Diffraction Method ... 171
A.2 Finite Element Models ................................................................................................. 172
A.2.1 Model of Laser Induced Thermal and Chemical Modifications ................. 173
vi
A.2.2 Model of Polymer Biodegradation Process ................................................ 174
A.2.3 Model of Drug Release Process .................................................................. 175
A.3 Purification Process of Drug Loaded PLLA Matrix for GPC measurements ..... 176
A.4 Publications Under Candidature .......................................................................... 177
vii
List of Figures Chapter 1
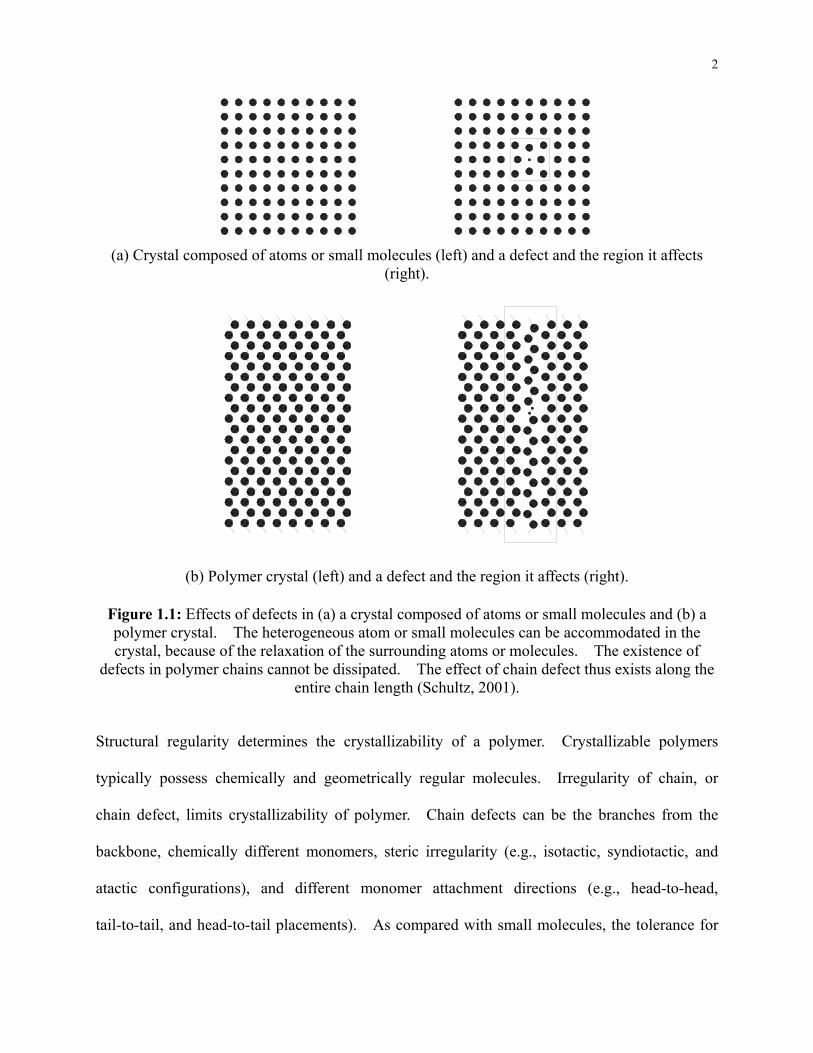
Figure 1.1: Effects of defects in (a) a crystal composed of atoms or small molecules and (b) a
polymer crystal. The heterogeneous atom or small molecules can be accommodated in
the crystal, because of the relaxation of the surrounding atoms or molecules. The
existence of defects in polymer chains cannot be dissipated. The effect of chain defect
thus exists along the entire chain length (Schultz, 2001). ..................................................... 2
Figure 1.2: Sketch of the morphology of two categories of spherulites. (a) Category 1
spherulite, which features the central multidirectional growth. (b) Category 2 spherulite,
which features sheaf-like unidirectional growth and double circle appearance (Norton &
Keller, 1985). ......................................................................................................................... 5
Figure 1.3: (a) Melting of the lamellae at temperatures higher than the melting temperature.
Decrease of crystallinity occurs within ns. (b) Snapshots of gradually melting lamella at
different times at 370 K. The lamella growth front retreats with time. The vertical
yellow line is for the ease of identifying withdrawal of the growth font (Yamamoto, 2010).
............................................................................................................................................... 9
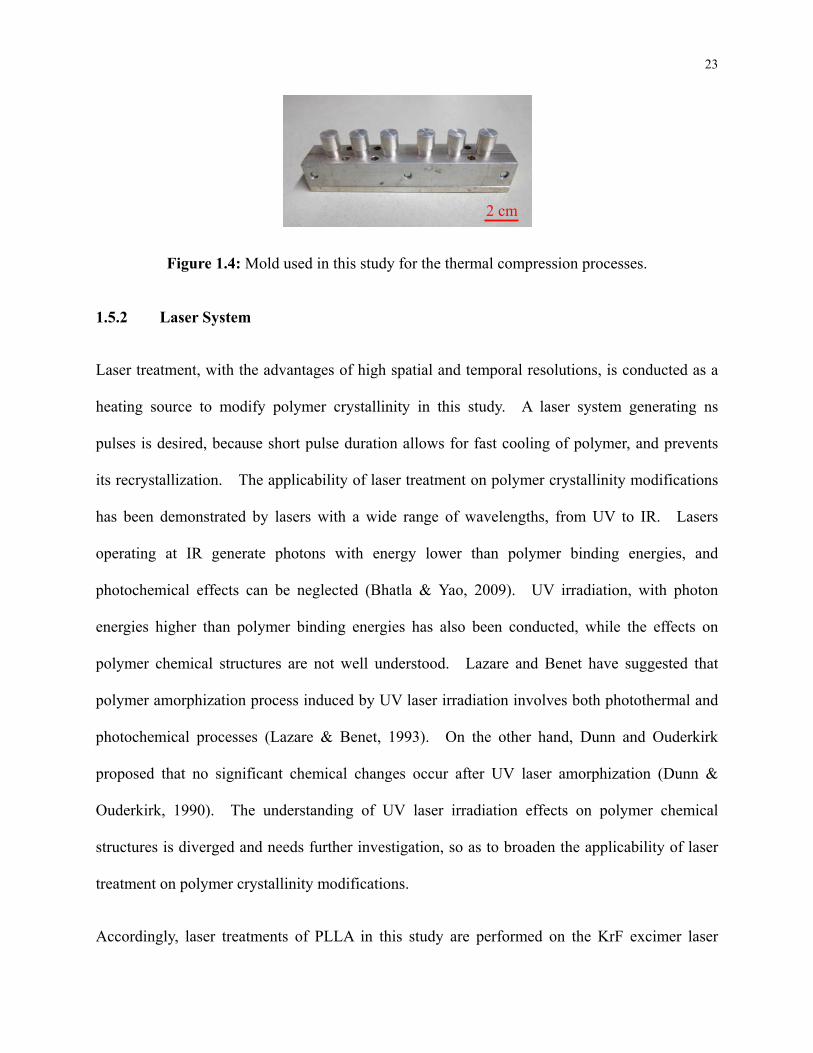
Figure 1.4: Mold used in this study for the thermal compression processes. .............................. 23
Figure 1.5: The excimer laser system used in the study. The system is composed of the
homogenizer and mask to generate a top hat pulse with a desired spot size. Laser pulse
irradiation is controlled by the computer. ............................................................................ 24
Figure 1.6: Sketch of the working principle of laser beam homogenization. .............................. 25
Figure 1.7: WAXD profile from semi-crystalline polyethylene. The dashed line shows the
estimated position of the amorphous scattering intensity (Campbell et al., 2000). ............. 27
Figure 1.8: GPC separation of polymer molecules with two different sizes. (a) the mixture of
viii
polymer molecules upon injection; (b) the mixture enters the porous column because of the
applied pressure gradient through the column length; (c) the small molecules are trapped
by the pores and flow slowly, but larger molecules are not, from which the molecules are
separated; (d) complete elution of large molecules. ............................................................ 29
Figure 1.9: DSC thermograms of poly (lactic acid) blended with plasticizer at different
concentrations (a) 0 wt %, (b) 5 wt %, (c) 10 wt %, (d) 15 wt %, (e) 20 wt %, (f) 25 wt %,
and (g) 30 wt %. The scanning rate is 40°C/min (Yeh et al., 2009). ................................ 31
Chapter 2
Figure 2.1: (a) The morphology of solvent cast film annealed at 140°C for 3 hours. The
morphology is similar to that of the as cast film. (b) The morphology of spin coated film
annealed at 140°C for 3 hours. The eye structure is observed. ........................................ 43
Figure 2.2: The morphology of spin coated film annealed at 140°C for 24 hours. Eye structure
remains observable while the boundary of spherulites can be more clearly observed. The
spherical symmetry does not extend to the center, and the sheaf-like features are preserved.
............................................................................................................................................. 45
Figure 2.3: (a) Sketch of the lamellar structure in solvent cast films. (b) Sketch of the lamellar
structure in spin coated films. .............................................................................................. 46
Figure 2.4: (a) WAXD profiles for solvent cast films annealed at different temperatures for 3
hours. Dotted line under the as cast film is the fitted curve for the amorphous region. (b)
WAXD profiles for spin coated films annealed at different temperatures. The (010) peak
start to emerge after 140°C annealing for 24 hours. Dotted line under the 80°C annealed
film is the fitted curve for the amorphous region. ............................................................... 49
ix
Figure 2.5: Intensity ratio I(110)/(200)/I(203) of the solvent cast and spin coated films annealed for 3
hours. The error bar represents the standard deviation. .................................................... 50
Figure 2.6: Location of the (110)/(200) peak for the solvent cast and spin coated films annealed
for 3 hours. The error bar represents the standard deviation. ........................................... 50
Figure 2.7: Degree of crystallinity of the solvent cast and spin coated films annealed for 3 hours.
Annealing temperature of 25°C means the as cast film. The error bar represents the
standard deviation. ............................................................................................................... 53
Figure 2.8: Degree of crystallinity and peak location of the spin coated films annealed at 140 °C
for 1, 3, 8, and 24 hours. ...................................................................................................... 54
Figure 2.9: (a) FTIR spectra of the solvent cast films before annealing and after annealed in
different conditions. (b) FTIR spectra of the spin coated films before annealing and after
annealed in different conditions. ......................................................................................... 56
Figure 2.10: (a) Curve fitting for the gt and tt conformers in the carbonyl C=O stretching region
of the as cast solvent cast film. (b) Curve fitting for the gt and tt conformers in the
carbonyl C=O stretching region of the solvent cast film annealed at 140°C for 3 hours. ... 57
Figure 2.11: Carbonyl C=O stretching region of the spin coated films annealed at different
temperatures for 3 hours. ..................................................................................................... 57
Figure 2.12: Second derivative spectra of the C=O stretching region for solvent cast and spin
coated films before annealing and annealed at different temperatures for 3 hours. ............ 58
Figure 2.13: Peak width of the resolved spectra for the gt and tt conformers of solvent cast films
before annealing and after annealed in different conditions. The error bar represents the
standard deviation of the five measurements. ..................................................................... 59
x
Chapter 3
Figure 3.1: Elementary events following the polymer absorption of photons with energies higher
than the polymeric bond energy........................................................................................... 66
Figure 3.2: Morphologies of the film with high radical mobility treated with fluence of (a) 2.50
J/cm2 and (b) 2.60 J/cm2, and film with low radical mobility treated with fluence of (c)
2.60 J/cm2 and (d) 2.70 J/cm2. ............................................................................................. 72
Figure 3.3: WAXD profiles of crystalline PLLA films with high radical mobility before and after
laser treatment. Note that the peaks decrease at higher fluences (2.40 and 2.60 J/cm2).
The same trend is observed for the films with low radical mobility. .................................. 74
Figure 3.4: Crystallinity of PLLA films derived from the WAXD results as a function of laser
fluence. ................................................................................................................................ 75
Figure 3.5: Simulation result of the typical temperature distribution in the film. This
simulation depicts the film with high radical mobility 1 μs after the onset of a 2.40 J/cm2
laser pulse. ........................................................................................................................... 75
Figure 3.6: Simulation results of the melting depth in the film and the normalized number
density of the CH3CHCOO units connecting at their ester group with other CH3CHCOO
units. .................................................................................................................................... 76
Figure 3.7: Simulation result of the typical film temperature profiles as a function of time after
laser irradiation. The simulation predicts the temperature profile on the surface of the
film with low radical mobility treated a single pulse with fluence of 1.80 and 2.80 J/cm2. 77
Figure 3.8: Typical C1s XPS spectra and the resolved peaks of the film before and after laser
treatment. The figures show the results of the film with high radical mobility (a) before
laser treatment, and treated with fluences of (b) 2.50 J/cm2 and (c) 2.60 J/cm2. Note that
xi
the peak area ratio does not agree with the theoretical value, 1:1:1; a possible reason is
given in Sec. 3.5.3.1. ........................................................................................................... 79
Figure 3.9: Area percentage of the three resolved peaks in the C1s XPS spectra of the films with
(a) high radical mobility and (b) low radical mobility. ....................................................... 80
Figure 3.10: Ratio of the O1s peak area to the C1s peak area derived from the XPS spectra for the
films with high and low radical mobility. ............................................................................ 81
Figure 3.11: Simulation results of the typical normalized number density of the CH3CHCOO
units connecting at their ester group with other CH3CHCOO units on the surface. Results
of the film with high radical mobility are shown. ............................................................... 84
Figure 3.12: Simulation results of the typical absolute value of the reaction rate of Eq. (9) for the
amorphous domain after the onset of laser pulse. Results of the film with high radical
mobility are shown. ............................................................................................................. 85
Figure 3.13: Simulation results of the typical absolute value of the reaction rate of Eq. (9) for the
crystalline domain after the onset of laser pulse. Results of the film with high radical
mobility are shown. ............................................................................................................. 87
Chapter 4
Figure 4.1: Schematic representation of (a) semicrystalline structure and (b) crystalline residue
of polymer after hydrolysis, which preferentially occurs in amorphous region and on
crystal fold surface (Tsuji & Ikarashi, 2004)....................................................................... 94
Figure 4.2: Non-degraded PLLA sample (a) before and (b) after laser treatment with a fluence of
3 J/cm2. Laser irradiated spots show less transparency due to increased surface roughness.
The laser-treated sample degraded for 14 days is given in (c) and its high crystallinity
xii
reduces the transparency. ................................................................................................... 100
Figure 4.3: PLLA crystallinity and the ratio of O1s to C1s as a function of laser fluence. The
error bar represents the standard deviation of 3 data points. ............................................. 100
Figure 4.4: Surface morphology of the laser treated sample (a) before and after degradation for
(b) 3, (c) 8, and (d) 14 days under the stereomicroscope. The squares in (a) are laser spots.
The edges of laser spots become less defined with degradation period, suggesting the
erosion of laser melted layer. Degradation in the non-melted bulk volume occurs in the
later stage. .......................................................................................................................... 102
Figure 4.5: Cross section of the laser-treated sample degraded for 14 days. The bulk remains
solid, suggesting that autocatalysis is not dominant. ......................................................... 102
Figure 4.6: Simulated spatial distribution of monomer concentration in the laser treated sample
degraded for (a) 0.5 days and (b) 6 days. .......................................................................... 103
Figure 4.7: WAXD profiles of the (a) non-laser treated and (b) laser treated samples degraded
for regular periods. Intensity of crystalline peaks increases with degradation period,
suggesting a higher crystallinity. Profiles are shifted in y direction for viewing clarity. 105
Figure 4.8: Crystallinity as a function of degradation period determined from WAXD.
Crystallinity increases with degradation period. A significant increase occurs on day 0.5
for both types of samples. Crystallinity also increases on day 8 and day 5 for the
non-laser treated and laser treated samples, respectively. The error bar represents the
standard deviation of 3 data points. ................................................................................... 105
Figure 4.9: GPC profiles of the (a) non-laser treated and (b) laser treated samples after regular
degradation periods. For (a), the distribution becomes wider and shifts left as the
degradation period increases to day 5, representing the random chain scission in the
xiii
amorphous region. After day 8, a distinct new peak is developed due to selective chain
scission of the fold surface of crystals. For (b), the MW distribution extends to the left
before day 3, signifying the random chain scission of the laser melt layer. At day 5, two
distinct peaks are developed due to the selective chain scission of the partially melted
crystal fold surfaces. Profiles are shifted in y direction for viewing clarity. .................. 107
Figure 4.10: Mw, Mn, and PDI of the (a) non-laser treated and (b) laser treated samples after
regular degradation periods. Mw and Mn decrease at a higher rate for the laser treated
samples, as a result of fast degradation in the laser melted layer. The non-homogeneous
degradation of the melted layer and bulk increases PDI. The error bar represents the
standard deviation of 3 data points. ................................................................................... 108
Figure 4.11: Experimental results of sample mass with and without laser treatments. Mass
decrease is observed after day 8 for non-laser treated sample and after day 3 for laser
treated sample. The error bar represents the standard deviation of 3 data points. ......... 109
Figure 4.12: Simulated MW of the non-laser treated and laser treated samples. ....................... 111
Figure 4.13: Simulated mass change of the non-laser treated and laser treated samples. ......... 112
Figure 4.14: Molar concentration of the simulated species as a function of degradation period.
(a) In the center of the non-laser treated sample. (b) In the laser melted layer of the laser
treated sample .................................................................................................................... 114
Chapter 5
Figure 5.1: Non-laser treated PLLA matrices loaded with 5 % drug (a) before degradation and
drug release, and degraded and released for (b) 35, (c) 49, (d) 70 days. ........................... 127
Figure 5.2: WAXD profiles of PLLA with different drug loading concentrations. Intensity of
xiv
crystalline peaks increases with drug concentration, suggesting a higher crystallinity.
Profiles are shifted in y direction for viewing clarity. ....................................................... 128
Figure 5.3: DSC thermograms of pure PLLA and PLLA loaded with 1 %, 5 %, 10 %, and 20 %
drug (a) heating from 50 to 200 °C and (b) around the glass transition temperature. The
heating rate is 5 °C/min. .................................................................................................... 130
Figure 5.4: Glass transition temperature and melting temperature of drug loaded PLLA matrices
as a function of drug concentration. .................................................................................. 131
Figure 5.5: Crystallinity as a function of drug loading concentration obtained from WAXD and
DSC. Crystallinity increases with drug concentration based on both measurements. The
error bar represents the standard deviation of 3 data points. ............................................. 131
Figure 5.6: GPC profiles of the non-laser treated PLLA matrices loaded with (a) 0 % and (b) 1
% drug as a function of degradation and drug release period. .......................................... 133
Figure 5.7: Number average and weight average molecular weights of (a) pure PLLA and PLLA
loaded with (b) 1 % (c) 5 % (d) 10 % (e) 20 % drug with polymer degradation and drug
release period. For pure PLLA and PLLA loaded with 1 %, 5 %, and 10 % drug, effect of
laser melting on degradation is also studied. ..................................................................... 136
Figure 5.8: (a) Absorbance spectra of the drug/PBS solutions with different drug concentrations.
(b) Linear relationship between absorbance at 552 nm and drug concentration in PBS.
Rhodamine B is used as the model drug. .......................................................................... 137
Figure 5.9: Drug release profiles of PLLA with different drug loading concentrations. ........... 138
Figure 5.10: Simulated spatial distribution of drug concentration in non-laser treated PLLA
loaded with 5 % drug after release for (a) 30 and (b) 70 days. Drug concentration is
represented as a percentage of initial value. ...................................................................... 139
xv
Figure 5.11: Crystallinity of non-laser treated PLLA loaded with 1 %, 5 %, 10 %, and 20 % drug
as a function of polymer degradation and drug release period. ......................................... 141
Figure 5.12: WAXD profiles of PLLA before and after laser treatment. Intensity of crystalline
peaks decreases after laser treatment, suggesting a reduced crystallinity. Profiles are
shifted in y direction for viewing clarity. .......................................................................... 143
Figure 5.13: Crystallinity of 1 %, 5 %, and 10 % drug loaded PLLA before and after laser
treatment. Laser treatment reduces crystallinity. Crystallinity decreases at a smaller
extent for higher drug concentrated PLLA. ....................................................................... 143
Figure 5.14: GPC profiles of the laser treated PLLA matrices loaded with (a) 0 % and (b) 1 %
drug as a function of degradation and drug release period. ............................................... 145
Figure 5.15: Modification of drug release profiles through laser melting. The induction period
of drug release is shortened due to laser treatment. ........................................................... 147
Figure 5.16: Crystallinity of laser treated PLLA loaded with 1 %, 5 %, and 10 % drug as a
function of polymer degradation and drug release period. ................................................ 148
xvi
Acknowledgements
The completion of this thesis cannot be possible without the aid of a number of individuals and
groups. First of all, I would like to express my deepest gratitude towards my academic advisor,
Prof. Y. Lawrence Yao. His academic guidance, expert advice, attention to detail, and hard
work have set an example I hope to achieve some day. I would also like to acknowledge my
thesis committee members, Prof. Jeffrey W. Kysar, Prof. James S. Im, Prof. Christopher J.
Durning, and Prof. Qiao Lin, for their time and precious comments. Financial supports from
Columbia University and National Science Foundation are also gratefully acknowledged.
Great gratitude goes to my colleagues in the Manufacturing Research Lab, Gen Satoh, Panjawat
Kongsuwan, Hongliang Wang, Huade Tan, and Grant Brandal, for their friendship and generous
help. I would also like to thank Dr. Young Suk Park at Brookhaven National Lab for his help
with the DSC and a portion of GPC measurements conducted in this thesis. Technical and
practical guidance during experiments from Dr. Chien-Yang Chiu, Dr. Po-Hua Lee, Dr.
Benjamin Dach, Dr. Xuegong Lei, Dr. Yongjun Li, and Dr. Xia Li is gratefully appreciated.
Many thanks are owed to my parents who have been standing by my side and supporting me in
various ways. Finally, I would like to thank my girlfriend to whom I am deeply grateful, for her
understanding and support during my Ph.D. studies.
1
Chapter 1: Introduction
1.1 Polymer Structure and Requirements for Crystallization
A polymer is a compound with high molecular weight. The structure of a polymer is composed
of chains of small repeat units known as monomers. Configuration and conformation are the
two terms commonly used to describe polymer structures. Configuration refers to the
organization of atoms or groups along the polymer chain and is determined during the
polymerization process. Configuration can only be changed by breaking and reforming existing
chemical bonds. Conformation refers to the arrangement of atoms or groups, and can be altered
through rotating the atoms or groups around a single bond. Different configurations result from
different placements of the monomers, including the head-to-head, tail-to-tail, and head-to-tail
placements, as well as stereoregular arrangements. Based on different monomer placements, a
polymer chain can possess isotactic configuration, syndiotactic configuration, or atactic
configuration. In isotactic configuration, all the side groups lie on the same side of the plane of
the chain. If the side groups lie alternately above and below the plane, the chain has a
syndiotactic configuration. If the side groups have a random sequence of positions, the
configuration is atactic. Usually the thermodynamically and spatially preferred configuration is
the syndiotactic configuration. Conformation includes the trans, gauche, and cis arrangements
of consecutive C-C single bonds and helical arrangements of crystalline polymers. The trans
conformation is staggered and the rotation angle of R-C-C-R is 180°. The trans conformation is
the most energetically stable. The gauche form is the next most stable conformation. The cis
conformation corresponds to the R-C-C-R rotation angle 0°, and is the least energetically stable.
2
(a) Crystal composed of atoms or small molecules (left) and a defect and the region it affects
(right).
(b) Polymer crystal (left) and a defect and the region it affects (right).
Figure 1.1: Effects of defects in (a) a crystal composed of atoms or small molecules and (b) a polymer crystal. The heterogeneous atom or small molecules can be accommodated in the crystal, because of the relaxation of the surrounding atoms or molecules. The existence of
defects in polymer chains cannot be dissipated. The effect of chain defect thus exists along the entire chain length (Schultz, 2001).
Structural regularity determines the crystallizability of a polymer. Crystallizable polymers
typically possess chemically and geometrically regular molecules. Irregularity of chain, or
chain defect, limits crystallizability of polymer. Chain defects can be the branches from the
backbone, chemically different monomers, steric irregularity (e.g., isotactic, syndiotactic, and
atactic configurations), and different monomer attachment directions (e.g., head-to-head,
tail-to-tail, and head-to-tail placements). As compared with small molecules, the tolerance for
3
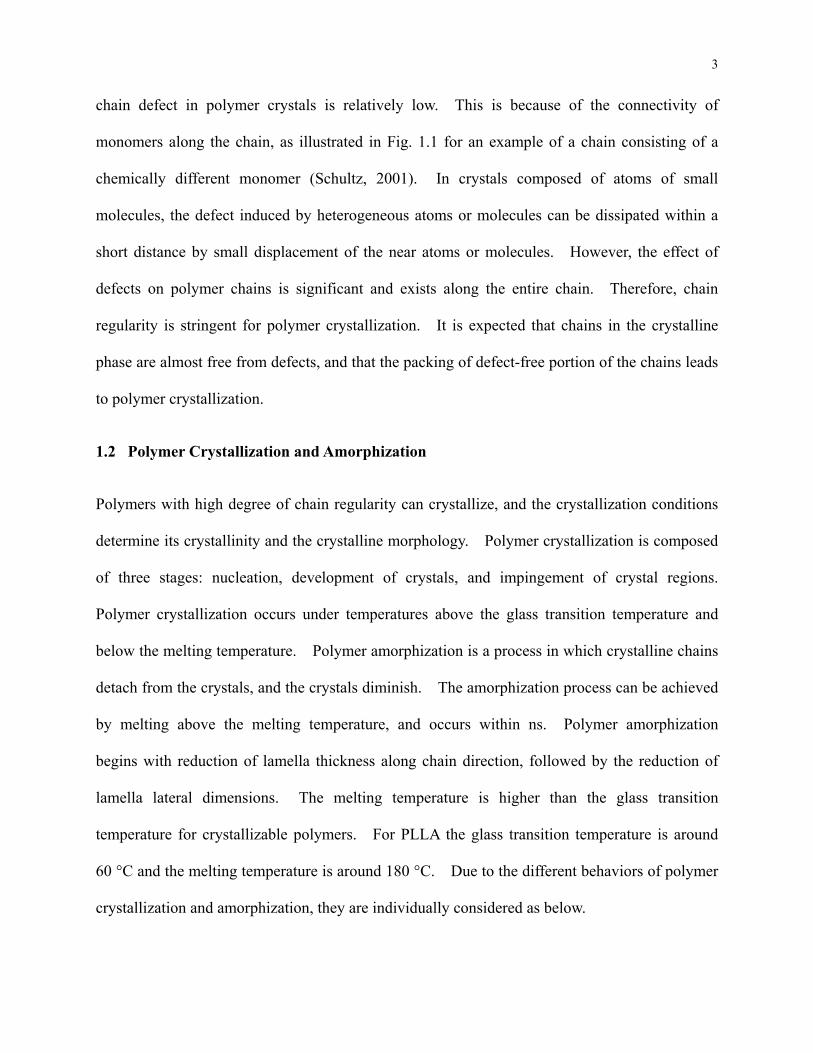
chain defect in polymer crystals is relatively low. This is because of the connectivity of
monomers along the chain, as illustrated in Fig. 1.1 for an example of a chain consisting of a
chemically different monomer (Schultz, 2001). In crystals composed of atoms of small
molecules, the defect induced by heterogeneous atoms or molecules can be dissipated within a
short distance by small displacement of the near atoms or molecules. However, the effect of
defects on polymer chains is significant and exists along the entire chain. Therefore, chain
regularity is stringent for polymer crystallization. It is expected that chains in the crystalline
phase are almost free from defects, and that the packing of defect-free portion of the chains leads
to polymer crystallization.
1.2 Polymer Crystallization and Amorphization
Polymers with high degree of chain regularity can crystallize, and the crystallization conditions
determine its crystallinity and the crystalline morphology. Polymer crystallization is composed
of three stages: nucleation, development of crystals, and impingement of crystal regions.
Polymer crystallization occurs under temperatures above the glass transition temperature and
below the melting temperature. Polymer amorphization is a process in which crystalline chains
detach from the crystals, and the crystals diminish. The amorphization process can be achieved
by melting above the melting temperature, and occurs within ns. Polymer amorphization
begins with reduction of lamella thickness along chain direction, followed by the reduction of
lamella lateral dimensions. The melting temperature is higher than the glass transition
temperature for crystallizable polymers. For PLLA the glass transition temperature is around
60 °C and the melting temperature is around 180 °C. Due to the different behaviors of polymer
crystallization and amorphization, they are individually considered as below.
4
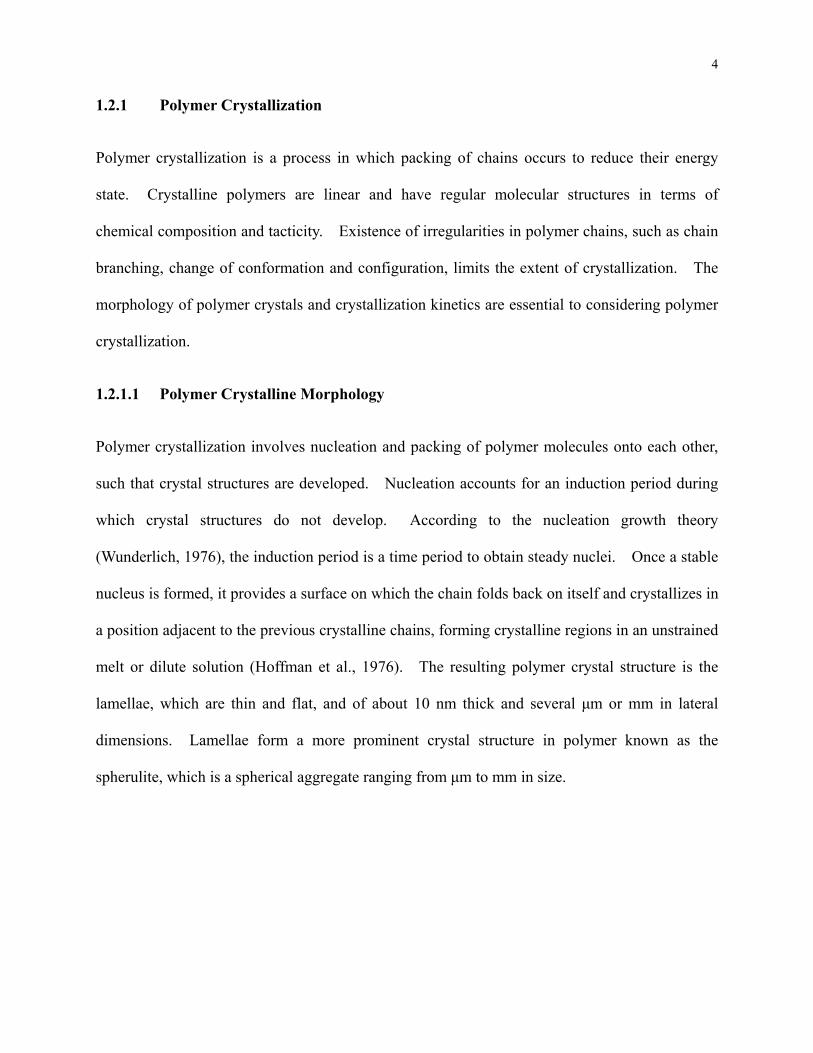
1.2.1 Polymer Crystallization
Polymer crystallization is a process in which packing of chains occurs to reduce their energy
state. Crystalline polymers are linear and have regular molecular structures in terms of
chemical composition and tacticity. Existence of irregularities in polymer chains, such as chain
branching, change of conformation and configuration, limits the extent of crystallization. The
morphology of polymer crystals and crystallization kinetics are essential to considering polymer
crystallization.
1.2.1.1 Polymer Crystalline Morphology
Polymer crystallization involves nucleation and packing of polymer molecules onto each other,
such that crystal structures are developed. Nucleation accounts for an induction period during
which crystal structures do not develop. According to the nucleation growth theory
(Wunderlich, 1976), the induction period is a time period to obtain steady nuclei. Once a stable
nucleus is formed, it provides a surface on which the chain folds back on itself and crystallizes in
a position adjacent to the previous crystalline chains, forming crystalline regions in an unstrained
melt or dilute solution (Hoffman et al., 1976). The resulting polymer crystal structure is the
lamellae, which are thin and flat, and of about 10 nm thick and several μm or mm in lateral
dimensions. Lamellae form a more prominent crystal structure in polymer known as the
spherulite, which is a spherical aggregate ranging from μm to mm in size.
5
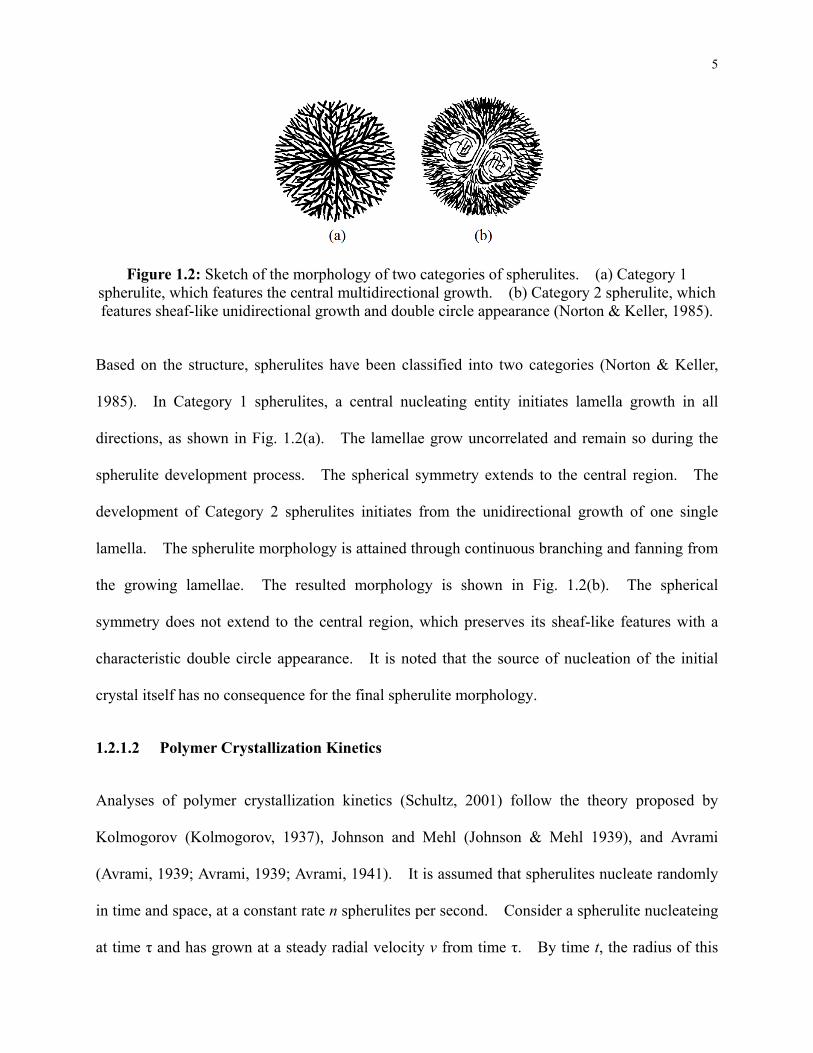
Figure 1.2: Sketch of the morphology of two categories of spherulites. (a) Category 1 spherulite, which features the central multidirectional growth. (b) Category 2 spherulite, which features sheaf-like unidirectional growth and double circle appearance (Norton & Keller, 1985).
Based on the structure, spherulites have been classified into two categories (Norton & Keller,
1985). In Category 1 spherulites, a central nucleating entity initiates lamella growth in all
directions, as shown in Fig. 1.2(a). The lamellae grow uncorrelated and remain so during the
spherulite development process. The spherical symmetry extends to the central region. The
development of Category 2 spherulites initiates from the unidirectional growth of one single
lamella. The spherulite morphology is attained through continuous branching and fanning from
the growing lamellae. The resulted morphology is shown in Fig. 1.2(b). The spherical
symmetry does not extend to the central region, which preserves its sheaf-like features with a
characteristic double circle appearance. It is noted that the source of nucleation of the initial
crystal itself has no consequence for the final spherulite morphology.
1.2.1.2 Polymer Crystallization Kinetics
Analyses of polymer crystallization kinetics (Schultz, 2001) follow the theory proposed by
Kolmogorov (Kolmogorov, 1937), Johnson and Mehl (Johnson & Mehl 1939), and Avrami
(Avrami, 1939; Avrami, 1939; Avrami, 1941). It is assumed that spherulites nucleate randomly
in time and space, at a constant rate n spherulites per second. Consider a spherulite nucleateing
at time τ and has grown at a steady radial velocity v from time τ. By time t, the radius of this
6
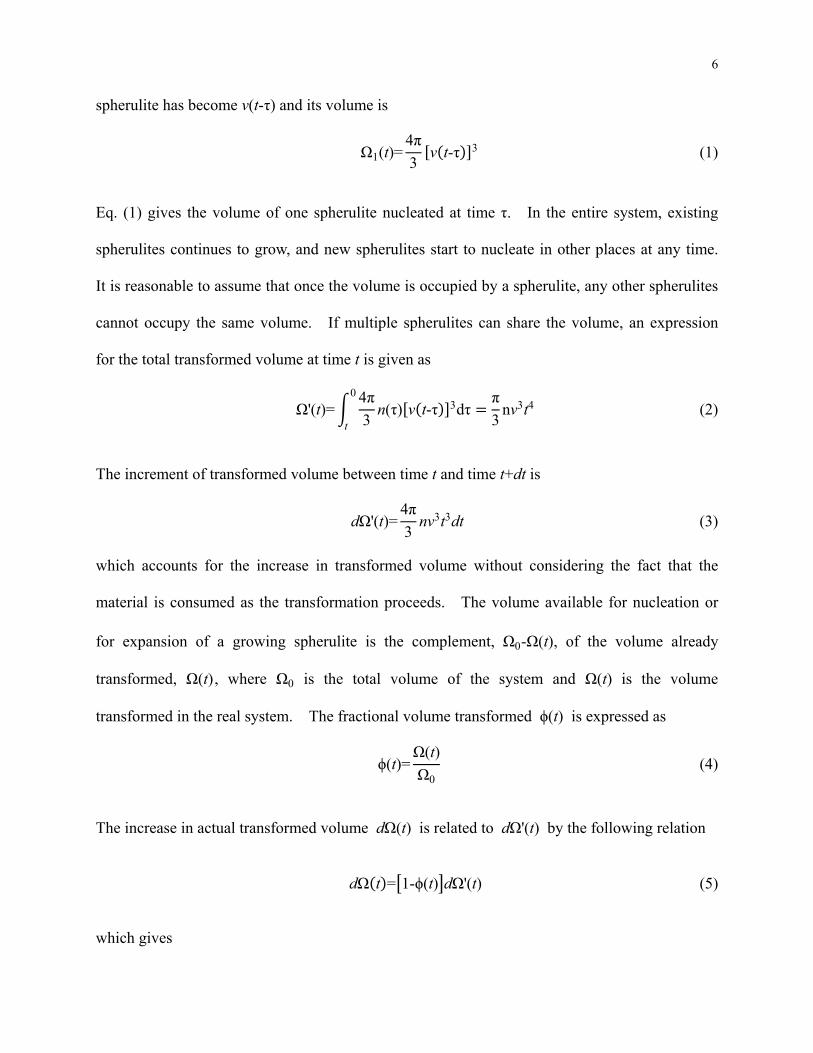
spherulite has become v(t-τ) and its volume is
Ω1(t)=4π
3v t-τ 3 (1)
Eq. (1) gives the volume of one spherulite nucleated at time τ. In the entire system, existing
spherulites continues to grow, and new spherulites start to nucleate in other places at any time.
It is reasonable to assume that once the volume is occupied by a spherulite, any other spherulites
cannot occupy the same volume. If multiple spherulites can share the volume, an expression
for the total transformed volume at time t is given as
Ω'(t)=4π
3n(τ) v t-τ 3dτ
0
t
π
3nv3t4 (2)
The increment of transformed volume between time t and time t+dt is
dΩ'(t)=4π
3nv3t3dt (3)
which accounts for the increase in transformed volume without considering the fact that the
material is consumed as the transformation proceeds. The volume available for nucleation or
for expansion of a growing spherulite is the complement, Ω0-Ω(t), of the volume already
transformed, Ω(t), where Ω0 is the total volume of the system and Ω(t) is the volume
transformed in the real system. The fractional volume transformed ϕ(t) is expressed as
ϕ(t)=Ω(t)
Ω0 (4)
The increase in actual transformed volume dΩ(t) is related to dΩ'(t) by the following relation
dΩ t = 1-ϕ(t) dΩ'(t) (5)
which gives
7
ϕ(t)=1-exp(-π
3nvv
3t4) (6)
where nv is the number of nuclei formed per second per unit volume. This expression
explicitly gives the time-dependence of the development of the overall degree of crystallization.
1.2.2 Polymer Amorphization
Polymer amorphization is a process in which crystalline polymer molecules detached from the
crystals, which leads to lamellae thinning and size reduction of crystals. Amorphization can be
achieved by melting, and polymer amorphization kinetics is relatively high as compared with
crystallization kinetics.
1.2.2.1 Polymer Amorphization Process
Polymer crystal amorphization occurs through a melting process, in which crystalline chain
segments consecutively detach from the crystal surface and diffuse into the melt. The melting
procedure is composed of two stages as theoretically considered (Belyayev, 1988) and
numerically verified (Yamamoto, 2010). The first stage of crystal melting occurs at the fold
surface, leading to a decrease of longitudinal crystal dimensions. This fold-surface melting is
very quick and reversible, giving increasingly thinner lamellae at higher temperatures. Large
molecular mobility in the crystal is essential prerequisite for this specific mode of melting. The
second melting stage becomes apparent right after the end of rapid surface melting. This stage
accounts for the chain detachment from the crystal surface, and thus the lateral dimension of
crystal decreases. The second stage of melting is slower and irreversible.
8
1.2.2.2 Polymer Amorphization Kinetics
Melting of polymer crystals occur within a temperature range, from Tm to Tm+∆Tm. The
crystal fraction melting in a temperature increment dTm within Tm and Tm+∆Tm can be
expressed as ϕ(t,Tm)dTm. The total crystallinity is then expressed as (Toda et al., 1998)
Φ(t)= ϕ(t,Tm)dTm
Tm+∆Tm
Tm
(7)
The change in ϕ(t,Tm) during melting is given by a rate equation
dϕ
dt(t,Tm)=-Rm(ΔT)ϕ(t,Tm) (8)
where Rm is the melting rate coefficient and assumed as a function of superheating, ΔT=T-Tm,
expressed as
Rm=0, for ΔT<0
Rm(ΔT), for ΔT>0 (9)
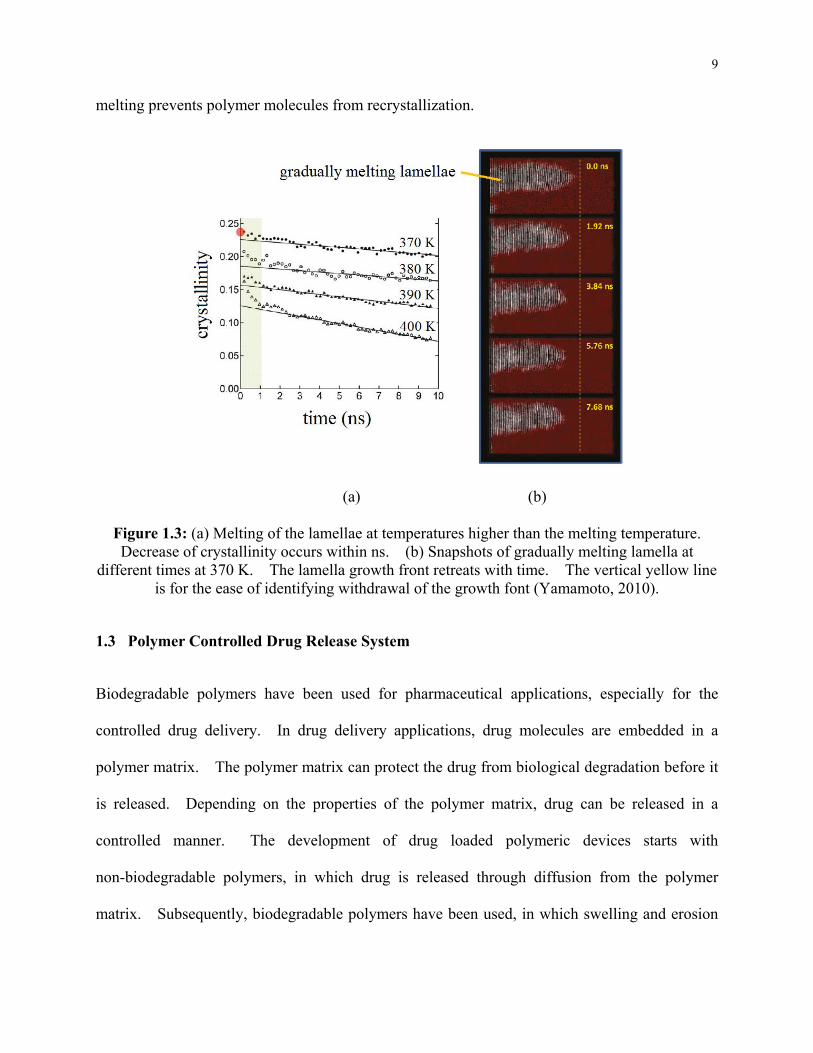
Molecular dynamics simulations have suggested that crystallinity decreases within ns, and Rm is
of the order of 109 s-1 (Yamamoto, 2010). The simulation results of polymer melting process
are given in Fig. 1.3. When the lamellae are subjected to temperatures above its melting
temperature, the melting of lamella fold surfaces rapidly takes place in the first 1 ns. The fold
surface melting is then followed by an irreversible melting process, which shortens the lamellae
along their initial growth directions. Fig. 1.3(a) shows the crystallinity after the polymer is
subjected to different temperatures higher than the melting point. Within the initial 1 ns, the
crystallinity rapidly decreases due to fold surface melting. The subsequent slower melting
represents the melting of lamellae, which leads to withdraws of lamella growth front, as shown
in Fig. 1.3(b). It can be noted that crystalline lamella melting and crystallinity reduction occur
on the order of ns. Due to the relatively slow crystallization kinetics, rapid cooling after
9
melting prevents polymer molecules from recrystallization.
(a) (b)
Figure 1.3: (a) Melting of the lamellae at temperatures higher than the melting temperature. Decrease of crystallinity occurs within ns. (b) Snapshots of gradually melting lamella at
different times at 370 K. The lamella growth front retreats with time. The vertical yellow line is for the ease of identifying withdrawal of the growth font (Yamamoto, 2010).
1.3 Polymer Controlled Drug Release System
Biodegradable polymers have been used for pharmaceutical applications, especially for the
controlled drug delivery. In drug delivery applications, drug molecules are embedded in a
polymer matrix. The polymer matrix can protect the drug from biological degradation before it
is released. Depending on the properties of the polymer matrix, drug can be released in a
controlled manner. The development of drug loaded polymeric devices starts with
non-biodegradable polymers, in which drug is released through diffusion from the polymer
matrix. Subsequently, biodegradable polymers have been used, in which swelling and erosion
10
can take place.
1.3.1 Mechanisms of Drug Release from Polymer Matrix
Based on the physical or chemical characteristics of polymer, drug release mechanism from a
polymer matrix can be categorized in accordance to three main mechanisms: diffusion-controlled
mechanism, swelling-controlled mechanism, polymer degradation-controlled mechanism (Arifin
et al., 2006; Leong & Langer, 1987). In all three mechanisms, diffusion is always involved.
For a non-biodegradable polymer matrix, drug release is due to the concentration gradient by
either diffusion or matrix swelling. Matrix swelling enhances drug diffusion. For a
biodegradable polymer matrix, release is normally controlled by the hydrolytic cleavage of
polymer chains that lead to matrix erosion. Matrix degradation and erosion accelerate diffusion
of drug molecules embedded in the matrix.
1.3.1.1 Diffusion Controlled Mechanism
For the diffusion controlled system, drug diffuses from a non-degradable polymer system, and
the drug release profile is obtained by solving Fick’s second law of diffusion subject to
appropriate boundary conditions. For one-dimensional drug release from a microsphere, the
second Fick’s law of diffusion is given by:
∂C
∂t=
1
r2
∂
∂rDr2 ∂C
∂r (10)
where D and C are the diffusion coefficient and drug concentration in the polymer matrix. The
amount of total drug released from a diffusion-controlled system into a release medium acting
essentially as a perfect sink is determined by the Higuchi’s model, given as (Higuchi, 1961)
Q= Dt(2A-Cs)Cs (11)
11
where Q is the amount of released drug after time t per unit exposed area, A is the total amount
of drug present in the matrix per unit volume, and Cs is the solubility of the drug in the polymer
matrix.
1.3.1.2 Swelling Controlled Mechanism
A swelling polymer can provide more control over the release of drug, especially when its
diffusivity in polymer is very low. For this purpose, a swellable polymer based system is
commonly made using a hydrophilic polymer so that water molecules can easily penetrate into
the polymer matrix. The imbibing water decreases the polymer concentration and thus the level
of polymer disentanglement. The polymer matrix disentanglement also leads to matrix swelling
that increases the free volume between polymer chains. The increased free volume favors drug
diffusion and thus drug release. At the interface of the polymer matrix and release medium,
polymer concentration is low due to swelling, such that polymer chains may diffuse into the
release medium. Therefore, the drug release is not only controlled by drug diffusion inside the
matrix, but also by the polymer chain disentanglement and diffusion processes.
1.3.1.3 Degradation Controlled Mechanism
A great deal of attention and research effort is being concentrated on biodegradable polymers.
These materials degrade within the human body, which avoids the need to remove a drug
delivery system after the drug release period. Drug is released as a result of polymer
degradation and erosion. Biodegradable polymers are versatile materials for a variety of
biomedical applications, especially for drug delivery systems, since their chemistry and surfaces
can be tailored to stabilize macromolecular agents and enhance the tissue site-targeting. More
importantly, the erosion kinetics can be tailored by careful selection of polymer and a variety of
12
techniques of encapsulation to control the drug release profile. In the simplest manner, the
erosion kinetics can be altered by modifying copolymer composition or the degree of
crystallinity as crystalline and amorphous polymers erode at different rates. In the thesis,
degradation refers to the polymer chain/bond cleavage/scission reaction (chemical process),
whereas the erosion designates the loss of polymer material in either monomers or oligomers
(chemical and physical process). Here, the erosion may consist of several chemical and
physical steps, including degradation. Since erosion is a more general term to capture the
overall mechanism of the bioerodible system, this section will mainly utilize the term erosion.
But the term of degradation will still be used when specific degradation processes, e.g. polymer
backbone cleavage and autocatalytic process, are involved in the model.
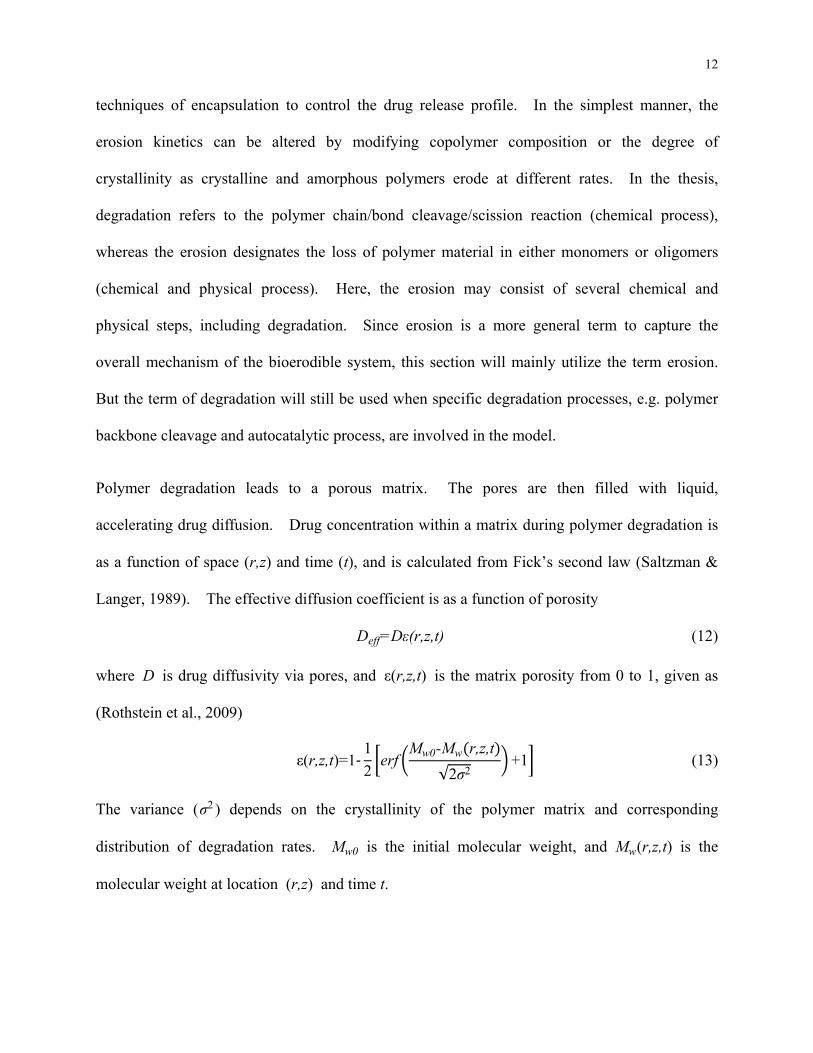
Polymer degradation leads to a porous matrix. The pores are then filled with liquid,
accelerating drug diffusion. Drug concentration within a matrix during polymer degradation is
as a function of space (r,z) and time (t), and is calculated from Fick’s second law (Saltzman &
Langer, 1989). The effective diffusion coefficient is as a function of porosity
Deff=Dε(r,z,t) (12)
where D is drug diffusivity via pores, and ε(r,z,t) is the matrix porosity from 0 to 1, given as
(Rothstein et al., 2009)
ε(r,z,t)=1‐1
2erf
Mw0-Mw r,z,t
√2σ2+1 (13)
The variance (σ2 ) depends on the crystallinity of the polymer matrix and corresponding
distribution of degradation rates. Mw0 is the initial molecular weight, and Mw(r,z,t) is the
molecular weight at location (r,z) and time t.
13
1.3.2 Degradation of Biodegradable Polymer in Physiological Environments
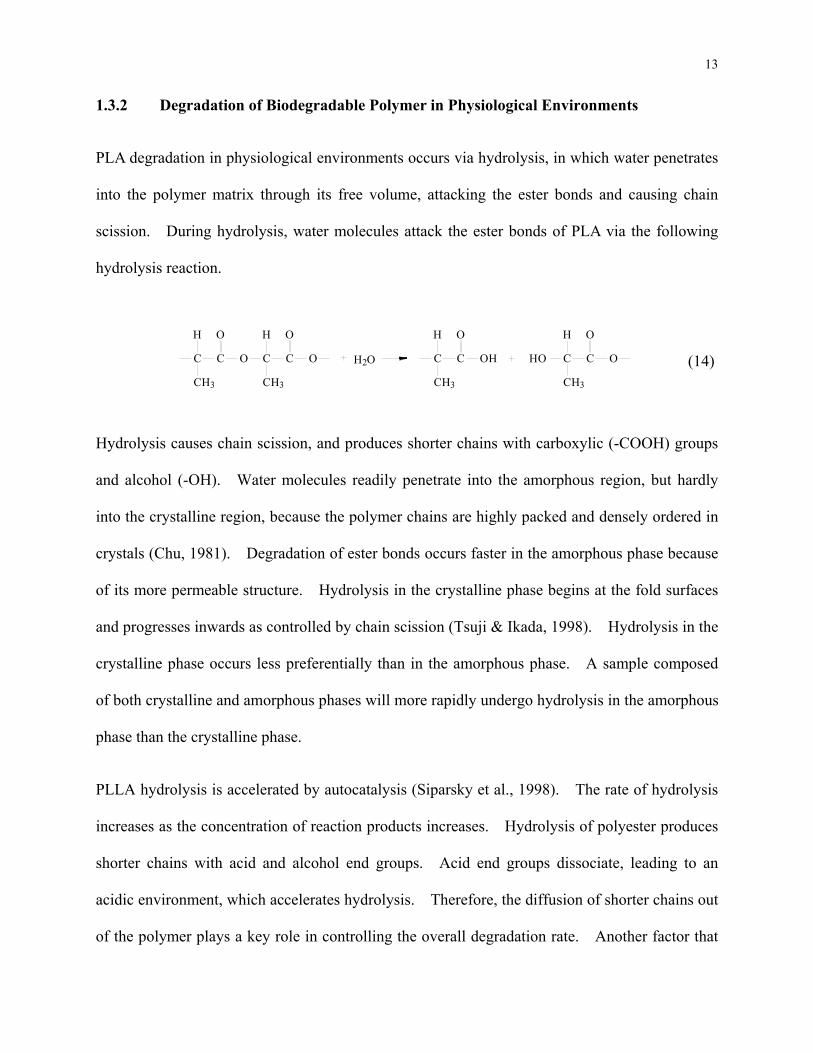
PLA degradation in physiological environments occurs via hydrolysis, in which water penetrates
into the polymer matrix through its free volume, attacking the ester bonds and causing chain
scission. During hydrolysis, water molecules attack the ester bonds of PLA via the following
hydrolysis reaction.
C C O C C O
H HO O
CH3 CH3
2OH C C
H O
CH3
OH HO C C O
H O
CH3
Hydrolysis causes chain scission, and produces shorter chains with carboxylic (-COOH) groups
and alcohol (-OH). Water molecules readily penetrate into the amorphous region, but hardly
into the crystalline region, because the polymer chains are highly packed and densely ordered in
crystals (Chu, 1981). Degradation of ester bonds occurs faster in the amorphous phase because
of its more permeable structure. Hydrolysis in the crystalline phase begins at the fold surfaces
and progresses inwards as controlled by chain scission (Tsuji & Ikada, 1998). Hydrolysis in the
crystalline phase occurs less preferentially than in the amorphous phase. A sample composed
of both crystalline and amorphous phases will more rapidly undergo hydrolysis in the amorphous
phase than the crystalline phase.
PLLA hydrolysis is accelerated by autocatalysis (Siparsky et al., 1998). The rate of hydrolysis
increases as the concentration of reaction products increases. Hydrolysis of polyester produces
shorter chains with acid and alcohol end groups. Acid end groups dissociate, leading to an
acidic environment, which accelerates hydrolysis. Therefore, the diffusion of shorter chains out
of the polymer plays a key role in controlling the overall degradation rate. Another factor that
(14)
14
complicates biodegradation is the increase of crystallinity during degradation (Zong et al., 1999;
Renouf-Glausera et al., 2005). Preferential degradation in the amorphous region leaves the
crystalline phase behind, leading to a mostly crystalline material. Chain scission as a result of
degradation also increases chain mobility which facilitates crystallization in the amorphous
phase.
1.4 Factors Determining Polymer Degradation and Drug Release
Polymer degradation and drug release are complicated processes, which are determined by a
variety of factors. These factors include polymer composition, polymer crystallinity, polymer
molecular weight, addition of drug, polymer matrix size, drug release environment, and effect of
radiation (Alexis, 2005). In physiological environments, PLLA degrades through hydrolysis, in
which water penetrates into polymer matrix through its free volume, and break the ester bonds.
In the current study, polymer crystallinity, drug addition, irradiation, and degradation and drug
release environment determine polymer degradation and drug release. These factors are
discussed below.
1.4.1 Polymer Crystallinity
It has been proposed that degradation proceeds through two main stages: in the amorphous
region, and then in the crystalline regions (Chu & Campbell, 1982). When the material is
immersed in an aqueous solution, water molecules diffuse through the polymer, and
accommodate themselves in the amorphous regions, rather than in the crystalline regions. The
chains in the amorphous regions are less packed, and thus water penetrates easily. On the other
hand, chains in the crystalline regions are aligned with a densely ordered crystalline structure,
such that little or no water can penetrate. Accordingly, hydrolytic degradation starts in the
15
amorphous regions, and chain folds in these regions degrade into fragments. As degradation
proceeds, the size of the fragments reduces and the fragments do not disentangle with other
polymer chains. At this stage, the fragments can diffuse into the release medium. This
diffusion removes these amorphous fragments, leading to a loss of materials. The regions
originally occupied by these segments become vacant and allows for further diffusion of species
with small molecular weights.
Polymer crystallinity is increased by annealing above its glass transition temperature. High
temperature annealing, however, may reduce polymer molecular weight due to thermal
decomposition, which increases the degradation rate. It has been reported (Nakamura et al.,
1989) that, after three-month in vivo implantation, the decrease in molecular weight of the
amorphous PLLA was 30-40 %, while that of the crystalline PLLA was 70-80 %. In addition,
the amorphous PLLA retained over 90 % of its initial bending strength, whereas the crystalline
PLLA lost more than 50 % of its initial value over the same degradation period. The reason
why the crystalline PLLA showed a higher degradation rate is attributed to the high
crystallization temperature of 200 °C. Thermal degradation occurs to PLLA when the
processing temperature is higher than its decomposition temperature around 200°C. After
thermal degradation, chain molecular weights reduce such that the number of end groups
increases. The end groups do not align with the crystalline chains, and offer additional free
volume. Water molecules can thus penetrate into such structure more easily, leading to faster
hydrolysis.
1.4.2 Addition of Drug and Small Molecules
While there is free volume around molecules, the long chains entangle with each other and
16
reduce their mobility. Plasticizers and drug molecules, generally small molecules with
molecular weights of several hundred g/mol, are able to permeate into the free volume around
the polymer chains and increase chain mobility. First, the existence of small molecules reduces
the effects of secondary bonding forces between polymer chains, which tend to keep the chains
to attract each other. Secondly, it increases intermolecular distance which results in an
increased free volume. Finally, as a result of the decreased secondary van der Waals bonding
forces and increased free volume, the small molecule acts as a lubricant which enhances chain
mobility. The polymer molecules are thus more easily able to move and slip past each other in
response to an applied load.
Through rendering additional chain mobility, the addition of a plasticizer lowers the glass
transition temperature of the material. It has been shown that the glass transition temperature of
PLA can be depressed by up to 45°C due to the addition of citrate esters as the plasticizer
(Labrecque et al., 1997). The increased chain mobility also affects polymer crystallization
kinetics. According to the DSC thermograms, crystallinity of annealed PLA increases with the
increasing contents of the plasticizer (Ljungberg & Wesslen, 2002). This indicates that the
existence of the plasticizer facilitates the crystallization process of PLA. While allowing
additional chain mobility, plasticizers increase free volume around chains. The additional free
volume favors water penetration into the polymer matrix, and thus hydrolytic degradation. The
extent of polymer weight loss during hydrolysis has been shown to increase with an increase in
plasticizer concentration (Labrecque et al., 1997). The addition of plasticizer may thus affect
polymer degradation in a combined way in terms of increased crystallinity and chain mobility.
17
1.4.3 Irradiation
Polymer degradation and drug release can be influenced by irradiation, including γ-irradiation
and laser irradiation. γ-irradiation is commonly used for sterilization of the drug loaded
polymer matrices for clinical applications. With the extremely high photon energy, γ-irradiation
can induce extensive bond breaking, causing undesired molecular weight reduction and chemical
structure modifications. As a heating source, on the other hand, laser irradiation has been
carried out to modify polymer crystallinity. Through crystallinity modification, polymer
degradation and thus drug release profiles over time can be tailored to meet individual needs in
clinical applications.
1.4.3.1 γ-Irradiation
γ-irradiation has been used to sterilize drug loaded polymer matrices for clinical applications,
while the γ-ray is also known to induce chemical modifications of polymer chains, such as
scission and crosslinking. The chemical modifications undesirably alter the biodegradable and
biocompatible properties of the polymer. From the GPC analysis, the γ-irradiated PLGA also
shows decreased molecular weights (Rothen-Weinhold et al., 1997). Such changes influence
the degradation rate and drug release profiles over time of drug loaded biodegradable polymers.
It has been reported that the release of 5-fluorouracil from PLGA microparticles depends on the
applied γ-irradiation dose. The exposure to the γ irradiation causes random polymer chain
scission with a decreased molecular weight. Species with smaller molecular weights do not
aligned with crystalline chains and allow for increased free volume, which leads to significant
effect on drug release. It has been observed that the initial burst of drug release is enhanced by
γ-irradiation, an undesired phenomenon in drug delivery applications (Faisant et al., 2002).
18
1.4.3.2 Laser Surface Irradiation
Polymer crystallinity plays an important role in determining its properties. Laser irradiation,
with advantage of high temporal and spatial resolutions, has been serving as a heat source to melt
polymer and reduce its crystallinity. Irradiated by the Nd:YAG laser with the photon energy
lower than PLLA bond energies, PLLA crystallinity has been reduced as quantified by the wide
angle X-ray diffraction (WAXD) measurements (Bhatla & Yao, 2009). However, the
non-uniform laser spatial intensity profile makes it difficult to achieve a uniform surface
treatment. Because of the incoherent light generated by the excimer laser, the beam can be
homogenized without interference, and the homogenized beam is spatially uniform and favorable
for surface treatment. Using the excimer laser, Lazare and Benet treat poly(ethylene
terephthalate) (PET) films, and demonstrate the presence of a thin amorphous surface layer
(Lazare & Benet, 1993). Lazare and Benet report that photochemical reactions are possible in
addition to photothermal effects, since excimer lasers operate at UV wavelengths with photon
energies higher than certain bond energies in polymers. In another attempt to decrease PET
film crystallinity using the excimer laser (Dunn & Ouderkirk, 1990), the possible chemical
changes are studied via X-ray photoelectron spectroscopy (XPS). It is found that low fluences
cause very little chemical changes. These chemical changes include the dissociation of ester
bonds and reduce of the number of oxygen atoms due to the emission of small molecules
(Watenabe et al., 1993); these modifications could alter the original properties of the polymers.
1.4.4 Degradation and Drug Release Environment
PLLA degradation and its drug release are a strong function of its degrading and release
environments. Two main factors are the temperature and pH. In a physiological environment,
19
the complete degradation of PLLA has been reported to take several years (Tsuji et al., 2000).
During the initial research and development processes, it is desired to proceed with a reduced
degradation and drug released period. To accelerate the degradation of biodegradable
polyesters, conducting degradation tests at elevated temperatures (Tsuji & Tsuruno, 2010; Weir et
al., 2004) and at acidic or alkaline pH (Belbella et al., 1996; Lam et al., 2008) are commonly
attempted. Under the alkaline pH, although the degradation mechanism is still based on
hydrolysis, molecular weight and mass loss results differ due to different degradation pathways
followed (Tsuji & Ikada, 1998; Lam et al., 2008). For accelerated conditions surface
degradation dominates, while bulk degradation pathway dominates for simulated physiological
conditions. The dominant surface degradation in the accelerated conditions can be attributed to
the fact that acidic or basic medium favors degradation while the diffusion rate remains the same,
so that it hydrolyzes the surface region before it diffuses into the bulk. Also, bi-modal
molecular distribution as a result of heterogeneous degradation of crystalline and amorphous
domains is not detected.
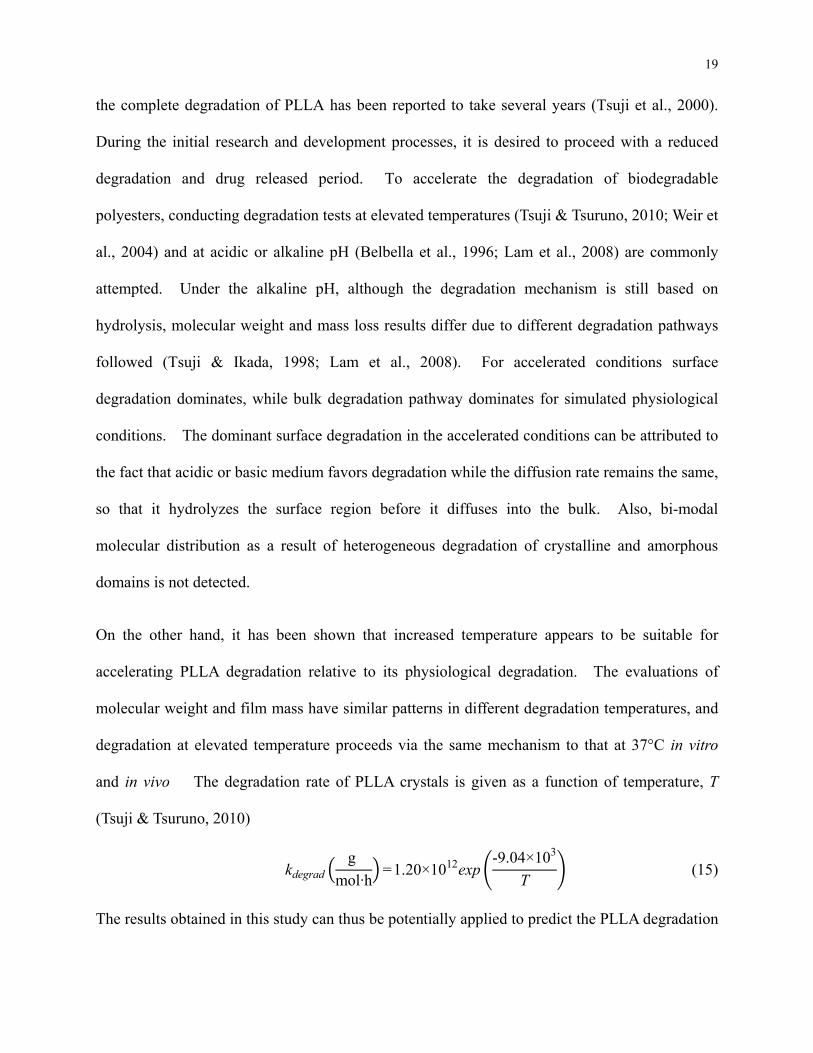
On the other hand, it has been shown that increased temperature appears to be suitable for
accelerating PLLA degradation relative to its physiological degradation. The evaluations of
molecular weight and film mass have similar patterns in different degradation temperatures, and
degradation at elevated temperature proceeds via the same mechanism to that at 37°C in vitro
and in vivo The degradation rate of PLLA crystals is given as a function of temperature, T
(Tsuji & Tsuruno, 2010)
kdegradg
mol·h=1.20×10¹²exp
-9.04×10³
T (15)
The results obtained in this study can thus be potentially applied to predict the PLLA degradation
20
behavior in the physiological environments at lower temperatures.
1.5 Experimental Considerations
In the study, experiments are composed of three major parts: sample preparation, laser treatments,
and characterization. PLLA samples are prepared in both solvent-involved and solvent free
processes. Laser treatment is conducted on a KrF excimer laser operating at a wavelength of
248 nm and pulse duration of 30 ns. Appropriate characterization methods are used to
determine sample properties. The three parts are detailed as follows.
1.5.1 Sample Preparation
Depending on whether solvent is used, sample preparation methods can be divided into
solvent-involved process and solvent-free process. The solvent-involved process includes spin
coating and solvent casting. The solvent-free process includes thermal compression and
extrusion. The solvent-involved processes have been commonly used for fundamental studies,
while products in drug delivery industry are generally fabricated through the solvent-free
processes, as discussed below.
1.5.1.1 Solvent-Involved Sample Formation Process
In fundamental studies concerning PLLA crystallization, PLLA samples are generally fabricated
through solvent-involved processes such as solvent casting or spin coating. Solvent casting is a
simple film formation technique in which polymer is dissolved in an appropriate solvent, and the
quiescent polymer solution is deposited on a substrate, while evaporation of solvent leaves the
solid polymer film. This process generally takes hours. During the casting process
crystallization could occur in solution if the evaporation rate is low enough for polymer
21
molecules to diffuse to the crystal growth front and overcome the energy barrier of deposition, so
that crystals can grow. Spin coating generates polymer films with thinner and more uniform
thickness. It involves rapid rotation of polymer solution, with the centrifugal force pushing it to
flow radially outward, decreasing its thickness. The solvent evaporates simultaneously. This
process typically finishes within several seconds or minutes. Due to rapid evaporation, it is less
likely that the material can crystallize.
The solvent-involved processes are affected by multiple variables including solution
concentration, solvent vaporization rate, the solvent used, and subsequent melting and
recrystallization. Fundamental understanding of crystallization and crystalline morphology has
been established through the investigation of the effects of these variables. Because of the wide
variety of process parameters allowed in the solvent-involved process, both solving casting and
spin coating methods are used in this thesis to investigate crystalline morphology developed in
different environments.
1.5.1.2 Solvent-Free Sample Formation Process
Solvent-involved methods, although commonly used in fundamental studies, have intrinsic
drawbacks which prevent their usage in biomedical applications, including non-uniform crystal
structure along film thickness (Zilberman et al., 2001), non-uniform dissolution of polymer
blends in solvent (McDonald et al., 2010), and issues related to residual solvent (Koegler et al.,
2002, which is toxic to cell (Mikos & Temeoff, 2000). Thus, solvent-free processes, including
thermal compression and extrusion, have been commonly used in biomedical applications such
as drug delivery. Solvent-free processes also allow for fabrication of matrices with complicated
shape for bio-applications (Jing et al., 2006), while the film thickness generated by
22
solvent-involved processes is limited because different solvent vaporization rate along solution
depth leads to non-uniform film structure along thickness. In addition, PLA-based polymer are
also usually blended with other polymers such as PCL to adjust the degradation and drug release
rate (Tanaka et al., 2006), while solubility of each component is different, which results in
incompatible blends and affects drug release rate (Liau & Chang, 1999).
Because of the above-mentioned constraints and potential issues associated with solvent
involvement in biomedical applications, the solvent-free sample formation process is used to
produce samples for biodegradation and drug release tests. The solvent-free method is realized
by thermal molding. The mold used in this study is composed of three parts, as shown in Fig.
1.4. The mold has six cavities, each with a diameter of 10 mm. Six pins are also shown in Fig.
1.4. Appropriate weight loading is applied onto the pin during the molding process to reduce
the porosity of the prepared samples.
The degradation patterns among the solvent-involved and solvent-free sample formation
processes are similar. It has been shown that PLLA films prepared in the two methods both
degrade via the same hydrolysis route: initial cleavage of ester bonds and reduction of molecular
weights, followed by the mass loss as a result of diffusion of degradation products (Tsuji &
Tsuruno, 2010; Weir et al., 2004). Thus, the results obtained based on the samples prepared
with the solvent-free methods can be applicable to those prepared with the solvent-involved
methods.
23
Figure 1.4: Mold used in this study for the thermal compression processes.
1.5.2 Laser System
Laser treatment, with the advantages of high spatial and temporal resolutions, is conducted as a
heating source to modify polymer crystallinity in this study. A laser system generating ns
pulses is desired, because short pulse duration allows for fast cooling of polymer, and prevents
its recrystallization. The applicability of laser treatment on polymer crystallinity modifications
has been demonstrated by lasers with a wide range of wavelengths, from UV to IR. Lasers
operating at IR generate photons with energy lower than polymer binding energies, and
photochemical effects can be neglected (Bhatla & Yao, 2009). UV irradiation, with photon
energies higher than polymer binding energies has also been conducted, while the effects on
polymer chemical structures are not well understood. Lazare and Benet have suggested that
polymer amorphization process induced by UV laser irradiation involves both photothermal and
photochemical processes (Lazare & Benet, 1993). On the other hand, Dunn and Ouderkirk
proposed that no significant chemical changes occur after UV laser amorphization (Dunn &
Ouderkirk, 1990). The understanding of UV laser irradiation effects on polymer chemical
structures is diverged and needs further investigation, so as to broaden the applicability of laser
treatment on polymer crystallinity modifications.
Accordingly, laser treatments of PLLA in this study are performed on the KrF excimer laser
2 cm
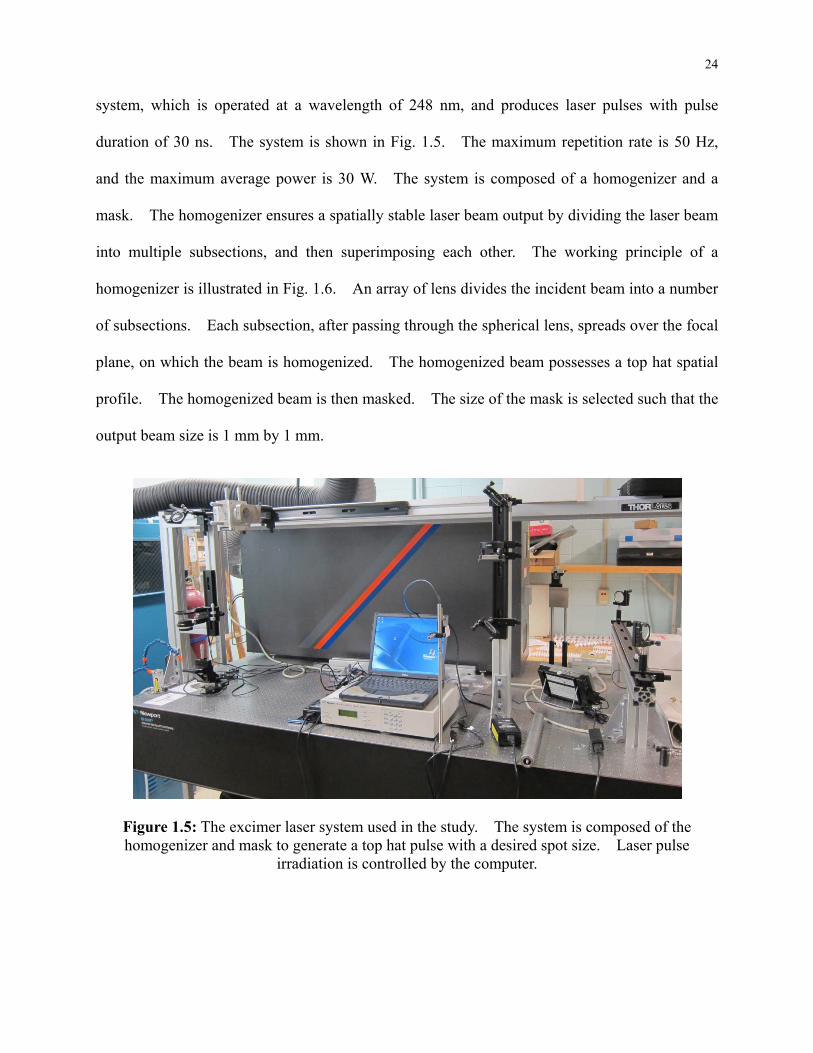
24
system, which is operated at a wavelength of 248 nm, and produces laser pulses with pulse
duration of 30 ns. The system is shown in Fig. 1.5. The maximum repetition rate is 50 Hz,
and the maximum average power is 30 W. The system is composed of a homogenizer and a
mask. The homogenizer ensures a spatially stable laser beam output by dividing the laser beam
into multiple subsections, and then superimposing each other. The working principle of a
homogenizer is illustrated in Fig. 1.6. An array of lens divides the incident beam into a number
of subsections. Each subsection, after passing through the spherical lens, spreads over the focal
plane, on which the beam is homogenized. The homogenized beam possesses a top hat spatial
profile. The homogenized beam is then masked. The size of the mask is selected such that the
output beam size is 1 mm by 1 mm.
Figure 1.5: The excimer laser system used in the study. The system is composed of the homogenizer and mask to generate a top hat pulse with a desired spot size. Laser pulse
irradiation is controlled by the computer.
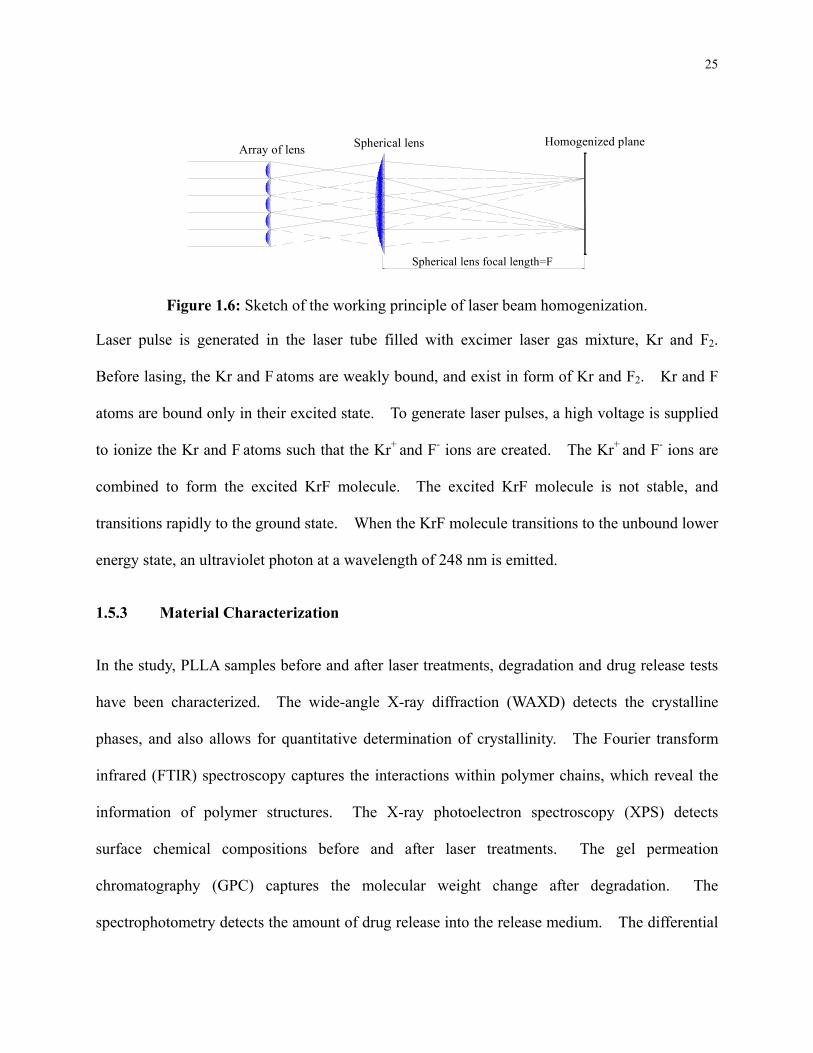
25
Spherical lens focal length=F
Homogenized planeArray of lens Spherical lens
Figure 1.6: Sketch of the working principle of laser beam homogenization.
Laser pulse is generated in the laser tube filled with excimer laser gas mixture, Kr and F2.
Before lasing, the Kr and F atoms are weakly bound, and exist in form of Kr and F2. Kr and F
atoms are bound only in their excited state. To generate laser pulses, a high voltage is supplied
to ionize the Kr and F atoms such that the Kr+ and F- ions are created. The Kr+ and F- ions are
combined to form the excited KrF molecule. The excited KrF molecule is not stable, and
transitions rapidly to the ground state. When the KrF molecule transitions to the unbound lower
energy state, an ultraviolet photon at a wavelength of 248 nm is emitted.
1.5.3 Material Characterization
In the study, PLLA samples before and after laser treatments, degradation and drug release tests
have been characterized. The wide-angle X-ray diffraction (WAXD) detects the crystalline
phases, and also allows for quantitative determination of crystallinity. The Fourier transform
infrared (FTIR) spectroscopy captures the interactions within polymer chains, which reveal the
information of polymer structures. The X-ray photoelectron spectroscopy (XPS) detects
surface chemical compositions before and after laser treatments. The gel permeation
chromatography (GPC) captures the molecular weight change after degradation. The
spectrophotometry detects the amount of drug release into the release medium. The differential
26
scanning calorimetry (DSC) measures the thermal properties of polymer, which indicates the
mobility of polymer chains. The working principle of GPC, as well as the applications of
WAXD and DSC to determine polymer crystallinity and chain mobility, respectively, is detailed
below.
1.5.3.1 Wide-Angle X-ray Diffraction
WAXD is an X-ray-diffraction technique generally used to investigate polymer crystal structures.
WAXD specifically refers to the analysis of crystalline peaks scattered to large angles, with
2θ>5° where 2θ is the angle between the directions of the scattered X-ray and the incident X-ray.
According to the Bragg’s law, the angle θ is determined as a function of the X-ray wavelength, λ,
the distance between two atomic planes, d, given as
nλ=2dsinθ (16)
While diffraction occurs in arbitrary directions, the equation demonstrates that only when the
angle θ satisfies the relationship can the diffracted rays be positively reinforced and observed.
For all values of θ that do not satisfy the equation, the reflected X-rays from multiple atomic
planes will be out of phase with one another and cancel each other, such that no diffraction is
observed (Alexander, 1969).
Diffraction from the crystalline phase gives well-defined peaks based on the Bragg’s law. On
the other hand, diffraction from an amorphous phase occurs in all directions, while a broad hump
can still be observed. This is because the existence of favored interactomic bond lengths allows
for weak positive reinforcement in particular directions. It can be assumed that the diffracted
intensity by an atom in a crystal is the same as that in an amorphous region. Based on the
assumption, crystallinity of a semi-crystalline polymer can be determined from the measured
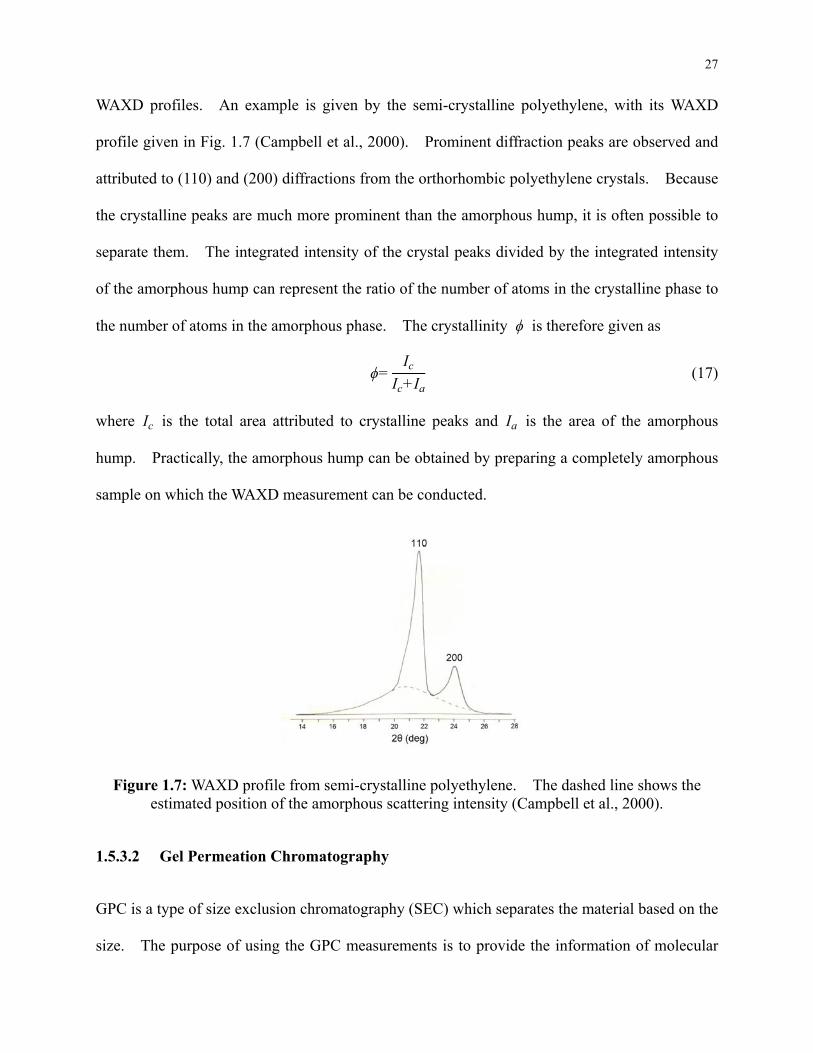
27
WAXD profiles. An example is given by the semi-crystalline polyethylene, with its WAXD
profile given in Fig. 1.7 (Campbell et al., 2000). Prominent diffraction peaks are observed and
attributed to (110) and (200) diffractions from the orthorhombic polyethylene crystals. Because
the crystalline peaks are much more prominent than the amorphous hump, it is often possible to
separate them. The integrated intensity of the crystal peaks divided by the integrated intensity
of the amorphous hump can represent the ratio of the number of atoms in the crystalline phase to
the number of atoms in the amorphous phase. The crystallinity ϕ is therefore given as
ϕ=Ic
Ic+Ia (17)
where Ic is the total area attributed to crystalline peaks and Ia is the area of the amorphous
hump. Practically, the amorphous hump can be obtained by preparing a completely amorphous
sample on which the WAXD measurement can be conducted.
Figure 1.7: WAXD profile from semi-crystalline polyethylene. The dashed line shows the estimated position of the amorphous scattering intensity (Campbell et al., 2000).
1.5.3.2 Gel Permeation Chromatography
GPC is a type of size exclusion chromatography (SEC) which separates the material based on the
size. The purpose of using the GPC measurements is to provide the information of molecular
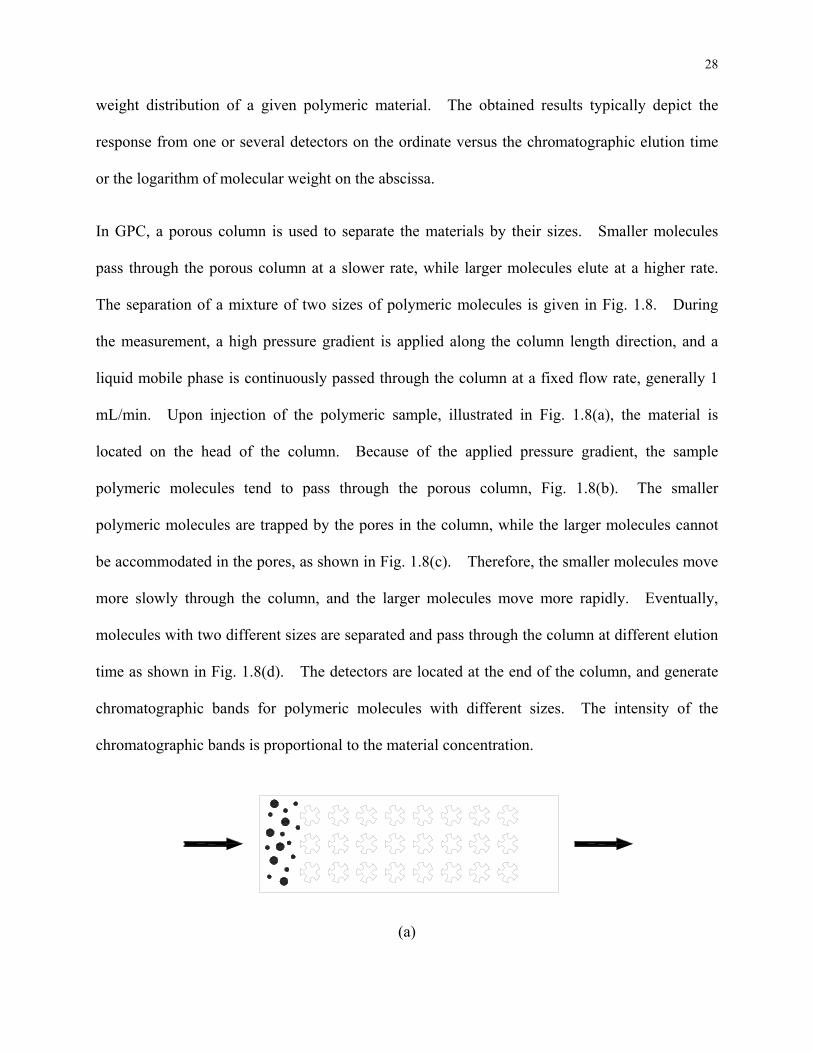
28
weight distribution of a given polymeric material. The obtained results typically depict the
response from one or several detectors on the ordinate versus the chromatographic elution time
or the logarithm of molecular weight on the abscissa.
In GPC, a porous column is used to separate the materials by their sizes. Smaller molecules
pass through the porous column at a slower rate, while larger molecules elute at a higher rate.
The separation of a mixture of two sizes of polymeric molecules is given in Fig. 1.8. During
the measurement, a high pressure gradient is applied along the column length direction, and a
liquid mobile phase is continuously passed through the column at a fixed flow rate, generally 1
mL/min. Upon injection of the polymeric sample, illustrated in Fig. 1.8(a), the material is
located on the head of the column. Because of the applied pressure gradient, the sample
polymeric molecules tend to pass through the porous column, Fig. 1.8(b). The smaller
polymeric molecules are trapped by the pores in the column, while the larger molecules cannot
be accommodated in the pores, as shown in Fig. 1.8(c). Therefore, the smaller molecules move
more slowly through the column, and the larger molecules move more rapidly. Eventually,
molecules with two different sizes are separated and pass through the column at different elution
time as shown in Fig. 1.8(d). The detectors are located at the end of the column, and generate
chromatographic bands for polymeric molecules with different sizes. The intensity of the
chromatographic bands is proportional to the material concentration.
(a)
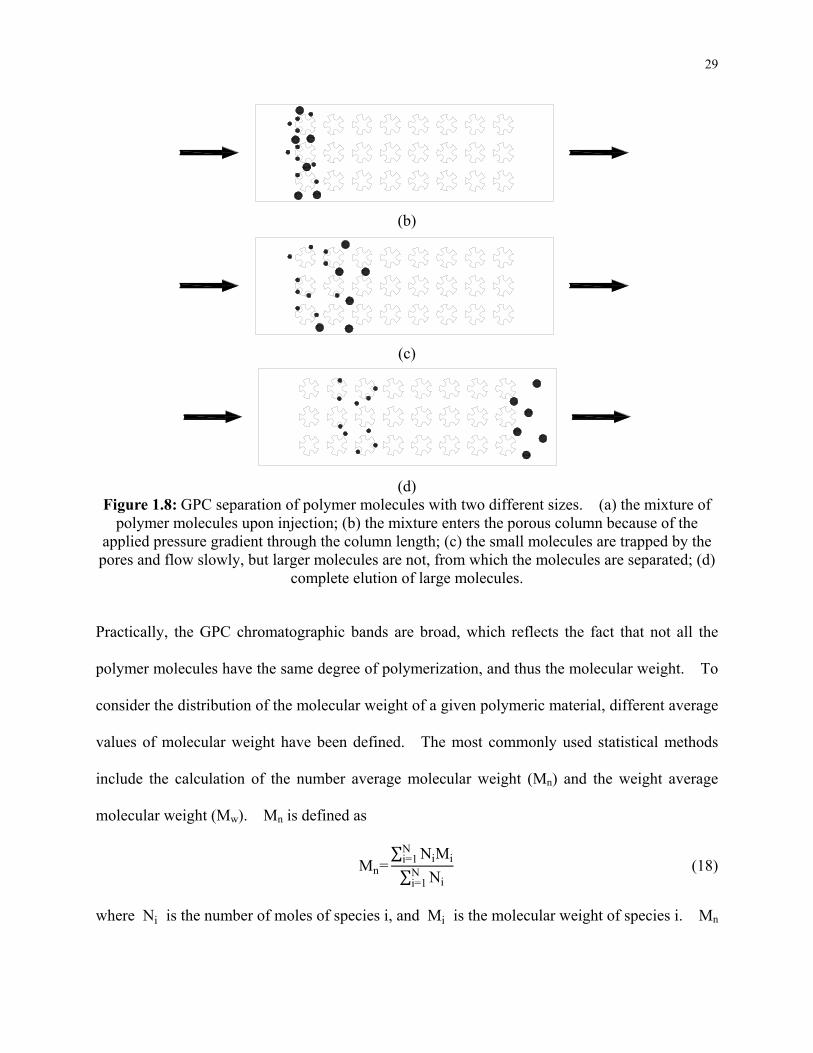
29
(b)
(c)
(d)
Figure 1.8: GPC separation of polymer molecules with two different sizes. (a) the mixture of polymer molecules upon injection; (b) the mixture enters the porous column because of the
applied pressure gradient through the column length; (c) the small molecules are trapped by the pores and flow slowly, but larger molecules are not, from which the molecules are separated; (d)
complete elution of large molecules.
Practically, the GPC chromatographic bands are broad, which reflects the fact that not all the
polymer molecules have the same degree of polymerization, and thus the molecular weight. To
consider the distribution of the molecular weight of a given polymeric material, different average
values of molecular weight have been defined. The most commonly used statistical methods
include the calculation of the number average molecular weight (Mn) and the weight average
molecular weight (Mw). Mn is defined as
Mn=∑ NiMi
Ni=1
∑ NiNi=1
(18)
where Ni is the number of moles of species i, and Mi is the molecular weight of species i. Mn
30
gives the average over the number of the molecules. Mw is defined as
Mw=∑ NiMi
2Ni=1
∑ NiMiNi=1
(19)
Mw gives the average over the weight of each polymer molecules. The ratio of Mw to Mn is
known as the polydispersity index (PDI), which gives a quantitative estimate of the molecular
weight distribution for the polymer. A large PDI represents a broad distribution of molecular
weight. A polymer with a PDI of unity contains molecules with the same molecular weight.
1.5.3.3 Differential Scanning Calorimetry
DSC is a thermoanalytical technique, which allows for the determination of thermal properties of
a material. During the DSC measurements, the sample and the reference are heated
independently while both are maintained at the same temperature during heating. To maintain
the same temperature, different amount of heat needs to be supplied to the sample during the
measurement. The difference of the provided heat is recorded so as to obtain the enthalpy and
entropy changes during phase transformations of the sample. In addition, the information of the
glass transition temperature (Tg), crystallization temperature (Tc), and melting temperature (Tm)
of a given sample can be determined.
While directly providing with the thermal properties of polymeric samples, information obtained
from the DSC measurements also reveal the polymer chain mobility in a given sample. This is
because chains with higher mobility require lower energy to crystallize and melt, and thus their
crystallization and melting occur at a lower temperature. This is experimentally demonstrated
in Fig. 1.9 (Yeh et al., 2009), in which PLA is blended with triacetine (TAc), an effective
plasticizer for PLA, at different concentrations. After blending, the values of Tg and Tm reduce
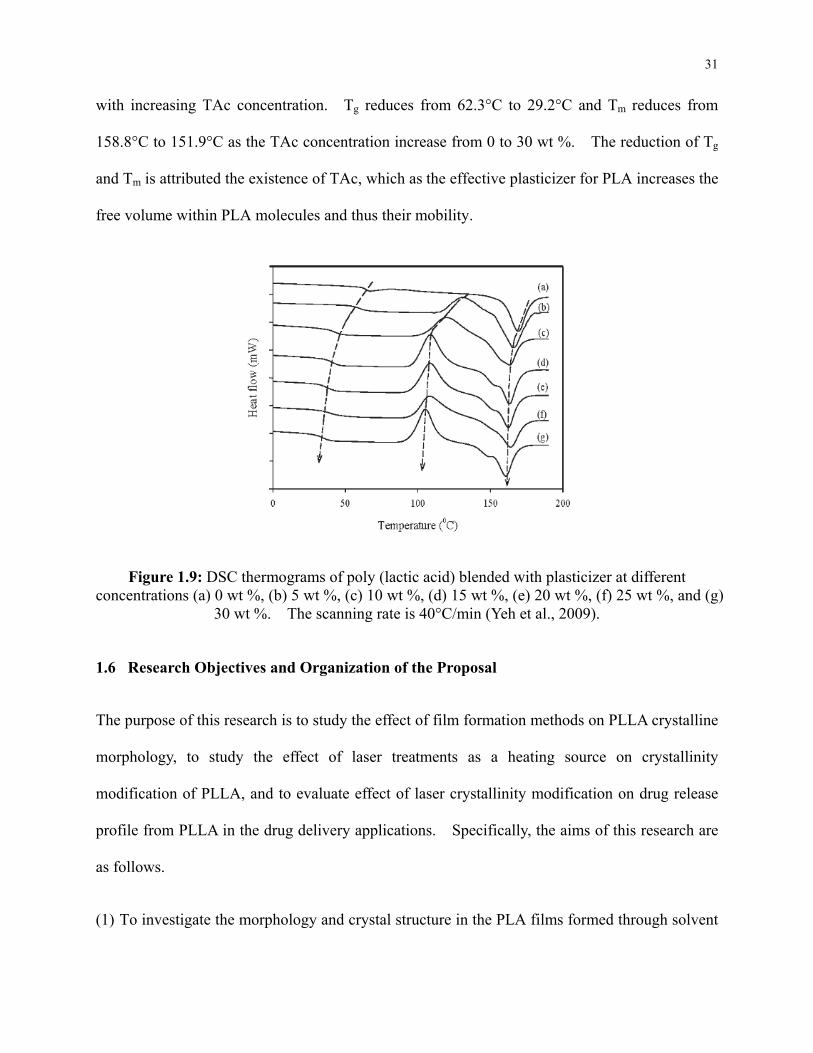
31
with increasing TAc concentration. Tg reduces from 62.3°C to 29.2°C and Tm reduces from
158.8°C to 151.9°C as the TAc concentration increase from 0 to 30 wt %. The reduction of Tg
and Tm is attributed the existence of TAc, which as the effective plasticizer for PLA increases the
free volume within PLA molecules and thus their mobility.
Figure 1.9: DSC thermograms of poly (lactic acid) blended with plasticizer at different concentrations (a) 0 wt %, (b) 5 wt %, (c) 10 wt %, (d) 15 wt %, (e) 20 wt %, (f) 25 wt %, and (g)
30 wt %. The scanning rate is 40°C/min (Yeh et al., 2009).
1.6 Research Objectives and Organization of the Proposal
The purpose of this research is to study the effect of film formation methods on PLLA crystalline
morphology, to study the effect of laser treatments as a heating source on crystallinity
modification of PLLA, and to evaluate effect of laser crystallinity modification on drug release
profile from PLLA in the drug delivery applications. Specifically, the aims of this research are
as follows.
(1) To investigate the morphology and crystal structure in the PLA films formed through solvent
32
casting and spin coating followed by annealing.
(2) To reduce surface crystallinity of PLLA films through melting by excimer laser treatment,
while minimizing possible chemical modifications.
(3) To investigate the effects of laser surface treatment on PLLA degradation in terms of
molecular weight, sample mass, and crystallinity.
(4) To investigate the effects of polymer degradation and drug loading on drug release
mechanisms, as well as the effect of laser crystallinity modification on drug release profile.
In Chapter 2, the effects of film formation method and annealing on the crystals formed in PLLA
films are investigated. Two solvent involved film formation processes, solvent casting and spin
coating, are conducted to prepare the PLLA films. Subsequent annealing on the prepared films
is carried out. The resulting crystalline morphology, molecular order, conformation, and
intermolecular interaction are examined using optical microscopy, wide-angle X-ray diffraction,
and Fourier transform infrared spectroscopy. It is observed that solvent casting produces
category 1 spherulites while annealing the spin coated films leads to spherulites of category 2.
The crystal structure of the two kinds of films also shows distinct features. The results enable
better understanding of the crystallites in PLLA, which is essential for its drug delivery
applications.
In Chapter 3, the excimer laser is used to induce surface crystallinity modifications of PLLA.
The effects of excimer laser irradiation on the surface morphology, crystallinity, and chemical
modifications are investigated via optical microscopy, wide-angle X-ray diffraction, and X-ray
photoelectron spectroscopy. A model is developed to numerically examine the spatial and
33
temporal temperature profiles, as well as the amount of chemical modifications. It is found that
PLLA crystallinity decreases as a function of laser fluence, and that the amount of chemical
modifications is minimized by annealing before laser treatment and reducing laser fluences,
which decrease free radical mobility and thus the dissociation quantum yield. A working
window is demonstrated in which PLLA crystallinity decreases with no measurable chemical
modifications, and the working window can be enlarged by decreasing free radical mobility.
In Chapter 4, the effect of laser induced PLLA crystallinity reduction on its biodegradation is
investigated. The degradation is characterized in terms of molecular weight, sample mass, and
crystallinity during the degradation process. Samples having lower initial surface crystallinity
are shown to have higher rates of molecular weight reduction and earlier mass loss than
non-laser treated samples, as observed from gel permeation chromatography and mass change.
Wide-angle X-ray diffraction measurements show that crystallinity increases with degradation.
A numerical model is implemented from hydrolysis and diffusion mechanisms to investigate the
effect of laser irradiation on biodegradation. Controlled laser treatment of PLLA offers a
method for constant drug release through the reduction of surface crystallinity.
34
Chapter 2: Effect of Film Formation Method and Annealing on Morphology and Crystal
Structure of Poly(L-Lactic Acid) Films
2.1 Introduction
There is a significant interest in use of biodegradable polymers due to their biocompatibility and
biodegradability. Poly lactic acid (PLA) is a biodegradable polymer and can be obtained from
renewable sources such as corn starch. It has a wide range of applications in food packaging
and tissue engineering. It is also preferred in drug delivery because it can degrade into
bioabsorbable products in physiological environments. Its degradation mainly comes from the
cleavage of its ester groups, and is sensitive to chemical hydrolysis. In this application, drug
molecules are encapsulated in the polymer by dispersing or dissolving in the polymeric solution,
formed through melting the polymer or dissolving it in a solvent. During the process polymer
may crystallize, which influences its degradation (Nampoothiri et al., 2010). Tsuji and Ikada
(Tsuji & Ikada, 1998) proposed that the degradation of PLA begins in the amorphous region
between the lamellae, followed by the disorientation of the lamellae and disappearance of the
spherulitic structure. Namely, crystallites affect PLA degradation and thus play a significant
role when the material is used in the drug delivery system.
Efforts have been done to investigate the crystallization behavior and resulting crystal structures
of PLA films. Among them, solvent casting (Tsuji & Ikada, 1995; Bhatla & Yao, 2009) and
spin coating (Li et al., 2009) are the two commonly used film formation methods. Solvent
casting is a simple film formation technique in which quiescent polymer solution is deposited on
a substrate, while evaporation of solvent leaves the solid polymer film. This process generally
takes hours. During the casting process crystallization could occur in solution if the
35
evaporation rate is low enough for polymer molecules to diffuse to the crystal growth front and
overcome the energy barrier of deposition, so that crystals can grow. Category 1 spherulites, in
which lamellae grow in all directions and the spherical symmetry extends to the central region as
defined by Norton and Keller (Norton & Keller, 1985), can be commonly observed in the as cast
films (Tsuji & Ikada, 1995; Takeda, 2005). Spin coating generates polymer films with thinner
and more uniform thickness. It involves rapid rotation of polymer solution, with the centrifugal
force pushing it to flow radially outward, decreasing its thickness. The solvent evaporates
simultaneously. This process typically finishes within several seconds or minutes. Due to
rapid evaporation, it is less likely for crystallites to develop in the as coated films.
To increase crystallinity in as cast/coated PLA films, further annealing has been attempted. For
the as cast films fully covered by spherulites formed during casting, subsequent annealing
increases the degree of crystallinity, but does not alter the morphology (Tsuji & Ikada, 1995;
Bhatla & Yao, 2009). As coated films are generally amorphous. Annealing such films from
the glassy state can generates crystal structures different from those developed in as cast films.
One common feature is the nodular structure (Zhao et al., 2009; Su et al., 2009; Hsu et al., 1986);
the nodule is the nanometer-sized crystalline particle developed during annealing from the glassy
state (Ogawa et al., 1985). As annealing time and/or temperature increase, the nodules enlarge,
and may develop into larger needle-like crystals (Zhao et al., 2009). It is also observed that
nodules develop into lath-like lamellae through merging or lateral aggregation (Su et al., 2009;
Hsu et al., 1986). At larger scale, the sheaf-like structures can be observed (Bassett et al., 1988;
Gao et al., 2004), and category 2 spherulites, in which lamellae grow unidirectionally in the
central region and the spherical symmetry does not extend to the center (Norton & Keller, 1985),
are developed (Ivanov & Jonas, 1998). Crystal structures developed by annealing from the
36
glassy state thus show distinct features from those developed in solution.
In spite of the fact that different film formation methods and subsequent annealing lead to
different morphologies and crystal structures, their effects have not been fully explored. Pluta
and Galeski (Pluta & Galeski, 2002) conducted the wide-angle X-ray diffraction (WAXD)
measurement on PLA films crystallized from melt and glass, and peculiarity in the WAXD
profiles for the latter is noticed. It reveals further information of the crystal structure, which is
not clear. Li et al. observed various PLA film morphologies crystallized from glass, while the
crystal structure is not addressed (Li et al., 2009). For annealed solvent cast PLA films, crystal
structures developed in the two crystallization steps are expected to be different. The difference
has not drawn much attention. It is also worth considering the causes leading to different
morphologies in the films.
The objective of this study is to investigate the morphology and crystal structure in the PLA
films formed through solvent casting and spin coating followed by annealing. The morphology
is observed by optical microscopy, and crystal structure is studied through the WAXD and
Fourier transform infrared (FTIR) measurement. The former is utilized to study the molecular
order and the latter is to investigate the conformation of molecules and intermolecular
interaction.
2.2 Background
Poly (L-lactic acid) (PLLA) has a glass transition and melting temperatures of around 60°C and
175°C respectively, and can crystallize in α, β, and γ forms depending on crystallization
conditions. The α form exists in solvent cast and annealed samples, and the unit cell structure is
orthorhombic with two 103 polymeric helices (Kobayashi et al., 1995; Miyata & Masuko, 1997;
37
Sasaki & Asakura, 2003). The lattice parameters are a=10.66 , b=6.16 , and c=28.88
(Miyata & Masuko, 1997), but the values may be slightly different (Kobayashi et al., 1995;
Sasaki & Asakura, 2003; Davis et al., 1968). In the orthorhombic unit cell, PLLA chains are
folded in the <110> direction (Miyata & Masuko, 1997; Kikkawa et al., 2002).
2.2.1 Nucleation and Crystallization
Polymer crystallization in dilute solution is composed of induction period, primary
crystallization, followed by secondary crystallization. The induction period is the time to
obtain steady nuclei before crystallization can occur (Imai et al., 1992). In primary
crystallization, spherulites are developed and eventually impinge with each other.
Crystallization can continue after the impingement, known as the secondary crystallization. It
is contributed by the amorphous chains within the lamellae with slower crystallization rates due
to chain imperfection (Schultz, 2001). Crystallization from the melt follows a different route, in
which nanometer-sized nodules are developed first followed by coalescing with each other to
form larger crystals such as lamellae (Su et al., 2009). The concurrent orientation adjustment of
neighboring nodules is required for prefect coalescence. This crystallization route accounts for
annealing of the as cast/coated film and the resulted crystal structures.
2.2.2 Mobility of Polymer Molecules in Solution and Melt
Polymer molecules move via diffusion, and the diffusion coefficient D is proportional to
mobility μ via D=µkBT, with kB the Boltzmann constant and T temperature. The value D is
related to solution concentration, which is divided into dilute, semidilute, and concentrated.
Molecules in dilute solutions are separated, occupying a spherical region of radius Rg=b√N/6
where b and N are the length and number of submolecules, respectively (Doi & Edwards, 1988).
38
As the concentration increases, the polymer coils start to overlap at the concentration c* given
as (Cotton et al., 1976)
MNA
43 πRg
3≤ c*≤
MNA
Rg3 (1)
where M is molecular weight and NA is the Avogadro constant. In the concentrated solution,
such as the polymer bulk above its glass transition temperature, the concentration fluctuation is
negligible. The cross-over concentration from semidilute to concentrated c** is (Doi &
Edwards, 1988)
c**v
MsNA
b6 (2)
where v and Ms are the excluded volume and molecular weight of the segment, respectively.
For dilute solution, the Stokes-Einstein equation gives the diffusion coefficient
D=kBT
6πηRH (3)
where η and RH are the solvent viscosity and hydrodynamic radius, respectively. The latter is
related to the radius of gyration Rg by RH=0.537Rg (Akcasu & Han, 1979). If the
concentration is extremely high, the chains are entangled and their movements are described on
the basis of the reptation theory (de Gennes, 1971), and the diffusion coefficient is then given by
(Doi & Edwards, 1988)
D=kBT
Nζ (4)
where ζ is a Rouse model parameter.
39
2.2.3 Structure of Spherulites
Spherulites are composed of the crystalline, the amorphous phases, as well as the rigid
amorphous phase (RAP). Chains in RAP are immobile and remain vitrified even above the
glass transition temperature (Menczel & Wunderlich, 1981). In terms of architectures,
spherulites can be developed into two categories (Norton & Keller, 1985), depending on the
competition between the order in the crystal structure and the disorder of the crystallographic
orientation; the disorder is associated with the randomization of secondary nucleation at the
growth front (Granasy et al., 2005). The randomness disrupts the crystalline anisotropy. For
category 1 spherulites, disrupt occurs early, and multiple directional growth is achieved in the
beginning. The disorder disrupts the crystalline anisotropy later for category 2 spherulites,
leading to the threadlike structure at the center and sheaf outside.
The origin of disorder during the secondary nucleation is caused by three reasons (Granasy et al.,
2005). The first reason is the static spatial heterogeneity such as foreign particles, which
deflect the tip of growing lamellae and perturb their growth directions. The second reason is
due to the small rotational diffusion coefficient when compared with translational diffusion
coefficient, which suggests that the molecule has difficulty changing its orientation when
depositing on the growth front and thus causes disorder. The third reason is the
non-crystallographic branching. From direct AFM observation (Li et al., 2001), it may occur at
a short distance away from the mother lamellae. This gives evidence that branching is formed
by the loose loop or protruding cilia of molecules trapped in the mother lamellae. The third
reason dominates based on simulation results (Granasy et al., 2005).
40
2.3 Materials and Methods
2.3.1 Sample Preparation and Annealing
PLLA granule samples were provided by PURAC and used as received. The inherent viscosity
(η) in chloroform at 25°C is 1.6 dl/g, and the molecular weight is M=56,274 g/mol from the
Mark-Houwink equation, η=0.454×10⁻⁴M0.73 (Schindler & Harper, 1979). To prepare solvent
cast films, the granules were dissolved in methylene chloride (CH2Cl2) from Sigma Aldrich, with
concentration of 0.1 g PLLA/3 mL CH2Cl2. The solution is stirred with a magnetic stirrer for 4
hours, and 15 mL solution was cast in a covered Petri dish with a glass slide as a substrate. The
solution was left in the hood at 25°C for 24 hours. The film formed on the glass substrate was
used as the solvent cast films. Its thickness, measured by profilometry, is 20-25 μm. The
solution with doubled concentration was spin-coated on a glass substrate with a rotational
acceleration of 255 rev/min2 and rotational velocity of 1000 rpm. The film thickness is around
2.5 μm. The thermophysical property and crystallization behavior in films thinner than 1 μm
differs from that in thicker films (Frank et al., 1996). Since both solvent cast and spin coated
films are thicker than 1 μm, the effects of film thickness are insignificant. The films were
annealed at 80°C, 110°C, and 140°C for 1 and 3 hours; some spin coated films were annealed at
140°C for 8 and 24 hours. The annealed films were quenched at room temperature after
annealing.
2.3.2 Characterization
Morphology of PLLA films was observed with an optical microscope (Olympus BX60) in the
transmission mode. WAXD measurements were accomplished using the Inel X-ray
diffractometer. Film specimens were exposed to the monochromatic CuKα radiation with
41
wavelength λ=0.15418 nm at 40 kV and 30 mA. Care was taken to adjust the incident angle of
the X-ray to prevent penetration into the substrate. A Perkin Elmer Spectrum 400 FTIR
spectrometer with attenuated total reflectance (ATR) attachment using ZnSe crystal was used to
measure the IR spectrum of the films peeled from the glass substrate. The data were recorded
with a 4 cm-1 resolution.
2.4 Results and Discussion
2.4.1 Morphology
Spherulites already appear and impinge in solvent cast films before annealing because solvent
evaporates at a rate low enough for crystals to grow during the casting process. The spherulitic
structure resembles category 1, and remains unchanged after annealing. The morphology for
the annealed solvent cast film is given in Fig. 2.1(a). No crystallite exists in spin coated films
before annealing as will be confirmed by WAXD. This is due to the fact that during coating,
the solvent evaporates faster than the induction period. It is pointed out that for linear
poly(decamethylene terephthalate) with molecular weight approximately 40,000 crystallized in
solution at 32.1°C, the induction period is between 6 and 34 minutes for solution concentration
between 10 and 2.5% (Lanceley & Sharples, 1966). Because of the similarity of the molecular
weight and crystallization temperature, the induction time of the PLLA in this study is expected
to be on the order of minutes, which is much longer than the solvent evaporation time (less than
45 seconds, assuming all the solvent evaporates by the end of coating process). It is reasonable
to obtain an amorphous structure through spin coating.
After annealing the spin coated films, paired dots are developed with a bright threadlike fiber in
between, which are category 2 spherulites, as shown in Fig. 2.1(b). The difference between the
42
two categories results from the order of the secondary nucleation: if disorder disrupts the
orientation of crystal growth early, category 1 spherulites can be generated, and
non-crystallographic branching is a main reason causing the disorder (Granasy et al., 2005).
The different branching behaviors in the two films results from the different amount of supplying
chains at crystallization sites. The chains are carried by a compensation flow induced by the
volume shrinkage because of crystallization (Schultz, 2001), and chain mobility is essential. To
investigate the mobility, the concentration and diffusion coefficient are calculated. For the
solvent cast films, the spherulites are developed in solution, whose overlap concentration,
calculated from Eq. (1), is between 0.6 and 2.3 g/ml. (For calculation, the monomer is taken as
the submolecule, and its length is estimated by the size of the unit cell (Miyata & Masuko, 1997).
The number of submolecules is therefore the degree of polymerization, 56,274/72=782.) Since
the solution concentration, 0.033 g/ml, is much less than the overlap concentration, the solution
is dilute and Eq. (3) is used to determine the diffusion coefficient to be 3 10-6 cm2/s. Due to
extremely high concentration, the molecules in spin coated films experience entanglement during
crystallization. The diffusion coefficients for PLLA bulk above the glass transition temperature
is as a function of temperature and degree of polymerization (Zhang et al., 2007). For the
temperature around 400 K and the degree of polymerization of 782, the diffusion coefficient is
estimated on the order of 10-9 cm2/s. Their results agree with the relation between diffusion
coefficient and chain length stated by Eq. (4). Therefore, during the periods when the
spherulites are developed, chain mobility in the spin coated films is much less than that in the
solvent cast films. The scenario of chain movement in the crystallization front in both films can
thus be described as follows. For solvent cast films, the high chain mobility enables a flow of
surrounding material to the crystallization front to compensate the volume shrinkage, supplying
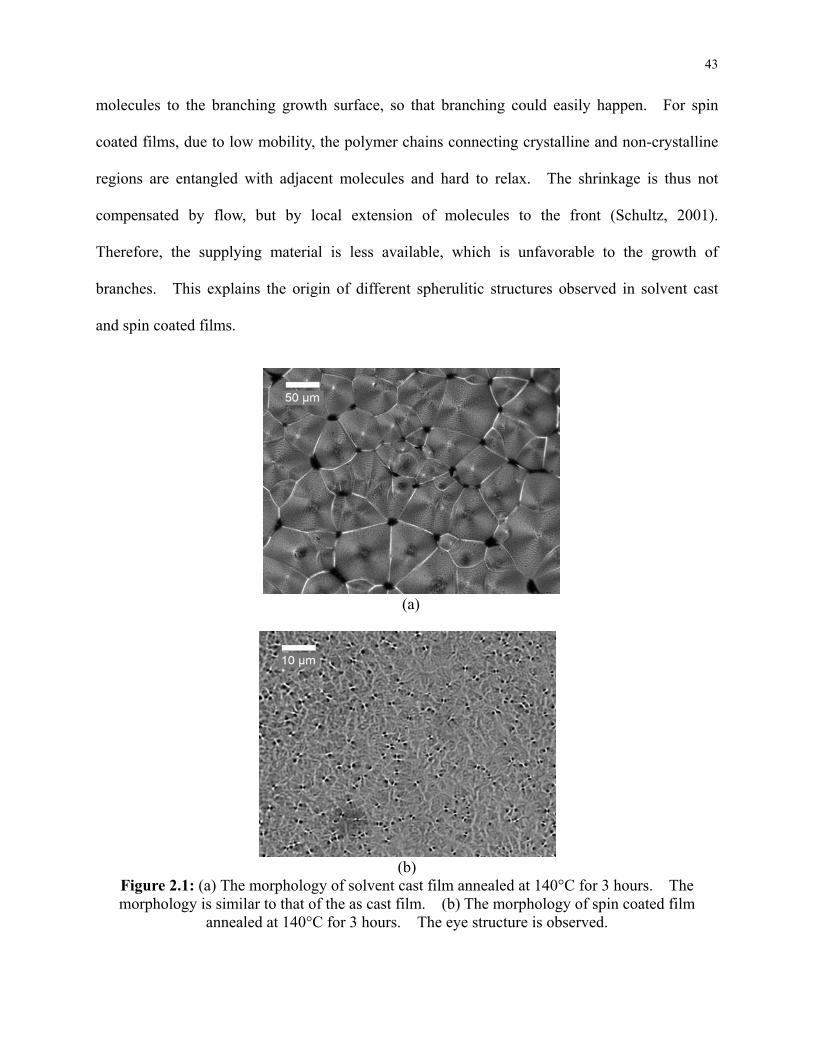
43
molecules to the branching growth surface, so that branching could easily happen. For spin
coated films, due to low mobility, the polymer chains connecting crystalline and non-crystalline
regions are entangled with adjacent molecules and hard to relax. The shrinkage is thus not
compensated by flow, but by local extension of molecules to the front (Schultz, 2001).
Therefore, the supplying material is less available, which is unfavorable to the growth of
branches. This explains the origin of different spherulitic structures observed in solvent cast
and spin coated films.
(a)
(b)
Figure 2.1: (a) The morphology of solvent cast film annealed at 140°C for 3 hours. The morphology is similar to that of the as cast film. (b) The morphology of spin coated film
annealed at 140°C for 3 hours. The eye structure is observed.
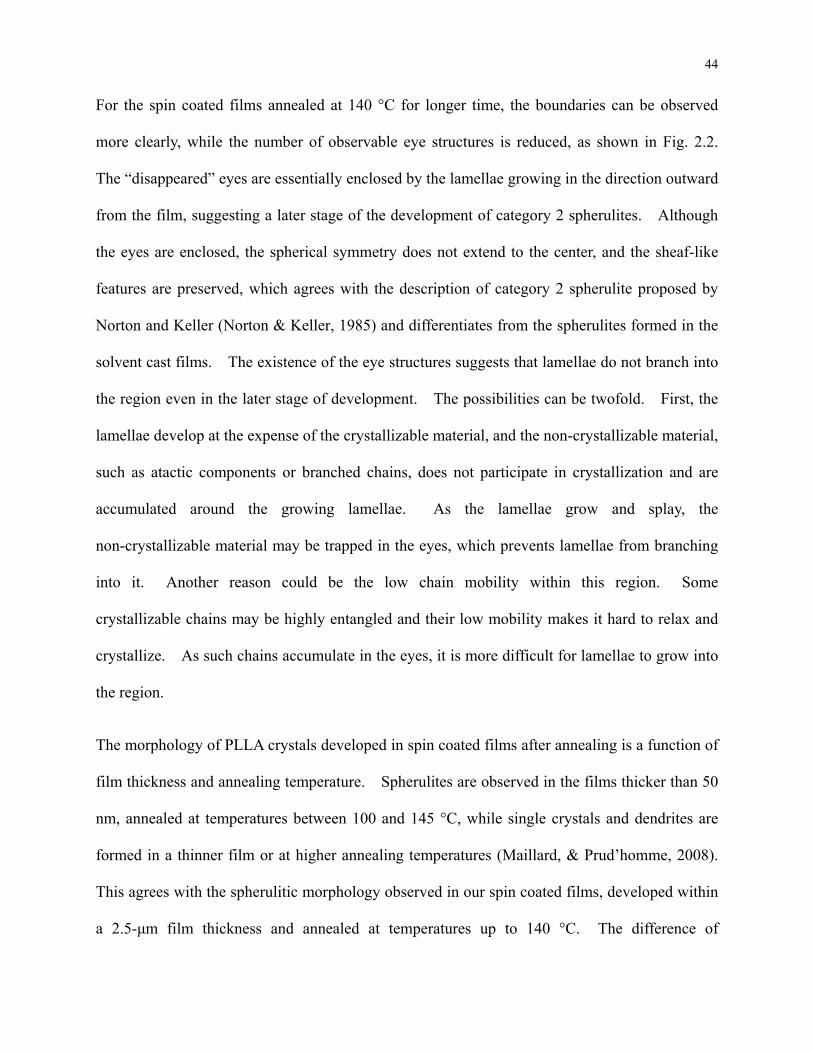
44
For the spin coated films annealed at 140 °C for longer time, the boundaries can be observed
more clearly, while the number of observable eye structures is reduced, as shown in Fig. 2.2.
The “disappeared” eyes are essentially enclosed by the lamellae growing in the direction outward
from the film, suggesting a later stage of the development of category 2 spherulites. Although
the eyes are enclosed, the spherical symmetry does not extend to the center, and the sheaf-like
features are preserved, which agrees with the description of category 2 spherulite proposed by
Norton and Keller (Norton & Keller, 1985) and differentiates from the spherulites formed in the
solvent cast films. The existence of the eye structures suggests that lamellae do not branch into
the region even in the later stage of development. The possibilities can be twofold. First, the
lamellae develop at the expense of the crystallizable material, and the non-crystallizable material,
such as atactic components or branched chains, does not participate in crystallization and are
accumulated around the growing lamellae. As the lamellae grow and splay, the
non-crystallizable material may be trapped in the eyes, which prevents lamellae from branching
into it. Another reason could be the low chain mobility within this region. Some
crystallizable chains may be highly entangled and their low mobility makes it hard to relax and
crystallize. As such chains accumulate in the eyes, it is more difficult for lamellae to grow into
the region.
The morphology of PLLA crystals developed in spin coated films after annealing is a function of
film thickness and annealing temperature. Spherulites are observed in the films thicker than 50
nm, annealed at temperatures between 100 and 145 °C, while single crystals and dendrites are
formed in a thinner film or at higher annealing temperatures (Maillard, & Prud’homme, 2008).
This agrees with the spherulitic morphology observed in our spin coated films, developed within
a 2.5-μm film thickness and annealed at temperatures up to 140 °C. The difference of
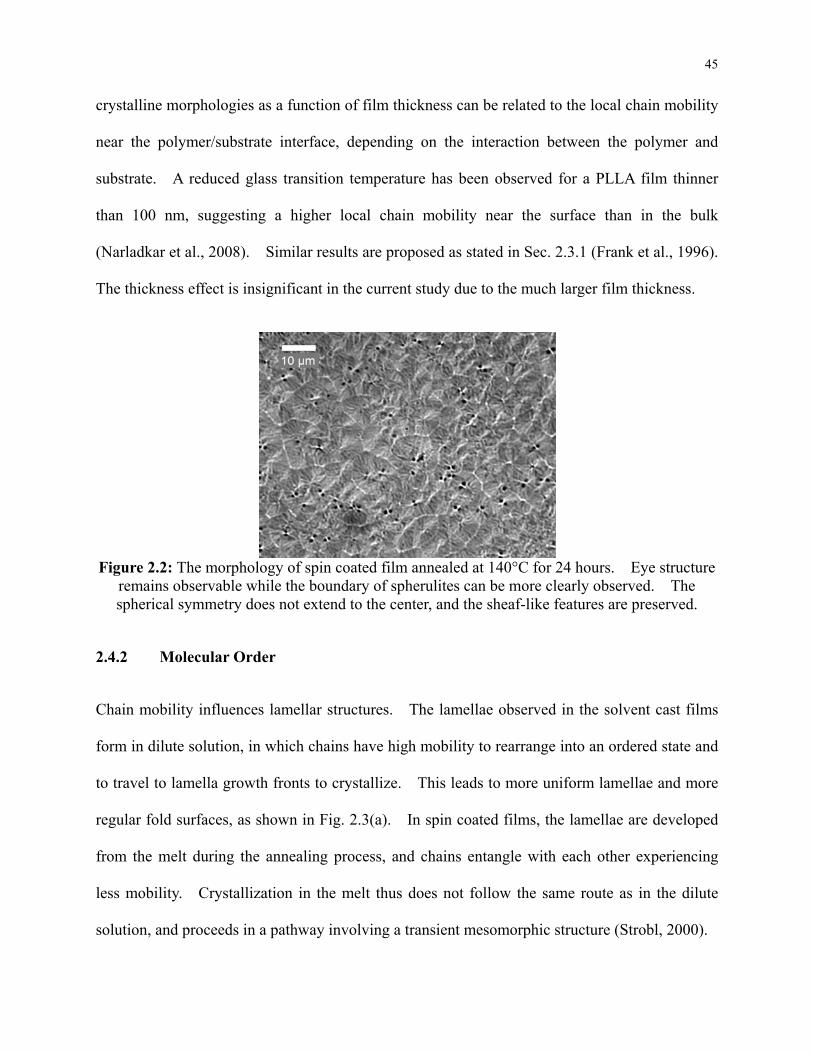
45
crystalline morphologies as a function of film thickness can be related to the local chain mobility
near the polymer/substrate interface, depending on the interaction between the polymer and
substrate. A reduced glass transition temperature has been observed for a PLLA film thinner
than 100 nm, suggesting a higher local chain mobility near the surface than in the bulk
(Narladkar et al., 2008). Similar results are proposed as stated in Sec. 2.3.1 (Frank et al., 1996).
The thickness effect is insignificant in the current study due to the much larger film thickness.
Figure 2.2: The morphology of spin coated film annealed at 140°C for 24 hours. Eye structure
remains observable while the boundary of spherulites can be more clearly observed. The spherical symmetry does not extend to the center, and the sheaf-like features are preserved.
2.4.2 Molecular Order
Chain mobility influences lamellar structures. The lamellae observed in the solvent cast films
form in dilute solution, in which chains have high mobility to rearrange into an ordered state and
to travel to lamella growth fronts to crystallize. This leads to more uniform lamellae and more
regular fold surfaces, as shown in Fig. 2.3(a). In spin coated films, the lamellae are developed
from the melt during the annealing process, and chains entangle with each other experiencing
less mobility. Crystallization in the melt thus does not follow the same route as in the dilute
solution, and proceeds in a pathway involving a transient mesomorphic structure (Strobl, 2000).
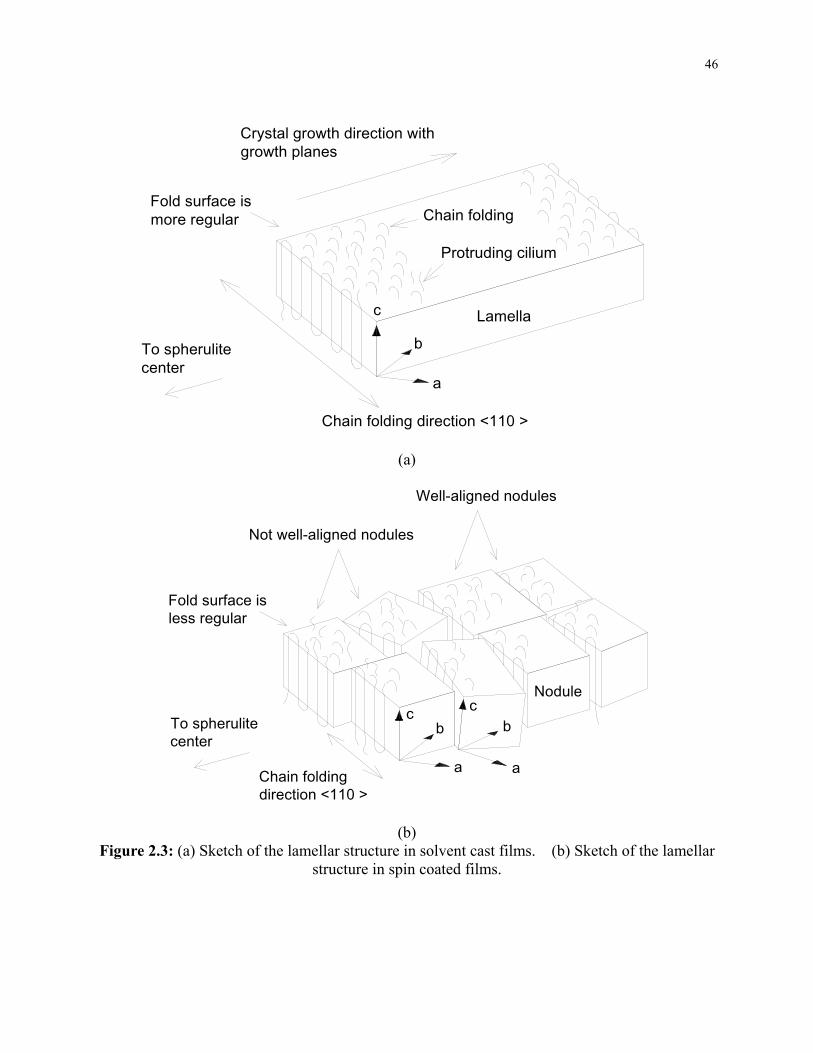
46
Crystal growth direction withgrowth planes
Chain folding direction <110 >
a
b
c
Fold surface ismore regular Chain folding
Protruding cilium
Lamella
To spherulitecenter
(a)
Not well-aligned nodules
Chain foldingdirection <110 >
a
bc
a
bc
To spherulitecenter
Well-aligned nodules
Fold surface isless regular
Nodule
(b)
Figure 2.3: (a) Sketch of the lamellar structure in solvent cast films. (b) Sketch of the lamellar structure in spin coated films.
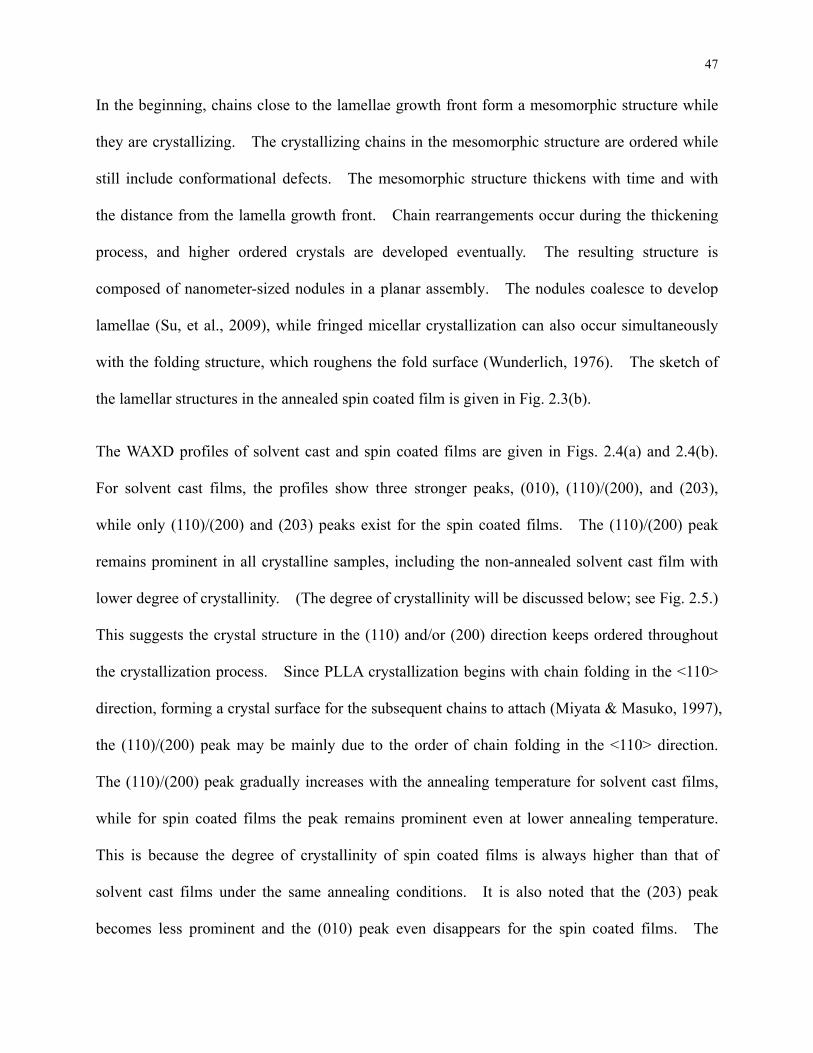
47
In the beginning, chains close to the lamellae growth front form a mesomorphic structure while
they are crystallizing. The crystallizing chains in the mesomorphic structure are ordered while
still include conformational defects. The mesomorphic structure thickens with time and with
the distance from the lamella growth front. Chain rearrangements occur during the thickening
process, and higher ordered crystals are developed eventually. The resulting structure is
composed of nanometer-sized nodules in a planar assembly. The nodules coalesce to develop
lamellae (Su, et al., 2009), while fringed micellar crystallization can also occur simultaneously
with the folding structure, which roughens the fold surface (Wunderlich, 1976). The sketch of
the lamellar structures in the annealed spin coated film is given in Fig. 2.3(b).
The WAXD profiles of solvent cast and spin coated films are given in Figs. 2.4(a) and 2.4(b).
For solvent cast films, the profiles show three stronger peaks, (010), (110)/(200), and (203),
while only (110)/(200) and (203) peaks exist for the spin coated films. The (110)/(200) peak
remains prominent in all crystalline samples, including the non-annealed solvent cast film with
lower degree of crystallinity. (The degree of crystallinity will be discussed below; see Fig. 2.5.)
This suggests the crystal structure in the (110) and/or (200) direction keeps ordered throughout
the crystallization process. Since PLLA crystallization begins with chain folding in the <110>
direction, forming a crystal surface for the subsequent chains to attach (Miyata & Masuko, 1997),
the (110)/(200) peak may be mainly due to the order of chain folding in the <110> direction.
The (110)/(200) peak gradually increases with the annealing temperature for solvent cast films,
while for spin coated films the peak remains prominent even at lower annealing temperature.
This is because the degree of crystallinity of spin coated films is always higher than that of
solvent cast films under the same annealing conditions. It is also noted that the (203) peak
becomes less prominent and the (010) peak even disappears for the spin coated films. The
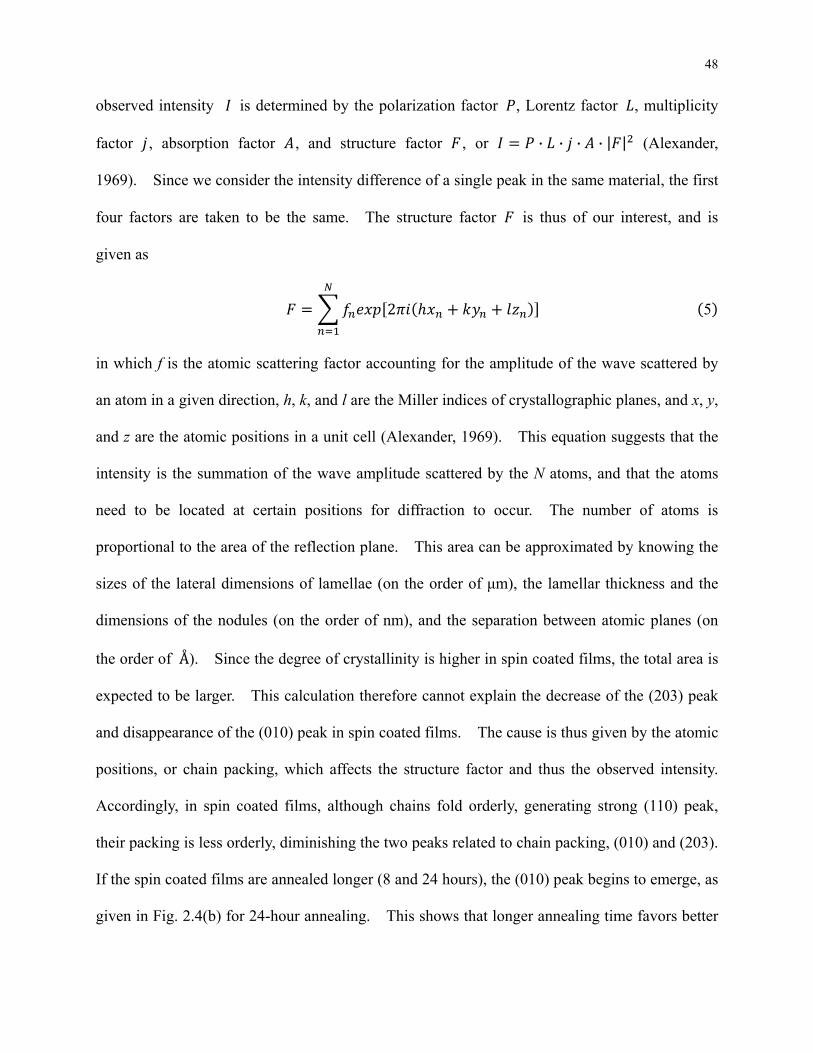
48
observed intensity is determined by the polarization factor , Lorentz factor , multiplicity
factor , absorption factor , and structure factor , or · · · · | | (Alexander,
1969). Since we consider the intensity difference of a single peak in the same material, the first
four factors are taken to be the same. The structure factor is thus of our interest, and is
given as
2 5
in which f is the atomic scattering factor accounting for the amplitude of the wave scattered by
an atom in a given direction, h, k, and l are the Miller indices of crystallographic planes, and x, y,
and z are the atomic positions in a unit cell (Alexander, 1969). This equation suggests that the
intensity is the summation of the wave amplitude scattered by the N atoms, and that the atoms
need to be located at certain positions for diffraction to occur. The number of atoms is
proportional to the area of the reflection plane. This area can be approximated by knowing the
sizes of the lateral dimensions of lamellae (on the order of μm), the lamellar thickness and the
dimensions of the nodules (on the order of nm), and the separation between atomic planes (on
the order of ). Since the degree of crystallinity is higher in spin coated films, the total area is
expected to be larger. This calculation therefore cannot explain the decrease of the (203) peak
and disappearance of the (010) peak in spin coated films. The cause is thus given by the atomic
positions, or chain packing, which affects the structure factor and thus the observed intensity.
Accordingly, in spin coated films, although chains fold orderly, generating strong (110) peak,
their packing is less orderly, diminishing the two peaks related to chain packing, (010) and (203).
If the spin coated films are annealed longer (8 and 24 hours), the (010) peak begins to emerge, as
given in Fig. 2.4(b) for 24-hour annealing. This shows that longer annealing time favors better
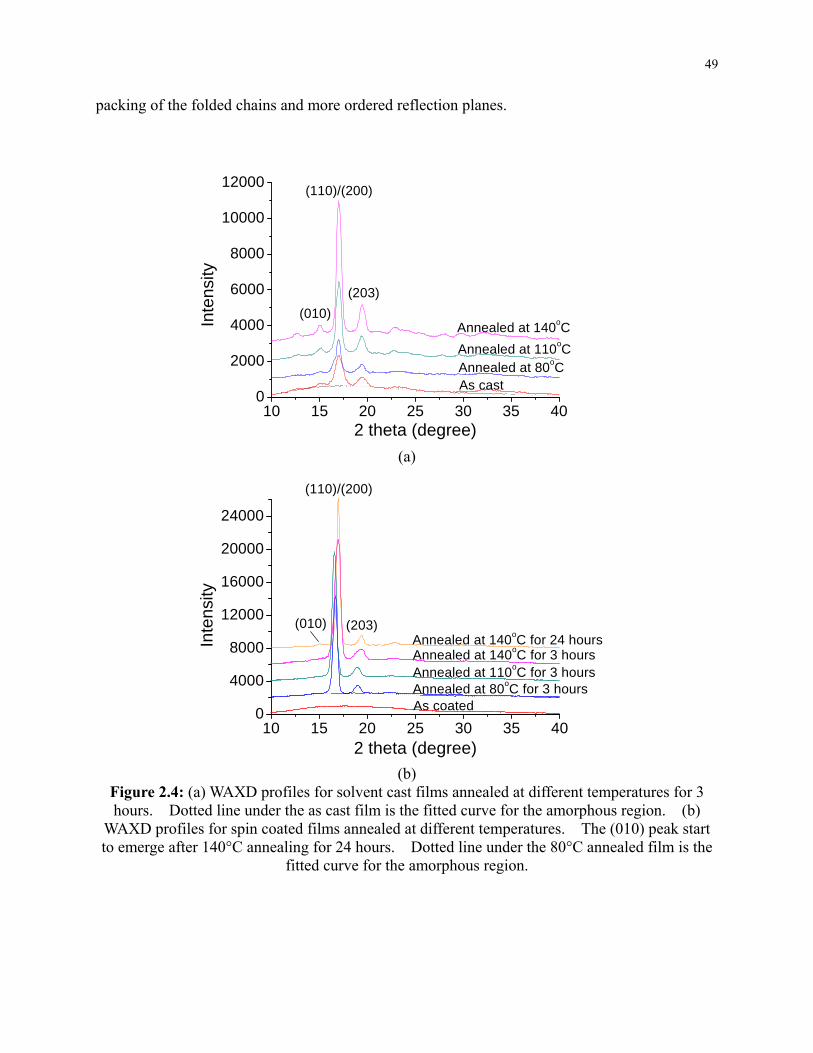
49
packing of the folded chains and more ordered reflection planes.
10 15 20 25 30 35 400
2000
4000
6000
8000
10000
12000
As castAnnealed at 80oCAnnealed at 110oC
(110)/(200)
(010)
(203)
Inte
nsity
2 theta (degree)
Annealed at 140oC
(a)
10 15 20 25 30 35 400
4000
8000
12000
16000
20000
24000
(010)Annealed at 140oC for 24 hours
As coatedAnnealed at 80oC for 3 hoursAnnealed at 110oC for 3 hours
Inte
nsity
2 theta (degree)
(110)/(200)
(203)
Annealed at 140oC for 3 hours
(b)
Figure 2.4: (a) WAXD profiles for solvent cast films annealed at different temperatures for 3 hours. Dotted line under the as cast film is the fitted curve for the amorphous region. (b)
WAXD profiles for spin coated films annealed at different temperatures. The (010) peak start to emerge after 140°C annealing for 24 hours. Dotted line under the 80°C annealed film is the
fitted curve for the amorphous region.
50
0 20 40 60 80 100 120 1400
2
4
6
8
10
12
Inte
nsity
rat
io
Annealing temperature (oC)
Spin coated film Solvent cast film
Figure 2.5: Intensity ratio I(110)/(200)/I(203) of the solvent cast and spin coated films annealed for 3
hours. The error bar represents the standard deviation.
0 20 40 60 80 100 120 14016.6
16.7
16.8
16.9
17.0
17.1
Pea
k lo
catio
n (2
the
ta)
Annealing temperature (oC)
Solvent cast film Spin coated film
2 theta=16.82o [17]
Figure 2.6: Location of the (110)/(200) peak for the solvent cast and spin coated films annealed
for 3 hours. The error bar represents the standard deviation.
The intensity ratio of the two strongest peaks, (110)/(200) and (203), is calculated based on the
area under the peaks. The results for 3-hour annealed films are given in Fig. 2.5, while the
results for 1-hour annealing are similar. The ratio for the spin coated films is always higher
because of the smaller (203) peaks as discussed above. This ratio does not change with
51
annealing temperature, which suggests that similar crystal structures are formed at the three
annealing temperatures. For solvent cast films, the ratio gradually increases with annealing
temperature. This higher ratio could come from the newly formed crystallites, since the degree
of crystallinity increases with annealing temperature. This increase is because the newly
formed crystallites do not develop in solution, but in an environment similar to the spin coated
films. From the above discussion, the chains may not pack well and have a smaller (203) peak.
Figure 2.6 shows the location of the (110)/(200) peak for 3-hour annealed films. Similar trend
is observed for 1-hour annealing. Similar trend is observed for 1-hour annealing. The peak
location for the spin coated films is smaller than that for solvent cast films. From the Bragg’s
law, spin coated films have larger d-spacings and thus less ordered and compact crystal structure,
which agrees with the discussion above. This can originate from the effect of folds (Alexander,
1968) irregular fold surfaces prevent ordered chain packing, increasing the basal area (a and b)
of the unit cell, while c remains unchanged. As discussed, the lamellar fold surface in the spin
coated films is rougher, which leads to larger a and b. Based on the plane spacing equation for
orthorhombic cells
1
d2 =h2
a2 +k2
b2 +l2
c2 (6)
where d is the d-spacing value, larger a and b result in larger d, and therefore smaller 2θ values.
Higher annealing temperature gives energy to the molecules to achieve equilibrium state, and
also enables them to change their conformations to favor chain packing. This explains the
smaller d-spacing in the 140°C-annealed spin coated film. We do not observe the change of 2θ
values in solvent cast films with annealing temperature. This is because the dominant
spherulitic structure is formed during the same casting process, and the effect of annealing is less
52
significant. The 2θ values differ in solvent cast films and spin coated films, and the calculated
value based on the lattice parameters is 16.82° (Miyata & Masuko, 1997). The values vary
slightly due to different processing and crystallization conditions as discussed, which
demonstrates that the lattice parameters of polymers can vary even for the same material.
The WAXD profiles in Fig. 2.4 are composed of amorphous diffraction and crystal diffraction.
The dotted line, obtained from amorphous PLLA, is the amorphous diffraction. The integrated
intensity of the amorphous diffraction, Ia, is the area under the amorphous diffraction curve,
while the integrated intensity of crystal diffraction, Ic, is the peak area. Crystallinity is the ratio
of Ic to Ia+Ic and can be calculated accordingly (Campbell et al., 2000) with results given in Fig.
2.7. The degree of crystallinity increases with annealing temperature, as expected. Similar
results are obtained for the 1-hour annealed films, except that the degree of crystallinity of the
1-hour annealed spin coated films is slightly less than that of the 3-hour annealed spin coated
films by 3%. The degree of crystallinity for 1-hour and 3-hour annealed solvent cast films are
the same, and 1 hour is found to be long enough to complete the secondary crystallization in
solvent cast films. It is also noticed that the degree of crystallinity for the solvent cast films is
always lower than the spin coated films, which suggests part of amorphous molecules in the
solvent cast films cannot crystallize. This could be related to the structure in spherulites.
Optical microscopy reveals that the non-annealed solvent cast film is already filled with
spherulites, but its degree of crystallinity is only 26%; the rest 74% is composed of the
amorphous chains. Some of them are inherently non-crystallizable due to branching or atactic
configuration, while some are crystallizable. Part of the crystallizable chains may be trapped by
the existing lamellar fold surfaces, forming the RAP. The fraction of RAP in crystalline PLLA
can be as large as around 20-30% (Wang et al., 2006; Sarasua et al., 2008), which inhibits the
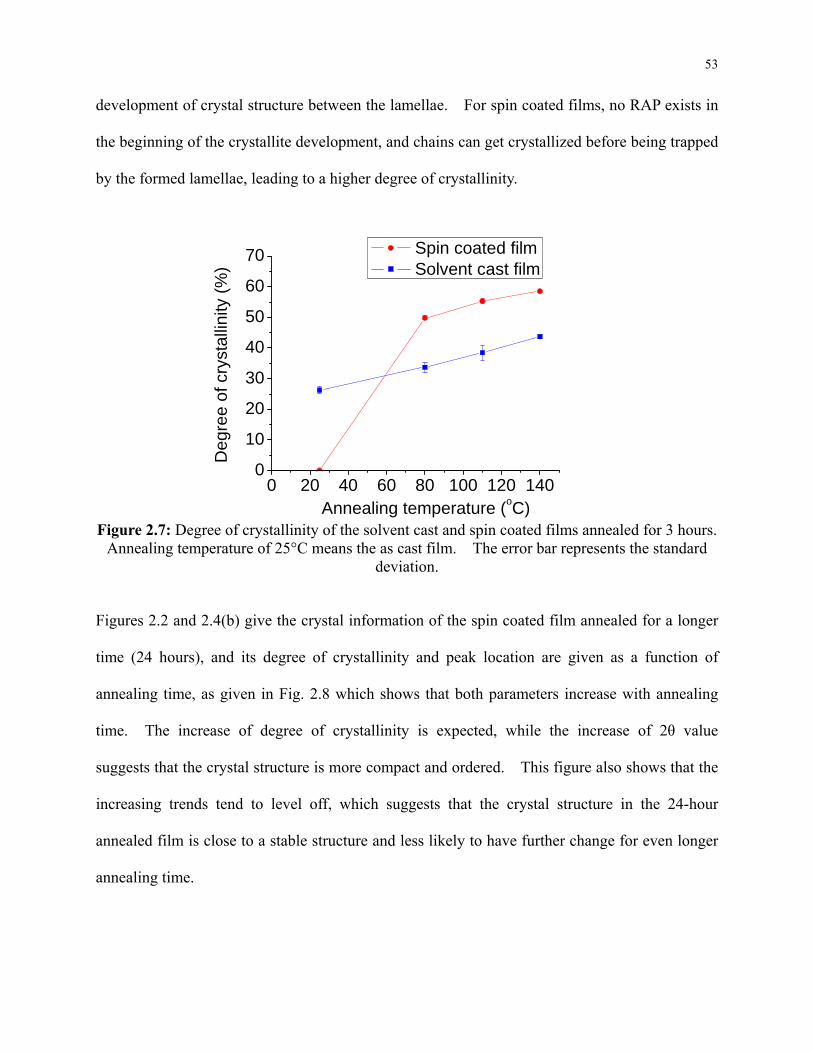
53
development of crystal structure between the lamellae. For spin coated films, no RAP exists in
the beginning of the crystallite development, and chains can get crystallized before being trapped
by the formed lamellae, leading to a higher degree of crystallinity.
0 20 40 60 80 100 120 1400
10
20
30
40
50
60
70 Spin coated film Solvent cast film
De
gre
e o
f cry
stal
linity
(%
)
Annealing temperature (oC) Figure 2.7: Degree of crystallinity of the solvent cast and spin coated films annealed for 3 hours.
Annealing temperature of 25°C means the as cast film. The error bar represents the standard deviation.
Figures 2.2 and 2.4(b) give the crystal information of the spin coated film annealed for a longer
time (24 hours), and its degree of crystallinity and peak location are given as a function of
annealing time, as given in Fig. 2.8 which shows that both parameters increase with annealing
time. The increase of degree of crystallinity is expected, while the increase of 2θ value
suggests that the crystal structure is more compact and ordered. This figure also shows that the
increasing trends tend to level off, which suggests that the crystal structure in the 24-hour
annealed film is close to a stable structure and less likely to have further change for even longer
annealing time.
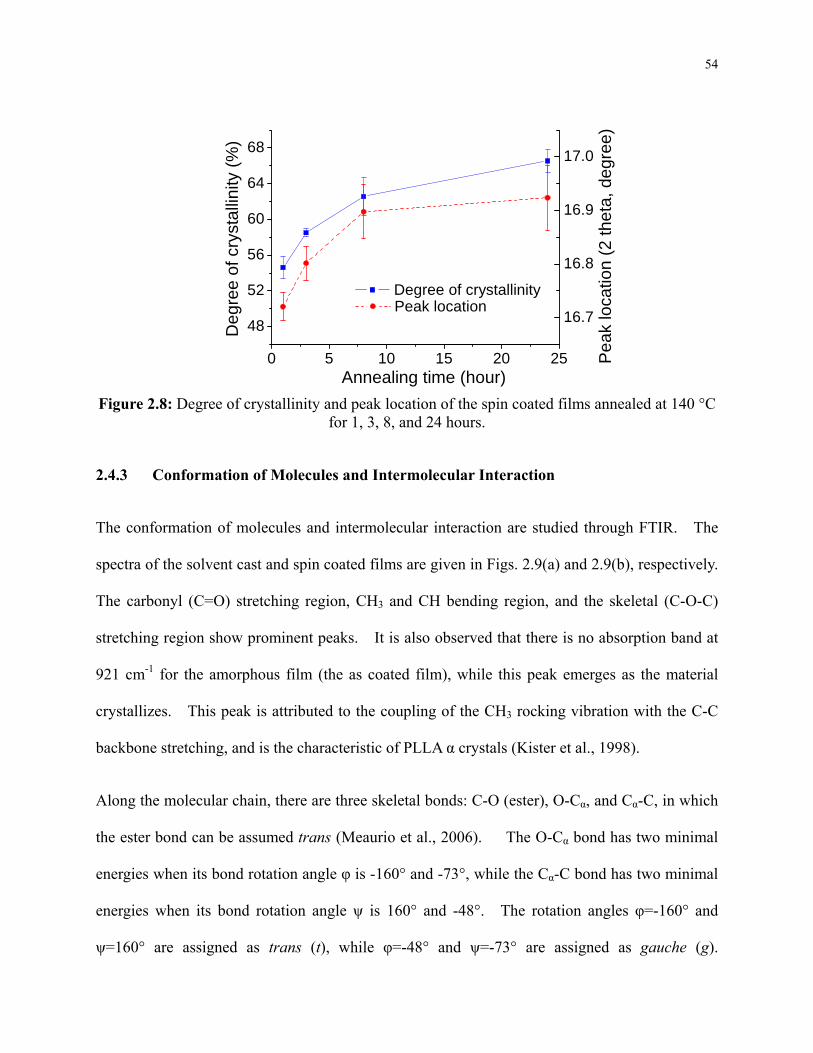
54
0 5 10 15 20 25
48
52
56
60
64
68
De
gre
e o
f cry
stal
linity
(%
)
Annealing time (hour)
Degree of crystallinity
16.7
16.8
16.9
17.0
Peak location
Pea
k lo
catio
n (2
thet
a, d
egre
e)
Figure 2.8: Degree of crystallinity and peak location of the spin coated films annealed at 140 °C
for 1, 3, 8, and 24 hours.
2.4.3 Conformation of Molecules and Intermolecular Interaction
The conformation of molecules and intermolecular interaction are studied through FTIR. The
spectra of the solvent cast and spin coated films are given in Figs. 2.9(a) and 2.9(b), respectively.
The carbonyl (C=O) stretching region, CH3 and CH bending region, and the skeletal (C-O-C)
stretching region show prominent peaks. It is also observed that there is no absorption band at
921 cm-1 for the amorphous film (the as coated film), while this peak emerges as the material
crystallizes. This peak is attributed to the coupling of the CH3 rocking vibration with the C-C
backbone stretching, and is the characteristic of PLLA α crystals (Kister et al., 1998).
Along the molecular chain, there are three skeletal bonds: C-O (ester), O-Cα, and Cα-C, in which
the ester bond can be assumed trans (Meaurio et al., 2006). The O-Cα bond has two minimal
energies when its bond rotation angle φ is -160° and -73°, while the Cα-C bond has two minimal
energies when its bond rotation angle ψ is 160° and -48°. The rotation angles φ=-160° and
ψ=160° are assigned as trans (t), while φ=-48° and ψ=-73° are assigned as gauche (g).
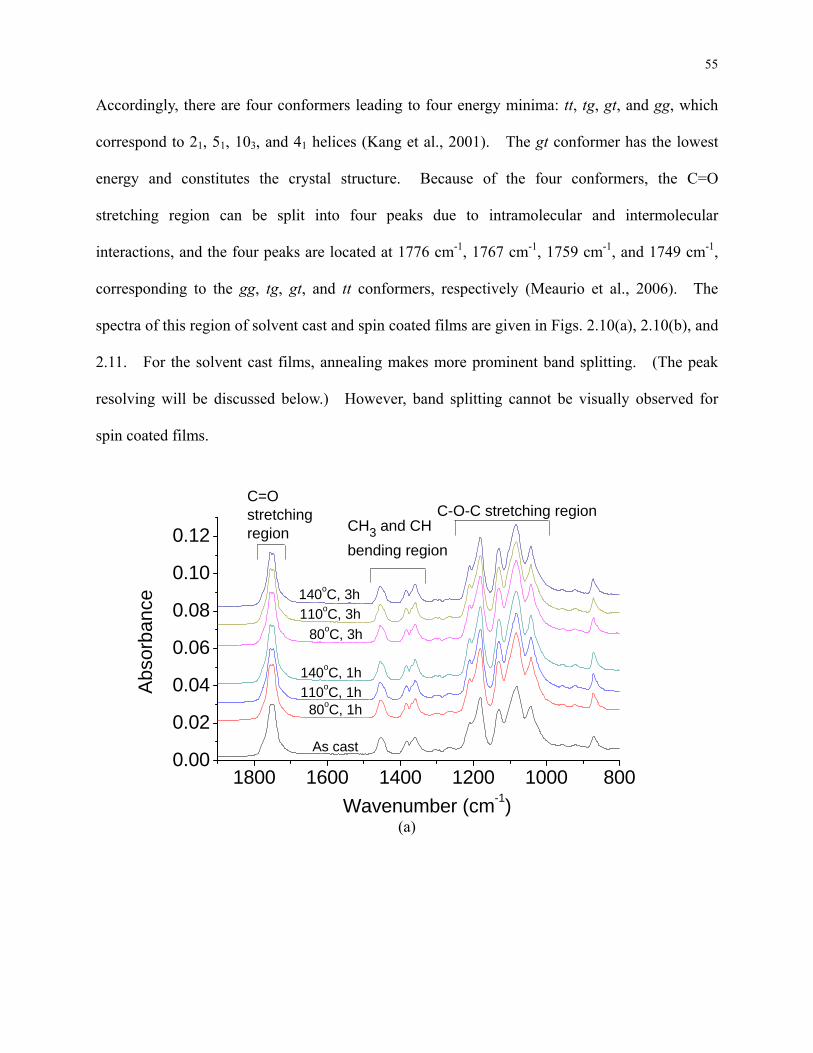
55
Accordingly, there are four conformers leading to four energy minima: tt, tg, gt, and gg, which
correspond to 21, 51, 103, and 41 helices (Kang et al., 2001). The gt conformer has the lowest
energy and constitutes the crystal structure. Because of the four conformers, the C=O
stretching region can be split into four peaks due to intramolecular and intermolecular
interactions, and the four peaks are located at 1776 cm-1, 1767 cm-1, 1759 cm-1, and 1749 cm-1,
corresponding to the gg, tg, gt, and tt conformers, respectively (Meaurio et al., 2006). The
spectra of this region of solvent cast and spin coated films are given in Figs. 2.10(a), 2.10(b), and
2.11. For the solvent cast films, annealing makes more prominent band splitting. (The peak
resolving will be discussed below.) However, band splitting cannot be visually observed for
spin coated films.
1800 1600 1400 1200 1000 8000.00
0.02
0.04
0.06
0.08
0.10
0.12CH3 and CH
bending region
As cast
80oC, 1h110oC, 1h
140oC, 1h
80oC, 3h
110oC, 3h
Abs
orba
nce
Wavenumber (cm-1)
140oC, 3h
C=Ostretchingregion
C-O-C stretching region
(a)
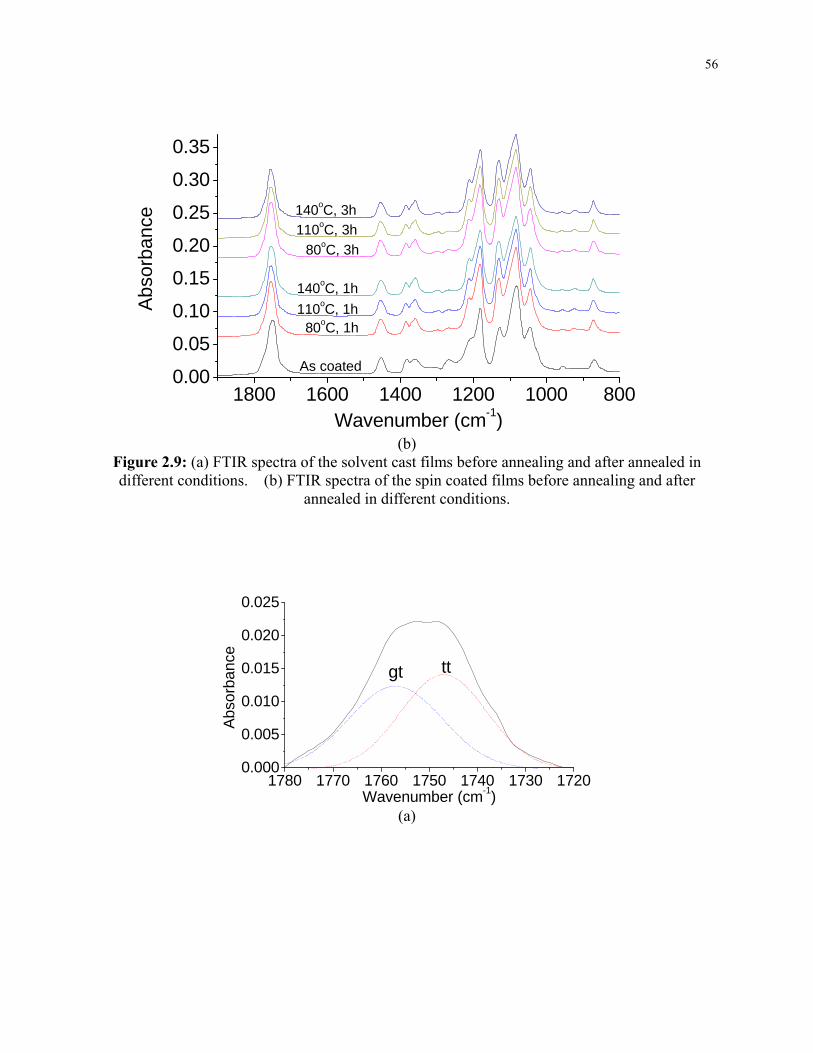
56
1800 1600 1400 1200 1000 8000.00
0.05
0.10
0.15
0.20
0.25
0.30
0.35A
bsor
banc
e
Wavenumber (cm-1)
140oC, 3h
110oC, 3h
80oC, 3h
140oC, 1h
110oC, 1h80oC, 1h
As coated
(b)
Figure 2.9: (a) FTIR spectra of the solvent cast films before annealing and after annealed in different conditions. (b) FTIR spectra of the spin coated films before annealing and after
annealed in different conditions.
1780 1770 1760 1750 1740 1730 17200.000
0.005
0.010
0.015
0.020
0.025
Abs
orb
an
ce
Wavenumber (cm-1)
gt tt
(a)
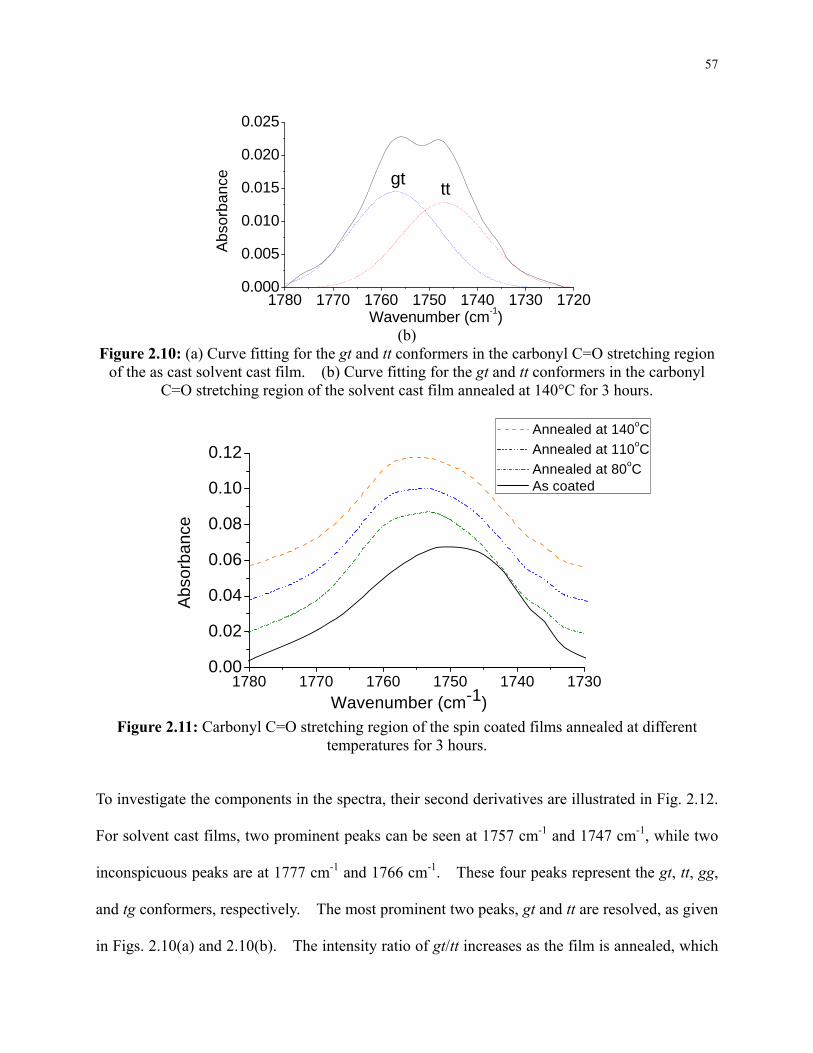
57
1780 1770 1760 1750 1740 1730 17200.000
0.005
0.010
0.015
0.020
0.025
ttgt
Abs
orba
nce
Wavenumber (cm-1) (b)
Figure 2.10: (a) Curve fitting for the gt and tt conformers in the carbonyl C=O stretching region of the as cast solvent cast film. (b) Curve fitting for the gt and tt conformers in the carbonyl
C=O stretching region of the solvent cast film annealed at 140°C for 3 hours.
1780 1770 1760 1750 1740 17300.00
0.02
0.04
0.06
0.08
0.10
0.12
Abs
orba
nce
Wavenumber (cm-1)
Annealed at 140oC
Annealed at 110oC
Annealed at 80oC As coated
Figure 2.11: Carbonyl C=O stretching region of the spin coated films annealed at different
temperatures for 3 hours.
To investigate the components in the spectra, their second derivatives are illustrated in Fig. 2.12.
For solvent cast films, two prominent peaks can be seen at 1757 cm-1 and 1747 cm-1, while two
inconspicuous peaks are at 1777 cm-1 and 1766 cm-1. These four peaks represent the gt, tt, gg,
and tg conformers, respectively. The most prominent two peaks, gt and tt are resolved, as given
in Figs. 2.10(a) and 2.10(b). The intensity ratio of gt/tt increases as the film is annealed, which
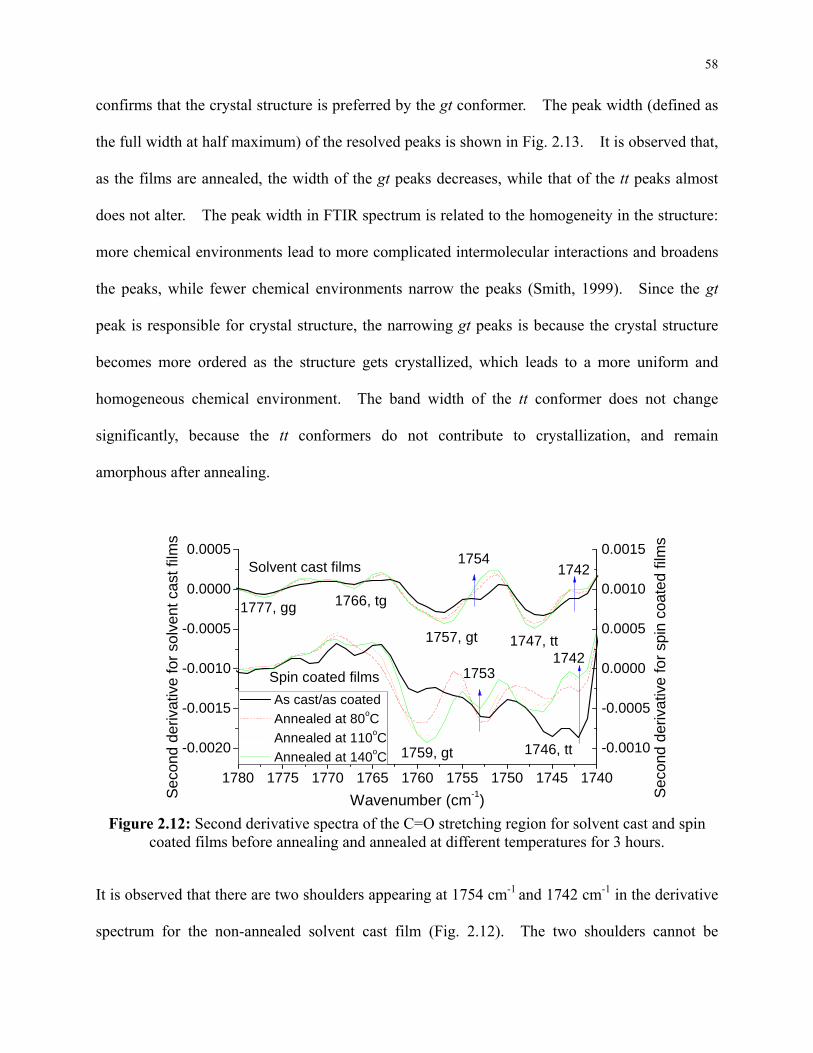
58
confirms that the crystal structure is preferred by the gt conformer. The peak width (defined as
the full width at half maximum) of the resolved peaks is shown in Fig. 2.13. It is observed that,
as the films are annealed, the width of the gt peaks decreases, while that of the tt peaks almost
does not alter. The peak width in FTIR spectrum is related to the homogeneity in the structure:
more chemical environments lead to more complicated intermolecular interactions and broadens
the peaks, while fewer chemical environments narrow the peaks (Smith, 1999). Since the gt
peak is responsible for crystal structure, the narrowing gt peaks is because the crystal structure
becomes more ordered as the structure gets crystallized, which leads to a more uniform and
homogeneous chemical environment. The band width of the tt conformer does not change
significantly, because the tt conformers do not contribute to crystallization, and remain
amorphous after annealing.
1780 1775 1770 1765 1760 1755 1750 1745 1740
-0.0020
-0.0015
-0.0010
-0.0005
0.0000
0.0005
17421753
1746, tt1759, gt
1766, tg1777, gg
1747, tt
Spin coated filmsS
econ
d de
rivat
ive
for
spin
coa
ted
film
s
Sec
ond
deriv
ativ
e fo
r so
lven
t cas
t fil
ms
Wavenumber (cm-1)
As cast/as coated
Annealed at 80oC
Annealed at 110oC
Annealed at 140oC
Solvent cast films
1757, gt
17541742
-0.0010
-0.0005
0.0000
0.0005
0.0010
0.0015
Figure 2.12: Second derivative spectra of the C=O stretching region for solvent cast and spin
coated films before annealing and annealed at different temperatures for 3 hours.
It is observed that there are two shoulders appearing at 1754 cm-1 and 1742 cm-1 in the derivative
spectrum for the non-annealed solvent cast film (Fig. 2.12). The two shoulders cannot be
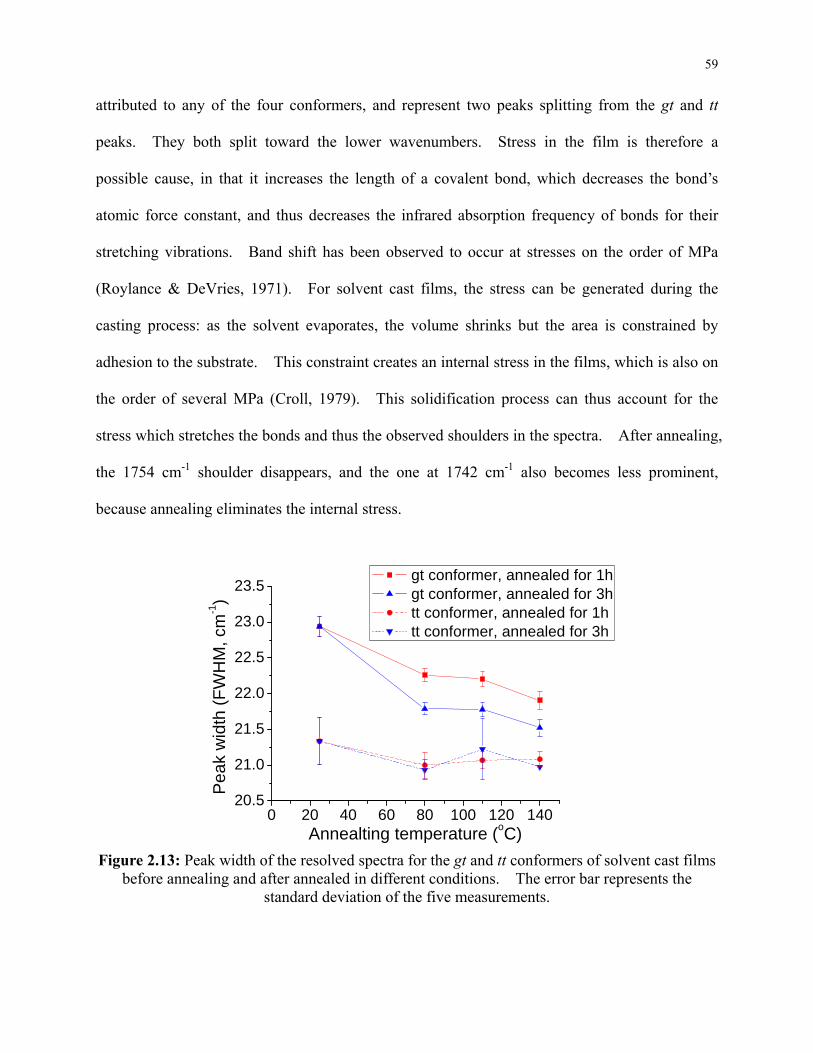
59
attributed to any of the four conformers, and represent two peaks splitting from the gt and tt
peaks. They both split toward the lower wavenumbers. Stress in the film is therefore a
possible cause, in that it increases the length of a covalent bond, which decreases the bond’s
atomic force constant, and thus decreases the infrared absorption frequency of bonds for their
stretching vibrations. Band shift has been observed to occur at stresses on the order of MPa
(Roylance & DeVries, 1971). For solvent cast films, the stress can be generated during the
casting process: as the solvent evaporates, the volume shrinks but the area is constrained by
adhesion to the substrate. This constraint creates an internal stress in the films, which is also on
the order of several MPa (Croll, 1979). This solidification process can thus account for the
stress which stretches the bonds and thus the observed shoulders in the spectra. After annealing,
the 1754 cm-1 shoulder disappears, and the one at 1742 cm-1 also becomes less prominent,
because annealing eliminates the internal stress.
0 20 40 60 80 100 120 14020.5
21.0
21.5
22.0
22.5
23.0
23.5
Pea
k w
idth
(F
WH
M, c
m-1)
Annealting temperature (oC)
gt conformer, annealed for 1h gt conformer, annealed for 3h tt conformer, annealed for 1h tt conformer, annealed for 3h
Figure 2.13: Peak width of the resolved spectra for the gt and tt conformers of solvent cast films
before annealing and after annealed in different conditions. The error bar represents the standard deviation of the five measurements.
60
For the spin coated films, the two prominent peaks are gt and tt, located at 1759 cm-1 and 1746
cm-1, respectively. There are two additional peaks shown at 1753 cm-1 and 1742 cm-1, which
are also located on the right to the gt and tt peaks, respectively; therefore, internal stress could be
the reason of the splitting. In addition to solidification, the centrifugal force during the spinning
process is another source of the internal stress (Vorotilov et al., 1995). However, this stress is
only on the order of only several Pa (Chang et al., 2003), much less than the stress required to
split the band and is less likely to be the reason. The stress induced by solidification is a more
reasonable cause. As the film is annealed, the peaks tend to become less prominent, suggesting
the decrease of stress. It can also be seen that, in the derivative spectrum for the as coated film,
the tt peak is much more prominent than the gt peak, which is consistent with the fact that this
film is amorphous, and may also explain why the band is located at a lower wavenumber in the
original spectrum, as seen in Fig. 2.11.
2.5 Conclusions
It has been shown that both film formation method and annealing have significant influences on
morphology and crystal structure of PLLA films. In solvent cast films, category 1 spherulites
are developed in solution during the casting process, and further annealing increases the degree
of crystallinity without affecting the morphology. Spin coating leads to amorphous structure,
and subsequent annealing generates category 2 spherulites. Molecular order in the two kinds of
films is also different as investigated via WAXD measurements. The crystal structure is more
compact in solvent cast films than in spin coated films, while the lamellae in solvent cast films
formed during casting may be unfavorable to further crystallization. The FTIR measurements
demonstrate the conformation of molecules and intermolecular interaction in the crystallites, and
also show possible stress in the films. Longer annealing time does not change the spherulitic
61
structure, which confirms that the crystal structure is mainly determined by film formation
method and the mobility of polymer chains at which annealing is conducted.
62
Chapter 3: Effect of Excimer Laser Irradiation on Crystallinity and Chemical Bonding of
Biodegradable Polymer
3.1 Introduction
Biodegradable polymers have been attracting wide attention due to their biocompatibility and
biodegradability. Being biodegradable, poly(lactic acid) (PLA) is used in food packaging and
tissue engineering. Its chemical structure also makes it favorable in drug delivery as it
hydrolyzes in the human body into lactic acid, which is then excreted showing no toxicity. In
drug delivery, drugs are embedded in a polymer matrix and released as it degrades. The
advantages of using biodegradable polymers in drug delivery system can be manifested by the
controlled drug release profiles against time (Amass et al., 1998). However, due to the
induction period of polymer degradation caused by the time for water molecules to penetrate into
the matrix, embedded drugs cannot release at the designed rate in the early stage.
Efforts have been made to modify the degradation rate of PLA. Its degradation rate has been
modified by adjusting temperature and pH value in the degradation environment (Zhao et al.,
2004). This attempt is limited since both parameters are invariants in the human body.
Blending PLA with another biodegradable polymer, poly(glycolic acid), to adjust the
degradation rate is also investigated (Miller et al., 1977), while the desired properties of PLA
may be altered in the copolymer. Tsuji (Tsuji, 2002) investigate the effects of tacticity, content
of L-lactide unit, and blending of poly(L-lactic acid) (PLLA) and poly(D-lactic acid) (PDLA) on
the degradation rate of PLA. Although the PDLLA film can have the highest degradation rate,
it requires specific chemical reaction environments to synthesize PDLLA with a desired ratio of
PLLA and PDLA.
63
A way to modify PLA degradation rate free from the above limitations is to change its
crystallinity (Nampoothiri et al., 2010). It is proposed that PLA degradation begins in the
amorphous regions between lamellae, followed by the disorientation of the lamellae and
disappearance of the spherulitic structure (Tsuji & Ikada, 1998). Less crystalline regions are
expected to degrade faster. Adjusting crystallinity is a relatively simple process, and can be
accomplished through thermal treatments such as annealing, melting and quenching (Tsuji &
Ikada, 1995). However, they affect the overall properties within the bulk and have limitation
since accelerating the initial degradation may only require decreasing surface crystallinity while
keeping the bulk intact. Recently, laser irradiation as a heating source to modify the surface
crystallinity has drawn increasing attention. It is also attractive due to flexibility, ease of use,
and spatial controllability.
Using the Nd:YAG laser with the photon energy lower than PLLA bond energies, Bhatla and
Yao (Bhatla & Yao, 2009) reduced the PLLA crystallinity, and quantified it by the wide angle
X-ray diffraction (WAXD) measurements. However, the non-uniform laser spatial intensity
profile makes it difficult to achieve a uniform surface treatment. Because of the incoherent
light generated by the excimer laser, the beam can be homogenized without interference, and the
homogenized beam is spatially uniform and favorable for surface treatment. Using the excimer
laser, Lazare and Benet (Lazare & Benet, 1993) treat poly(ethylene terephthalate) (PET) films,
and demonstrate the presence of a thin amorphous surface layer. Lazare and Benet report that
photochemical reactions are possible in addition to photothermal effects, since excimer lasers
operate at UV wavelengths with photon energies higher than certain bond energies in polymers.
In another attempt to decrease PET film crystallinity using the excimer laser (Dunn & Ouderkirk,
1990), the chemical changes are studied via X-ray photoelectron spectroscopy (XPS). It is
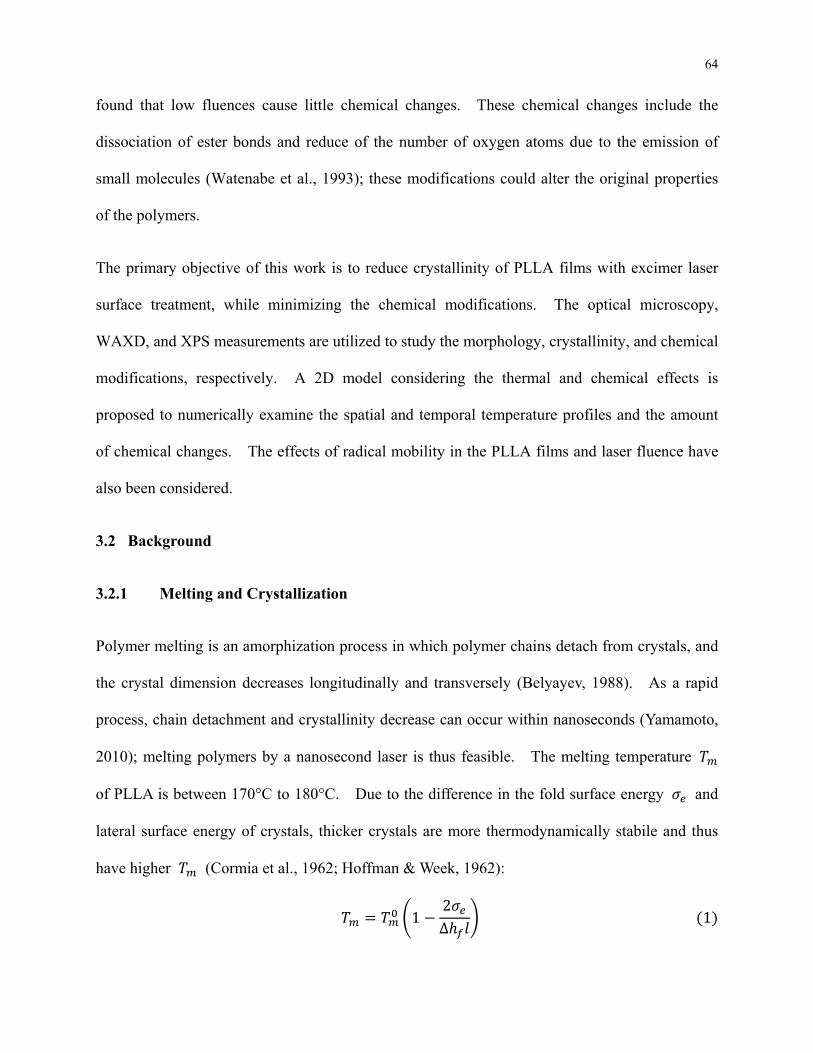
64
found that low fluences cause little chemical changes. These chemical changes include the
dissociation of ester bonds and reduce of the number of oxygen atoms due to the emission of
small molecules (Watenabe et al., 1993); these modifications could alter the original properties
of the polymers.
The primary objective of this work is to reduce crystallinity of PLLA films with excimer laser
surface treatment, while minimizing the chemical modifications. The optical microscopy,
WAXD, and XPS measurements are utilized to study the morphology, crystallinity, and chemical
modifications, respectively. A 2D model considering the thermal and chemical effects is
proposed to numerically examine the spatial and temporal temperature profiles and the amount
of chemical changes. The effects of radical mobility in the PLLA films and laser fluence have
also been considered.
3.2 Background
3.2.1 Melting and Crystallization
Polymer melting is an amorphization process in which polymer chains detach from crystals, and
the crystal dimension decreases longitudinally and transversely (Belyayev, 1988). As a rapid
process, chain detachment and crystallinity decrease can occur within nanoseconds (Yamamoto,
2010); melting polymers by a nanosecond laser is thus feasible. The melting temperature
of PLLA is between 170°C to 180°C. Due to the difference in the fold surface energy and
lateral surface energy of crystals, thicker crystals are more thermodynamically stabile and thus
have higher (Cormia et al., 1962; Hoffman & Week, 1962):
12∆
1
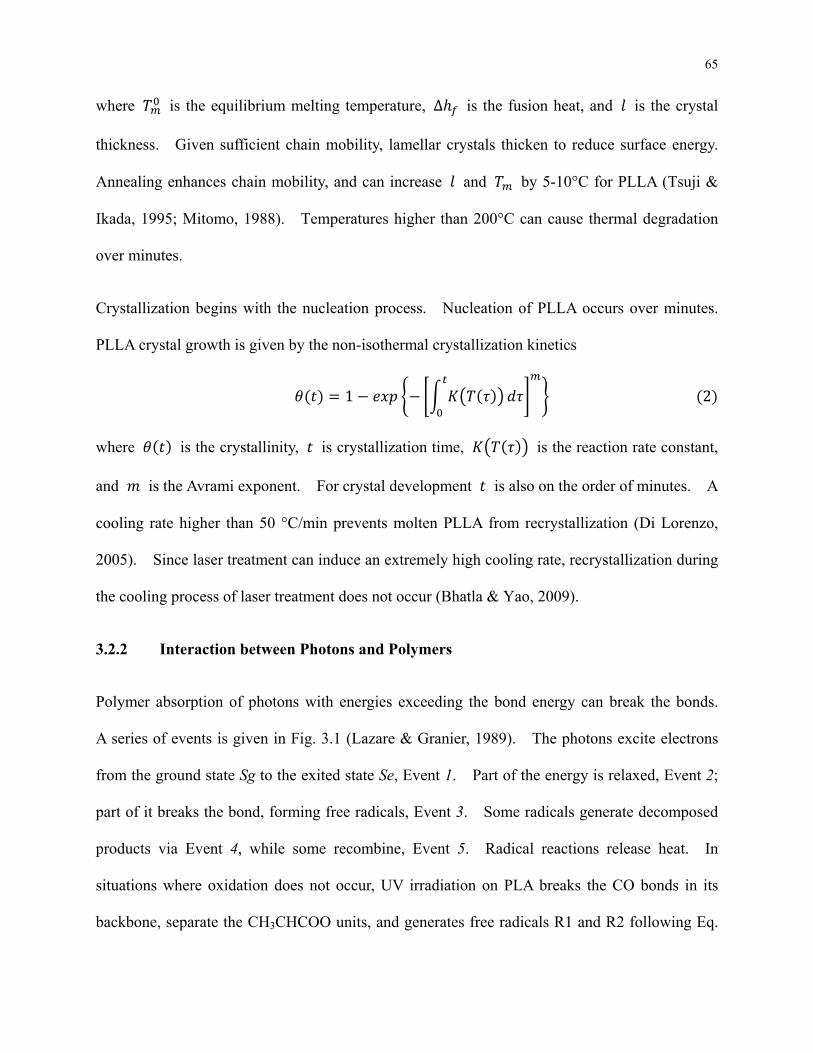
65
where is the equilibrium melting temperature, ∆ is the fusion heat, and is the crystal
thickness. Given sufficient chain mobility, lamellar crystals thicken to reduce surface energy.
Annealing enhances chain mobility, and can increase and by 5-10°C for PLLA (Tsuji &
Ikada, 1995; Mitomo, 1988). Temperatures higher than 200°C can cause thermal degradation
over minutes.
Crystallization begins with the nucleation process. Nucleation of PLLA occurs over minutes.
PLLA crystal growth is given by the non-isothermal crystallization kinetics
1 2
where is the crystallinity, is crystallization time, is the reaction rate constant,
and is the Avrami exponent. For crystal development is also on the order of minutes. A
cooling rate higher than 50 °C/min prevents molten PLLA from recrystallization (Di Lorenzo,
2005). Since laser treatment can induce an extremely high cooling rate, recrystallization during
the cooling process of laser treatment does not occur (Bhatla & Yao, 2009).
3.2.2 Interaction between Photons and Polymers
Polymer absorption of photons with energies exceeding the bond energy can break the bonds.
A series of events is given in Fig. 3.1 (Lazare & Granier, 1989). The photons excite electrons
from the ground state Sg to the exited state Se, Event 1. Part of the energy is relaxed, Event 2;
part of it breaks the bond, forming free radicals, Event 3. Some radicals generate decomposed
products via Event 4, while some recombine, Event 5. Radical reactions release heat. In
situations where oxidation does not occur, UV irradiation on PLA breaks the CO bonds in its
backbone, separate the CH3CHCOO units, and generates free radicals R1 and R2 following Eq.
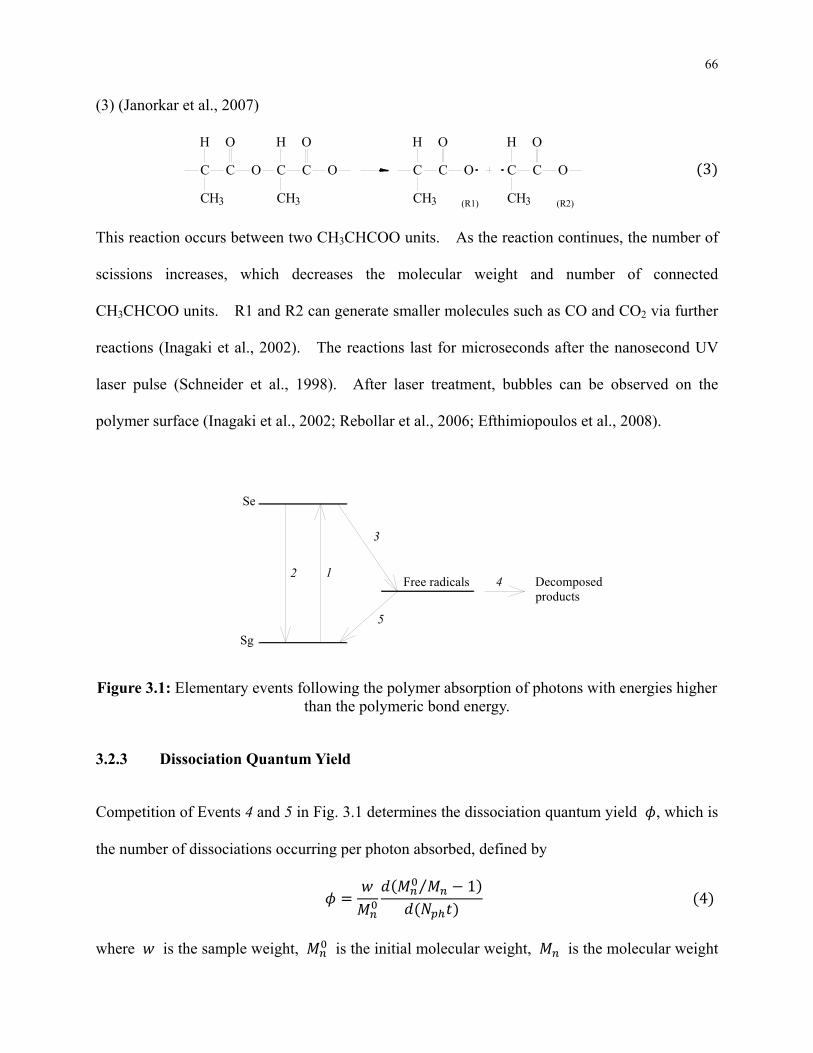
66
(3) (Janorkar et al., 2007)
C C O C C O
H HO O
CH3 CH3
C C O
H O
CH3
C C O
H O
CH3 (R2)(R1)
This reaction occurs between two CH3CHCOO units. As the reaction continues, the number of
scissions increases, which decreases the molecular weight and number of connected
CH3CHCOO units. R1 and R2 can generate smaller molecules such as CO and CO2 via further
reactions (Inagaki et al., 2002). The reactions last for microseconds after the nanosecond UV
laser pulse (Schneider et al., 1998). After laser treatment, bubbles can be observed on the
polymer surface (Inagaki et al., 2002; Rebollar et al., 2006; Efthimiopoulos et al., 2008).
Free radicals Decomposedproducts
12
Sg
Se
3
4
5
Figure 3.1: Elementary events following the polymer absorption of photons with energies higher
than the polymeric bond energy.
3.2.3 Dissociation Quantum Yield
Competition of Events 4 and 5 in Fig. 3.1 determines the dissociation quantum yield , which is
the number of dissociations occurring per photon absorbed, defined by
⁄ 1 4
where is the sample weight, is the initial molecular weight, is the molecular weight
3
67
at time , is the number of absorbed photons per unit time. The number of scissions per
chain, ⁄ 1, increases with radical mobility based on the cage effect. The quantum
yield in the mobile state is generally larger by an order under UV irradiation (Dan & Guillet,
1973), and is proportional to the dissociation reaction rate constant through (Aleksandrov et
al., 1988)
5
where is the photon absorption cross section with photon frequency .
3.3 Numerical Model
To numerically investigate the spatial and temporal distribution of temperature and the amount
of chemical modifications, a 2D symmetric thermal and chemical model is developed. Since
PLLA is semitransparent at UV, laser irradiation energy is absorbed by the bulk, and the bulk
temperature is governed by the heat equation
· , 6
where is density, is specific heat, is conductivity, is laser irradiation depth,
, is the laser power density, and is the release heat of radical reactions and will be
determined in Eq. (12). For an incompressible material, change in during the phase
transition can be approximated by ∆ ∆ ⁄ , where ∆ is the heat of fusion. The
specific heat is calculated as
∆ , ∆ 7
where is the specific heat in the solid state and is a step function with value 0 for
∆ and 1 for ∆ . The specific heat of polymeric materials is typically
68
around 1000 J/(kg·K) (Boudenne et al., 2011); thus is assumed 1000 J/(kg·K). ∆ , 10°C,
is half the transition temperature span. Laser power density, , , is a function of space and
time
, · · exp · 4 22
8
where is the absorptivity, 0.07, is the absorption coefficient, 103 cm-1 (Ohki et al., 2007),
is the pulse width, 25 ns, and is the peak power density obtained by ⁄ with
the laser fluence. Convection and radiation are considered on the boundaries while insulation is
specified along the symmetry line. The initial temperature is set 20°C. Change of crystal size
due to annealing is not of interest, while its effect on is considered by assuming different
’s for the non-annealed films (175°C) and annealed films (180°C). From the backgrounds of
crystallization and cooling rate in Sec. 3.2.1, it is assumed that no crystallization occurs during
cooling; the assumption will be validated by our simulation results in Sec. 3.5.2. Crystallinity
decreases as the material melts; therefore, the crystallinity change is related to the melting depth
in the film.
The chemical modifications occur via Eq. (3) if R1 and R2 do not recombine. The amount of
modifications depends on the number of scissions, Eq. (4). As scission occurs, the connections
of the CH3CHCOO units at their ester group with another unit are broken, and the number of
such connected CH3CHCOO units decreases. Therefore, the number of the CH3CHCOO units
with connection at their ester group to another unit in a unit volume, or its number density, is
modeled. For incompressible materials, the number density is governed by the mass
conservation equation
69
· · 9
where is the number density with an initial value of , is the velocity vector, is the
diffusion coefficient, and is the reaction rate. Velocity and diffusion gradients are assumed
to be negligible during laser treatment, and thus ⁄ . The reaction rate is given by the
crystallinity ,
· 1 · 10
where and are the reaction rates of the crystalline and amorphous domains, respectively.
The photochemical reaction rate is proportional to the number density (Bityurin et al., 2003).
Thus, · and · where and are the reaction rate constants of the
crystalline and amorphous domains, respectively. Temperature dependence of reaction rate is
expressed by the Arrhenius expressions for the reaction rate constant (Astrath et al., 2009); the
proportionality between the reaction rate constant and quantum yield (Aleksandrov et al., 1988)
is also considered.
· · 11
where or , and is the pre-exponential factor of the Arrhenius expression, assumed
107 1/s, is the activation energy, assumed 25 kJ/mol, and is the universal gas constant.
and are the step functions accounting for the quantum yields in solid and mobile states.
To consider the one-order-of-magnitude difference of the quantum yields in the mobile and solid
states (Dan & Guillet, 1973), is assumed 1 if and 0.1 if and is
assumed 1 if and 0.1 if . Temperature is imported from the thermal analysis.
It is assumed that the time period for the photochemical process is 20 and that no
flux across the boundaries. The release heat of radical reactions is considered as
70
2 12
where is the number density of the free radicals to be recombined or react, which is 2 if
all molecules in the ground state can be excited to generate free radicals (Event 1 in Fig. 3.1).
Also in Eq. (12), is the reaction heat by each event, around 600 J/mol (Currie et al., 1969),
and is the step function whose value is 1 if and 0 if to consider the
time period of the photochemical process. The reaction heat is then output to the thermal
analysis. Part of the crystalline chain becomes amorphous during melting, while its motion
could be constrained by surrounding crystals. Thus, at the same , the initial crystalline
domain is assumed to have the same mobility and reaction rate before and after melting. Since
the amount of chemical modifications on the polymer chains induced via Eq. (3) is of interest
and the generated free radicals only react with other radicals instead of the polymer chains
(Inagaki et al., 2002), the subsequent chemical reactions and products are not considered in the
simulation.
The coupled partial differential equations 6 and 9 with boundary and initial conditions can
be solved through the finite element method. The software COMSOL Multiphysics 4.1 is used.
A 2D symmetric model is developed and composed of thermal and chemical analyses. Its
domain is 0.7 mm × 20 µm with laser beam size 0.5 mm. The thermal analysis is realized by
the Heat Transfer in Solids Interface of the Heat Transfer Module. The chemical analysis is
accomplished by the Transport of Diluted Species Interface of the Chemical Reaction
Engineering Module, which is able to compute the number density of a single species under
varying reaction rates. The COMSOL smoothed Heaviside function, flc2hs, is used as the step
functions.
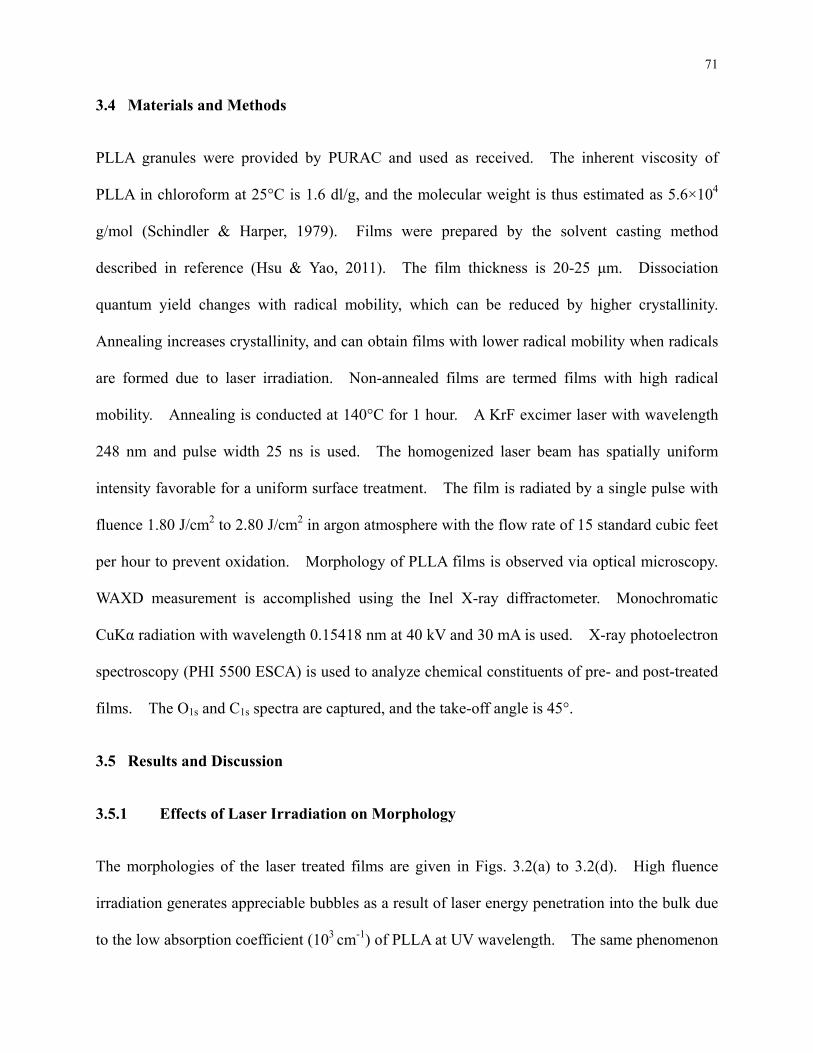
71
3.4 Materials and Methods
PLLA granules were provided by PURAC and used as received. The inherent viscosity of
PLLA in chloroform at 25°C is 1.6 dl/g, and the molecular weight is thus estimated as 5.6×10⁴
g/mol (Schindler & Harper, 1979). Films were prepared by the solvent casting method
described in reference (Hsu & Yao, 2011). The film thickness is 20-25 μm. Dissociation
quantum yield changes with radical mobility, which can be reduced by higher crystallinity.
Annealing increases crystallinity, and can obtain films with lower radical mobility when radicals
are formed due to laser irradiation. Non-annealed films are termed films with high radical
mobility. Annealing is conducted at 140°C for 1 hour. A KrF excimer laser with wavelength
248 nm and pulse width 25 ns is used. The homogenized laser beam has spatially uniform
intensity favorable for a uniform surface treatment. The film is radiated by a single pulse with
fluence 1.80 J/cm2 to 2.80 J/cm2 in argon atmosphere with the flow rate of 15 standard cubic feet
per hour to prevent oxidation. Morphology of PLLA films is observed via optical microscopy.
WAXD measurement is accomplished using the Inel X-ray diffractometer. Monochromatic
CuKα radiation with wavelength 0.15418 nm at 40 kV and 30 mA is used. X-ray photoelectron
spectroscopy (PHI 5500 ESCA) is used to analyze chemical constituents of pre- and post-treated
films. The O1s and C1s spectra are captured, and the take-off angle is 45°.
3.5 Results and Discussion
3.5.1 Effects of Laser Irradiation on Morphology
The morphologies of the laser treated films are given in Figs. 3.2(a) to 3.2(d). High fluence
irradiation generates appreciable bubbles as a result of laser energy penetration into the bulk due
to the low absorption coefficient (103 cm-1) of PLLA at UV wavelength. The same phenomenon
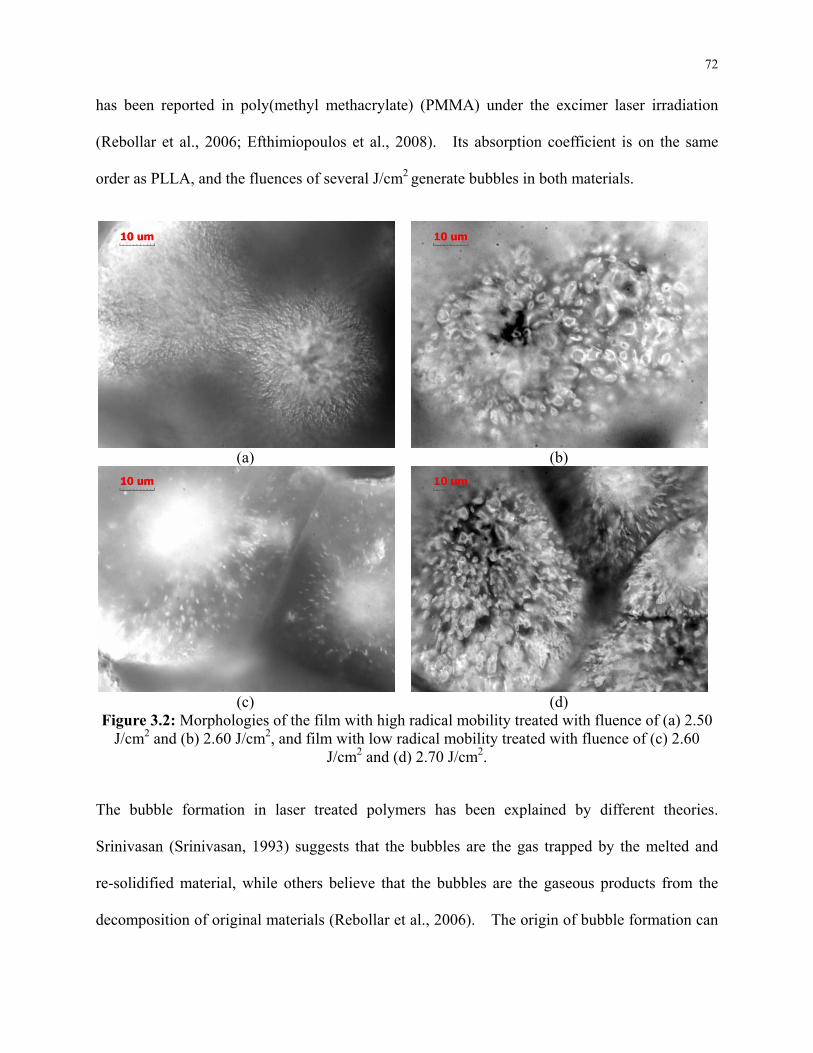
72
has been reported in poly(methyl methacrylate) (PMMA) under the excimer laser irradiation
(Rebollar et al., 2006; Efthimiopoulos et al., 2008). Its absorption coefficient is on the same
order as PLLA, and the fluences of several J/cm2 generate bubbles in both materials.
(a) (b)
(c) (d) Figure 3.2: Morphologies of the film with high radical mobility treated with fluence of (a) 2.50
J/cm2 and (b) 2.60 J/cm2, and film with low radical mobility treated with fluence of (c) 2.60 J/cm2 and (d) 2.70 J/cm2.
The bubble formation in laser treated polymers has been explained by different theories.
Srinivasan (Srinivasan, 1993) suggests that the bubbles are the gas trapped by the melted and
re-solidified material, while others believe that the bubbles are the gaseous products from the
decomposition of original materials (Rebollar et al., 2006). The origin of bubble formation can
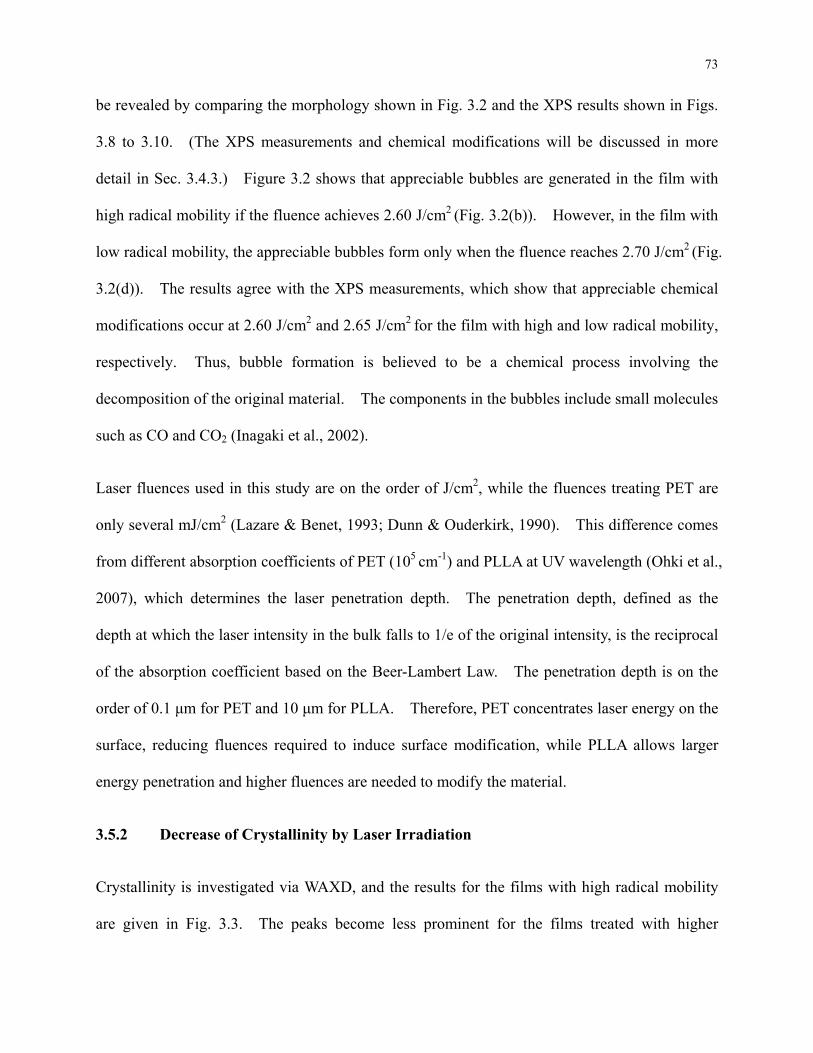
73
be revealed by comparing the morphology shown in Fig. 3.2 and the XPS results shown in Figs.
3.8 to 3.10. (The XPS measurements and chemical modifications will be discussed in more
detail in Sec. 3.4.3.) Figure 3.2 shows that appreciable bubbles are generated in the film with
high radical mobility if the fluence achieves 2.60 J/cm2 (Fig. 3.2(b)). However, in the film with
low radical mobility, the appreciable bubbles form only when the fluence reaches 2.70 J/cm2 (Fig.
3.2(d)). The results agree with the XPS measurements, which show that appreciable chemical
modifications occur at 2.60 J/cm2 and 2.65 J/cm2 for the film with high and low radical mobility,
respectively. Thus, bubble formation is believed to be a chemical process involving the
decomposition of the original material. The components in the bubbles include small molecules
such as CO and CO2 (Inagaki et al., 2002).
Laser fluences used in this study are on the order of J/cm2, while the fluences treating PET are
only several mJ/cm2 (Lazare & Benet, 1993; Dunn & Ouderkirk, 1990). This difference comes
from different absorption coefficients of PET (105 cm-1) and PLLA at UV wavelength (Ohki et al.,
2007), which determines the laser penetration depth. The penetration depth, defined as the
depth at which the laser intensity in the bulk falls to 1/e of the original intensity, is the reciprocal
of the absorption coefficient based on the Beer-Lambert Law. The penetration depth is on the
order of 0.1 μm for PET and 10 μm for PLLA. Therefore, PET concentrates laser energy on the
surface, reducing fluences required to induce surface modification, while PLLA allows larger
energy penetration and higher fluences are needed to modify the material.
3.5.2 Decrease of Crystallinity by Laser Irradiation
Crystallinity is investigated via WAXD, and the results for the films with high radical mobility
are given in Fig. 3.3. The peaks become less prominent for the films treated with higher
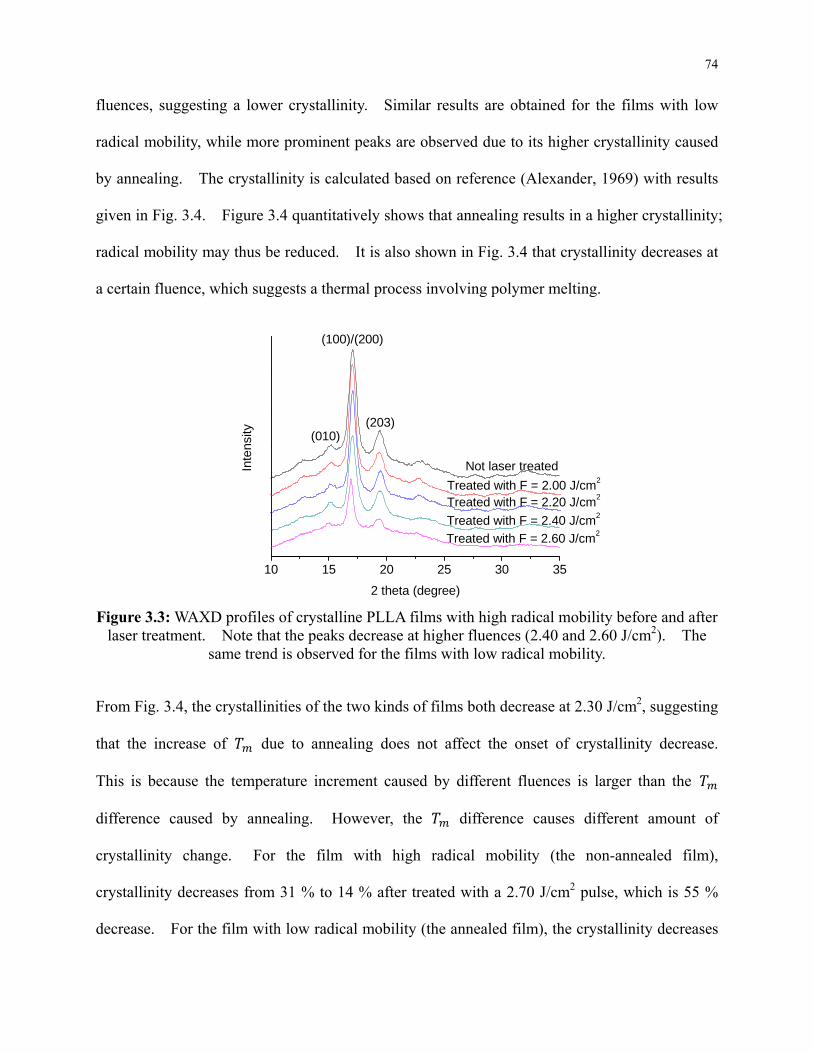
74
fluences, suggesting a lower crystallinity. Similar results are obtained for the films with low
radical mobility, while more prominent peaks are observed due to its higher crystallinity caused
by annealing. The crystallinity is calculated based on reference (Alexander, 1969) with results
given in Fig. 3.4. Figure 3.4 quantitatively shows that annealing results in a higher crystallinity;
radical mobility may thus be reduced. It is also shown in Fig. 3.4 that crystallinity decreases at
a certain fluence, which suggests a thermal process involving polymer melting.
10 15 20 25 30 35
Treated with F = 2.40 J/cm2
Treated with F = 2.60 J/cm2
Treated with F = 2.00 J/cm2
Treated with F = 2.20 J/cm2
(010)
Inte
nsity
2 theta (degree)
(100)/(200)
(203)
Not laser treated
Figure 3.3: WAXD profiles of crystalline PLLA films with high radical mobility before and after
laser treatment. Note that the peaks decrease at higher fluences (2.40 and 2.60 J/cm2). The same trend is observed for the films with low radical mobility.
From Fig. 3.4, the crystallinities of the two kinds of films both decrease at 2.30 J/cm2, suggesting
that the increase of due to annealing does not affect the onset of crystallinity decrease.
This is because the temperature increment caused by different fluences is larger than the
difference caused by annealing. However, the difference causes different amount of
crystallinity change. For the film with high radical mobility (the non-annealed film),
crystallinity decreases from 31 % to 14 % after treated with a 2.70 J/cm2 pulse, which is 55 %
decrease. For the film with low radical mobility (the annealed film), the crystallinity decreases
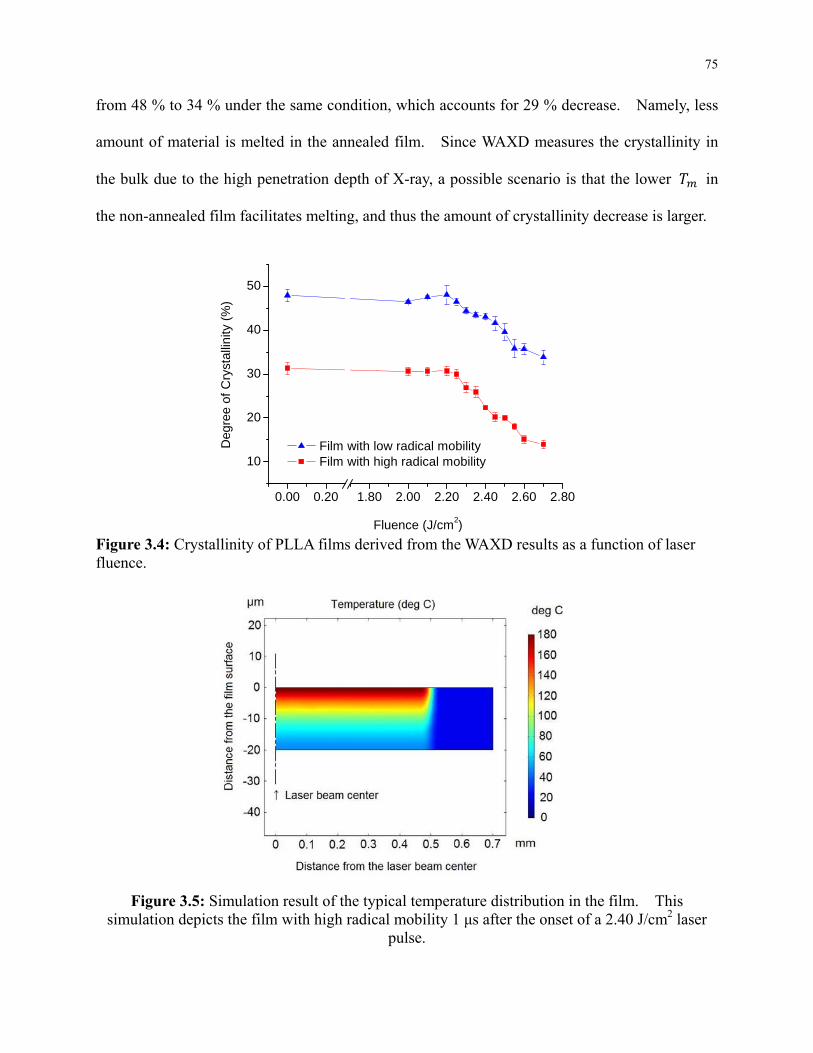
75
from 48 % to 34 % under the same condition, which accounts for 29 % decrease. Namely, less
amount of material is melted in the annealed film. Since WAXD measures the crystallinity in
the bulk due to the high penetration depth of X-ray, a possible scenario is that the lower in
the non-annealed film facilitates melting, and thus the amount of crystallinity decrease is larger.
0.00 0.20 1.80 2.00 2.20 2.40 2.60 2.80
10
20
30
40
50
Fluence (J/cm2)
Deg
ree
of C
ryst
allin
ity (
%)
Film with low radical mobility Film with high radical mobility
Figure 3.4: Crystallinity of PLLA films derived from the WAXD results as a function of laser fluence.
Figure 3.5: Simulation result of the typical temperature distribution in the film. This
simulation depicts the film with high radical mobility 1 μs after the onset of a 2.40 J/cm2 laser pulse.
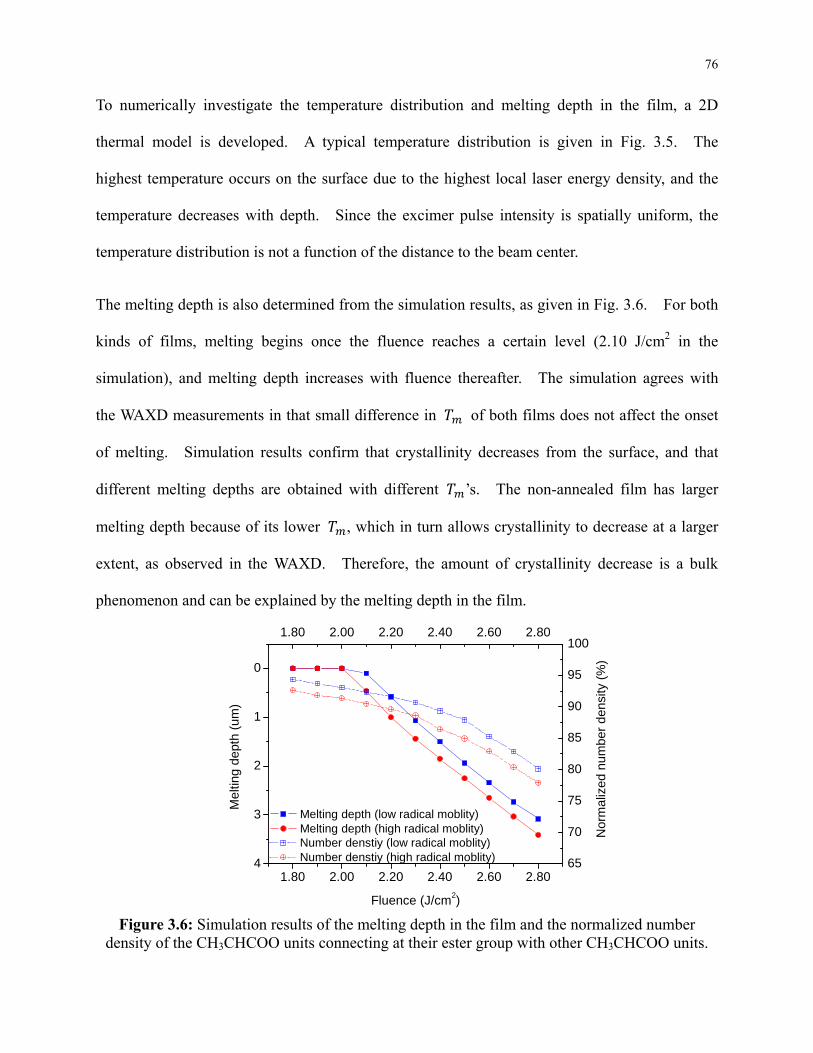
76
To numerically investigate the temperature distribution and melting depth in the film, a 2D
thermal model is developed. A typical temperature distribution is given in Fig. 3.5. The
highest temperature occurs on the surface due to the highest local laser energy density, and the
temperature decreases with depth. Since the excimer pulse intensity is spatially uniform, the
temperature distribution is not a function of the distance to the beam center.
The melting depth is also determined from the simulation results, as given in Fig. 3.6. For both
kinds of films, melting begins once the fluence reaches a certain level (2.10 J/cm2 in the
simulation), and melting depth increases with fluence thereafter. The simulation agrees with
the WAXD measurements in that small difference in of both films does not affect the onset
of melting. Simulation results confirm that crystallinity decreases from the surface, and that
different melting depths are obtained with different ’s. The non-annealed film has larger
melting depth because of its lower , which in turn allows crystallinity to decrease at a larger
extent, as observed in the WAXD. Therefore, the amount of crystallinity decrease is a bulk
phenomenon and can be explained by the melting depth in the film.
1.80 2.00 2.20 2.40 2.60 2.804
3
2
1
0
Mel
ting
dept
h (u
m)
Fluence (J/cm2)
Melting depth (low radical moblity) Melting depth (high radical moblity)
1.80 2.00 2.20 2.40 2.60 2.80
65
70
75
80
85
90
95
100
Nor
mal
ized
num
ber
dens
ity (
%)
Number denstiy (low radical moblity) Number denstiy (high radical moblity)
Figure 3.6: Simulation results of the melting depth in the film and the normalized number
density of the CH3CHCOO units connecting at their ester group with other CH3CHCOO units.
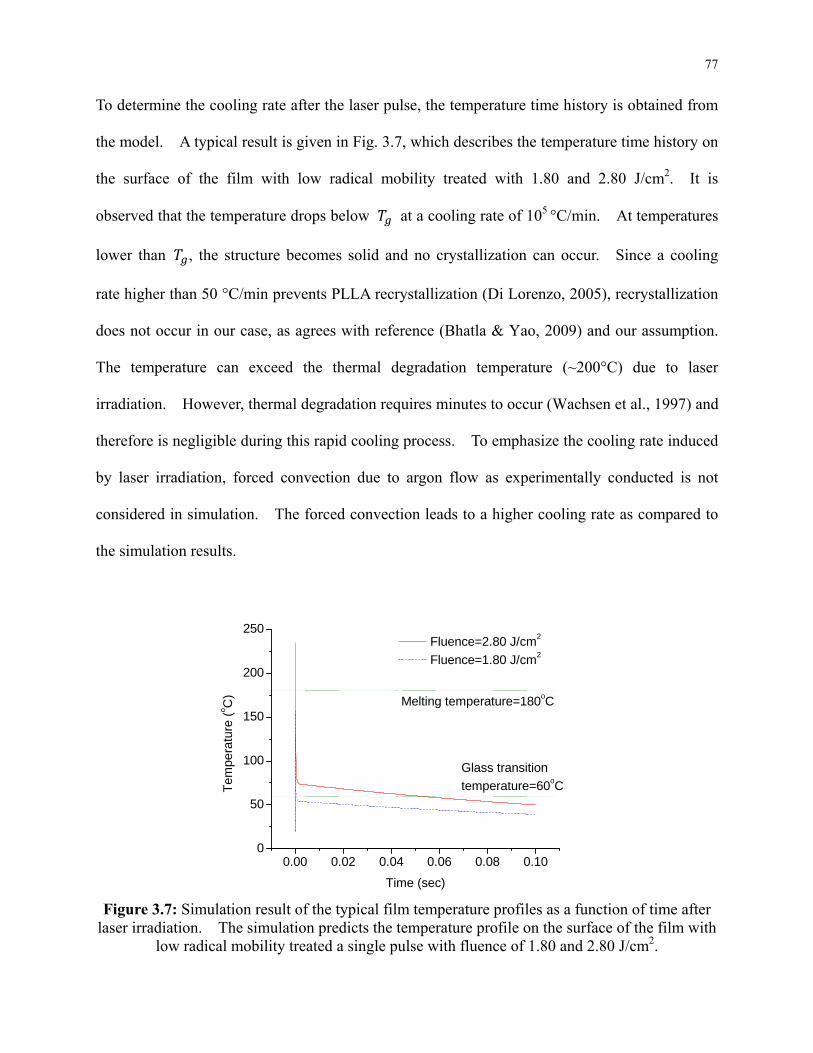
77
To determine the cooling rate after the laser pulse, the temperature time history is obtained from
the model. A typical result is given in Fig. 3.7, which describes the temperature time history on
the surface of the film with low radical mobility treated with 1.80 and 2.80 J/cm2. It is
observed that the temperature drops below at a cooling rate of 105 °C/min. At temperatures
lower than , the structure becomes solid and no crystallization can occur. Since a cooling
rate higher than 50 °C/min prevents PLLA recrystallization (Di Lorenzo, 2005), recrystallization
does not occur in our case, as agrees with reference (Bhatla & Yao, 2009) and our assumption.
The temperature can exceed the thermal degradation temperature (~200°C) due to laser
irradiation. However, thermal degradation requires minutes to occur (Wachsen et al., 1997) and
therefore is negligible during this rapid cooling process. To emphasize the cooling rate induced
by laser irradiation, forced convection due to argon flow as experimentally conducted is not
considered in simulation. The forced convection leads to a higher cooling rate as compared to
the simulation results.
0.00 0.02 0.04 0.06 0.08 0.100
50
100
150
200
250
Glass transition
temperature=60oCTem
pera
ture
(o C
)
Time (sec)
Fluence=2.80 J/cm2
Fluence=1.80 J/cm2
Melting temperature=180oC
Figure 3.7: Simulation result of the typical film temperature profiles as a function of time after
laser irradiation. The simulation predicts the temperature profile on the surface of the film with low radical mobility treated a single pulse with fluence of 1.80 and 2.80 J/cm2.
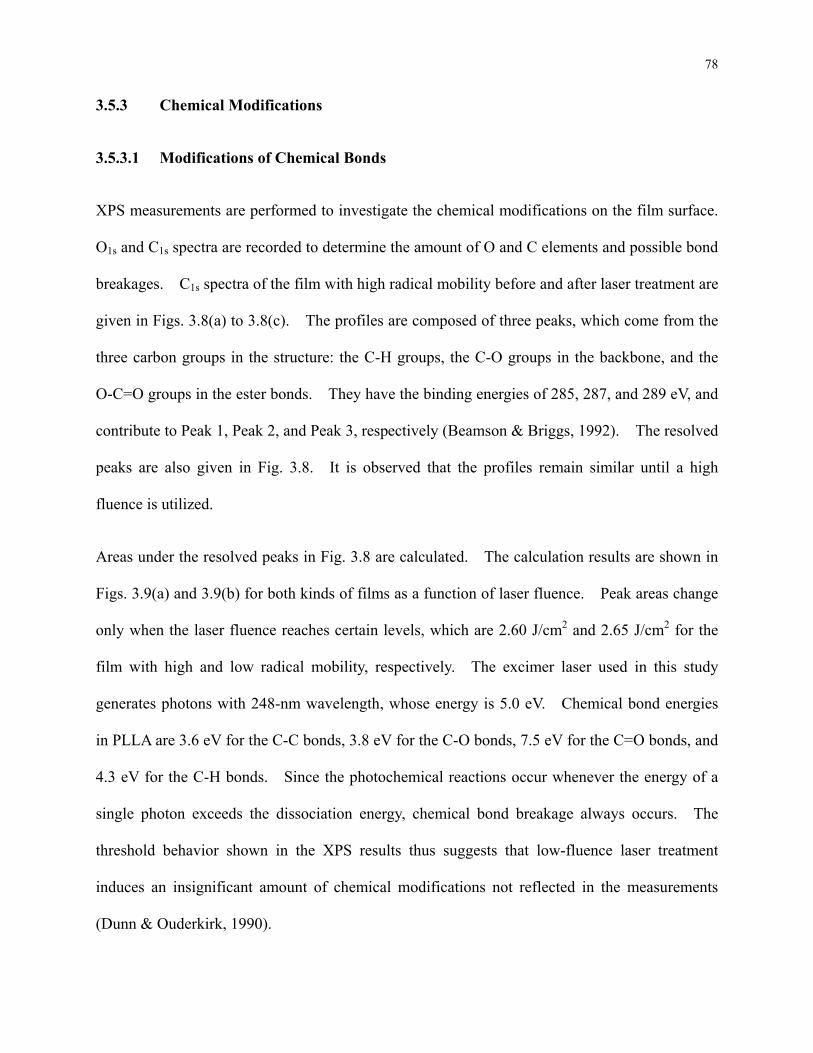
78
3.5.3 Chemical Modifications
3.5.3.1 Modifications of Chemical Bonds
XPS measurements are performed to investigate the chemical modifications on the film surface.
O1s and C1s spectra are recorded to determine the amount of O and C elements and possible bond
breakages. C1s spectra of the film with high radical mobility before and after laser treatment are
given in Figs. 3.8(a) to 3.8(c). The profiles are composed of three peaks, which come from the
three carbon groups in the structure: the C-H groups, the C-O groups in the backbone, and the
O-C=O groups in the ester bonds. They have the binding energies of 285, 287, and 289 eV, and
contribute to Peak 1, Peak 2, and Peak 3, respectively (Beamson & Briggs, 1992). The resolved
peaks are also given in Fig. 3.8. It is observed that the profiles remain similar until a high
fluence is utilized.
Areas under the resolved peaks in Fig. 3.8 are calculated. The calculation results are shown in
Figs. 3.9(a) and 3.9(b) for both kinds of films as a function of laser fluence. Peak areas change
only when the laser fluence reaches certain levels, which are 2.60 J/cm2 and 2.65 J/cm2 for the
film with high and low radical mobility, respectively. The excimer laser used in this study
generates photons with 248-nm wavelength, whose energy is 5.0 eV. Chemical bond energies
in PLLA are 3.6 eV for the C-C bonds, 3.8 eV for the C-O bonds, 7.5 eV for the C=O bonds, and
4.3 eV for the C-H bonds. Since the photochemical reactions occur whenever the energy of a
single photon exceeds the dissociation energy, chemical bond breakage always occurs. The
threshold behavior shown in the XPS results thus suggests that low-fluence laser treatment
induces an insignificant amount of chemical modifications not reflected in the measurements
(Dunn & Ouderkirk, 1990).
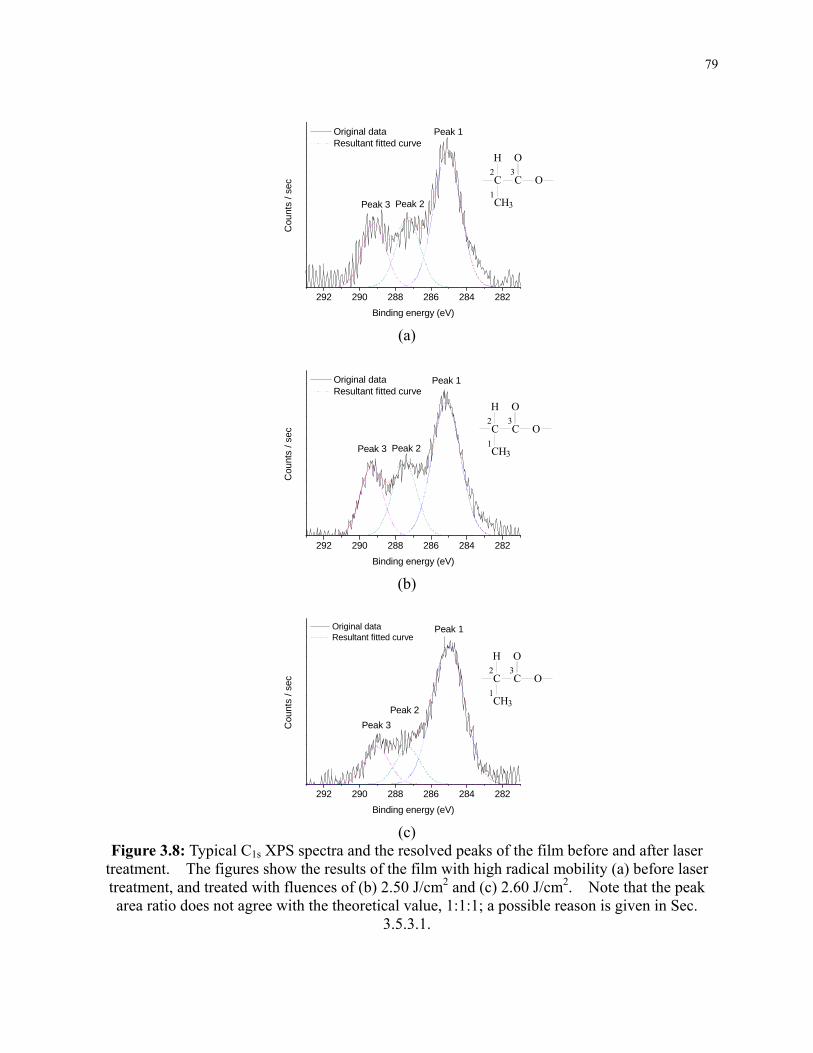
79
292 290 288 286 284 282
Peak 3 Peak 2
Cou
nts
/ se
c
Binding energy (eV)
Original data Resultant fitted curve
Peak 1
(a)
292 290 288 286 284 282
Cou
nts
/ se
c
Binding energy (eV)
Original data Resultant fitted curve
Peak 2Peak 3
Peak 1
(b)
292 290 288 286 284 282
Cou
nts
/ se
c
Binding energy (eV)
Original data Resultant fitted curve
Peak 2
Peak 3
Peak 1
(c)
Figure 3.8: Typical C1s XPS spectra and the resolved peaks of the film before and after laser treatment. The figures show the results of the film with high radical mobility (a) before laser treatment, and treated with fluences of (b) 2.50 J/cm2 and (c) 2.60 J/cm2. Note that the peak area ratio does not agree with the theoretical value, 1:1:1; a possible reason is given in Sec.
3.5.3.1.
C C O
H O
CH31
2 3
C C O
H O
CH31
2 3
C C O
H O
CH31
2 3
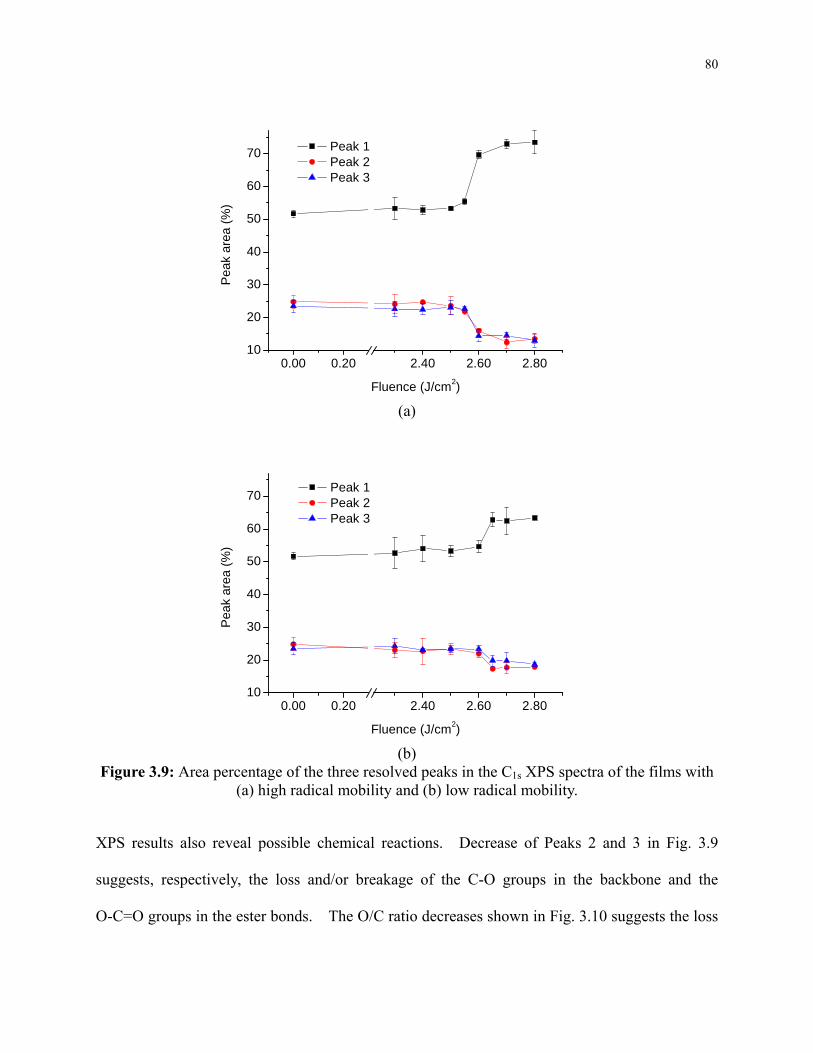
80
0.00 0.20 2.40 2.60 2.8010
20
30
40
50
60
70
Pea
k ar
ea (
%)
Fluence (J/cm2)
Peak 1 Peak 2 Peak 3
(a)
0.00 0.20 2.40 2.60 2.8010
20
30
40
50
60
70 Peak 1 Peak 2 Peak 3
Pea
k ar
ea (
%)
Fluence (J/cm2)
(b) Figure 3.9: Area percentage of the three resolved peaks in the C1s XPS spectra of the films with
(a) high radical mobility and (b) low radical mobility.
XPS results also reveal possible chemical reactions. Decrease of Peaks 2 and 3 in Fig. 3.9
suggests, respectively, the loss and/or breakage of the C-O groups in the backbone and the
O-C=O groups in the ester bonds. The O/C ratio decreases shown in Fig. 3.10 suggests the loss
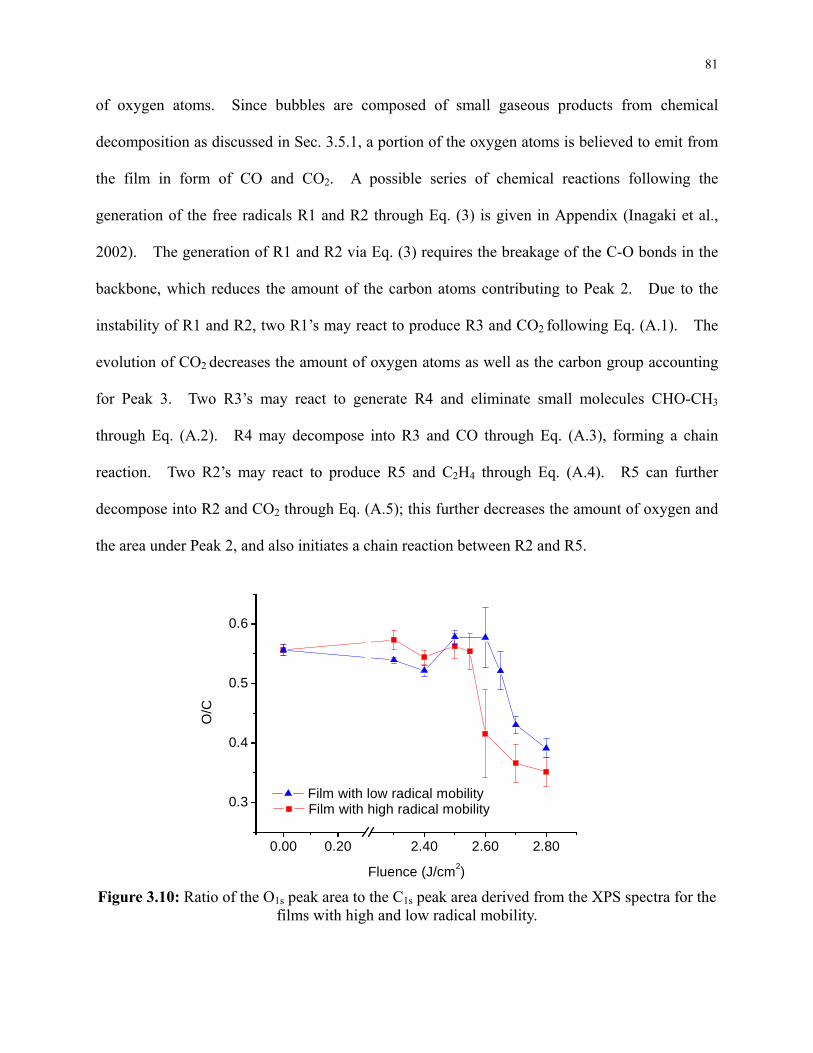
81
of oxygen atoms. Since bubbles are composed of small gaseous products from chemical
decomposition as discussed in Sec. 3.5.1, a portion of the oxygen atoms is believed to emit from
the film in form of CO and CO2. A possible series of chemical reactions following the
generation of the free radicals R1 and R2 through Eq. (3) is given in Appendix (Inagaki et al.,
2002). The generation of R1 and R2 via Eq. (3) requires the breakage of the C-O bonds in the
backbone, which reduces the amount of the carbon atoms contributing to Peak 2. Due to the
instability of R1 and R2, two R1’s may react to produce R3 and CO2 following Eq. (A.1). The
evolution of CO2 decreases the amount of oxygen atoms as well as the carbon group accounting
for Peak 3. Two R3’s may react to generate R4 and eliminate small molecules CHO-CH3
through Eq. (A.2). R4 may decompose into R3 and CO through Eq. (A.3), forming a chain
reaction. Two R2’s may react to produce R5 and C2H4 through Eq. (A.4). R5 can further
decompose into R2 and CO2 through Eq. (A.5); this further decreases the amount of oxygen and
the area under Peak 2, and also initiates a chain reaction between R2 and R5.
O/C
Film with high radical mobility
0.00 0.20 2.40 2.60 2.80
0.3
0.4
0.5
0.6
Film with low radical mobility
Fluence (J/cm2)
Figure 3.10: Ratio of the O1s peak area to the C1s peak area derived from the XPS spectra for the films with high and low radical mobility.
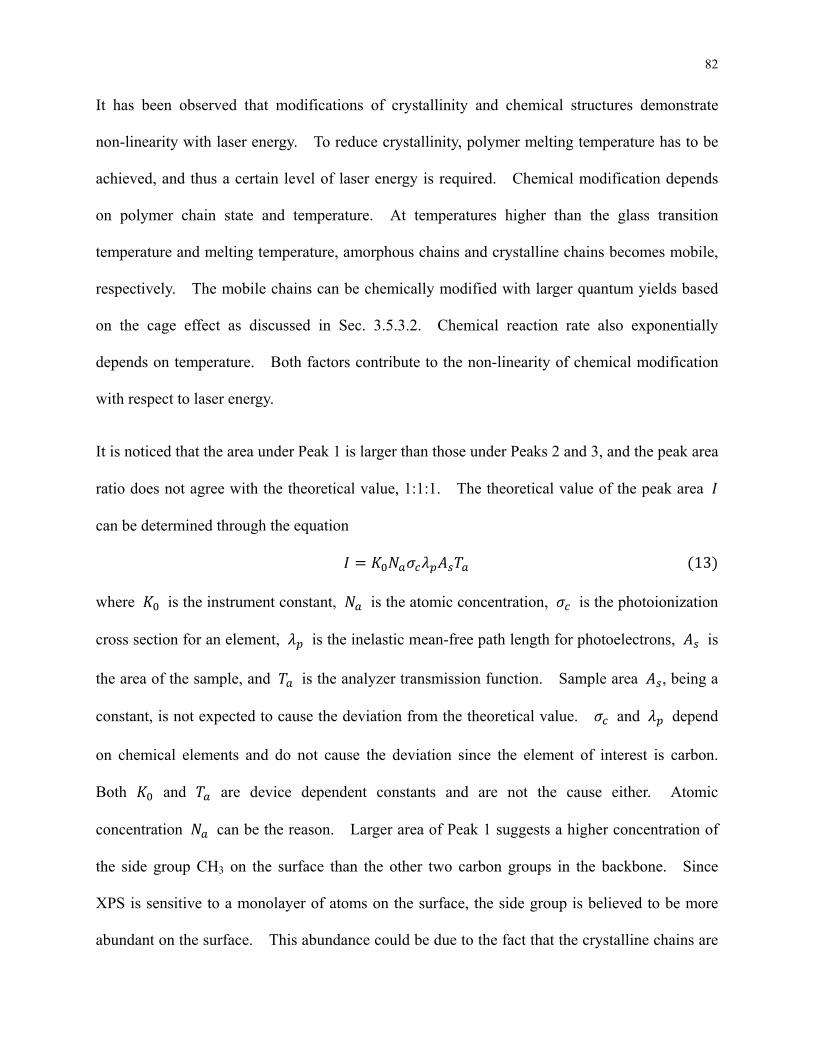
82
It has been observed that modifications of crystallinity and chemical structures demonstrate
non-linearity with laser energy. To reduce crystallinity, polymer melting temperature has to be
achieved, and thus a certain level of laser energy is required. Chemical modification depends
on polymer chain state and temperature. At temperatures higher than the glass transition
temperature and melting temperature, amorphous chains and crystalline chains becomes mobile,
respectively. The mobile chains can be chemically modified with larger quantum yields based
on the cage effect as discussed in Sec. 3.5.3.2. Chemical reaction rate also exponentially
depends on temperature. Both factors contribute to the non-linearity of chemical modification
with respect to laser energy.
It is noticed that the area under Peak 1 is larger than those under Peaks 2 and 3, and the peak area
ratio does not agree with the theoretical value, 1:1:1. The theoretical value of the peak area
can be determined through the equation
13
where is the instrument constant, is the atomic concentration, is the photoionization
cross section for an element, is the inelastic mean-free path length for photoelectrons, is
the area of the sample, and is the analyzer transmission function. Sample area , being a
constant, is not expected to cause the deviation from the theoretical value. and depend
on chemical elements and do not cause the deviation since the element of interest is carbon.
Both and are device dependent constants and are not the cause either. Atomic
concentration can be the reason. Larger area of Peak 1 suggests a higher concentration of
the side group CH3 on the surface than the other two carbon groups in the backbone. Since
XPS is sensitive to a monolayer of atoms on the surface, the side group is believed to be more
abundant on the surface. This abundance could be due to the fact that the crystalline chains are
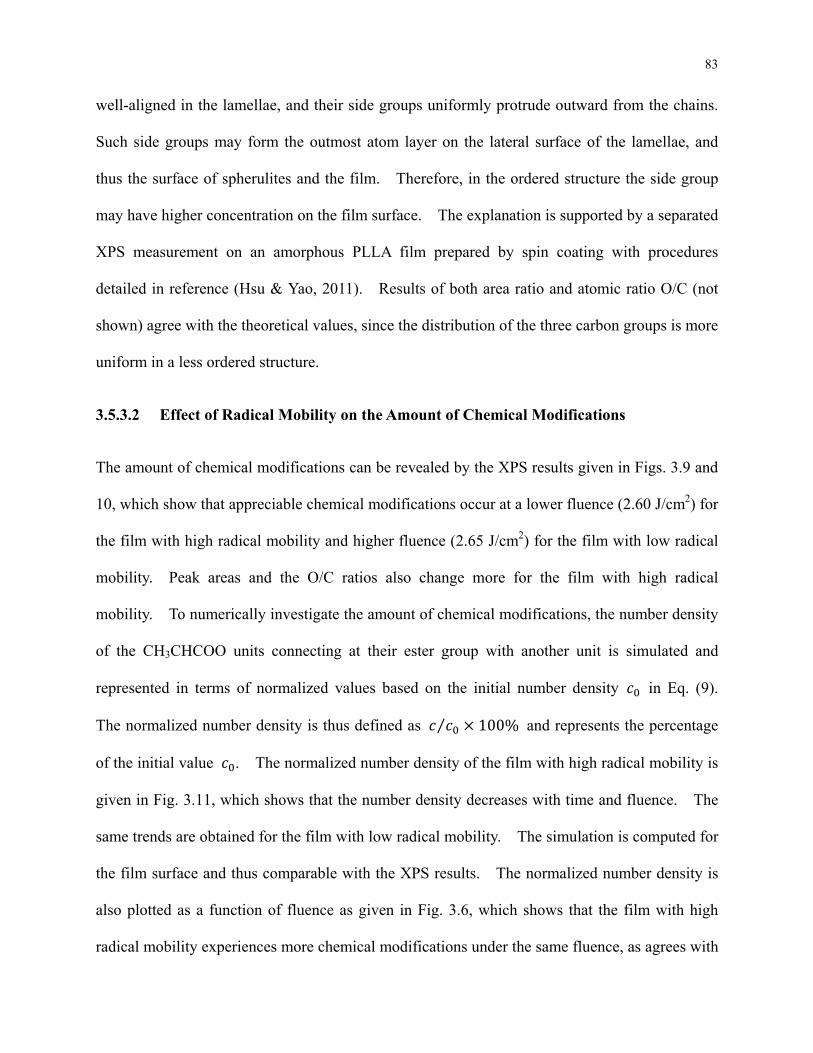
83
well-aligned in the lamellae, and their side groups uniformly protrude outward from the chains.
Such side groups may form the outmost atom layer on the lateral surface of the lamellae, and
thus the surface of spherulites and the film. Therefore, in the ordered structure the side group
may have higher concentration on the film surface. The explanation is supported by a separated
XPS measurement on an amorphous PLLA film prepared by spin coating with procedures
detailed in reference (Hsu & Yao, 2011). Results of both area ratio and atomic ratio O/C (not
shown) agree with the theoretical values, since the distribution of the three carbon groups is more
uniform in a less ordered structure.
3.5.3.2 Effect of Radical Mobility on the Amount of Chemical Modifications
The amount of chemical modifications can be revealed by the XPS results given in Figs. 3.9 and
10, which show that appreciable chemical modifications occur at a lower fluence (2.60 J/cm2) for
the film with high radical mobility and higher fluence (2.65 J/cm2) for the film with low radical
mobility. Peak areas and the O/C ratios also change more for the film with high radical
mobility. To numerically investigate the amount of chemical modifications, the number density
of the CH3CHCOO units connecting at their ester group with another unit is simulated and
represented in terms of normalized values based on the initial number density in Eq. (9).
The normalized number density is thus defined as ⁄ 100% and represents the percentage
of the initial value . The normalized number density of the film with high radical mobility is
given in Fig. 3.11, which shows that the number density decreases with time and fluence. The
same trends are obtained for the film with low radical mobility. The simulation is computed for
the film surface and thus comparable with the XPS results. The normalized number density is
also plotted as a function of fluence as given in Fig. 3.6, which shows that the film with high
radical mobility experiences more chemical modifications under the same fluence, as agrees with
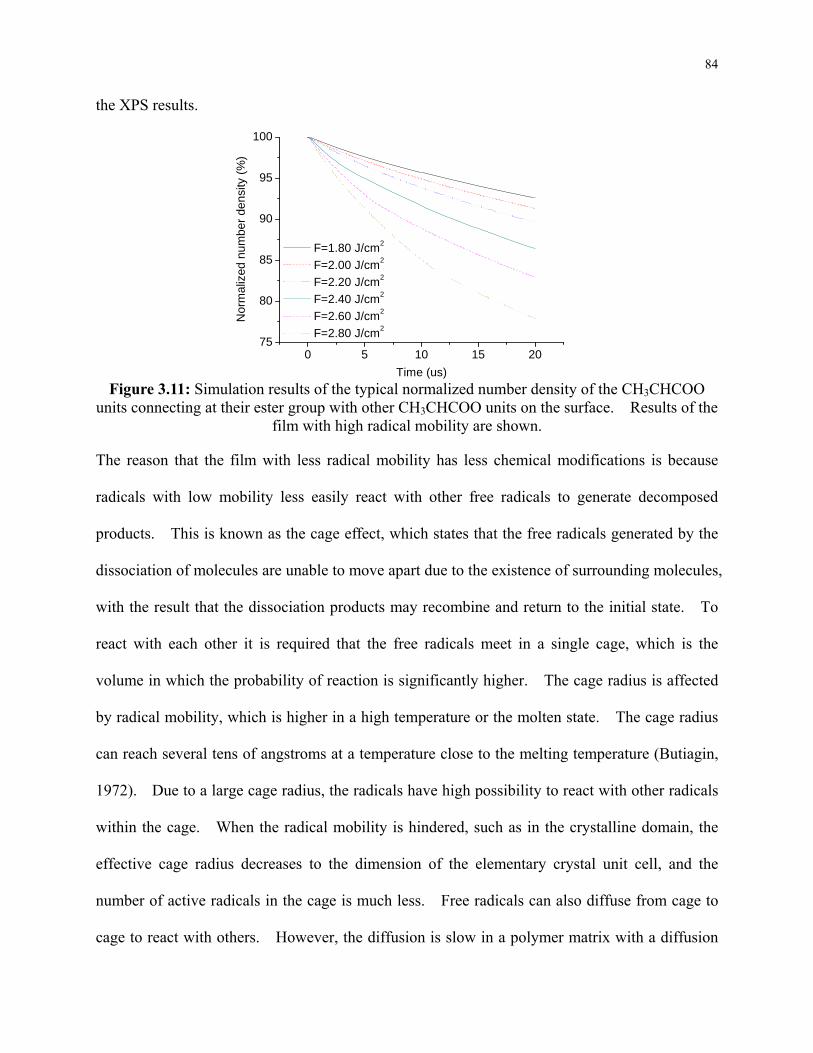
84
the XPS results.
0 5 10 15 2075
80
85
90
95
100
Nor
mal
ized
num
ber
den
sity
(%
)
Time (us)
F=1.80 J/cm2
F=2.00 J/cm2
F=2.20 J/cm2
F=2.40 J/cm2
F=2.60 J/cm2
F=2.80 J/cm2
Figure 3.11: Simulation results of the typical normalized number density of the CH3CHCOO
units connecting at their ester group with other CH3CHCOO units on the surface. Results of the film with high radical mobility are shown.
The reason that the film with less radical mobility has less chemical modifications is because
radicals with low mobility less easily react with other free radicals to generate decomposed
products. This is known as the cage effect, which states that the free radicals generated by the
dissociation of molecules are unable to move apart due to the existence of surrounding molecules,
with the result that the dissociation products may recombine and return to the initial state. To
react with each other it is required that the free radicals meet in a single cage, which is the
volume in which the probability of reaction is significantly higher. The cage radius is affected
by radical mobility, which is higher in a high temperature or the molten state. The cage radius
can reach several tens of angstroms at a temperature close to the melting temperature (Butiagin,
1972). Due to a large cage radius, the radicals have high possibility to react with other radicals
within the cage. When the radical mobility is hindered, such as in the crystalline domain, the
effective cage radius decreases to the dimension of the elementary crystal unit cell, and the
number of active radicals in the cage is much less. Free radicals can also diffuse from cage to
cage to react with others. However, the diffusion is slow in a polymer matrix with a diffusion
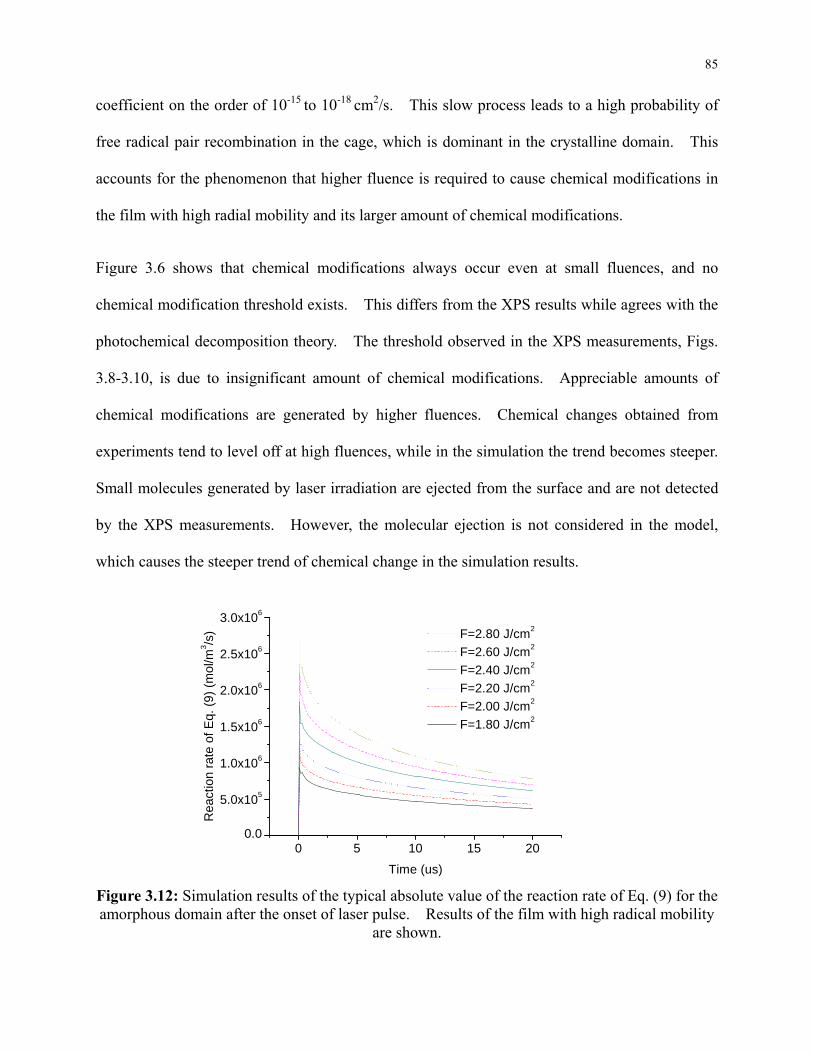
85
coefficient on the order of 10-15 to 10-18 cm2/s. This slow process leads to a high probability of
free radical pair recombination in the cage, which is dominant in the crystalline domain. This
accounts for the phenomenon that higher fluence is required to cause chemical modifications in
the film with high radial mobility and its larger amount of chemical modifications.
Figure 3.6 shows that chemical modifications always occur even at small fluences, and no
chemical modification threshold exists. This differs from the XPS results while agrees with the
photochemical decomposition theory. The threshold observed in the XPS measurements, Figs.
3.8-3.10, is due to insignificant amount of chemical modifications. Appreciable amounts of
chemical modifications are generated by higher fluences. Chemical changes obtained from
experiments tend to level off at high fluences, while in the simulation the trend becomes steeper.
Small molecules generated by laser irradiation are ejected from the surface and are not detected
by the XPS measurements. However, the molecular ejection is not considered in the model,
which causes the steeper trend of chemical change in the simulation results.
0 5 10 15 200.0
5.0x10⁵
1.0x10⁶
1.5x10⁶
2.0x10⁶
2.5x10⁶
3.0x10⁶
Rea
ctio
n ra
te o
f E
q. (
9) (
mol
/m3 /s
)
Time (us)
F=2.80 J/cm2
F=2.60 J/cm2
F=2.40 J/cm2
F=2.20 J/cm2
F=2.00 J/cm2
F=1.80 J/cm2
Figure 3.12: Simulation results of the typical absolute value of the reaction rate of Eq. (9) for the amorphous domain after the onset of laser pulse. Results of the film with high radical mobility
are shown.
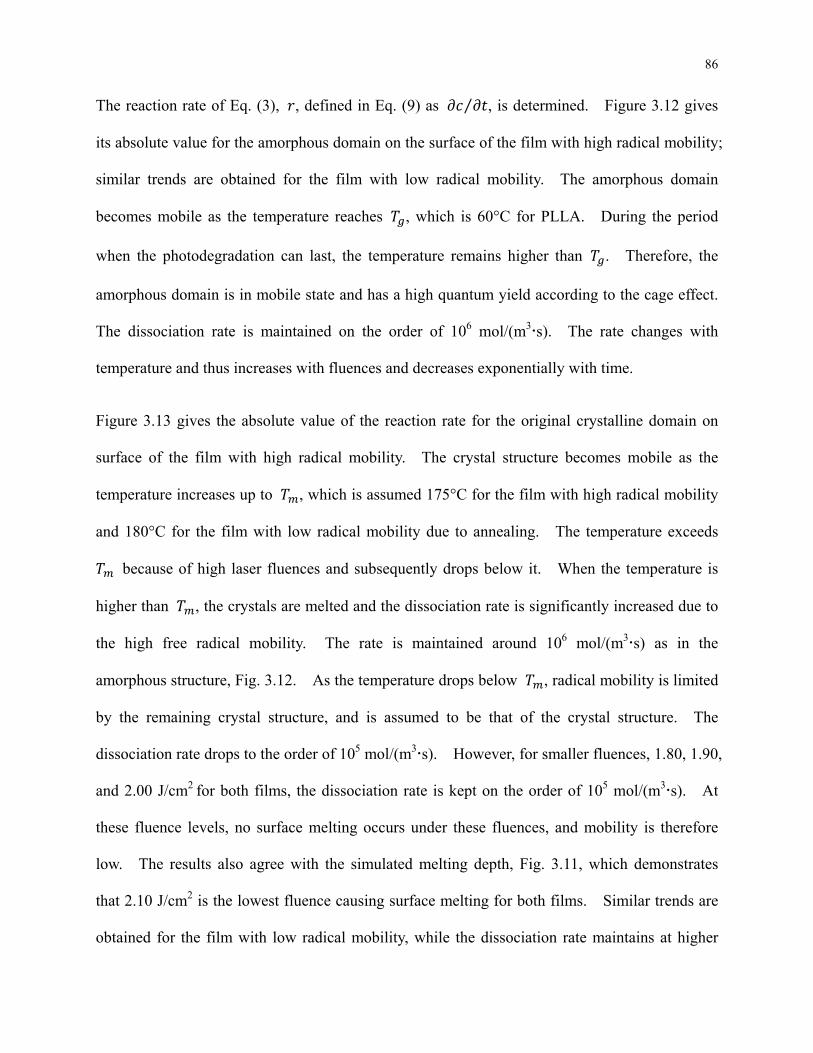
86
The reaction rate of Eq. (3), , defined in Eq. (9) as ⁄ , is determined. Figure 3.12 gives
its absolute value for the amorphous domain on the surface of the film with high radical mobility;
similar trends are obtained for the film with low radical mobility. The amorphous domain
becomes mobile as the temperature reaches , which is 60°C for PLLA. During the period
when the photodegradation can last, the temperature remains higher than . Therefore, the
amorphous domain is in mobile state and has a high quantum yield according to the cage effect.
The dissociation rate is maintained on the order of 106 mol/(m3s). The rate changes with
temperature and thus increases with fluences and decreases exponentially with time.
Figure 3.13 gives the absolute value of the reaction rate for the original crystalline domain on
surface of the film with high radical mobility. The crystal structure becomes mobile as the
temperature increases up to , which is assumed 175°C for the film with high radical mobility
and 180°C for the film with low radical mobility due to annealing. The temperature exceeds
because of high laser fluences and subsequently drops below it. When the temperature is
higher than , the crystals are melted and the dissociation rate is significantly increased due to
the high free radical mobility. The rate is maintained around 106 mol/(m3s) as in the
amorphous structure, Fig. 3.12. As the temperature drops below , radical mobility is limited
by the remaining crystal structure, and is assumed to be that of the crystal structure. The
dissociation rate drops to the order of 105 mol/(m3s). However, for smaller fluences, 1.80, 1.90,
and 2.00 J/cm2 for both films, the dissociation rate is kept on the order of 105 mol/(m3s). At
these fluence levels, no surface melting occurs under these fluences, and mobility is therefore
low. The results also agree with the simulated melting depth, Fig. 3.11, which demonstrates
that 2.10 J/cm2 is the lowest fluence causing surface melting for both films. Similar trends are
obtained for the film with low radical mobility, while the dissociation rate maintains at higher
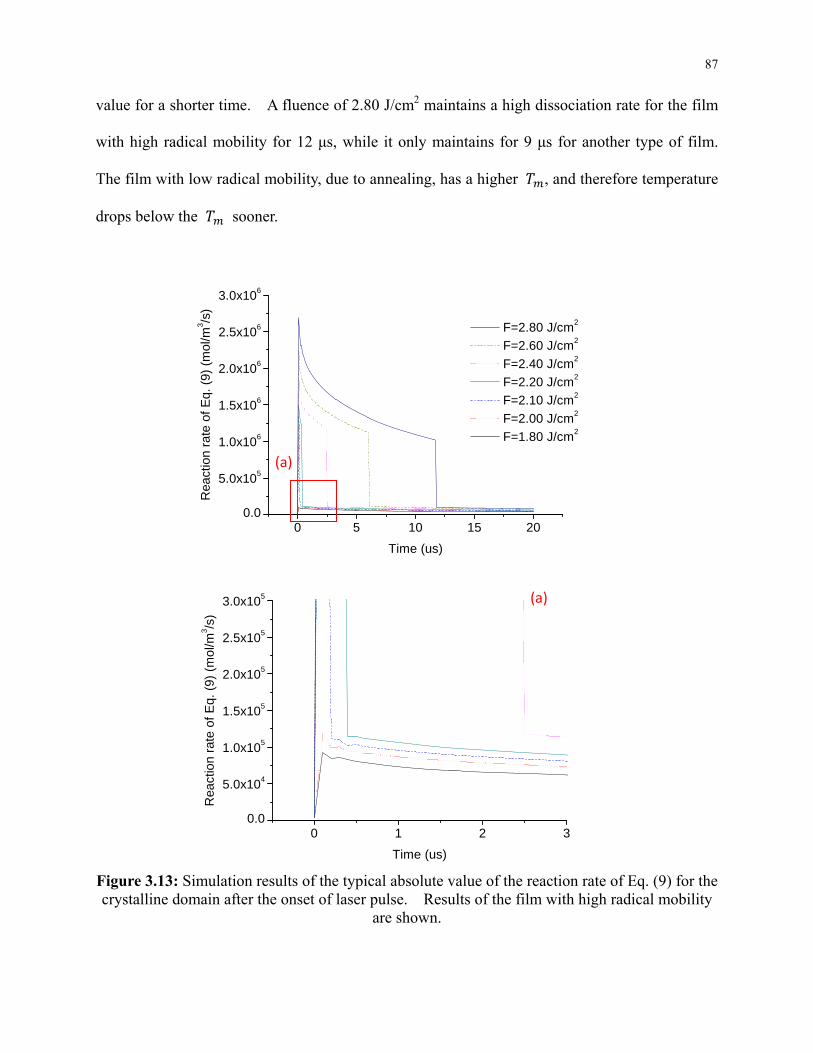
87
value for a shorter time. A fluence of 2.80 J/cm2 maintains a high dissociation rate for the film
with high radical mobility for 12 μs, while it only maintains for 9 μs for another type of film.
The film with low radical mobility, due to annealing, has a higher , and therefore temperature
drops below the sooner.
0 5 10 15 200.0
5.0x10⁵
1.0x10⁶
1.5x10⁶
2.0x10⁶
2.5x10⁶
3.0x10⁶
Rea
ctio
n ra
te o
f E
q. (
9) (
mol
/m3 /s
)
Time (us)
F=2.80 J/cm2
F=2.60 J/cm2
F=2.40 J/cm2
F=2.20 J/cm2
F=2.10 J/cm2
F=2.00 J/cm2
F=1.80 J/cm2
0 1 2 30.0
5.0x10⁴
1.0x10⁵
1.5x10⁵
2.0x10⁵
2.5x10⁵
3.0x10⁵
Rea
ctio
n ra
te o
f E
q. (
9) (
mol
/m3 /s
)
Time (us)
Figure 3.13: Simulation results of the typical absolute value of the reaction rate of Eq. (9) for the crystalline domain after the onset of laser pulse. Results of the film with high radical mobility
are shown.
(a)
(a)
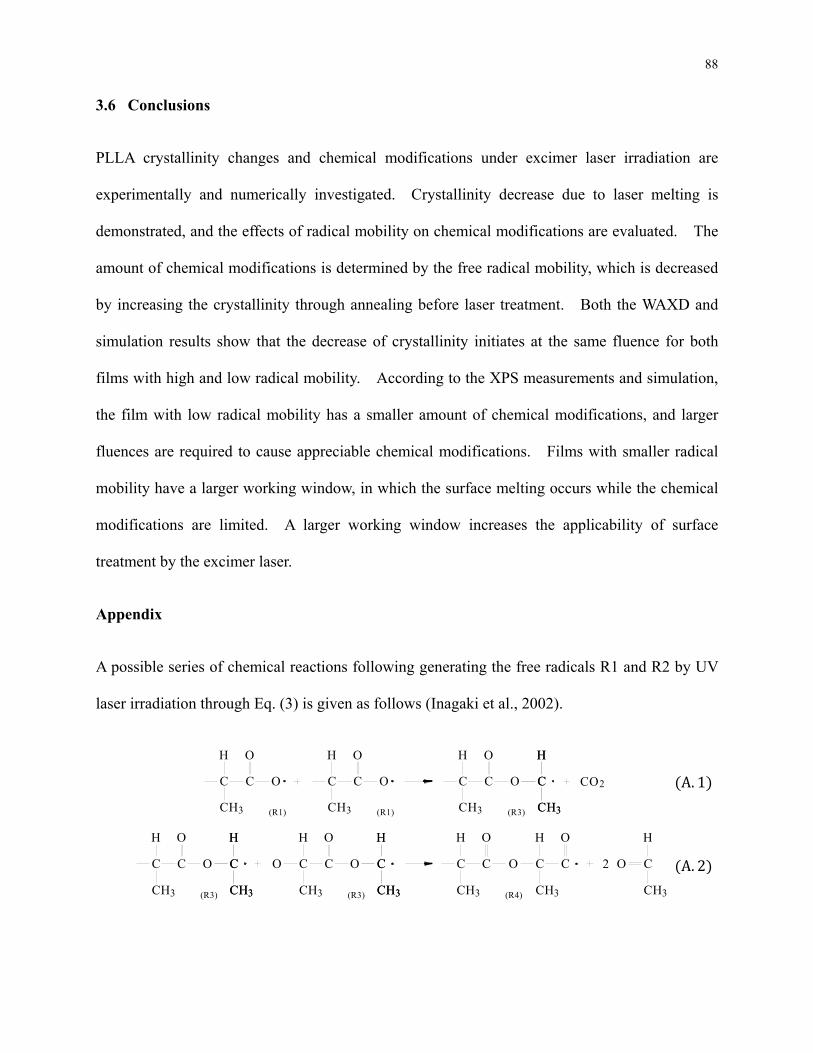
88
3.6 Conclusions
PLLA crystallinity changes and chemical modifications under excimer laser irradiation are
experimentally and numerically investigated. Crystallinity decrease due to laser melting is
demonstrated, and the effects of radical mobility on chemical modifications are evaluated. The
amount of chemical modifications is determined by the free radical mobility, which is decreased
by increasing the crystallinity through annealing before laser treatment. Both the WAXD and
simulation results show that the decrease of crystallinity initiates at the same fluence for both
films with high and low radical mobility. According to the XPS measurements and simulation,
the film with low radical mobility has a smaller amount of chemical modifications, and larger
fluences are required to cause appreciable chemical modifications. Films with smaller radical
mobility have a larger working window, in which the surface melting occurs while the chemical
modifications are limited. A larger working window increases the applicability of surface
treatment by the excimer laser.
Appendix
A possible series of chemical reactions following generating the free radicals R1 and R2 by UV
laser irradiation through Eq. (3) is given as follows (Inagaki et al., 2002).
C C O
H O
CH3
C C O
H O
CH3
C C O
H O
CH3
C
H
CH3
C
H
CH3
CO2
(R1) (R1) (R3)
C C O
H O
CH3
C
H
CH3
C
H
CH3
C C O
H O
CH3
C
H
CH3
C
H
CH3
O
(R3) (R3)
C C
H O
CH3
C C
H O
CH3
O C
H
CH
O
3
2
(R4)
A. 1
A. 2
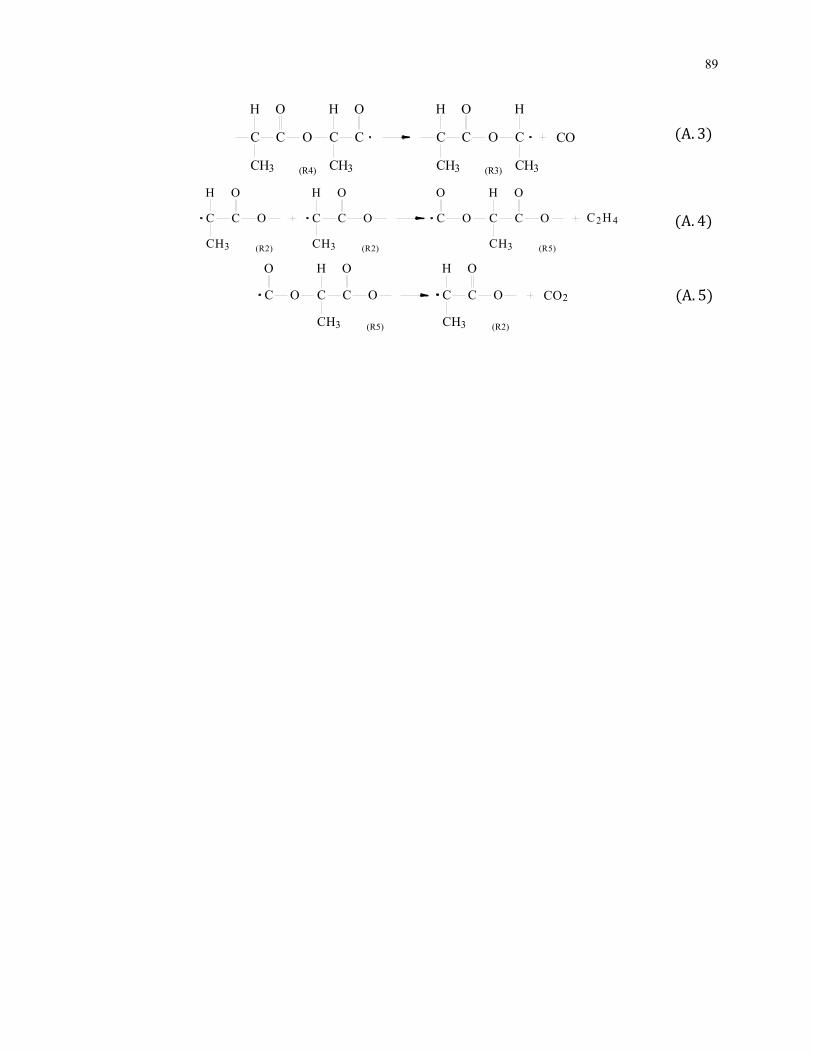
89
C C
H O
CH3
C C
H O
CH3
O
(R4)
C C
H O
CH3
C
H
CH3
O
(R3)
CO
C C O
H O
CH3 (R2)
C C O
H O
CH3 (R2)
C C O
H O
CH3 (R5)
C O
O
C H2 4
C C O
H O
CH3 (R5)
C O
O
C C O
H O
CH3 (R2)
CO2
A. 3
A. 4
A. 5
90
Chapter 4: Effect of Laser Induced Crystallinity Modification on Biodegradation Profile of
Poly(L-Lactic Acid)
4.1 Introduction
Poly(L-lactic acid) (PLLA) is attractive in drug delivery, food packaging, and tissue engineering
applications because of its biocompatible and biodegradable properties. PLLA is especially of
interest in drug delivery applications because it hydrolyzes in the human body into lactic acid, a
product which is excreted by the body with no toxicity. In drug delivery applications, drugs are
embedded in a polymer matrix and released as it degrades. Biodegradable polymers offer a
means to control the drug delivery in time (Amass et al., 2008). PLLA degradation exhibits an
induction period, a duration of time required for water molecules to penetrate into the matrix
before degradation can occur. During this time, embedded drugs are not released at a linear
rate.
PLLA degradation in a physiological environment occurs via hydrolysis, in which water
penetrates into the polymer matrix, attacking the ester bonds and causing chain scission. Water
molecules readily penetrate into the amorphous region, but hardly into the crystalline region,
because the polymer chains are highly packed and densely ordered in crystals (Chu, 1981).
Degradation of ester bonds occurs faster in the amorphous phase because of its more permeable
structure. Hydrolysis in the crystalline phase begins at the fold surfaces and progresses inwards
as controlled by chain scission (Tsuji & Ikada, 1998). Hydrolysis in the crystalline phase
occurs less preferentially than in the amorphous phase. A sample composed of both crystalline
and amorphous phases will more rapidly undergo hydrolysis in the amorphous phase than the
crystalline phase.
91
PLLA hydrolysis is accelerated by autocatalysis (Siparsky et al., 1998). The rate of hydrolysis
increases as the concentration of reaction products increases. Hydrolysis of polyester produces
shorter chains with acid and alcohol end groups. Acid end groups dissociate, leading to an
acidic environment, which accelerates hydrolysis. Therefore, the diffusion of shorter chains out
of the polymer plays a key role in controlling the overall degradation rate. Another factor that
complicates biodegradation is the increase of crystallinity during degradation (Zong et al., 1999;
Renouf-Glausera et al., 2005). Preferential degradation in the amorphous region leaves the
crystalline phase behind, leading to a mostly crystalline material. Chain scission as a result of
degradation also increases chain mobility which facilitates crystallization in the amorphous
phase.
Because changing the surface crystallinity of PLLA has the potential to tailor the initial
degradation rate, laser heat treatment to reduce surface crystallinity is of interest. PLLA
crystallinity reduction by laser irradiation with infra-red (IR) and green wavelengths has been
quantified through wide-angle X-ray diffraction (WAXD) measurements (Bhatla & Yao, 2009).
The same effects have been observed by excimer laser processes operating at ultra violet (UV)
wavelengths with photon energies higher than bond energies (Dunn & Ouderkirk, 1990; Hsu et
al., 2012). It has been shown that surface crystallinity can be reduced with no measurable
chemical modifications due to the low radical mobility in the crystal structure (Hsu et al., 2012).
The effects of laser treatment on polymer degradation over time have yet to be studied.
The objective of this work is to investigate the effects of laser surface treatment on PLLA
degradation, characterized by the change in mass, molecular weight (MW), and crystallinity.
Since PLLA degradation behaves similarly at elevated temperatures (Weir et al., 2004),
degradation is conducted at elevated temperatures to shorten the total test time. MW and
92
crystallinity are determined through gel permeation chromatography (GPC) and WAXD,
respectively. A numerical model is developed to capture the degradation process.
4.2 Background
4.2.1 Laser Melting of Polymer
Polymer melting is an amorphization process in which crystalline polymer chains detach from
crystals. Crystalline polymer chains are held by weak van der Waals forces and hydrogen
bonds, which are broken during melting to form an amorphous structure. Melting initiates at
the crystal fold surface, followed by the progressive unfolding of chains towards the center of the
crystal. Polymer melting occurs within nanoseconds (Yamamoto, 2010), and thus nanosecond
laser treatment is used to induce polymer melting. Crystallinity is reduced after laser melting as
a result of slow crystallization kinetics compared to the rapid melting and cooling during laser
processing (Bhatla & Yao, 2009; Dunn & Ouderkirk, 1990; Hsu et al., 2012).
Polymer absorption of photons with energies exceeding the bond energy risk braking chemical
bonds. In PLA, this reaction occurs between two CH3CHCOO units. If no oxidation occurs
during processing, the separated CH3CHCOO units may recombine. According to the cage
effect, high PLLA crystallinity has been shown to reduce the amount of bond breaking and lead
to non-measurable chemical modifications under UV laser treatment (Hsu et al., 2012).
4.2.2 Biodegradation of Polyester
PLA is a biodegradable polyester which breaks down in the human body through hydrolysis.
Water molecules attack the ester bonds via the following reaction
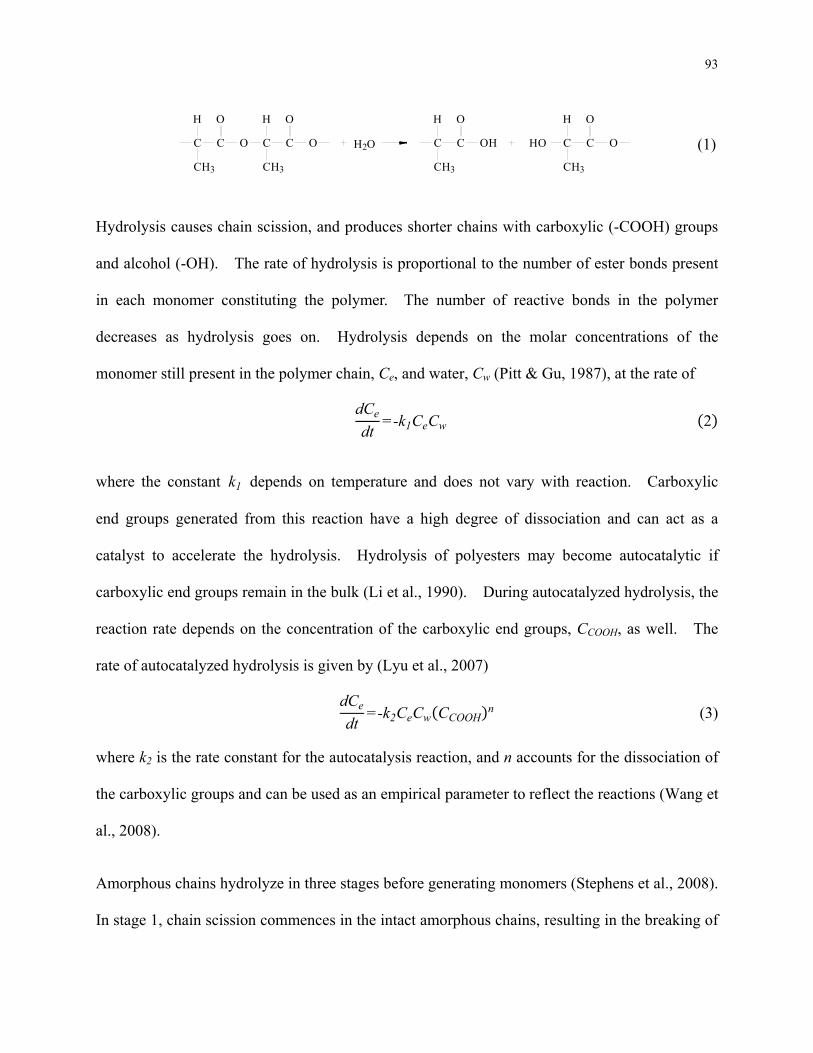
93
C C O C C O
H HO O
CH3 CH3
2OH C C
H O
CH3
OH HO C C O
H O
CH3
Hydrolysis causes chain scission, and produces shorter chains with carboxylic (-COOH) groups
and alcohol (-OH). The rate of hydrolysis is proportional to the number of ester bonds present
in each monomer constituting the polymer. The number of reactive bonds in the polymer
decreases as hydrolysis goes on. Hydrolysis depends on the molar concentrations of the
monomer still present in the polymer chain, Ce, and water, Cw (Pitt & Gu, 1987), at the rate of
dCe
dt=-k1CeCw 2
where the constant k1 depends on temperature and does not vary with reaction. Carboxylic
end groups generated from this reaction have a high degree of dissociation and can act as a
catalyst to accelerate the hydrolysis. Hydrolysis of polyesters may become autocatalytic if
carboxylic end groups remain in the bulk (Li et al., 1990). During autocatalyzed hydrolysis, the
reaction rate depends on the concentration of the carboxylic end groups, CCOOH, as well. The
rate of autocatalyzed hydrolysis is given by (Lyu et al., 2007)
dCe
dt=-k2CeCw CCOOH
n (3)
where k2 is the rate constant for the autocatalysis reaction, and n accounts for the dissociation of
the carboxylic groups and can be used as an empirical parameter to reflect the reactions (Wang et
al., 2008).
Amorphous chains hydrolyze in three stages before generating monomers (Stephens et al., 2008).
In stage 1, chain scission commences in the intact amorphous chains, resulting in the breaking of
(1)
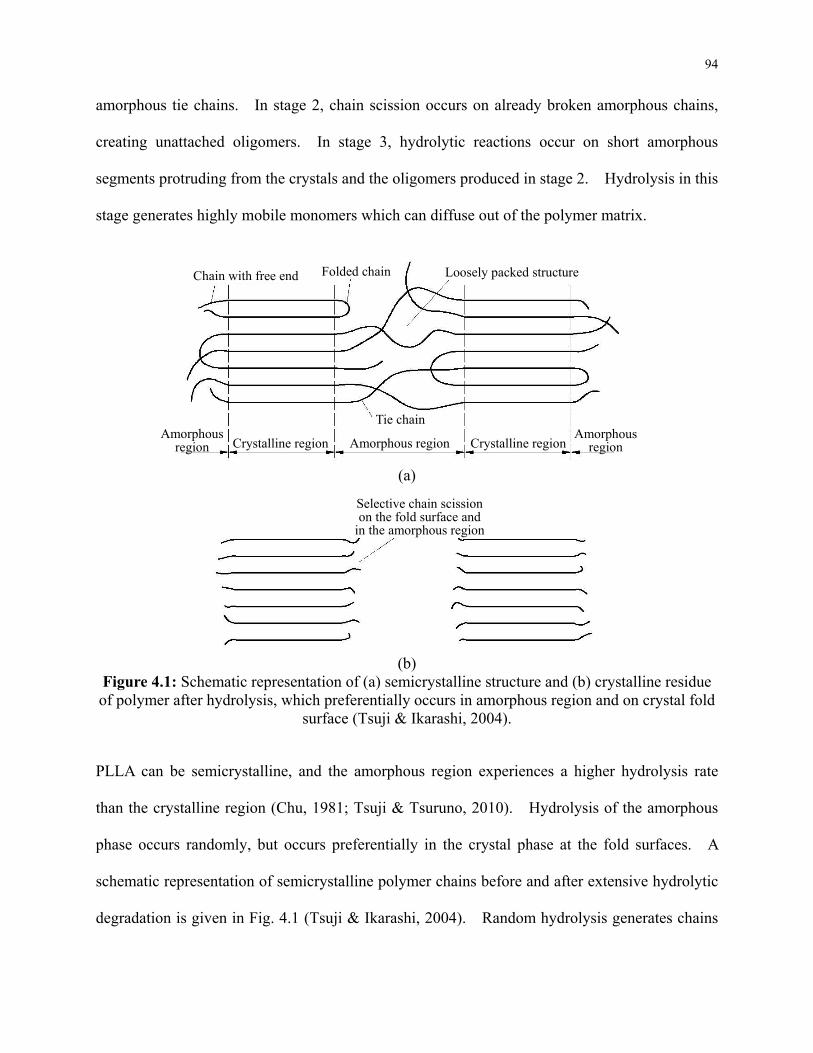
94
amorphous tie chains. In stage 2, chain scission occurs on already broken amorphous chains,
creating unattached oligomers. In stage 3, hydrolytic reactions occur on short amorphous
segments protruding from the crystals and the oligomers produced in stage 2. Hydrolysis in this
stage generates highly mobile monomers which can diffuse out of the polymer matrix.
(a)
(b)
Figure 4.1: Schematic representation of (a) semicrystalline structure and (b) crystalline residue of polymer after hydrolysis, which preferentially occurs in amorphous region and on crystal fold
surface (Tsuji & Ikarashi, 2004).
PLLA can be semicrystalline, and the amorphous region experiences a higher hydrolysis rate
than the crystalline region (Chu, 1981; Tsuji & Tsuruno, 2010). Hydrolysis of the amorphous
phase occurs randomly, but occurs preferentially in the crystal phase at the fold surfaces. A
schematic representation of semicrystalline polymer chains before and after extensive hydrolytic
degradation is given in Fig. 4.1 (Tsuji & Ikarashi, 2004). Random hydrolysis generates chains
Chain with free end Folded chain Loosely packed structure
Tie chainAmorphous
region Amorphous
region Crystalline region Crystalline region Amorphous region
Selective chain scission on the fold surface and
in the amorphous region
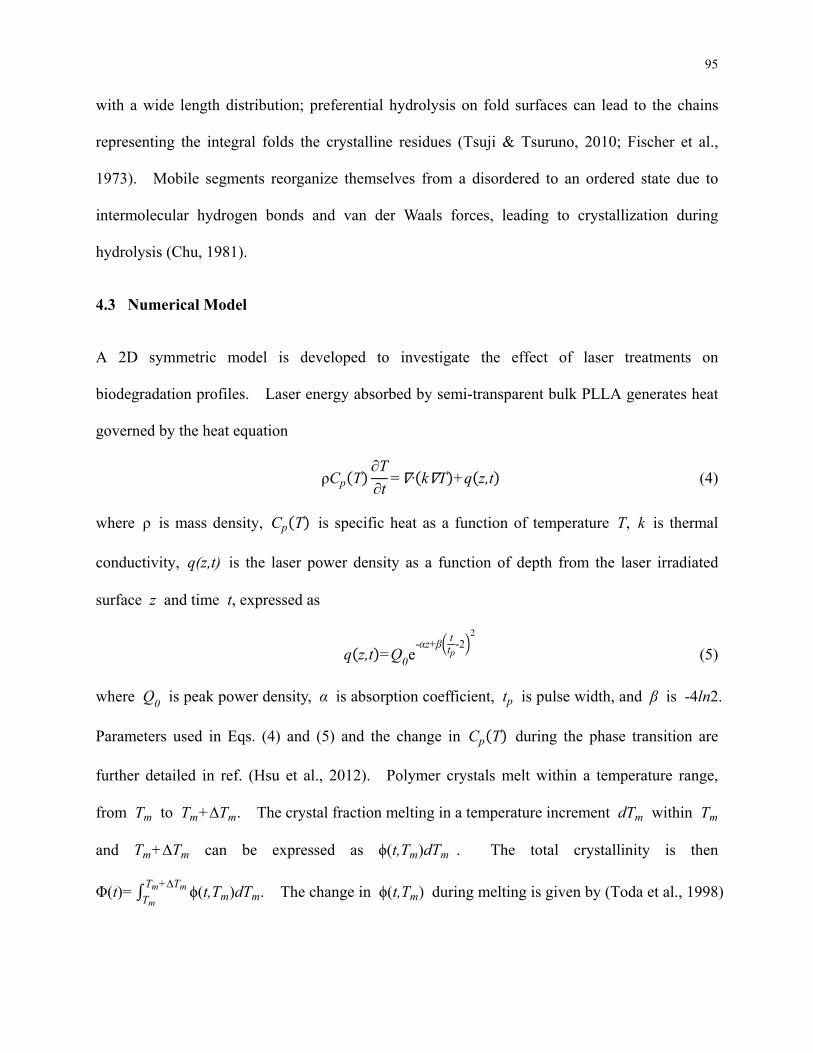
95
with a wide length distribution; preferential hydrolysis on fold surfaces can lead to the chains
representing the integral folds the crystalline residues (Tsuji & Tsuruno, 2010; Fischer et al.,
1973). Mobile segments reorganize themselves from a disordered to an ordered state due to
intermolecular hydrogen bonds and van der Waals forces, leading to crystallization during
hydrolysis (Chu, 1981).
4.3 Numerical Model
A 2D symmetric model is developed to investigate the effect of laser treatments on
biodegradation profiles. Laser energy absorbed by semi-transparent bulk PLLA generates heat
governed by the heat equation
ρCp T∂T
∂t= · k T +q z,t (4)
where ρ is mass density, Cp T is specific heat as a function of temperature T, k is thermal
conductivity, q(z,t) is the laser power density as a function of depth from the laser irradiated
surface z and time t, expressed as
q z,t =Q0e-αz+β
ttp
-22
(5)
where Q0 is peak power density, α is absorption coefficient, tp is pulse width, and β is -4ln2.
Parameters used in Eqs. (4) and (5) and the change in Cp T during the phase transition are
further detailed in ref. (Hsu et al., 2012). Polymer crystals melt within a temperature range,
from Tm to Tm+∆Tm. The crystal fraction melting in a temperature increment dTm within Tm
and Tm+∆Tm can be expressed as ϕ(t,Tm)dTm . The total crystallinity is then
Φ(t)= ϕ(t,Tm)dTmTm+∆Tm
Tm. The change in ϕ(t,Tm) during melting is given by (Toda et al., 1998)
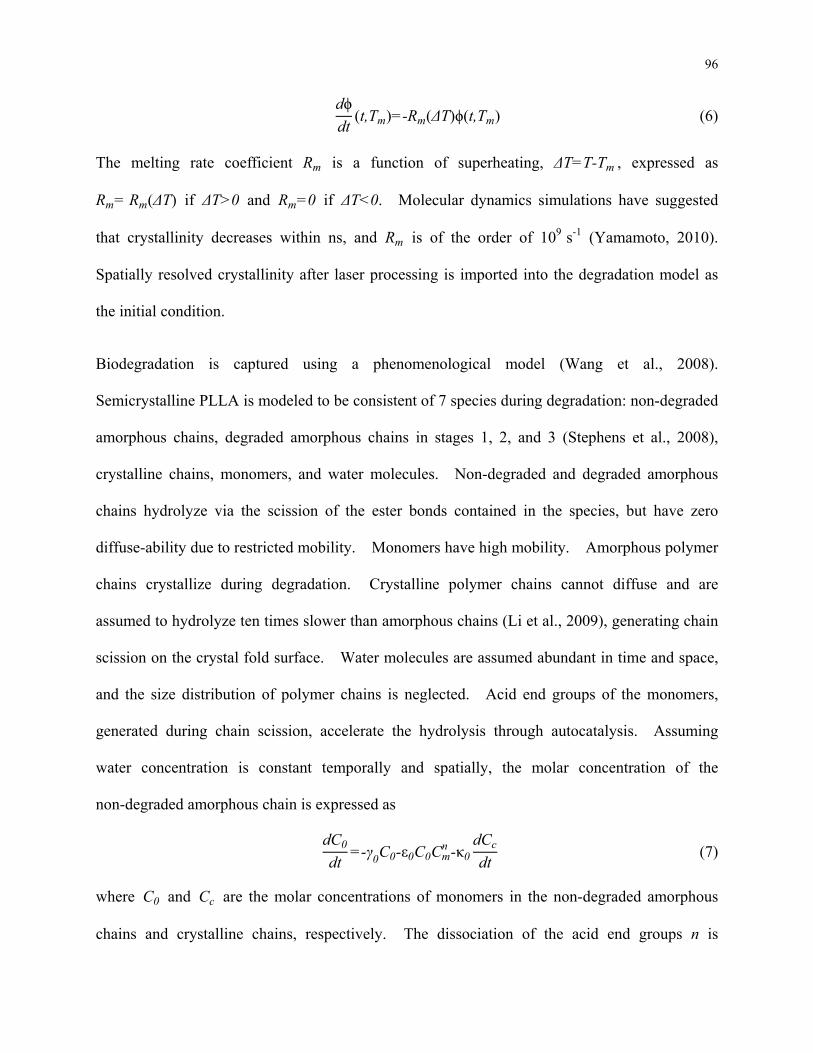
96
dϕ
dt(t,Tm)=-Rm(ΔT)ϕ(t,Tm) (6)
The melting rate coefficient Rm is a function of superheating, ΔT=T-Tm , expressed as
Rm= Rm(ΔT) if ΔT>0 and Rm=0 if ΔT<0. Molecular dynamics simulations have suggested
that crystallinity decreases within ns, and Rm is of the order of 109 s-1 (Yamamoto, 2010).
Spatially resolved crystallinity after laser processing is imported into the degradation model as
the initial condition.
Biodegradation is captured using a phenomenological model (Wang et al., 2008).
Semicrystalline PLLA is modeled to be consistent of 7 species during degradation: non-degraded
amorphous chains, degraded amorphous chains in stages 1, 2, and 3 (Stephens et al., 2008),
crystalline chains, monomers, and water molecules. Non-degraded and degraded amorphous
chains hydrolyze via the scission of the ester bonds contained in the species, but have zero
diffuse-ability due to restricted mobility. Monomers have high mobility. Amorphous polymer
chains crystallize during degradation. Crystalline polymer chains cannot diffuse and are
assumed to hydrolyze ten times slower than amorphous chains (Li et al., 2009), generating chain
scission on the crystal fold surface. Water molecules are assumed abundant in time and space,
and the size distribution of polymer chains is neglected. Acid end groups of the monomers,
generated during chain scission, accelerate the hydrolysis through autocatalysis. Assuming
water concentration is constant temporally and spatially, the molar concentration of the
non-degraded amorphous chain is expressed as
dC0
dt=-γ0C0-ε0C0Cm
n -κ0dCc
dt (7)
where C0 and Cc are the molar concentrations of monomers in the non-degraded amorphous
chains and crystalline chains, respectively. The dissociation of the acid end groups n is
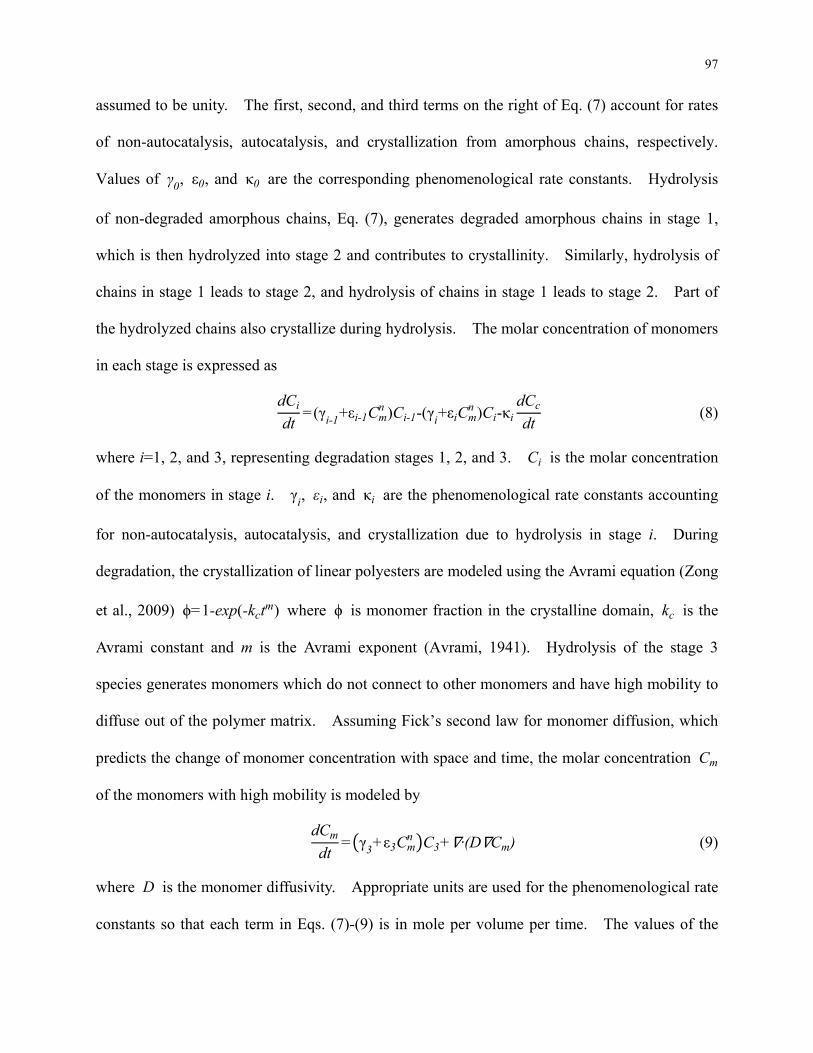
97
assumed to be unity. The first, second, and third terms on the right of Eq. (7) account for rates
of non-autocatalysis, autocatalysis, and crystallization from amorphous chains, respectively.
Values of γ0, ε0, and κ0 are the corresponding phenomenological rate constants. Hydrolysis
of non-degraded amorphous chains, Eq. (7), generates degraded amorphous chains in stage 1,
which is then hydrolyzed into stage 2 and contributes to crystallinity. Similarly, hydrolysis of
chains in stage 1 leads to stage 2, and hydrolysis of chains in stage 1 leads to stage 2. Part of
the hydrolyzed chains also crystallize during hydrolysis. The molar concentration of monomers
in each stage is expressed as
dCi
dt=(γi-1+εi-1Cm
n )Ci-1-(γi+εiCmn )Ci-κi
dCc
dt (8)
where i=1, 2, and 3, representing degradation stages 1, 2, and 3. Ci is the molar concentration
of the monomers in stage i. γi, εi, and κi are the phenomenological rate constants accounting
for non-autocatalysis, autocatalysis, and crystallization due to hydrolysis in stage i. During
degradation, the crystallization of linear polyesters are modeled using the Avrami equation (Zong
et al., 2009) ϕ=1-exp(-kctm) where ϕ is monomer fraction in the crystalline domain, kc is the
Avrami constant and m is the Avrami exponent (Avrami, 1941). Hydrolysis of the stage 3
species generates monomers which do not connect to other monomers and have high mobility to
diffuse out of the polymer matrix. Assuming Fick’s second law for monomer diffusion, which
predicts the change of monomer concentration with space and time, the molar concentration Cm
of the monomers with high mobility is modeled by
dCm
dt= γ3+ε3Cm
n C3+ ·(D Cm) (9)
where D is the monomer diffusivity. Appropriate units are used for the phenomenological rate
constants so that each term in Eqs. (7)-(9) is in mole per volume per time. The values of the
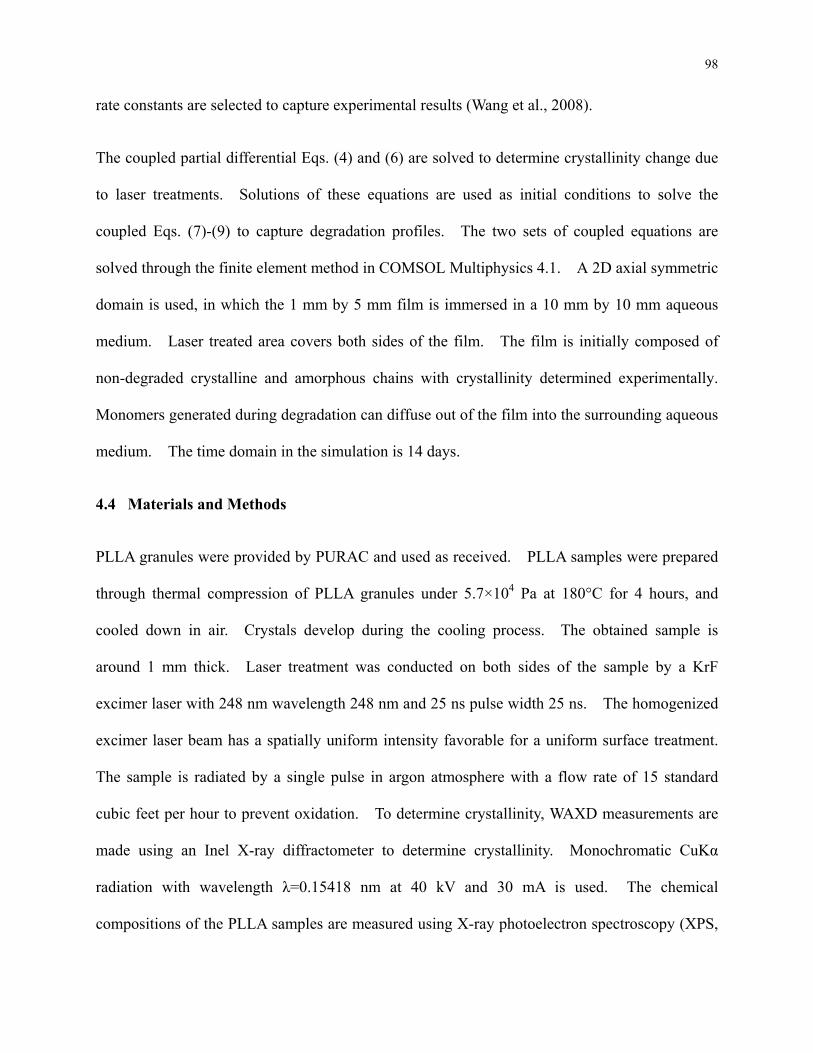
98
rate constants are selected to capture experimental results (Wang et al., 2008).
The coupled partial differential Eqs. (4) and (6) are solved to determine crystallinity change due
to laser treatments. Solutions of these equations are used as initial conditions to solve the
coupled Eqs. (7)-(9) to capture degradation profiles. The two sets of coupled equations are
solved through the finite element method in COMSOL Multiphysics 4.1. A 2D axial symmetric
domain is used, in which the 1 mm by 5 mm film is immersed in a 10 mm by 10 mm aqueous
medium. Laser treated area covers both sides of the film. The film is initially composed of
non-degraded crystalline and amorphous chains with crystallinity determined experimentally.
Monomers generated during degradation can diffuse out of the film into the surrounding aqueous
medium. The time domain in the simulation is 14 days.
4.4 Materials and Methods
PLLA granules were provided by PURAC and used as received. PLLA samples were prepared
through thermal compression of PLLA granules under 5.7×10⁴ Pa at 180°C for 4 hours, and
cooled down in air. Crystals develop during the cooling process. The obtained sample is
around 1 mm thick. Laser treatment was conducted on both sides of the sample by a KrF
excimer laser with 248 nm wavelength 248 nm and 25 ns pulse width 25 ns. The homogenized
excimer laser beam has a spatially uniform intensity favorable for a uniform surface treatment.
The sample is radiated by a single pulse in argon atmosphere with a flow rate of 15 standard
cubic feet per hour to prevent oxidation. To determine crystallinity, WAXD measurements are
made using an Inel X-ray diffractometer to determine crystallinity. Monochromatic CuKα
radiation with wavelength λ=0.15418 nm at 40 kV and 30 mA is used. The chemical
compositions of the PLLA samples are measured using X-ray photoelectron spectroscopy (XPS,
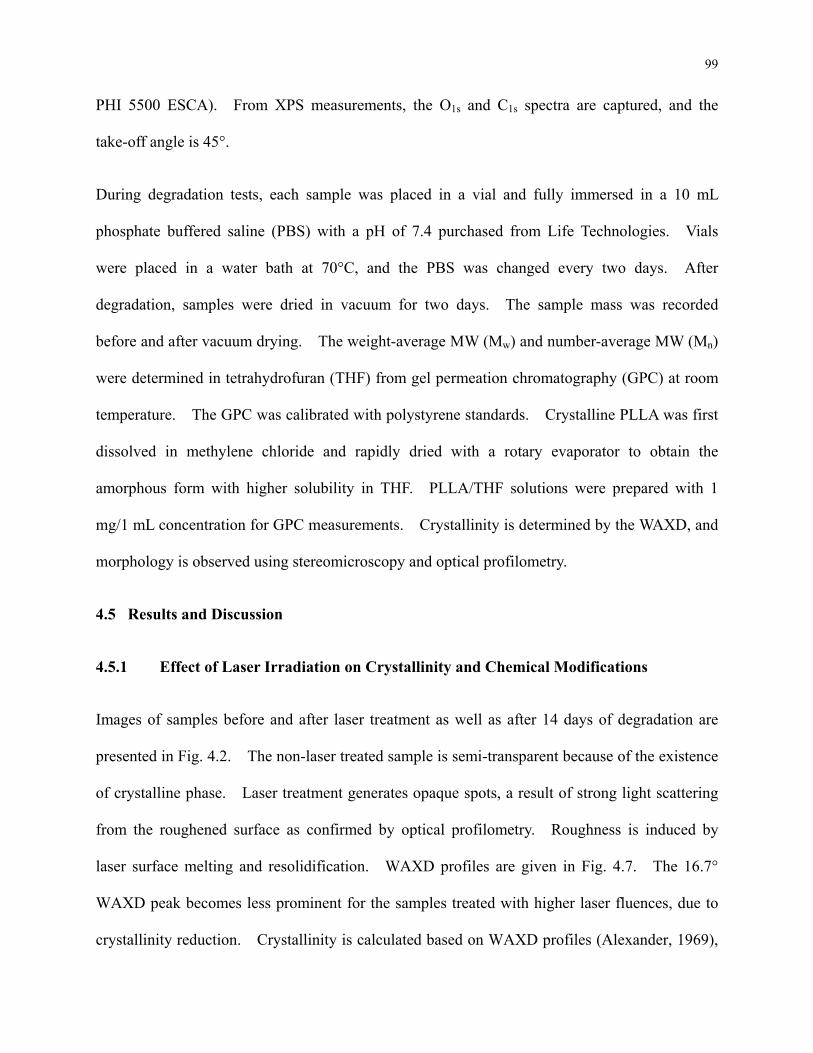
99
PHI 5500 ESCA). From XPS measurements, the O1s and C1s spectra are captured, and the
take-off angle is 45°.
During degradation tests, each sample was placed in a vial and fully immersed in a 10 mL
phosphate buffered saline (PBS) with a pH of 7.4 purchased from Life Technologies. Vials
were placed in a water bath at 70°C, and the PBS was changed every two days. After
degradation, samples were dried in vacuum for two days. The sample mass was recorded
before and after vacuum drying. The weight-average MW (Mw) and number-average MW (Mn)
were determined in tetrahydrofuran (THF) from gel permeation chromatography (GPC) at room
temperature. The GPC was calibrated with polystyrene standards. Crystalline PLLA was first
dissolved in methylene chloride and rapidly dried with a rotary evaporator to obtain the
amorphous form with higher solubility in THF. PLLA/THF solutions were prepared with 1
mg/1 mL concentration for GPC measurements. Crystallinity is determined by the WAXD, and
morphology is observed using stereomicroscopy and optical profilometry.
4.5 Results and Discussion
4.5.1 Effect of Laser Irradiation on Crystallinity and Chemical Modifications
Images of samples before and after laser treatment as well as after 14 days of degradation are
presented in Fig. 4.2. The non-laser treated sample is semi-transparent because of the existence
of crystalline phase. Laser treatment generates opaque spots, a result of strong light scattering
from the roughened surface as confirmed by optical profilometry. Roughness is induced by
laser surface melting and resolidification. WAXD profiles are given in Fig. 4.7. The 16.7°
WAXD peak becomes less prominent for the samples treated with higher laser fluences, due to
crystallinity reduction. Crystallinity is calculated based on WAXD profiles (Alexander, 1969),
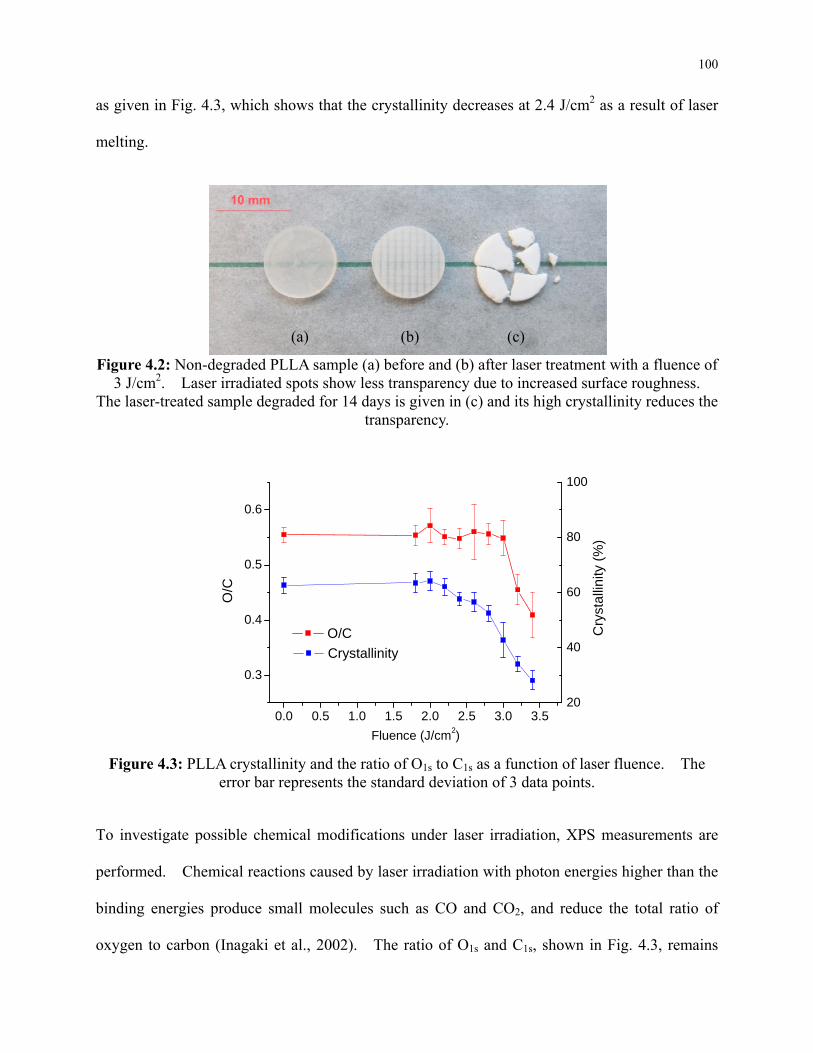
100
as given in Fig. 4.3, which shows that the crystallinity decreases at 2.4 J/cm2 as a result of laser
melting.
Figure 4.2: Non-degraded PLLA sample (a) before and (b) after laser treatment with a fluence of
3 J/cm2. Laser irradiated spots show less transparency due to increased surface roughness. The laser-treated sample degraded for 14 days is given in (c) and its high crystallinity reduces the
transparency.
0.0 0.5 1.0 1.5 2.0 2.5 3.0 3.5
0.3
0.4
0.5
0.6
Cry
stal
linity
(%
)
O/C
Fluence (J/cm2)
O/C
20
40
60
80
100
Crystallinity
Figure 4.3: PLLA crystallinity and the ratio of O1s to C1s as a function of laser fluence. The
error bar represents the standard deviation of 3 data points.
To investigate possible chemical modifications under laser irradiation, XPS measurements are
performed. Chemical reactions caused by laser irradiation with photon energies higher than the
binding energies produce small molecules such as CO and CO2, and reduce the total ratio of
oxygen to carbon (Inagaki et al., 2002). The ratio of O1s and C1s, shown in Fig. 4.3, remains
(a) (b) (c)
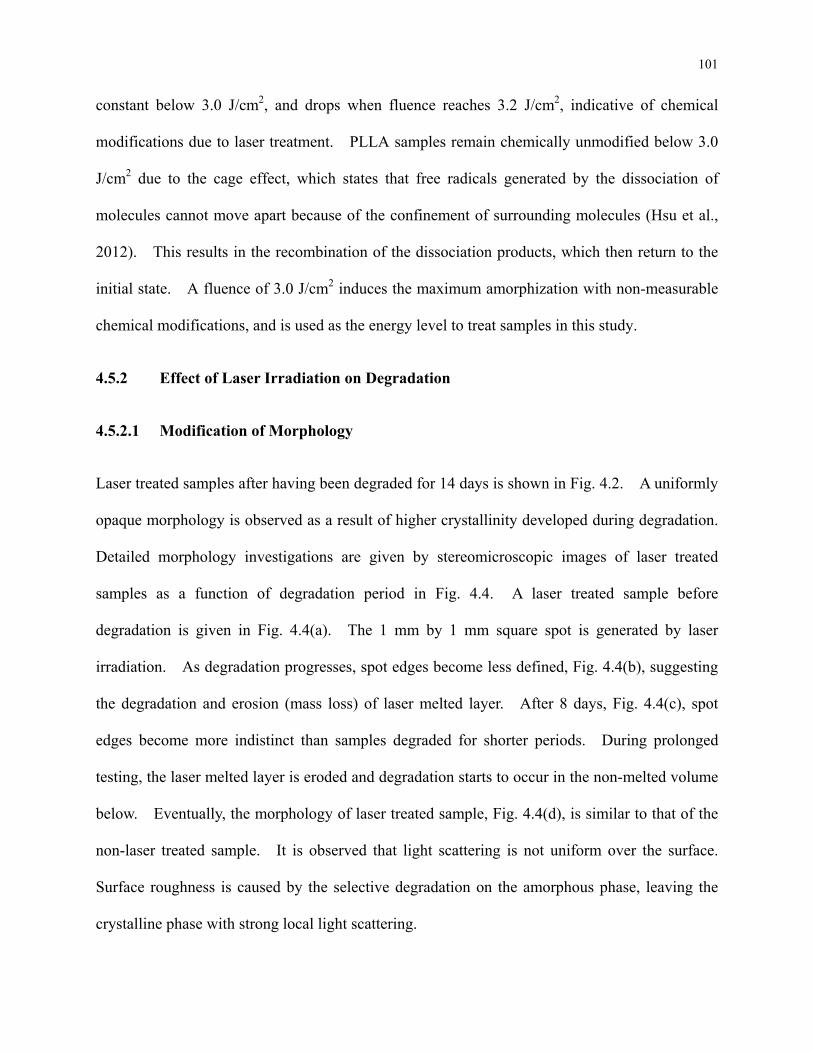
101
constant below 3.0 J/cm2, and drops when fluence reaches 3.2 J/cm2, indicative of chemical
modifications due to laser treatment. PLLA samples remain chemically unmodified below 3.0
J/cm2 due to the cage effect, which states that free radicals generated by the dissociation of
molecules cannot move apart because of the confinement of surrounding molecules (Hsu et al.,
2012). This results in the recombination of the dissociation products, which then return to the
initial state. A fluence of 3.0 J/cm2 induces the maximum amorphization with non-measurable
chemical modifications, and is used as the energy level to treat samples in this study.
4.5.2 Effect of Laser Irradiation on Degradation
4.5.2.1 Modification of Morphology
Laser treated samples after having been degraded for 14 days is shown in Fig. 4.2. A uniformly
opaque morphology is observed as a result of higher crystallinity developed during degradation.
Detailed morphology investigations are given by stereomicroscopic images of laser treated
samples as a function of degradation period in Fig. 4.4. A laser treated sample before
degradation is given in Fig. 4.4(a). The 1 mm by 1 mm square spot is generated by laser
irradiation. As degradation progresses, spot edges become less defined, Fig. 4.4(b), suggesting
the degradation and erosion (mass loss) of laser melted layer. After 8 days, Fig. 4.4(c), spot
edges become more indistinct than samples degraded for shorter periods. During prolonged
testing, the laser melted layer is eroded and degradation starts to occur in the non-melted volume
below. Eventually, the morphology of laser treated sample, Fig. 4.4(d), is similar to that of the
non-laser treated sample. It is observed that light scattering is not uniform over the surface.
Surface roughness is caused by the selective degradation on the amorphous phase, leaving the
crystalline phase with strong local light scattering.
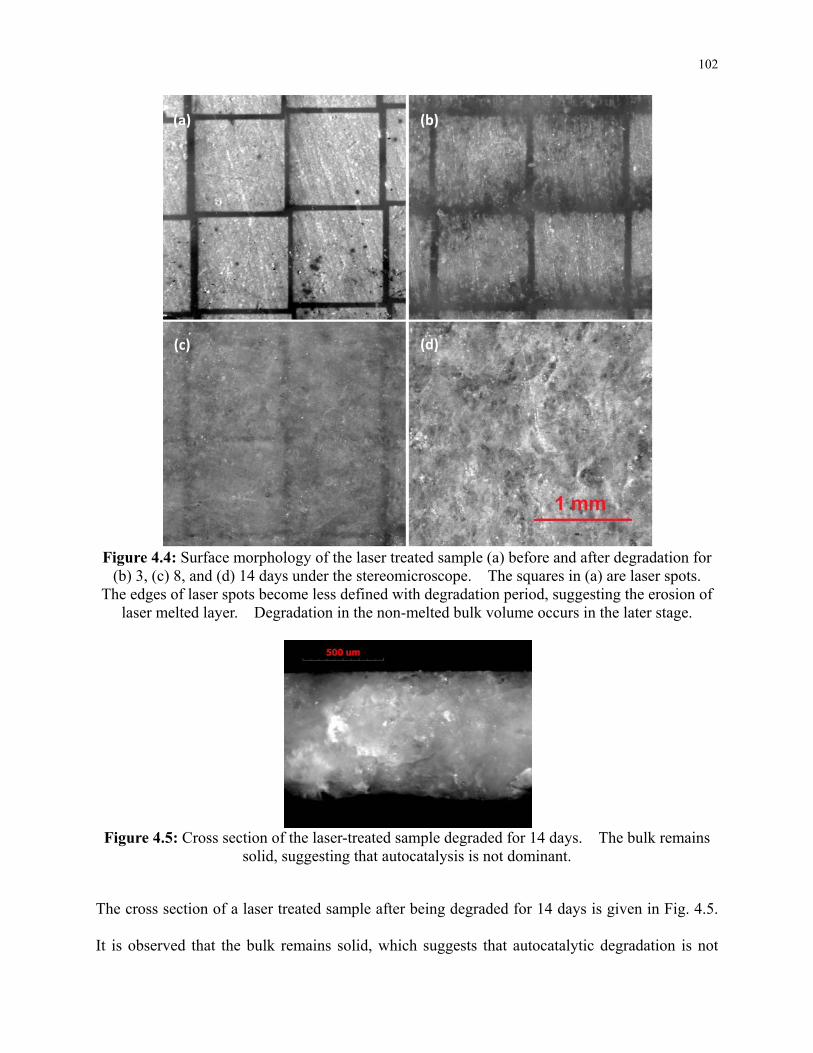
102
Figure 4.4: Surface morphology of the laser treated sample (a) before and after degradation for
(b) 3, (c) 8, and (d) 14 days under the stereomicroscope. The squares in (a) are laser spots. The edges of laser spots become less defined with degradation period, suggesting the erosion of
laser melted layer. Degradation in the non-melted bulk volume occurs in the later stage.
Figure 4.5: Cross section of the laser-treated sample degraded for 14 days. The bulk remains
solid, suggesting that autocatalysis is not dominant.
The cross section of a laser treated sample after being degraded for 14 days is given in Fig. 4.5.
It is observed that the bulk remains solid, which suggests that autocatalytic degradation is not
(c)
(a)
(d)
(b)
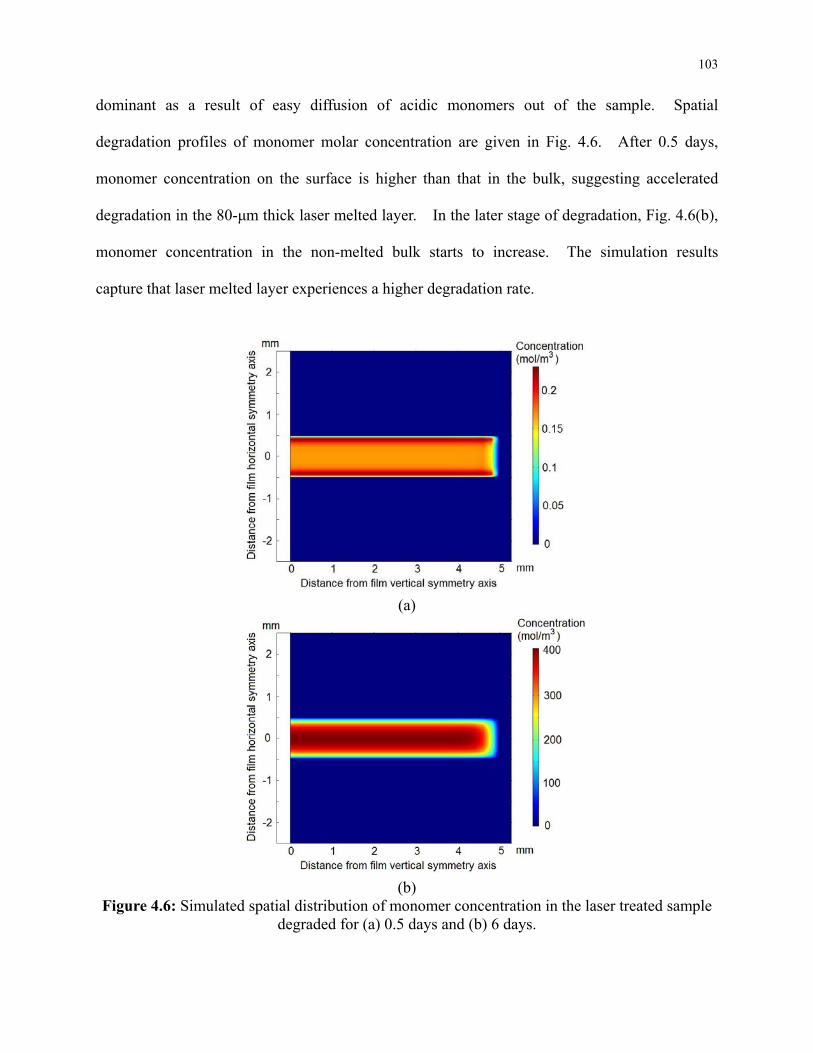
103
dominant as a result of easy diffusion of acidic monomers out of the sample. Spatial
degradation profiles of monomer molar concentration are given in Fig. 4.6. After 0.5 days,
monomer concentration on the surface is higher than that in the bulk, suggesting accelerated
degradation in the 80-μm thick laser melted layer. In the later stage of degradation, Fig. 4.6(b),
monomer concentration in the non-melted bulk starts to increase. The simulation results
capture that laser melted layer experiences a higher degradation rate.
(a)
(b)
Figure 4.6: Simulated spatial distribution of monomer concentration in the laser treated sample degraded for (a) 0.5 days and (b) 6 days.
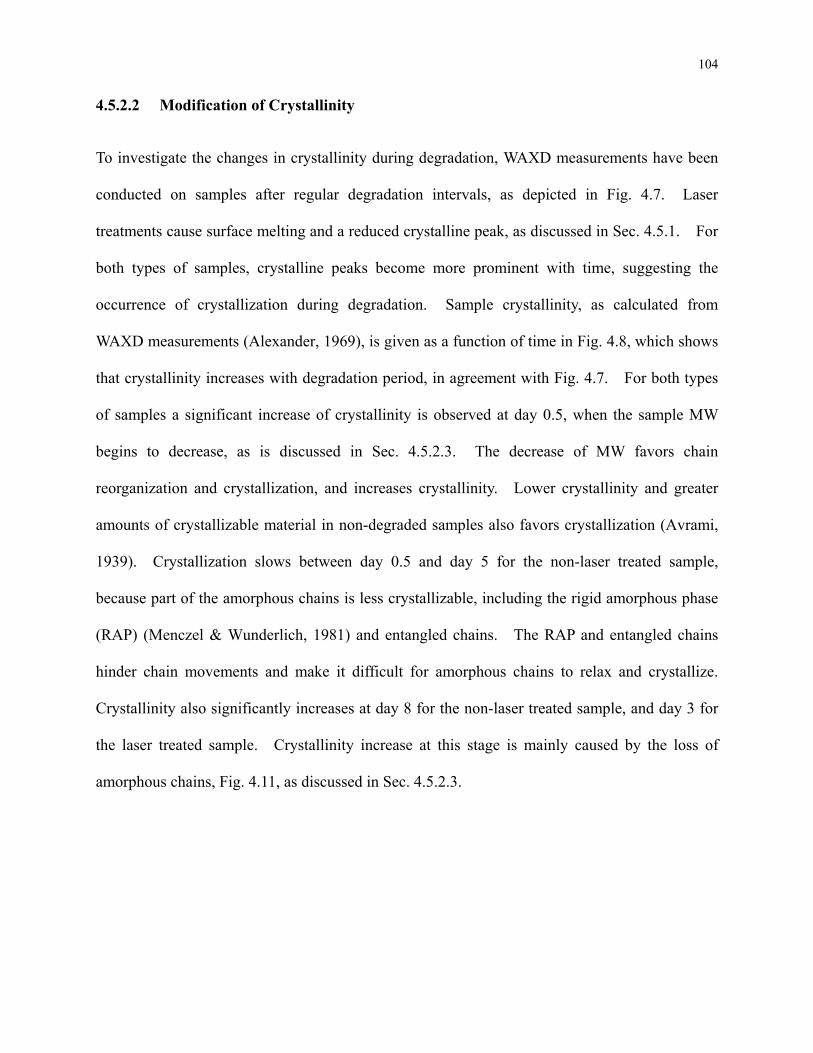
104
4.5.2.2 Modification of Crystallinity
To investigate the changes in crystallinity during degradation, WAXD measurements have been
conducted on samples after regular degradation intervals, as depicted in Fig. 4.7. Laser
treatments cause surface melting and a reduced crystalline peak, as discussed in Sec. 4.5.1. For
both types of samples, crystalline peaks become more prominent with time, suggesting the
occurrence of crystallization during degradation. Sample crystallinity, as calculated from
WAXD measurements (Alexander, 1969), is given as a function of time in Fig. 4.8, which shows
that crystallinity increases with degradation period, in agreement with Fig. 4.7. For both types
of samples a significant increase of crystallinity is observed at day 0.5, when the sample MW
begins to decrease, as is discussed in Sec. 4.5.2.3. The decrease of MW favors chain
reorganization and crystallization, and increases crystallinity. Lower crystallinity and greater
amounts of crystallizable material in non-degraded samples also favors crystallization (Avrami,
1939). Crystallization slows between day 0.5 and day 5 for the non-laser treated sample,
because part of the amorphous chains is less crystallizable, including the rigid amorphous phase
(RAP) (Menczel & Wunderlich, 1981) and entangled chains. The RAP and entangled chains
hinder chain movements and make it difficult for amorphous chains to relax and crystallize.
Crystallinity also significantly increases at day 8 for the non-laser treated sample, and day 3 for
the laser treated sample. Crystallinity increase at this stage is mainly caused by the loss of
amorphous chains, Fig. 4.11, as discussed in Sec. 4.5.2.3.
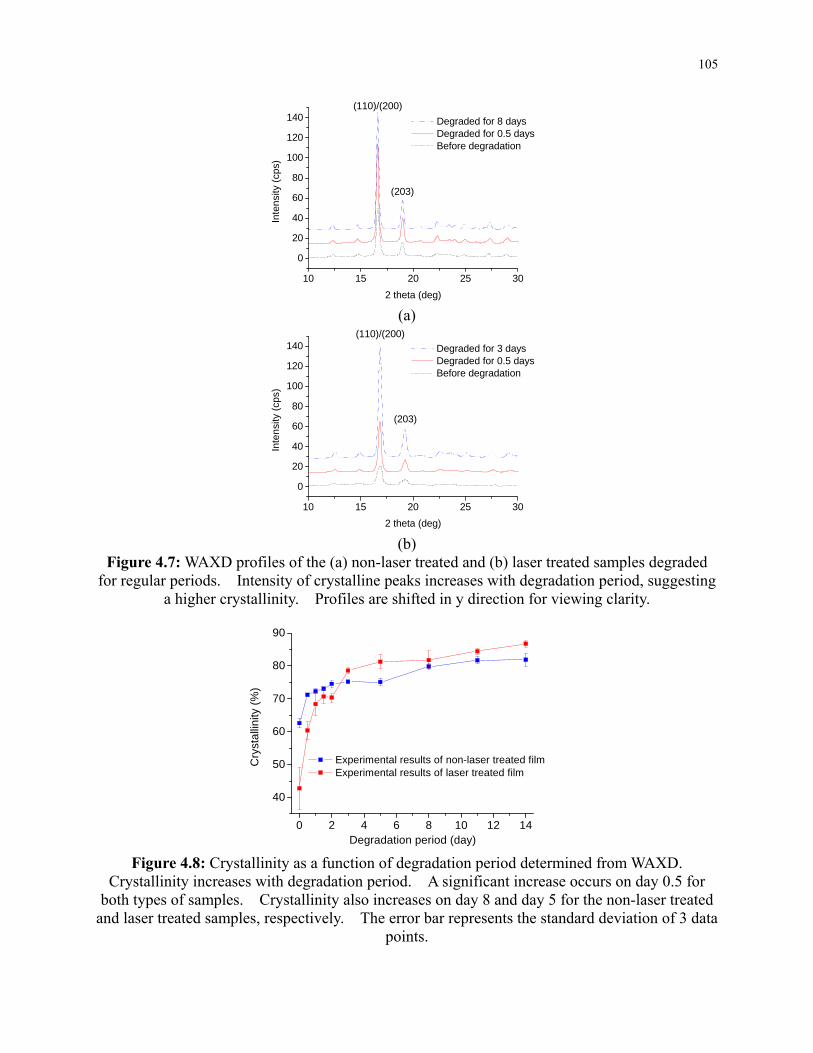
105
10 15 20 25 30
0
20
40
60
80
100
120
140
Inte
nsity
(cp
s)
2 theta (deg)
Degraded for 8 days Degraded for 0.5 days Before degradation
(110)/(200)
(203)
(a)
10 15 20 25 30
0
20
40
60
80
100
120
140
(203)
(110)/(200)
Inte
nsi
ty (
cps)
2 theta (deg)
Degraded for 3 days Degraded for 0.5 days Before degradation
(b)
Figure 4.7: WAXD profiles of the (a) non-laser treated and (b) laser treated samples degraded for regular periods. Intensity of crystalline peaks increases with degradation period, suggesting
a higher crystallinity. Profiles are shifted in y direction for viewing clarity.
0 2 4 6 8 10 12 14
40
50
60
70
80
90
Experimental results of non-laser treated film Experimental results of laser treated film
Cry
sta
llin
ity (
%)
Degradation period (day)
Figure 4.8: Crystallinity as a function of degradation period determined from WAXD. Crystallinity increases with degradation period. A significant increase occurs on day 0.5 for
both types of samples. Crystallinity also increases on day 8 and day 5 for the non-laser treated and laser treated samples, respectively. The error bar represents the standard deviation of 3 data
points.
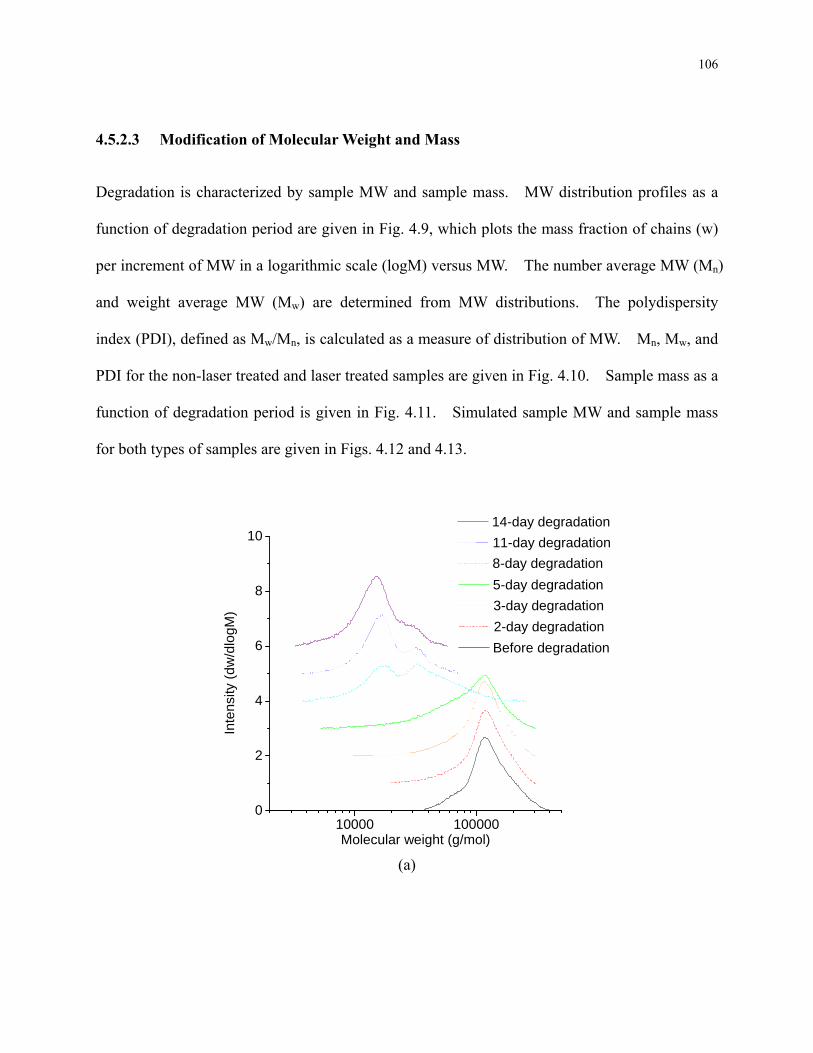
106
4.5.2.3 Modification of Molecular Weight and Mass
Degradation is characterized by sample MW and sample mass. MW distribution profiles as a
function of degradation period are given in Fig. 4.9, which plots the mass fraction of chains (w)
per increment of MW in a logarithmic scale (logM) versus MW. The number average MW (Mn)
and weight average MW (Mw) are determined from MW distributions. The polydispersity
index (PDI), defined as Mw/Mn, is calculated as a measure of distribution of MW. Mn, Mw, and
PDI for the non-laser treated and laser treated samples are given in Fig. 4.10. Sample mass as a
function of degradation period is given in Fig. 4.11. Simulated sample MW and sample mass
for both types of samples are given in Figs. 4.12 and 4.13.
10000 1000000
2
4
6
8
10
Before degradation
2-day degradation
Molecular weight (g/mol)
5-day degradation
8-day degradation
11-day degradation
Inte
nsi
ty (
dw
/dlo
gM
)
14-day degradation
3-day degradation
(a)
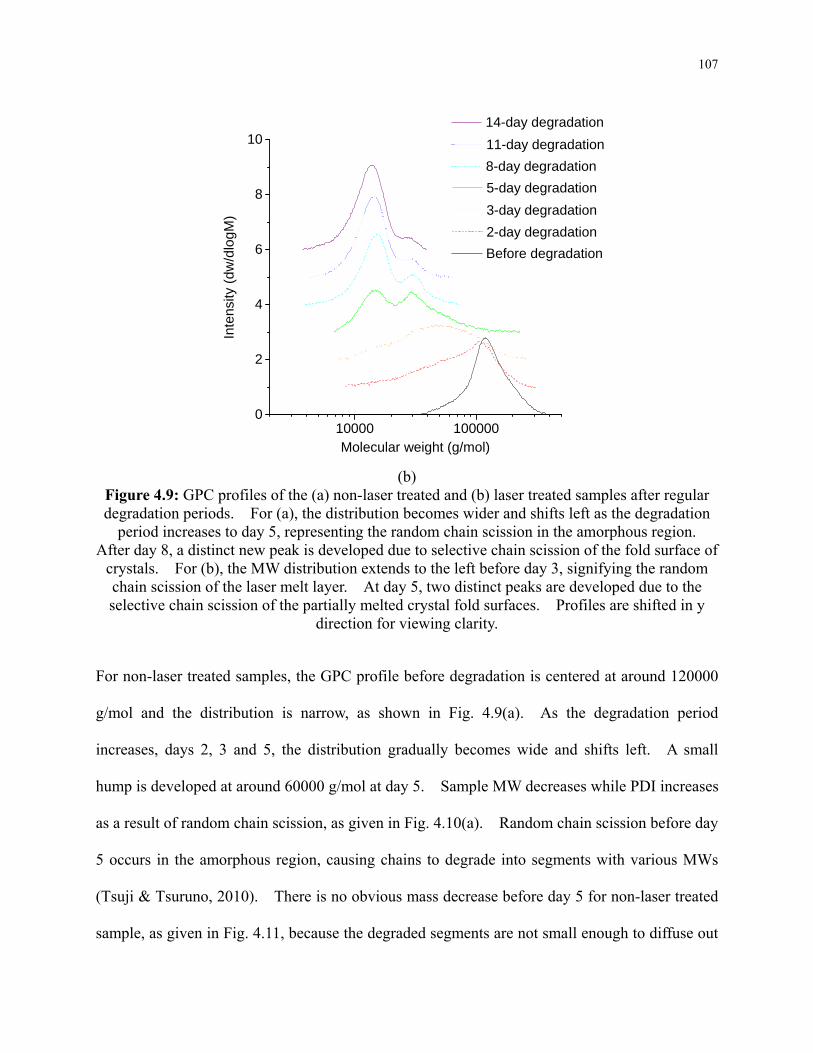
107
10000 1000000
2
4
6
8
10
Inte
nsi
ty (
dw
/dlo
gM
)
Molecular weight (g/mol)
Before degradation
2-day degradation
3-day degradation
5-day degradation
8-day degradation
11-day degradation
14-day degradation
(b)
Figure 4.9: GPC profiles of the (a) non-laser treated and (b) laser treated samples after regular degradation periods. For (a), the distribution becomes wider and shifts left as the degradation
period increases to day 5, representing the random chain scission in the amorphous region. After day 8, a distinct new peak is developed due to selective chain scission of the fold surface of
crystals. For (b), the MW distribution extends to the left before day 3, signifying the random chain scission of the laser melt layer. At day 5, two distinct peaks are developed due to the selective chain scission of the partially melted crystal fold surfaces. Profiles are shifted in y
direction for viewing clarity.
For non-laser treated samples, the GPC profile before degradation is centered at around 120000
g/mol and the distribution is narrow, as shown in Fig. 4.9(a). As the degradation period
increases, days 2, 3 and 5, the distribution gradually becomes wide and shifts left. A small
hump is developed at around 60000 g/mol at day 5. Sample MW decreases while PDI increases
as a result of random chain scission, as given in Fig. 4.10(a). Random chain scission before day
5 occurs in the amorphous region, causing chains to degrade into segments with various MWs
(Tsuji & Tsuruno, 2010). There is no obvious mass decrease before day 5 for non-laser treated
sample, as given in Fig. 4.11, because the degraded segments are not small enough to diffuse out
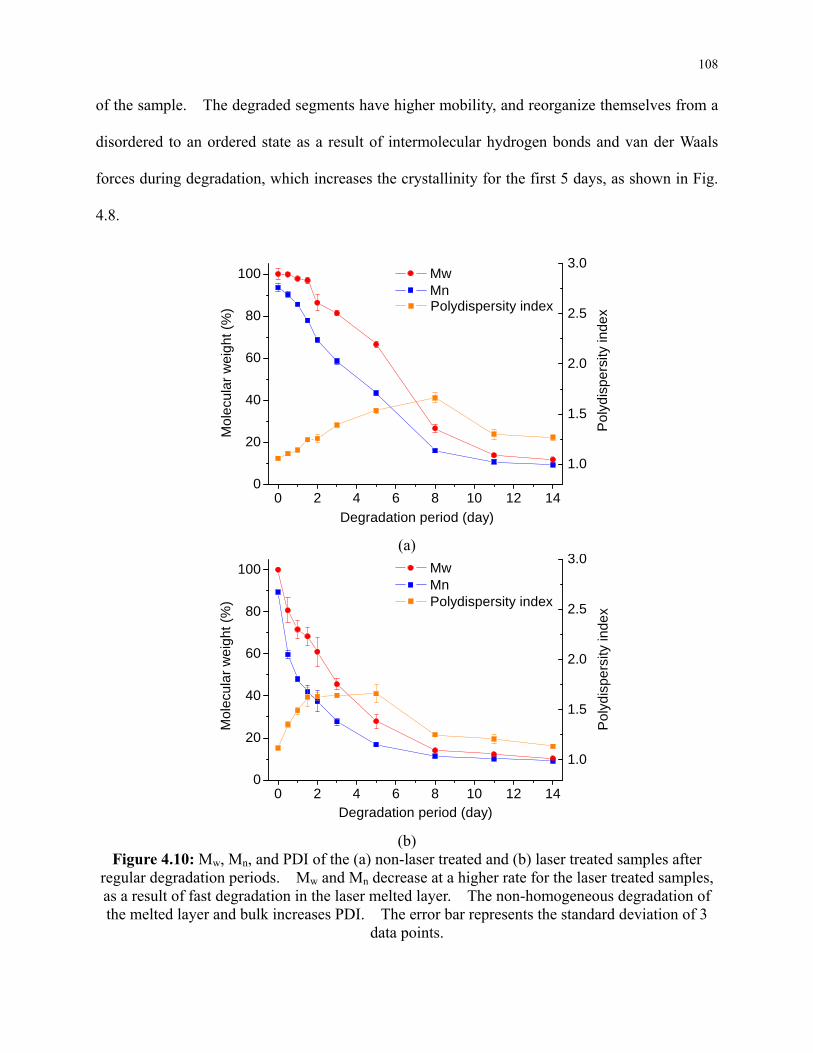
108
of the sample. The degraded segments have higher mobility, and reorganize themselves from a
disordered to an ordered state as a result of intermolecular hydrogen bonds and van der Waals
forces during degradation, which increases the crystallinity for the first 5 days, as shown in Fig.
4.8.
0 2 4 6 8 10 12 140
20
40
60
80
100
Pol
ydis
pers
ity in
dex
Degradation period (day)
Mo
lecu
lar
we
igh
t (%
)
Mw Mn
1.0
1.5
2.0
2.5
3.0
Polydispersity index
(a)
0 2 4 6 8 10 12 140
20
40
60
80
100
Mo
lecu
lar
we
igh
t (%
)
Degradation period (day)
Mw Mn
1.0
1.5
2.0
2.5
3.0
Pol
ydis
pers
ity in
dex
Polydispersity index
(b)
Figure 4.10: Mw, Mn, and PDI of the (a) non-laser treated and (b) laser treated samples after regular degradation periods. Mw and Mn decrease at a higher rate for the laser treated samples, as a result of fast degradation in the laser melted layer. The non-homogeneous degradation of the melted layer and bulk increases PDI. The error bar represents the standard deviation of 3
data points.
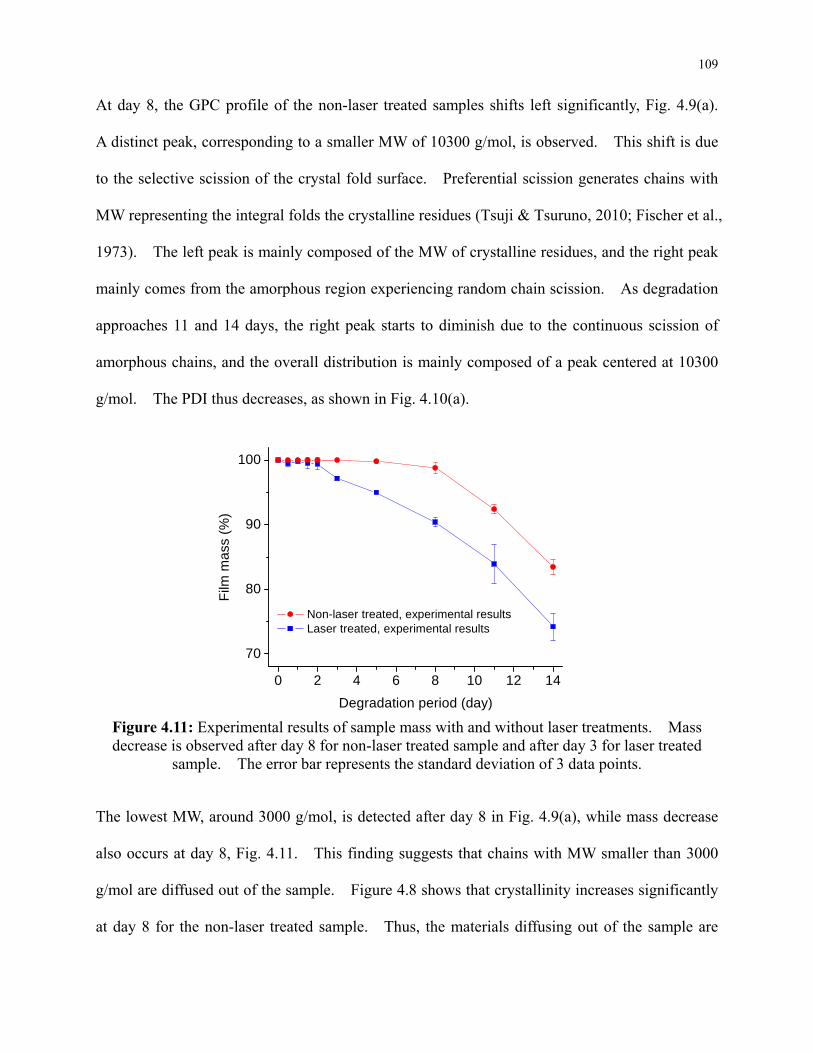
109
At day 8, the GPC profile of the non-laser treated samples shifts left significantly, Fig. 4.9(a).
A distinct peak, corresponding to a smaller MW of 10300 g/mol, is observed. This shift is due
to the selective scission of the crystal fold surface. Preferential scission generates chains with
MW representing the integral folds the crystalline residues (Tsuji & Tsuruno, 2010; Fischer et al.,
1973). The left peak is mainly composed of the MW of crystalline residues, and the right peak
mainly comes from the amorphous region experiencing random chain scission. As degradation
approaches 11 and 14 days, the right peak starts to diminish due to the continuous scission of
amorphous chains, and the overall distribution is mainly composed of a peak centered at 10300
g/mol. The PDI thus decreases, as shown in Fig. 4.10(a).
0 2 4 6 8 10 12 14
70
80
90
100
Film
ma
ss (
%)
Degradation period (day)
Non-laser treated, experimental results Laser treated, experimental results
Figure 4.11: Experimental results of sample mass with and without laser treatments. Mass decrease is observed after day 8 for non-laser treated sample and after day 3 for laser treated
sample. The error bar represents the standard deviation of 3 data points.
The lowest MW, around 3000 g/mol, is detected after day 8 in Fig. 4.9(a), while mass decrease
also occurs at day 8, Fig. 4.11. This finding suggests that chains with MW smaller than 3000
g/mol are diffused out of the sample. Figure 4.8 shows that crystallinity increases significantly
at day 8 for the non-laser treated sample. Thus, the materials diffusing out of the sample are
110
mainly amorphous. The reduction of amorphous material increases the crystallinity in the
sample and leads to stronger local light scattering shown in Fig. 4.4(d).
GPC profiles of the laser treated sample are given in Fig. 4.9(b). Before degradation, the GPC
profile of the laser treated sample has a peak at 120000 g/mol similar to the non-laser treated
sample, which suggests that laser treatment does not modify PLLA MW. When compared with
the non-laser treated sample, MW decreases at a high rate at the early stage for the laser treated
sample. On days 2 and 3, significant changes of GPC profiles are observed in Fig. 4.9(b). At
day 2, the peak at 120000 g/mol decreases, while the distribution extends to the smaller MW
region. The peak diminishes at day 3, and a hump at smaller MW region is developed.
During this period, a random chain scission of the laser melted layer occurs.
Non-homogeneous degradation at the laser melted layer and the bulk widens the MW
distribution and thus increases the PDI, Fig. 4.10(b). The high degradation rate of the laser
treated sample is caused by water molecules penetrating into the less ordered structure caused by
laser melting. Faster water penetration into the bulk is also responsible for the diminished
original peak at day 3.
At day 5, the hump is split into two peaks for the laser treated sample, as shown in Fig. 4.9(b).
The distinct distribution of two peaks is suggestive of selective chain scission on crystal fold
surfaces. Same phenomenon is observed in the non-laser treated sample at day 8. The earlier
occurrence of this selective scission for the laser treated sample may be due to the less ordered
structure of the partially melted crystals. For partially melted crystals, the crystal thickness is
diminished, which increases the molecular loop length on the fold surface (Belyayev, 1988).
This longer loop length enlarges the free volume, the volume not occupied by polymer molecules
in a polymer matrix. A larger free volume allows for easy water penetration, and facilitates
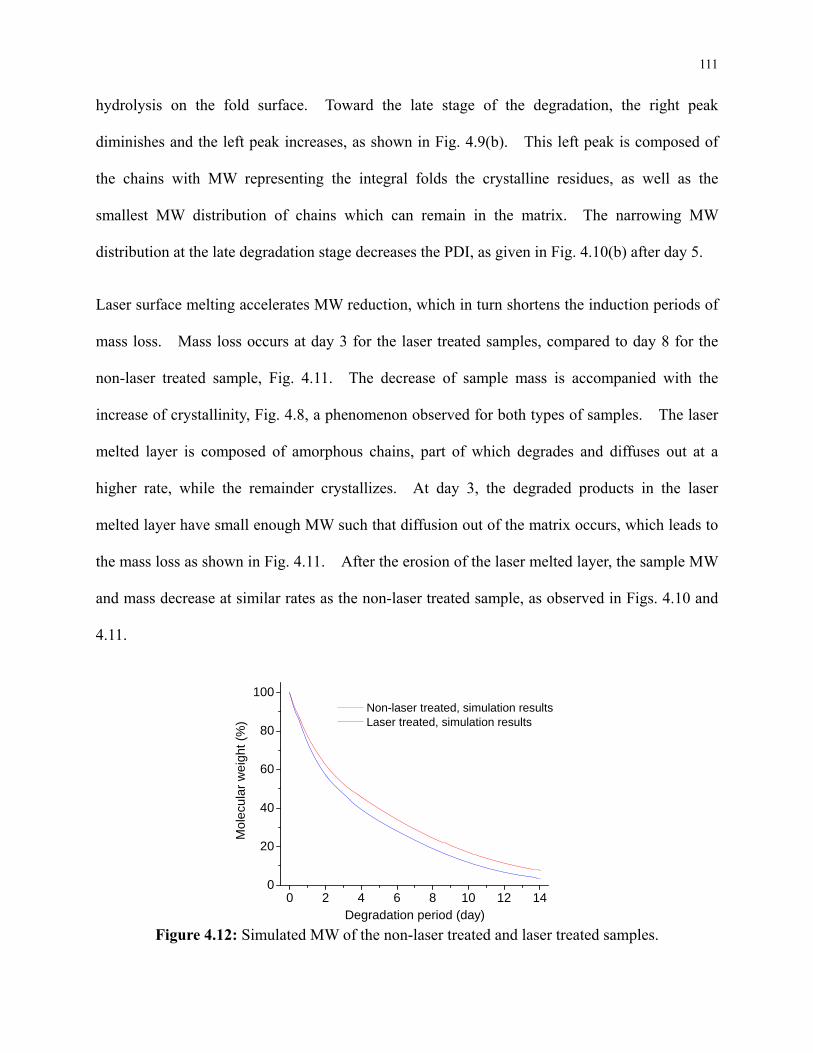
111
hydrolysis on the fold surface. Toward the late stage of the degradation, the right peak
diminishes and the left peak increases, as shown in Fig. 4.9(b). This left peak is composed of
the chains with MW representing the integral folds the crystalline residues, as well as the
smallest MW distribution of chains which can remain in the matrix. The narrowing MW
distribution at the late degradation stage decreases the PDI, as given in Fig. 4.10(b) after day 5.
Laser surface melting accelerates MW reduction, which in turn shortens the induction periods of
mass loss. Mass loss occurs at day 3 for the laser treated samples, compared to day 8 for the
non-laser treated sample, Fig. 4.11. The decrease of sample mass is accompanied with the
increase of crystallinity, Fig. 4.8, a phenomenon observed for both types of samples. The laser
melted layer is composed of amorphous chains, part of which degrades and diffuses out at a
higher rate, while the remainder crystallizes. At day 3, the degraded products in the laser
melted layer have small enough MW such that diffusion out of the matrix occurs, which leads to
the mass loss as shown in Fig. 4.11. After the erosion of the laser melted layer, the sample MW
and mass decrease at similar rates as the non-laser treated sample, as observed in Figs. 4.10 and
4.11.
0 2 4 6 8 10 12 140
20
40
60
80
100
Mol
ecul
ar w
eigh
t (%
)
Degradation period (day)
Non-laser treated, simulation results Laser treated, simulation results
Figure 4.12: Simulated MW of the non-laser treated and laser treated samples.
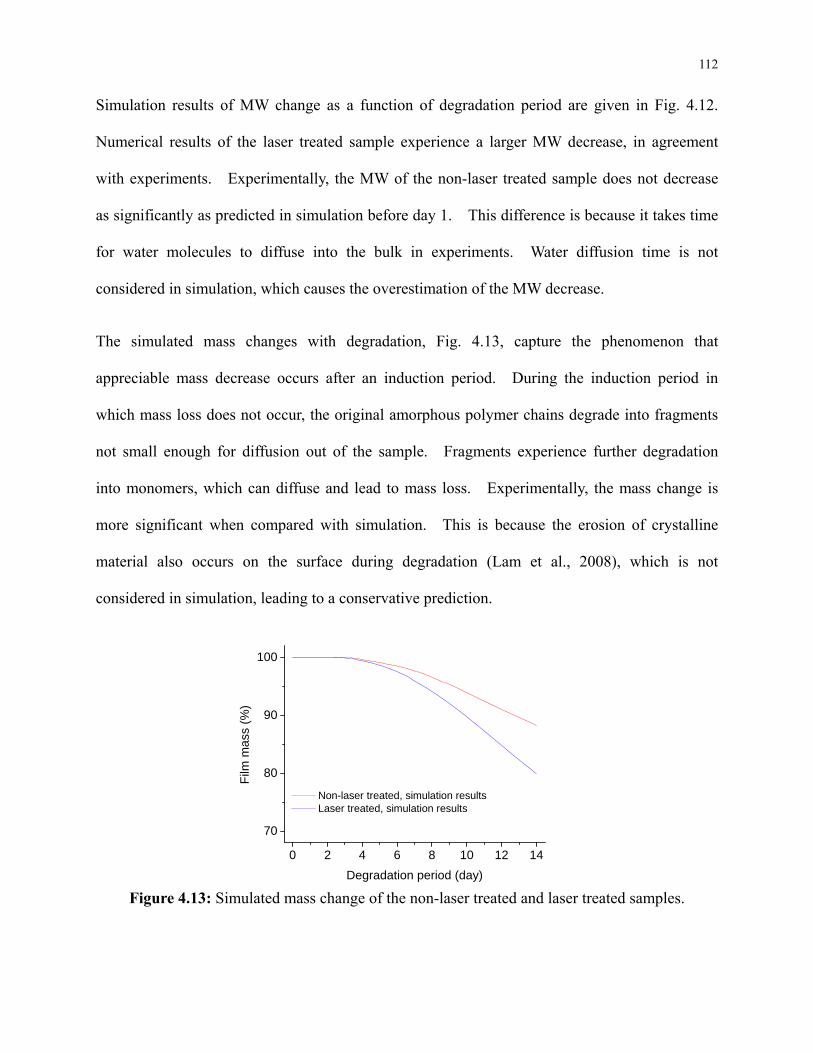
112
Simulation results of MW change as a function of degradation period are given in Fig. 4.12.
Numerical results of the laser treated sample experience a larger MW decrease, in agreement
with experiments. Experimentally, the MW of the non-laser treated sample does not decrease
as significantly as predicted in simulation before day 1. This difference is because it takes time
for water molecules to diffuse into the bulk in experiments. Water diffusion time is not
considered in simulation, which causes the overestimation of the MW decrease.
The simulated mass changes with degradation, Fig. 4.13, capture the phenomenon that
appreciable mass decrease occurs after an induction period. During the induction period in
which mass loss does not occur, the original amorphous polymer chains degrade into fragments
not small enough for diffusion out of the sample. Fragments experience further degradation
into monomers, which can diffuse and lead to mass loss. Experimentally, the mass change is
more significant when compared with simulation. This is because the erosion of crystalline
material also occurs on the surface during degradation (Lam et al., 2008), which is not
considered in simulation, leading to a conservative prediction.
0 2 4 6 8 10 12 14
70
80
90
100
Film
ma
ss (
%)
Degradation period (day)
Non-laser treated, simulation results Laser treated, simulation results
Figure 4.13: Simulated mass change of the non-laser treated and laser treated samples.
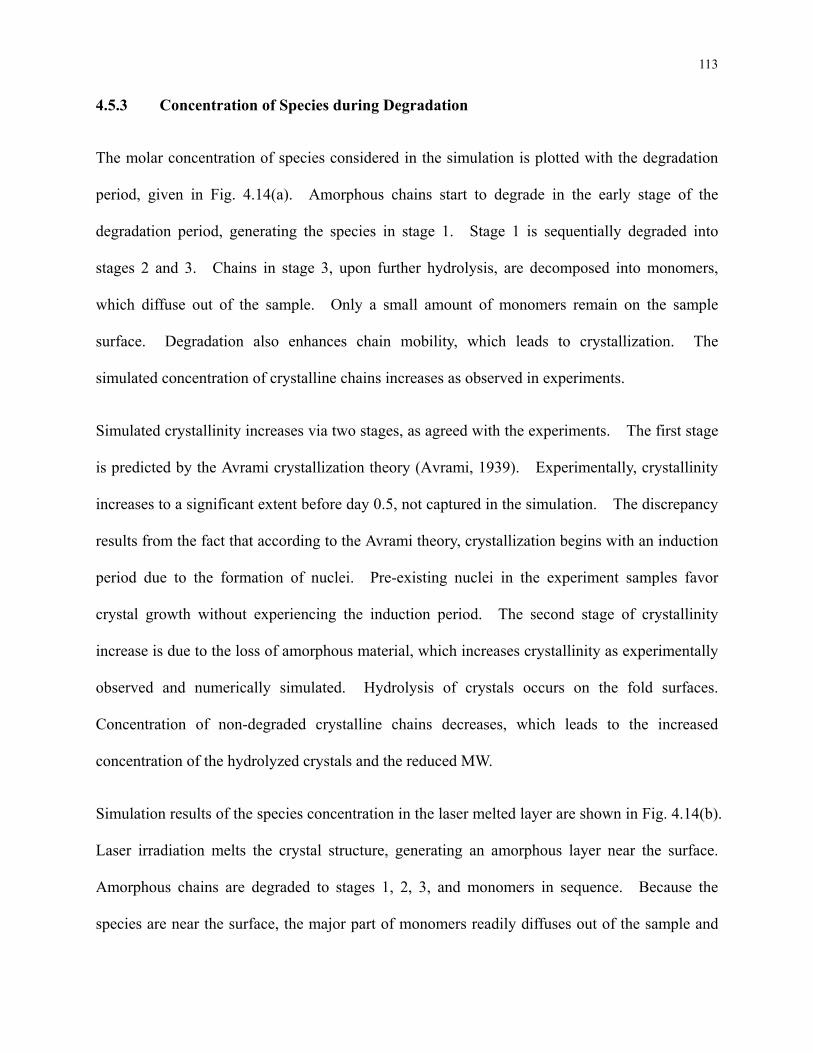
113
4.5.3 Concentration of Species during Degradation
The molar concentration of species considered in the simulation is plotted with the degradation
period, given in Fig. 4.14(a). Amorphous chains start to degrade in the early stage of the
degradation period, generating the species in stage 1. Stage 1 is sequentially degraded into
stages 2 and 3. Chains in stage 3, upon further hydrolysis, are decomposed into monomers,
which diffuse out of the sample. Only a small amount of monomers remain on the sample
surface. Degradation also enhances chain mobility, which leads to crystallization. The
simulated concentration of crystalline chains increases as observed in experiments.
Simulated crystallinity increases via two stages, as agreed with the experiments. The first stage
is predicted by the Avrami crystallization theory (Avrami, 1939). Experimentally, crystallinity
increases to a significant extent before day 0.5, not captured in the simulation. The discrepancy
results from the fact that according to the Avrami theory, crystallization begins with an induction
period due to the formation of nuclei. Pre-existing nuclei in the experiment samples favor
crystal growth without experiencing the induction period. The second stage of crystallinity
increase is due to the loss of amorphous material, which increases crystallinity as experimentally
observed and numerically simulated. Hydrolysis of crystals occurs on the fold surfaces.
Concentration of non-degraded crystalline chains decreases, which leads to the increased
concentration of the hydrolyzed crystals and the reduced MW.
Simulation results of the species concentration in the laser melted layer are shown in Fig. 4.14(b).
Laser irradiation melts the crystal structure, generating an amorphous layer near the surface.
Amorphous chains are degraded to stages 1, 2, 3, and monomers in sequence. Because the
species are near the surface, the major part of monomers readily diffuses out of the sample and
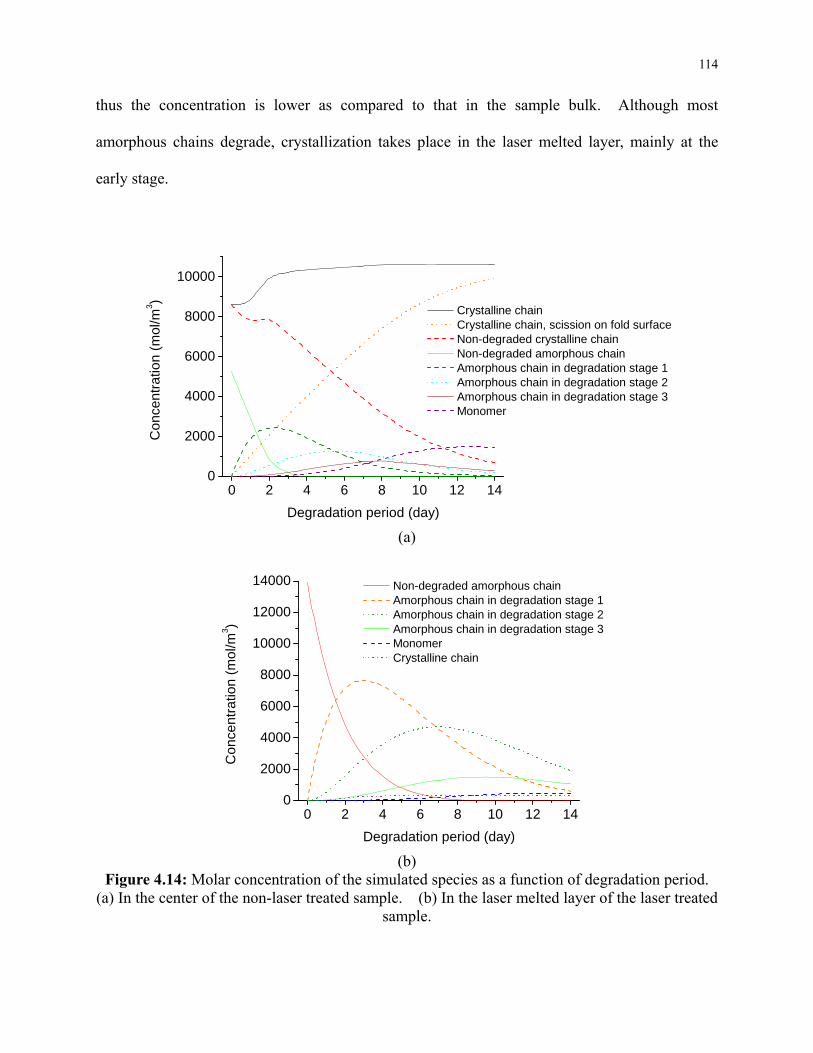
114
thus the concentration is lower as compared to that in the sample bulk. Although most
amorphous chains degrade, crystallization takes place in the laser melted layer, mainly at the
early stage.
0 2 4 6 8 10 12 140
2000
4000
6000
8000
10000
Co
nce
ntr
atio
n (
mo
l/m3 )
Degradation period (day)
Crystalline chain Crystalline chain, scission on fold surface Non-degraded crystalline chain Non-degraded amorphous chain Amorphous chain in degradation stage 1 Amorphous chain in degradation stage 2 Amorphous chain in degradation stage 3 Monomer
(a)
0 2 4 6 8 10 12 140
2000
4000
6000
8000
10000
12000
14000
Co
nce
ntr
atio
n (
mo
l/m3 )
Degradation period (day)
Non-degraded amorphous chain Amorphous chain in degradation stage 1 Amorphous chain in degradation stage 2 Amorphous chain in degradation stage 3 Monomer Crystalline chain
(b)
Figure 4.14: Molar concentration of the simulated species as a function of degradation period. (a) In the center of the non-laser treated sample. (b) In the laser melted layer of the laser treated
sample.
115
4.6 Conclusions
The effect of laser irradiation on PLLA biodegradation has been studied experimentally and
numerically. Excimer laser irradiation has been shown to melt the PLLA surface. The melted
layer showed lower crystallinity and no observable chemical changes according to WAXD and
XPS measurements. Optical micrographs taken during degradation testing show that
degradation initiates on the sample surface, and the melted layer allows for the accelerated initial
degradation as is also captured through numerical simulations. Laser treated samples
experience a faster initial MW reduction, which leads to a shorter induction period of mass loss
as observed from GPC. Heterogeneous degradation of PLLA samples caused by
inhomogeneous crystallinity is observed in both laser treated and non-laser treated samples from
bimodal distribution of MW from GPC measurements. Laser treated samples exhibited higher
crystallinity after degradation as a result of preferred degradation and higher chain mobility in
the amorphous phase, as confirmed from the WAXD measurements. Changes in MW, sample
mass, and species evolution during degradation are captured in simulation results of both laser
treated and non-laser treated samples. Laser modification to the crystallinity of PLLA has been
shown to reduce the degradation induction period, a desired property in drug delivery
applications.
116
Chapter 5: Effect of Drug Loading and Laser Surface Melting on Polymer Biodegradation
and Drug Release Profile
5.1 Introduction
Poly(lactic acid) (PLA) has been attracting wide attention due to its biocompatible and
biodegradable properties. PLA has been of interest in drug delivery applications because it
hydrolyzes in the human body into lactic acid, a product which is then excreted by the body with
no toxicity. In drug delivery applications, drug molecules are embedded in a polymer matrix
and released into the human body, with the release profile determined by polymer matrix
degradation. The advantages of using biodegradable polymers in a drug delivery system are
demonstrated by the controlled drug release profiles over time. With the controlled release, the
concentration of the released drug in the human body is stably maintained between the minimum
effective level and toxic level (Amass et al., 1998). The prolonged drug effective period also
reduces drug taking frequency and improves the life quality of patients.
Drug release profile is determined by the degradation of polymer matrix. In a physiological
environment, PLA degradation occurs via hydrolysis, in which water penetrates into the polymer
matrix, breaking the ester bonds and causing chain scission. Crystallinity affects PLA
hydrolysis, because water molecules readily penetrate into the amorphous region, while are
hardly accommodated in the crystalline region with highly packed and densely ordered structures
(Chu, 1981). A higher water concentration increases hydrolytic degradation rate. Therefore,
degradation rate of ester bonds is higher in the amorphous region, and disorientation of the
lamellae and disappearance of the crystal structure occur later (Tsuji & Ikada, 1998). The slow
degradation kinetics of crystalline PLA leads to an induction period of drug release, during
117
which the limited amount of drug is released. The induction period is undesirable because it
delays drug release and effectiveness. Since PLA degradation is a function of crystallinity, as
an attempt to shortening the induction period, laser irradiation has been conducted on the PLA
surface to reduce its crystallinity (Hsu et al., 2012a). It has been shown that with a reduced
surface crystallinity, PLA degrades at a higher initial rate and experiences a shorter time period
before occurrence of mass loss (Hsu et al., 2012b). The results demonstrate the potentiality to
shorten the induction period of drug release through laser crystallinity modification.
In addition to polymer crystallinity, drug release is also influenced by drug loading. Drugs are
typically small molecules. Blending of small molecules into polymer affects polymer
crystallinity and thermal properties, a process known as plasticization. Plasticization increases
chain mobility because the existence of small molecules renders extra free volume between
chains (Flory, 1940). From differential scanning calorimetry (DSC), the plasticized PLA has
been reported to have a reduced glass transition temperature (Tg) and melting temperature (Tm)
(Ljungberg & Wesslen, 2002; Xiao et al., 2009). The reduced Tg and Tm are a result of higher
chain mobility (Yeh et al., 2009). Chain mobility is a factor which affects PLA degradation and
therefore drug release. Plasticization also increases PLA crystallinity as compared to the
non-plasticized PLA, because mobile chains are easy to reorganize themselves to an ordered and
energetically stable state (Xiao et al., 2009; Yeh et al., 2009). PLA with higher crystallinity
exhibits a slower degradation, which in turn slows down drug release. The combined effects of
modified chain mobility and crystallinity by drug loading on drug release are not clear and
require further investigation.
Drug release can also be resulted from drug dissolution and diffusion, which leads to an initial
high release rate, known as the initial burst. One mechanism of initial burst is the rapid
118
dissolution of a large amount of drug molecules on the surface of polymer matrix (Lao et al.,
2009). The burst phenomenon is morphologically illustrated on the surface of drug loaded
polymer matrix before and after the immersion in release medium. Drug particles are observed
on the polymer surface before immersion. The particles are quickly dissolved into the release
medium after immersion, leaving behind a vacant space with no polymer molecules. The
released drug from the surface layer accounts for the initial burst. The vacant space can also
connect with each other, forming channels which allow for fast drug diffusion into the release
medium (Spenlehauer, 1988). At a higher drug loading concentration, channels formed by drug
release are more closely connected which facilitates drug diffusion. Drug release during the
initial burst has less correlation with polymer degradation. Water molecules will diffuse into
the vacant space. Since water concentration determines the rate of hydrolytic degradation,
water diffusion into the polymer matrix is expected to affect polymer degradation.
Accordingly, drug release from a polymer system is complicated by multiple factors, including
polymer crystallinity, polymer mobility, and the vacant space left behind after drug release.
Investigation of the combined effects is prerequisite to better control the drug release profiles.
By considering these combined effects, the objective of this work is to investigate the effects of
drug loading on polymer degradation and drug release, as well as the modification of drug
release profiles through laser surface melting. Polymer degradation is characterized by the
molecular weight of polymer matrix measured from the gel permeation chromatography (GPC).
Effect of drug loading on polymer matrix is characterized by its crystallinity and thermal
properties from the wide-angle X-ray diffraction (WAXD) and differential scanning calorimetry
(DSC). The amount of drug release in a release medium is determined by spectrophotometry.
A numerical model is developed to capture polymer degradation and drug release processes.
119
5.2 Background
5.2.1 Effect of Additives on Polymer Mobility
The addition of small molecules, such as drugs, into polymer matrices can plasticize the material.
Theories explaining polymer plasticization include the lubricity theory (Kirkpatrick, 1940) and
the gel theory (Aiken et al., 1947), while a more precise and widely accepted explanation is
provided by the free volume theory (Flory, 1940). The free volume can be divided into two
fractions: the free oscillation volume, which accounts for molecule oscillations and increases
slightly as the temperature rises below glass transition temperature (Tg), and the free
torsion-oscillation volume, which increases greatly with the temperature above Tg, as the
molecules have enough energy to move, bend, or rotate (Ueberreiter & Kanig, 1952). By
providing additional free volume, the introduction of plasticizer molecules into the polymer
matrix reduces viscosity and thus Tg. As the free volume theory predicts, the introduction of
plasticizers leads to more flexibility and easy molecule movement. When a small quantity of
plasticizer is added, the free volume is increased. Therefore, a new redistribution of the
configurations is allowed, which increases the number and size of polymer crystallites as well as
the overall crystallinity (Marcilla & Beltran, 2004).
5.2.2 Biodegradation of Polyester
PLA is a biodegradable polyester which hydrolyzes in the human body, leading to chain scission
at ester bonds. The hydrolysis reaction is given as follows.
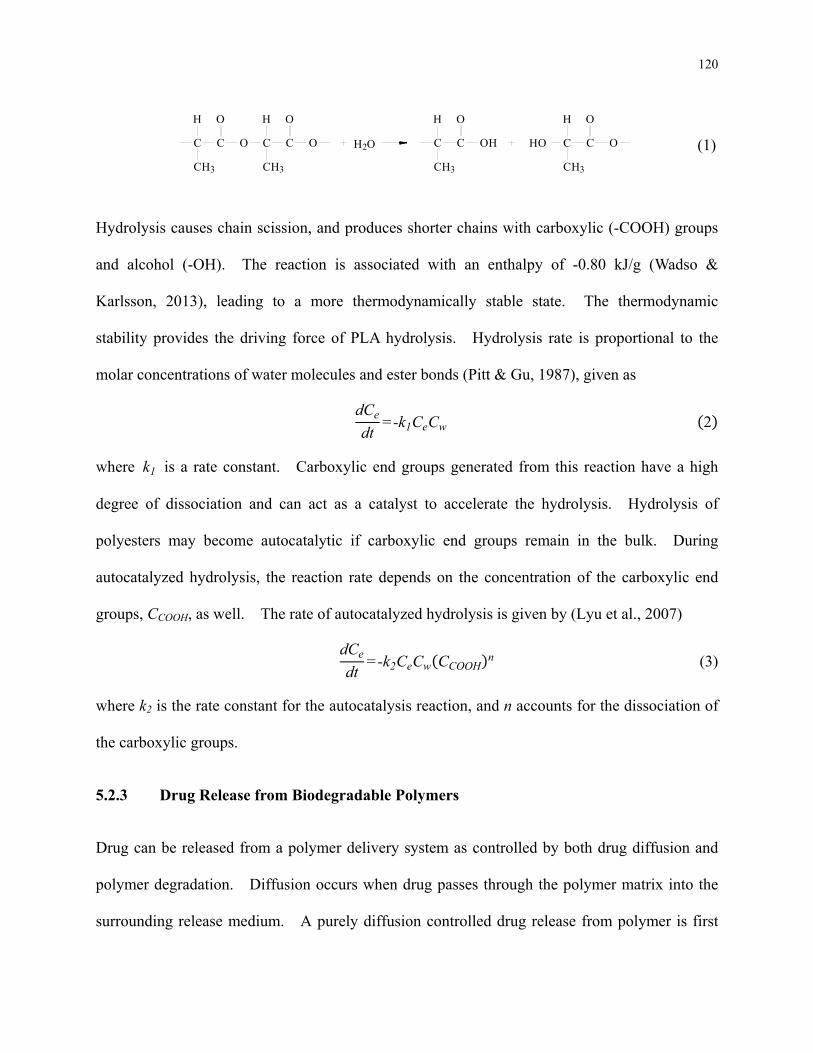
120
C C O C C O
H HO O
CH3 CH3
2OH C C
H O
CH3
OH HO C C O
H O
CH3
Hydrolysis causes chain scission, and produces shorter chains with carboxylic (-COOH) groups
and alcohol (-OH). The reaction is associated with an enthalpy of -0.80 kJ/g (Wadso &
Karlsson, 2013), leading to a more thermodynamically stable state. The thermodynamic
stability provides the driving force of PLA hydrolysis. Hydrolysis rate is proportional to the
molar concentrations of water molecules and ester bonds (Pitt & Gu, 1987), given as
dCe
dt=-k1CeCw 2
where k1 is a rate constant. Carboxylic end groups generated from this reaction have a high
degree of dissociation and can act as a catalyst to accelerate the hydrolysis. Hydrolysis of
polyesters may become autocatalytic if carboxylic end groups remain in the bulk. During
autocatalyzed hydrolysis, the reaction rate depends on the concentration of the carboxylic end
groups, CCOOH, as well. The rate of autocatalyzed hydrolysis is given by (Lyu et al., 2007)
dCe
dt=-k2CeCw CCOOH
n (3)
where k2 is the rate constant for the autocatalysis reaction, and n accounts for the dissociation of
the carboxylic groups.
5.2.3 Drug Release from Biodegradable Polymers
Drug can be released from a polymer delivery system as controlled by both drug diffusion and
polymer degradation. Diffusion occurs when drug passes through the polymer matrix into the
surrounding release medium. A purely diffusion controlled drug release from polymer is first
(1)
121
quantitatively considered in the Higuchi’s model (Higuchi, 1961). For the past decades, the
importance of polymer degradation on drug release has drawn increasing attention, and models
accounting for polymer degradation have been proposed to explain physical phenomena
observed experimentally. Based on model prediction and experimental data, drug release
profile is composed of up to four phases: initial burst, induction period, degradation controlled
release, and terminal release phase (Rothstein et al., 2008). Upon immersion into the release
medium, the polymer matrix begins to be hydrated by the surrounding liquid environment,
leading to the initial burst, phase 1. After phase 1, drug release is then controlled by polymer
degradation. Before polymer chains degrade into chain segments with molecular weights small
enough, drugs are held in the polymer matrix and cannot release, which accounts for the
induction period as demonstrated in phase 2. Once chain segments with small enough
molecular weights are formed, drugs can be released, as observed in phase 3. By the end of the
release period, release occurs at a reduced rate, phase 4. The reduced rate in phase 4 is a result
of the longer diffusion path length of the drug located in the bulk center, which is released in the
late stage.
5.3 Numerical Model
Simulation is developed to investigate the effect of drug loading and laser treatment on polymer
degradation and drug release profiles. Laser energy absorbed by semi-transparent bulk PLLA
generates heat and is governed by the heat equation
ρCp T∂T
∂t= · k T +q z,t
∂Hm
∂t (4)
where ρ is mass density, Cp T is specific heat as a function of temperature T, and k is
thermal conductivity. During laser heating, polymer experiences glass transition and melting.
122
Polymer glass transition is a second order transition, in which specific heat changes while no
latent heat is involved. Polymer melting is a first order transition, in which specific heat
changes and melting enthalpy is involved (Painter & Coleman, 1997). q(z,t) is the laser power
density as a function of depth z from the matrix surface and time t, expressed as
q z,t =Q0eαz+β
ttp
22
(5)
where Q0 is peak power density, α is absorption coefficient, tp is pulse width, and β is a
constant 4ln2.
The results of laser melting depth serve as the initial condition of the polymer degradation and
drug release model. The process of polymer degradation and drug release is captured with a
phenomenological model (Wang et al., 2008; Hsu et al., 2012b). During the polymer
degradation and drug release process, the PLLA matrix is modeled to be composed of 9 species:
non-degraded amorphous chains, degraded amorphous chains in stages 1, 2, and 3, crystalline
chains, degraded crystalline chains, monomers, water molecules, and drug molecules. Details
of the species of polymeric material generated during degradation process are given in Chap. 4
Degradation of amorphous chains and crystalline chains are considered separately. To consider
amorphous chain degradation, the concentration of the non-degraded amorphous chain is
expressed as
dC0
dt= 0C0Cw ε0C0CwCm
n κ0dCc
dt (6)
where C0 , Cc , and Cw are the molar concentrations of monomers in the non-degraded
amorphous chains, non-degraded crystalline chains, and water molecules, respectively. The
dissociation of the acid end groups n is assumed to be unity. Values of 0, ε0, and κ0 are the
123
corresponding phenomenological rate constants, accounting for non-autocatalysis, autocatalysis,
and crystallization due to hydrolysis of non-degraded amorphous chains. Degradation of
amorphous chains experiences three stages before monomers are generated (Stephens et al.,
2008), and thus the molar concentration of monomers in each degradation stage is expressed as
dCi
dt=(γi-1+εi-1Cm
n )Ci-1Cw (γi+εiCmn )CiCw κi
dCc
dt (7)
where i=1, 2, and 3, representing degradation stages 1, 2, and 3. Ci is the molar concentration
of the monomers in stage i. γi, ε , and κi are the phenomenological rate constants accounting
for non-autocatalysis, autocatalysis, and crystallization due to hydrolysis in stage i. Hydrolysis
of the stage 3 species generates monomers which do not connect to other monomers and have
high mobility to diffuse out of the polymer matrix. Assuming Fick’s second law for monomer
diffusion, which predicts the change of monomer concentration with space and time, the molar
concentration Cm of the monomers with high mobility is modeled by
dCm
dt= γ3+ε3Cm
n C3Cw+ ·(Dm,eff Cm) (8)
where Dm,eff is the effective monomer diffusivity as a function of matrix porosity induced by
degradation. The pores are defined as regions in a polymer matrix with a molecular weight low
enough to allow the embedded drug to release. Dm,eff is then expressed as
Dm,eff=Dmε(r,z,t) (9)
where Dm is the monomer diffusivity via pores, and ε(r,z,t) is the matrix porosity from 0 to 1.
Assuming the molecular weights which form the pores follow a normal distribution, ε(r,z,t) is
given as (Rothstein et al., 2009)
ε(r,z,t)=1-1
2erf
Mw(r,z,t)-Mwp
√2σ2+1 (10)
124
where σ2 accounts for the variation of degradation. Mw(r,z,t) is the molecular weight at
location (r,z) and time t. Mwp is the average molecular weight at which pores start to form,
allowing the diffusion of small molecules such as monomers and drug molecules.
Degradation of crystalline chains is assumed to be a one-step process, in which chain scission
only occurs on the fold surfaces of lamellae, generating the crystalline region composed of the
integral folds the crystalline chains. Crystal degradation is thus given as
dCc
dt= κ0+κi
dCc
dtγcCcCw εcCcCwCm
n (11)
where κ0+κi , γc , and εc are the phenomenological rate constants accounting for
crystallization of amorphous chains during their degradation, non-autocatalysis, and
autocatalysis of crystalline chains, respectively.
Drug concentration within a matrix during polymer degradation is as a function of space (r,z) and
time t, and is calculated from Fick’s second law as (Saltzman & Langer, 1989)
∂Cd(r,z,t)
∂t= (Dd,eff Cd) (12)
where Cd is the concentration of drug molecules, Dd,eff is the effective diffusivity accounting
for the porosity during polymer degradation and drug release period.
Drug molecules located in the layer below polymer matrix surface are subjected to initial burst
because of the contact with the release medium. Due to the connection of vacant space left
behind by the released drug, the layer accounting for initial burst is thicker for higher drug
loading concentration. It is assumed in the simulation that in the layer from the matrix surface
S to a depth of S‐dib, drug is subject to initial burst and the matrix porosity ε is unity. In the
bulk from matrix center to S‐dib, drug release is a function of porosity generated by polymer
125
degradation, such that
Dd,eff=Ddε(r,z,t) (13)
where Dd is drug diffusivity via pores, and ε(r,z,t) is the matrix porosity from 0 to 1 as
expressed in Eq. (10). Due to fast water diffusion into PLLA matrix as compared to the slow
PLLA hydrolysis kinetics (Lyu & Untereker, 2009), water concentration, Cw, is assumed to be
saturated over the degradation and drug release period, and loss of monomer and drug is
replaced by water molecules in simulation.
Eqs. (4) and (5) are solved to determine the laser melting depth. Solutions are used as the initial
conditions to solve the coupled Eqs. (6) to (11) to capture degradation profiles. Release of
embedded drug is simulated with Eqs. (12) and (13). Appropriate units are used for the
phenomenological rate constants so that concentration change is expressed in mole per volume
per time. The values of the rate constants are selected to capture experimental results. The
equations are solved through the finite element method in COMSOL Multiphysics 4.1. A 2D
axisymmetric model is used for the matrix with a diameter of 10 mm and thickness of 1 mm
experimentally tested. In the spatial domain, the 1 mm by 5 mm film is immersed in a 10 mm
by 10 mm aqueous medium. Laser treated area covers both sides of the film domain. The
film domain is initially composed of drug molecules, non-degraded crystalline and amorphous
chains with crystallinity determined experimentally. Monomers generated during degradation
can diffuse out of the film into the surrounding aqueous medium. The time domain in the
simulation corresponds to the experiment time span.
5.4 Materials and Methods
PLLA granules were provided by PURAC and used as received. Rhodamine B (RB) from
126
Sigma Aldrich is used as the model drug. To assure homogeneous drug loading, RB was loaded
into PLLA through solvent casting. 2 g PLLA granules were dissolved in 45 mL
dichloromethane from Sigma Aldrich by sonication for 1.5 hours. During sonication, 20, 100,
200, and 400 mg RB powder was dissolved in the PLLA solution to prepare 1 %, 5 %, 10 %, and
20 % drug loading concentrations, respectively. The drug loaded solution was cast in a covered
Petri dish, and left in a hood at 25°C for 72 hours for dichloromethane to vaporize. A solid
PLLA film with homogeneous drug loading is left behind. 100 mg of the film was thermally
compressed under 5.7×10⁴ Pa at 185°C for 1 hour, and cooled down in air. The cooling process
lasts for around 2 hours before room temperature is reached, allowing for polymer crystallization.
The obtained PLLA matrix has 1 mm thickness and 10 mm diameter. Sample crystallinity and
thermal properties were determined by WAXD and DSC measurements. The WAXD system is
equipped with monochromatic CuKα radiation with wavelength λ=0.15418 nm at 40 kV and 30
mA. For DSC measurement, fragment of matrix (around 5 mg) was heated from 50 to 200 °C
at a rate of 5°C/min under a nitrogen gas flow. To study the effect of laser treatment on
shortening the drug release induction period, the 1 %, 5 %, and 10 % drug loaded matrices were
treated on both sides by a KrF excimer laser with a 248 nm wavelength, 25 ns pulse width, and
3.0 J/cm2 fluence (Hsu et al., 2012b).
Drug release tests were conducted such that each sample was placed in a vial and fully immersed
in a 10 mL phosphate buffered saline (PBS) with a pH of 7.4. The drug release period lasts for
up to 84 days. Vials were placed in a water bath at 37°C to simulate body temperature, and the
PBS was changed every 7 days. The amount of released drug in the PBS was determined by
spectrophotometry, in which the absorbance of RB at 552 nm was recorded and is a function of
RB concentration. After drug release, samples were rinsed with distill water and dried in
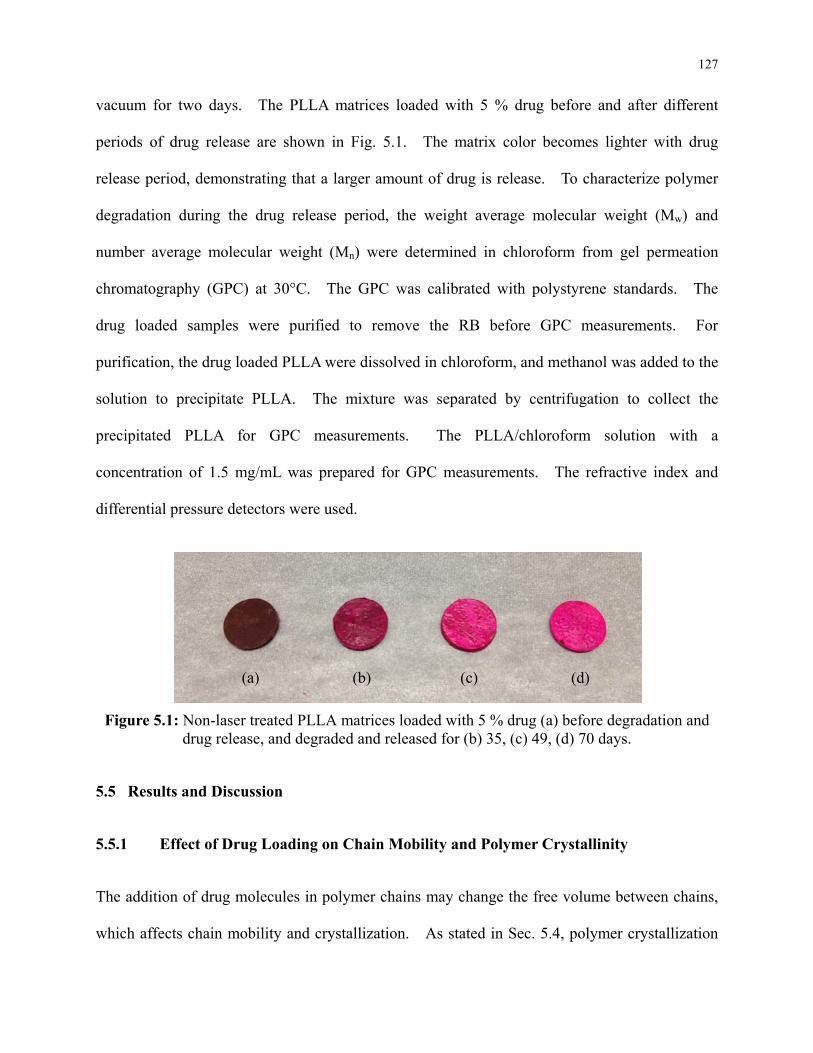
127
vacuum for two days. The PLLA matrices loaded with 5 % drug before and after different
periods of drug release are shown in Fig. 5.1. The matrix color becomes lighter with drug
release period, demonstrating that a larger amount of drug is release. To characterize polymer
degradation during the drug release period, the weight average molecular weight (Mw) and
number average molecular weight (Mn) were determined in chloroform from gel permeation
chromatography (GPC) at 30°C. The GPC was calibrated with polystyrene standards. The
drug loaded samples were purified to remove the RB before GPC measurements. For
purification, the drug loaded PLLA were dissolved in chloroform, and methanol was added to the
solution to precipitate PLLA. The mixture was separated by centrifugation to collect the
precipitated PLLA for GPC measurements. The PLLA/chloroform solution with a
concentration of 1.5 mg/mL was prepared for GPC measurements. The refractive index and
differential pressure detectors were used.
Figure 5.1: Non-laser treated PLLA matrices loaded with 5 % drug (a) before degradation and drug release, and degraded and released for (b) 35, (c) 49, (d) 70 days.
5.5 Results and Discussion
5.5.1 Effect of Drug Loading on Chain Mobility and Polymer Crystallinity
The addition of drug molecules in polymer chains may change the free volume between chains,
which affects chain mobility and crystallization. As stated in Sec. 5.4, polymer crystallization
(a) (b) (c) (d)
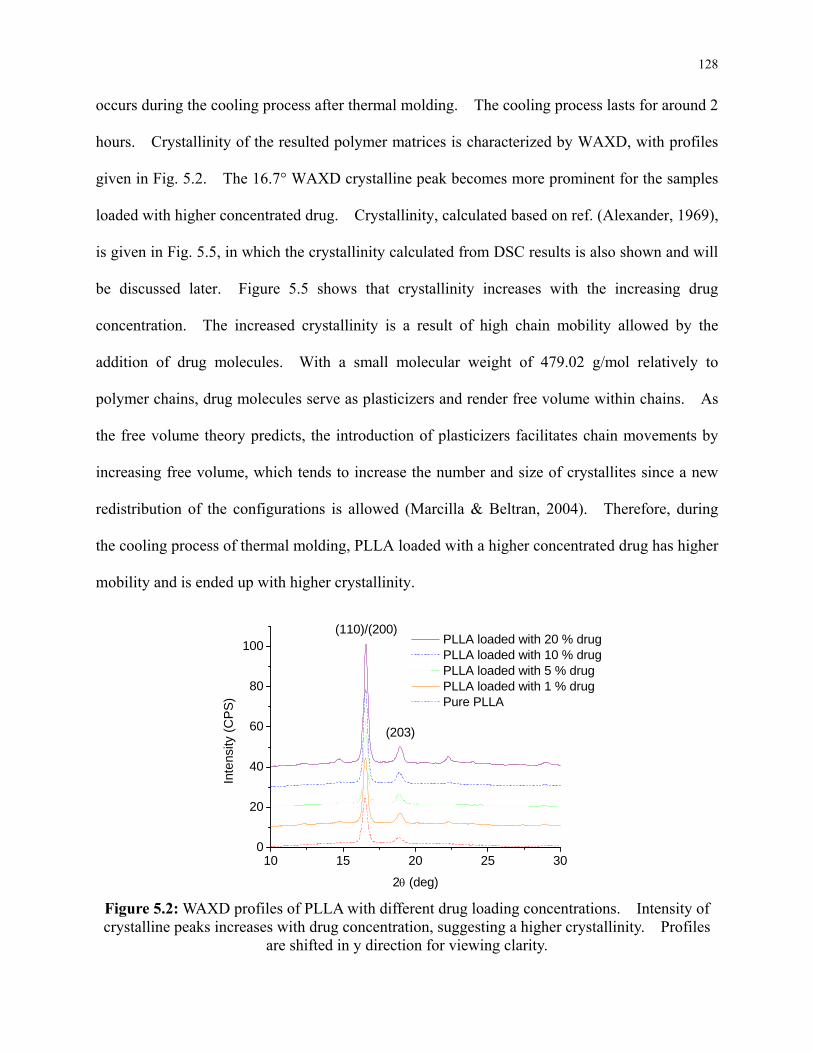
128
occurs during the cooling process after thermal molding. The cooling process lasts for around 2
hours. Crystallinity of the resulted polymer matrices is characterized by WAXD, with profiles
given in Fig. 5.2. The 16.7° WAXD crystalline peak becomes more prominent for the samples
loaded with higher concentrated drug. Crystallinity, calculated based on ref. (Alexander, 1969),
is given in Fig. 5.5, in which the crystallinity calculated from DSC results is also shown and will
be discussed later. Figure 5.5 shows that crystallinity increases with the increasing drug
concentration. The increased crystallinity is a result of high chain mobility allowed by the
addition of drug molecules. With a small molecular weight of 479.02 g/mol relatively to
polymer chains, drug molecules serve as plasticizers and render free volume within chains. As
the free volume theory predicts, the introduction of plasticizers facilitates chain movements by
increasing free volume, which tends to increase the number and size of crystallites since a new
redistribution of the configurations is allowed (Marcilla & Beltran, 2004). Therefore, during
the cooling process of thermal molding, PLLA loaded with a higher concentrated drug has higher
mobility and is ended up with higher crystallinity.
10 15 20 25 300
20
40
60
80
100(110)/(200)
Inte
nsity
(C
PS
)
2 (deg)
PLLA loaded with 20 % drug PLLA loaded with 10 % drug PLLA loaded with 5 % drug PLLA loaded with 1 % drug Pure PLLA
(203)
Figure 5.2: WAXD profiles of PLLA with different drug loading concentrations. Intensity of crystalline peaks increases with drug concentration, suggesting a higher crystallinity. Profiles
are shifted in y direction for viewing clarity.
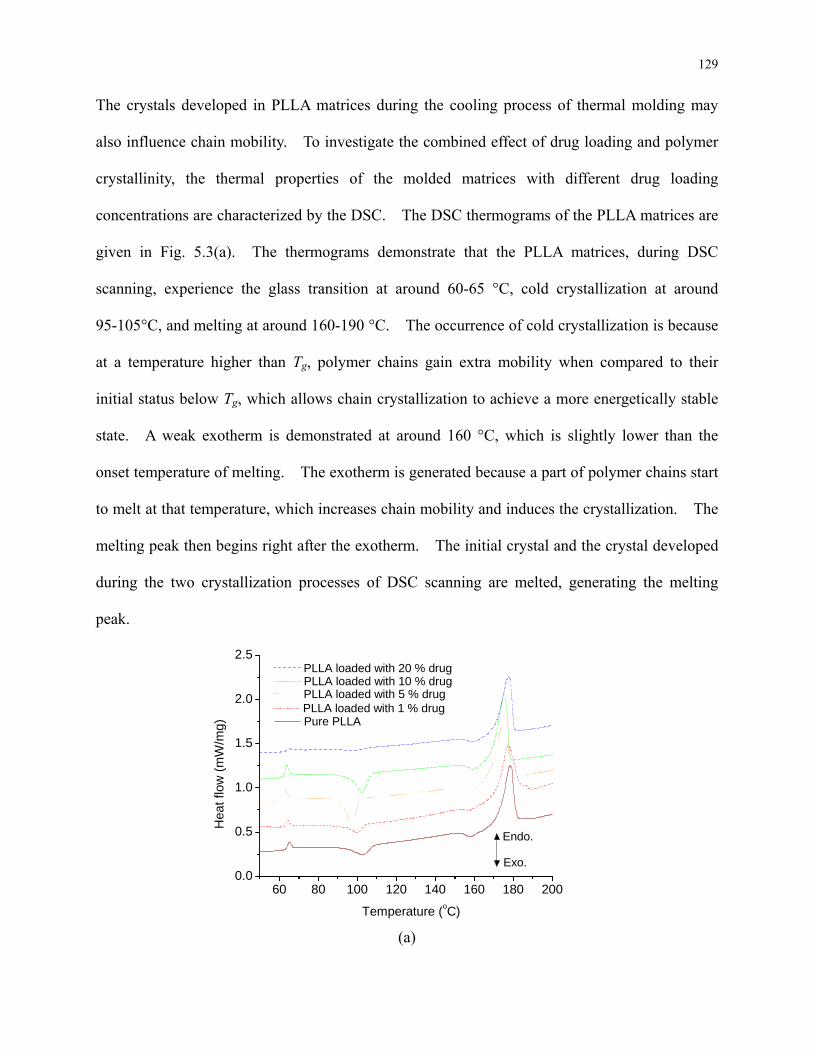
129
The crystals developed in PLLA matrices during the cooling process of thermal molding may
also influence chain mobility. To investigate the combined effect of drug loading and polymer
crystallinity, the thermal properties of the molded matrices with different drug loading
concentrations are characterized by the DSC. The DSC thermograms of the PLLA matrices are
given in Fig. 5.3(a). The thermograms demonstrate that the PLLA matrices, during DSC
scanning, experience the glass transition at around 60-65 °C, cold crystallization at around
95-105°C, and melting at around 160-190 °C. The occurrence of cold crystallization is because
at a temperature higher than Tg, polymer chains gain extra mobility when compared to their
initial status below Tg, which allows chain crystallization to achieve a more energetically stable
state. A weak exotherm is demonstrated at around 160 °C, which is slightly lower than the
onset temperature of melting. The exotherm is generated because a part of polymer chains start
to melt at that temperature, which increases chain mobility and induces the crystallization. The
melting peak then begins right after the exotherm. The initial crystal and the crystal developed
during the two crystallization processes of DSC scanning are melted, generating the melting
peak.
60 80 100 120 140 160 180 2000.0
0.5
1.0
1.5
2.0
2.5
Hea
t flo
w (
mW
/mg)
Temperature (oC)
Pure PLLA
PLLA loaded with 5 % drug PLLA loaded with 10 % drug PLLA loaded with 20 % drug
Exo.
PLLA loaded with 1 % drug
Endo.
(a)
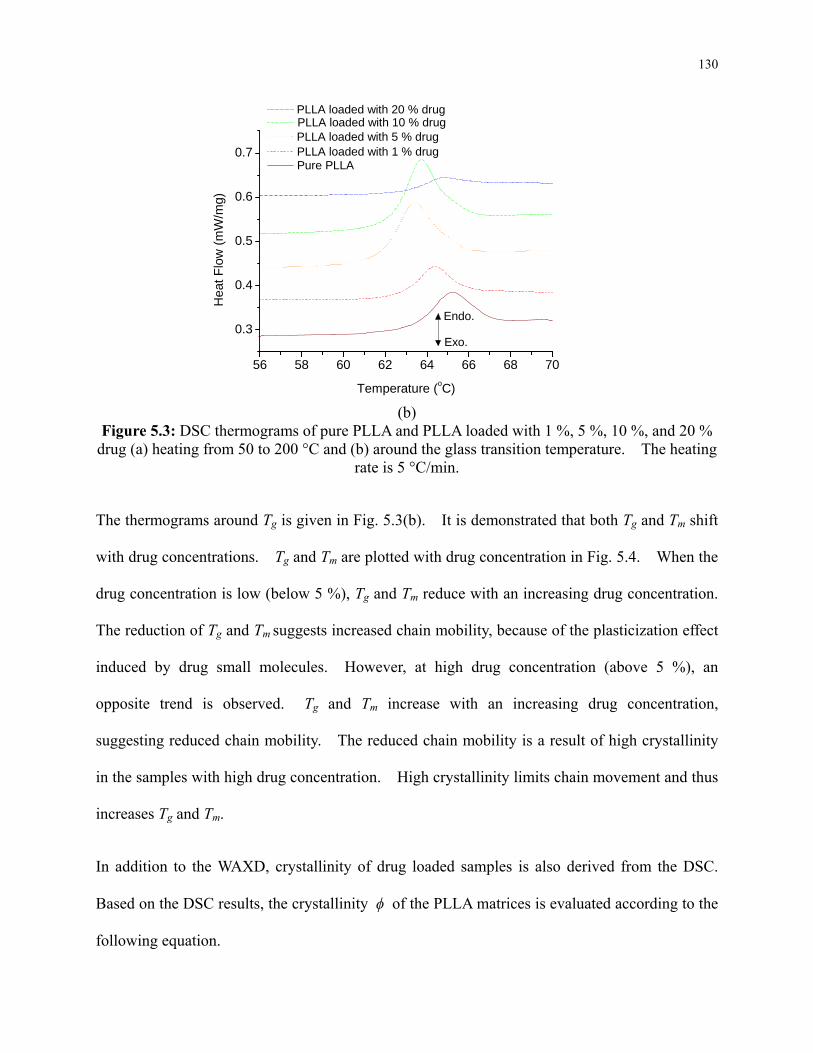
130
56 58 60 62 64 66 68 70
0.3
0.4
0.5
0.6
0.7
Hea
t F
low
(m
W/m
g)
Temperature (oC)
Pure PLLA PLLA loaded with 1 % drug PLLA loaded with 5 % drug
Endo.
Exo.
PLLA loaded with 10 % drug PLLA loaded with 20 % drug
(b)
Figure 5.3: DSC thermograms of pure PLLA and PLLA loaded with 1 %, 5 %, 10 %, and 20 % drug (a) heating from 50 to 200 °C and (b) around the glass transition temperature. The heating
rate is 5 °C/min.
The thermograms around Tg is given in Fig. 5.3(b). It is demonstrated that both Tg and Tm shift
with drug concentrations. Tg and Tm are plotted with drug concentration in Fig. 5.4. When the
drug concentration is low (below 5 %), Tg and Tm reduce with an increasing drug concentration.
The reduction of Tg and Tm suggests increased chain mobility, because of the plasticization effect
induced by drug small molecules. However, at high drug concentration (above 5 %), an
opposite trend is observed. Tg and Tm increase with an increasing drug concentration,
suggesting reduced chain mobility. The reduced chain mobility is a result of high crystallinity
in the samples with high drug concentration. High crystallinity limits chain movement and thus
increases Tg and Tm.
In addition to the WAXD, crystallinity of drug loaded samples is also derived from the DSC.
Based on the DSC results, the crystallinity ϕ of the PLLA matrices is evaluated according to the
following equation.
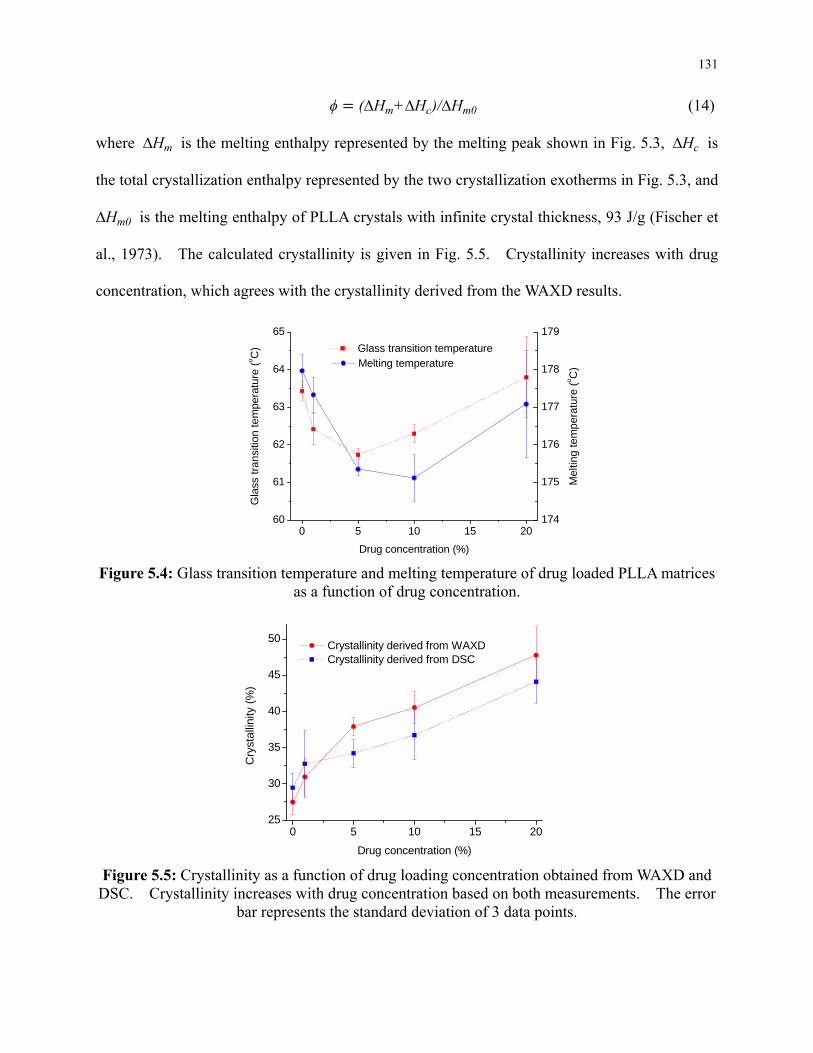
131
ϕ (∆Hm+∆Hc)/∆Hm0 (14)
where ∆Hm is the melting enthalpy represented by the melting peak shown in Fig. 5.3, ∆Hc is
the total crystallization enthalpy represented by the two crystallization exotherms in Fig. 5.3, and
∆Hm0 is the melting enthalpy of PLLA crystals with infinite crystal thickness, 93 J/g (Fischer et
al., 1973). The calculated crystallinity is given in Fig. 5.5. Crystallinity increases with drug
concentration, which agrees with the crystallinity derived from the WAXD results.
0 5 10 15 2060
61
62
63
64
65
Mel
ting
tem
per
atu
re (
o C)
Gla
ss t
ran
sitio
n te
mpe
ratu
re (
o C)
Drug concentration (%)
Glass transition temperature
174
175
176
177
178
179
Melting temperature
Figure 5.4: Glass transition temperature and melting temperature of drug loaded PLLA matrices
as a function of drug concentration.
0 5 10 15 2025
30
35
40
45
50
Cry
sta
llin
ity (
%)
Drug concentration (%)
Crystallinity derived from WAXD Crystallinity derived from DSC
Figure 5.5: Crystallinity as a function of drug loading concentration obtained from WAXD and
DSC. Crystallinity increases with drug concentration based on both measurements. The error bar represents the standard deviation of 3 data points.
132
5.5.2 Effect of Drug Concentration on Polymer Degradation and Drug Release
Drug loading affects polymer degradation and can affect resulted drug release profile over time.
The effect of drug loading concentration on polymer degradation and drug release profiles are
investigated. Crystallinity of PLLA matrix during the degradation and drug release period is
also recorded and discussed.
5.5.2.1 Polymer Degradation during Drug Release
The effect of drug loading concentration on polymer degradation is characterized by the
molecular weight through the GPC. GPC profiles of non-laser treated samples are given in Fig.
5.6 for pure PLLA and PLLA loaded with 1 % drug. The profiles give the information of
molecular weight distributions. Minor change of GPC profile is observed for the non-drug
loaded PLLA, suggesting insignificant degradation over time. On the other hand, the GPC
profiles of drug loaded PLLA shift left, demonstrating a decrease of molecular weight as a result
of degradation. Bimodal distributions can be observed at the late stage of degradation for the
drug loaded matrices. The occurrence of the bimodal distribution is because of the preferential
chain scission on the lamella fold surfaces, which generates integral folds of crystalline chains
and therefore a peak located at a lower molecular weight. The bimodal distribution is also
observed for non-drug loaded PLLA at a late stage under an accelerated degradation condition
previously reported in literature (Hsu et al., 2012b). For 5 %, 10 %, and 20 % drug loaded
PLLA, the GPC profiles also shift left with time and the bimodal distributions are observed.
The profiles shift left at a higher rate with a higher drug concentration, suggesting a faster
degradation.
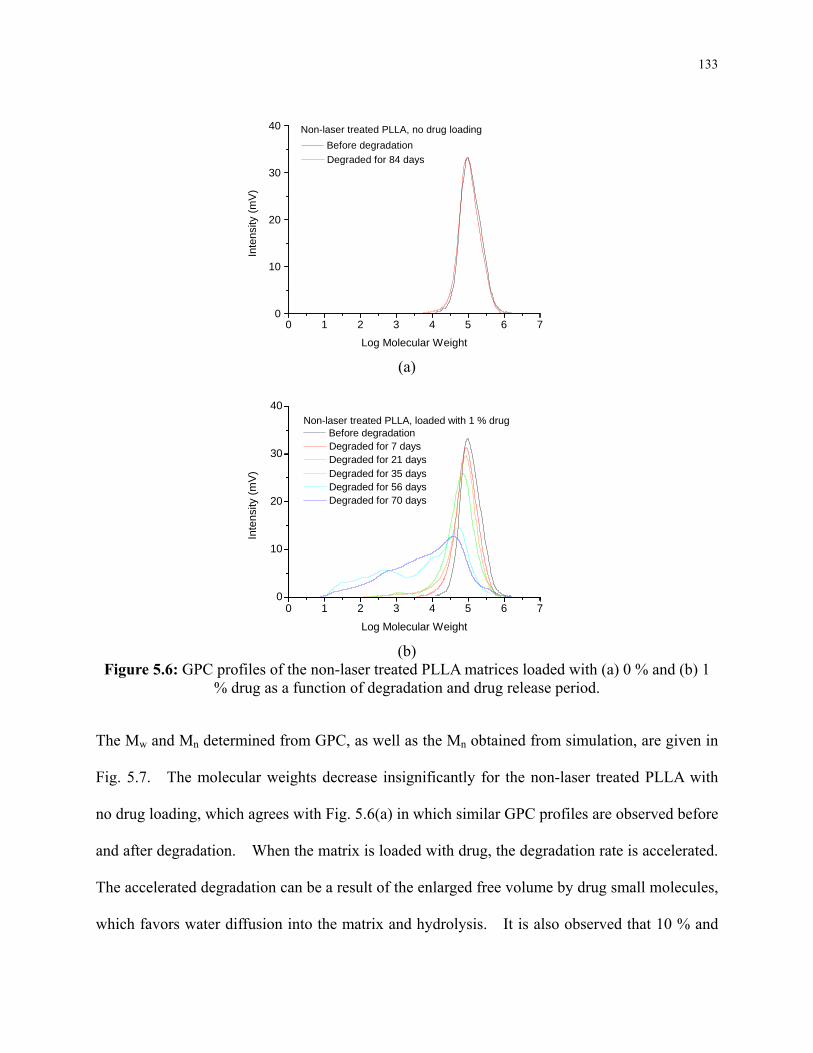
133
0 1 2 3 4 5 6 70
10
20
30
40
Inte
nsity
(m
V)
Log Molecular Weight
Before degradation
Non-laser treated PLLA, no drug loading
Degraded for 84 days
(a)
0 1 2 3 4 5 6 70
10
20
30
40
Inte
nsi
ty (
mV
)
Log Molecular Weight
Before degradationNon-laser treated PLLA, loaded with 1 % drug
Degraded for 7 days Degraded for 21 days Degraded for 35 days Degraded for 56 days Degraded for 70 days
(b)
Figure 5.6: GPC profiles of the non-laser treated PLLA matrices loaded with (a) 0 % and (b) 1 % drug as a function of degradation and drug release period.
The Mw and Mn determined from GPC, as well as the Mn obtained from simulation, are given in
Fig. 5.7. The molecular weights decrease insignificantly for the non-laser treated PLLA with
no drug loading, which agrees with Fig. 5.6(a) in which similar GPC profiles are observed before
and after degradation. When the matrix is loaded with drug, the degradation rate is accelerated.
The accelerated degradation can be a result of the enlarged free volume by drug small molecules,
which favors water diffusion into the matrix and hydrolysis. It is also observed that 10 % and
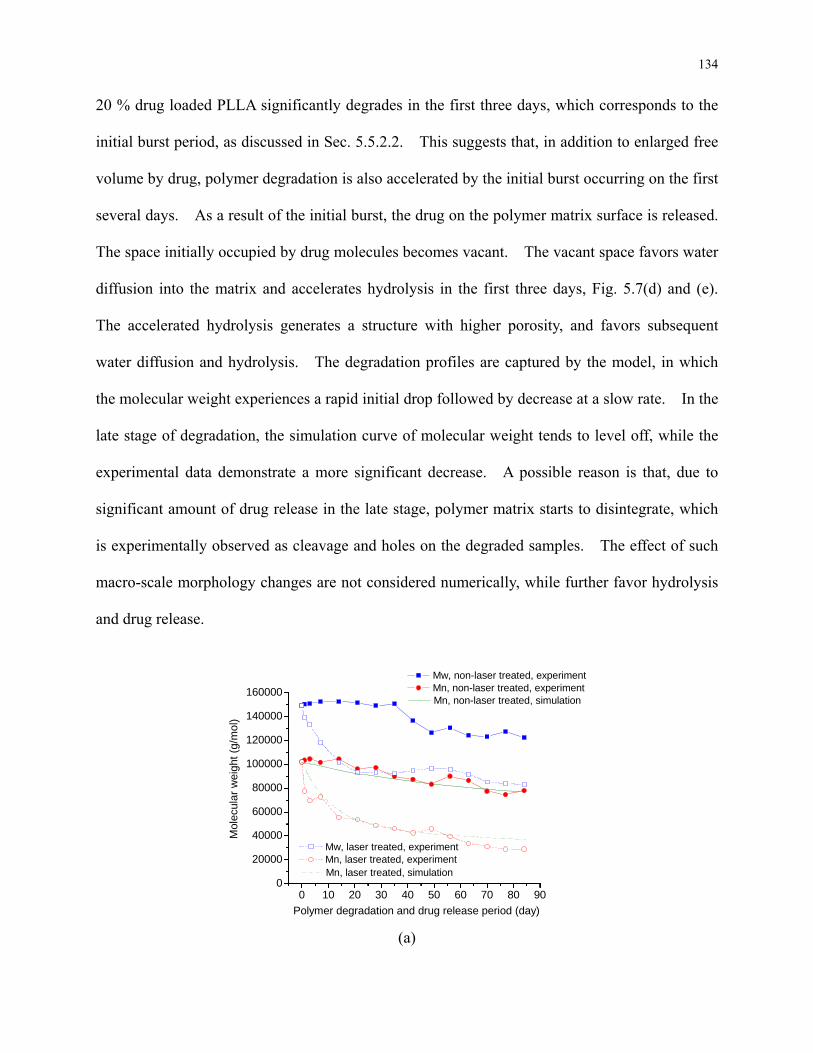
134
20 % drug loaded PLLA significantly degrades in the first three days, which corresponds to the
initial burst period, as discussed in Sec. 5.5.2.2. This suggests that, in addition to enlarged free
volume by drug, polymer degradation is also accelerated by the initial burst occurring on the first
several days. As a result of the initial burst, the drug on the polymer matrix surface is released.
The space initially occupied by drug molecules becomes vacant. The vacant space favors water
diffusion into the matrix and accelerates hydrolysis in the first three days, Fig. 5.7(d) and (e).
The accelerated hydrolysis generates a structure with higher porosity, and favors subsequent
water diffusion and hydrolysis. The degradation profiles are captured by the model, in which
the molecular weight experiences a rapid initial drop followed by decrease at a slow rate. In the
late stage of degradation, the simulation curve of molecular weight tends to level off, while the
experimental data demonstrate a more significant decrease. A possible reason is that, due to
significant amount of drug release in the late stage, polymer matrix starts to disintegrate, which
is experimentally observed as cleavage and holes on the degraded samples. The effect of such
macro-scale morphology changes are not considered numerically, while further favor hydrolysis
and drug release.
0 10 20 30 40 50 60 70 80 900
20000
40000
60000
80000
100000
120000
140000
160000
Mol
ecul
ar w
eig
ht (
g/m
ol)
Polymer degradation and drug release period (day)
Mw, non-laser treated, experiment Mn, non-laser treated, experiment
Mw, laser treated, experiment Mn, laser treated, experiment
Mn, non-laser treated, simulation
Mn, laser treated, simulation
(a)
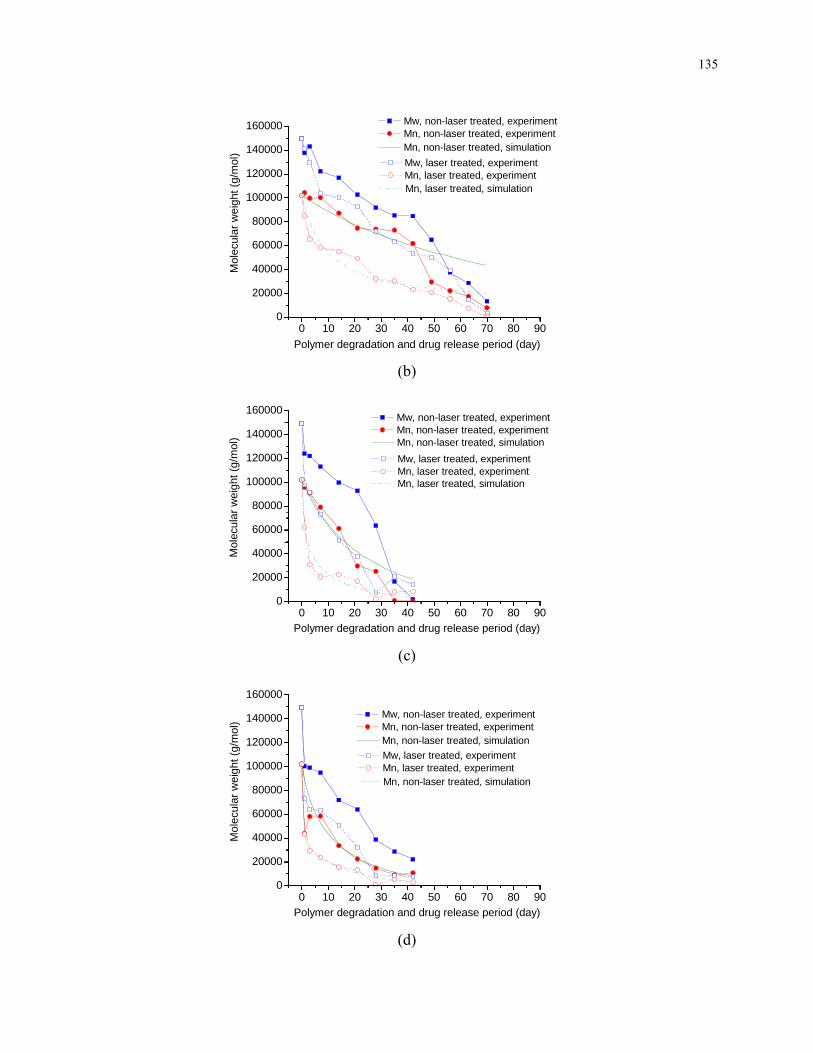
135
0 10 20 30 40 50 60 70 80 900
20000
40000
60000
80000
100000
120000
140000
160000
Polymer degradation and drug release period (day)
Mol
ecul
ar w
eigh
t (g
/mol
)
Mw, non-laser treated, experiment Mn, non-laser treated, experiment
Mw, laser treated, experiment Mn, laser treated, experiment
Mn, non-laser treated, simulation
Mn, laser treated, simulation
(b)
0 10 20 30 40 50 60 70 80 900
20000
40000
60000
80000
100000
120000
140000
160000
Mol
ecul
ar w
eigh
t (g
/mol
)
Polymer degradation and drug release period (day)
Mw, non-laser treated, experiment Mn, non-laser treated, experiment
Mw, laser treated, experiment Mn, laser treated, experiment
Mn, non-laser treated, simulation
Mn, laser treated, simulation
(c)
0 10 20 30 40 50 60 70 80 900
20000
40000
60000
80000
100000
120000
140000
160000
Mol
ecul
ar w
eigh
t (g
/mol
)
Polymer degradation and drug release period (day)
Mw, non-laser treated, experiment Mn, non-laser treated, experiment
Mw, laser treated, experiment Mn, laser treated, experiment
Mn, non-laser treated, simulation
Mn, non-laser treated, simulation
(d)
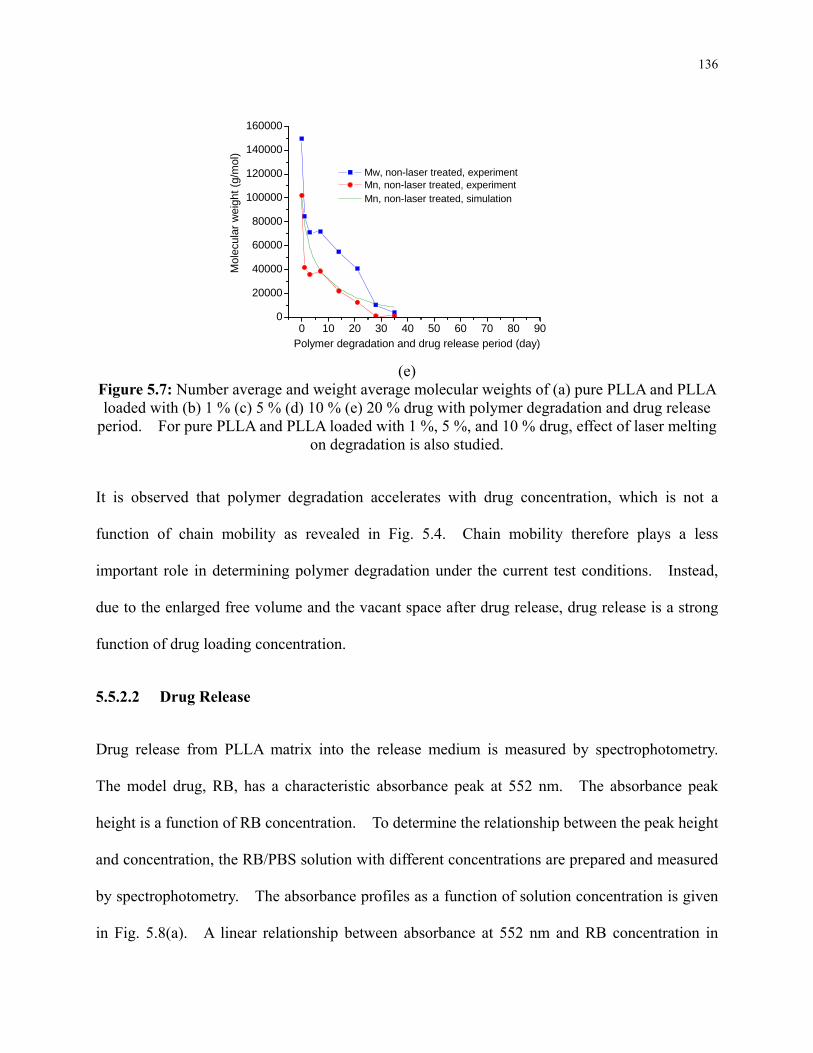
136
0 10 20 30 40 50 60 70 80 900
20000
40000
60000
80000
100000
120000
140000
160000
Mol
ecul
ar w
eigh
t (g
/mol
)
Polymer degradation and drug release period (day)
Mw, non-laser treated, experiment Mn, non-laser treated, experiment Mn, non-laser treated, simulation
(e)
Figure 5.7: Number average and weight average molecular weights of (a) pure PLLA and PLLA loaded with (b) 1 % (c) 5 % (d) 10 % (e) 20 % drug with polymer degradation and drug release
period. For pure PLLA and PLLA loaded with 1 %, 5 %, and 10 % drug, effect of laser melting on degradation is also studied.
It is observed that polymer degradation accelerates with drug concentration, which is not a
function of chain mobility as revealed in Fig. 5.4. Chain mobility therefore plays a less
important role in determining polymer degradation under the current test conditions. Instead,
due to the enlarged free volume and the vacant space after drug release, drug release is a strong
function of drug loading concentration.
5.5.2.2 Drug Release
Drug release from PLLA matrix into the release medium is measured by spectrophotometry.
The model drug, RB, has a characteristic absorbance peak at 552 nm. The absorbance peak
height is a function of RB concentration. To determine the relationship between the peak height
and concentration, the RB/PBS solution with different concentrations are prepared and measured
by spectrophotometry. The absorbance profiles as a function of solution concentration is given
in Fig. 5.8(a). A linear relationship between absorbance at 552 nm and RB concentration in
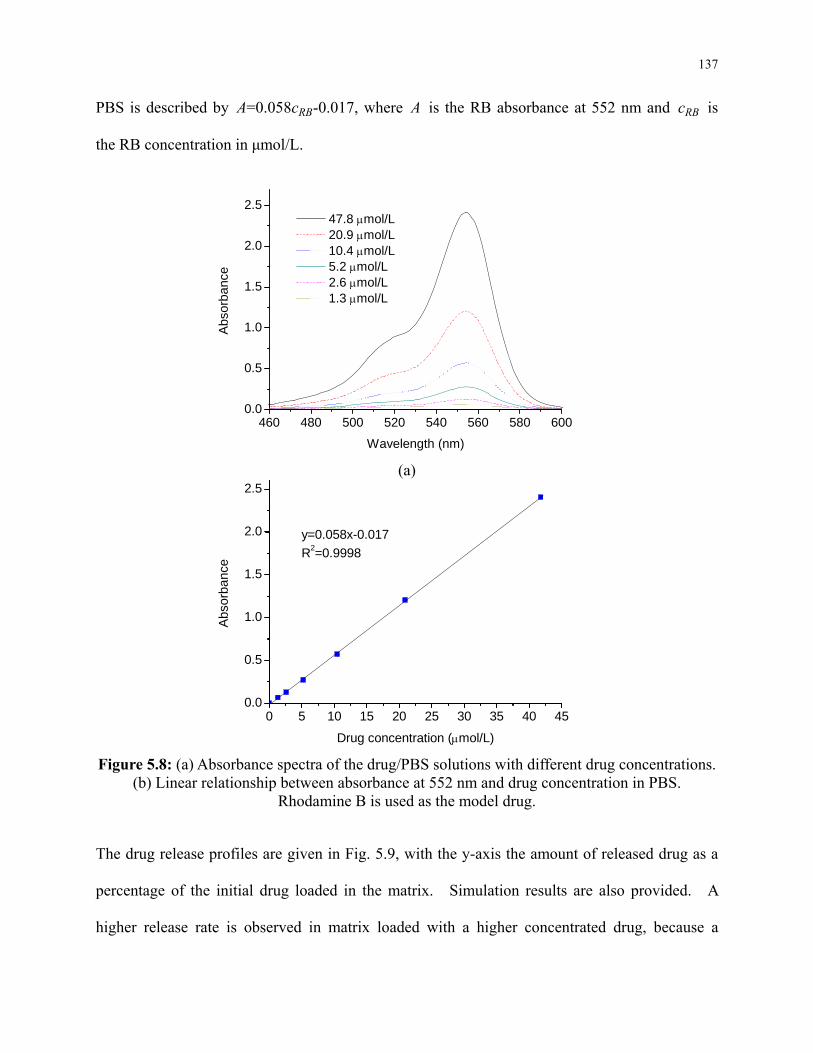
137
PBS is described by A=0.058cRB-0.017, where A is the RB absorbance at 552 nm and cRB is
the RB concentration in μmol/L.
460 480 500 520 540 560 580 6000.0
0.5
1.0
1.5
2.0
2.5
Abs
orba
nce
Wavelength (nm)
47.8 mol/L 20.9 mol/L 10.4 mol/L 5.2 mol/L 2.6 mol/L 1.3 mol/L
(a)
0 5 10 15 20 25 30 35 40 450.0
0.5
1.0
1.5
2.0
2.5
Abs
orba
nce
Drug concentration (mol/L)
y=0.058x-0.017
R2=0.9998
Figure 5.8: (a) Absorbance spectra of the drug/PBS solutions with different drug concentrations.
(b) Linear relationship between absorbance at 552 nm and drug concentration in PBS. Rhodamine B is used as the model drug.
The drug release profiles are given in Fig. 5.9, with the y-axis the amount of released drug as a
percentage of the initial drug loaded in the matrix. Simulation results are also provided. A
higher release rate is observed in matrix loaded with a higher concentrated drug, because a
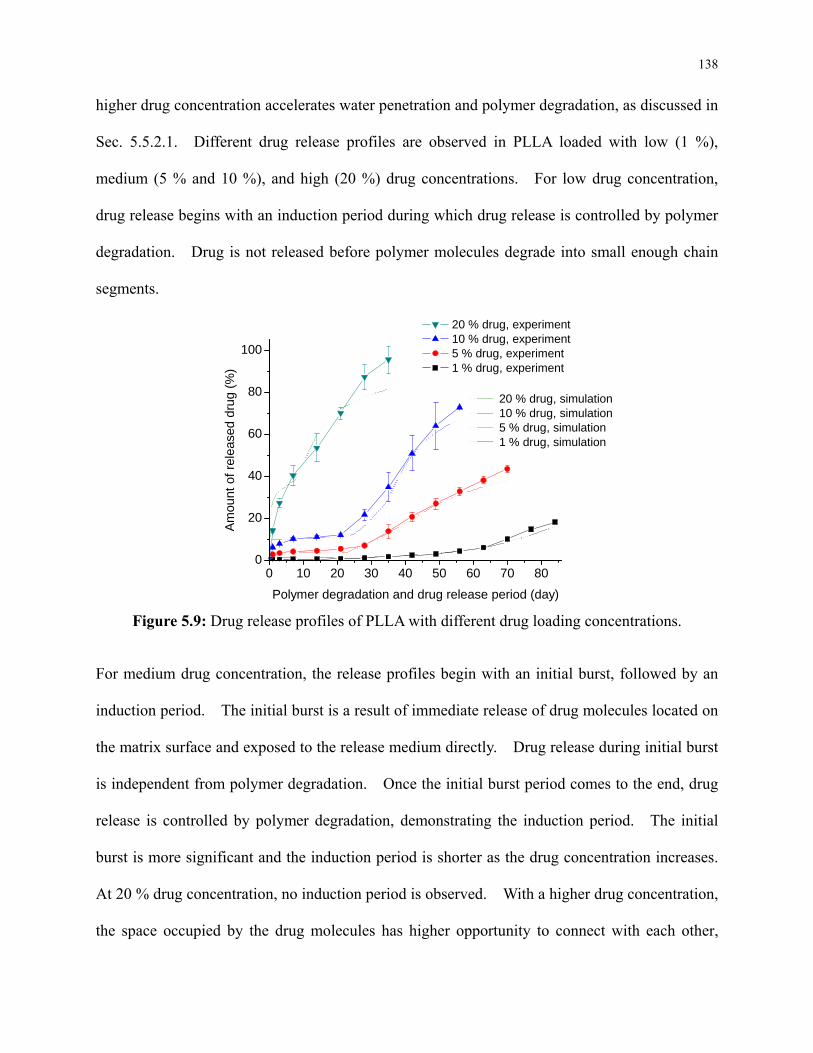
138
higher drug concentration accelerates water penetration and polymer degradation, as discussed in
Sec. 5.5.2.1. Different drug release profiles are observed in PLLA loaded with low (1 %),
medium (5 % and 10 %), and high (20 %) drug concentrations. For low drug concentration,
drug release begins with an induction period during which drug release is controlled by polymer
degradation. Drug is not released before polymer molecules degrade into small enough chain
segments.
0 10 20 30 40 50 60 70 800
20
40
60
80
100
Am
ount
of
rele
ased
dru
g (%
)
Polymer degradation and drug release period (day)
20 % drug, experiment 10 % drug, experiment 5 % drug, experiment 1 % drug, experiment
20 % drug, simulation 10 % drug, simulation 5 % drug, simulation 1 % drug, simulation
Figure 5.9: Drug release profiles of PLLA with different drug loading concentrations.
For medium drug concentration, the release profiles begin with an initial burst, followed by an
induction period. The initial burst is a result of immediate release of drug molecules located on
the matrix surface and exposed to the release medium directly. Drug release during initial burst
is independent from polymer degradation. Once the initial burst period comes to the end, drug
release is controlled by polymer degradation, demonstrating the induction period. The initial
burst is more significant and the induction period is shorter as the drug concentration increases.
At 20 % drug concentration, no induction period is observed. With a higher drug concentration,
the space occupied by the drug molecules has higher opportunity to connect with each other,
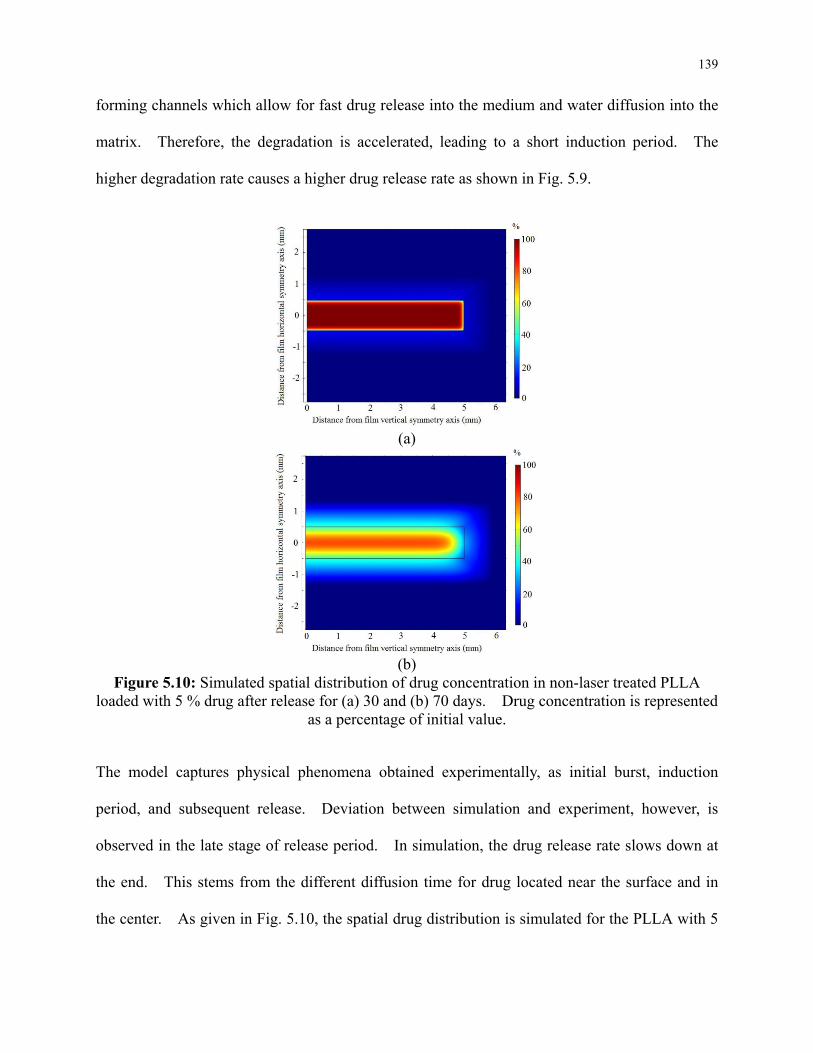
139
forming channels which allow for fast drug release into the medium and water diffusion into the
matrix. Therefore, the degradation is accelerated, leading to a short induction period. The
higher degradation rate causes a higher drug release rate as shown in Fig. 5.9.
(a)
(b)
Figure 5.10: Simulated spatial distribution of drug concentration in non-laser treated PLLA loaded with 5 % drug after release for (a) 30 and (b) 70 days. Drug concentration is represented
as a percentage of initial value.
The model captures physical phenomena obtained experimentally, as initial burst, induction
period, and subsequent release. Deviation between simulation and experiment, however, is
observed in the late stage of release period. In simulation, the drug release rate slows down at
the end. This stems from the different diffusion time for drug located near the surface and in
the center. As given in Fig. 5.10, the spatial drug distribution is simulated for the PLLA with 5
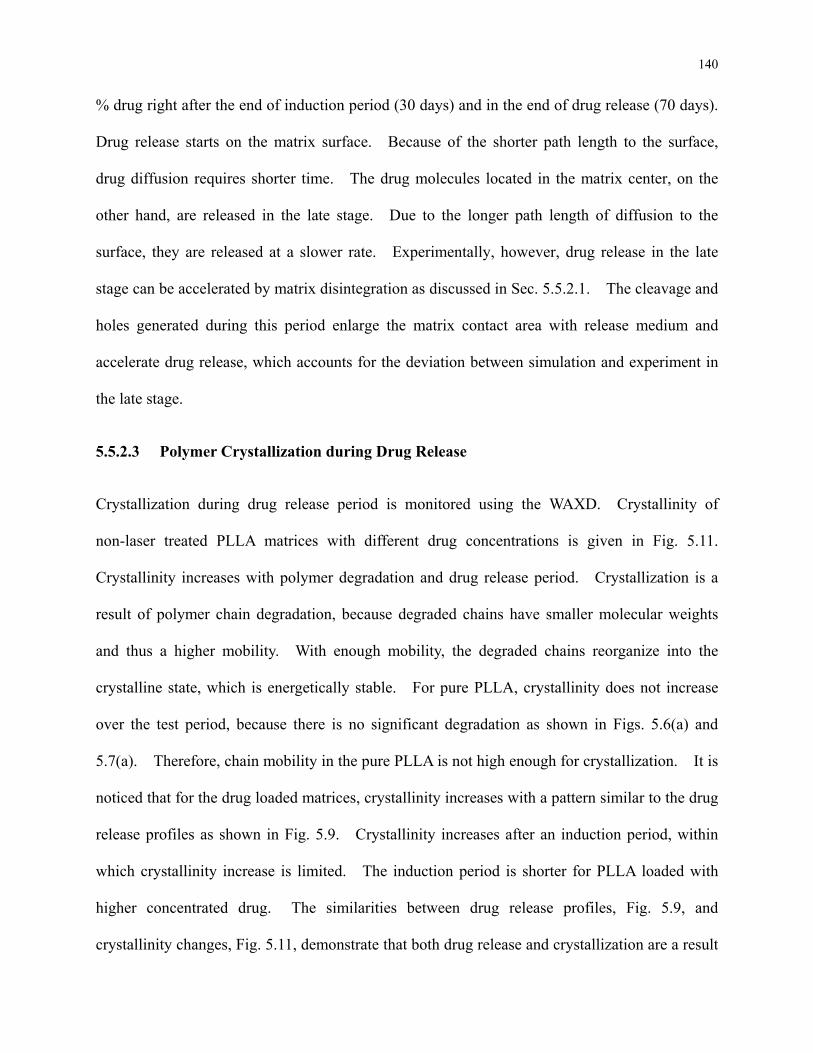
140
% drug right after the end of induction period (30 days) and in the end of drug release (70 days).
Drug release starts on the matrix surface. Because of the shorter path length to the surface,
drug diffusion requires shorter time. The drug molecules located in the matrix center, on the
other hand, are released in the late stage. Due to the longer path length of diffusion to the
surface, they are released at a slower rate. Experimentally, however, drug release in the late
stage can be accelerated by matrix disintegration as discussed in Sec. 5.5.2.1. The cleavage and
holes generated during this period enlarge the matrix contact area with release medium and
accelerate drug release, which accounts for the deviation between simulation and experiment in
the late stage.
5.5.2.3 Polymer Crystallization during Drug Release
Crystallization during drug release period is monitored using the WAXD. Crystallinity of
non-laser treated PLLA matrices with different drug concentrations is given in Fig. 5.11.
Crystallinity increases with polymer degradation and drug release period. Crystallization is a
result of polymer chain degradation, because degraded chains have smaller molecular weights
and thus a higher mobility. With enough mobility, the degraded chains reorganize into the
crystalline state, which is energetically stable. For pure PLLA, crystallinity does not increase
over the test period, because there is no significant degradation as shown in Figs. 5.6(a) and
5.7(a). Therefore, chain mobility in the pure PLLA is not high enough for crystallization. It is
noticed that for the drug loaded matrices, crystallinity increases with a pattern similar to the drug
release profiles as shown in Fig. 5.9. Crystallinity increases after an induction period, within
which crystallinity increase is limited. The induction period is shorter for PLLA loaded with
higher concentrated drug. The similarities between drug release profiles, Fig. 5.9, and
crystallinity changes, Fig. 5.11, demonstrate that both drug release and crystallization are a result
141
of polymer degradation. Polymer matrix with a reduced molecular weight has larger free
volume and higher chain mobility, which favor drug release and chain crystallization.
0 10 20 30 40 50 60 70 80
20
30
40
50
60
70
Cry
stal
linity
(%
)
Polymer degradation and drug release period (day)
20 % drug in non-laser treated PLLA 10 % drug in non-laser treated PLLA 5 % drug in non-laser treated PLLA 1 % drug in non-laser treated PLLA 0 % drug in non-laser treated PLLA
Figure 5.11: Crystallinity of non-laser treated PLLA loaded with 1 %, 5 %, 10 %, and 20 % drug
as a function of polymer degradation and drug release period.
Water can hardly penetrate into polymer crystalline region, and thus higher crystallinity can
reduce polymer degradation and retard drug release. However, based on Figs. 5.9 and 5.11,
polymer degradation and drug release do not slow down even the crystallinity increases. This is
because drug release and polymer degradation left behind a porous structure. The pores
accelerate water diffusion and hydrolytic degradation, even if the crystallinity increases. The
effect of higher crystallinity to slow down degradation and drug release is therefore canceled out
and does not dominate during the process.
It is also noticed that the crystallinity of drug loaded PLLA drops in the first three days of drug
release period. The drop may be due to the significant release of drug molecules as a result of
initial burst. A portion of drug molecules was initially trapped in the crystalline phase and held
142
the crystalline chains through the intermolecular force. The loss of drug molecules reduces the
intermolecular force between crystalline chains, and leads to less ordered chain packing.
5.5.3 Laser Modification of Polymer Degradation and Drug Release Profile
It has been shown in the previous section that at low drug concentrations (1 %, 5 % and 10 %),
drug release profile demonstrates an induction period during which the amount of drug release is
limited. The induction period is undesirable in drug delivery applications. During the
induction period, drug release is prohibited by the slow polymer degradation kinetics. Polymer
degradation is a function of crystallinity. Laser treatment is conducted to reduce polymer
surface crystallinity. The effect of laser treatment on polymer degradation and drug release is
investigated. Crystallinity of the laser treated PLLA matrix during degradation and drug release
period is also monitored and discussed.
5.5.3.1 Laser Modification of Polymer Crystallinity
Modification of polymer crystallinity by laser treatment is studied by WAXD with results shown
in Fig. 5.12. The crystalline peak is located at 16.7°. The height of crystalline peak reduces
for the laser treated samples, suggesting a reduced crystallinity due to laser treatment. The
calculated crystallinity based on ref. (Alexander, 1969) is given in Fig. 5.13 as a function of drug
concentration. As agreed with Fig. 5.12, crystallinity decreases after laser treatment. The
reduced crystallinity is a result of fast melting kinetics as compared to slow crystallization
kinetics of polymer. It is noticed that crystallinity decreases at a smaller extent for matrices
with higher drug concentrations. This can be due to the reason that the drug molecules have an
absorption peak near the laser wavelength, 248 nm. Part of laser energy is absorbed by the drug
molecules, and therefore less energy can penetrate into the matrix and melt the polymer.
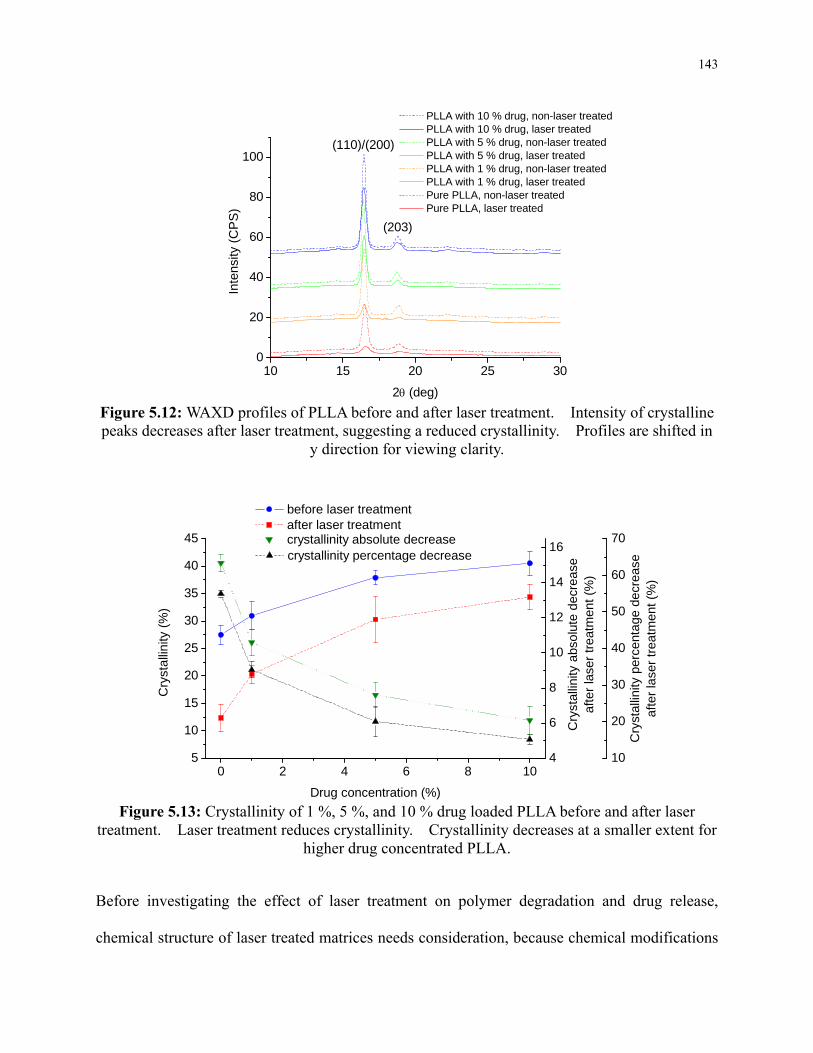
143
10 15 20 25 300
20
40
60
80
100
(203)
(110)/(200)
Inte
nsity
(C
PS
)
2 (deg)
PLLA with 10 % drug, non-laser treated PLLA with 10 % drug, laser treated PLLA with 5 % drug, non-laser treated PLLA with 5 % drug, laser treated PLLA with 1 % drug, non-laser treated PLLA with 1 % drug, laser treated Pure PLLA, non-laser treated Pure PLLA, laser treated
Figure 5.12: WAXD profiles of PLLA before and after laser treatment. Intensity of crystalline peaks decreases after laser treatment, suggesting a reduced crystallinity. Profiles are shifted in
y direction for viewing clarity.
0 2 4 6 8 105
10
15
20
25
30
35
40
45
Cry
stal
linity
abs
olu
te d
ecre
ase
afte
r la
ser
tre
atm
ent
(%)
Cry
stal
linity
pe
rcen
tage
de
crea
seaf
ter
lase
r tr
eatm
ent
(%)
Cry
stal
linity
(%
)
Drug concentration (%)
before laser treatment after laser treatment
10
20
30
40
50
60
70 crystallinity percentage decrease
4
6
8
10
12
14
16 crystallinity absolute decrease
Figure 5.13: Crystallinity of 1 %, 5 %, and 10 % drug loaded PLLA before and after laser
treatment. Laser treatment reduces crystallinity. Crystallinity decreases at a smaller extent for higher drug concentrated PLLA.
Before investigating the effect of laser treatment on polymer degradation and drug release,
chemical structure of laser treated matrices needs consideration, because chemical modifications
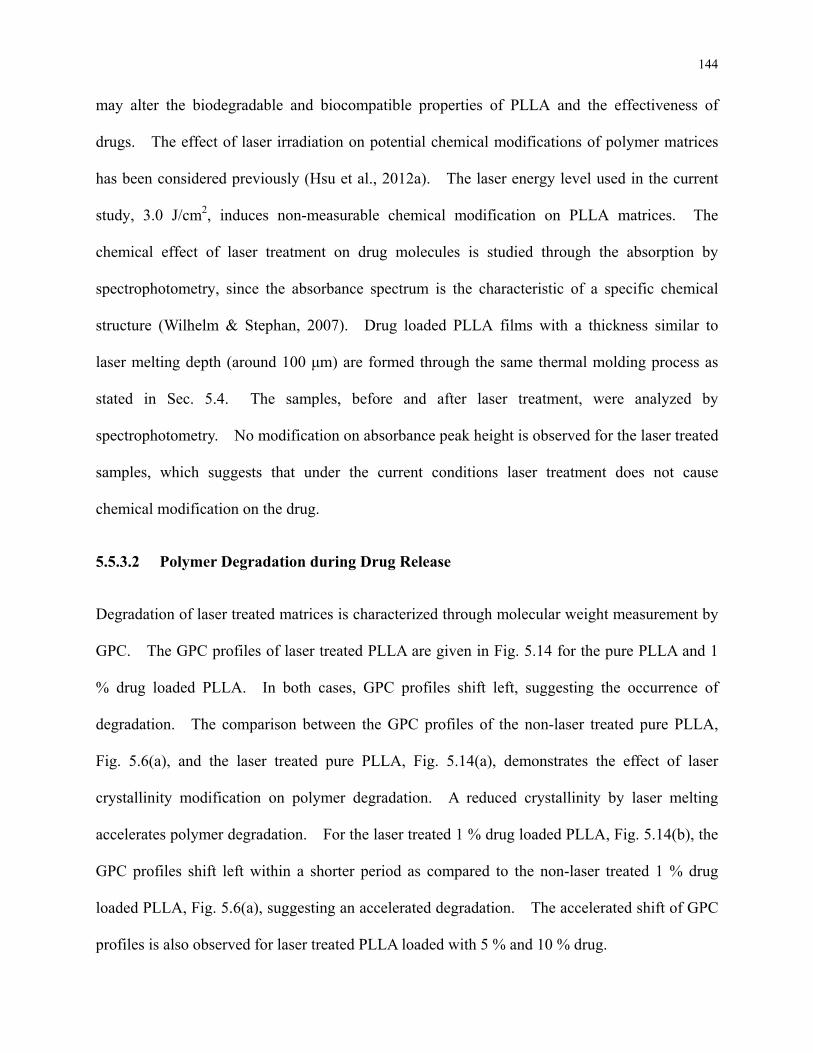
144
may alter the biodegradable and biocompatible properties of PLLA and the effectiveness of
drugs. The effect of laser irradiation on potential chemical modifications of polymer matrices
has been considered previously (Hsu et al., 2012a). The laser energy level used in the current
study, 3.0 J/cm2, induces non-measurable chemical modification on PLLA matrices. The
chemical effect of laser treatment on drug molecules is studied through the absorption by
spectrophotometry, since the absorbance spectrum is the characteristic of a specific chemical
structure (Wilhelm & Stephan, 2007). Drug loaded PLLA films with a thickness similar to
laser melting depth (around 100 μm) are formed through the same thermal molding process as
stated in Sec. 5.4. The samples, before and after laser treatment, were analyzed by
spectrophotometry. No modification on absorbance peak height is observed for the laser treated
samples, which suggests that under the current conditions laser treatment does not cause
chemical modification on the drug.
5.5.3.2 Polymer Degradation during Drug Release
Degradation of laser treated matrices is characterized through molecular weight measurement by
GPC. The GPC profiles of laser treated PLLA are given in Fig. 5.14 for the pure PLLA and 1
% drug loaded PLLA. In both cases, GPC profiles shift left, suggesting the occurrence of
degradation. The comparison between the GPC profiles of the non-laser treated pure PLLA,
Fig. 5.6(a), and the laser treated pure PLLA, Fig. 5.14(a), demonstrates the effect of laser
crystallinity modification on polymer degradation. A reduced crystallinity by laser melting
accelerates polymer degradation. For the laser treated 1 % drug loaded PLLA, Fig. 5.14(b), the
GPC profiles shift left within a shorter period as compared to the non-laser treated 1 % drug
loaded PLLA, Fig. 5.6(a), suggesting an accelerated degradation. The accelerated shift of GPC
profiles is also observed for laser treated PLLA loaded with 5 % and 10 % drug.
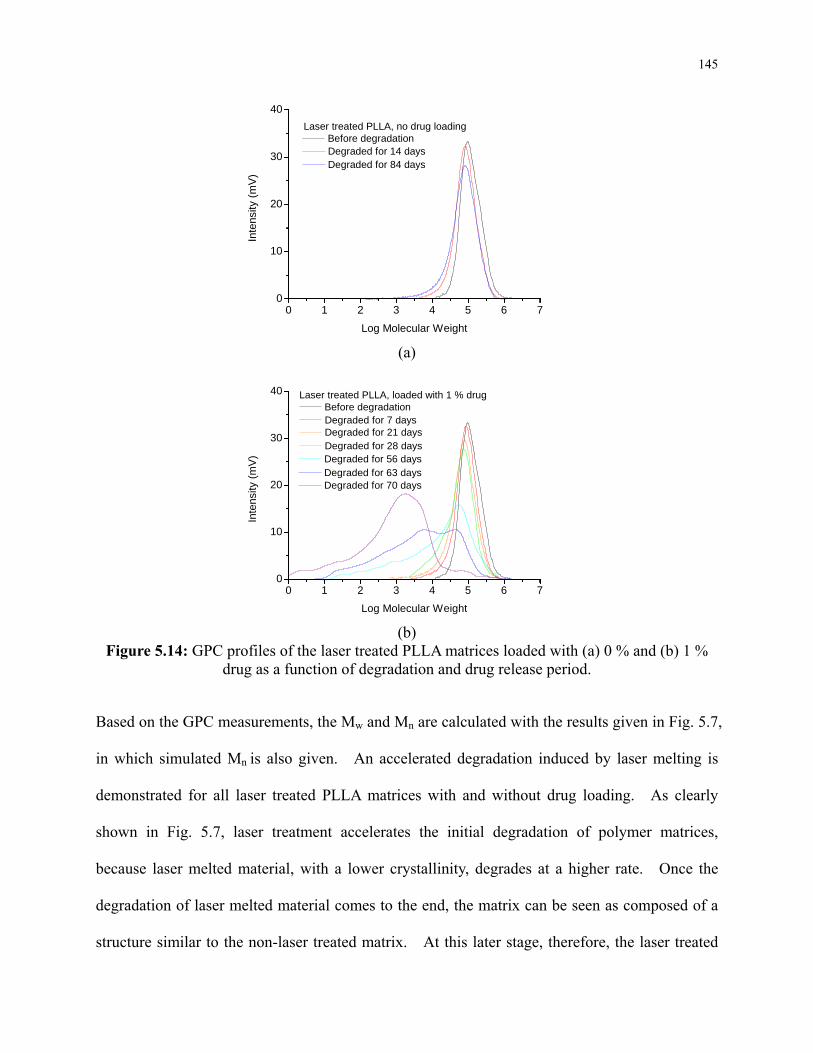
145
0 1 2 3 4 5 6 70
10
20
30
40
Laser treated PLLA, no drug loading
Inte
nsity
(m
V)
Log Molecular Weight
Before degradation Degraded for 14 days Degraded for 84 days
(a)
0 1 2 3 4 5 6 70
10
20
30
40 Laser treated PLLA, loaded with 1 % drug
Inte
nsity
(m
V)
Log Molecular Weight
Before degradation Degraded for 7 days Degraded for 21 days Degraded for 28 days Degraded for 56 days Degraded for 63 days Degraded for 70 days
(b)
Figure 5.14: GPC profiles of the laser treated PLLA matrices loaded with (a) 0 % and (b) 1 % drug as a function of degradation and drug release period.
Based on the GPC measurements, the Mw and Mn are calculated with the results given in Fig. 5.7,
in which simulated Mn is also given. An accelerated degradation induced by laser melting is
demonstrated for all laser treated PLLA matrices with and without drug loading. As clearly
shown in Fig. 5.7, laser treatment accelerates the initial degradation of polymer matrices,
because laser melted material, with a lower crystallinity, degrades at a higher rate. Once the
degradation of laser melted material comes to the end, the matrix can be seen as composed of a
structure similar to the non-laser treated matrix. At this later stage, therefore, the laser treated
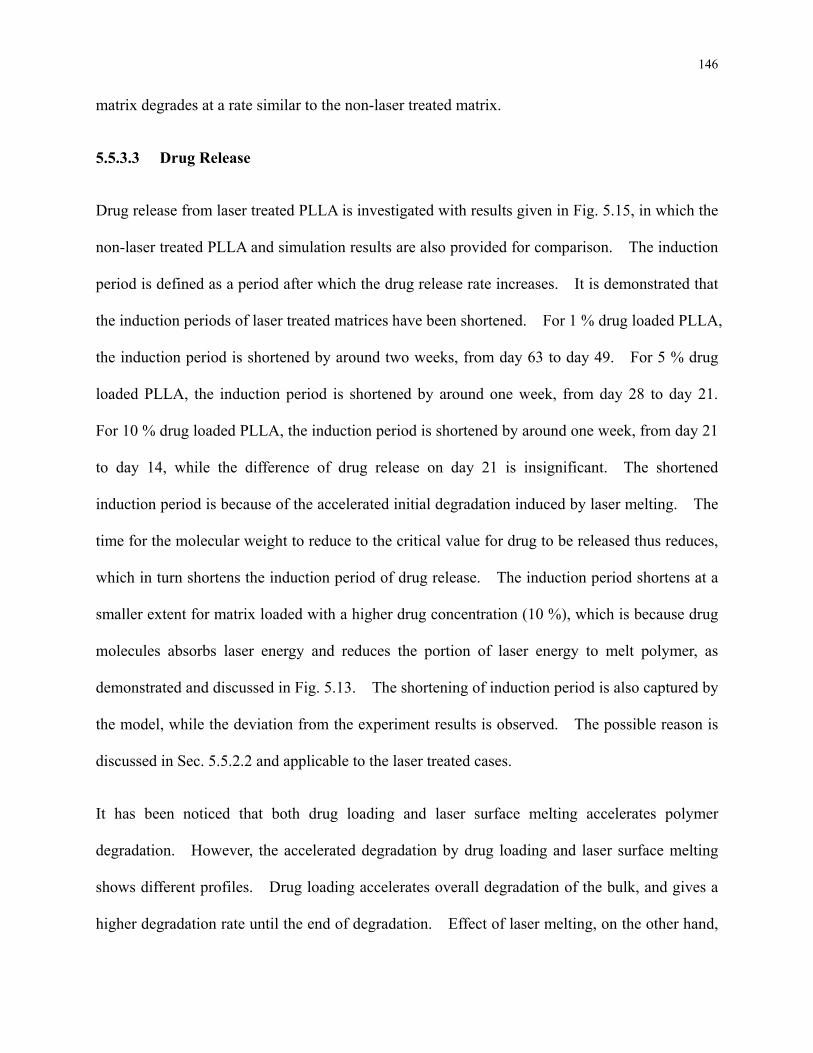
146
matrix degrades at a rate similar to the non-laser treated matrix.
5.5.3.3 Drug Release
Drug release from laser treated PLLA is investigated with results given in Fig. 5.15, in which the
non-laser treated PLLA and simulation results are also provided for comparison. The induction
period is defined as a period after which the drug release rate increases. It is demonstrated that
the induction periods of laser treated matrices have been shortened. For 1 % drug loaded PLLA,
the induction period is shortened by around two weeks, from day 63 to day 49. For 5 % drug
loaded PLLA, the induction period is shortened by around one week, from day 28 to day 21.
For 10 % drug loaded PLLA, the induction period is shortened by around one week, from day 21
to day 14, while the difference of drug release on day 21 is insignificant. The shortened
induction period is because of the accelerated initial degradation induced by laser melting. The
time for the molecular weight to reduce to the critical value for drug to be released thus reduces,
which in turn shortens the induction period of drug release. The induction period shortens at a
smaller extent for matrix loaded with a higher drug concentration (10 %), which is because drug
molecules absorbs laser energy and reduces the portion of laser energy to melt polymer, as
demonstrated and discussed in Fig. 5.13. The shortening of induction period is also captured by
the model, while the deviation from the experiment results is observed. The possible reason is
discussed in Sec. 5.5.2.2 and applicable to the laser treated cases.
It has been noticed that both drug loading and laser surface melting accelerates polymer
degradation. However, the accelerated degradation by drug loading and laser surface melting
shows different profiles. Drug loading accelerates overall degradation of the bulk, and gives a
higher degradation rate until the end of degradation. Effect of laser melting, on the other hand,
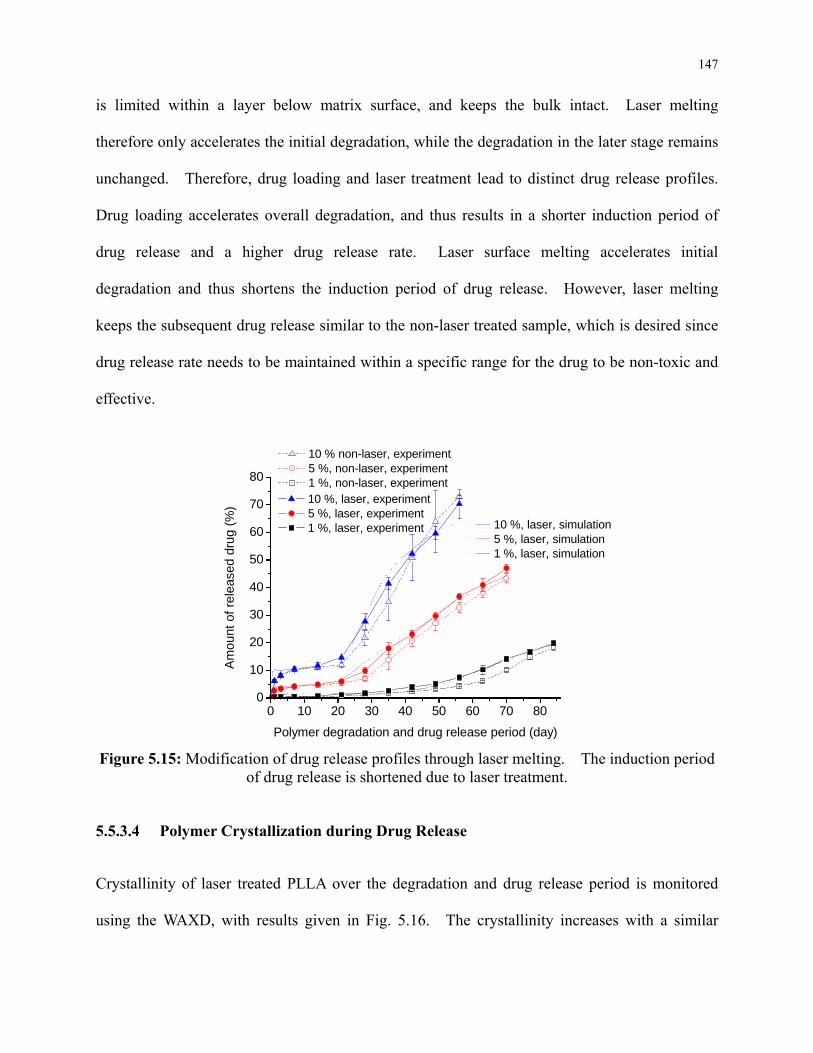
147
is limited within a layer below matrix surface, and keeps the bulk intact. Laser melting
therefore only accelerates the initial degradation, while the degradation in the later stage remains
unchanged. Therefore, drug loading and laser treatment lead to distinct drug release profiles.
Drug loading accelerates overall degradation, and thus results in a shorter induction period of
drug release and a higher drug release rate. Laser surface melting accelerates initial
degradation and thus shortens the induction period of drug release. However, laser melting
keeps the subsequent drug release similar to the non-laser treated sample, which is desired since
drug release rate needs to be maintained within a specific range for the drug to be non-toxic and
effective.
0 10 20 30 40 50 60 70 800
10
20
30
40
50
60
70
80
Am
oun
t of
rel
ease
d dr
ug (
%)
Polymer degradation and drug release period (day)
10 % non-laser, experiment 5 %, non-laser, experiment 1 %, non-laser, experiment 10 %, laser, experiment 5 %, laser, experiment 1 %, laser, experiment 10 %, laser, simulation
5 %, laser, simulation 1 %, laser, simulation
Figure 5.15: Modification of drug release profiles through laser melting. The induction period
of drug release is shortened due to laser treatment.
5.5.3.4 Polymer Crystallization during Drug Release
Crystallinity of laser treated PLLA over the degradation and drug release period is monitored
using the WAXD, with results given in Fig. 5.16. The crystallinity increases with a similar
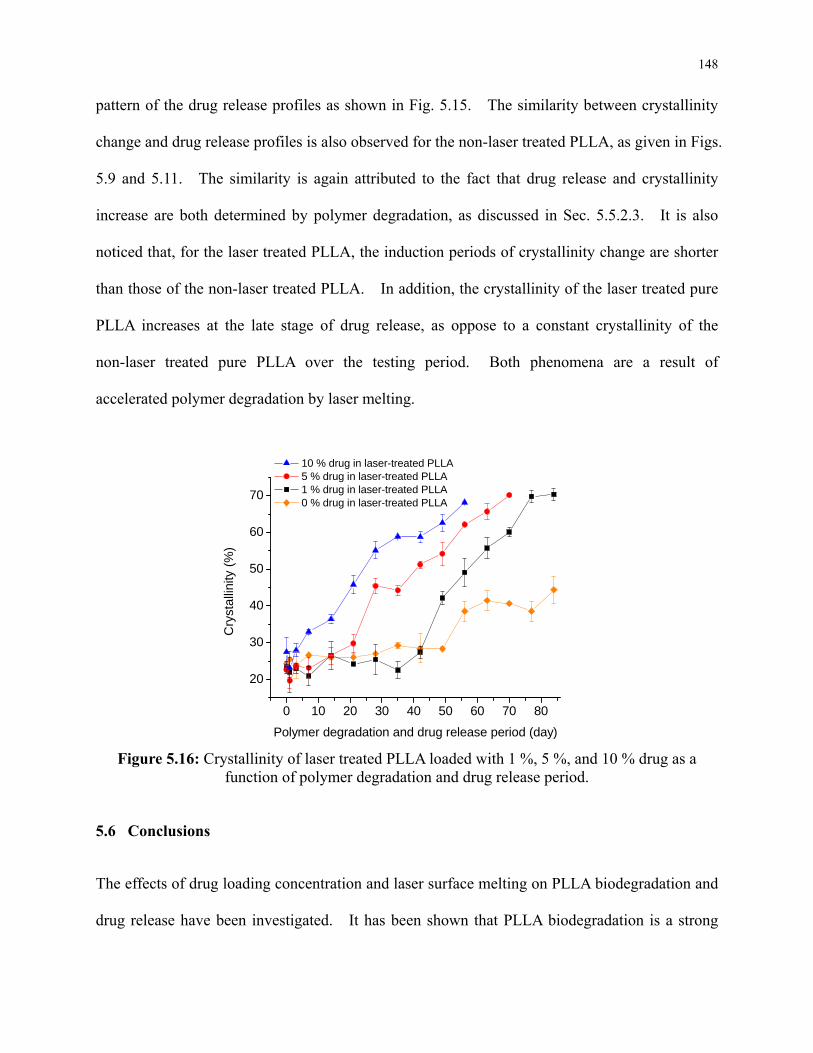
148
pattern of the drug release profiles as shown in Fig. 5.15. The similarity between crystallinity
change and drug release profiles is also observed for the non-laser treated PLLA, as given in Figs.
5.9 and 5.11. The similarity is again attributed to the fact that drug release and crystallinity
increase are both determined by polymer degradation, as discussed in Sec. 5.5.2.3. It is also
noticed that, for the laser treated PLLA, the induction periods of crystallinity change are shorter
than those of the non-laser treated PLLA. In addition, the crystallinity of the laser treated pure
PLLA increases at the late stage of drug release, as oppose to a constant crystallinity of the
non-laser treated pure PLLA over the testing period. Both phenomena are a result of
accelerated polymer degradation by laser melting.
0 10 20 30 40 50 60 70 80
20
30
40
50
60
70
Cry
stal
linity
(%
)
Polymer degradation and drug release period (day)
10 % drug in laser-treated PLLA 5 % drug in laser-treated PLLA 1 % drug in laser-treated PLLA 0 % drug in laser-treated PLLA
Figure 5.16: Crystallinity of laser treated PLLA loaded with 1 %, 5 %, and 10 % drug as a
function of polymer degradation and drug release period.
5.6 Conclusions
The effects of drug loading concentration and laser surface melting on PLLA biodegradation and
drug release have been investigated. It has been shown that PLLA biodegradation is a strong
149
function of drug loading, with a higher drug concentration leading to faster degradation. The
accelerated biodegradation caused by drug loading is attributed to the porous structure in the
polymer matrix after drug release. The porous structure favors water diffusion into the matrix
and accelerates hydrolytic degradation. The accelerated biodegradation reduces the induction
period of drug release and increases the drug release rate. Drug loading also influences chain
crystallinity and mobility, while in the current study both factors do not dominantly determine
PLLA biodegradation and drug release.
Laser melting reduces surface crystallinity of PLLA matrix, which accelerates polymer
degradation in the early stage and shortens the induction period of drug release. Laser
treatment only melts a layer below matrix surface and keeps the bulk intact. Therefore, after
laser melted material degrades, polymer degradation proceeds at a similar rate as the non-laser
treated samples. Similar polymer degradation rate results in similar drug release rate after laser
treatment. Accordingly, laser crystallinity modification has been shown to reduce the induction
period of drug release, while keep the drug release rate unmodified, which is a desired property
in drug delivery applications.
150
Chapter 6: Conclusions
In this study, the knowledge of morphology and crystal structure of poly(L-Lactic Acid) (PLLA)
as a biodegradable polymer has been advanced. Laser treatment has been conducted to reduce
surface crystallinity of biodegradable polymer. The reduced crystallinity has modified polymer
degradation profile, and successfully shortened the induction period of drug release. Major
findings and contributions of this study are summarized as follows. Suggestions for future
work are also listed.
6.1 Effect of Sample Formation Process on Morphology and Crystal Structure of
Biodegradable Polymer
It has been systematically demonstrated that PLLA morphology and crystal structure depend on
sample formation processes. Sample formation processes determine polymer chain mobility
and crystallization time, which are the important factors affecting the development of polymer
crystals. Solvent casting and spin coating, as well as subsequent annealing, have been
conducted for the detailed investigation of the process effects and resulted crystal structures.
Different categories of spherulites have been observed on solvent cast and spin coated samples.
Development of different spherulites stems from different chain mobility during the spherulite
development process. In solvent casting, solvent is present and chain mobility is high. For the
annealed spin coated films, spherulites are formed in viscous state with low chain mobility.
The higher mobility in solvent casting also allows for a better chain packing as revealed by the
wide angle X-ray diffraction (WAXD) observations. Annealing increases crystallinity of both
solvent cast and spin coated samples. After annealing under the same conditions, the
crystallinity for the solvent cast sample is lower than that in the spin coated sample, showing the
151
possible existence of the rigid amorphous phase in the solvent cast sample.
The detailed investigation advances the knowledge of PLLA crystallization and the effect of
sample formation processes. In addition, PLLA crystallinity strongly determines its
biodegradation. The advanced knowledge of the process effect, therefore, contributes to the
application of PLLA as a biodegradable material in various medical devices such as stent,
scaffold, and drug delivery system.
6.2 Laser Crystallinity Modification of Biodegradable Polymer
It has been numerically and experimentally demonstrated that under laser irradiation with photon
energy higher than polymer bond energies, there exists a working window of laser energy levels
which reduce polymer crystallinity and incur insignificant chemical modifications. The
working window size has also been shown to be a function of polymer crystallinity. Higher
crystallinity leads to lower chain mobility. Mobility determines melting point and quantum
yield of chemical decomposition.
Annealing has been conducted to increase polymer crystallinity for subsequent laser treatment.
After laser melting, crystallinity decreases for both annealed and non-annealed samples based on
the WAXD observations. Because of higher chain mobility, the non-annealed samples have a
lower melting temperature, and its melting depth is slightly larger. In the current study,
however, the melting points of both types of samples are not significantly different to affect the
laser energy level to reduce the crystallinity. Both annealed and non-annealed samples require
the same laser energy level to reduce their crystallinity.
Under laser irradiation with the photon energy higher than polymer bond energies, molecule
152
dissociation will occur, generating free radicals. Based on the cage effect, the free radicals are
difficult to move apart as confined by surrounding molecules with lower mobility such as
crystals. As a result, a large portion of free radicals recombine and return to the initial state,
incurring inappreciable chemical changes with a small quantum yield, which is desire to keep the
biocompatibility and biodegradability of PLLA. The cage effect is also revealed by the fact that
the annealed sample, with lower mobility, requires higher laser energy to induce chemical
modifications. Therefore, the working window is larger for samples with higher initial
crystallinity.
Since biodegradation of PLLA is a strong function of its crystallinity, laser treatment can be
utilized to modify PLLA biodegradation. PLLA biodegradation also determines drug release
profiles in the drug delivery application. Therefore, laser crystallinity modification further
provides a potential method to tailor the drug release profiles.
6.3 Modification of Polymer Biodegradation by Laser Melting
Effect of laser crystallinity modification on polymer biodegradation has been investigated for the
first time. To characterize the degradation process, polymer molecular weight, morphology,
and sample mass have been monitored. It has been shown that laser treated samples experience
a faster initial reduction of molecular weight, which suggests the preferential degradation of laser
melted material due to the reduced crystallinity.
To study the degradation of laser melted layer, careful morphology observation has been
conducted. As degradation progresses, it is observed that the surface morphology of laser
treated sample becomes more similar to that of the non-laser treated sample. Namely, the laser
treated surface regions are progressively eroded. This shows that degradation preferentially
153
occurs in the laser melted layer, which allows for the accelerated initial degradation. In
addition, the degraded sample possesses a solid cross section, which suggests that autocatalytic
degradation is not dominant, as a result of easy diffusion of acidic monomers out of the sample.
The accelerated initial degradation facilitates the diffusion of the degraded products with smaller
molecular weights, which in turn shortens the time period before the occurrence of sample mass
loss. This demonstrates the potentiality of laser crystallinity modification to shorten the
induction period of drug release, which is desired in drug delivery applications.
6.4 Effect of Drug Loading on Degradation and Drug Release of Biodegradable Polymer
The addition of drug into polymer matrix modifies matrix properties in many ways, including
changing chain mobility, crystallinity, and porosity during drug release. The combined effects
determine polymer degradation and drug release profiles. In this study, detailed investigation of
these combined effects has been carried out as a function of drug loading concentration. Drug
concentration influences polymer crystallinity and chain mobility as characterized by WAXD and
differential scanning calorimetry. Crystallinity increases with drug concentration due to the
plasticization effect, which enhances chain mobility and favors crystallization. The developed
crystals, however, reduce chain mobility. Therefore, with increasing drug concentration,
polymer chain mobility increases before decreasing at an even higher concentration.
Distinct PLLA biodegradation and drug release profiles have been observed with different drug
concentrations. At low concentration, drug release begins with an induction period during
which drug release is hindered due to the slow PLLA degradation kinetics. Higher drug
concentration results in faster degradation and thus drug release. The accelerated degradation is
attributed to the porous structure in the polymer matrix after drug release rather to the polymer
154
mobility. The effect of porosity also cancels out the effect of crystallinity; the latter tends to
slow down polymer degradation and drug release, which is not observed in the current study.
Therefore, with higher porosity, higher drug loaded PLLA leads to more porous structure during
drug release. The porous structure favors water diffusion and accelerates hydrolysis, which in
turn reduces the induction period of drug release and increases the release rate.
6.5 Shortening of Induction Period of Drug Release by Laser Melting
The slow degradation kinetics of PLLA results in an induction period of drug release, during
which a limited amount of drug is released. The induction period is undesirable because it
delays drug release and effectiveness. In this study, laser crystallinity modification has been
conducted to tailor the drug release profile and induction period of drug release for the first time.
It has been shown that laser melting accelerates polymer degradation in the early stage and
shortens the induction period of drug release, due to the early degradation of laser melted
material. Laser treatment keeps the bulk intact. Therefore, polymer degradation rate remains
similar after laser melted material degrades. Accordingly, laser treatment reduces the induction
period of drug release, while keeps the drug release rate originally designed for a drug delivery
system.
Both drug loading and laser surface melting accelerates polymer degradation and drug release.
However, it has been demonstrated the effects of drug loading and laser melting on the
accelerated degradation and drug release profiles are distinct. Drug loading accelerates the
overall degradation of the matrix until the end of the drug release period. Effect of laser
melting, on the other hand, is limited within a layer below matrix surface and therefore only
accelerates the initial degradation, while the degradation in the late stage remains similar.
155
Therefore, drug loading and laser treatment lead to distinct drug release profiles. Drug loading
accelerates overall degradation, and results in a shorter induction period of drug release and a
higher drug release rate. Laser surface melting accelerates initial degradation, and thus shortens
the induction period of drug release while keeps the originally designed release rate, which is
desired in drug delivery applications.
6.6 Future Work
Effects of laser crystallinity modification of biodegradable polymer have been investigated.
Laser treatment reduces polymer crystallinity. The reduced crystallinity accelerates polymer
degradation and therefore shortens the induction period of drug release. The results open the
possibility to precisely tailor the drug release profiles from biodegradable polymers through laser
treatments. To achieve the objective, possible required research is given below.
This study has demonstrated that one layer of laser melted material successfully modifies
polymer biodegradation and shortens the induction period of drug release. Future investigation
could involve the development of polymer matrix having multiple laser melted layers with
different crystallinities. With the multi-layer structure, a more graduate crystallinity gradient
along matrix thickness can be realized, which potentially allows for tuning drug release profiles
in a more accurate manner. To develop the multi-layer structure, multiple laser irradiations,
with different operating parameters, on the polymer matrix surface may be required. Effects of
laser parameters such as repetition rate, pulse number, wavelength, and pulse energy on
crystallinity modification thus need further investigation, in order to achieve better control over
crystallinity along matrix thickness. Other irradiation sources such as flash lamps, with the
advantages of tunable wavelengths, will also be considered for further investigation.
156
Spatially resolved measurements of crystallinity along the specimen thickness direction are
required, especially for the multi-layer structure mentioned in the previous paragraph. Micro
X-ray diffraction (μXRD) method may be a potential characterization method. μXRD allows
for a spatial resolution of the order of micron, and can be investigated to measure the cross
sections of laser treated polymeric materials. Crystallinity as a function of thickness can be
obtained. To carry out the μXRD measurements and to interpret the results, the issue associated
with the X-ray beam size with respect to the polymer crystal structure size will be addressed to
ensure correct and accurate characterization.
In this study, degradation and drug release tests are conducted on matrices with a fixed geometry.
Geometry of matrices determines the contact area with the body fluid, as well as the diffusion
path lengths of degraded products and drug molecules. Effect of matrix geometry requires
further investigation. During drug release period, complex processes such as hydrolysis,
crystallization, and diffusion occur. To investigate the processes in detail, a numerical model
with better predictability is desired. Predictable model is also favorable to further investigate
laser processing to modify drug release, because long term experiments of drug release, on the
order of weeks or months, slow down the investigation and development processes.
Undesired initial burst has been observed on high drug concentrated matrices in this study. To
reduce initial burst, matrices can be covered by a layer with lower drug concentration. Laser
treatment can be applied on this covering layer to shorten the induction period. Through
adjusting drug spatial concentration within the matrix, and applying suitable laser treatment,
problems with initial burst and induction period can be simultaneously resolved.
157
References
Chapter 1
Alexander, L. E., 1969, X-Ray Diffraction Methods in Polymer Science, John Wiley & Sons, New York, Chap. 1.
Alexis, F., 2005, “Factors Affecting the Degradation and Drug-Release Mechanism of Poly(lactic acid) and Poly[(lactic acid)-co-(glycolic acid)],” Polym. Int., 54, pp. 36-46.
Arifin, D. Y., Lee, L. Y., and Wang, C.-H., 2006, “Mathematical Modeling and Simulation of Drug Release from Microspheres: Implications to Drug Delivery Systems,” Adv. Drug Delivery Rev., 58, pp. 1274-1325.
Avrami, M., 1939, “Kinetics of Phase Change. I. General Theory,” J. Chem. Phys., 7, pp. 1103-1112.
Avrami, M., 1940, “Kinetics of Phase Change. I. Transformation-Time Relations for Random Distribution of Nuclei,” J. Chem. Phys., 8, pp. 212-224.
Avrami, M., 1941, “Granulation, Phase Change, and Microstructure: Kinetics of Phase Change. III,” J. Chem. Phys., 9, pp. 177-184.
Belbella, A., Vauthier, C., Fessi, H., Devissaguet, J.-P., Puisieux, F., 1996, “In Vitro Degradation of Nanospheres from Poly(D,L-Lactides) of Different Molecular Weights and Polydispersities,” Int. J. Pharm., 129, pp. 95-102.
Belyayev, O. F., 1988, “Mechanism of Melting of Oriented Polymers,” Polym. Sci. U. S. S. R., 30, pp. 2545-2552.
Bhatla, A. and Yao, Y.L., 2009, “Effect of Laser Surface Modification on the Crystallinity of Poly(L-lactic acid),” J. Manuf. Sci. Eng., 131, 051004.
Campbell, D., Pethrick, R. A., and White, J. R., 2000, Polymer Characterization, Stanley Thornes Ltd., Chap. 8.
Chu, C. C. and Campbell, N. D., 1982, “Scanning Electron Microscopic Study of the Hydrolytic Degradation of Poly(glyco1ic acid) Suture,” J. Biomed. Mater. Res., 16, pp. 417-430.
Chu, C. C., 1981, “Hydrolytic Degradation of Polyglycolic Acid: Tensile Strength and Crystallinity Study,” J. Appl. Polym. Sci., 26, pp. 1727-1734.
Dunn, D. S. and Ouderkirk, A. J., 1990, “Chemical and Physical Properties of Laser-Modified Polymers,” Macromol., 23, pp. 770-774.
Faisant, N., Siepmann, J., Oury, P., Laffineur, V., Bruna, E., Haffner, J., Benoit, J.P., 2002, “The Effect of Gamma-Irradiation on Drug Release from Bioerodible Microparticles: a Quantitative Treatment,” Int. J. Pharm., 242, pp. 281-284.
158
Higuchi, T., 1961, “Rate of Release of Medicaments from Ointment Bases Containing Drugs in Suspension,” J. Pharm. Sci., 50, pp. 874-875.
Hoffman, J. D., Davis, G. T., and Lauritzen, J. I., 1976, Treatise on Solid State Chemistry, Hannay, N. B., ed., Plenum Press, New York, Vol. 3, Chap. 7.
Jing, D, Wu, L, and Ding, J., 2006, “Solvent-Assisted Room-Temperature Compression Molding Approach to Fabricated Porous Scaffolds for Tissue Engineering,” Macromol. Biosci., 6, pp. 747-757.
Koegler, W.S., Patrick, C., Cima, M.J., and Griffith, L.G., 2002, “Carbon Dioxide Extraction of Residual Chloroform from Biodegradable Polymers,” J. Biomed. Mater. Res., 63, pp. 567-576.
Labrecque, L. V., Kumar, R. A., Dave, V., Gross, R. A., McCarthy, S. P., 1997, “Citrate Esters as Plasticizers for Poly (lactic acid),” J Appl. Polym. Sci., 66, pp. 1507-1513.
Lam, C.X.F., Savalani, M.M., Teoh, S.-H., and Hutmacher, D.W., 2008, “Dynamics of in Vitro Polymer Degradation of Polycaprolactone-Based Scaffolds: Accelerated versus Simulated Physiological Conditions,” Biomed. Mater. 3, 034108.
Lazare, S. and Benet, P., 1993, “Surface Amorphization of Mylar Films with the Excimer Laser Radiation Above and Below Ablation Threshold: Ellipsometric Measurements,” J. Appl. Phys., 74, pp. 4953-4957.
Leong, K. W. and Langer, R., 1987, “Polymeric Controlled Drug Delivery,” Adv. Drug Delivery Rev., 1, pp. 199-233
Liau, W. B. and Chang, C. F., 1999, “Casting Solvent Effect on Crystallization Behavior and Morphology of Poly(Ethylene Oxide)/Poly(Methyl Methacrylate),” J. Appl. Polym. Scie., 76, pp. 1627-1636.
Ljungberg, N and Wesslen, B, 2002, “Preparation and Properties of Plasticized Poly(lactic acid) Films,” J Appl. Polym. Sci., 86, pp. 1227-1234.
McDonald, P.F., Lyons, J.G., Geever, L.M., Higginbotham, C.L., 2010, “In Vitro Degradation and Drug Release from Polymer Blends Based on Poly(DL-Lactide), Poly(L-Lactide-Glycolide) and Poly(ε-Caprolactone),” J. Mater. Sci., 45, pp. 1284-1292.
Mikos, A. G. and Temeoff, J. S., 2000, “Formation of Highly Porous Biodegradable Scaffolds for Tissue Engineering,” EJB Electronic Journal of Biotechnology, 3, fulltext-5.
N. Kolmogorov, “On the Statistical Theory of Crystallization of Metals [in Russian],” Izv. Akad. Nauk SSSR, Ser. Mat., No. 3, 1937, pp. 355-359.
Nakamura, T., Hitomi, S., Watanabe, S., Shimizu, Y., Jamshidi, K., Hyon, S.-H., and Y. Ikada, 1989, “Bioabsorption of Polylactides with Different Molecular Properties,” J. Biomed. Mater. Res., 23, pp. 1115-1130.
159
Norton, D. R., and Keller, A., 1985, “The Spherulitic and Lamellar Morphology of Melt-Crystallized Isotactic Polypropylene,” Polymer, 26, pp. 704-716.
Renouf-Glausera, A. C., Roseb, J., Farrarb, D. F., and Cameron, R. E., 2005, “The Effect of Crystallinity on the Deformation Mechanism and Bulk Mechanical Properties of PLLA,” Biomater., 26, pp. 5771-5782.
Rothen-Weinhold, A., Besseghir, K., and Gurny, R, 1997, “Analysis of the Influence of Polymer Characteristics and Core Loading on the in Vivo Release of a Somatostatin Analogue,” Eur. J. Pharm. Sci., 5, pp. 303-313.
Rothstein, S. N., Federspiel, W. J., and Little, S. R., 2009, “A Unified Mathematical Model for the Prediction of Controlled Release from Surface and Bulk Eroding Polymer Matrices,” Biomater., 30, pp. 1657-1664.
Saltzman, W. M. and Langer, R., 1989, “Transport Rates of Proteins in Porous Materials with Known Microgeometry,” Biophys. J., 55, pp. 163-171.
Schultz, J. M., 2001, Polymer Crystallization: The Development of Crystalline Order in Thermoplastic Polymers, Oxford University Press, New York, Chap 9.
Siparsky, G. L., Voorhees, K. J., and Miao, F., 1998, “Hydrolysis of Polylactic Acid (PLA) and Polycaprolactone (PCL) in Aqueous Acetonitrile Solutions: Autocatalysis,” J. Environmental Polym. Degrad., 6, pp. 31-41.
Tanaka, T., Tsuchiya, T., Takahashi, H., Taniguchi, M., and Lloyd, D. R., 2006, “Microfiltration Membrane of Polymer Blend of Poly(L-Lactic Acid) and Poly(ε-Caprolactone),” Desalination, 193, pp. 367-374.
Toda, A., Tomita, C., Hikosaka, M., and Saruyama, Y., 1998, “Melting of Polymer Crystals Observed by Temperature Modulated D.S.C. and Its Kinetic Modeling,” Polym., 39, pp. 5093-5104.
Tsuji, H. and Tsuruno, T., 2010, “Accelerated Hydrolytic Degradation of Poly(L-lactide)/Poly(D-lactide) Stereocomplex up to Late Stage,” Polym. Degrad. Stab., 95, pp. 477-484.
Tsuji, H., and Ikada, Y., 1998, “Properties and Morphology of Poly(L-Lactide). ii. Hydrolysis in Alkaline Solution,” J. Polym. Sci. A: Polym. Chem., 36, pp. 59-66.
Tsuji, H., Mizuno, A., and Ikada, Y., 2000, “Properties and Morphology of Poly(L-lactide). III. Effects of Initial Crystallinity on Long-Term in Vitro Hydrolysis of High Molecular Weight Poly(L-lactide) Film in Phosphate-Buffered Solution,” J. Appl. Polym. Sci., 77, pp. 1452-1464.
W. A. Johnson and R. F. Mehl, “Reaction Kinetics in Processes of Nucleation and Growth,” Transactions of the American Institute of Mining and Metallurgical Engineers, Vol. 135, 1939, pp. 416-442.
160
Watenabe, H., Takata, T., Tsuge, M., 1993, “Polymer Surface Modification due to Excimer Laser Radiation—Chemical and Physical Changes in the Surface Structure of Poly(ethylene terephthalate),” Polym. Int., 31, pp. 247-254.
Weir, N.A., Buchanan, F.J., Orr, J.F., Farrar, D.F., and Dickson, G.R., 2004, “Degradation of Poly-L-Lactide. Part 2: Increased Temperature Accelerated Degradation,” Proc. Inst. Mech. Eng., H: J. Eng. Med, 218, pp. 321-330.
Wunderlich, B., 1976, Macromolecular Physics, Vol. 2, Academic Press, New York.
Yamamoto, T., 2010, “Molecular Dynamics of Reversible and Irreversible Melting in Chain-Folded Crystals of Short Polyethylene-Like Polymer,” Macromol., 43, pp. 9384-9393.
Yeh, J.-T., Huang, C.-Y., Chai, W.-L., Chen, K.-N., 2009, “Plasticized Properties of Poly (lactic acid) and Triacetine Blends,” J. Appl. Polym. Sci., 112, 2757-2763.
Zilberman, M., Schwade, N. D., Meidell, R. S., and Eberhart, R. C., 2001, “Structured Drug-Loaded Bioresorbable Films for Support Structures,” J. Biomater. Sci. Polymer Edn., 12, pp. 875-892.
Zong, X. H., Wang, Z. G., Hsiao, B. S., Chu, B., Zhou, J. J., and Jamiolkowski, D. D., 1999, “Structure and Morphology Changes in Absorbable Poly(glycolide) and Poly(glycolide- co-lactide) during in Vitro Degradation,” Macromol., 32, pp. 8107-8114.
Chapter 2
Akcasu, A. Z., and Han, C. C., 1979, “Molecular Weight and Temperature Dependence of Polymer Dimensions in Solution,” Macromolecules, 12(2), pp. 276-280.
Alexander, L. E., 1969, X-Ray Diffraction Methods in Polymer Science, John Wiley & Sons, New York, Chap. 1.
Bassett, D. C., Olley, R. H., and Al Raheil, I. A. M., 1988, “On Crystallization Phenomena in PEEK,” Polymer, 29, pp. 1745-1754.
Bhatla, A., and Yao, Y. L., 2009, “Effect of Laser Surface Modification on the Crystallinity of Poly(L-Lactic Acid),” J. Manufacturing Science and Engineering, 131, pp. 051004-1-051004-11.
Campbell, D., Pethrick, R. A., and White, J. R., 2000, Polymer Characterization, 2nd ed., Stanley Thornes, Cheltenham.
Chang, C.-C., Wei, K.-H., and Chen, W.-C., 2003, “Spin-Coating of Polyimide-Silica Hybrid Optical Thin Films,” J. Electrochem. Soc., 150(8), pp. F147-F150.
Cotton, J. P., Nierlich, M., Boue, F., Daoud, M., Farnoux, B., Jannink, G., Duplessix, R., and Picot, C., 1976, “Experimental Determination of the Temperature-Concentration Diagram of Flexible Polymer Solutions by Neutron Scattering,” J. Chem. Phys., 65(3), pp. 1101-1108.
161
Croll, S. G., 1979, “The Origin of Residual Internal Stress in Solvent-Cast Thermoplastic Coatings,” J. Appl. Polym. Sci., 23, pp. 847-858.
Davis, G. T., Eby, R. K., and Martin, G. M., 1968, “Variations of the Unit-Cell Dimensions of Polyethylene: Effect of Crystallization Conditions, Annealing, and Deformation,” J. Appl. Phys., 39(11), pp. 4973-4981.
de Gennes, P. G., 1971, “Reptation of a Polymer Chain in the Presence of Fixed Obstacles,” J. Chem. Phys., 55(2), pp. 572-579.
Doi, M., and Edwards, S. F., 1988, The Theory of Polymer Dynamics, Oxford University Press, New York, Chaps. 2 and 5.
Frank, C. W., Rao, V., Despotopoulou, M. M., Pease, R. F. W., Hinsberg, W. D., Miller, R. D., and Rabolt, J. F., 1996, “Structure in Thin and Ultrathin Spin-Cast Polymer Films,” Science, 273, pp. 912-915.
Gao, X., Hou, W., Zhou, J., Li, L., and Zhao, L., 2004, “Relationships Between the Crystal Structures and the Multiple Melting Behaviors of Poly(Ethylene 2,6-Naphthalate),” Macrom. Mater. and Eng. 289, pp. 174-180.
Granasy, L., Pusztai, T., Tegze, G., Warren, J. A., and Douglas, J. F., 2005, “Growth and Form of Spherulites,” Phys. Rev. E, 72, pp. 011605-1-011605-15.
Hsu, C. C., Geil, P. H., Miyaji, H., and Asai, K., 1986, “Structure and Properties of Polypropylene Crystallized from the Glassy State,” J. Polym. Sci. B, 24, pp. 2379-2401.
Imai, M., Mori, K., Mizukami, T., Kaji, K., and Kanaya, T., 1992, “Structural Formation of Poly (Ethylene Terephthalate) during the Induction Period of Crystallization: 1. Ordered Structure Appearing before Crystal Nucleation,” Polymer, 33(21), pp. 4451-4456.
Ivanov, D. A., and Jonas, A. M., 1998, “Isothermal Growth and Reorganization upon Heating of a Single Poly(Aryl-Ether-Ether-Ketone) (PEEK) Spherulite, as Imaged by Atomic Force Microscopy,” Macromolecules, 31, pp. 4546-4550.
Kang, S., Hsu, S. L., Stidham, H. D., Smith, P. B., Leugers, M. A., and Yang, X., 2001, “A Spectroscopic Analysis of Poly(Lactic Acid) Structure,” Macromolecules, 34, pp. 4542-4548.
Kikkawa, Y., Abe, H., Iwata, T., Inoue, Y., and Doi, Y., 2002, “Crystallization, Stability, and Enzymatic Degradation of Poly(L-Lactide) Thin Film,” Biomacromolecules, 3(2), pp. 350-356.
Kister, G., Cassanas, G., and Vert, M., 1998, “Effects of Morphology, Conformation and Configuration on the IR and Raman Spectra of Various Poly(Lactic Acid)s,” Polymer, 39(2), pp. 267-273.
Kobayashi, J., Asahi, T., Ichiki, M., Oikawa, A., Suzuki, H., Watanabe, T., Fukada, E., and Shikinami, Y., 1995, “Structural and Optical Properties of Poly Lactic Acids,” J. Appl. Phys. 77(7), pp. 2957-2973.
162
Lanceley, H. A., and Sharples, A., 1966, “A Kinetic Study of Polymer Crystallization from Solution,” Die Makromolekulare Chemie, 94, pp. 30-41.
Li, H., Nie, W., Deng, C., Chen, X., and Ji, X., 2009, “Crystalline Morphology of Poly(L-Lactic Acid) Thin Films,” Eur. Polym. J., 45, pp. 123-130.
Li, L., Chan, C.-M., Yeung, K. L., Li, J.-X., Ng, K.-M., and Lei, Y., 2001, “Direct Observation of Growth of Lamellae and Spherulites of a Semicrystalline Polymer by AFM,” Macromolecules, 34, pp. 316-325.
Maillard, D., and Prud’homme, R. E., 2008, “The Crystallization of Ultrathin Films of Polylactides-Morphologies and Transitions,” Can. J. Chem., 86, pp. 556-563.
Meaurio, E., Zuza, E., Lopez-Rodrıguez, N., and Sarasua, J. R., 2006, “Conformational Behavior of Poly(L-Lactide) Studied by Infrared Spectroscopy,” J. Phys. Chem., 110, pp. 5790-5800.
Menczel, J., and Wunderlich, B., 1981, “Heat Capacity Hysteresis of Semicrystalline Macromolecular Glasses,” J. Polym. Sci.: Polym. Lett. Ed., 19, pp. 261-264.
Miyata, T., and Masuko, T., 1997, “Morphology of Poly(L-Lactide) Solution-Grown Crystals,” Polymer, 38(16), pp. 4003-4009.
Nampoothiri, K. M., Nair, N. R., and John, R. P., 2010, “An Overview of the Recent Developments in Polylactide (PLA) Research,” Bioresource Technology, 101, pp. 8493-8501.
Narladkar, A., Balnois, E., Vignaud, G., and Grohens, Y., 2008, “Difference in Glass Transition Behavior Between Semi Crystalline and Amorphous Poly(lactic acid) Thin Films,” Macromol. Symp., 273, pp. 146-152.
Norton, D. R., and Keller, A., 1985, “The Spherulitic and Lamellar Morphology of Melt-Crystallized Isotactic Polypropylene,” Polymer, 26, pp. 704-716.
Ogawa, T., Miyaji, H., and Asai, K., 1985, “Nodule Structure of Polypropylene,” J. Phys. Soc. Japan, 54(10), pp. 3668-3670.
Pluta, M., and Galeski, A., 2002, “Crystalline and Supermolecular Structure of Polylactide in Relation to the Crystallization Method,” J. Appl. Polym. Sci., 86, pp. 1386-1395.
Roylance, D. K., and DeVries, K. L., 1971, “Determination of Atomic Stress Distribution in Oriented Polypropylene by Infrared Spectroscopy,” Polym. Lett., 9, pp. 443-447.
Sarasua, J.-R., Zuza, E., Imaz, N., and Meaurio, E., 2008, “Crystallinity and Crystalline Confinement of the Amorphous Phase in Polylactides,” Macromol. Symp., 272, pp. 81-86.
Sasaki, S., and Asakura, T., 2003, “Helix Distortion and Crystal Structure of the α-Form of Poly(L-Lactide),” Macromolecule, 36, pp. 8385-8390.
Schindler, A., and Harper, D., 1979, “Polylactide. II. Viscosity-Molecular Weight Relationships
163
and Unperturbed Chain Dimensions,” J. Polym. Sci.: Polym. Chem. Ed., 17, pp. 2593-2599.
Schultz, J. M., 2001, Polymer Crystallization: The Development of Crystalline Order in Thermoplastic Polymers, Oxford University Press, New York, Chaps. 4 and 10.
Smith, B., 1999, Infrared Spectral Interpretation: A Systematic Approach, CRC Press, Boca Raton, FL, Chap. 1.
Strobl, G., 2000, “From the Melt via Mesomorphic and Granular Crystalline Layers to Lamellar Crystallites: A Major Route Followed in Polymer Crystallization?” Eur. Phys. J. E 3, pp. 165-183.
Su, C. H., Jeng, U., Chen, S. H., Lin, S. J., Wu, W. R., Chuang, W.-T., Tsai, J. C., and Su, A. C., 2009, “Nanograin Evolution in Cold Crystallization of Syndiotactic Polystyrene as Illustrated via In-Situ Small/Wide Angle X-Ray Scattering and Differential Scanning Calorimetry,” Macromolecules, 42, pp. 6656-6664.
Takeda, H., Nakashima, C., and Nasu, N., 2005, “Studies on Structure of Poly(ε-L-Lysine) Spherulite Grown from Solution,” Sen’I Gakkaishi, 61, pp. 61-66.
Tsuji, H., and Ikada, Y., 1995, “Properties and Morphology of poly(L-Lactide). 1. Annealing Condition Effects on Properties and Morphologies of Poly(L-Lactide),” Polymer, 36(14), pp. 2709-2716.
Tsuji, H., and Ikada, Y., 1998, “Properties and Morphology of Poly(L-Lactide). II. Hydrolysis in Alkaline Solution,” J. Polym. Sci. A: Polym. Chem., 36, pp. 59-66.
Vorotilov, K., Petrovsky, V., and Vasiljev, V., 1995, “Spin Coating Process of Sol-Gel Silicate Films Deposition: Effect of Spin Speed and Processing Temperature,” J. Sol-Gel Sci. and Tech., 5, pp. 173-183.
Wang, Y., Funari, S. S., and Mano, J. F., 2006, “Influence of Semicrystalline Morphology on the Glass Transition of Poly(L-Lactic Acid),” Macromol. Chem. Phys., 207, pp. 1262-1271.
Wunderlich, B., 1976, Macromolecular Physics, Academic Press, New York, Vol. 2, Chap. 5.
Zhang, J., Liang, Y., Yan, J., and Lou, J., 2007, “Study of the Molecular Weight Dependence of Glass Transition Temperature for Amorphous Poly(L-Lactide) by Molecular Dynamics Simulation,” Polymer, 48, pp. 4900-4905.
Zhao, J., Qiu, J., Niu, Y., and Wang, Z., 2009, “Evolutions of Morphology and Crystalline Ordering Upon Annealing of Quenched Isotactic Polypropylene,” J. Polym. Sci. B, 47, pp. 1703-1712.
Chapter 3
Aleksandrov, A. P., Kitai, M. S., and Varbanskaya, R. A., 1988, “Photochemical Autocatalytic Propagation Reaction of Polyene Sequences in Photodegradation of Polyvinyl Chloride,” Polym.
164
Sci. U. S. S. R., 30, pp. 1687-1696.
Alexander, L. E., 1969, X-ray Diffraction Methods in Polymer Science, New York: John Wiley & Sons.
Amass, W., Amass, A., Tighe, B., 1998, “A Review of Biodegradable Polymers: Uses, Current Developments in the Synthesis and Characterization of Biodegradable Polyesters, Blends of Biodegradable Polymers and Recent Advances in Biodegradation Studies,” Polym. Int., 47, pp. 89-144.
Astrath, N. G. C., Astrath, F. B. G., Shen, J., Zhou, J., Michaelian, K. H., Fairbridge, C., Malacarne, L. C., Pedreira, P. R. B., Santoro, P. A., and Baesso, M. L., 2009, “Arrhenius Behavior of Hydrocarbon Fuel Photochemical Reaction Rates by Thermal Lens Spectroscopy,” Appl. Phys. Lett., 95, 191902.
Beamson, G. and Briggs, D., 1992, High Resolution XPS of Organic Polymers, Chichester: John Wiley & Sons.
Belyayev, O. F., 1988, “Mechanism of Melting of Oriented Polymers,” Polym. Sci. U. S. S. R., 30, pp. 2545-2552.
Bhatla, A. and Yao, Y. L., 2009, “Effect of Laser Surface Modification on the Crystallinity of Poly(L-Lactic Acid),” J. Manuf. Sci. Eng., 131, 051004.
Bityurin, N., Luk’yanchuk, B. S., Hong, M. H., and Chong, T. C., 2003, “Models for Laser Ablation of Polymers,” Chem. Rev., 103, pp. 519-552.
Boudenne, A., Ibos, L., Candau, Y., and Thomas, S., editors, 2011, Handbook of Multiphase Polymer Systems, West Sussex, John Wiley & Sons, Chap. 10.
Butiagin, P. J., 1972, “The Decay of Free Radicals in Polymer Media,” Proc. Int. Conf. Chem. Transform. Polym., pp. 57-76.
Cormia, R. L., Price, F. P., and Turnbull, D., 1962, “Kinetics of Crystal Nucleation in Polyethylene,” J. Chem. Phys., 37, pp. 1333-1340.
Currie, J. A., Bohm, G. G. A., and Dole, M., 1969, “Calorimetric Detection on Free Radicals in Irradiated Polyethylene,” Polym. Lett., 7, pp. 535-539.
Dan, E. and Guillet, J. E., 1973, “Photochemistry of Ketone Polymers. X. Chain Scission Reactions in the Solid State,” Macromol., 6, pp. 230-235.
Di Lorenzo, M. L., 2005, “Crystallization Behavior of Poly(L-Lactic Acid),” Eur. Polym. J., 41, pp. 569-575.
Dunn, D. S. and Ouderkirk, A. J., 1990, “Chemical and Physical Properties of Laser-Modified Polymers,” Macromol., 23, pp. 770-774.
165
Efthimiopoulos, T., Kiagias, H., Christoulakis, S., and Merlemis, N., 2008, “Bubble Creation and Collapse during Excimer Laser Ablation of Weak Absorbing Polymer,” Appl. Surf. Sci., 254, pp. 5626-5630.
Hoffman, J. D. and Weeks, J. J., 1962, “Melting Process and the Equilibrium Melting Temperature of Polychlorotrifluoroethylene,” J. Res. Nat. Bureau of Standards-A. Phys. Chem., 66A, pp. 13-28.
Hsu, S.-T. and Yao, Y. L., 2011, “Effect of Film Formation Method and Annealing on Crystallinity of Poly (L-Lactic Acid) Films,” Proc. Int. Manuf. Sci. Eng. Conf., MSEC2011-50205.
Inagaki, N., Narushima, K., Tsutsui, Y., and Ohyama, Y., 2002, “Surface Modification and Degradation of Poly(Lactic Acid) Films by Ar-Plasma,” J. Adhes. Sci. Technol., 16, pp. 1041-1054.
Janorkar, A. V., Metters, A. T., and Hirt, D. E., 2007, “Degradation of Poly(L-Lactide) Films under Ultraviolet-Induced Photografting and Sterilization Conditions,” J. Appl. Polym. Sci., 106, pp. 1042-1047.
Lazare, S. and Benet, P., 1993, “Surface Amorphization of Mylar Films with the Excimer Laser Radiation Above and Below Ablation Threshold: Ellipsometric Measurements,” J. Appl. Phys., 74, pp. 4953-4957.
Lazare, S. and Granier, V., 1989, “Ultraviolet Laser Photoablation of Polymers: A Review and Recent Results,” Laser Chem., 10, pp. 25-40.
Miller, R. A., Brady, J. M., and Cutright, D. E., 1977, “Degradation Rates of Oral Resorbable Implants (Polylactates and Polyglycolates): Rate Modification with Changes in PLA/PGA Copolymer Ratios,” J. Biomed. Mater. Res., 11, pp. 711-719.
Mitomo, H., 1988, “Correspondence of Lamellar Thickness to Melting Point of Nylon-6,6 Single Crystal,” Polym., 29, pp. 1635-1642.
Nampoothiri, K. M., Nair, N. R., and John, R. P., 2010, “An Overview of the Recent Developments in Polylactide (PLA) Research,” Bioresour. Technol., 101, pp. 8493-8501.
Ohki, Y., Hirai, N., Fuse, N., Tanaka, T., Kohtoh, M., and Okabe, S., 2007, “Search for Adequate Biodegradable Polymer as an Eco-Friendly Electrical Insulating Material,” Proc. Int. Symp. EcoTopia Sci., pp. 488-493.
Rebollar, E., Bounos, G., Oujja, M., Georgiou, S., and Castillejo, M., 2006, “Effect of Molecular Weight on the Morphological Modifications Induced by UV Laser Ablation of Doped Polymers,” J. Phys. Chem. B, 110, pp. 16452-16458.
Schindler, A. and Harper, D., 1979, “Polylactide. II. Viscosity-Molecular Weight Relationships and Unperturbed Chain Dimensions,” J. Polym. Sci.: Polym. Chem. Ed., 17, pp. 2593-2599.
166
Schneider, S., Richter, F., and Brem, B., 1998, The Photodegradation of Poly(2,6-dimethyl-1,4-phenylene Oxide)—a Flash Photolysis Study of Polymer and Model Compounds,” Polym. Degrad. Stab., 61, pp. 543-464.
Srinivasan, R., 1993, “Pulsed Ultraviolet Laser Interactions with Organic Polymers Dependence of Mechanism Upon Laser Power,” Polym. Degrad. Stab., 43, pp. 101-107.
Tsuji, H. and Ikada, Y., 1995, “Properties and Morphology of Poly(L-Lactide). 1. Annealing Condition Effects on Properties and Morphologies of Poly(L-Lactide),” Polym., 36, pp. 2709-2716.
Tsuji, H. and Ikada, Y., 1998, “Properties and Morphology of Poly(L-Lactide). II. Hydrolysis in Alkaline Solution,” J. Polym. Sci., Part A: Polym. Chem., 36, pp. 59-66.
Tsuji, H., 2002, “Autocatalytic Hydrolysis of Amorphous-Made Polylactides: Effects of L-Lactide Content, Tacticity, and Enantiomeric Polymer Blending,” Polym., 43, pp. 1789-1796.
Wachsen, O., Platkowski, K., and Reichert, K. H., 1997, “Thermal Degradation of Poly-L-Lactide—Studies on Kinetics, Modelling and Melt Stabilization,” Polym. Degrad. Stab., 57, pp.87-94.
Watenabe, H., Takata, T., and Tsuge, M., 1993, “Polymer Surface Modification due to Excimer Laser Radiation—Chemical and Physical Changes in the Surface Structure of Poly(Ethylene Terephthalate),” Polym. Int., 31, pp. 247-254.
Yamamoto, T., 2010, “Molecular Dynamics of Reversible and Irreversible Melting in Chain-Folded Crystals of Short Polyethylene-Like Polymer,” Macromol., 43, pp. 9384-9393.
Zhao, Y., Fu, J., Ng, D. K. P., and Wu, C., 2004, “Formation and Degradation of Poly(D,L-Lactide) Nanoparticles and Their Potential Application as Controllable Releasing Devices,” Macromol. Biosci., 4, pp. 901-906.
Chapter 4
Alexander, L. E., 1969, X-Ray Diffraction Methods in Polymer Science, John Wiley & Sons, New York, Chap. 1.
Amass, W., Amass, A., and Tighe, B., 2008, “A Review of Biodegradable Polymers: Uses, Current Developments in the Synthesis and Characterization of Biodegradable Polyesters, Blends of Biodegradable Polymers and Recent Advances in Biodegradation Studies.” Polym. Int., 47, pp. 89-144.
Avrami, M., 1939, “Kinetics of Phase Change. I: General Theory,” J. Chem. Phys., 7, pp. 1103-1112.
Avrami, M., 1941, “Granulation, Phase Change, and Microstructure: Kinetics of Phase Change. III,” J. Chem. Phys., 9, pp. 177-184.
167
Belyayev, O. F., 1988, “Mechanism of Melting of Oriented Polymers,” Polym. Sci. U. S. S. R., 30, pp. 2545-2552.
Bhatla, A., and Yao, Y. L., 2009, “Effect of Laser Surface Modification on the Crystallinity of Poly(L-Lactic Acid),” J. Manuf. Sci. Eng., 131, 051004.
Chu, C. C., 1981, “Hydrolytic Degradation of Polyglycolic Acid: Tensile Strength and Crystallinity Study,” J. Appl. Polym. Sci., 26, pp. 1727-1734.
Dunn, D. S., and Ouderkirk, A. J., 1990, “Chemical and Physical Properties of Laser-Modified Polymers,” Macromol., 23, pp. 770-774.
Fischer, E. W., Sterzel, H. J., and Wegner, G., 1973, “Investigation of the Structure of Solution Grown Crystals of Lactide Copolymers by Means of Chemical Reactions,” Kol-ZuZ Polymere, 251, pp. 980-990.
Hsu, S.-T., Tan, H., and Yao, Y. L., 2012, “Effect of Excimer Laser Irradiation on Crystallinity and Chemical Bonding of Biodegradable Polymer,” Polym. Degrad. Stab., 97, pp. 88-97.
Inagaki, N., Narushima, K., Tsutsui, Y., and Ohyama, Y., 2002 “Surface Modification and Degradation of Poly(Lactic Acid) Films by Ar-Plasma,” J. Adhes. Sci. Technol., 16, pp. 1041-1054.
Lam, C. X. F., Savalani, M. M., Teoh, S. H., and Hutmacher, D. W., 2008, “Dynamics of in Vitro Polymer Degradation of Polycaprolactone-Based Scaffolds: Accelerated versus Simulated Physiological Conditions,” Biomed. Mater., 3, 034108.
Li, H., Nie, W., Deng, C., Chen, X., and Ji, X., 2009, “Crystalline Morphology of Poly(L-Lactic Acid) Thin Films,” Eur. Polym. J., 45, pp. 123-130.
Li, S. M., Garreau, H., and Vert, M., 1990, “Structure-Property Relationships in the Case of the Degradation of Massive Poly(α-Hydroxy Acids) in Aqueous Media: Part 2 Degradation of Lactide-Glycolide Copolymers: PLA37.5GA25 and PLA75GA25,” J. Mater. Sci.: Mater. Med., 1, pp. 131-139.
Lyu, S., Schley, J., Loy, B., Lind, D., Hobot, C., Sparer, R., and Untereker, D., 2007, “Kinetics and Time-Temperature Equivalence of Polymer Degradation,” Biomacromol., 8, pp. 2301-2310.
Menczel, J., Wunderlich, B., 1981, “Heat Capacity Hysteresis of Semicrystalline Macromolecular Glasses,” J. Polym. Sci.: Polym. Lett. Ed., 19, pp. 261-264.
Pitt, C. G., and Gu, Z., 1987, “Modification of the Rates of Chain Cleavage of Poly(ε-Caprolactone) and Related Polyesters in the Solid State,” J. Controlled. Release, 4, pp. 283-292.
Renouf-Glausera, A. C., Roseb, J., Farrarb, D. F., and Cameron, R. E., 2005, “The Effect of Crystallinity on the Deformation Mechanism and Bulk Mechanical Properties of PLLA,” Biomater., 26, pp. 5771-5782.
168
Siparsky, G. L., Voorhees, K. J., and Miao, F., 1998, “Hydrolysis of Polylactic Acid (PLA) and Polycaprolactone (PCL) in Aqueous Acetonitrile Solutions: Autocatalysis,” J. Environmental Polym. Degrad., 6, pp. 31-41.
Stephens, C. H., Whitmore, P. M., Morris, H. R., and Bier, M. E., 2008, “Hydrolysis of the Amorphous Cellulose in Cotton-Based Paper,” Biomacromol., 9, pp. 1093-1099.
Toda, A., Tomita, C., Hikosaka, M., and Saruyama, Y., 1998, “Melting of Polymer Crystals Observed by Temperature Modulated D.S.C. and Its Kinetic Modeling,” Polym., 39, pp. 5093-5104.
Tsuji, H., and Ikada, Y., 1998, “Properties and Morphology of Poly(L-Lactide). ii. Hydrolysis in Alkaline Solution,” J. Polym. Sci. A: Polym. Chem., 36, pp. 59-66.
Tsuji, H., and Ikarashi, K., 2004, “In Vitro Hydrolysis of Poly(L-Lactide) Crystalline Residues as Extended-Chain Crystallites: II. Effects of Hydrolysis Temperature,” Biomacromol., 5, pp. 1021-1028.
Tsuji, H., and Tsuruno, T., 2010, “Accelerated Hydrolytic Degradation of Poly(L-Lactide)/Poly(D-Lactide) Stereocomplex up to Late Stage,” Polym. Degrad. Stab., 95, pp. 477-484.
Wang, Y., Pan, J., Han, X., Sinka, C., and Ding, L., 2008, “A Phenomenological Model for the Degradation of Biodegradable Polymers,” Biomater., 29, pp. 3393-3401.
Weir, N. A., Buchanan, F. J., Orr, J. F., Farrar, D. F., and Dickson, G. R., 2004, “Degradation of Poly-L-Lactide. Part 2: Increased Temperature Accelerated Degradation,” Proc. Instn. Mech. Engrs. Part. H: J. Eng. in Med., 218, pp. 321-330.
Yamamoto, T., 2010, “Molecular Dynamics of Reversible and Irreversible Melting in Chain-Folded Crystals of Short Polyethylene-Like Polymer,” Macromol., 43, pp. 9384-9393.
Zong, X. H., Wang, Z. G., Hsiao, B. S., Chu, B., Zhou, J. J., and Jamiolkowski, D. D., 1999, “Structure and Morphology Changes in Absorbable Poly(glycolide) and Poly(glycolide- co-lactide) during in Vitro Degradation,” Macromol., 32, pp. 8107-8114.
Chapter 5
Amass, W., Amass, A., and Tighe, B., 2008, “A Review of Biodegradable Polymers: Uses, Current Developments in the Synthesis and Characterization of Biodegradable Polyesters, Blends of Biodegradable Polymers and Recent Advances in Biodegradation Studies,” Polym. Int., 47, pp. 89-144.
Aiken, W., Alfrey, T., Janssen, A., and Mark, H., 1947, “Creep Behavior of Plasticized Vinylite VYNW,” J. Polym. Sci., 2, pp. 178-198.
Alexander, L. E., 1969, X-Ray Diffraction Methods in Polymer Science, John Wiley & Sons, New York, Chap. 1.
169
Chu, C. C., 1981, “Hydrolytic Degradation of Polyglycolic Acid: Tensile Strength and Crystallinity Study,” J. Appl. Polym. Sci., 26, pp. 1727-1734.
Fischer, E. W., Sterzel, H. J., and Wegner, G., 1973, “Investigation of the Structure of Solution Grown Crystals of Lactide Copolymers by Means of Chemical Reactions,” Kolloid-Z. u. Z. Polym., 251, pp. 980-990.
Flory, P. J., 1940, “Viscosities of Linear Polyesters. An Exact Relationship between Viscosity and Chain Length,” J. Am. Chem. Soc., 62, pp. 1057-1070.
Higuchi, T., 1961, “Rate of Release of Medicaments from Ointment Bases Containing Drugs in Suspensions,” J. Pharm. Sci., 50, pp. 874-875.
Hsu, S.-T., Tan, H., and Yao, Y. L., 2012a, “Effect of Excimer Laser Irradiation on Crystallinity and Chemical Bonding of Biodegradable Polymer,” Polym. Degrad. Stab., 97, pp. 88-97.
Hsu, S.-T., Tan, H., and Yao, Y. L., 2012b, “Effect of Laser Induced Crystallinity Modification on Biodegradation Profile of Poly(L-Lactic Acid),” J. Manuf. Sci. Eng., submitted.
Kirkpatrick, A., 1940, “Some Relations between Molecular Structure and Plasticizing Effect,” J. Appl. Phys., 11, pp. 255-261.
Lao, L. L., Venkatraman, S. S., and Peppas, N. A., 2009, “A Novel Model and Experimental Analysis of Hydrophilic and Hydrophobic Agent Release from Biodegradable Polymers,” J. Biomed. Mater. Res. A., 90, pp. 1054-1065.
Ljungberg, N. and Wesslen, B., 2002, “The Effects of Plasticizers on the Dynamic Mechanical and Thermal Properties of Poly(Lactic Acid),” J. Appl. Polym. Sci., 86, pp. 1227-1234.
Lyu, S. and Untereker, D., 2009, “Degradability of Polymers for Implantable Biomedical Devices,” Int. J. Mol. Sci., 10, pp. 4033-4065.
Lyu, S., Schley, J., Loy, B., Lind, D., Hobot, C., Sparer, R., and Untereker, D., 2007, “Kinetics and Time-Temperature Equivalence of Polymer Degradation,” Biomacromol., 8, pp. 2301-2310.
Marcilla, A. and Beltran, M., 2004, “Mechanisms of Plasticizers Action,” in: Wypych, G., ed., Handbook of Plasticizers, ChemTec Publishing, Toronto, Chap. 5.
Painter, P. C. & Coleman, M. M., Fundamentals of Polymer Science: An Introductory Text, Technomic Publishing, Lancaster, Chap. 8.
Pitt, C. G. and Gu, Z., 1987, “Modification of the Rates of Chain Cleavage of Poly(ε-Caprolactone) and Related Polyesters in the Solid State,” J. Controlled Release, 4, pp. 283-292.
Rothstein, S. N. and Federspiel, W. J., Little, S. R., 2009, “A Unified Mathematical Model for the Prediction of Controlled Release from Surface and Bulk Eroding Polymer Matrices,” Biomater., 30, pp. 1657-1664.
170
Rothstein, S. N., Federspiel, W. J., and Little, S. R., 2008, “A Simple Model Framework for the Prediction of Controlled Release from Bulk Eroding Polymer Matrices,” J. Mater. Chem., 18, pp. 1873-1880.
Saltzman, W. M. and Langer, R., 1989, “Transport Rates of Proteins in Porous Materials with Known Microgeometry,” Biophys. J., 55, pp. 163-171.
Spenlehauer, G., Vert, M., Benoit, J.-P., Chabot, F., and Veillard, M., 1988, “Biodegradable Cisplatin Microspheres Prepared by the Solvent Evaporation Method: Morphology and Release Characteristics,” J. Controlled Release, 7, pp. 217-229.
Stephens, C. H., Whitmore, P. M., Morris, H. R., and Bier, M. E., 2008, “Hydrolysis of the Amorphous Cellulose in Cotton-Based Paper,” Biomacromol., 9, pp. 1093-1099.
Tsuji, H. and Ikada, Y., 1998, “Properties and Morphology of Poly(L-Lactide). ii. Hydrolysis in Alkaline Solution,” J. Polym. Sci. A: Polym. Chem., 36, pp. 59-66.
Ueberreiter, K. and Kanig, G., 1952, “Self-Plasticization of Polymers,” J. Colloid Sci., 7, pp. 569-583.
Wadso, L. and Karlsson, O. J., 2013, “Alkaline Hydrolysis of Polymers with Ester Groups Studied by Isothermal Calorimetry,” Polym. Deg. Stab., 98, pp. 73-78.
Wang, Y., Pan, J., Han, X., Sinka, C., and Ding, L., 2008, “A Phenomenological Model for the Degradation of Biodegradable Polymers,” Biomater., 29, pp. 3393-3401.
Wilhelm, P. and Stephan, D., 2007, “Photodegradation of Rhodamine B in Aqueous Solution via SiO2@TiO2 Nano-Spheres,” J. Photochem. Photobio. A: Chem., 185, pp. 19-25.
Xiao, H., Lu, W., and Yeh, J., 2009, “Effect of Plasticizer on the Crystallization Behavior of Poly(Lactic Acid),” J. Appl. Polym. Sci., 113, pp. 112-121.
Yeh, J., Huang, C., Chai, W., and Chen, K., 2009, “Plasticized Properties of Poly (Lactic Acid) and Triacetine Blends,” J. Appl. Polym. Sci., 112, pp. 2757-2763.
171
Appendix
This appendix details data processing, numerical models, sample preparation process for gel
permeation chromatography (GPC), and the publications associated with the work achieved in
this thesis. The appendix is divided into four parts. The first part explains the calculation of
polymer crystallinity from the wide angle x-ray diffraction (WAXD) method. The second part
describes the numerical models developed in this thesis. The third part gives the purification
process of drug loaded samples for the GPC measurements. Publications based on the work
done in this thesis are included in the fourth part.
A.1 Calculation of Polymer Crystallinity from Wide Angle X-Ray Diffraction Method
Under the assumption that the x-ray diffraction intensity from the atom in the amorphous region
is the same as that in the crystalline region, polymer crystallinity is determined based on the
WAXD profiles. The crystallinity is the ratio of the crystalline peak area to the area under the
overall profile. To calculate the area, the background of WAXD profiles needs to be removed
first. A MATLAB program, crystallinity.m, has been written to remove the background. In
the program, the increment and range of WAXD measurement is defined in terms of 2θ values as
x_sec=0.029;
x_min=0.295;
x_max=100.751;
The experiment result, in the .txt format, is imported into the program through
y=load('WAXD result.txt');
The data points to determine the background are defined at both ends of the WAXD profiles.
172
For the left end of the WAXD profile, the data points are
x_linefit_left1=100;
x_linefit_right1=200;
which means the 100th to 200th data point from the left end of the WAXD profile are used to
determine the background. Similarly, for the right end of the WAXD profile, the data points are
x_linefit_left2=3000;
x_linefit_right2=3165;
The background is fitted through the polyfit function. The profile with background subtracted
is plotted through
fid=fopen('WAXD result_output.txt','wt');
for i=1:sec
fprintf(fid,'%d\n',round(y_cut(1,i)));
end
The processed profile is then saved as WAXD result_output.txt. To determine the crystallinity,
the processed profile is then fitted with the WAXD profiles obtained from the amorphous sample.
The difference between the total area under the processed profile and the area under the
amorphous profile represents the contribution from the crystalline phase. The area contributed
from the crystalline phase divided by the total area is the calculated crystallinity.
A.2 Finite Element Models
In this thesis, three models have been developed based on the finite element method through
COMSOL Multiphysics. The first model, developed in Chap. 3, considers the laser induced
thermal and chemical modifications. The second model, developed in Chap. 4, considers the
173
polymer biodegradation process. The third model, developed in Chap. 5, considers the drug
release process. The three models are described as follows.
A.2.1 Model of Laser Induced Thermal and Chemical Modifications
This 2D symmetric model simulated the coupled thermal and chemical modifications induced by
a single excimer laser pulse. Material properties are defined in Parameters under Global
Definitions. Variables are written in Definitions. Heat capacity is given as 1000[J/(kg*K)] +
(dH/Tm) * flc2hs((T-Tm)[1/K],dT[1/K]) where flc2hs is a smoothed Heaviside function and dT
specifies the interval within which the heat capacity changes due to melting. The rate factor, k,
for chemical reaction is given as A*exp(-E/(8.314[J/(mol*K)]*T))*if(T>Tm,1,0.1) to consider its
dependence with temperature based on the Arrhenius relationship, as well as the polymer chain
state. If the temperature is higher than the melting temperature, the crystalline chains become
mobile and have high rate factor than below the melting temperature. Through if(T>Tm,1,0.1)
it is assumed that the polymer chain below the melting temperature has a rate factor one order of
magnitude smaller than the chain above the melting temperature.
The thermal effect induced by laser irradiation is simulated in the Heat Transfer (ht) model, and
the chemical modification is simulated in the Transport of Diluted Species (chds) model. The
two models are coupled such that the temperature calculated in the Heat Transfer (ht) model
determines the chemical reaction rate in the Transport of Diluted Species (chds) model, and
chemical reaction heat is imported into the Heat Transfer (ht) model. In Heat Transfer (ht),
laser energy is defined in Heat Source 1 as a function of depth, exp((ab)*y[1/m]) and a function
of time, exp(-4*log(2)*((t-2*tp)/tp)^2). The top hat profile of laser energy in space is described
through if(x>bw,0,1), where bw is the beam width. The calculated temperature is imported into
174
the Transport of Diluted Species (chds) model through the variable -rate in Reactions 1. The
variable rate, given in Definitions, is the product of the rate factor, k, and the concentration of
unmodified polymer chains, cP, as specified by the rate equation. The heat generated through
chemical reactions coupled with the Heat Transfer (ht) model, as defined in Heat Source 2.
A.2.2 Model of Polymer Biodegradation Process
This model is developed in a 2D axisymmetric domain to consider the biodegradation of a
circular polymer matrix. Material properties are given in Parameters under Global Definitions,
and variables are written in Definitions. The biodegradation rate is written in form of the
product of the rate constant and the concentration of species involved in a reaction. For
example, the biodegradation rate of the original amorphous chains is given as
k1*c_e*c_w+k2*c_e*c_w*c_m, where k1 is the rate constant for non-autocatalysis degradation,
k2 is the rate constant for autocatalysis degradation, c_e, c_w, and c_m refers to the
concentration of different species as described below. The difference in crystallinity along
thickness due to laser irradiation is expressed as area_cryst in Variables 1.
This model is composed of seven species: non-degraded amorphous chains (c_e), monomers
(c_m), non-degraded crystalline chains (c_c), degraded crystalline chains (c_cs), degraded
amorphous chains in stages 1, 2, and 3 (c_d1, c_d2, and c_d3). The changes of their
concentrations as a function of time and space due to biodegradation are calculated in the
Transport of Diluted Species (chds) model. The initial conditions are specified in Initial Values
1. The reaction rates for all species are specified in Reactions 1. For initial non-degraded
amorphous chains, the reaction rate is -rate_amor-rate_crystallization, which signifies that the
reduction of the initial non-degraded amorphous chains is due to degradation (-rate_amor) and
175
crystallization (-rate_crystallization). Degradation of initial amorphous chains generates
degraded amorphous chains in stage 1. The reaction rate of the degraded amorphous chains in
stage 1 is therefore given as rate_amor-rate_degraded_1-rate_crystallization_deg_1. The term,
rate_amor, is contributed from the degradation of the initial amorphous chains. The term,
-rate_degraded_1, represents the degradation of stage 1 amorphous chains, which generates
stage 2 amorphous chains. The term, -rate_crystallization_deg_1, accounts for the reduction of
stage 1 amorphous chains due to crystallization. Similar reaction equations are given for stage
2 amorphous chains as rate_degraded_1-rate_degraded_2-rate_crystallization_deg_2, and stage
3 amorphous chains as rate_degraded_2-rate_degraded_3-rate_crystallization_deg_3.
Degradation of stage 3 amorphous chains generates monomers, with the rate given as
rate_degraded_3. Concentration change of the crystalline chains is calculated as
rate_crystallization+rate_crystallization_deg_1+rate_crystallization_deg_2+rate_crystallizatio
n_deg_3-rate_cryst. The first three terms signify the contribution of crystalline chains from
amorphous chains. The last term considers the degradation of crystalline chains, which occurs
on crystal fold surfaces and generates the integral fold of crystalline chains.
A.2.3 Model of Drug Release Process
This model is developed as the Transport of Diluted Species (chds) model in a 2D axisymmetric
domain to consider the biodegradation and drug release of a circular polymer matrix. This
model is an extension of the model described in Sec. A.2.2 in that drug molecules and porosity
due to polymer biodegradation are considered, while the governing equations are similar. In
addition to the seven species mentioned in Sec. A.2.2, the eighth species is added to the current
model to consider the addition of drug molecules. The concentration of drug molecules is
c_drug, which is a function of time and space. The reaction rate of drug, given in Reaction 1, is
176
0 assuming no reaction between drug and other species. Polymer degradation generates a
porous structure in the matrix. Assuming the polymer molecular weights forming pores follow
a normal distribution, the porosity, por, is written as 1-(erf((MW-MWr)/sdv)+1)*0.5*bulk as
given in Definitions, where MW is the molecular weight as a function of time and space and
MWr is the molecular weight at which pore starts to form. The diffusivity of drug, Dc_drug, is
proportional to the porosity as specified in Convection and Diffusion 1.
A.3 Purification Process of Drug Loaded PLLA Matrix for GPC measurements
In drug release tests, PLLA matrix is loaded with the model drug, rhodamine B. To measure the
molecular weights of drug loaded PLLA, GPC measurements are performed. The model drug,
with a small molecular weight of 479 g/mol, may block GPC columns, which are designed to
separate macromolecules. Therefore, the drug molecules need to be removed.
To conduct the purification process, around 5 mg of drug loaded matrix is dissolved in 0.1 mL
chloroform through sonication for 5 min. Both drug and PLLA can be dissolved in chloroform,
and a clear solution is obtained. 20 mL methanol is then added into the solution. The solution
is sonicated for 5 min. Drug is dissolved in methanol. PLLA, on the other hand, is not soluble
in methanol and forms the suspension. To collect PLLA suspension, centrifugation is
conducted which separates materials based on mass. The centrifugation is operated at 3000
rpm for 15 min, and PLLA suspension and drug/methanol solution are separated in the centrifuge
tube. The drug/methanol solution, located in the upper part of the tube, is removed, leaving
behind the solid PLLA. This process is repeated up to three times until remained drug is not
visually observable. The collected PLLA is dried in a hood for 48 hours to remove chloroform
and methanol, and then measured by GPC.
177
A.4 Publications Under Candidature
Hsu, S.-T., Tan, H, and Yao, Y. L., 2012, “Effect of Laser Induced Crystallinity
Modification on Biodegradation Profile of Poly(L-lactic Acid),” Journal of Manufacturing
Science and Engineering, submitted.
Also in Proceedings of 31st International Congress on Applications of Lasers and
Electro-Optics (ICALEO), Sept. 2012, M204.
Hsu, S.-T., Tan, H, and Yao, Y. L., 2012, “Effect of Excimer Laser Irradiation on
Crystallinity and Chemical Bonding of Biodegradable Polymer,” Polymer Degradation and
Stability, Vol. 97, No. 1, pp. 88-97.
Also in Proceedings of 30th International Congress on Applications of Lasers and
Electro-Optics (ICALEO), Oct. 2011, M1306.
Hsu, S.-T., Wang, H., Satoh, G., and Yao, Y. L., 2011, “Application of Surface Structuring
with Lasers,” Proceedings of 30th International Congress on Applications of Lasers and
Electro-Optics (ICALEO), M1201, Invited Paper.
Hsu, S.-T. and Yao, Y. L., 2011, “Effect of Film Formation Method and Annealing on
Morphology and Crystal Structure of Poly(L-lactic Acid) Films,” Journal of Manufacturing
Science and Engineering, accepted.
Also in Proceedings of 6th International Manufacturing Science and Engineering
Conference (MSEC), June 2011, MSEC2011-50205.
Hsu, S.-T. and Yao, Y. L., 2013, “Effect of Drug Loading on Laser Modified Polymer
Biodegradation,” Materials Letters, submitted.
178
Hsu, S.-T. and Yao, Y. L., 2013, “Effect of Drug Loading and Laser Surface Melting on
Drug Release Profile from Biodegradable Polymer,” Journal of Applied Polymer Science,
submitted.
Wang, H., Hsu, S.-T., Tan, H., Yao, Y. L., Chen, H., Azer, M. N., 2012, “Predictive
Modeling for Glass-Side Laser Scribing of Thin Film Photovoltaic Cells,” Journal of
Manufacturing Science and Engineering, submitted.
Also in Proceedings of 40th North American Manufacturing Research Conference
(NAMRC), June 2012, NAMRC40-7774.