Embed Size (px)
Citation preview

uth Marijuana Prevention Workgroup - Community Needs Assessment

©Youth Now Page 2 of 44
Executive Summary
This report summarizes the regional needs assessment conducted through the Prevent Coalition Youth
Now Prevention Initiative, in partnership with Clark County Public Health, Battle Ground Prevent
Together, Connect Evergreen, La Center United, Unite Washougal, and West Van for Youth and One
Prevention Alliance of Skamania County. The assessment took place April 2016 through June 2017 and
included two parts: analysis of the quantitative data Healthy Youth Survey (HYS), and OSPI (Office of
Superintendent and Public Instruction School Discipline and Dropout Data) and a stakeholder survey
regarding community priorities and needs. Both were essential to developing effective strategies to meet
the challenges in Clark County and Skamania County around youth marijuana use.
Healthy Youth Survey data clearly established that marijuana use and related risk factors affect all
communities in the region. The workgroup decided to select specific issues influencing youth marijuana
use as “priority populations” instead of focusing on particular geographical areas, ethnicities, or school-
related factors. Adverse Childhood Experiences (ACEs), while familial and individual in effect, become an
environmental and community-wide issue due to prevalence and known correlation to substance abuse
risk across the lifespan. The workgroup analyzed rates of use of marijuana among 10th graders in the
general population and among 10th graders who also reported ACEs-related risk factors.
Key findings
Youth who perceive no or low risk of harm from regular marijuana use were identified as a priority
population.
Youth who report marijuana is easy to get were identified as a priority population.
Youth who have experienced any ACEs-related risk factors were identified as a priority population.
By examining the HYS data in conjunction with the gaps and needs identified in the stakeholder survey, it
was clear that the highest risk factors involve issues that crossed ethnicity, behavioral, and other
demographic categories.
As this report is shared with community leaders, it is important to consider the role of resilience and
cross-sector strategies in primary prevention and continue capturing local conditions to assess the best
opportunities for community-based prevention efforts.

©Youth Now Page 3 of 44
Youth Marijuana Prevention – Needs Assessment Report
A Youth Marijuana Prevention Evaluation Workgroup was formed in spring of 2016 to conduct a regional
need assessment related to youth marijuana use. This work was supported by the Washington State
Department of Health Youth Marijuana Prevention and Education Program funds awarded to Clark and
Skamania Counties. The purpose of the assessment was to understand the community-specific needs to
help inform strategies to prevent youth marijuana use. This report summarizes the four sections of the
needs assessment template provided by the Washington State Department of Health and includes two
phases of the needs assessment: quantitative data analysis and results of a stakeholder survey regarding
community priorities and needs.
Section 1: Understanding Reach and Populations to Serve
The coalitions in the Southwest Washington Region working on marijuana prevention and education are
as follows: Prevent Coalition, Battle Ground Prevent Together, Connect Evergreen, La Center United,
Unite Washougal, West Van for Youth and One Prevention Alliance (Skamania County). Representatives
from all seven coalitions meet monthly to collaborate, share resources and ensure fiscal responsibility.
Prevent Coalition is housed within ESD 112 with the mission to support and connect communities to build
resilience and prevent youth substance abuse in Clark County. Prevent Coalition is the lead organization
for the Department of Health Youth Marijuana Prevention and Education Program through Department
of Health and co-author of this needs assessment.
Battle Ground Prevent Together is a community coalition with the overall goal to prevent and reduce
youth substance abuse in the Battle Ground community by working with all sectors of the community to
build resiliency, strengthen relationships and provide education for families and community members.
Prevent Together is funded through the federal Drug Free Communities Support Program and works
collaboratively with Prevent Coalition.
Connect Evergreen is the newest substance abuse prevention coalition serving the Evergreen School
District boundaries in Vancouver, Washington. Prevent Coalition formally mentored Connect Evergreen
to build capacity and apply for the Drug Free Communities Grant in March of 2017.
La Center United formed in 2013 to serve the La Center community and was mentored by Prevent
Coalition to successfully build capacity and receive a Drug Free Communities Grant in the fall of 2015. La
Center United’s Mission is: Inspiring our community to be safe, healthy and resilient; Preventing
destructive behavior through open access to education and environmental strategies; Supporting those in
need; sharing ideas and offering help.
Unite! Washougal focuses on collaboration to build a healthy community for youth and families to thrive.
Unite! focuses on healthy choices and reducing substance abuse and underage drinking. Unite! partners
with the local school district to bring Prevention Intervention services to our youth. As a Community
©Youth Now Page 4 of 44
Prevention and Wellness Coalition, Unite! brings direct services that promote parenting skills and social
emotional learning to the community. Unite! partners with Prevent Coalition to promote the Youth Now
messaging and events and training for the Washougal community.
West Van for Youth is a coalition serving the neighborhood of West Vancouver. The coalition focuses on
reducing underage drinking and marijuana use among youth and is funded through the Community
Prevention Wellness Initiative.
One Prevention Alliance is a community coalition serving Skamania County. The coalition receives
Community Wellness Prevention Initiative funding as well as the Drug Free Communities Program. OPA
was formally mentored by Prevent Coalition in 2013 when the coalition applied and received the Drug
Free Communities grant.
Quantitative Data Analysis:
Healthy Youth Survey (HYS), Office of Superintendent and Public Instruction (OSPI)
Healthy Youth Survey is a survey of youth in 6th, 8th, 10th and 12th grades to monitor health risks and
protective factors affecting youth health. This report focuses on 10th graders. Results based on small
numbers of students answering questions are unstable (with high margin of error) and a potential risk of
confidentiality breach. In order to protect confidentiality, data were suppressed where minimum sample
requirements were not met per Clark County Public Health Data Standards. Therefore, if fewer than 30
students selected a given response option, data were suppressed. Appendix A represents a chart of all
data points for each county within the region as requested by Department of Health.
Demographics
Data were gathered on the demographic characteristics of the 10th grade populations in Washington
State, Clark and Skamania Counties who completed the 2016 Healthy Youth Survey. Characteristics by
race/ethnicity, gender, sexual orientation and free or reduced lunch status are reported. Free or reduced
lunch status is intended to serve as a proxy indicator for socioeconomic status.
Table 1. 10th Graders Who Completed the 2016 Healthy Youth Survey by Race/Ethnicity
Population
White/ Caucasian
(NH)
American Indian/ Alaska
Native (NH)
Asian/ Asian
American (NH)
Black/ African
American (NH)
Hispanic
Native Hawaiian/
Pacific Islander (NH)
Multi-racial (NH)
Other (NH)
% (95% CI)
% (95% CI)
% (95% CI)
% (95% CI)
% (95% CI)
% (95% CI)
% (95% CI)
% (95% CI)
WA State 54.5 (47.2, 61.6)
2.4 (1.8, 3.3)
5.5 (4.1, 7.3)
3.1 (2.3, 4.1)
20.3 (13.2, 29.8)
1.4 (1.0, 1.9)
8.5 (7.5, 9.6)
4.2 (3.7, 4.7)
Clark County
64.2 (62.8, 65.7)
2.0 (1.6, 2.4)
5.5 (4.9, 6.3)
3.3 (2.8, 3.9)
10.9 (1.0, 11.8)
1.8 (1.5, 2.3)
6.6 (5.9, 7.4)
5.5 (4.9, 6.2)
Skamania County
63.8 (50.4, 75.4)
5.2 (1.6, 15.3)
0.0 (0.0, 0.0)
0.0 (0.0, 0.0)
12.1 (5.7, 23.6)
1.7 (0.2, 11.9)
15.5 (8.1, 27.6)
1.7 (0.2, 11.9)
NH=Non-Hispanic

©Youth Now Page 5 of 44
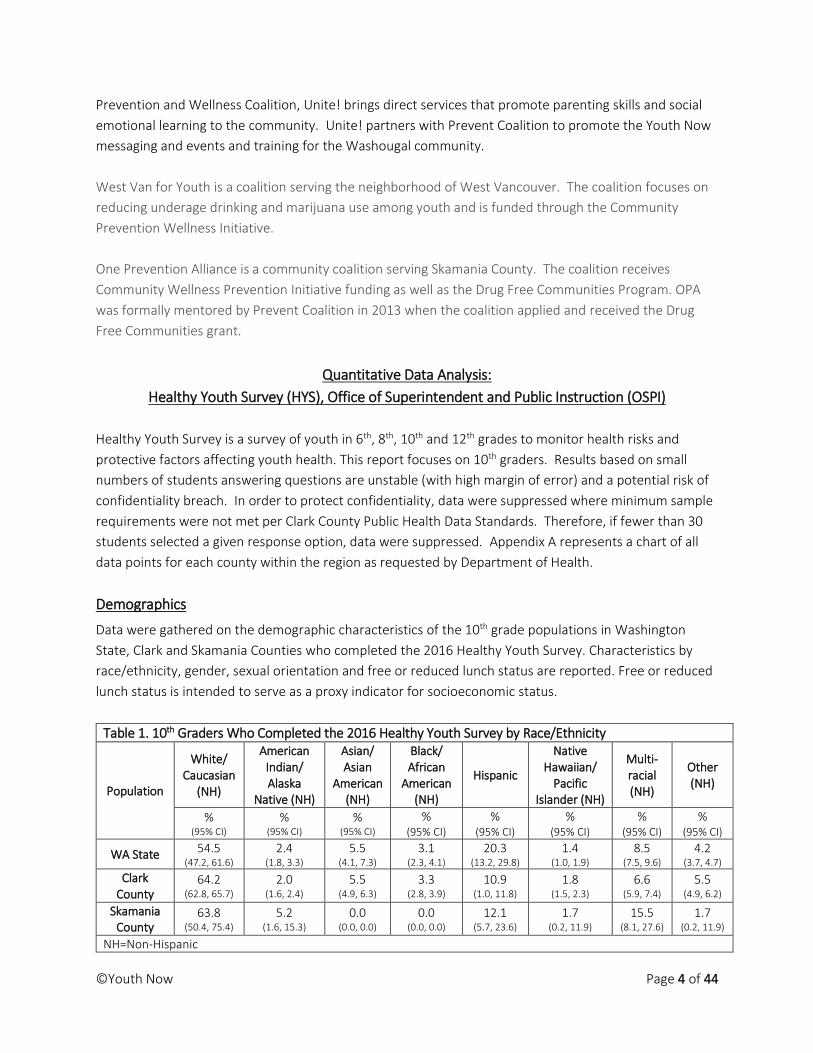
There was a greater proportion of 10th graders who identified as White/Caucasian (NH) (64.2%) in Clark
County than Washington State (54.5%). Additionally, there was a lower proportion of 10th graders who
identified as Hispanic (10.9%) and Multiracial (6.6%) in Clark County than in Washington State, with 20.3%
and 8.5% identifying as Hispanic and Multiracial, respectively.
Table 2. 10th Graders Who Completed the 2016 Healthy Youth Survey by Gender, Sexual Orientation and Free/Reduced Lunch Status
Population Male Female
Hetero-sexual
LGBQ Free/ Reduced
Lunch
No Free/ Reduced
Lunch
Unsure of Free/ Reduced Lunch
Status
% (95% CI)
% (95% CI)
% (95% CI)
% (95% CI)
% (95% CI)
% (95% CI)
% (95% CI)
WA State 48.5 (47.3, 49.8)
51.5 (50.2, 52.7)
81.6 (80.1, 83.0)
18.4 (16.9, 19.9)
32.3 (26.6, 38.6)
60.4 (53.6, 66.9)
7.2 (6.2, 8.4)
Clark County
47.7 (46.2, 49.2)
52.3 (50.8, 53.7)
82.0 (80.1, 83.8)
18.0 (16.2, 19.9)
26.6 (24.7, 28.5)
68.0 (66.0, 70.0)
5.4 (4.5, 6.4)
Skamania County
56.7 (43.6, 68.9)
43.3 (31.1, 56.4)
85.2 (72.6, 92.6)
14.8 (7.4, 27.4)
46.7 (29.0, 65.2)
40.0 (23.5, 59.1)
13.3 (4.8, 32.0)
Ratios by gender, sexual orientation and free/reduced lunch status were similar across Washington State,
Clark and Skamania Counties. However, a significantly greater proportion of 10th graders in Skamania
County reported receiving free or reduced priced lunches at school (46.7%) compared to Clark County
10th graders (26.6%).
Current Marijuana Use
The HYS question measuring current marijuana use reads: During the past 30 days, on how many days did
you use marijuana or hashish (weed, hash, pot)? Use on any day was reported as current marijuana use.
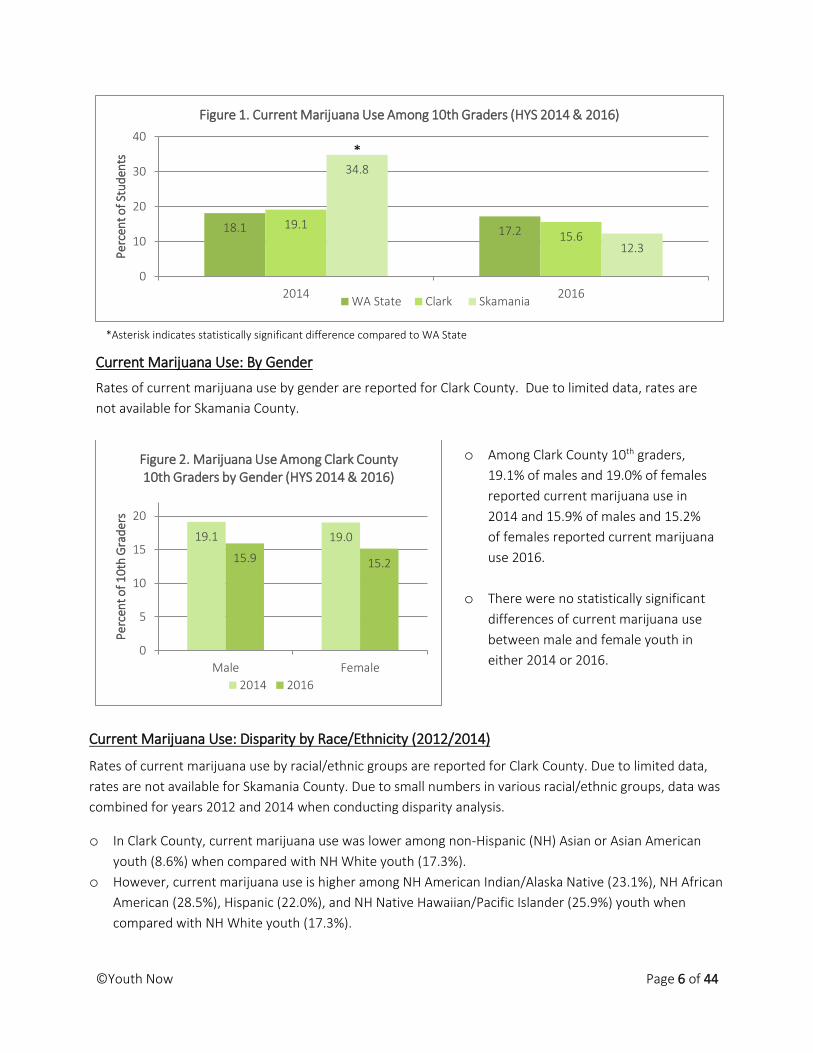
o In Clark County, 19.1% of 10th graders reported current marijuana use in 2014 and 15.6% reported
current marijuana use in 2016. This rate was similar to the statewide average in both years.
o In Skamania County, 35% of 10th graders reported current marijuana use in 2014. This rate is
significantly higher than the statewide average. In 2016, only 12.3% of 10th graders in Skamania
County reported current marijuana use.
©Youth Now Page 6 of 44
Current Marijuana Use: By Gender
Rates of current marijuana use by gender are reported for Clark County. Due to limited data, rates are
not available for Skamania County.
Current Marijuana Use: Disparity by Race/Ethnicity (2012/2014)
Rates of current marijuana use by racial/ethnic groups are reported for Clark County. Due to limited data,
rates are not available for Skamania County. Due to small numbers in various racial/ethnic groups, data was
combined for years 2012 and 2014 when conducting disparity analysis.
o In Clark County, current marijuana use was lower among non-Hispanic (NH) Asian or Asian American
youth (8.6%) when compared with NH White youth (17.3%).
o However, current marijuana use is higher among NH American Indian/Alaska Native (23.1%), NH African
American (28.5%), Hispanic (22.0%), and NH Native Hawaiian/Pacific Islander (25.9%) youth when
compared with NH White youth (17.3%).
18.1 17.219.1
15.6
34.8
12.3
0
10
20
30
40
2014 2016
Pe
rcen
t o
f St
ud
ents
Figure 1. Current Marijuana Use Among 10th Graders (HYS 2014 & 2016)
WA State Clark Skamania
19.1 19.0
15.9 15.2
0
5
10
15
20
Male Female
Pe
rcen
t o
f 1
0th
Gra
der
s
Figure 2. Marijuana Use Among Clark County 10th Graders by Gender (HYS 2014 & 2016)
2014 2016
*
*Asterisk indicates statistically significant difference compared to WA State
o Among Clark County 10th graders,
19.1% of males and 19.0% of females
reported current marijuana use in
2014 and 15.9% of males and 15.2%
of females reported current marijuana
use 2016.
o There were no statistically significant
differences of current marijuana use
between male and female youth in
either 2014 or 2016.

©Youth Now Page 7 of 44
Current Marijuana Use: Disparity by Race/Ethnicity (2014/2016)
Rates of current marijuana use by racial/ethnic groups are reported or Clark County. Due to limited data,
rates are not available for Skamania County. Due to small numbers in various racial/ethnic groups, data was
combined for years 2014 and 2016 when conducting disparity analysis.
o In Clark County, current marijuana use was significantly lower among non-Hispanic (NH) Asian/Asian
American youth (7.7%) when compared with NH White youth (16.8%).
o However, current marijuana use is significantly higher among NH Black/African American youth
(27.2%), Hispanic/Latino youth (21.0%), and NH Native Hawaiian/Pacific Islander youth (23.6%) when
compared with NH White youth (16.8%).
17.3
23.1
8.6
28.5
22.025.9
19.4
0
5
10
15
20
25
30
White /Caucasion NH
(reference)
AmericanIndian / Alaska
Native NH
Asian / AsianAmerican NH
Black / AfricanAmerican NH
Hispanic /Latino
NativeHawaiian /
PacificIslander NH
Multiracial NH
Pe
rcen
t o
f St
ud
ents
Figure 3. Current Marijuana Use by Race/Ethnicity among Clark County 10th Graders, (HYS 2012/2014)
*
**
16.820.0
7.7
27.2
21.023.6
19.6
0
5
10
15
20
25
30
White /Caucasion NH
(reference)
AmericanIndian / Alaska
Native NH
Asian / AsianAmerican NH
Black / AfricanAmerican NH
Hispanic /Latino
NativeHawaiian /
PacificIslander NH
Multiracial NH
Pe
rcen
t o
f St
ud
ents
Figure 4. Current Marijuana Use by Race/Ethnicty among Clark County 10th Graders, (HYS 2014/2016)
**
*Asterisk indicates statistically significant difference compared to non-Hispanic White race
*Asterisk indicates statistically significant difference compared to non-Hispanic White race
*
*
*

©Youth Now Page 8 of 44
12.8
21.8
0
5
10
15
20
25
Heterosexual (reference) Gay / Lesbian / Bisexual /Questioning
Pe
rcen
t o
f St
ud
ents
Figure 5. Current Marijuana Use by Sexual Orientation among Clark County 10th Graders, HYS
2016
Current Marijuana Use: By Sexual Orientation
Rates of current marijuana use by sexual orientation are reported for Clark County. Due to limited data,
rates are not available for Skamania County.
o In Clark County, current
marijuana use was
significantly higher among
youth who identified as gay,
lesbian, bisexual or were
unsure of their sexual
orientation (21.8%) compared
to youth who identified as
heterosexual (12.8%).
*
*Statistically significant difference compared to heterosexual.

©Youth Now Page 9 of 44
Current Marijuana Use: By Socioeconomic Status
Mother’s education level and student’s free or reduced lunch status were used a proxy indicators for
socioeconomic status. Those students with mothers who have lower educational attainment and those
students who receive free or reduced priced lunch at school are assumed to have a lower socioeconomic
status than students who mothers have a higher educational attainment and those that do not receive free
or reduced priced lunch as school. Rates of current marijuana use by these indicators are reported for Clark
County. Due to limited data, rates are not available for Skamania County.
o In Clark County, current marijuana use was significantly lower among youth with mothers who received
either a Bachelor’s degree (9.6%) or an advanced degree (10.8%) when compared to those with
mothers with a high school education (18.8%).
o In addition, current marijuana use was significantly higher among youth with mother who did not finish
high school (24.8%) when compared to those with mothers with a high school education (18.8%).
24.8
18.816.2
9.6 10.8 12.1
0
5
10
15
20
25
30
Did Not FinishHigh School
Graduated HighSchool or GED
(reference)
Some College orTechnical School
Bachelor'sDegree
AdvancedDegree
Don't Know
Pe
rcen
t o
f St
ud
ents
Figure 6. Current Marijuana Use by Mother's Education Level Among Clark County 10th Graders (HYS 2016)
12.8
22.0
10.6
0
5
10
15
20
25
No (reference) Yes Don't Know
Pe
rcen
t o
f St
ud
ents
Figure 7. Current Marijuana Use by Free/Reduced Lunch Status Among Clark County 10th Graders
(HYS 2016)
*
* * *
o In Clark County, current marijuana
use was significantly higher
among youth who receive free or
reduced priced lunches at school
(22.0%) when compared with
students who do not receive free
or reduced priced lunches at
school (12.8%).
*
*Statistically significant difference from high school graduate/GED.
*Statistically significant difference from no free/reduced lunch.
©Youth Now Page 10 of 44
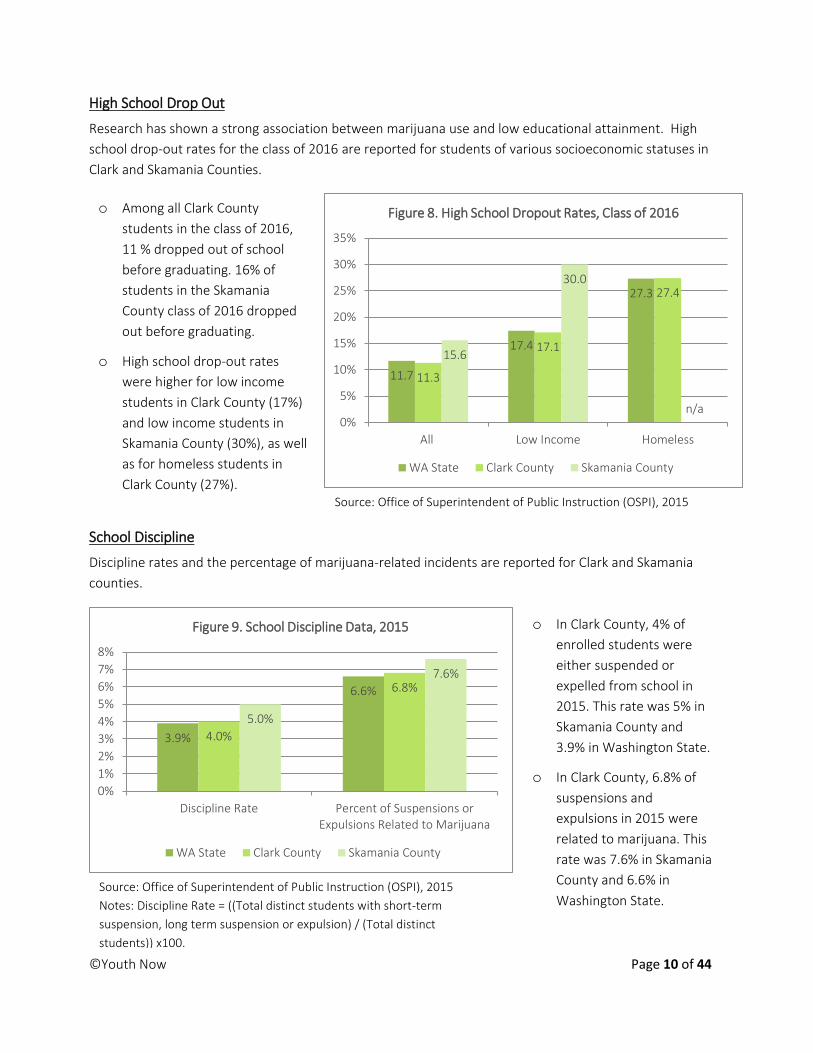
High School Drop Out
Research has shown a strong association between marijuana use and low educational attainment. High
school drop-out rates for the class of 2016 are reported for students of various socioeconomic statuses in
Clark and Skamania Counties.
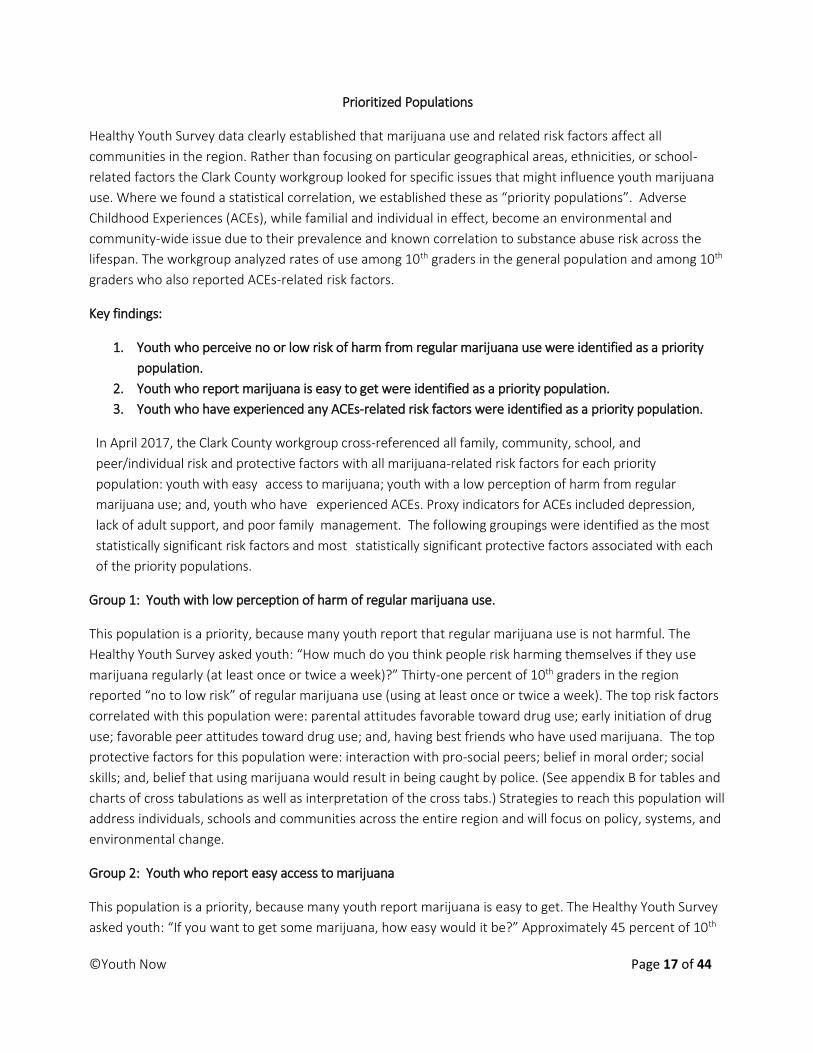
School Discipline
Discipline rates and the percentage of marijuana-related incidents are reported for Clark and Skamania
counties.
3.9%
6.6%
4.0%
6.8%
5.0%
7.6%
0%
1%
2%
3%
4%
5%
6%
7%
8%
Discipline Rate Percent of Suspensions orExpulsions Related to Marijuana
Figure 9. School Discipline Data, 2015
WA State Clark County Skamania County
o Among all Clark County
students in the class of 2016,
11 % dropped out of school
before graduating. 16% of
students in the Skamania
County class of 2016 dropped
out before graduating.
o High school drop-out rates
were higher for low income
students in Clark County (17%)
and low income students in
Skamania County (30%), as well
as for homeless students in
Clark County (27%). Source: Office of Superintendent of Public Instruction (OSPI), 2015
Source: Office of Superintendent of Public Instruction (OSPI), 2015
Notes: Discipline Rate = ((Total distinct students with short-term
suspension, long term suspension or expulsion) / (Total distinct
students)) x100.
11.7
17.4
27.3
11.3
17.1
27.4
15.6
30.0
n/a0%
5%
10%
15%
20%
25%
30%
35%
All Low Income Homeless
Figure 8. High School Dropout Rates, Class of 2016
WA State Clark County Skamania County
o In Clark County, 4% of
enrolled students were
either suspended or
expelled from school in
2015. This rate was 5% in
Skamania County and
3.9% in Washington State.
o In Clark County, 6.8% of
suspensions and
expulsions in 2015 were
related to marijuana. This
rate was 7.6% in Skamania
County and 6.6% in
Washington State.

©Youth Now Page 11 of 44
Youth Risk Factors
Several indicators were analyzed to understand the risk factors impacting youth marijuana use. Indicator
topics address community, family, school, and individual/peer domains. Figure 10 below shows the percent
of youth reporting characteristics that may predict marijuana use.
76
46
66
29
26
42
51
34
44
16
21
34
24
29
53
34
45
14
20
32
23
26
0% 20% 40% 60% 80%
Marijuana easy to get
Perceive no/low risk from regularmarijuana use
Have friends who used marijuana in thepast 12 months
First marijuana use <14 years age
Live with someone who uses marijuana
No parental discussion about NOT usingmarijuana
Has been bullied at least once in the pastmonth
Got mostly C's, D's and F's last year
Figure 10. Marijuana-Related Risk Factors among 10th graders (HYS 2014)
WA State Clark County Skamania County
*
*
*
Skamania n/a
Skamania n/a
*
* Indicates statistically significant difference compared to WA State;
**Regular marijuana use is defined as using once or twice a week
**

©Youth Now Page 12 of 44
Figure 11 below shows youth marijuana-related risk factors among 10th graders in 2016. In Clark County, the
percentage of 10th graders who had friends who used marijuana in the past year (39%) was significantly
lower than in 2014 (44%). In addition, the percentage of 10th graders in Clark County who used marijuana
before the age of 14 significantly decreased from 2014 (16%) to 2016 (12%) and the percentages of 10th
graders who reported having easy access to marijuana also significantly decreased from 2014 (51%) to 2016
(46%). The percentage of 10th graders in Clark County who reported getting mostly C’s, D’s and F’s in school
last year also significantly decreased from 2014 (29%) to 2016 (25%). There were no statistically significant
differences between 2014 and 2016 rates for marijuana-related risk factors in Skamania County.
*Indicates a statistically significant difference compared to WA State
**Regular marijuana use is defined as using at least once or twice a week
39
Skamania n/a
Skamania n/a
19
Skamania n/a
39
35
33
46
31
39
12
20
30
23
25
48
33
42
12
21
31
21
25
0 10 20 30 40 50 60
Marijuana easy to get
Perceive no/low risk from regular marijuana use**
Have friends who used marijuana in the past 12months
First marijuana use <14 years age
Live with someone who uses marijuana
No parent discussion about NOT using marijuana
Has been bullied at least once in the past month
Got mostly C's, D's and F's last year
Percent
Figure 11. Marijuana-Related Risk Factors among 10th Graders (HYS 2016)
WA State Clark County Skamania County
*

©Youth Now Page 13 of 44
Risk Factors Related to Adverse Childhood Experiences (ACEs)
ACEs are potentially traumatic events that can have negative, lasting effects on health and well-being.
Research shows that ACEs are related to youth substance abuse. Indicators in the HYS that may be related
to ACEs were selected to understand prevalence of trauma-related risk factors in the region and assess how
each relates to marijuana use. Topic areas of selected indicators included mental health, suicide, physical
abuse, gang activity, adult support, and poor family management. Poor family management is measured by
asking youth a combination of questions addressing parental engagement, supervision, and appropriate
discipline. Poor family management practices include lack of clear expectations for behavior, failure of
parents to monitor their children – knowing where they are and whom they are with, and inconsistent
punishment. Figure 12 shows the percent of youth experiencing ACEs-related risk factors.
32
Skamania n/a
Skamania n/a
Skamania n/a
38
Skamania n/a
Skamania n/a
Skamania n/a
34
20
10
16
33
27
19
6
35
21
10
15
33
27
19
6
0% 5% 10% 15% 20% 25% 30% 35% 40%
Depression
Consider suicide
Attempt Suicide
Lack of adult support
Poor family management
Physical Abuse
Gang activity
Gang Member
Figure 12. Prevalence of ACEs-Related Risk Factors among 10th Graders (HYS 2014)
WA State Clark County Skamania County

©Youth Now Page 14 of 44
Figure 13 below shows the prevalence of ACEs-related risk factors among 10th graders in 2016. The
percentage of 10th graders in Clark County who reported ever being physically abused by an adult,
significantly decreased from 2014 (27%) to 2016 (21%). There were no statistically significant differences
between 2014 and 2016 rates for ACEs-related risk factors in Skamania County.
28
24
Skamania n/a
Skamania n/a
Skamania n/a
Skamania n/a
17
Skamania n/a
35
20
9
14
33
21
17
5
34
21
10
15
32
23
19
5
0 5 10 15 20 25 30 35 40
Depression
Considered Suicide
Attempted Suicide
Lack of Adult Support
Poor Family Management
Physical Abuse
Gang Activity
Gang Member
Percent
Figure 13. Prevalence of ACEs-Related Risk Factors among 10th Graders (2016)
Washington State Clark County Skamania County

©Youth Now Page 15 of 44
Key Finding: Youth reporting risk factors related to ACEs also reported significantly higher rates of
marijuana use when compared with the overall rate of marijuana use (19%) among 10th graders in Clark
County. Figure 14 shows youth are significantly more likely to use marijuana if they experience any of the
ACEs related risk factors.
Among Clark County 10th graders with depression, 29% also use marijuana
Among ~ 2,207 youth with depression~ 642 of those youth also use marijuana
Among Clark County 10th graders who considered suicide, 35% also use marijuana
Among ~1,266 youth who considered suicide~ 439 of those youth also use marijuana
Among Clark County 10th graders who attempted suicide, 44% also use marijuana
Among ~649 youth who attempted suicide~ 288 of those youth also use marijuana
Among Clark County 10th graders lacking adult support, 34% also use marijuana
Among ~1,064 youth lacking adult support~ 362 of those youth also use marijuana
Among Clark County 10th graders with poor family management, 33% also use marijuana
Among ~2,109 youth with poor family management~702of those youth also use marijuana
Among Clark County 10th graders who were physically abused, 35% also use marijuana
Among ~1.752 youth who were physically abused~ 608 of those youth also use marijuana
Among Clark County 10th graders reporting gang activity, 34% also use marijuana
Among ~1,214 youth reporting gang activity~ 411 of those youth also use marijuana
Among Clark County 10th graders who are gang members, 55% also use marijuana
Among ~389 youth who are gang members~ 213 of those youth also use marijuana
29%35%
44%
34% 33% 35% 34%
55%
0
10
20
30
40
50
60
Depression ConsideredSuicide
AttemptedSuicide
Lack of AdultSupport
Poor FamilyManagement
PhysicalAbuse
Gang Activity GangMember
Pe
rcen
t
Figure 14. Percent Marijuana Use among 10th Graders with ACEs-Related Risk FactorsClark County (2014)
2014 19.1% Marijuana Use among All 10th Graders

©Youth Now Page 16 of 44
Key Finding: Youth reporting risk factors related to ACEs also reported significantly higher rates of
marijuana use when compared with the overall rate of marijuana use (19%) among 10th graders in Clark
County. Figure 15 shows youth are significantly more likely to use marijuana if they experience any of the
ACEs related risk factors.
Among Clark County 10th graders with depression, 24% also use marijuana
Among ~ 1452 youth with depression~ 350 of those youth also use marijuana
Among Clark County 10th graders who considered suicide, 28% also use marijuana
Among ~828 youth who considered suicide~231 of those youth also use marijuana
Among Clark County 10th graders who attempted suicide, 34% also use marijuana
Among ~190 youth who attempted suicide~64 of those youth also use marijuana
Among Clark County 10th graders lacking adult support, 28% also use marijuana
Among ~300 youth lacking adult support~84 of those youth also use marijuana
Among Clark County 10th graders with poor family management, 32% also use marijuana
Among ~627 youth with poor family management~201 of those youth also use marijuana
Among Clark County 10th graders who were physically abused, 24% also use marijuana
Among ~415 youth who were physically abused~101 of those youth also use marijuana
Among Clark County 10th graders reporting gang activity, 31% also use marijuana
Among ~723 youth reporting gang activity~222 of those youth also use marijuana
Among Clark County 10th graders who are gang members, 54% also use marijuana
Among ~199 youth who are gang members~ 108 of those youth also use marijuana
24%28%
34%28%
32%24%
31%
54%
0
10
20
30
40
50
60
Depression ConsideredSuicide
AttemptedSuicide
Lack of AdultSupport
Poor FamilyManagement
PhysicalAbuse
Gang Activity GangMember
Pe
rcen
t
Figure 15. Percent Marijuana Use among 10th Graders With ACEs-Related Risk FactorsClark County (2016)
2016 15.6% Marijuana Use among All 10th Graders
©Youth Now Page 17 of 44
Prioritized Populations
Healthy Youth Survey data clearly established that marijuana use and related risk factors affect all
communities in the region. Rather than focusing on particular geographical areas, ethnicities, or school-
related factors the Clark County workgroup looked for specific issues that might influence youth marijuana
use. Where we found a statistical correlation, we established these as “priority populations”. Adverse
Childhood Experiences (ACEs), while familial and individual in effect, become an environmental and
community-wide issue due to their prevalence and known correlation to substance abuse risk across the
lifespan. The workgroup analyzed rates of use among 10th graders in the general population and among 10th
graders who also reported ACEs-related risk factors.
Key findings:
1. Youth who perceive no or low risk of harm from regular marijuana use were identified as a priority
population.
2. Youth who report marijuana is easy to get were identified as a priority population.
3. Youth who have experienced any ACEs-related risk factors were identified as a priority population.
In April 2017, the Clark County workgroup cross-referenced all family, community, school, and
peer/individual risk and protective factors with all marijuana-related risk factors for each priority
population: youth with easy access to marijuana; youth with a low perception of harm from regular
marijuana use; and, youth who have experienced ACEs. Proxy indicators for ACEs included depression,
lack of adult support, and poor family management. The following groupings were identified as the most
statistically significant risk factors and most statistically significant protective factors associated with each
of the priority populations.
Group 1: Youth with low perception of harm of regular marijuana use.
This population is a priority, because many youth report that regular marijuana use is not harmful. The
Healthy Youth Survey asked youth: “How much do you think people risk harming themselves if they use
marijuana regularly (at least once or twice a week)?” Thirty-one percent of 10th graders in the region
reported “no to low risk” of regular marijuana use (using at least once or twice a week). The top risk factors
correlated with this population were: parental attitudes favorable toward drug use; early initiation of drug
use; favorable peer attitudes toward drug use; and, having best friends who have used marijuana. The top
protective factors for this population were: interaction with pro-social peers; belief in moral order; social
skills; and, belief that using marijuana would result in being caught by police. (See appendix B for tables and
charts of cross tabulations as well as interpretation of the cross tabs.) Strategies to reach this population will
address individuals, schools and communities across the entire region and will focus on policy, systems, and
environmental change.
Group 2: Youth who report easy access to marijuana
This population is a priority, because many youth report marijuana is easy to get. The Healthy Youth Survey
asked youth: “If you want to get some marijuana, how easy would it be?” Approximately 45 percent of 10th
©Youth Now Page 18 of 44
graders in the region report that marijuana is “very or sort of easy” to get. The top risk factors correlated
with this population were: laws and norms favorable to drug use; early initiation of drug use; favorable
attitudes towards drug use; and, having best friends who use marijuana. The top protective factors for this
population were: belief in moral order; social skills; belief that using marijuana would result in being caught
by police; and, perception of risk from regular marijuana use. Strategies to reach this population will address
individuals, schools, and communities across the entire region and will focus on policy, systems, and
environmental change.
Group 3: Youth who experience ACEs related risk factors
This population is a priority, because youth are significantly more likely to use marijuana if they have
experienced any ACEs-related risk factors. Proxy indicators for ACEs-related risk factors were: depression;
lack of adult support; and, poor family management. The Healthy Youth Survey asked youth: “During the
past 12 months, did you ever feel so sad or hopeless almost every day for two weeks or more in a row that
you stopped doing some usual activities?” In our region, 34.4 percent of 10th graders reported “yes.” The
top risk factors correlated with youth experiencing depression were: low commitment to school; age at first
marijuana use; youth who report being bullied at least once in the past month; and, youth who report the
presence of adult support when they feel sad. The top protective factors were: opportunities for pro-social
involvement in the family; rewards for pro-social involvement in school; interaction with pro-social peers at
the individual, peer, and community level. Strategies to reach this population will address individuals,
schools, and communities across the entire region and will focus on policy, systems, and environmental
change.
Of the coalitions listed in Section 1, many specifically focus on the populations prioritized above. For
example, Unite Washougal involves youth who do not think marijuana is harmful, youth who have easy
access to marijuana and youth who experience report experiencing ACEs related risk factors.
Another example is the Connect Evergreen Coalition that specifically focuses on building resilience and
mitigating the negative effects of toxic stress and trauma. The coalition membership reflects the
populations we have prioritized as evidenced by strong membership of students who have stated a need
to understand why marijuana is harmful as well as students who report that marijuana is easy to get.
Of the coalitions listed in Section 1, youth are involved with each coalition in different ways. The Strong
Teens Against Substance Hazards and Abuse is a Clark County wide prevention group that elects coalition
liaisons for each coalition. The STASHA liaison attends the coalition meeting and act as a representative for
youth voice and involvement. Battle Ground Prevent Together has a strong youth coalition called the
DREAM Team that meets weekly. The DREAM Team participates in activities and projects such as the
vSTARS community assessment of vapor stores and community education nights for parents and peers.
Unite! Washougal Community Coalition engages students through opportunities to build leadership skills
and making their voice heard with public speaking. They formed a youth coalition that made a video about

©Youth Now Page 19 of 44
coping skills. They won a scholarship to the Spring Youth Forum and will be reaching out to middle school
youth to help them transition to high school.
Section 2: Risk, Protective and Contributing Factors of Youth Marijuana Use
Stakeholder Feedback Survey Findings
The qualitative survey gathered input from community stakeholders about youth marijuana-related risk
factors, existing resources to address those risk factors, and resources and services needed. The web-based
survey was administered via Survey Monkey to school district prevention interventionists, counselors,
school nurses, social workers, principals, local prevention coalition coordinators, and treatment providers
throughout Clark and Skamania Counties between April 2016- June 2017. An additional survey was
administered between December 2016-March 2017 throughout Clark and Skamania Counties that
specifically targeted Law Enforcement and Health Care Professionals. The first stakeholder feedback survey
received 42 responses. The second stakeholder feedback survey received 18 responses. The following
results of the first survey are summarized and are reported as a percentage of the survey respondents
(Figure 16,17,18). The second survey was changed slightly to include the sector of the respondent and is
reported as a percentage of the survey respondents in figures 19 and 20.
Priority Risk Factors
Community stakeholders responded that the top three
issues affecting youth marijuana use were low
perception of harm (83%), ACEs (73%), and ease of
access (64%). Some respondents also selected
depression (26%), academic risk (24%), and poverty
(17%).
Respondents also identified additional risk factors as follows:
Priority Risk Factors
Low perception of harm (83%)
Adverse Childhood Experiences (73%)
Ease of access (64%)
Domain Additional Risk factors
Community
Societal acceptance and lack of perceived consequences (22%)
Lack of youth-engaging activities (14%)
Lack of research on impacts of marijuana (6%)
Figure 16.
Figure 17.

©Youth Now Page 20 of 44
Protective Factors
Protective factors suggested by stakeholders that may shield youth from marijuana use were:
Expanded Stakeholder Outreach
After completing the first needs assessment in June
2016, the evaluation workgroup expanded the
stakeholder survey outreach to include additional
stakeholders, specifically targeting law enforcement and
health care professionals. The survey was distributed
via Survey Monkey between December 2016 - June
2017 and 18 surveys were collected. Respondents were asked which sector they identified with
(this question was added to the second survey). 61% of the respondents indicated they identify as
Law Enforcement, 22% identify as Health Care Professionals, 5.5% identify as Treatment or other
Youth Serving Agencies, 5.5% identify as Schools, and 5.5% identify as parents.
Family Parental tolerance of marijuana use and lack of communication and engagement with
youth (42%)
School Lack of curriculums addressing legalized marijuana (8%)
Individual/ Peer
Peer pressure and perception that peers are using (31%)
Self-medication and coping with mental health issues (19%)
Domain Protective Factors
Community
Youth-engaging activities (45%)
Mentoring and counseling services (38%)
Positive social norms (17%)
Trauma-informed services (7%)
Culturally competent services (5%)
Family Prevention curriculums and policies (45%)
School Lack of curriculums addressing legalized marijuana (8%)
Individual/Peer Peer support (38%)
Resilience and self-esteem (10%)
Priority Risk Factors
Low perception of harm (78%)
Adverse Childhood Experiences (67%)
Ease of access (56%)
Figure 18.
Figure 19.

©Youth Now Page 21 of 44
Priority Risk Factors
This expanded stakeholder outreach concluded that the top three risk factors contributing to youth
marijuana use are: Low Perception of Harm (78%), Easy Access to Marijuana (67%) and ACEs
(56%). Some respondents also selected depression (28%), academic risk (22%), and poverty (28%).
Respondents also identified additional risk factors as follows:
In the qualitative section of the survey, stakeholders reported concerns about societal view of
marijuana use, consequences of use, and parental tolerance of marijuana use, and the impact
those views have on youth.
Stakeholders suggested protective factors that help shield youth from marijuana use including
school services such as education and prevention programs, extracurricular activities, and
community projects completed by prevention coalitions.
The strategies to increase protective factors will be identified during the strategic planning session
that will take place by the evaluation workgroup once this needs assessment is complete. The
workgroup will ensure effective measurements are identified to evaluate the effectiveness of the
efforts and strategies.
Domain Additional Risk factors
Community
Societal acceptance (40%)
Community Racism (10%)
Family Parental tolerance of marijuana use and lack of communication and engagement with
youth (50%)
School Lack of activities and resources (10%)
Individual/ Peer
Peer pressure and perception that peers are using (30%)
Figure 20.

©Youth Now Page 22 of 44
Section 3: Assessing Resources
Currently existing resources and services addressing priority risk factors were:
Comments from stakeholder survey when asked: “What resources and prevention services are currently
available to address youth marijuana use?”
“We have a strong coalition and prevention/intervention counselors and school counselors in the
schools. We also have a community center but, it is in the city next to ours and the local students do
not have transportation to it.”
“Prevention courses and events such as; life skills, second step, all stars, prevention ed. also event
such as; Teens care 2 and stand up 4 teens”
“Schools, Coalition, Community Health Office, Local Mental Health/Substance Abuse Office, Local
Medical Office”
Needed Resources and Services The resource and service needs reported by stakeholders are described below.
Domain Existing Resources & Services
Community
Community Prevention Coalitions (31%)
Substance-use treatment (17%)
Boys and Girls Club (7%)
Cross-sector engagement (with medical, public health, faith-based, and mental
health communities) (5%)
School
Prevention programs (31%)
Prevention specialist (31%)
Prevention courses (Life Skills, Second Step, All Stars) (5%)
Activities such as sports, music, theatre (5%)
Family /
Individual/ Peer Adult and peer support (5%)
Figure 21.

©Youth Now Page 23 of 44
Resource & Service Needs
Treatment and counseling (24%)
Research on legalized marijuana (19%)
Culturally specific services (14%)
Education on harm and consequences (14%)
Engage youth (14%)
Prevention marketing (11%)
Cross-sector engagement (medical, public health, faith-based, mental health communities) (11%)
Consistent enforcement & consequences (11%)
Affordable & accessible activities (8%)
Trauma-informed discipline (8%)
Mentor & adult support (8%)
Policies for marketing and retail (8%)
Comments made from stakeholders when asked “what resources and prevention services are needed to
address youth marijuana prevention?”
“I believe more face to face involvement in school. Through small group settings.”
“Would be beneficial to provide youth with school credit for attending drug/alcohol treatment
services.”
“On line education is there but generally when people search for side effect to marijuana use they
get all the "scientific" evidence from websites promoting marijuana use first. These companies pay a
lot of money to ,google for example, to have there "adds" pop up first. Real studies and credible in
biased information is way at the bottom of lists on line”

©Youth Now Page 24 of 44
“There are no free community after-school programs in our community for youth. There are also not
enough counselors in our middle and high school to properly assess problems with marijuana and to
effectively introduce interventions with those students. We currently have a very part-time
addictions intervention person who is not employed by the schools. She has not been effective in
establishing relationships with students, in order to properly help them, due to her very part-time
status”
“The schools have some assistance through P.I.'s and counselors, but they all seem to be stretched
too thin. There are some group support and treatment services on-site at the schools, but there
could always be more support for parents and student. If we were able to build strong Prevention
Clubs in the Middle and High Schools, it would strengthen the Peer-to-Peer efforts to reach youth --
which has tremendous potential. The UTC work at Battle Ground High School demonstrates the
power of Student to Student influence”
“Training to help adults better understand students that are different and help develop strategies to
engage students more at school”
Section 4: Assessing Community Readiness
The SW Washington Region is ready to address youth marijuana use and the need for prevention resources
and services. The eight substance abuse prevention coalitions within Clark and Skamania counties work
closely together to ensure collaboration takes place within the entire region. For the past three years, the
coalitions have met monthly as a regional collaborative to support one another, analyze data, provide
technical assistance and plan effective prevention strategies together, especially as they relate to youth
marijuana prevention. The Educational Service District 112 supports and leads the Prevention Intervention
Specialists working in middle and high schools throughout the region. As a result, Prevent has direct access
to students and the priority populations in the schools throughout the region.
Conclusion
The Healthy Youth Survey analysis highlights marijuana-related disparities by race, gender, socioeconomic
status, sexual orientation, and geography, as well as youth characteristics such as academic risk, bullying,
and risk factors related to Adverse Childhood Experiences (ACEs). The school discipline and dropout data
highlights marijuana related disparities by 12th grade dropout rate, dropout rate among low-income
population, and marijuana related discipline rates. The evaluation workgroup engaged in a thorough review
of the data profiles between April 2016 to June 2017 to identify priorities. Since the data profile
demonstrated that marijuana use and related risk factors affect all communities in the region, the
workgroup decided to select specific issues influencing youth marijuana use as “priority populations,”
instead of focusing on particular geographical areas. Consequently, the three priority focus areas selected
were:

©Youth Now Page 25 of 44
Youth who perceive no or low risk of harm from regular marijuana use
Youth who report marijuana is easy to get
Youth who experience Adverse Childhood Experiences
The quantitative and qualitative phases of the assessment each resulted in the prioritization of the same
three focus areas identified above. The evaluation workgroup’s prioritization was based upon review of HYS
data while the feedback survey results reflect the perceptions and experiences of diverse youth-serving
stakeholders in the community. The stakeholder survey also provides information regarding gaps and needs
in the community. Taken together, these findings underscore the priority risk factors impacting youth
marijuana use and the resources needed in the community to address youth marijuana prevention.
The evaluation workgroup will continue building upon this assessment over the next year to help inform and
refine strategies, including narrowing the priority population to address the disparities found. The
evaluation workgroup strives to meet the needs of our unique communities through continual assessment,
outreach, and dissemination of findings. In the next steps, the Evaluation Committee will convene, to
analyze the risk and protective factors included in this report, to choose the strategies and create the
strategic plan.

©Youth Now Page 26 of 44
Acknowledgements
This regional needs assessment was made possible by the Prevent Youth Now Prevention Initiative, in partnerships with Clark County Public Health, Battle Ground Prevent Together, Connect Evergreen, La Center United, One Prevention Alliance (Skamania County), Unite Washougal, and West Van for Youth. Collaboration of these groups and stakeholders within the communities was essential to developing effective strategies to meet the challenges in Clark County and Skamania County around youth marijuana use. Special thanks to the dedication of the follow individuals; Adiba Ali, Epidemiologist Clark County Public Health, Kathleen Lovgren, Epidemiologist Clark County Public Health, Margaret McCarthy, Drug Free Community Program Coordinator Unite! Washougal Community Coalition, Jennifer Kirby Drug Free Community Program Coordinator La Center United, Cyndie Meyer, Program Manager for Chronic Disease Prevention at Clark County Public Health, Kathy Deschner Drug Free Community Program Coordinator Prevent Together Battle Ground Prevention Alliance Coalition, Leanne Reid Prevent Coordinator Educational District 112, Susie Strom Prevention Services Coordinator One Prevention Alliance Community Coalition Skamania County Sheriff's Office, Megan Streeter Prevent Coordinator Educational Service District 112, Joy Lyons Prevention Intervention Coordinator Educational Service District 112.
Funding was provided by Washington State Department of Health, Dedicated Marijuana Account Funding.

©Youth Now Page 27 of 44
Appendix A
Domain Indicator Subpopulation Data Source County Year (%) 95% CI
Dropout
12th Grade Dropout Rate
Overall OSPI Clark 2015 11.3 n/a
Skamania 2015 15.6 n/a
12th Grade Dropout Rate
Low Income OSPI Clark 2015 17.1 n/a
Skamania 2015 30.0 n/a
12th Grade Dropout Rate
Homeless OSPI Clark 2015 27.4 n/a
Skamania 2015 n/a n/a
Discipline
Discipline Rate Overall OSPI Clark 2015 4.0 n/a
Skamania 2015 5.0 n/a
% of Incidents Related to Marijuana
Overall OSPI Clark 2015 6.8 n/a
Skamania 2015 7.6 n/a
Marijuana Discipline Rate / 10,000 Students
Overall OSPI Clark 2015 684.7 per 10,000
Skamania 2015 759.5 per 10,000
Marijuana Overall
Current Marijuana Use 10th Grade
Overall HYS
Clark 2014 19.1 (17.9, 20.2)
2016 15.6 (14.5, 16.7)
Skamania 2014 34.8 (24.3, 47.0)
2016 12.3 (5.8, 24.0)
Gender
Current Marijuana Use 10th Grade
Females HYS
Clark 2014 19.0 (17.5, 20.7)
2016 15.2 (13.7, 16.7)
Skamania 2014 n/a n/a
2016 n/a n/a
Current Marijuana Use 10th Grade
Males HYS
Clark 2014 19.1 (17.5, 20.8)
2016 15.9 (14.4, 17.6)
Skamania 2014 n/a n/a
2016 n/a n/a
Race/ Ethnicity
Current Marijuana Use
10th Grade American Indian or Alaska Native
(NH)
HYS
Clark 2012/14 23.1 (18.4, 28.5)
2014/16 20.0 (14.8, 26.5)
Skamania 2012/14 n/a n/a
2014/16 n/a n/a
Current Marijuana Use 10th Grade
Asian or Asian American (NH)
HYS
Clark 2012/14 8.6 (6.8, 10.8)
2014/16 7.7 (5.6, 10.3)
Skamania 2012/14 n/a n/a
2014/16 n/a n/a
Current Marijuana Use 10th Grade
Black or African American (NH)
HYS
Clark 2012/14 28.5 (24.6, 32.9)
2014/16 27.2 (22.5, 32.6)
Skamania 2012/14 n/a n/a
2014/16 n/a n/a
Current Marijuana Use 10th Grade Hispanic
HYS
Clark 2012/14 22.0 (19.8, 24.5)
2014/16 21.0 (18.5, 23.9)
Skamania 2012/14 n/a n/a
2014/16 n/a n/a
Current Marijuana Use 10th Grade
Multiracial (NH) HYS
Clark 2012/14 19.4 (16.8, 22.2)
2014/16 19.6 (16.6, 23.0)
Skamania 2012/14 n/a n/a
2014/16 n/a n/a
Current Marijuana Use 10th Grade HYS Clark
2012/14 25.9 (21.0, 31.4)
2014/16 23.6 (18.0, 30.4)
Skamania 2012/14 n/a n/a

©Youth Now Page 28 of 44
Domain Indicator Subpopulation Data Source County Year (%) 95% CI
Native Hawaiian or Pacific Islander
(NH) 2014/16 n/a n/a
Current Marijuana Use 10th Grade White or
Caucasian (NH) HYS
Clark 2012/14 17.3 (16.5, 18.2)
2014/16 16.8 (15.9, 17.8)
Skamania 2012/14 n/a n/a
2014/16 n/a n/a
Sexual Orientation
Current Marijuana Use
10th Grade Gay, Lesbian,
Bisexual or Questioning
HYS
Clark 2014 n/a n/a
2016 21.8 (17.5, 26.9)
Skamania 2014 n/a n/a
2016 n/a n/a
Current Marijuana Use 10th Grade
Heterosexual HYS
Clark 2014 n/a n/a
2016 12.8 (11.1, 14.7)
Skamania 2014 n/a n/a
2016 n/a n/a
SES Status (proxy)
Current Marijuana Use 10th Grade
Free/Reduced Price Lunch
HYS
Clark 2014 n/a n/a
2016 22.0 (18.8, 25.7)
Skamania 2014 n/a n/a
2016 n/a n/a
Current Marijuana Use 10th Grade
No Free/Reduced Price Lunch
HYS
Clark 2014 n/a n/a
2016 12.8 (11.1, 14.6)
Skamania 2014 n/a n/a
2016 n/a n/a
Current Marijuana Use
10th Grade Mom’s Education:
Less than High School
HYS
Clark 2014 29.5 (25.6, 33.8)
2016 24.8 (21.1, 29.0)
Skamania 2014 n/a n/a
2016 n/a n/a
Current Marijuana Use
10th Grade: Mom’s Education:
High School or GED
HYS
Clark 2014 24.8 (22.1, 27.7)
2016 18.8 (16.3, 21.5)
Skamania 2014 n/a n/a
2016 n/a n/a
Current Marijuana Use 10th Grade:
Mom’s Education: Some College
HYS
Clark 2014 17.1 (15.0, 19.5)
2016 16.2 (14.0, 18.7)
Skamania 2014 n/a n/a
2016 n/a n/a
Current Marijuana Use 10th Grade:
Mom’s Education: Bachelor’s Degree
HYS
Clark 2014 13.5 (11.3, 15.9)
2016 9.6 (7.8, 11.8)
Skamania 2014 n/a n/a
2016 n/a n/a
Current Marijuana Use 10th Grade:
Mom’s Education: Advanced Degree
HYS
Clark 2014 11.7 (9.1, 14.9)
2016 10.8 (8.2, 14.1)
Skamania 2014 n/a n/a
2016 n/a n/a
Marijuana- Related
Risk Factors
Have friends who used marijuana in the past 12 months
10th Grade Overall
HYS
Clark 2014 44.4 (41.3, 45.6)
2016 39.2 (37.0, 41.4)
Skamania 2014 65.6 (46.9, 80.5)
2016 n/a n/a
Perceive no/low risk of harm regular marijuana use
10th Grade Overall
HYS Clark
2014 34.4 (32.4, 36.4)
2016 31.3 (29.3, 33.3)
Skamania 2014 45.4 (28.8, 63.2)
©Youth Now Page 29 of 44
Domain Indicator Subpopulation Data Source County Year (%) 95% CI
2016 n/a n/a
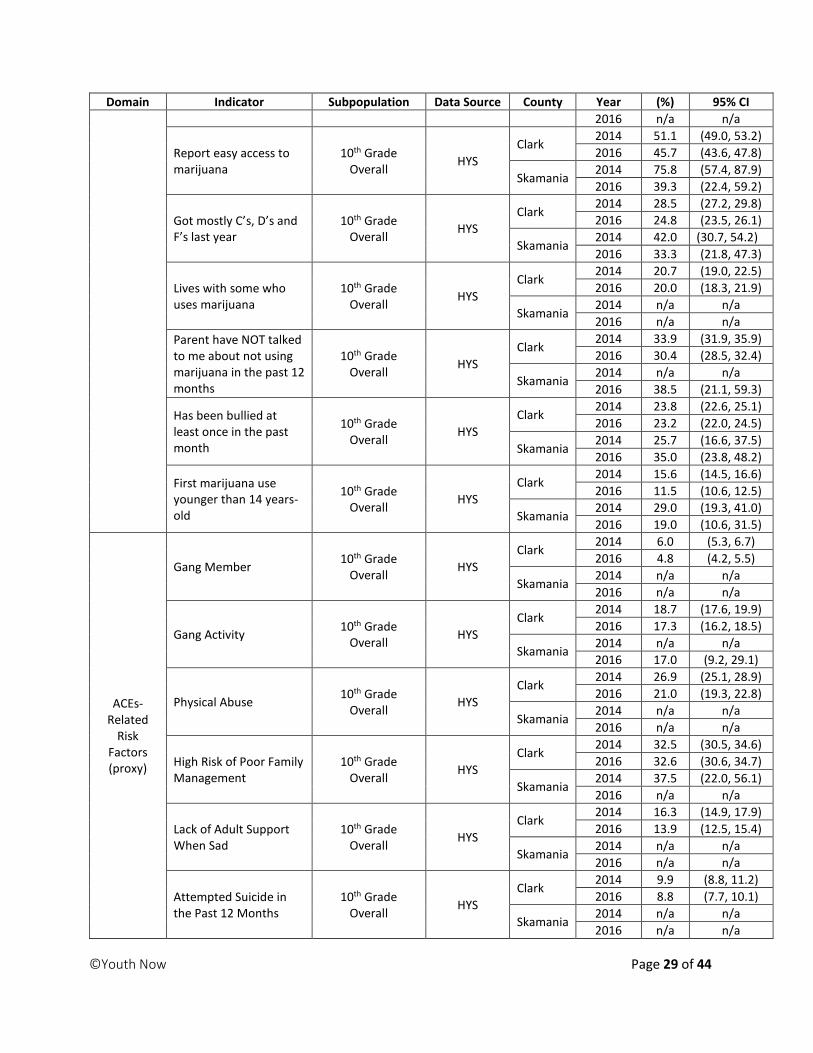
Report easy access to marijuana
10th Grade Overall
HYS
Clark 2014 51.1 (49.0, 53.2)
2016 45.7 (43.6, 47.8)
Skamania 2014 75.8 (57.4, 87.9)
2016 39.3 (22.4, 59.2)
Got mostly C’s, D’s and F’s last year
10th Grade Overall
HYS
Clark 2014 28.5 (27.2, 29.8)
2016 24.8 (23.5, 26.1)
Skamania 2014 42.0 (30.7, 54.2)
2016 33.3 (21.8, 47.3)
Lives with some who uses marijuana
10th Grade Overall
HYS
Clark 2014 20.7 (19.0, 22.5)
2016 20.0 (18.3, 21.9)
Skamania 2014 n/a n/a
2016 n/a n/a
Parent have NOT talked to me about not using marijuana in the past 12 months
10th Grade Overall
HYS
Clark 2014 33.9 (31.9, 35.9)
2016 30.4 (28.5, 32.4)
Skamania 2014 n/a n/a
2016 38.5 (21.1, 59.3)
Has been bullied at least once in the past month
10th Grade Overall
HYS
Clark 2014 23.8 (22.6, 25.1)
2016 23.2 (22.0, 24.5)
Skamania 2014 25.7 (16.6, 37.5)
2016 35.0 (23.8, 48.2)
First marijuana use younger than 14 years-old
10th Grade Overall
HYS
Clark 2014 15.6 (14.5, 16.6)
2016 11.5 (10.6, 12.5)
Skamania 2014 29.0 (19.3, 41.0)
2016 19.0 (10.6, 31.5)
ACEs- Related
Risk Factors (proxy)
Gang Member 10th Grade
Overall HYS
Clark 2014 6.0 (5.3, 6.7)
2016 4.8 (4.2, 5.5)
Skamania 2014 n/a n/a
2016 n/a n/a
Gang Activity 10th Grade
Overall HYS
Clark 2014 18.7 (17.6, 19.9)
2016 17.3 (16.2, 18.5)
Skamania 2014 n/a n/a
2016 17.0 (9.2, 29.1)
Physical Abuse 10th Grade
Overall HYS
Clark 2014 26.9 (25.1, 28.9)
2016 21.0 (19.3, 22.8)
Skamania 2014 n/a n/a
2016 n/a n/a
High Risk of Poor Family Management
10th Grade Overall
HYS
Clark 2014 32.5 (30.5, 34.6)
2016 32.6 (30.6, 34.7)
Skamania 2014 37.5 (22.0, 56.1)
2016 n/a n/a
Lack of Adult Support When Sad
10th Grade Overall
HYS
Clark 2014 16.3 (14.9, 17.9)
2016 13.9 (12.5, 15.4)
Skamania 2014 n/a n/a
2016 n/a n/a
Attempted Suicide in the Past 12 Months
10th Grade Overall
HYS
Clark 2014 9.9 (8.8, 11.2)
2016 8.8 (7.7, 10.1)
Skamania 2014 n/a n/a
2016 n/a n/a

©Youth Now Page 30 of 44
Domain Indicator Subpopulation Data Source County Year (%) 95% CI
Considered Suicide in the Past 12 Months
10th Grade Overall
HYS
Clark 2014 19.5 (18.3, 20.7)
2016 19.8 (18.6, 21.0)
Skamania 2014 n/a n/a
2016 23.7 (14.4, 36.6)
Depression in the Past 12 Months
10th Grade Overall
HYS
Clark 2014 34.0 (32.7, 35.4)
2016 34.6 (33.2, 36.1)
Skamania 2014 31.9 (21.8, 44.0)
2016 28.3 (18.2, 41.3)
n/a = data was not available or suppressed because of low participation
Appendix B
Crosstabs Between HYS Risk/Protective Factors and Marijuana-Related Risk Factors with
Priority Populations, Clark and Skamania Counties Combined, 2016
Methods: Crosstabs between all family, community, school, and peer/individual risk and protective
factors and all marijuana-related risk factors were done with each priority population: kids with easy
access to marijuana, kids with a low perception of harm from regular marijuana use, and kids who have
experienced ACEs (proxies for ACEs include depression, lack of adult support and poor family
management). The following were identified as the most statistically significant risk factors and most
statistically significant protective factors associated with each of the priority populations.
Priority 1: Ease of Access to Marijuana
HYS Question: If you wanted to get some marijuana, how easy would it be for you to get some?
Ease of Access to Marijuana Cross-tabs, 10th Graders from Clark and Skamania Counties, 2016.
(%) (95% Confidence Interval)
Very/Sort of Hard Very/Sort of Easy p-value
t-statistic
Ease of Access to Marijuana 54.8
(52.7, 56.9) 45.2
(43.1, 47.3)
Community Risk Factor: Laws & Norms Favorable to Drug Use
How wrong would most adults in your neighborhood or community think it was for kids your age to:
• Use marijuana? • Drink alcohol? • Smoke cigarettes?
If a kid drank some beer, wine, or hard liquor (for example vodka, whiskey, or gin) in your community, would he or she be caught by the police?
If a kid carried a handgun in your community, would he or she be caught by the police?
If a kid used marijuana in your community, would he or she because by the police?
Low Risk 65.8
(63.4, 68.2) 34.2
(31.6, 36.6)
Risk Factor Protective Factor
©Youth Now Page 31 of 44
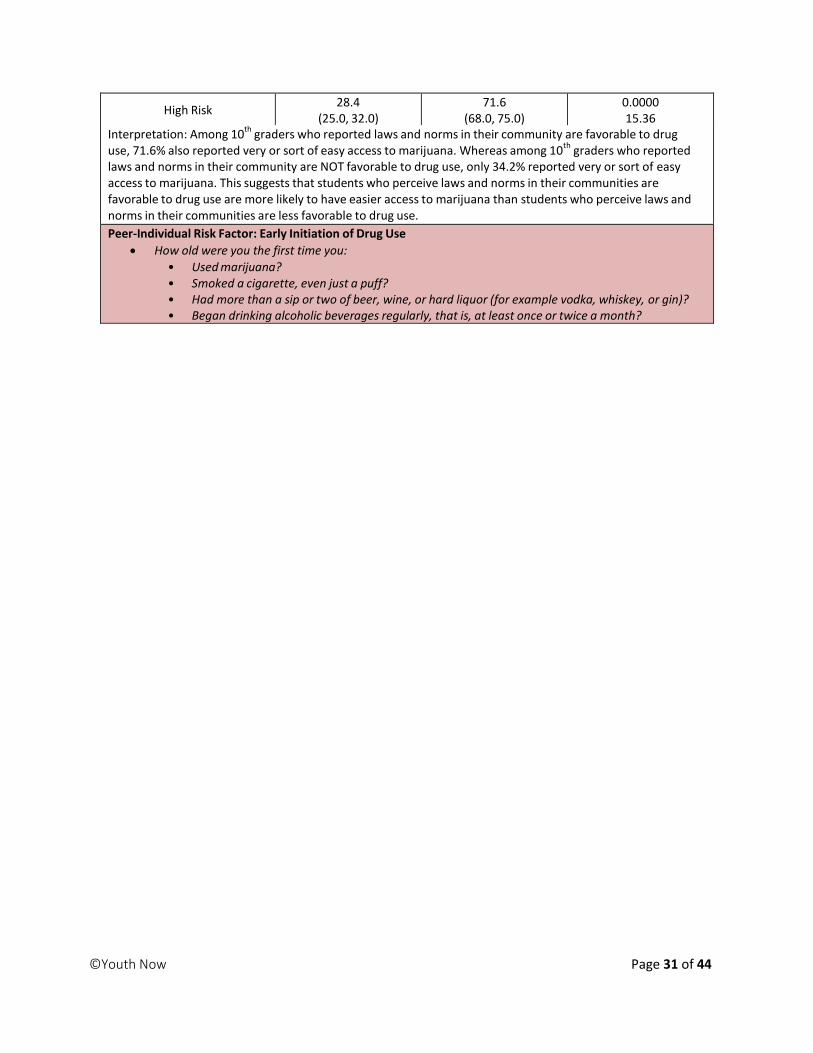
High Risk 28.4
(25.0, 32.0) 71.6
(68.0, 75.0) 0.0000 15.36
Interpretation: Among 10th
graders who reported laws and norms in their community are favorable to drug use, 71.6% also reported very or sort of easy access to marijuana. Whereas among 10
th graders who reported
laws and norms in their community are NOT favorable to drug use, only 34.2% reported very or sort of easy access to marijuana. This suggests that students who perceive laws and norms in their communities are favorable to drug use are more likely to have easier access to marijuana than students who perceive laws and norms in their communities are less favorable to drug use.
Peer-Individual Risk Factor: Early Initiation of Drug Use
How old were you the first time you:
• Used marijuana? • Smoked a cigarette, even just a puff? • Had more than a sip or two of beer, wine, or hard liquor (for example vodka, whiskey, or gin)? • Began drinking alcoholic beverages regularly, that is, at least once or twice a month?

©Youth Now Page 32 of 44
Low Risk 63.1
(60.8, 65.4) 36.9
(34.6, 39.2)
High Risk 19.5
(15.9, 23.8) 80.5
(76.2, 84.1) 0.0000 14.12
Interpretation: Among 10th
graders who began using drugs at a young age, 80.5% also reported very or sort of easy access to marijuana. Whereas among 10
th graders who did not begin using drugs at a young age, only
36.9% reported having very or sort of easy access to marijuana. This suggests that early initiation of drug use is a risk factor for easy access to marijuana.
Peer-Individual Risk Factor: Favorable Attitudes Towards Drug Use
How wrong do YOU think it is for someone your age to:
• Drink beer, wine, or hard liquor (for example vodka, whiskey, or gin) regularly? • Smoke cigarettes? • Use marijuana? • Use LSD, cocaine, amphetamines, or another illegal drug?
Low Risk 69.3
(66.7, 71.8) 30.7
(28.2, 33.3)
High Risk 31.5
(28.3, 34.9) 68.5
(65.1, 71.7) 0.0000 16.02
Interpretation: Among 10th
graders who have favorable attitudes toward drug use, 68.5% also reported very or
sort of easy access to marijuana. Whereas among 10th
graders who have less favorable attitudes toward drug
use, only 30.7% also reported easy access to marijuana. This suggests that 10th
graders who do think it is wrong to use drugs (including alcohol, cigarette, marijuana, and other drugs), tend to have easier access to
marijuana than 10th
graders who think it is wrong to use drugs.
Have best friends who have used marijuana Think of your four best friends (the friends you feel closest to). In the past year (12 months), how many of your best friends have used marijuana?
No 71.5
(68.8, 74.1) 28.5
(26.0, 31.2)
Yes 29.5
(26.3, 32.9) 70.5
(67.1, 73.7) 0.0000 17.20
Interpretation: Among 10th
graders who have best friends who have used marijuana, 70.5% also reported
having very or sort of easy access to marijuana. Whereas among 10th
graders who do not have best friends who have used marijuana, only 28.5% reported having very or sort of easy access to marijuana. This suggests
that 10th
graders who have friends who have used marijuana are significantly more like to have easy access to marijuana. Additional note: Of 10
th graders in Clark and Skamania Counties who reported getting marijuana in the past
month, 40% said they got it from their friends.
Peer-Individual Protective Factor: Belief in the Moral Order
I think it is okay to take something without asking as long as you get away with it.
I think sometimes it’s okay to cheat at school.
It is all right to beat up people if they start the fight.
It is important to be honest with your parents, even if they become upset or you get punished.
Low Protection 33.8
(30.0, 37.8) 66.2
(62.2, 70.0)
High Protection 62.8
(60.4, 65.2) 37.2
(34.8, 39.6) 0.0000 -11.59
Interpretation: Among 10th
graders who believe in the moral order, 37.2% also reported very or sort of easy access to marijuana. Whereas among 10
th graders who showed low protection for belief in the moral order,
66.2% reported very or sort of easy access to marijuana.

©Youth Now Page 33 of 44
Peer-Individual Protective Factor: Social Skills
You’re looking at CDs in a music store with a friend. You look up and see her slip a CD under coat. She smiles and says, “Which one do you want? Go ahead, take it while nobody’s around.” There is nobody in

©Youth Now Page 34 of 44
sight, no employees, and no other customers. What would you go now?
You are visiting another part of town and you don’t know any of the people your age there. You are walking down the street and some teenager you don’t know is walking toward you. He is about your size. As he is about to pass you, he deliberately bumps into you and you almost lose your balance. What would you say or do?
You are at a party at someone’s house and one of your friends offer you a drink containing alcohol. What would you say or do?
Low Protection 35.4
(31.9, 39.1) 64.6
(60.9, 68.1)
High Protection 66.4
(63.6, 69.0) 33.6
(31.0, 36.4) 0.0000 -12.71
Interpretation: Among 10th
graders have well developed social skills, 33.6% also reported very or sort of easy
access to marijuana. Whereas among 10th
graders who show less developed social skills, 64.6% also reported very or sort of easy access to marijuana. This suggests that students who have better social skills are significantly less likely to have easy access to marijuana than students who have poorer social skills.
Would a kid your age using marijuana get caught by the police? If a kid used marijuana in your neighborhood/community, would he or she be caught by the police?
No 41.8
(39.3, 44.3) 58.2
(55.7, 60.7)
Yes 83.0
(73.9, 85.6) 17.0
(14.4, 20.1) 0.0000 -16.64
Interpretation: Among 10th
grader who thought a kid their age using marijuana would not get caught by the
police, 58.2% also reported having very or sort of easy access to marijuana. Whereas among 10th
graders who thought a kid their age using marijuana would get caught by the police, only 17% also reported having very or sort of easy access to marijuana. This shows that kids who think they would caught by the police for using marijuana are significantly less likely to have easy access to marijuana than kids who think they wouldn’t get caught by the police for using marijuana.
Perception of risk from regular marijuana use How much do you think people risk harming themselves if they: use marijuana regularly (at least once or twice a week)?
No/low risk 32.3
(28.8, 35.9) 67.7
(64.1, 71.2)
Moderate risk 50.5
(46.5, 54.5) 49.5
(45.5, 53.5) 0.0000 -6.50
Great risk 75.1
(72.0, 78.0) 24.9
(22.0, 28.1) 0.0000 -15.84
Interpretation: 10th
graders who perceive no or low risk of harm from regularly using marijuana are significantly more likely to have very or sort of easy access to marijuana (67.7%) than students who perceive a moderate risk of harm (49.5%) or a great risk of harm (24.9%) from regularly using marijuana.
*Row Percentages

©Youth Now Page 35 of 44
Priority 2: Low Perception of Harm from Regular Marijuana Use
HYS questions: How much do you think people risk harming themselves if they: Use marijuana regularly
(at least once or twice a week)?
Perception of Harm from Regular Marijuana Use Cross-tabs, 10th Graders in Clark and Skamania Counties, 2016
(%) (95% Confidence Interval)
No/Low Risk Moderate Risk Great Risk p-value
t-statistic Perception of harm from
regular marijuana use 31.0
(29.1, 33.0) 27.6
(25.7, 29.5) 38.1
(36.1, 40.2)
Family Risk Factor: Parental Attitudes Favorable Toward Drug Use
How wrong do your parents feel it would be for you to: • Drink beer, wine, or hard liquor (for example vodka, whiskey, or gin) regularly (at least once or twice
a month)?
• Smoke cigarettes? o Use marijuana?
Low Risk 18.5
(16.5, 20.7) 26.6
(24.2, 29.0) 51.2
(48.5, 53.9)
High Risk 50.3
(46.9, 53.7) 29.3
(26.3, 32.4) 17.6
(15.2, 20.3) 0.0000 -15.05
Interpretation: Among 10th
graders who are likely to have parents with favorable attitudes toward drug use, 50.3% perceived no or low risk of harm from marijuana use, 29.3% perceived a moderate risk, and only 17.6% perceived a
great risk. Whereas among 10th
graders who are less likely to have parents with favorable attitudes toward drug use, 18.5% perceived no or low risk of harm from marijuana use, 26.6% perceived a moderate risk, and 51.2%
perceived a great risk. This suggests that parental attitudes toward drug use play an important role in 10th
graders perception of harm from regular marijuana use.
Peer-Individual Risk Factors: Early Initiation of Drug Use
How old were you the first time you: • Used marijuana? • Smoked a cigarette, even just a puff? • Had more than a sip or two of beer, wine, or hard liquor (for example vodka, whiskey, or gin)? o Began drinking alcoholic beverages regularly, that is, at least once or twice a month?
Low Risk 23.3
(21.4, 25.4) 28.8
(26.7, 31.0) 44.6
(42.2, 47.0)
High Risk 63.7
(58.8, 68.4) 22.7
(18.8, 27.2) 10.7
(8.0, 14.2) 0.0000 -14.50
Interpretation: Among 10th
graders who are at low risk of early initiation of drug use, 23.3% perceived no or low risk of harm from regular marijuana use, 28.8% perceived a moderate risk of harm, and 44.6% perceived a great
risk of harm. Among 10th
graders who reported first using drugs at a young age, 63.7% perceived no or low risk of harm from regular marijuana use, 22.7% perceived a moderate risk of harm, and only 10.7% perceived a great risk of harm. This suggests that early initiation of drug use is a strong risk factor for low perception of harm from regular marijuana use.
Peer-Individual Risk Factor: Favorable Attitudes Toward Drug Use
46 How wrong do YOU think it is for someone your age to:
46.6 Drink beer, wine, or hard liquor (for example vodka, whiskey, or gin) regularly? 46.7 Smoke cigarettes? 46.8 Use marijuana? o Use LSD, cocaine, amphetamines, or another illegal drug?

©Youth Now Page 36 of 44
Low Risk 16.7 27.7 52.3
(14.8, 18.8) (25.3, 30.2) (49.5, 55.0)
High Risk 54.2 27.4 15.4 0.0000
(50.6, 57.8) (24.3, 30.7) (12.9, 18.1) -16.96 Interpretation: Among 10
th graders who have less favorable attitudes toward drug use, 16.7% perceived no or low
risk of harm from regular marijuana use, 27.7 perceived a moderate risk of harm, and 52.3% perceived a great risk
of harm. Among 10th
graders who have more favorable attitudes toward drug use, 54.2% perceived no or low risk of harm from regular marijuana use, 27.4% perceived a moderate risk of harm, and only 15.4% perceived a great risk of harm. This shows that students who do not believe using alcohol, tobacco, or marijuana is very wrong for a kid their age are significantly more likely to also perceive little harm in regularly using marijuana.
Have best friends who have used marijuana
Think of your four best friends (the friends you feel closest to). In the past year (12 months), how many of your best friends have used marijuana?
No 17.9 27.1 51.6
(15.8, 20.2) (24.6, 29.7) (48.7, 54.5)
Yes 50.2 27.8 19.4 0.0000
(46.6, 53.8) (24.7, 31.2) (16.7, 22.4) -14.38 Interpretation: Among 10
th graders who have best friends who have used marijuana, 50.2% perceived no or low
risk of harm from regularly using marijuana, 27.8% perceived a moderate risk of harm, and 19.4% perceived a great
risk of harm. Whereas among 10th
graders who did not have best friends who have used marijuana, only 17.9% perceived no or low risk of harm and 51.6% perceived a great risk of harm.
Peer-Individual Protective Factor: Interaction with Prosocial Peers
Think of you four best friends (the friends you feel closest to). In the past year (12 months), how many of your best friends have…
o Participated in clubs, organizations or activities at school? o Made a commitment to stay drug-free? o Liked school? o Regularly attended religious services? o Tried to do well in school?
Low Protection 44.3
(40.9, 47.8) 26.8
(23.8, 29.9) 25.0
(22.2, 28.2)
High Protection 20.2
(17.9, 22.6) 27.9
(25.3, 30.6) 49.5
(46.5, 52.5) 0.0000 11.08
Interpretation: Among 10th
graders who reported more opportunities for interaction with prosocial peers, 20.2% perceived no or low risk of harm from regularly using marijuana, 27.9% perceived a moderate risk of harm, and 49.5% perceived a great risk of harm.
Peer-Individual Protective Factor: Belief in the Moral Order
I think it is okay to take something without asking as long as you get away with it.
I think sometimes it’s okay to cheat at school.
It is all right to beat up people if they start the fight.
It is important to be honest with your parents, even if they become upset or you get punished.
Low Protection 53.1
(49.0, 57.2) 26.5
(23.1, 30.3) 17.4
(14.5, 20.7)
High Protection 22.7
(20.7, 24.9) 27.8
(25.6, 30.1) 46.0
(43.5, 48.4) 0.0000 13.01
Interpretation: Among 10th
graders who showed a stronger belief in the moral order, 22.7% perceived no or low risk of harm from regular marijuana use, 27.8% perceived a moderate risk of harm, and 46% perceived a great risk of harm.
Peer-Individual Protective Factor: Social Skills
You’re looking at CDs in a music store with a friend. You look up and see her slip a CD under coat. She smiles and says, “Which one do you want? Go ahead, take it while nobody’s around.” There is nobody in sight, no

©Youth Now Page 37 of 44
employees, and no other customers. What would you go now?
You are visiting another part of town and you don’t know any of the people your age there. You are walking down the street and some teenager you don’t know is walking toward you. He is about your size. As he is about to pass you, he deliberately bumps into you and you almost lose your balance. What would you say or do?
4. You are at a party at someone’s house and one of your friends offer you a drink containing alcohol. What would you say or do?
Low Protection 49.0 27.5 19.4
(45.2, 52.7) (24.3, 31.0) (16.7, 22.6)
High Protection 19.9 27.3 50.1 0.0000
(17.7, 22.3) (24.9, 29.9) (47.3, 53.0) 12.84
Interpretation: Among 10th
grader who showed more developed social skills, 19.9% perceived no or low risk of harm from regular marijuana use, 27.3% perceived a moderate risk of harm, and 50.1% perceived a great risk of harm.
Would a marijuana user get caught by the police? If a kid used marijuana in your neighborhood/community, would he or she be caught by the police?
No 38.1
(35.7, 40.7) 30.0
(27.7, 32.4) 28.9
(26.6, 31.3)
Yes 14.8
(12.3, 17.8) 22.5
(19.5, 25.9) 58.7
(54.9, 62.4) 0.0000 10.36
Interpretation: Among 10th
graders who thought a kid their age using marijuana would get caught by the police, 14.8% perceived no or low risk of harm from regular marijuana use, 22.5% perceived a moderate risk, and 58.7% perceived a great risk of harm.

©Youth Now Page 38 of 44
Priority 3: Depression
HYS Question: During the past 12 months, did you ever feel so sad or hopeless almost every day for two
weeks or more in a row that you stopped doing some usual activities?
Depression Cross-tabs, 10th Graders in Clark and Skamania Counties, 2016 (%)
(95% Confidence Interval) No Yes
p-value
t-statistic
Depression in the past year 65.6
(64.2, 67.0)
School Risk Factor: Low Commitment to School
34.4 (33.0, 35.8)
o How often do you feel the schoolwork you are assigned is meaningful and important?
o How interesting are most of your courses to you?
o How important do you think the things you are learning school are going to be for you later in life?
o Think back over the past year in school. How often did you:
o Enjoy being in school? o Hate being in school? o Try to do your best work in school?
o During the LAST 4 WEEKS, how many whole days of school have you missed because you skipped of “cut”?
Low Risk 73.5
(71.0, 75.9)
High Risk 51.8
(48.5, 55.0)
26.5 (24.1, 29.0)
48.3 (45.0, 51.5)
0.0000 10.24
Interpretation: 10th
graders who expressed a low commitment to school are significantly more likely to have experienced depression in the past year, than 10
th grader who expressed a higher commitment to school. Among
10th
graders who showed a low commitment to school, 48.3% also reported depression in the past year. Whereas among 10
th graders who showed a higher commitment to school, only 26.5% reported depression in the past year.
Age at first marijuana use How old were you the first time you used marijuana?
Never used marijuana 71.4
(69.8, 73.0)
13 or younger 47.6
(43.2, 52.0)
14 or older 50.7
(46.7, 54.7)
28.6 (27.0, 30.2)
52.4 (48.0, 56.8)
49.3 (45.3, 53.3)
0.0000 10.30
0.0000 9.77
Interpretation: 10th
graders who began using marijuana at a young age are significantly more likely to have experienced depression in the past year compared to 10
th graders who have never used marijuana. Among 10
th
graders who first used marijuana at age 13 or younger, 52.4% also reported depression in the past year.
Bullied at least once in the past month A student is being bullied when another student, or group of students, say or do nasty or unpleasant things to him or her. It is also bullying when a student is teased repeatedly in a way he or she doesn’t like. It is NOT bullying when tow students of about the same strength argue or fight. In the last 30 days, how often have you been bullied?
No 72.2
(70.6, 73.7) 27.8
(26.3, 29.4)
Yes 44.1
(41.0, 47.1) 55.9
(52.9, 59.0) 0.0000 16.06

©Youth Now Page 39 of 44
Interpretation: 10th
graders who have been bullied in the past month are significantly more likely to reported experiencing depression in the past year. Among 10
th graders who reported being bullied in the past month, 55.9%
also reported depression n in the past year. Whereas among 10th
graders who did not report being bullied, only 27.8% also reported depression in the past year.
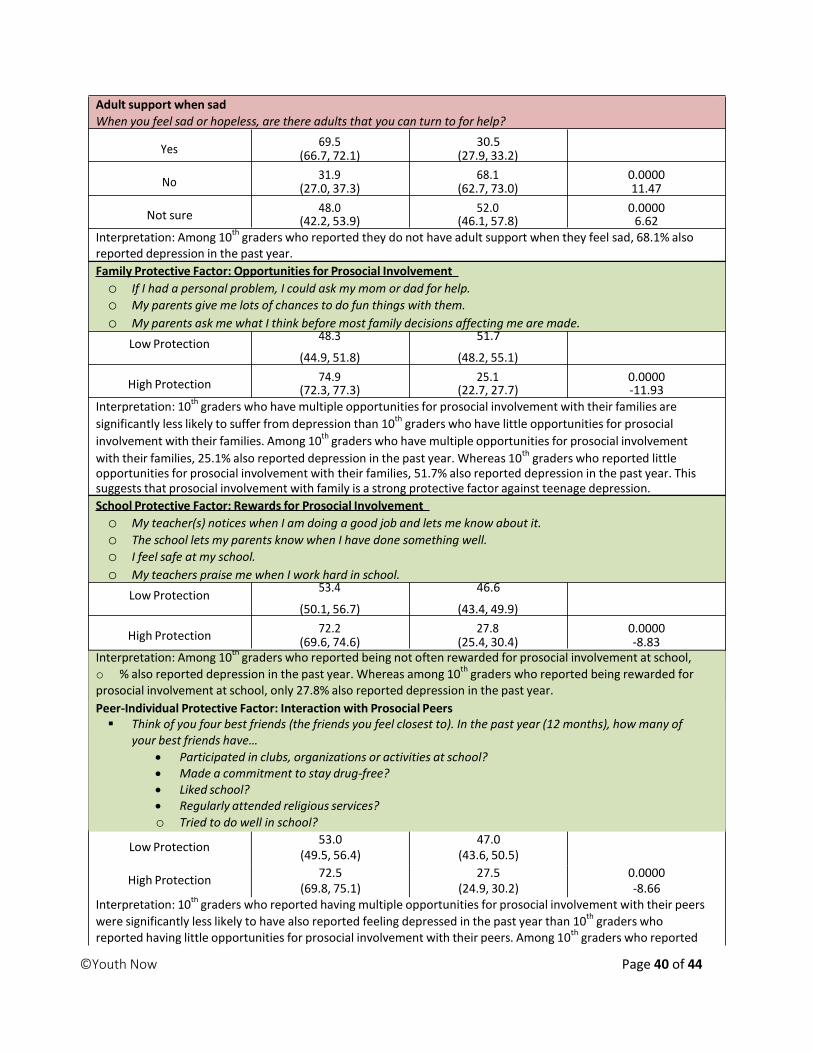
©Youth Now Page 40 of 44
Adult support when sad
When you feel sad or hopeless, are there adults that you can turn to for help?
Yes 69.5 30.5
(66.7, 72.1) (27.9, 33.2)
No 31.9 68.1 0.0000
(27.0, 37.3) (62.7, 73.0) 11.47
Not sure 48.0 52.0 0.0000
(42.2, 53.9) (46.1, 57.8) 6.62 Interpretation: Among 10
th graders who reported they do not have adult support when they feel sad, 68.1% also
reported depression in the past year.
Family Protective Factor: Opportunities for Prosocial Involvement
o If I had a personal problem, I could ask my mom or dad for help.
o My parents give me lots of chances to do fun things with them.
o My parents ask me what I think before most family decisions affecting me are made.
Low Protection 48.3 51.7
(44.9, 51.8) (48.2, 55.1)
High Protection 74.9 25.1 0.0000
(72.3, 77.3) (22.7, 27.7) -11.93 Interpretation: 10
th graders who have multiple opportunities for prosocial involvement with their families are
significantly less likely to suffer from depression than 10th
graders who have little opportunities for prosocial
involvement with their families. Among 10th
graders who have multiple opportunities for prosocial involvement
with their families, 25.1% also reported depression in the past year. Whereas 10th
graders who reported little opportunities for prosocial involvement with their families, 51.7% also reported depression in the past year. This suggests that prosocial involvement with family is a strong protective factor against teenage depression.
School Protective Factor: Rewards for Prosocial Involvement
o My teacher(s) notices when I am doing a good job and lets me know about it.
o The school lets my parents know when I have done something well.
o I feel safe at my school.
o My teachers praise me when I work hard in school.
Low Protection 53.4 46.6
(50.1, 56.7) (43.4, 49.9)
High Protection 72.2 27.8 0.0000
(69.6, 74.6) (25.4, 30.4) -8.83 Interpretation: Among 10
th graders who reported being not often rewarded for prosocial involvement at school,
o % also reported depression in the past year. Whereas among 10th
graders who reported being rewarded for prosocial involvement at school, only 27.8% also reported depression in the past year.
Peer-Individual Protective Factor: Interaction with Prosocial Peers Think of you four best friends (the friends you feel closest to). In the past year (12 months), how many of
your best friends have…
Participated in clubs, organizations or activities at school? Made a commitment to stay drug-free? Liked school? Regularly attended religious services?
o Tried to do well in school?
Low Protection 53.0
(49.5, 56.4) 47.0
(43.6, 50.5)
High Protection 72.5
(69.8, 75.1) 27.5
(24.9, 30.2) 0.0000 -8.66
Interpretation: 10th
graders who reported having multiple opportunities for prosocial involvement with their peers
were significantly less likely to have also reported feeling depressed in the past year than 10th
graders who reported having little opportunities for prosocial involvement with their peers. Among 10
th graders who reported

©Youth Now Page 41 of 44
having little opportunities for prosocial involvement with their peers, 47% also reported depression in the past
year. Whereas among 10th
graders who reported having multiple opportunities for prosocial involvement with their peers, only 27.5% also reported depression in the past year. This suggests that prosocial involvement with peers is a strong protective factor against depression.
Community Protective Factor: Opportunities for Prosocial Involvement
There are adults in my neighborhood or community I could talk to about something important.
Which of the following activities for people your age are available if your community?
o Sports teams and recreation o Scout, Camp Fire, 4-H Clubs, or other service clubs o Boys and Girls Club, YMCA, or other activity clubs
Low Protection 49.8
(45.3, 54.3) 50.2
(45.8, 54.7)
High Protection 68.2
(65.9, 70.4) 31.8
(29.6, 34.1) 0.0000 -7.30
Interpretation: Among 10th
graders who reported multiple opportunities for prosocial involvement in their
communities, 31.8% also reported depression in the past year. Whereas among 10th
graders who reported little opportunities for prosocial involvement in their communities, 50.2% also reported depression in the past year.
*Row percentages

©Youth Now Page 42 of 44
Priority 4: Lack of Adult Support
HYS Question: When you feel sad or hopeless, are there adults that you can turn to for help?
*Could not do cross-tabs for “Lack of Adult Support” and risk and protective factors variables, as well as some marijuana risk factors. The HYS question about adult support was only asked on Form B, whereas risk/protective factors questions as well as many questions on marijuana-related risk factors were only asked on Form A.
Adult Support Cross-tabs, 10th Graders in Clark and Skamania Counties, 2016
(%) (95% Confidence Interval)
Never sad Adult
support NO adult support
Not sure p-value
t-statistic When you feel sad, are there
adults you can turn to? 22.3
(20.7, 24.1) 51.3
(49.2, 53.4) 13.9
(12.5, 15.4) 12.5
(11.2, 13.9)
Bullied at least once in the past month A student is being bullied when another student, or group of students, say or do nasty or unpleasant things to him or her. It is also bullying when a student is teased repeatedly in a way he or she doesn’t like. It is NOT bullying when tow students of about the same strength argue or fight. In the last 30 days, how often have you been bullied?
No 26.1
(24.1, 28.3) 52.6
(50.2, 54.9) 10.4
(9.1, 12.0) 10.9
(9.5, 12.4)
Yes 9.7
(7.5, 12.5) 47.6
(43.4, 51.8) 25.0
(21.5, 28.8) 17.7
(14.7, 21.2) 0.0000
7.64
Interpretation: Among 10th
graders who reported being bullied in the past month, 25% also said they lack adult
support when they feel sad. Whereas among 10th
graders who did not report being bullied in the past month, only 10.4% said they lacked adult support.
Depression in the past year During the past 12 months, did you ever feel so sad or hopeless almost every day for two weeks or more in a row that you stopped doing some usual activities?
No 31.2
(28.9, 33.6) 53.3
(50.7, 55.8) 6.6
(5.5, 8.0) 8.9
(7.6, 10.5)
Yes 4.2
(3.0, 5.9) 47.5
(43.9, 51.1) 28.7
(25.6, 32.1) 19.6
(16.9, 22.6) 0.0000 12.16
Interpretation: Among 10th
graders who reported experiencing depression in the past year, 28.7% also said they do not have adults they can turn to when they feel sad.
*Row percentages

©Youth Now Page 43 of 44
Priority 5: Poor Family Management
HYS Questions:
My parents ask if I’ve gotten my homework done.
Would you parents know if you did not come home on time?
When I am not at home, one of my parents knows where I am and who I am with.
The rules in my family are clear.
My family has clear rules about alcohol and drug use.
If you drank some beer, wine, or liquor (for example vodka, whiskey, or gin) without your parent’s permission, would you be caught by them?
If you carried a handgun without your parent’s permission, would you be caught by them?
If you skipped school, would you be caught by your parents?

©Youth Now Page 44 of 44