Embed Size (px)
Citation preview

Experience you can trust.
UTC Telecom 2009June 3, 2009
David Boroughs
Network Planning for Smart Grid
Page 2
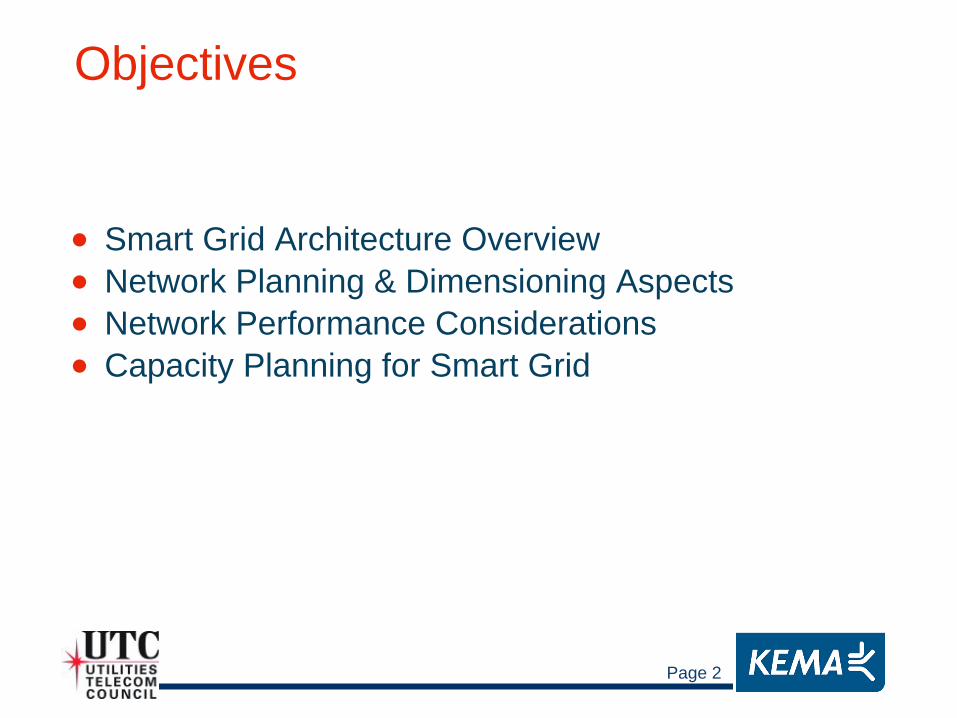
Objectives
•
Smart Grid Architecture Overview•
Network Planning & Dimensioning Aspects
•
Network Performance Considerations•
Capacity Planning for Smart Grid

Page 3
Smart Grid - an Enterprise-Wide Focus.
Advanced Metering
Infrastructure
Advanced Metering
Infrastructure
Distribution Management
MWMMWMOMSOMSGISGIS
T&D Planning & Engineering
Asset MgmtAsset MgmtMaintenanceMgmt
MaintenanceMgmt
SystemsPlanningSystemsPlanning
Communications Infrastructure
Auto SwitchingVoltage ControlsSelf-Healing
Auto SwitchingVoltage ControlsSelf-Healing
Procurement & Market Ops
Planning &ForecastingPlanning &Forecasting
Bidding &SchedulingBidding &
Scheduling
SettlementsSettlements
Trading &ContractsTrading &Contracts
ResourceDispatch
ResourceDispatch
SCADASCADA
EMSEMS OperationsPlanning
OperationsPlanning
DSMDSM
DMSDMST&D Operations
Executive DashboardsExecutive Dashboards
Customer Services
MDMSMDMS CISCIS BillingBillingCall CenterCall Center
Enterprise Level
SystemsIntegration
Plant Info
Plant Info Substation
AutomationSubstation AutomationTransmission
InfoTransmission
Info
Transmission/Dist. Automation
Control Center Ops.
Transmission/Dist. Automation
Control Center Ops.
Production Info
Production InfoPumping
AutomationPumping
Automation TransportationInfo
TransportationInfo
Power/Resource Scheduling
AMI Head End Systems
Line Sensors, Distribution Metering, Other Status Reporting Devices
HAN IVR
Micro Generation: Wind, Solar, Fuel Cell, Battery
PEV/PHEV’s Charging & Billing; scheduling

Page 4
Network Dimensioning for Smart Grid Data
•
Review Current Network Infrastructure Capabilities– Capability to Support Differing Requirements Based
on Criticality of Traffic– Network Capacity and Performance– Impediments to Meeting Business
Objectives/Network Weaknesses•
Required Enhancements to Make Network Infrastructure Supportable– Security Requirements For Operational And Non-
operational Data– Technology Options to Support Requirements

Page 5
Methodology for Network Planning & Optimization•
Communications Architecture Planning, Optimization, Design Process

Page 6
Backbone and Access Networks

Page 7
Revenue meters
Co-existing Field Networks
Feeder protectionVoltage
regulator
SCADA or Distribution
Management System
Line Recloser
Line Recloser
AMI LAN
module
Backfeed Tie Switch
Cell Relay
WAN
OpenWay Meters
LANHAN
AMI Data Network
Capacitor control
Meter Data Management
System
Enterprise WAN
DA Data Network

Page 8
Network Performance Components
• Network Availability: Ensuring Network is Available– Typically 99.999% Uptime for Operational– Excluded Times Of Use Include:
•
Downtime (sometimes excludes maintenance times)•
Bit-error-rate Degradation Below A Useable Threshold•
Network Latency– Maximum Allowable Data Transit Time Through Network– Transit time in seconds for operational, minutes for other data type
•
Quality of Service (QoS) – Critical Data Given Top Priority for Delivery Over Other Data– System Management for Optimal Performance
•
Capacity Planning– System Designed For Adequate Spare Capacity (“Planning Margin”)

Page 9
Capacity Planning Network Traffic Modeling
•
“Operational” and “Non-Operational”, or “Operational Support” Traffic
•
Substation Traffic Load on Backbone Transport Network
•
Distribution Automation Load on Access network•
AMI Traffic load on Access Network
•
HAN Traffic Load on Access Network•
Overall Combined Traffic effects on Total Network
Page 10
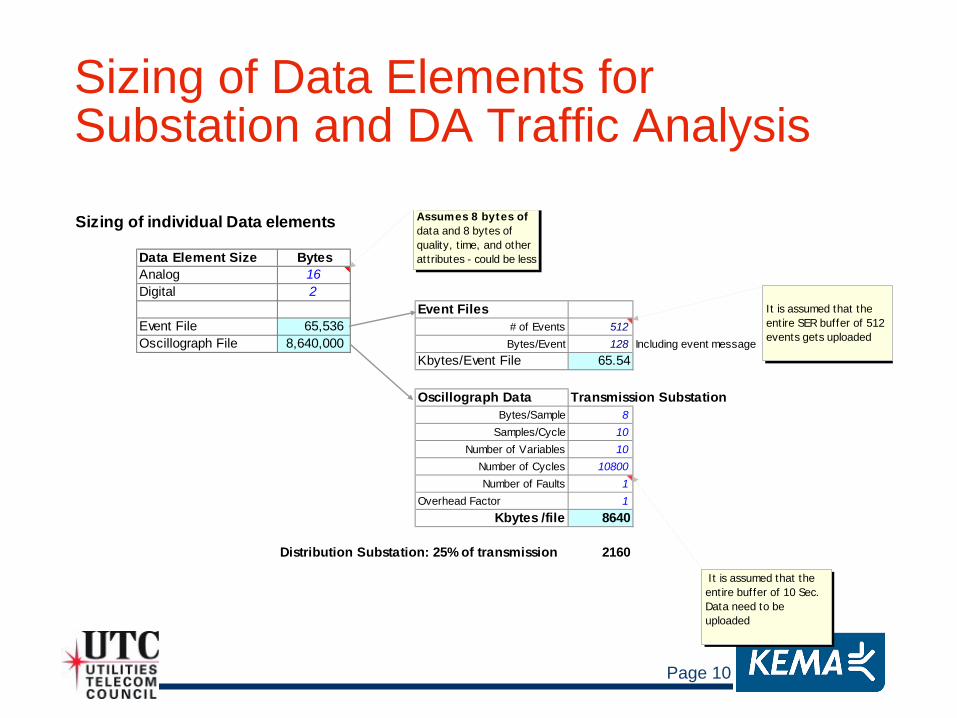
Sizing of Data Elements for Substation and DA Traffic Analysis
Sizing of individual Data elements
Data Element Size BytesAnalog 16Digital 2
Event FilesEvent File 65,536 # of Events 512Oscillograph File 8,640,000 Bytes/Event 128 Including event message
Kbytes/Event File 65.54
Oscillograph Data Transmission SubstationBytes/Sample 8
Samples/Cycle 10Number of Variables 10
Number of Cycles 10800Number of Faults 1
Overhead Factor 1Kbytes /file 8640
Distribution Substation: 25% of transmission 2160
It is assumed that the entire buffer of 10 Sec. Data need to be uploaded
It is assumed that the entire SER buffer of 512 events gets uploaded
Assumes 8 bytes of data and 8 bytes of quality, time, and other attributes - could be less
Page 11
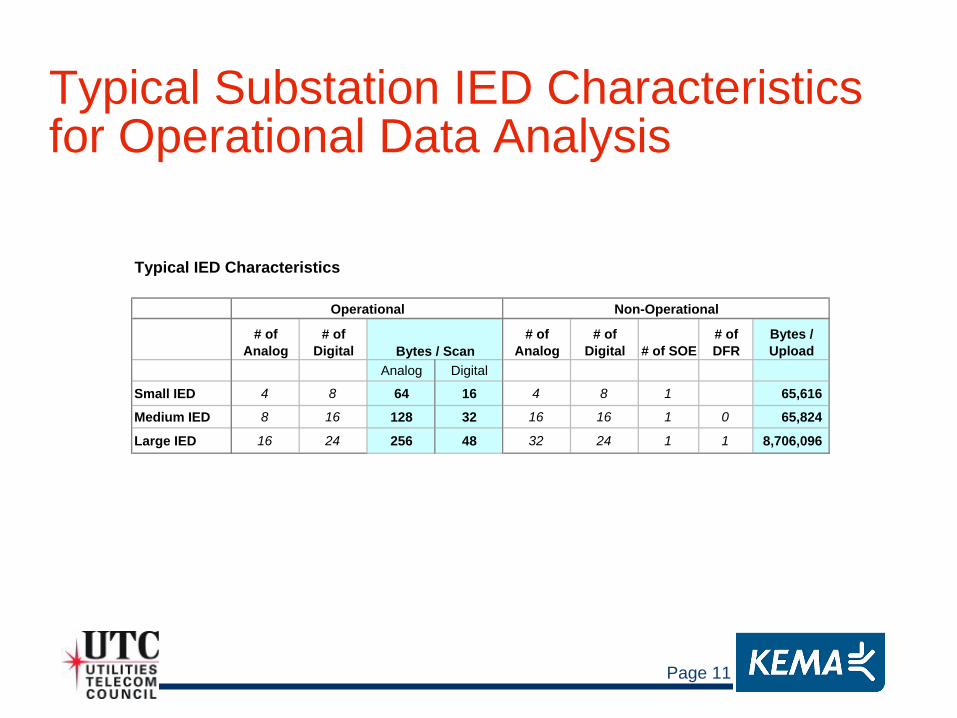
Typical Substation IED Characteristics for Operational Data Analysis
Typical IED Characteristics
# of Analog
# of Digital
# of Analog
# of Digital # of SOE
# of DFR
Bytes / Upload
Analog Digital
Small IED 4 8 64 16 4 8 1 65,616
Medium IED 8 16 128 32 16 16 1 0 65,824
Large IED 16 24 256 48 32 24 1 1 8,706,096
Operational Non-Operational
Bytes / Scan

Page 12
Determination of Bandwidth Capacity
•
Modeling of Substation Traffic Load on TransportTypical Transmission Substation
# of IEDs
A point D Point
Total Point Count
Bytes / Scan
Burst Loading/
Sec
A point
D Point SER DFR % of
Interest
Sec / Upload Scan
Accepted Latency
(sec)Bytes / Upload
Burst Bytes /
SecA D A D
Small IED 40 160 320 480 6 2 6 2 3,200 747 160 320 40 0 30% 600 600 2,624,640 1,312 Medium IED 10 320 160 480 6 2 6 2 1,600 373 160 160 10 0 30% 600 600 658,240 329 Large IED 10 640 240 880 6 2 6 2 3,040 667 320 240 10 10 40% 600 600 87,060,960 58,041
Total SA 60 1120 720 1840 6 7,840 1,787 640 720 60 10 600 90,343,840 59,682 Equivalent data in kilobits 62.72 14.293 Equivalent traffic in megabits 722.75 0.48
Comm Overhead 25% Communications Load offered to Network (kbps) 17.9 Communications Load offered to Network (kbps) 596.8
Typical Distribution Substation `
# of IEDs
A point D Point
Total Point Count
Bytes / Scan
Burst Loading/
Sec
A point
D Point SER DFR % of
Interest
Sec / Upload Scan
Accepted Latency
(sec)Bytes / Upload
Burst Bytes /
SecA D A D
Small IED 10 40 80 120 6 2 6 2 800 187 40 80 10 0 10% 1200 1200 656,160 55 Medium IED 10 80 160 240 6 2 6 2 1,600 373 160 160 10 0 10% 1200 1200 658,240 55 Large IED 5 80 120 200 6 2 6 2 1,520 333 160 120 5 5 10% 1200 1200 11,130,480 928
Total SA 25 200 360 560 6 3,920 893 360 360 25 5 1200 12,444,880 1,037 Equivalent traffic in kilobits 31.36 7.1467 Equivalent traffic in megabits 99.56 0.008
Comm Overhead 25% Communications Load offered to Network (kbps) 8.9 Communications Load offered to Network (kbps) 10.4
Operational Non-Operational
Non-Operational
Sec / Scan
Sec / Scan
Accepted Latency (Sec)
Accepted Latency (Sec)
Operational

Page 13
System Loading Transport Case200 Transmission Substations800 Distribution Substations
# of Substations
Analog Count
Digital Count
Total Count MBits / Scan Burst Loading
(MBits/Sec) Mbits / Upload Burst Loading Mbits / Sec
Transmission 3 3,360 2,160 5,520 0.188 0.04 2,168 1.43 Distribution 12 2,400 4,320 6,720 0.376 0.09 1,195 0.10
Total 15 5,760 6,480 12,240 0.564 0.13 - 3,363 1.53 Comm Overhead 25% Communications Load (Mbps) 0.16 1.913% of Substations participatingTransmission 6 6,720 4,320 11,040 0.376 0.09 4,337 2.86 Distribution 24 4,800 8,640 13,440 0.753 0.17 2,389 0.20
Total 30 11,520 12,960 24,480 1.129 0.26 - 6,726 3.06 Comm Overhead 25% Communications Load (Mbps) 0.32 3.835% of Substations participatingTransmission 10 11,200 7,200 18,400 0.627 0.14 7,228 4.77 Distribution 40 8,000 14,400 22,400 1.254 0.29 3,982 0.33
Total 50 19,200 21,600 40,800 1.882 0.43 - 11,210 5.11 Comm Overhead 25% Communications Load (Mbps) 0.54 6.3810% of Substations participatingTransmission 20 22,400 14,400 36,800 1.254 0.29 14,455 9.55 Distribution 80 16,000 28,800 44,800 2.509 0.57 7,965 0.66
Total 100 38,400 43,200 81,600 3.763 0.86 - 22,420 10.21 Comm Overhead 25% Communications Load (Mbps) 1.07 12.77
Non-Operational DataOperational Data
Operational Data Non-Operational Data
Operational Data Non-Operational Data
Operational Data Non-Operational Data
1.5% of Substations participating

Page 14
Distribution Automation Feeder Requirements
Feeder relay IED, RTU, or DA controller
SubstationLine Switch
Line Switch
Line Switch
Tie SwitchControl Center
Data Req.17 AI x 410 DI x 43.1 Kbps
Data Req.20 AI10 DI0.88 Kbps
Switchgear open/close command for automatic line switches. Occurrence: 3-4 times per year, 160 bits sent in 2 seconds (per switch)
Switchgear open/close command for automatic tie switches. Occurrence: 3-4 times per year, 40 bits sent in 2 seconds (per switch)
Feeder breaker open/close command. Occurrence: 3-4 times per year, 20 bits sent in 2 seconds (per switch)
Data Req.12 AI6 DI0.036 Kbps
VOLT/VAR bank
Data Req.12 AI6 DI0.036 Kbps
VOLT/VAR bank
Line Switch
Line Switch
Tie Switch
Tie Switch
Tie Switch
Tie Switch
Feeder 1
Feeder 2
Feeder 3Feeder
4
Data Req.20 AI10 DI0.88 Kbps
Data Req.20 AI10 DI0.88 Kbps
Data Req.20 AI10 DI0.88 Kbps
Data Req.20 AI10 DI0.88 Kbps
Data Req.20 AI10 DI0.88 Kbps
Data Req.20 AI10 DI0.88 Kbps
Data Req.20 AI10 DI0.88 Kbps
Data Req.20 AI10 DI0.88 Kbps
Data Req.20 AI10 DI0.88 Kbps
Page 15
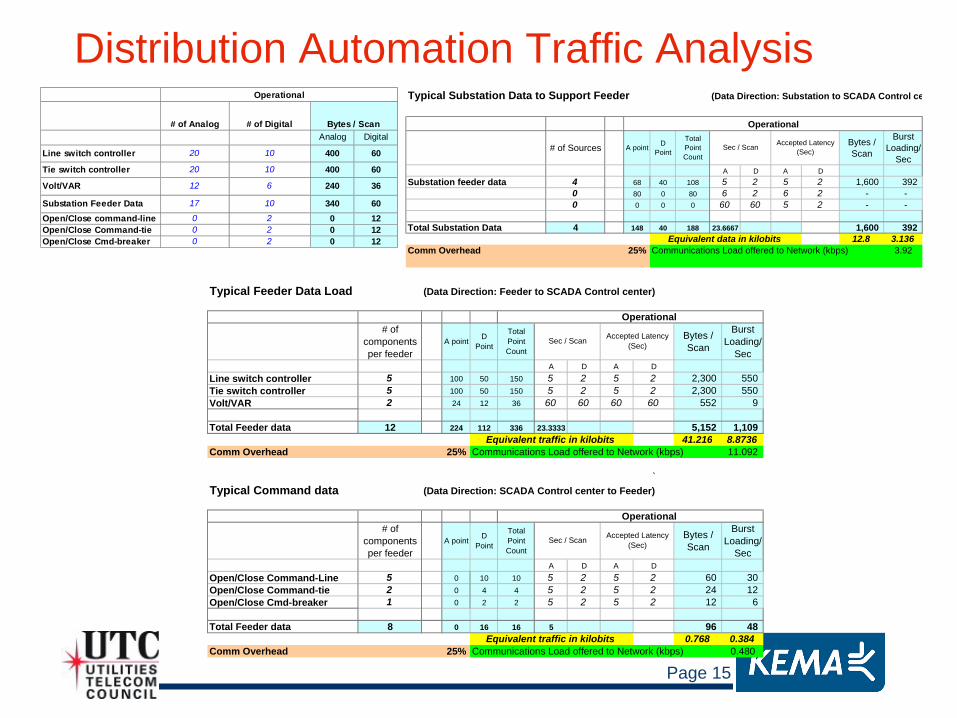
Distribution Automation Traffic Analysis# of Analog # of Digital
Analog Digital
Line switch controller 20 10 400 60
Tie switch controller 20 10 400 60
Volt/VAR 12 6 240 36
Substation Feeder Data 17 10 340 60Open/Close command-line 0 2 0 12Open/Close Command-tie 0 2 0 12Open/Close Cmd-breaker 0 2 0 12
Operational
Bytes / Scan
Typical Substation Data to Support Feeder (Data Direction: Substation to SCADA Control ce
# of Sources A point D Point
Total Point Count
Bytes / Scan
Burst Loading/
SecA D A D
Substation feeder data 4 68 40 108 5 2 5 2 1,600 392 0 80 0 80 6 2 6 2 - - 0 0 0 0 60 60 5 2 - -
Total Substation Data 4 148 40 188 23.6667 1,600 392 Equivalent data in kilobits 12.8 3.136
Comm Overhead 25% Communications Load offered to Network (kbps) 3.92
Operational
Sec / Scan Accepted Latency (Sec)
Typical Feeder Data Load (Data Direction: Feeder to SCADA Control center)
# of components per feeder
A point D Point
Total Point Count
Bytes / Scan
Burst Loading/
SecA D A D
Line switch controller 5 100 50 150 5 2 5 2 2,300 550 Tie switch controller 5 100 50 150 5 2 5 2 2,300 550 Volt/VAR 2 24 12 36 60 60 60 60 552 9
Total Feeder data 12 224 112 336 23.3333 5,152 1,109 Equivalent traffic in kilobits 41.216 8.8736
Comm Overhead 25% Communications Load offered to Network (kbps) 11.092
`Typical Command data (Data Direction: SCADA Control center to Feeder)
# of components per feeder
A point D Point
Total Point Count
Bytes / Scan
Burst Loading/
SecA D A D
Open/Close Command-Line 5 0 10 10 5 2 5 2 60 30 Open/Close Command-tie 2 0 4 4 5 2 5 2 24 12 Open/Close Cmd-breaker 1 0 2 2 5 2 5 2 12 6
Total Feeder data 8 0 16 16 5 96 48 Equivalent traffic in kilobits 0.768 0.384
Comm Overhead 25% Communications Load offered to Network (kbps) 0.480
Operational
Sec / Scan Accepted Latency (Sec)
Sec / Scan Accepted Latency (Sec)
Operational
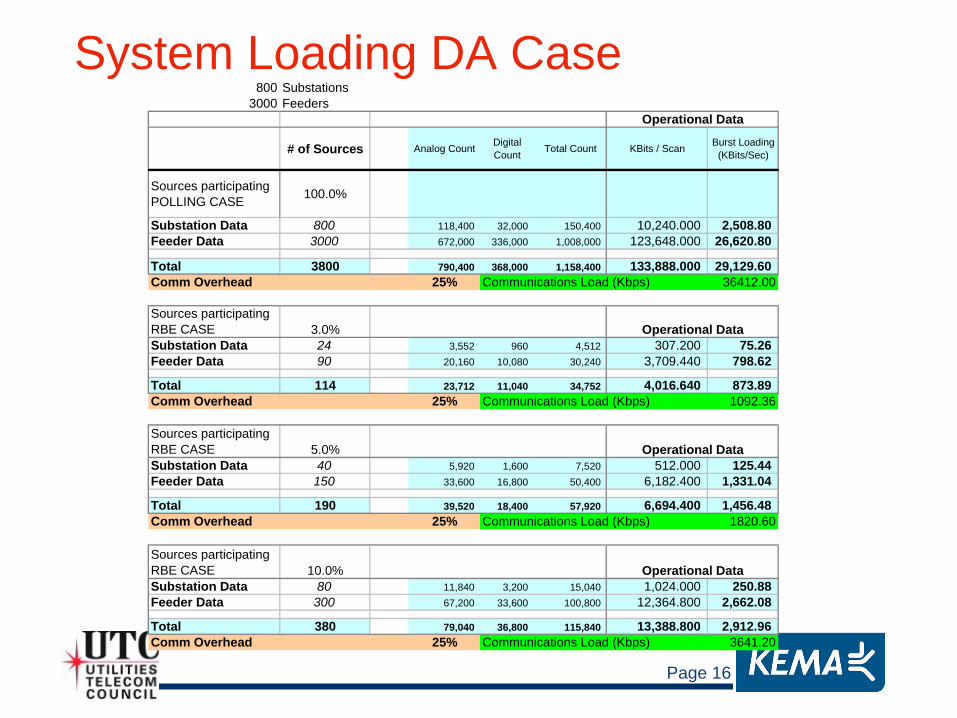
Page 16
System Loading DA Case800 Substations
3000 Feeders
# of Sources Analog Count Digital Count Total Count KBits / Scan Burst Loading
(KBits/Sec)
Sources participating POLLING CASE 100.0%
Substation Data 800 118,400 32,000 150,400 10,240.000 2,508.80 Feeder Data 3000 672,000 336,000 1,008,000 123,648.000 26,620.80
Total 3800 790,400 368,000 1,158,400 133,888.000 29,129.60Comm Overhead 25% Communications Load (Kbps) 36412.00
Sources participating RBE CASE 3.0%Substation Data 24 3,552 960 4,512 307.200 75.26 Feeder Data 90 20,160 10,080 30,240 3,709.440 798.62
Total 114 23,712 11,040 34,752 4,016.640 873.89 Comm Overhead 25% Communications Load (Kbps) 1092.36
Sources participating RBE CASE 5.0%Substation Data 40 5,920 1,600 7,520 512.000 125.44 Feeder Data 150 33,600 16,800 50,400 6,182.400 1,331.04
Total 190 39,520 18,400 57,920 6,694.400 1,456.48 Comm Overhead 25% Communications Load (Kbps) 1820.60
Sources participating RBE CASE 10.0%Substation Data 80 11,840 3,200 15,040 1,024.000 250.88 Feeder Data 300 67,200 33,600 100,800 12,364.800 2,662.08
Total 380 79,040 36,800 115,840 13,388.800 2,912.96 Comm Overhead 25% Communications Load (Kbps) 3641.20
Operational Data
Operational Data
Operational Data
Operational Data

Page 17
AMI Meter Data CaseMessage Type and
Direction Desired
Response Time
Estimated Message
Size Estimated Frequency
Estimated Average
Data Payload - Backhaul Network
Estimated Average
Data Payload -
Meter Access Network
Peak Through-
put Estimate
Bytes/ Message
Messages per day Bytes/day Bytes/day Bytes/
peak System (TDSP to
Meter)
Polling cell relay <1 hour 0 0 0 Account
Management and Authentication
<1 hour 102 3 306 306
subtotal bytes/time period 306 306 0
Utility (meter to MDM)
Tamper < 5 min 102 0.00034 0 0 0.51 Meter status < 5 min 102 3 306 306 Meter Reads
Electric < 5 min 1000 3 3,000 3,000 0
Meter Reads Gas < 5 min 200 3 600 600 1 Meter Reads Water < 5 min 200 3 600 600 1 Meter configuration
download < 5 min 2,500 0.08333 208 208
Meter firmware upgrade 1 day 1,000,000 0 0 0
Remote disconnect < 60 sec 400 0.00068 0 0 2 Remote connect < 60 sec 400 0.00068 0 0 2
Account Management and
Authentication < 5 min 102 2 204 204
Power Quality N/A 0 1 0 0
subtotal bytes/time period 4,919 4,919 7
Total Meter Traffic (both ways) bytes/time
period 5,225 5,225 7
bits/sec (avg) 0.48 0.48

Page 18
HAN Traffic Considerations•
Initial Case-to the HAN Initial Case-From the HAN
•
To be resolved– What services provided by the Utility vs Retail provider– If retail provider, how will communications be accomplished?
Message Type and Direction
Desired Response
Time
Estimated Message
Size Estimated Frequency
Estimated Average
Data Payload - Backhaul Network
Estimated Average
Data Payload -
Meter Access Network
30-Minute Throughp
ut Estimate
Bytes
/Message Messages
per day Bytes/day Bytes/day Bytes/30
min Retail signals (REP to HAN)
Direct Load reduction
< 60 sec 102 2 204 204 102
HAN Device (6 2 per home)
< 5 min 204 2 408 408 204
Energy Services Display Device
Energy Management
System
Smart Appliance PCT
Load Control Price signaling < 5 min 200 2 400 400 200 HAN Firmware
Update/ Confirmation
N/A 0 0 0 0
Account Management and
Authentication
1 day 102 0.00274
Subtotal bytes/time period
1,012 1,012 506
bits/sec (avg)
0.09 0.09 2.25
Message Type and Direction
Desired Response
Time
Estimated Message
Size Estimated Frequency
Estimated Average
Data Payload - Backhaul Network
Estimated Average
Data Payload -
Meter Access Network
30-Minute Throughp
ut Estimate
Bytes
/Message Messages
per day Bytes/day Bytes/day Bytes/30
min HAN (HAN to REP)
Energy services 2 102 0 0 0 0 Energy
Management Systems (Lighting Control Systems)
2 102 0 0 0
Load control 2 102 0 0 0 0 PCT 2 102 2 204 204 102
Smart appliances 3 102 0 0 0 In -home displays 2 102 2 204 204 102 Sensors (i.e. Gas
leak detection, water leaks)
1 102 0.002740 0 0 0.255
bytes/time period
408 408 204
bits/sec (avg)
0.04 0.04 5.45

Page 19
HAN Traffic Could Grow as Customer Acceptance and Applications Increase

Page 20
Forecast For Meter and HAN Traffic
•
If one collector is designed for 5,000 meters– 40.9 kbps initial simple devices– 61.2 kbps base case– 267.1 kbps heavy use case
•
If 100 collectors accommodate 500,000 meters– 4.09 Mbps total system initial simple case– 6.12 Mbps base case– 26.7 Mbps heavy use case
•
Issues/Considerations– Careful design of a collector/meter ratio to ensure no traffic congestion– Mesh access network design must ensure system does not choke as
data aggregates toward collector– Ensure access technology is flexible to support growth– HAN data rate function of customer acceptance rates & schemes
(All in Bits per sec)
MeteringNtwk to HAN HAN to Ntwk Total HAN (2 way) Total AMS
Initial Simple Devices 2.25 5.45 7.70 0.48 8.18Base Case 8.12 3.63 11.75 0.48 12.24Heavy Use Case 37.97 14.97 52.94 0.48 53.42

Page 21
Total System Loading Analysis200 Transmission Substations 100 collectors800 Distribution Substations 100% HAN customer acceptance base case
# of Subs or field devices
Analog Count
Digital Count
Total Count MBits / Scan Burst Loading
(MBits/Sec) Mbits / Upload Burst Loading Mbits / Sec
3% of Substations participatingTransmission 6 6,720 4,320 11,040 0.38 0.09 4,337 2.86 Distribution 24 4,800 8,640 13,440 0.75 0.17 2,389 0.20 Substation DA Data 24 3,552 960 4,512 0.31 0.08 Feeder DA Data 90 20,160 10,080 30,240 3.71 0.80 AMI&HAN Meter Data 100 collectors,100% customers Base case 6.12 Total 144 35,232 24,000 59,232 5.15 7.25 - 6,726 3.06 Comm Overhead 25% Communications Load (Mbps) 9.06 3.835% of Substations participatingTransmission 10 11,200 7,200 18,400 0.63 0.14 7,228 4.77 Distribution 40 8,000 14,400 22,400 1.25 0.29 3,982 0.33 Substation DA Data 40 5,920 1,600 7,520 0.51 0.13Feeder DA Data 150 33,600 16,800 50,400 6.18 1.33AMI&HAN Meter Data 100 collectors,100% customers Base case 6.12 Total 240 58,720 40,000 98,720 8.58 8.01 - 11,210 5.11 Comm Overhead 25% Communications Load (Mbps) 10.01 6.3810% of Substations participatingTransmission 20 22,400 14,400 36,800 1.25 0.29 14,455 9.55 Distribution 80 16,000 28,800 44,800 2.51 0.57 7,965 0.66 Substation DA Data 80 11,840 3,200 15,040 1.02 0.25Feeder DA Data 300 67,200 33,600 100,800 12.36 2.66AMI&HAN Meter Data 100 collectors,100% customers Base case 6.12 Total 480 117,440 80,000 197,440 17.15 9.89 - 22,420 10.21 Comm Overhead 25% Communications Load (Mbps) 12.36 12.77
Operational Data Non-Operational Data
Operational Data Non-Operational Data
Operational Data Non-Operational Data
Operational Data Non-Operational Data
Page 22
Results of the Process•
A Disciplined And Thorough Approach To Planning, Budgeting, And Implementing Telecommunications Systems As A Strategic Asset Has Benefits– Ensures Reliability Of Services– Establishes Predictable Budgeting And Cost Control
•
Effect Of The Network Planning And Optimization Effort– Accommodation Of Enterprise Demands– Improved Asset Value– Accurate Multi-year Budget Forecasting– Implementation Of New Appropriate Technology At The Right
Time