Embed Size (px)
Citation preview

Review of Integrative Business and Economics Research, Vol. 8, Issue 1 94
Copyright 2019 GMP Press and Printing ISSN: 2304-1013 (Online); 2304-1269 (CDROM); 2414-6722 (Print)
Using the Sailing Ship Effect in Technology Migration: The Case of Sanyo’s Strategy in Rechargeable Batteries Takuya Miyamoto Faculty of Commerce, Kurume University
ABSTRACT
This paper focuses on the case of a rechargeable battery business in the 1990s. Qualitative and quantitative data are analyzed to reveal that much like the sailing ship effect, Sanyo improved its existing battery technology while undertaking R&D on a higher-quality battery with new technology. Then, Sanyo switched entirely to selling its new technology and achieved top market share. Thus, the sailing ship effect enabled Sanyo to innovate new and higher-quality technology while managing the window of opportunity for its release. The managerial implication is that incumbents have an incentive to maintain existing technology rather than entering the market of new technology; however, when an incumbent recognizes the limitations and potentials of both technologies, the sailing ship effect is useful to prepare the new technology. Keywords: Technology Migration, Disruptive Innovation, Sailing Ship Effect, Window of Opportunity. Received 27 March 2018 | Revised 15 June 2018 | Accepted 10 July 2018. 1. INTRODUCTION
The theory of disruptive innovation, introduced by Clayton Christensen, maintains that new products displace existing products and that new entrants defeat incumbents (Christensen, 1997). Practically and theoretically, we can find well-matched examples of this in various industries such as HDD, steel manufacturing, medical services, and educational services.
Along with this discussion, Foster (1986) asserted that under the “sailing ship effect,” incumbents often hold to their prior product too much and tend to ignore new technologies; thus, incumbents often confront new technology by innovating on their prior product. Therefore, the sailing ship effect is defined as a phenomenon by which the introduction of a new technology to a market accelerates the innovation of an incumbent technology. In this process, many incumbents lag behind shifting to the new technology

Review of Integrative Business and Economics Research, Vol. 8, Issue 1 95
Copyright 2019 GMP Press and Printing ISSN: 2304-1013 (Online); 2304-1269 (CDROM); 2414-6722 (Print)
and, eventually, new entrants defeat incumbents; that is, the sailing ship effect connotes negative outcomes like the last gasp. In contrast to this perception, Sanyo’s rechargeable battery business in the 1990s describes a case where an incumbent succeeds in overcoming technology migration under the situation of the sailing ship effect. Sony was the first to market a lithium-ion battery in 1992. Because Sanyo did not have a lithium-ion battery business at that time, Sanyo decided to improve its nickel-metal hydride battery (prior technology) in order to compete with Sony’s new battery technology. This seems to be a typical case of the sailing ship effect. In the meantime, however, Sanyo prepared to market a lithium-ion battery with higher specifications than that of Sony’s battery. In fact, Sony struggled to sell its lithium-ion battery following the release of Sanyo’s improved nickel-metal hydride (Ni-MH) battery and then lost market share after Sanyo launched its high-specification lithium-ion battery. This case implies that under certain conditions, improving prior technology as a sailing ship effect allows incumbents to stall for time as they research and develop the new technology. This paper tries to answer three questions: (1) Why do incumbents often lag behind technology migrations? (2) Why did Sanyo overcome the technology migration? (3) How did Sanyo’s strategy function about stalling for time to research and develop the lithium-ion battery? 2. RESEARCH BACKGROUND 2.1 Theoretical review
Many previous studies have shed light on the phenomenon that incumbents with prior technology lag behind in shifting to new technologies and are defeated by a new entrant (Christensen, 1997; Cooper and Smith, 1992; Audsdörfer et al., 2013). Foster (1986) revealed the cause of this phenomenon, concluding that the myopic strategy of improving prior technology makes it difficult for incumbents to switch to new technology. Thus, the myopic focus on prior technology, i.e., the sailing ship effect, has been considered somewhat detrimental for switching to a new technology. Here, the entry timing is introduced to the analysis and discussion; that is, the first mover has advantages such as cost reduction from the learning curve and pioneering market share, whereas the follower has advantages such as the avoidance of technological uncertainty and market uncertainty. Some studies have indicated that companies should not change their existing customer base or product lines imprudently (e.g., Inuzuka, 2016). Therefore, a company must enter the market with strategic timing to gain both advantages.
Review of Integrative Business and Economics Research, Vol. 8, Issue 1 96
Copyright 2019 GMP Press and Printing ISSN: 2304-1013 (Online); 2304-1269 (CDROM); 2414-6722 (Print)
Tellis and Golder (2002) refer to this optimal timing of technology migration as the “window of opportunity.” That is, too early entry to the market for a new technology will confront with the least fruitful market like ‘Death Valley,’ while too late entry will lead the losing of competition. Tellis and Golder (2002) also showed that technology pioneers did not always become market leaders. Golder and Tellis (1993) pointed out that almost half of technology pioneers who were the fastest movers failed before the market matured, and leaders on timing of mass market keeps competitive advantage for a long time. Hence, there exists an optimal window of opportunity in technology migrations (Adner, 2012). As Christensen et al. (1998) described, previous studies on entry timing included various factors and various theories such as technological skill (Clark, 1985; Tushman and Anderson, 1986; Henderson and Clark, 1990), dominant product design (Utterback and Abernathy, 1975), population ecology (Hannan and Freeman, 1989), and interactions with the external environment (Christensen and Rosenbloom, 1995; Pfeffer and Salancik, 1978). This paper sheds light on the management of the window of opportunity (Lieberman and Montgomery, 1988). Cooper and Schendel (1976) revealed that following the introduction of new technologies into the market, many prior technologies did not decrease in sales volume and some initially increased. These authors also stated that more than five years were needed before the sales volume of new technologies exceeded that of prior technologies in many technology migrations. Theoretically, to some extent, incumbents are able to prepare for the new technology during the “migration period,” which is the coexistent term of both prior technology and new technology (Bergek et al., 2013). In addition, an adequate timespan for the migration period should help incumbents to be well-prepared. Therefore, this paper will investigate how to secure an adequate migration period and how to manage both prior and new technologies (O’Reilly and Tushman, 2013). 2.2 Research questions
The main subjects of this research are the ambidextrous management of prior and new technologies and the use of entry timing as a window of opportunity. To investigate these subjects, this paper sets three hypotheses. H1: Ordinary incumbents have difficulty in realizing a new technology and miss the
window of opportunity for entry. H2: Improving its prior technology to counter the new technology incentivized Sanyo to
develop the new technology and optimize its entry timing. H3: Sanyo prevented the spread of the new technology by releasing an upgraded version

Review of Integrative Business and Economics Research, Vol. 8, Issue 1 97
Copyright 2019 GMP Press and Printing ISSN: 2304-1013 (Online); 2304-1269 (CDROM); 2414-6722 (Print)
of its prior technology. The first hypothesis concerns the reason why incumbents often mis-judge their entry timing while the second hypothesis concerns the reason for Sanyo’s success in this regard. These hypotheses are concerned with the management of both the prior technology and the new technology. The third hypothesis tests whether Sanyo’s strategy was successful in managing the window of opportunity. This hypothesis is related to understanding how to secure an adequate migration period and how to keep the window of opportunity open until the incumbent can enter. 2.3 Research methodology
This paper employs multiple sources of qualitative and quantitative data. The qualitative data include those from interviews with Sanyo engineers, newspaper articles, and public data such as Sanyo’s company history. Quantitative data include sales and shipment trends of the rechargeable battery business in the 1990s. Quantitative data of industry statistics are cited from Japan’s Ministry of Economy, Trade and Industry. On the basis of these data, this paper adopts two models for testing: the gravity model from Huff (1963) and the competitive model of Lotka–Volterra. 2.3.1 Gravity model
The “gravity model” presented in Huff (1963) explains the incentives for consumers among shopping center trade areas, using a metaphor of Newton’s gravity equation:
𝑃𝑃𝑃𝑃𝑃𝑃 =𝑀𝑀𝑃𝑃 𝐷𝐷𝑃𝑃𝑃𝑃𝛾𝛾⁄
∑ 𝑀𝑀𝑃𝑃 𝐷𝐷𝑃𝑃𝑃𝑃𝛾𝛾⁄𝑛𝑛𝑗𝑗=1
,
where 𝑀𝑀𝑃𝑃 means attractiveness at point 𝑃𝑃, 𝐷𝐷𝑃𝑃𝑃𝑃𝛾𝛾 means distance from point 𝑃𝑃 to 𝑃𝑃, and 𝑃𝑃𝑃𝑃𝑃𝑃 shows the probability that a consumer at point 𝑃𝑃 goes shopping at point 𝑃𝑃 . This model is based on the assumption that attraction, such as the scale of a shopping center, has a positive effect on customer attraction and that distance has a negative effect on customer attraction. Indeed, this model has been applied in the field of retail marketing, but it can be also applied to the analysis of attractiveness on entry timing among technologies. Thus, this paper suggests following model:
𝐺𝐺𝑃𝑃𝑃𝑃 =𝑀𝑀𝑃𝑃 𝐷𝐷𝑃𝑃𝑃𝑃⁄
∑ 𝑀𝑀𝑃𝑃 𝐷𝐷𝑃𝑃𝑃𝑃⁄𝑛𝑛𝑗𝑗=1
,
where 𝐺𝐺𝑃𝑃𝑃𝑃 means the incentive on entrance of the technology, 𝑀𝑀𝑃𝑃 is the market size of technology 𝑃𝑃, and 𝐷𝐷𝑃𝑃𝑃𝑃 means the distance from technology 𝑃𝑃 to technology 𝑃𝑃. If technology 𝑃𝑃 is similar to technology 𝑃𝑃, then 𝐷𝐷𝑃𝑃𝑃𝑃 is 1. If a company with technology 𝑃𝑃 needs research and development on entering technology 𝑃𝑃, then 𝐷𝐷𝑃𝑃𝑃𝑃 is added +1 or +2 according to the
Review of Integrative Business and Economics Research, Vol. 8, Issue 1 98
Copyright 2019 GMP Press and Printing ISSN: 2304-1013 (Online); 2304-1269 (CDROM); 2414-6722 (Print)
needed effort of that R&D. If a company with technology 𝑃𝑃 needs to change their production system on entering technology 𝑃𝑃, then 𝐷𝐷𝑃𝑃𝑃𝑃 is added +1 or +2 according to the needed effort of that change.
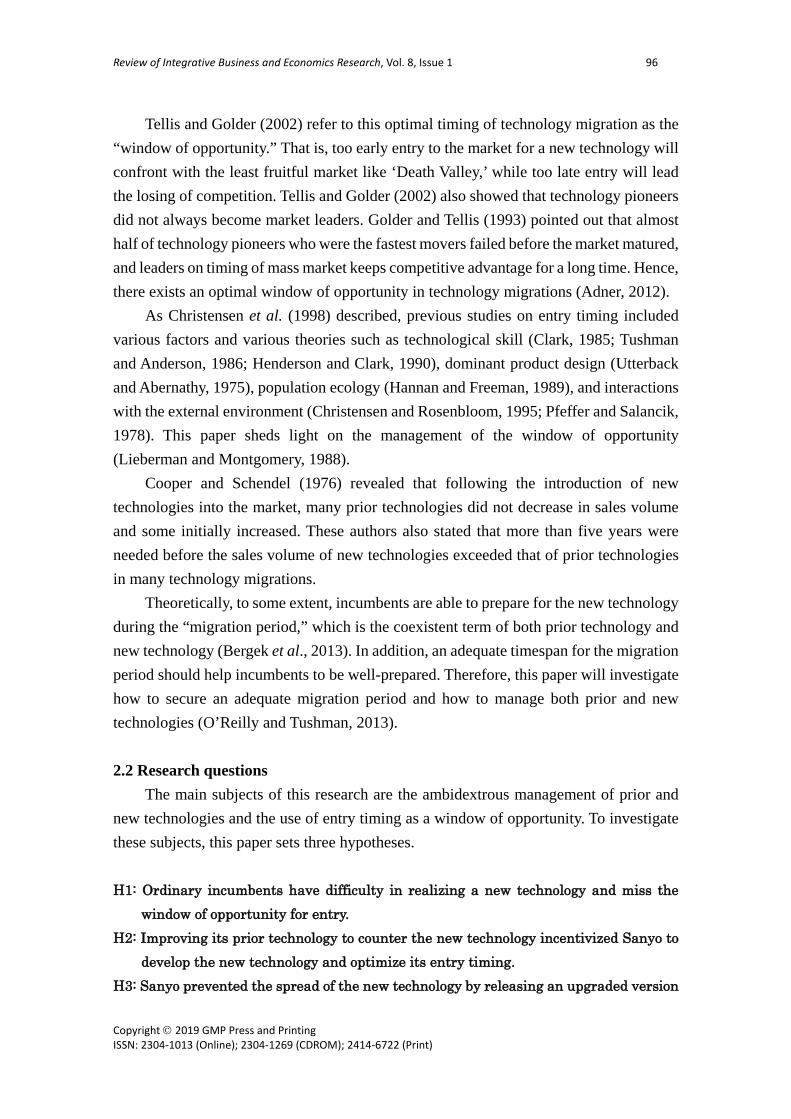
This paper presents three models by utilizing data such as sales and shipment trends from the industry statistics (quantitative data) and interview (qualitative) data. Model 1 is used for the most basic analysis. Model 2 is the model adjusted to Sanyo’s strategy and management. Model 3 is the model of Toshiba to be compared with that of Sanyo. From these models, the tendency of incentive of entry timing will be analyzed. Then, this paper validates whether the incentive of the gravity model explains the real entry timing of each company by ordered logistic regression analysis:
Y=𝛼𝛼 + 𝛽𝛽1 ∙G(new)− 𝛽𝛽2 ∙G(prior)+𝜀𝜀. In this analysis of Y, partial entry is defined as 1 and full-scale entry is done as 2. Sanyo entered the lithium-ion battery (new) technology partially from the nickel-metal hydride battery (prior) technology in 1994 and Toshiba entered partially in 1993. Both Sanyo and Toshiba made full-scale entries with the lithium-ion battery in 1998. Therefore, in Sanyo’s case, Y is 0 from 1991 to 1993 and Y is 1 from 1994 to 1997, and Y is 2 from 1998 to 2000. G(new) is the gravity of new technology (lithium-ion battery) and G(old) is that of prior technology (nickel-metal hydride battery). This equation represents whether entry timing and gravity of lithium-ion battery will correlate significantly or not. 2.3.2 Competitive Lotka–Volterra model
Pistorius and Utterback (1996) explain technological interactions by using the competitive Lotka–Volterra model, which shows the population dynamics of two species competing for a common resource. Given two species’ populations (N and O), the Lotka–Volterra formulation explains the rate of increase of each species based on its interactions in an ecosystem. According to Haberman (1977), the competitive Lotka–Volterra equations are:
rate of increase (species N):𝑑𝑑𝑁𝑁𝑛𝑛𝑑𝑑𝑑𝑑
= 𝑟𝑟𝑛𝑛𝑁𝑁𝑛𝑛(1 − 𝑁𝑁𝑛𝑛+𝛼𝛼𝑛𝑛𝑛𝑛𝑁𝑁𝑛𝑛𝐾𝐾
) and
rate of increase (species O): 𝑑𝑑𝑁𝑁𝑛𝑛𝑑𝑑𝑑𝑑
= 𝑟𝑟𝑜𝑜𝑁𝑁𝑜𝑜(1 − 𝑁𝑁𝑛𝑛+𝛼𝛼𝑛𝑛𝑛𝑛𝑁𝑁𝑛𝑛𝐾𝐾
),
where 𝛼𝛼𝑛𝑛𝑜𝑜 means the effect of species O on the population of species N and 𝛼𝛼𝑜𝑜𝑛𝑛 means the effect species N on the population of species O. Then, 𝑟𝑟𝑛𝑛 and 𝑟𝑟𝑜𝑜 are inherent growth

Review of Integrative Business and Economics Research, Vol. 8, Issue 1 99
Copyright 2019 GMP Press and Printing ISSN: 2304-1013 (Online); 2304-1269 (CDROM); 2414-6722 (Print)
rates, and K is the carrying capacity. 𝑁𝑁𝑛𝑛 and 𝑁𝑁𝑜𝑜 are the population numbers of each
species. In this equation, (1 − 𝑁𝑁𝑛𝑛𝐾𝐾
) and (1 − 𝑁𝑁𝑛𝑛𝐾𝐾
) represent the inhibitory effect of
populations within the species. (1 − 𝛼𝛼𝑛𝑛𝑛𝑛𝑁𝑁𝑛𝑛𝐾𝐾
) and (1 − 𝛼𝛼𝑛𝑛𝑛𝑛𝑁𝑁𝑛𝑛𝐾𝐾
) represent the inhibitory
effect of populations between two species. Then, 𝛼𝛼𝑛𝑛𝑜𝑜 and 𝛼𝛼𝑜𝑜𝑛𝑛 are the competitive coefficients. If these coefficients are 0, then the two species do not influence either population. In this paper, 𝑁𝑁𝑛𝑛 and 𝑁𝑁𝑜𝑜 are volumes of lithium-ion battery (species N) and nickel-metal hydride battery (species O) at 1997. 𝑟𝑟𝑛𝑛 and 𝑟𝑟𝑜𝑜 are the growth rates of these two batteries until 1997. 𝐾𝐾 is the whole volume of rechargeable battery industry. This paper investigates two models: the model where each competitive coefficient is 0.5 and the model where each competitive coefficient is 0. The former model presumes the prior technology should affect the population of new technology. The latter model presumes the prior technology should not have affected the population of new technology as a counterfactual assumption. 3. RESULTS 3.1 Case study: strategy of Sanyo
In 1990, Sanyo was a leading company in the rechargeable battery industry. At that time, the nickel-cadmium battery was the mainstream battery. Then, around 1991, the nickel-metal hydride battery was marketed by Sanyo, Toshiba, Panasonic, and others. Sanyo was also one of the leading companies for nickel-metal hydride batteries. Immediately afterwards, in about 1992, Sony launched the lithium-ion battery. Most of the prior technology battery companies, such as Sanyo, had lagged behind in producing the lithium-ion battery; however, in 1999, Sanyo would capture top market share. In this regard, Sanyo devised a prominent strategy. Sanyo prevented the lithium-ion battery of Sony from spreading market by upgrading its prior nickel-metal hydride battery technology (see Figure 1). In fact, the nickel-metal hydride battery had the almost same specification as the lithium-ion battery from 1992 to 1999. In addition, the nickel-metal hydride battery was a reasonable price; therefore, the lithium-ion battery did not extend the market (see Figure 2). Under this life-extension strategy for its prior technology, Sanyo researched and developed a lithium-ion battery with higher specifications than that of Sony’s.

Review of Integrative Business and Economics Research, Vol. 8, Issue 1 100
Copyright 2019 GMP Press and Printing ISSN: 2304-1013 (Online); 2304-1269 (CDROM); 2414-6722 (Print)
Figure 1. Number of Specifications of Rechargeable Batteries (1975–2005)
Figure 2. Shipments of Rechargeable Batteries (1993–2005)
From Figures 1 and 2, it is clear that after 1998 the market for the lithium-ion battery increased. Thus, latecomers such as Sanyo had to catch up with Sony. In this case, the window of opportunity was closed around 1998. Sanyo entered the lithium-ion battery business partially in 1994 and planned to enter the lithium-ion battery business full-scale and with greater specifications around 1998. 3.2 Results: gravity model and incentive of entry
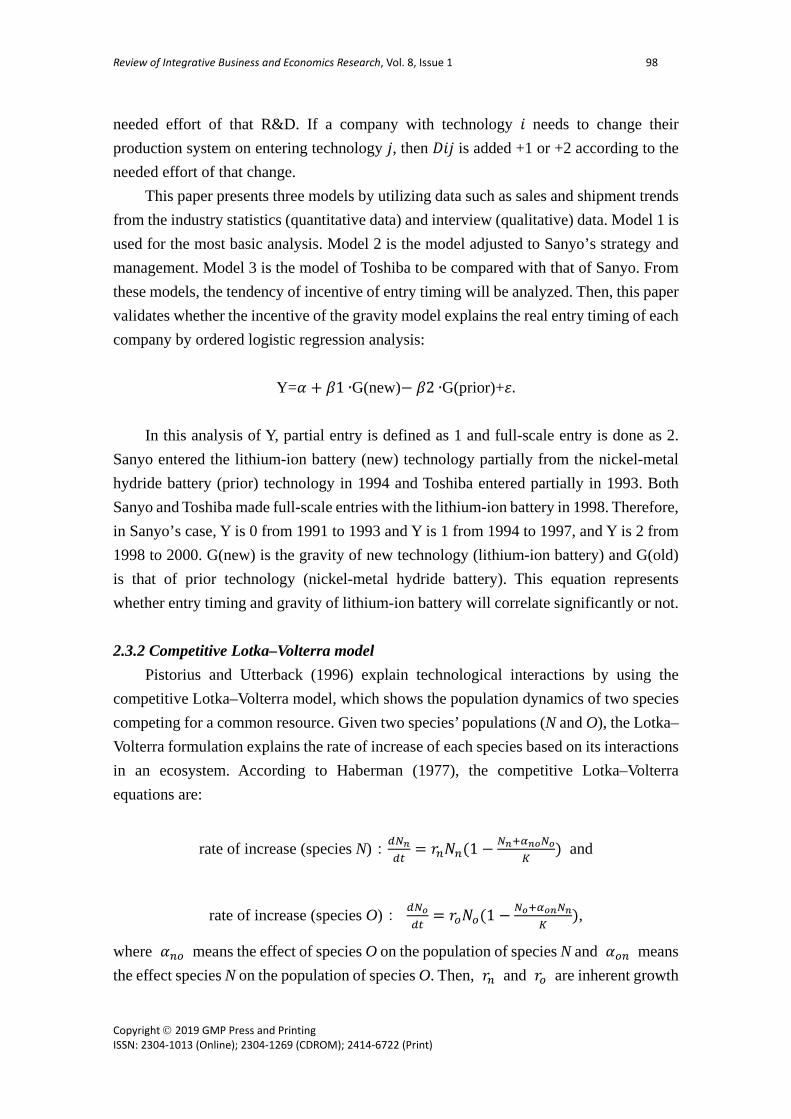
The gravity model introduces the incentive of entry to the new technology and explains why incumbents often miss the window of opportunity. Model 1 illustrates the incentive of each technology in chronological order (see Table 1). This model is an ordinary model that does not consider each company’s strategy and management. From Table 1, even in 2000, incumbents have the incentive of the nickel-cadmium battery (Ni-
Window of Opportunity
Review of Integrative Business and Economics Research, Vol. 8, Issue 1 101
Copyright 2019 GMP Press and Printing ISSN: 2304-1013 (Online); 2304-1269 (CDROM); 2414-6722 (Print)
Cd) technology, preceded the nickel-metal hydride (Ni-MH) and lithium-ion batteries. Under this incentive system, incumbents would miss the window of opportunity.
Table 1. Ordinary Model
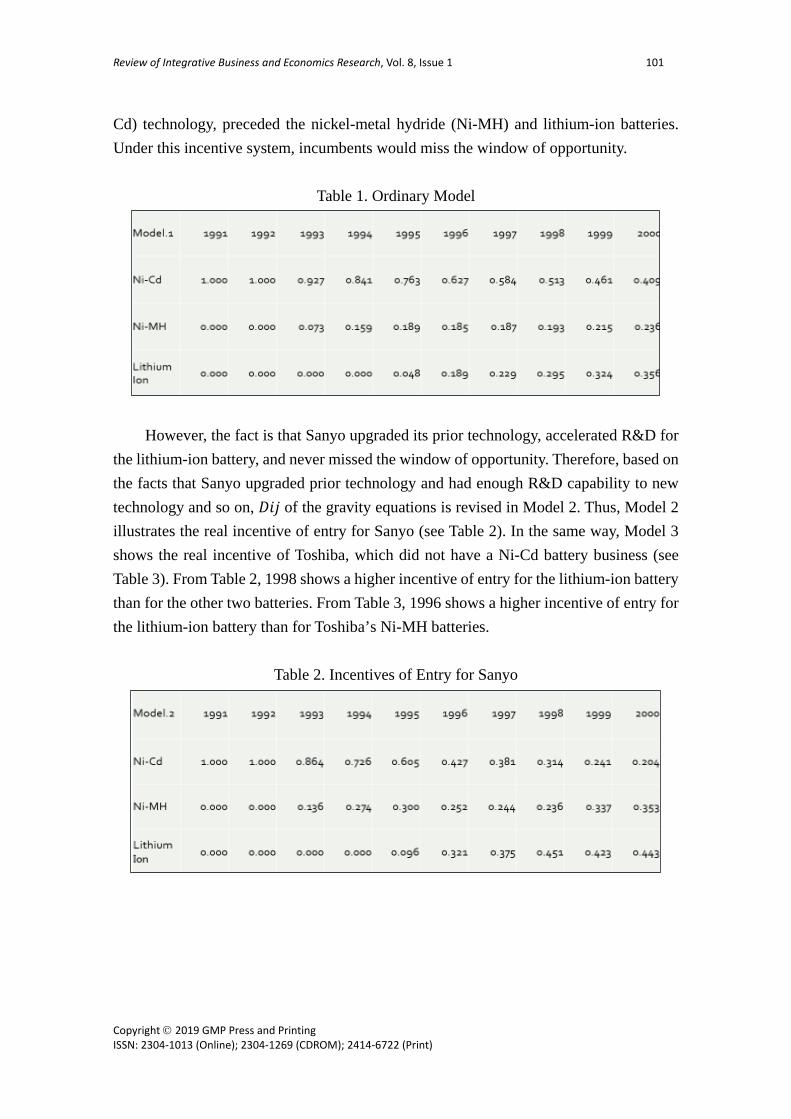
However, the fact is that Sanyo upgraded its prior technology, accelerated R&D for the lithium-ion battery, and never missed the window of opportunity. Therefore, based on the facts that Sanyo upgraded prior technology and had enough R&D capability to new technology and so on, 𝐷𝐷𝑃𝑃𝑃𝑃 of the gravity equations is revised in Model 2. Thus, Model 2 illustrates the real incentive of entry for Sanyo (see Table 2). In the same way, Model 3 shows the real incentive of Toshiba, which did not have a Ni-Cd battery business (see Table 3). From Table 2, 1998 shows a higher incentive of entry for the lithium-ion battery than for the other two batteries. From Table 3, 1996 shows a higher incentive of entry for the lithium-ion battery than for Toshiba’s Ni-MH batteries.
Table 2. Incentives of Entry for Sanyo

Review of Integrative Business and Economics Research, Vol. 8, Issue 1 102
Copyright 2019 GMP Press and Printing ISSN: 2304-1013 (Online); 2304-1269 (CDROM); 2414-6722 (Print)
Table 3. Incentives of Entry for Toshiba
3.3 Results: ordered logistic regression analysis
Ordered logistic regression analysis shows that the incentive of new technology from the gravity model is significantly covariant with the actual entry timing (see Tables 4 and 5). It is proved that the incentive of new technology (in this case, the lithium-ion battery) is able to explain the entry timing of a company. Thus, if the incentive of a new technology from the gravity model is higher than that of any other technology, then the company has the incentive to enter the new technology.
Table 4. Results of Ordered Logistic Regression Analysis 𝛽𝛽 Significance Level
Gravity (New) 12.303 0.006
Gravity (Old) -4.502 0.088
Pseudo R2
Cox and Snell
0.662
Table 5. Spearman’s Rank Correlation Coefficient
Entry
(Y)
Gravity
New
Gravity
Old
Sales
New
Sales
Old
Distance
New
Distance
Old
Entry (Y) ―
Gravity New 0.751** ―
Gravity Old -0.571** -0.400 ―
Sales New 0.877** 0.874** -0.357 ―
Sales Old -0.884** -0.806** 0.508* -0.947** ―
Distance New -0.853** -0.595** 0.647** -0.795** -0.833** ―
Distance Old -0.651** -0.403 0.327** -0.718** -0.698** 0.791** ― **p < 0.01, *p < 0.05

Review of Integrative Business and Economics Research, Vol. 8, Issue 1 103
Copyright 2019 GMP Press and Printing ISSN: 2304-1013 (Online); 2304-1269 (CDROM); 2414-6722 (Print)
Gravity New: incentive (gravity) of lithium-ion battery
Gravity Old: incentive (gravity) of nickel-metal hydride battery
Sales New: sales amount of lithium-ion battery
Sales Old: sales amount of nickel-metal hydride battery
Distance New: Distance of lithium-ion battery
Distance Old: Distance of nickel-metal hydride battery
3.4 Results: competitive Lotka–Volterra model
The nickel-metal hydride battery and lithium-ion battery were launched in the same market, such as notebook PCs and mobile phones. When the nickel-metal hydride battery was upgraded and penetrated the market, the lithium-ion battery could not likewise expand. This fact can be proved by using the competitive Lotka–Volterra model. Model A presumes that both technologies compete with each other (competitive coefficients = 0.5). Model B presumes that both technologies do not compete with each other (competitive coefficients = 0). Model B shows how much both technologies would have increased sales if both technologies had been launched into different markets separately: no competition, no cannibalism. The results are illustrated in Table 6 and Figure 3. Comparing the slopes for each technology on this graph, we can confirm the following fact: the growth rate of the lithium-ion battery (solid line) is higher than that of the nickel-metal hydride battery (broken line) during this period. If competition between both technologies had not occurred, then the growth for lithium-ion batteries would increase at a higher rate than for nickel-metal hydride batteries. Thus, the nickel-metal hydride battery succeeded to some extent in preventing the lithium-ion battery from spreading in the market.
Table 6. Results of Competition Models A and B Model A Model B Difference Ni-MH 529,700 593,756 +64,056 Lithium-ion 319,849 413,338 +93,489

Review of Integrative Business and Economics Research, Vol. 8, Issue 1 104
Copyright 2019 GMP Press and Printing ISSN: 2304-1013 (Online); 2304-1269 (CDROM); 2414-6722 (Print)
Figure 3. Growth Rates of Ni-MH and Lithium-ion Batteries
4. DISCUSSION
As explained by the gravity model, incumbents usually do not have the incentive to enter the new technology until the window of opportunity has been already closed. However, Sanyo upgraded its prior technologies to prevent the new technology from spreading and recognized the window of opportunity. As a result, this strategy made Sanyo realize the limitation of its prior technologies and the potential of the new technology. Sanyo was able to realize the new technology would surpass prior technologies in the foreseeable future because it was considered difficult to improve its prior technologies to compete with the new technology. This finally altered Sanyo’s incentive for entering the new technology. This fact is also reflected in the gravity model (Model 2). The more Sanyo improved its prior technology, the more cost Sanyo had to spend. As the strategy of upgrading prior technologies incurred cost, the incentive for maintaining the prior technologies should decrease. On the other hand, the incentive of entry to the new technology should be higher. Therefore, Model 2 indicates that Sanyo had the incentive of full-scale entry to the new technology around 1998. This tendency can be verified by ordered logistic regression analysis. The gravity model, as the incentive of entry to the new technology or of remaining prior technology, explains the actual entry timing of each incumbent significantly. This strategy of upgrading prior technologies succeeded in expanding the window of entry. As shown in the competitive Lotka–Volterra model, due to the upgraded prior technologies, the lithium-ion battery was not able to expand in the market. Thus, the strategy of upgrading prior technologies broadened the window of opportunity and secured sufficient time for Sanyo to develop a lithium-ion battery with higher quality than
250,000
300,000
350,000
400,000
450,000
500,000
550,000
600,000
Model A Model B
Ni-MH Lithium-ion

Review of Integrative Business and Economics Research, Vol. 8, Issue 1 105
Copyright 2019 GMP Press and Printing ISSN: 2304-1013 (Online); 2304-1269 (CDROM); 2414-6722 (Print)
Sony’s (see Figure 4).
Figure 4. Whole Images of Sanyo’s Strategy
According to these results, the hypotheses presented earlier are all supported: H1 is supported by the gravity Model 1 analysis that shows ordinary incumbents have difficulty in feeling the incentive for a new technology and miss the window of opportunity; H2 is supported by the gravity Model 2 analysis that shows improving prior technology incentivized Sanyo to develop the new technology and optimize its entry timing; H3 is supported by the competitive Lotka–Volterra model in that the new technology did not expand in the market due to the introduction of Sanyo’s upgraded prior technologies. 5. CONCLUSION
This paper paid attention to the case that Sony entered the lithium-ion battery market first but Sanyo captured top-share at the market’s growth stage. Behind this story, in the beginning, Sanyo countered the lithium-ion battery with upgraded prior technologies, thereby competing through the sailing ship effect. In terms of the coexistence of these technologies, Sanyo accelerated its R&D on the lithium-ion battery and launched a higher-quality lithium-ion battery. When the best opportunity arose, Sanyo switched completely from its prior technology to its lithium-ion battery technology. This paper proved how the sailing ship effect enabled Sanyo to manage the window of opportunity for entry and secure time to develop the new technology with a higher quality. Previous studies have highlighted only on the negative aspects of the sailing ship effect. However, this research proved that this effect has positive aspects under certain
1992 1994 1999
Sony marketed
lithium-ion battery
Sanyo entered lithium-ion
battery market partially
1998
Sanyo entered the
market with full-scale Sanyo got
top-share
Sanyo upgraded prior technologies.
Prior tech prevented new tech from spreading.
Sanyo shifted to new tech.
Sanyo prepared for launching
high-quality lithium-ion battery.

Review of Integrative Business and Economics Research, Vol. 8, Issue 1 106
Copyright 2019 GMP Press and Printing ISSN: 2304-1013 (Online); 2304-1269 (CDROM); 2414-6722 (Print)
conditions. On this point, Howells (2002) asserted that new and old technologies often coexist for some time, using the shipbuilding industry as an original example of this effect. Some studies have argued that old technology can sometimes survive so long as it maintains a unique strong point that the new technology lacks (Adner and Snow, 2010; Bessant, 2008). Then, the counter action by incumbents in the coexistence phase becomes most important (Abernathy and Rosenbloom, 1969). This paper showed how Sanyo broadened the window of opportunity by using the sailing ship effect and developing a high-quality lithium-ion battery. One of other originalities of this research is its unique methodology. Whereas previous studies tended to rely on qualitative research, this paper is informed by both qualitative and quantitative data. Moreover, the results reveal positive aspects of the sailing ship effect. Finally, this research has incorporated the kind of strategy that could enable incumbents to survive technology migrations. The implication for practical management is that indeed incumbents have the incentive to maintain their prior technology rather than to enter the market of new technology. However, if a company recognizes the limitations and the potentials of both technologies, then the sailing ship effect can be useful to prepare and plan the technology migration. The limitation of this research is in identifying the conditions under which the sailing ship effect is useful. On this point, Suarez and Lanzolla (2005) mentioned that the speed of market expansion and technology improvements determine first-mover advantage or disadvantage. Hill and Rothaermal (2003) pointed out the importance of the relationship between research units and development units to cope with implementing a new technology quickly. However, this paper introduced a kind of successful counter actions by incumbents and explored the logic on the management of the window of opportunity for entry.
ACKNOWLEDGEMENT This paper is supported by Grant-in-Aid for Young Scientists (B), JSPS, No: 17K13803 and Grant for Productivity Research 2018 (Management Academy of Japan Productivity Center).
REFERENCES [1] Abernathy, W.J., Rosenbloom, R.S. (1969), “Parallel strategies in development
projects”, Management Science, 15, 486–505. [2] Adner, R. (2012), The Wide Lens: A New Strategy for Innovation, London: Penguin. [3] Adner, R., Snow, D. (2010), “Old technology responses to new technology treats:

Review of Integrative Business and Economics Research, Vol. 8, Issue 1 107
Copyright 2019 GMP Press and Printing ISSN: 2304-1013 (Online); 2304-1269 (CDROM); 2414-6722 (Print)
Demand heterogeneity and technology retreats”, Industrial and Corporate Change, 19, 1655–1675.
[4] Audsdörfer, P., Bessant, J., Möslein, K., von Stamm, B., Piller, F. (2013), Discontinuous Innovation: Learning to Manage the Unexpected, London: Imperial College Press.
[5] Bergek, A., Berggren, C., Magnusson, T., Hobday, M. (2013) “Technological discontinuities and the challenge for incumbent firms: destruction, disruption or creative accumulation?”, Research Policy, 42, 1210–1224.
[6] Bessant, J. (2008), “Dealing with discontinuous innovation: The european experience”, International Journal of Technology Management, 42, 36–50.
[7] Christensen, C.M. (1997), The Innovator’s Dilemma, Cambridge Massachusetts: Harvard Business School Press.
[8] Christensen, C.M., Rosenbloom, R.S. (1995), “Explaining the attacker’s advantage: technological paradigms, organizational dynamics, and the value network”, Research Policy, 24, 233–257.
[9] Christensen, C.M., Suárez, F.F., Utterback, J.M. (1998), “Strategies for survival in fast-changing industries”, Management Science, 44, S207–S220.
[10] Clark, K.B. (1985), “The interaction of design hierarchies and market concepts in technological evolution”, Research Policy, 14, 235–251.
[11] Cooper, A.C., Schendel, D. (1976), “Strategic responses to technological threats”, Business Horizons, 19, 61–69.
[12] Cooper, A.C., Smith, C.G. (1992), “How established firms respond to threatening technologies”, Academy of Management Executive, 6, 55–70.
[13] Foster, R.J. (1986), Innovation: The Attacker’s Advantage, New York: Summit Books.
[14] Golder, P.N., Tellis, G.J. (1993), “Pioneer advantage: marketing logic or marketing legend?”, Journal of Marketing Research, 30, 158–170.
[15] Haberman, R. (1977), Mathematical Model: Polution Dynamics, Prentice Hall. [16] Hannan, M.T., Freeman, J. (1989), Organizational Ecology, Cambridge
Massachusetts: Harvard University Press. [17] Henderson, R., Clark, K.B. (1990), “Architectural innovation: the reconfiguration of
prior product technologies and the failure of established firms”, Administrative Science Quarterly, 335, 9–30.
[18] Hill, C.W., Rothaermal, F.T. (2003), “The performance of incumbent firms in the face of radical technological innovation”, Academy of Management Review, 28, 257–274.
[19] Howells, J. (2002), “The response of old technology incumbents to technological

Review of Integrative Business and Economics Research, Vol. 8, Issue 1 108
Copyright 2019 GMP Press and Printing ISSN: 2304-1013 (Online); 2304-1269 (CDROM); 2414-6722 (Print)
competition- does the sailing ship effect exist?”, Journal of Management Studies, 39, 887–906.
[20] Huff, D.L. (1963), “A probabilistic analysis of shopping center trade areas”, Land Economics, 39, 81–90.
[21] Inuzuka, A. (2016), “How should suppliers respond to economic Crisis? Lessons from the Japanese auto parts industry”, Review of Integrative Business & Economics Research, 5, 280–292.
[22] Lieberman, M.B., Montgomery, D.B. (1988), “First-mover advantages”, Strategic Management Journal, 9, 41–58.
[23] O’Reilly, C.A., Tushman, M.L. (2013), “Organizational ambidexterity: Past, present, and future”, Academy of Management Perspectives, 27, 324–338.
[24] Pfeffer, J., Salancik, G.R. (1978), The External Control of Organizations: A Resource Dependence Perspective, New York: Harper & Row.
[25] Pistorius, C.W. I, Utterback, J.M. (1996), “A Lotka-Volterra model for multi-mode technological interaction: Modeling competition, symbiosis and predator-prey modes”, Working Paper (#3929), Sloan School of Management, Massachusetts Institute of Technology.
[26] Suarez, F.F., Lanzolla, G. (2005), “The half-truth of first-mover advantage”, Harvard Business Review, 83, 121–127.
[27] Tellis, G.J., Golder, P.N. (2002), Will and Vision: How Latecomers Grow to dominate Markets, The McGraw-Hill Companies, Inc.
[28] Tushman, M.L., Anderson, P. (1986), “Technological discontinuities and organizational environments”, Administrative Science Quarterly, 31, 439–465.
[29] Utterback, J.M., Abernathy, W.J. (1975), “A dynamic model of process and product innovation”, Omega, 33, 639–656.


![Model Kartonowy - Fly Model 133 - Sailing Ship Tovarisch[1]](https://img.pdfslide.us/doc/110x75/55cf9c36550346d033a90c71/model-kartonowy-fly-model-133-sailing-ship-tovarisch1.jpg)