Embed Size (px)
Citation preview
Using Signal Controllers To Count
Bicyclists Peter Koonce, Christine Kendrick, Mark Haines, David Urowsky
Portland Bureau of Transportation
Pam Johnson, Miguel Figliozzi, Ph.D., Sirisha Kothuri, Ph.D., Chris Monsere, Ph.D., Bryan Blanc
Krista Nordback, Ph.D., P.E.
Oregon Transportation Research and Education Consortium (OTREC)
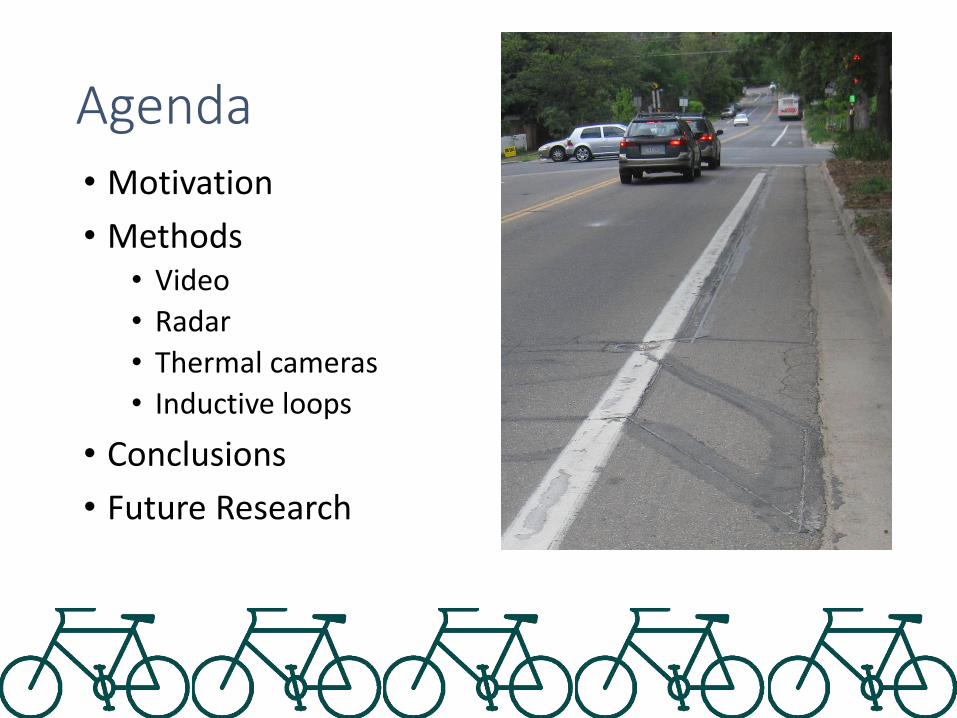
Agenda • Motivation
• Methods • Video
• Radar
• Thermal cameras
• Inductive loops
• Conclusions
• Future Research

Motivation
Why measure walking & biking?
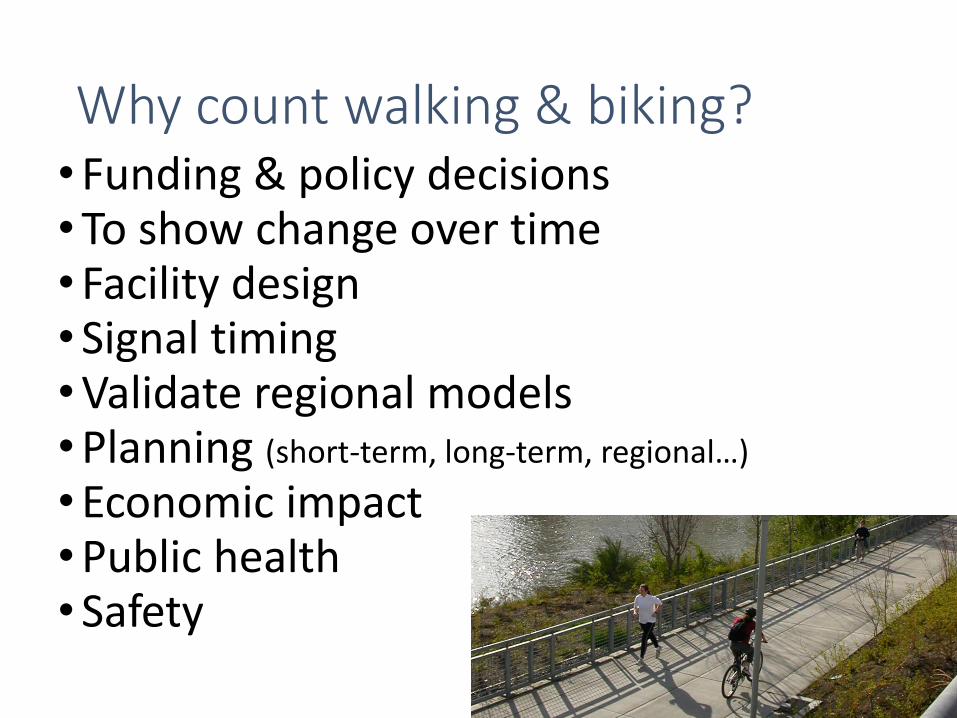
Why count walking & biking? •Funding & policy decisions •To show change over time •Facility design •Signal timing •Validate regional models •Planning (short-term, long-term, regional…)
•Economic impact •Public health •Safety
Traffic Monitoring Programs
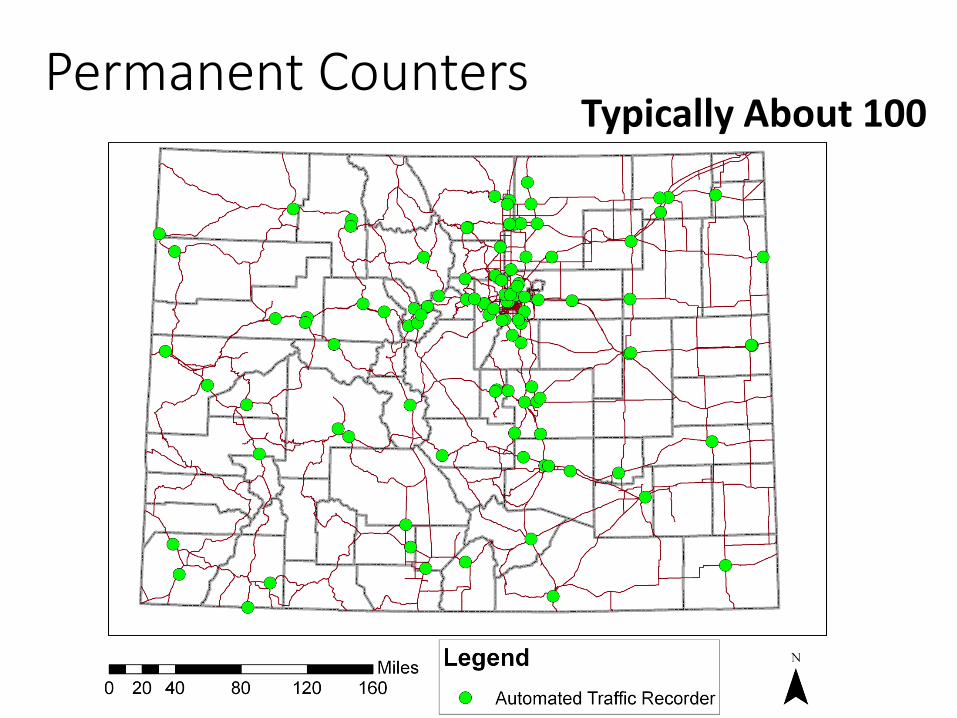
Permanent Counters Typically About 100
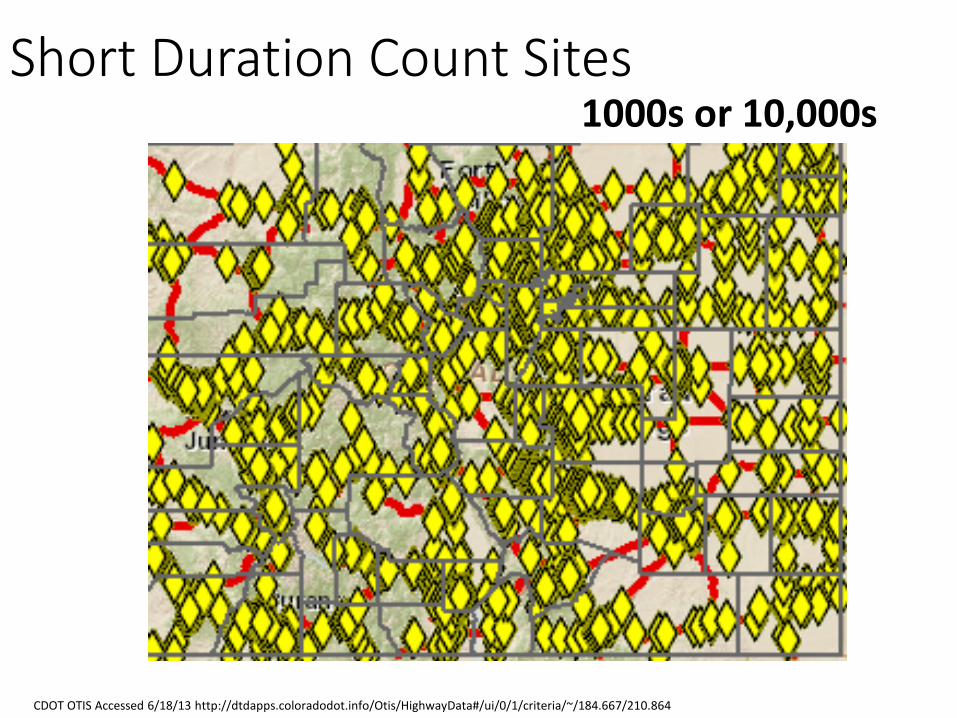
Short Duration Count Sites
CDOT OTIS Accessed 6/18/13 http://dtdapps.coloradodot.info/Otis/HighwayData#/ui/0/1/criteria/~/184.667/210.864
1000s or 10,000s

Can we apply these methods to bicycling?
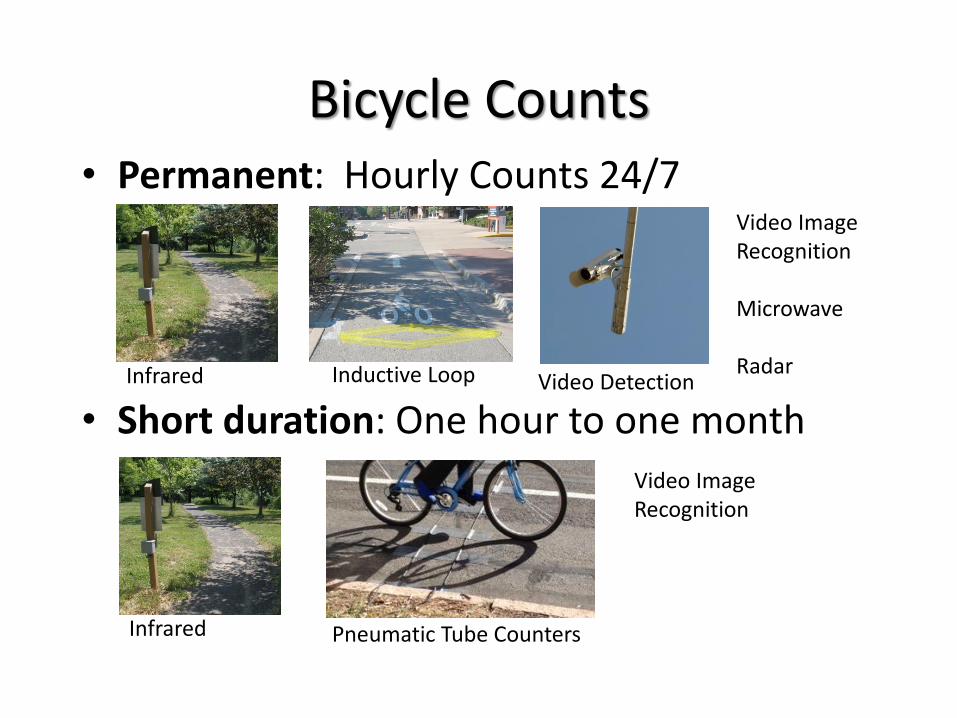
Bicycle Counts • Permanent: Hourly Counts 24/7
• Short duration: One hour to one month
Inductive Loop Video Detection
Pneumatic Tube Counters
Video Image Recognition Microwave Radar
Infrared
Infrared
Video Image Recognition
Can we afford it?
• Non-motorized traffic is more variable than motorized.
– More continuous counters needed.
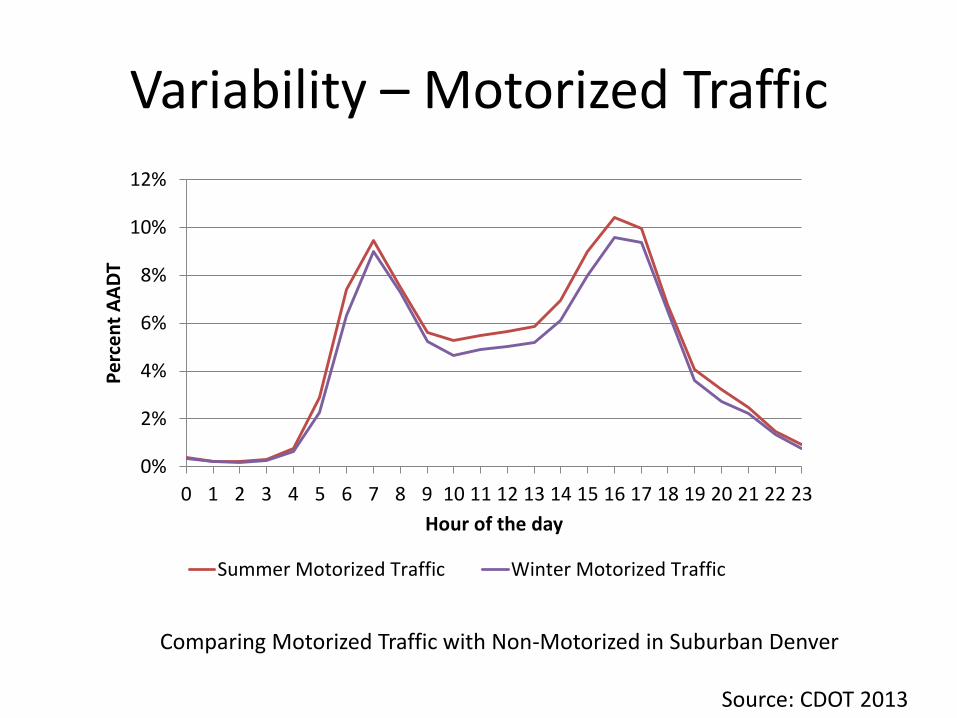
Variability – Motorized Traffic
Comparing Motorized Traffic with Non-Motorized in Suburban Denver
Source: CDOT 2013
0%
2%
4%
6%
8%
10%
12%
0 1 2 3 4 5 6 7 8 9 10 11 12 13 14 15 16 17 18 19 20 21 22 23
Pe
rce
nt
AA
DT
Hour of the day
Summer Motorized Traffic Winter Motorized Traffic
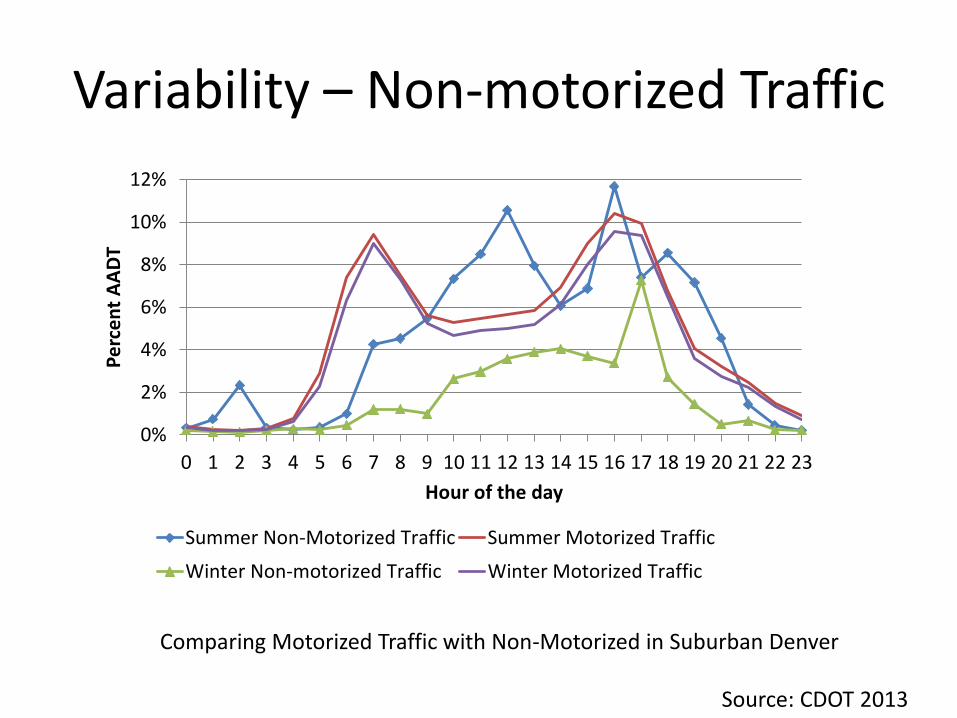
Variability – Non-motorized Traffic
Comparing Motorized Traffic with Non-Motorized in Suburban Denver
Source: CDOT 2013
0%
2%
4%
6%
8%
10%
12%
0 1 2 3 4 5 6 7 8 9 10 11 12 13 14 15 16 17 18 19 20 21 22 23
Pe
rce
nt
AA
DT
Hour of the day
Summer Non-Motorized Traffic Summer Motorized Traffic
Winter Non-motorized Traffic Winter Motorized Traffic
Can we afford it?
• Non-motorized traffic is more variable than motorized.
– More continuous counters needed.
• Dense travel network.
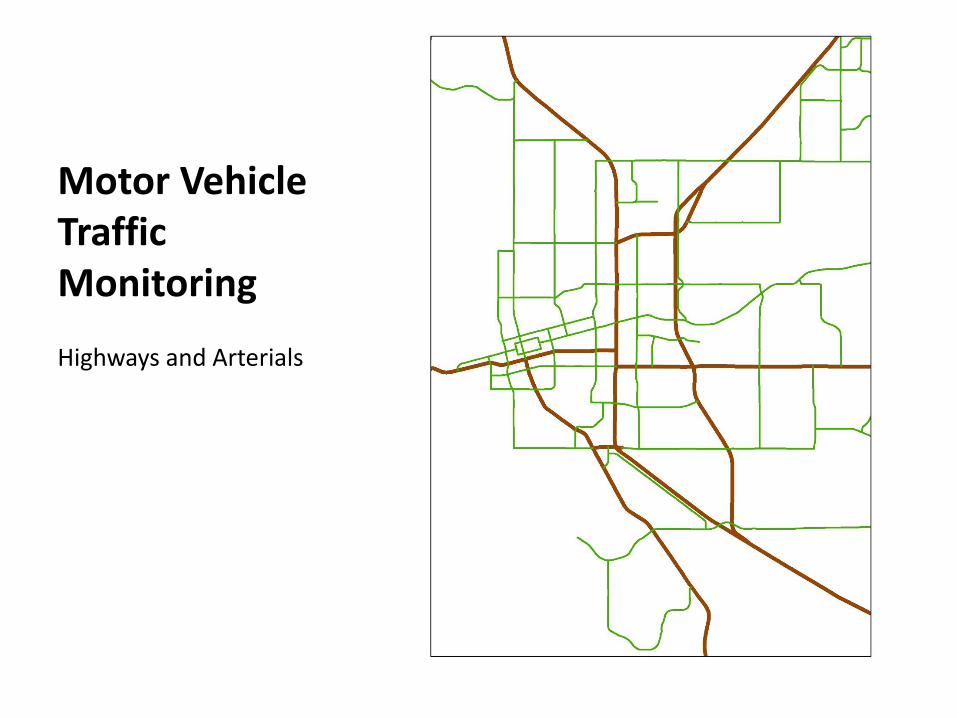
Motor Vehicle Traffic Monitoring
Highways and Arterials
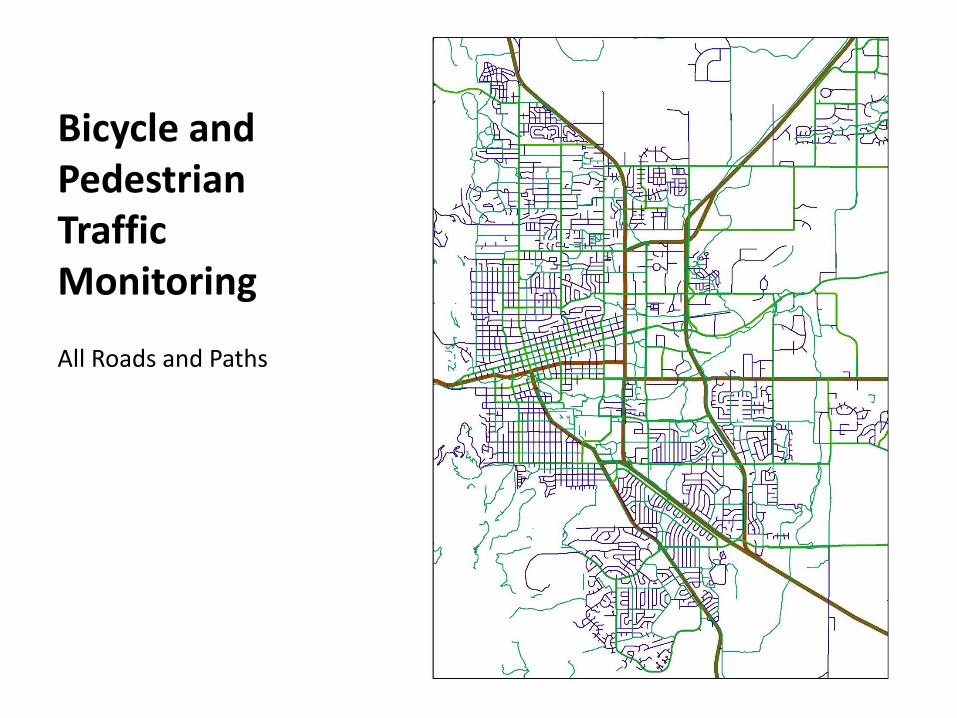
Bicycle and Pedestrian Traffic Monitoring
All Roads and Paths
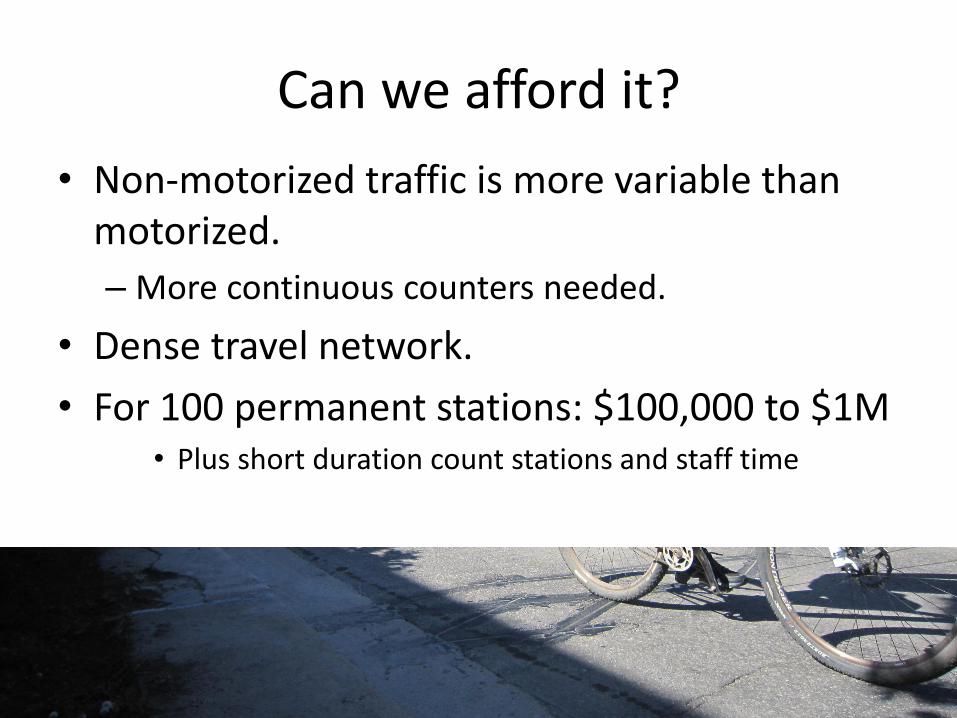
Can we afford it?
• Non-motorized traffic is more variable than motorized.
– More continuous counters needed.
• Dense travel network.
• For 100 permanent stations: $100,000 to $1M • Plus short duration count stations and staff time
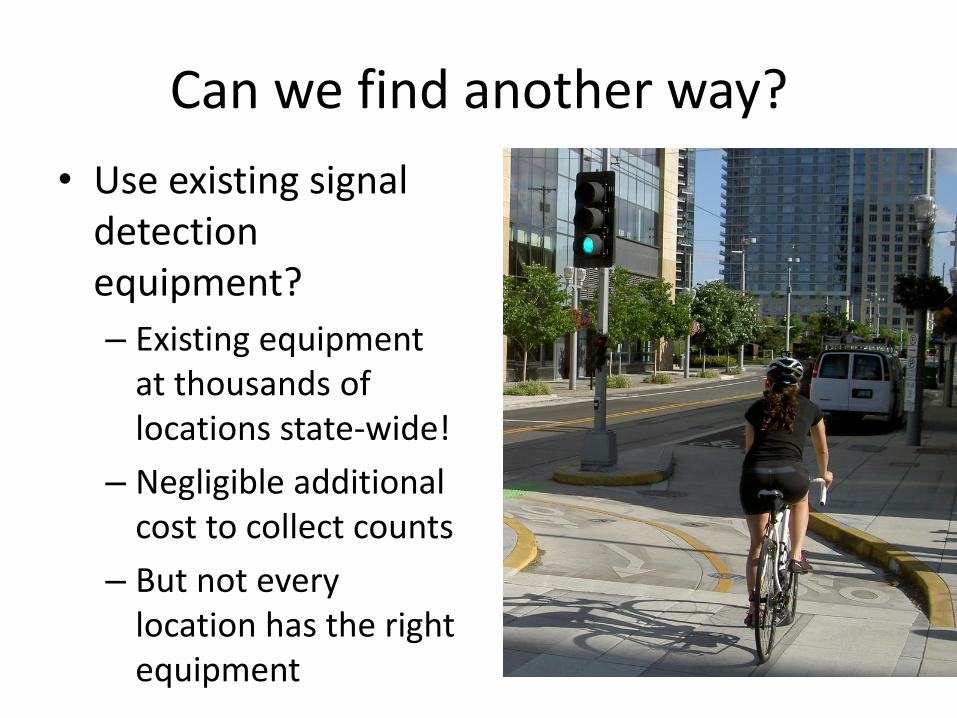
Can we find another way?
• Use existing signal detection equipment?
– Existing equipment at thousands of locations state-wide!
– Negligible additional cost to collect counts
– But not every location has the right equipment
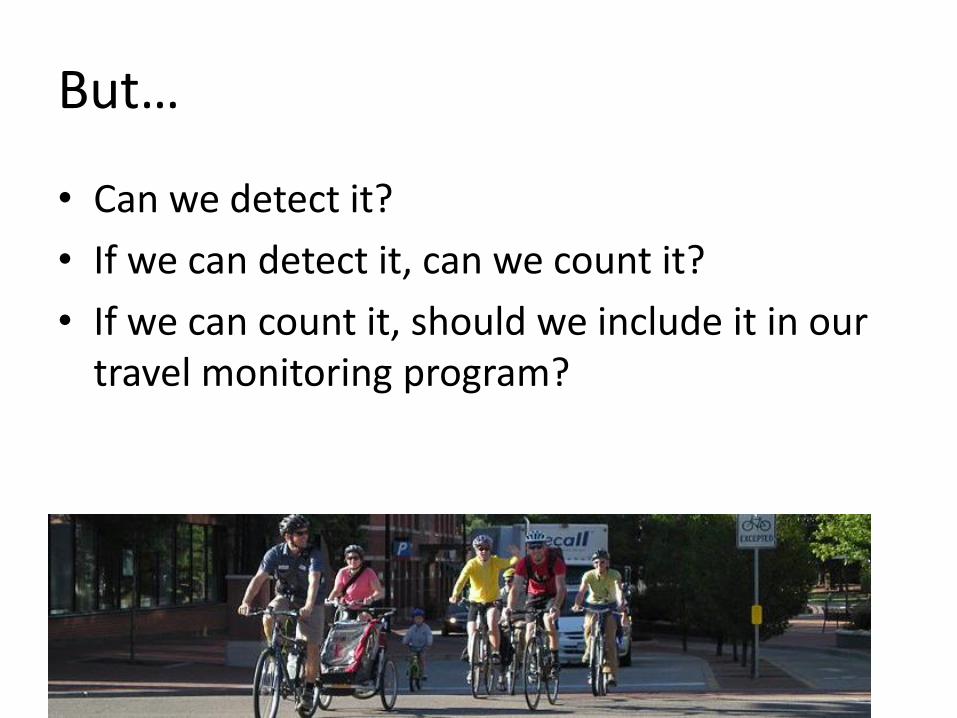
But…
• Can we detect it?
• If we can detect it, can we count it?
• If we can count it, should we include it in our travel monitoring program?

Methods
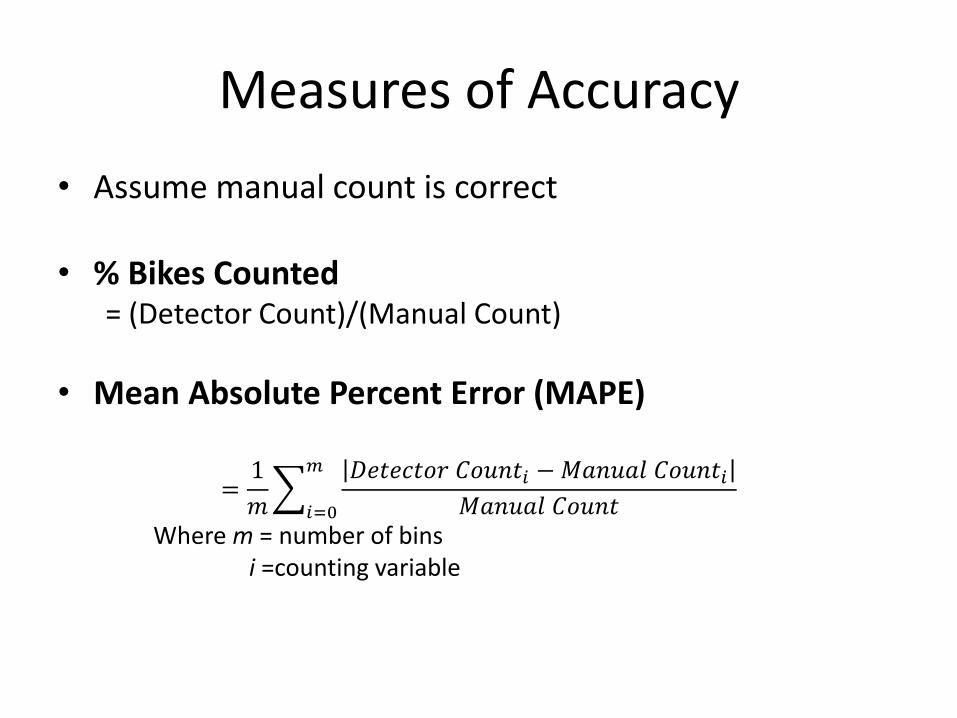
Measures of Accuracy
• Assume manual count is correct
• % Bikes Counted = (Detector Count)/(Manual Count)
• Mean Absolute Percent Error (MAPE)
=1
𝑚
𝐷𝑒𝑡𝑒𝑐𝑡𝑜𝑟 𝐶𝑜𝑢𝑛𝑡𝑖 −𝑀𝑎𝑛𝑢𝑎𝑙 𝐶𝑜𝑢𝑛𝑡𝑖𝑀𝑎𝑛𝑢𝑎𝑙 𝐶𝑜𝑢𝑛𝑡
𝑚
𝑖=0
Where m = number of bins i =counting variable
Video
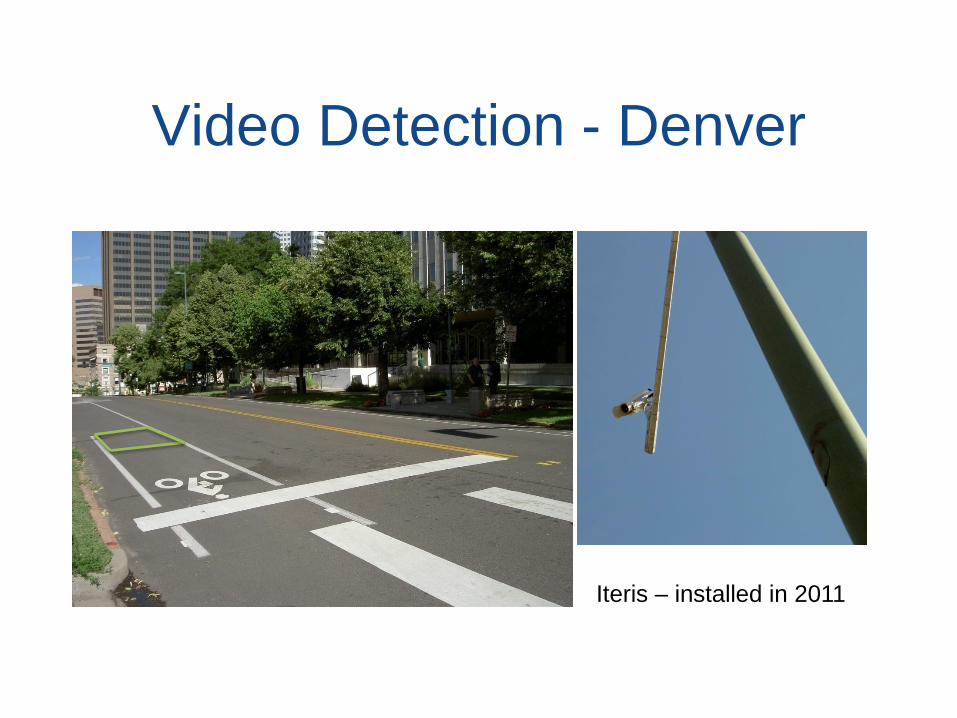
Video Detection - Denver
Iteris – installed in 2011
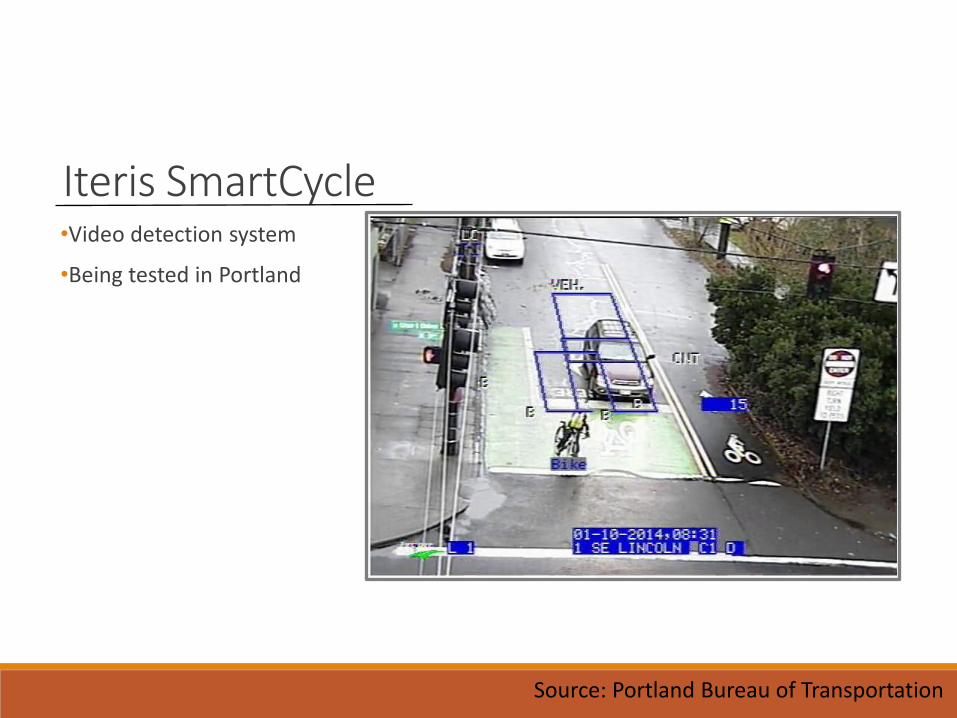
Iteris SmartCycle •Video detection system
•Being tested in Portland
Source: Portland Bureau of Transportation
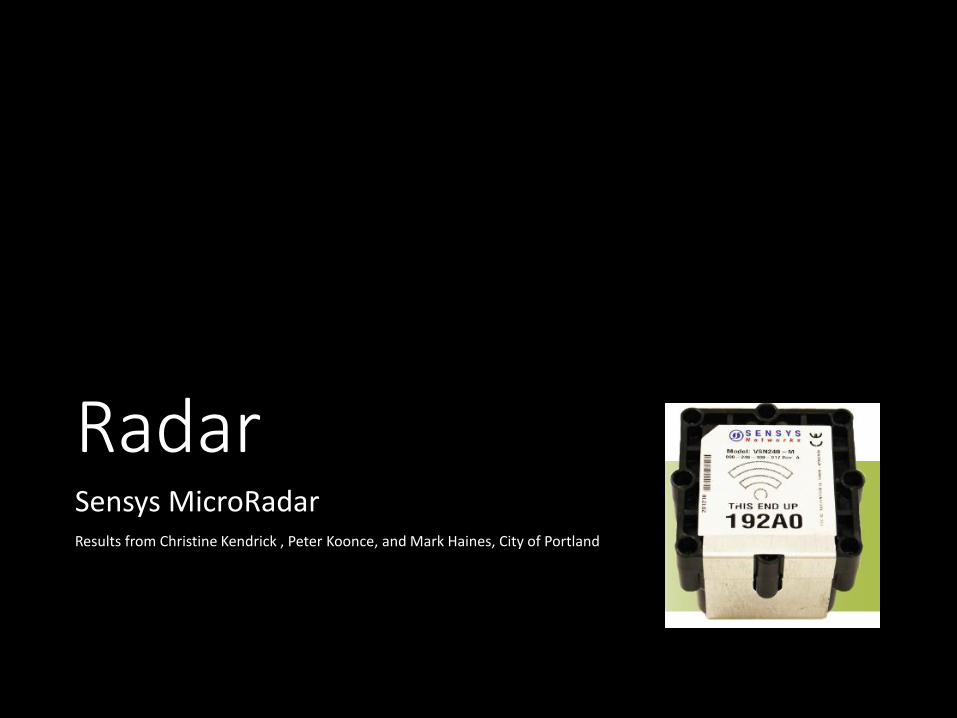
Radar Sensys MicroRadar Results from Christine Kendrick , Peter Koonce, and Mark Haines, City of Portland
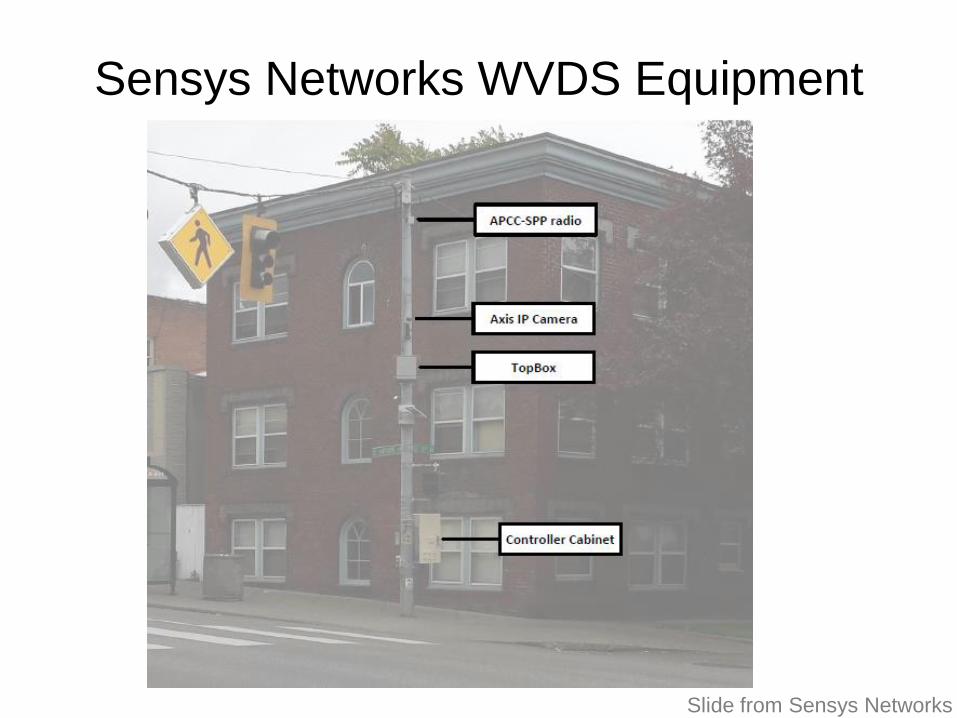
Sensys Networks WVDS Equipment
Slide from Sensys Networks
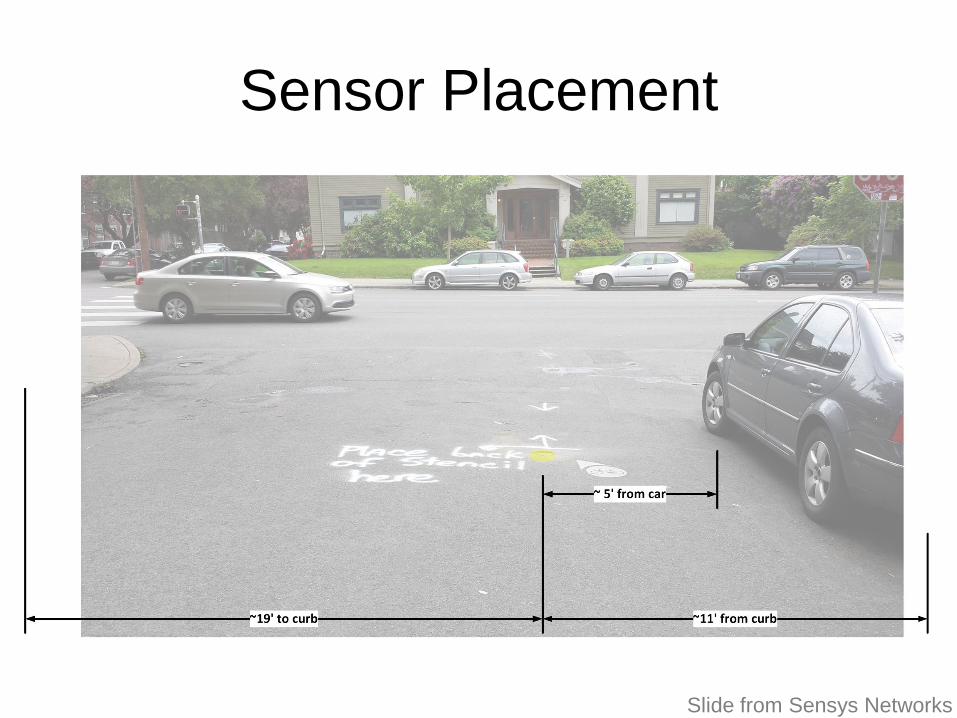
Sensor Placement
Slide from Sensys Networks
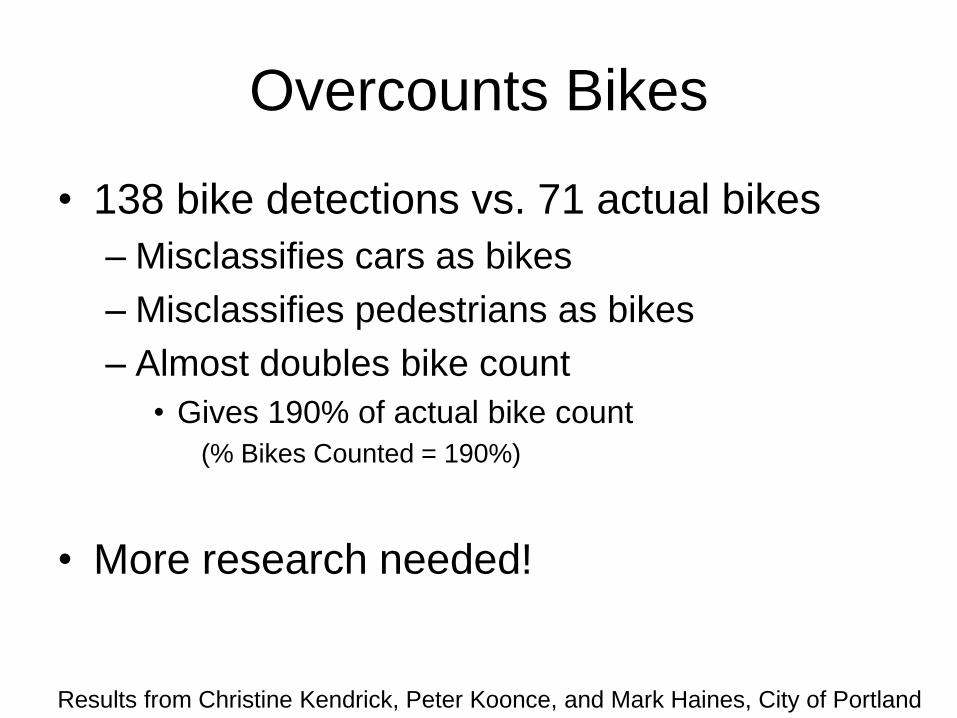
Overcounts Bikes
• 138 bike detections vs. 71 actual bikes
– Misclassifies cars as bikes
– Misclassifies pedestrians as bikes
– Almost doubles bike count
• Gives 190% of actual bike count
(% Bikes Counted = 190%)
• More research needed!
Results from Christine Kendrick, Peter Koonce, and Mark Haines, City of Portland
Thermal Camera Results from Christine Kendrick , Peter Koonce, City of Portland
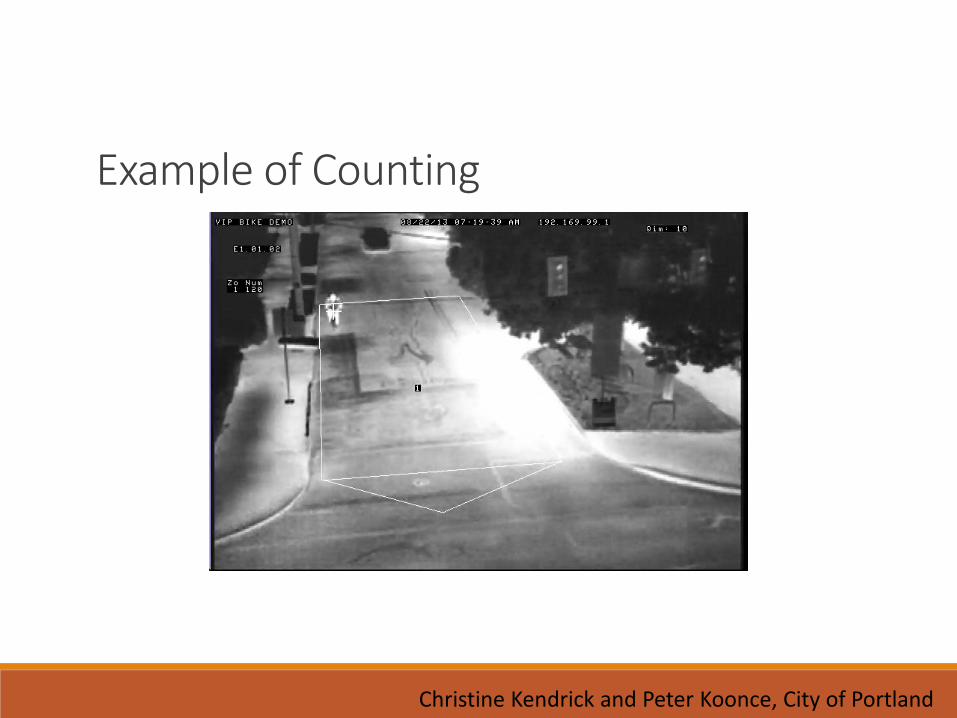
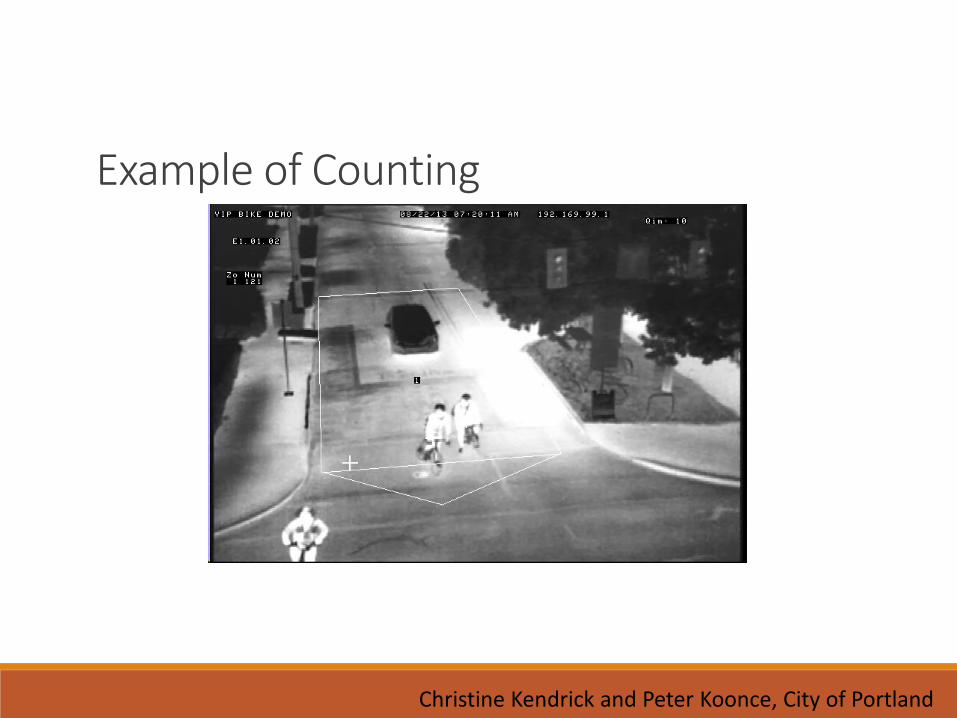
Example of Counting
Christine Kendrick and Peter Koonce, City of Portland
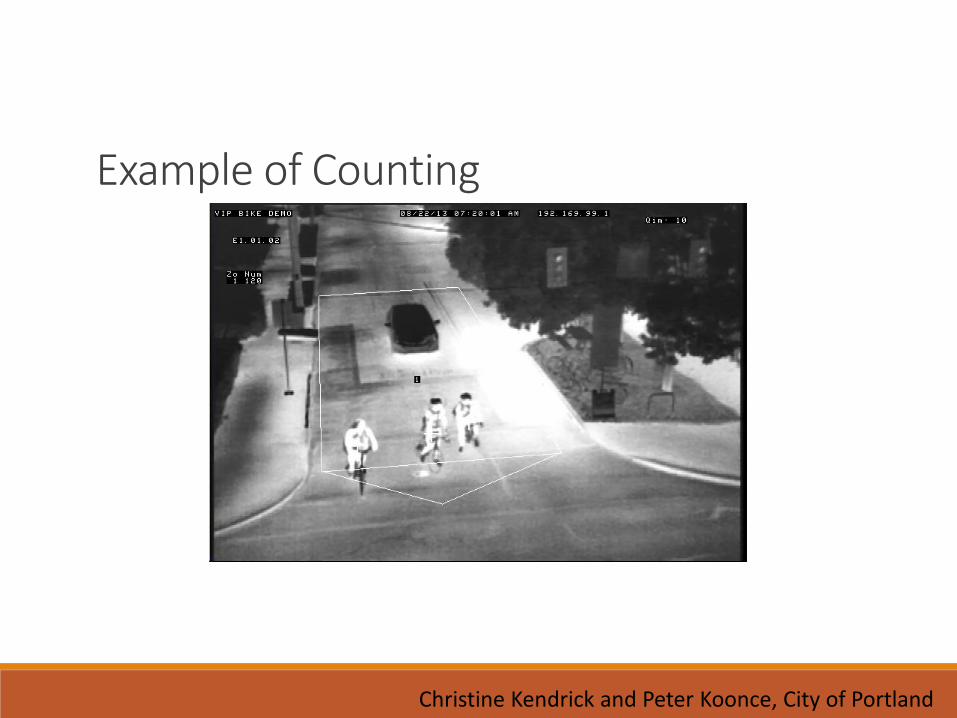
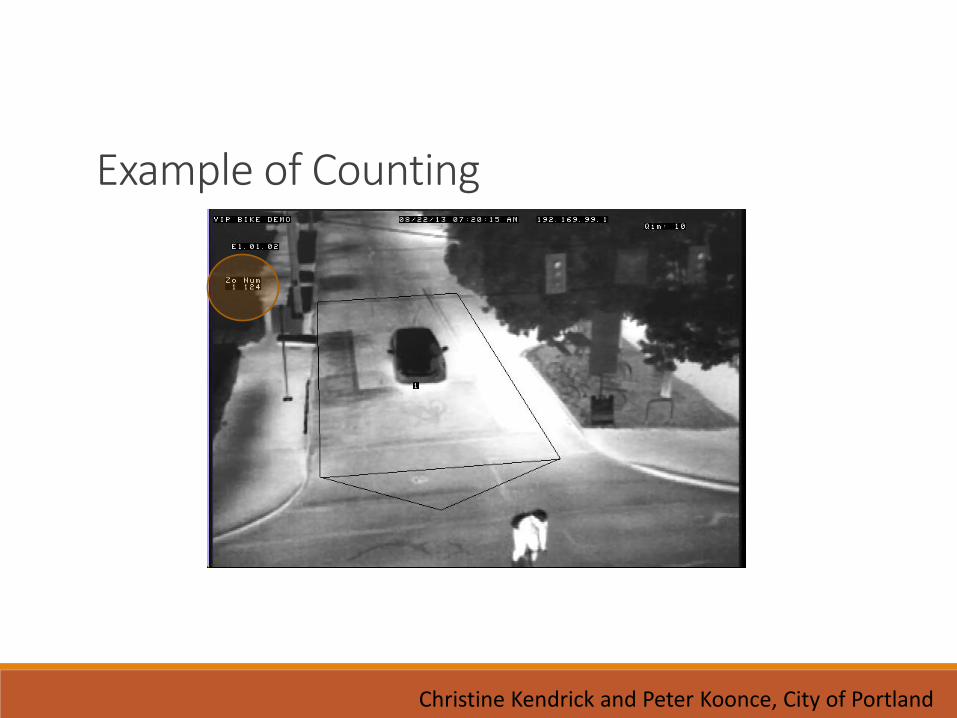
Example of Counting
Christine Kendrick and Peter Koonce, City of Portland
Example of Counting
Christine Kendrick and Peter Koonce, City of Portland
Example of Counting
Christine Kendrick and Peter Koonce, City of Portland
Results
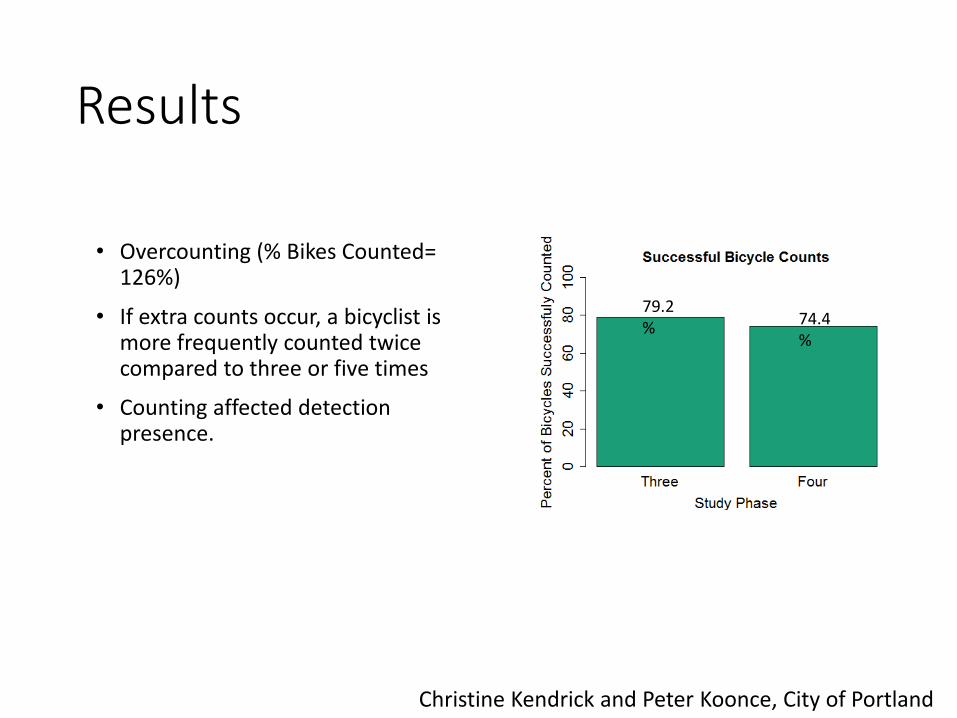
•Overcounting (% Bikes Counted= 126%)
•If extra counts occur, a bicyclist is more frequently counted twice compared to three or five times
•Counting affected detection presence.
Christine Kendrick and Peter Koonce, City of Portland

Inductive Loops
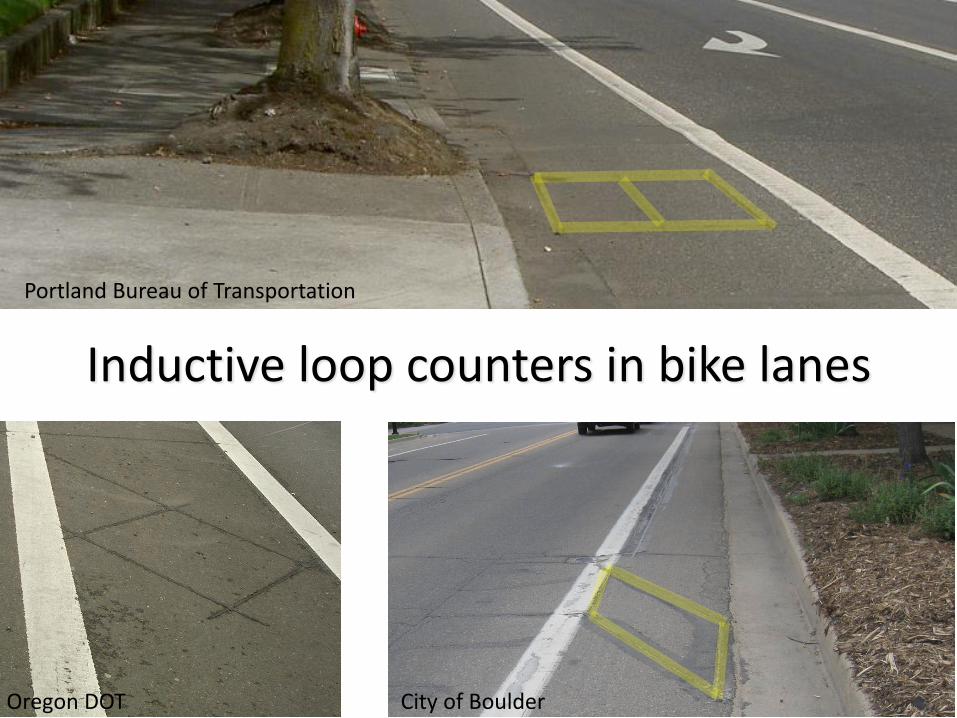
Inductive loop counters in bike lanes
Oregon DOT
Portland Bureau of Transportation
City of Boulder
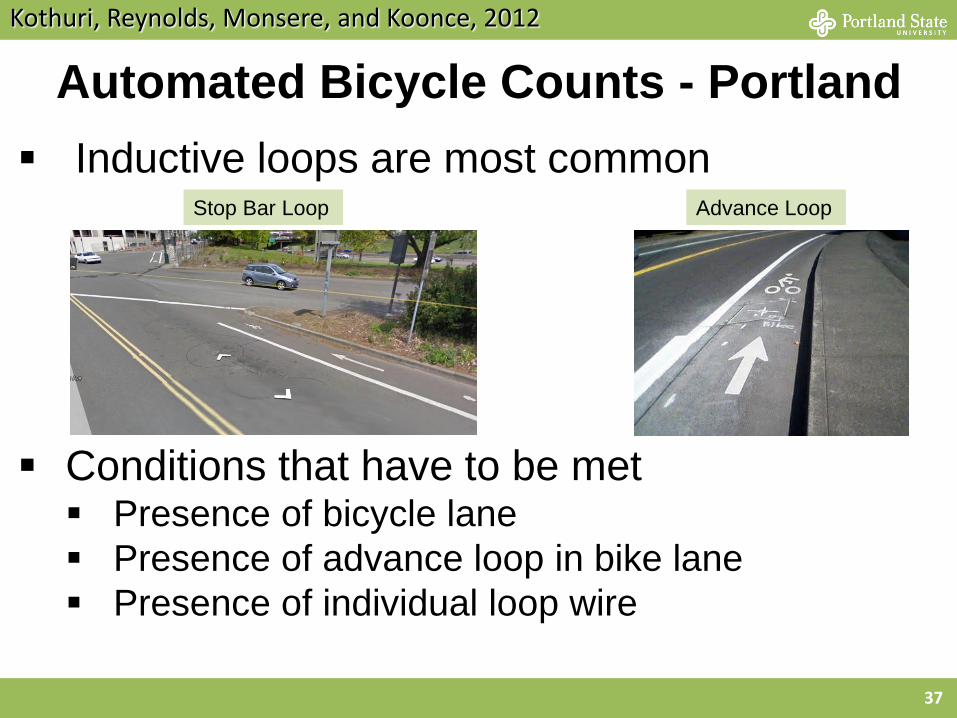
Automated Bicycle Counts - Portland
Kothuri, Reynolds, Monsere, and Koonce, 2012
37
Inductive loops are most common
Conditions that have to be met Presence of bicycle lane
Presence of advance loop in bike lane
Presence of individual loop wire
Stop Bar Loop Advance Loop
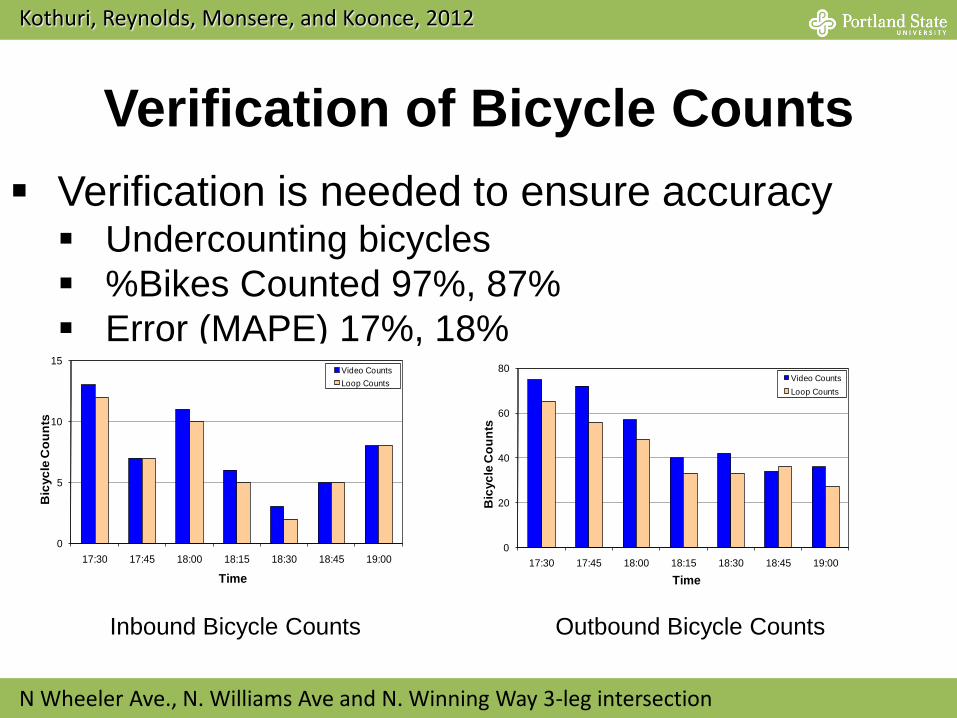
Verification of Bicycle Counts
Verification is needed to ensure accuracy Undercounting bicycles
%Bikes Counted 97%, 87%
Error (MAPE) 17%, 18%
0
5
10
15
17:30 17:45 18:00 18:15 18:30 18:45 19:00
Bic
yc
le C
ou
nts
Time
Video Counts
Loop Counts
0
20
40
60
80
17:30 17:45 18:00 18:15 18:30 18:45 19:00
Bic
yc
le C
ou
nts
Time
Video Counts
Loop Counts
Inbound Bicycle Counts Outbound Bicycle Counts
N Wheeler Ave., N. Williams Ave and N. Winning Way 3-leg intersection
Kothuri, Reynolds, Monsere, and Koonce, 2012
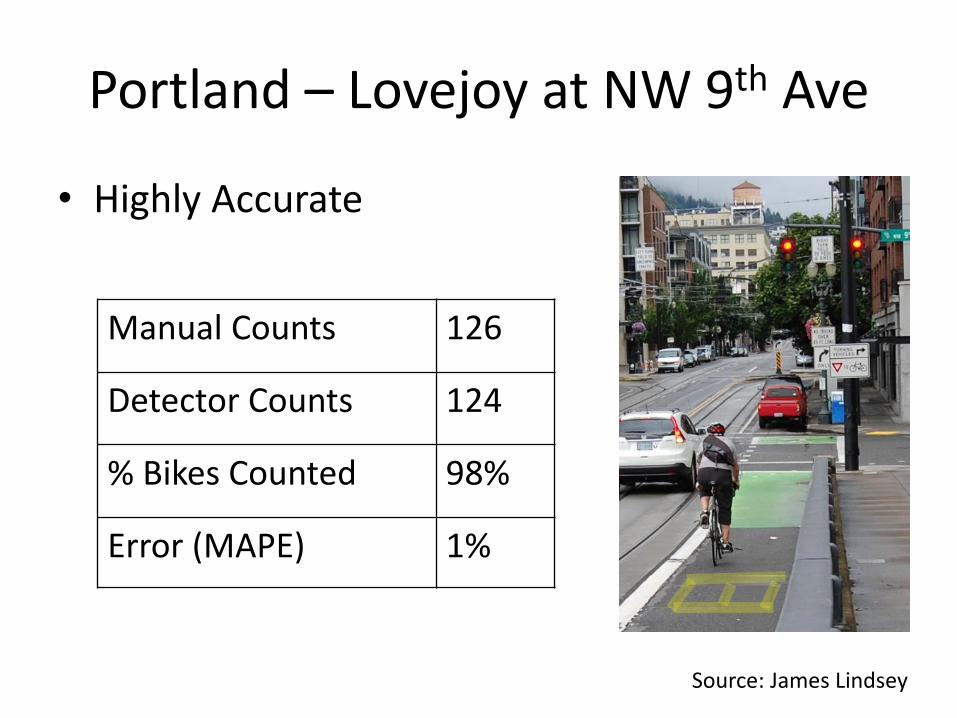
Portland – Lovejoy at NW 9th Ave
• Highly Accurate
Manual Counts 126
Detector Counts 124
% Bikes Counted 98%
Error (MAPE) 1%
Source: James Lindsey
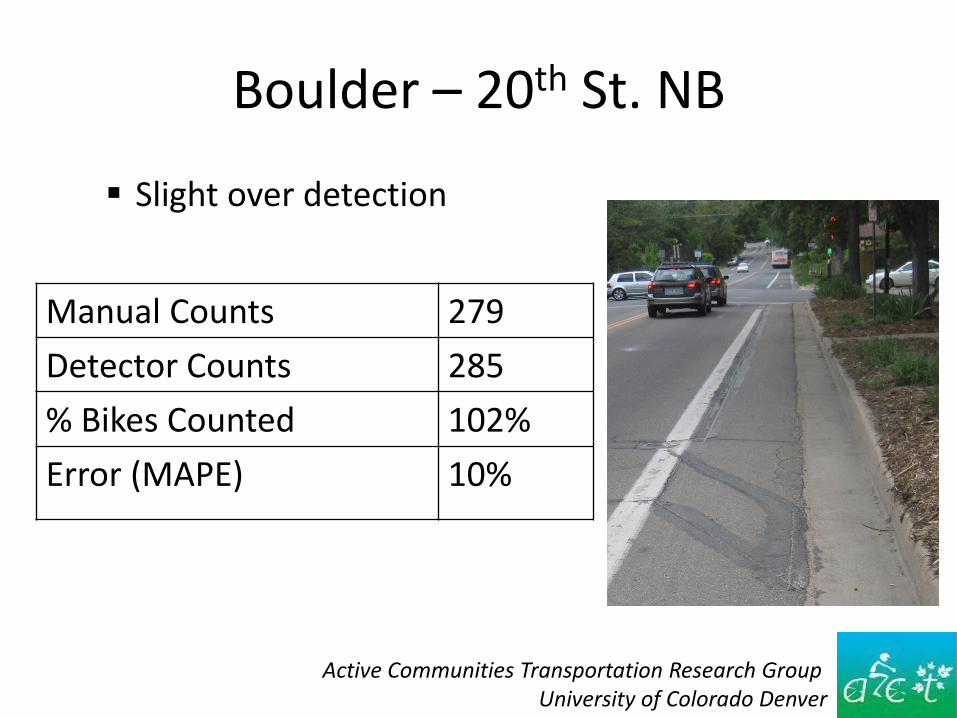
Boulder – 20th St. NB
Slight over detection
Manual Counts 279
Detector Counts 285
% Bikes Counted 102%
Error (MAPE) 10%
Active Communities Transportation Research Group University of Colorado Denver
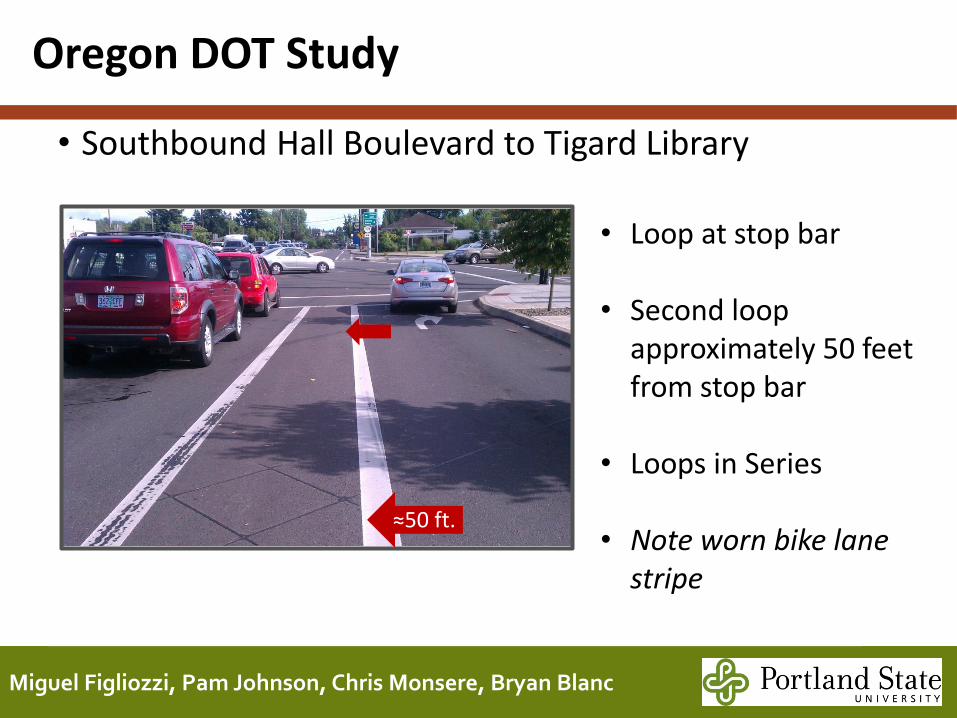
• Southbound Hall Boulevard to Tigard Library
Miguel Figliozzi, Pam Johnson, Chris Monsere, Bryan Blanc
Oregon DOT Study
41
≈50 ft.
• Loop at stop bar • Second loop
approximately 50 feet from stop bar
• Loops in Series
• Note worn bike lane stripe
Miguel Figliozzi, Pam Johnson, Chris Monsere, Bryan Blanc
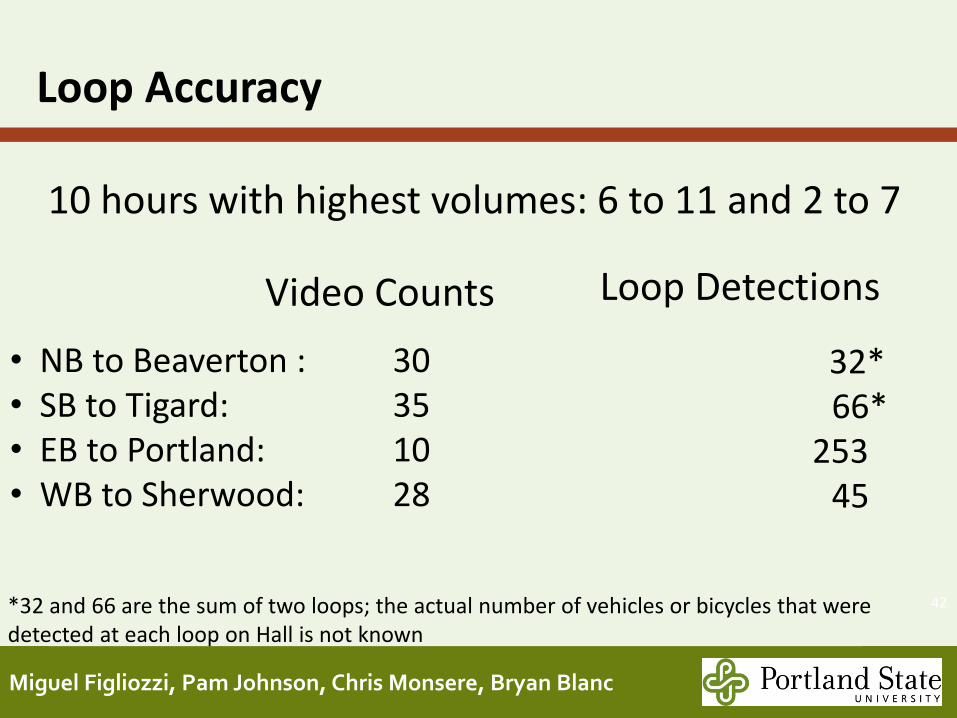
Loop Accuracy
42
32* 66* 253 45
Video Counts
• NB to Beaverton : 30 • SB to Tigard: 35 • EB to Portland: 10 • WB to Sherwood: 28
Loop Detections
10 hours with highest volumes: 6 to 11 and 2 to 7
*32 and 66 are the sum of two loops; the actual number of vehicles or bicycles that were detected at each loop on Hall is not known
Miguel Figliozzi, Pam Johnson, Chris Monsere, Bryan Blanc
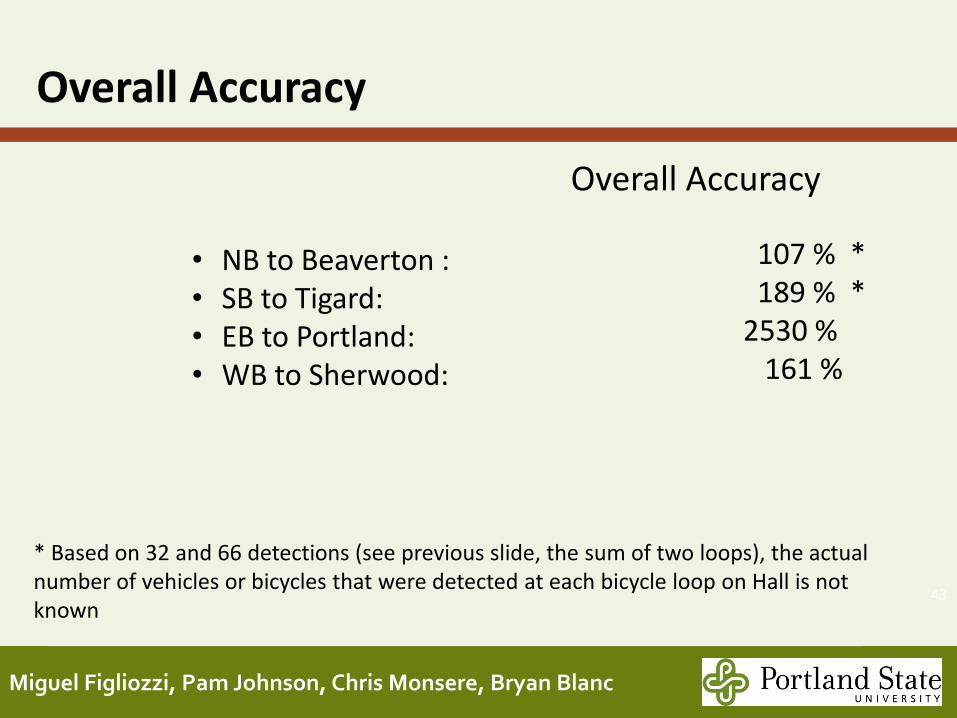
Overall Accuracy
43
107 % * 189 % * 2530 % 161 %
• NB to Beaverton : • SB to Tigard: • EB to Portland: • WB to Sherwood:
Overall Accuracy
* Based on 32 and 66 detections (see previous slide, the sum of two loops), the actual number of vehicles or bicycles that were detected at each bicycle loop on Hall is not known
• The location of loops is very important.
• Clearly, getting the right sensitivity is important to obtain accurate counts.
• TESTING is not optional!!!
Miguel Figliozzi, Pam Johnson, Chris Monsere, Bryan Blanc
Summary: Bicycle Loops
44

Conclusions
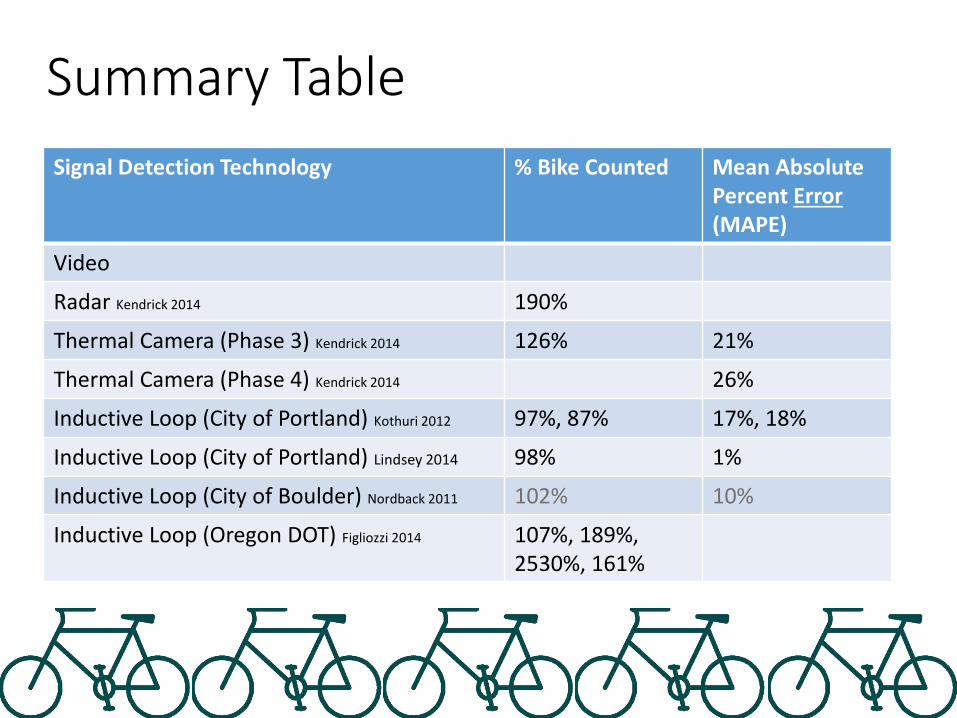
Summary Table
Signal Detection Technology % Bike Counted Mean Absolute Percent Error (MAPE)
Video
Radar Kendrick 2014 190%
Thermal Camera (Phase 3) Kendrick 2014 126% 21%
Thermal Camera (Phase 4) Kendrick 2014 26%
Inductive Loop (City of Portland) Kothuri 2012 97%, 87% 17%, 18%
Inductive Loop (City of Portland) Lindsey 2014 98% 1%
Inductive Loop (City of Boulder) Nordback 2011 102% 10%
Inductive Loop (Oregon DOT) Figliozzi 2014 107%, 189%, 2530%, 161%
Conclusions
Can we detect it? • Sometimes.
If we can detect it, can we count it? • Maybe, but overcounts common.
If we can count it, should we include it in our travel monitoring program?
• You be the judge!
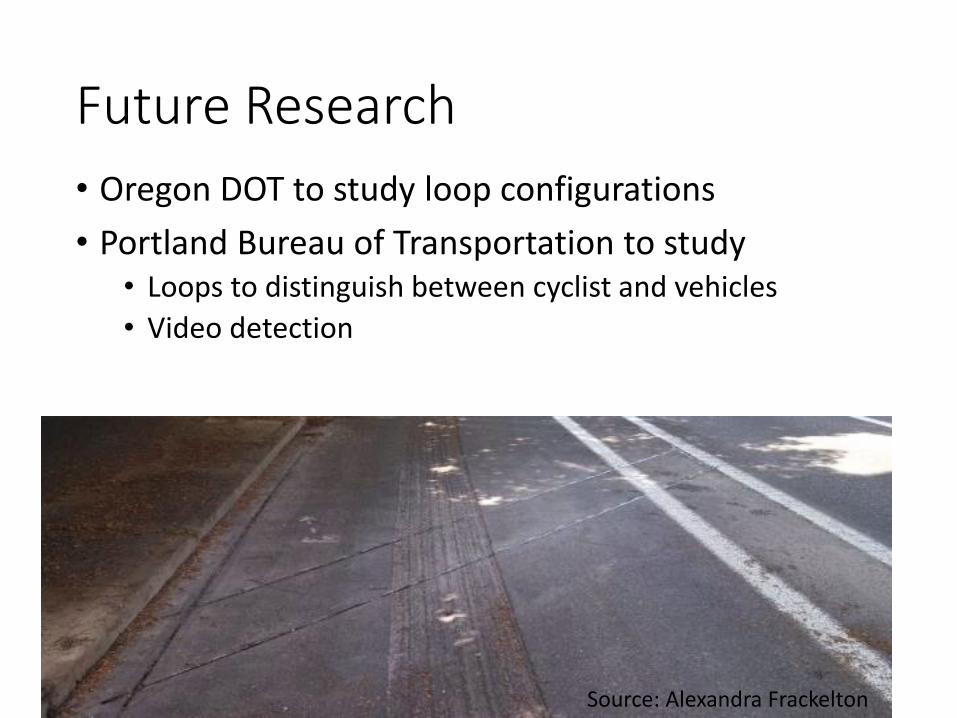
Future Research
• Oregon DOT to study loop configurations
• Portland Bureau of Transportation to study • Loops to distinguish between cyclist and vehicles
• Video detection
Source: Alexandra Frackelton
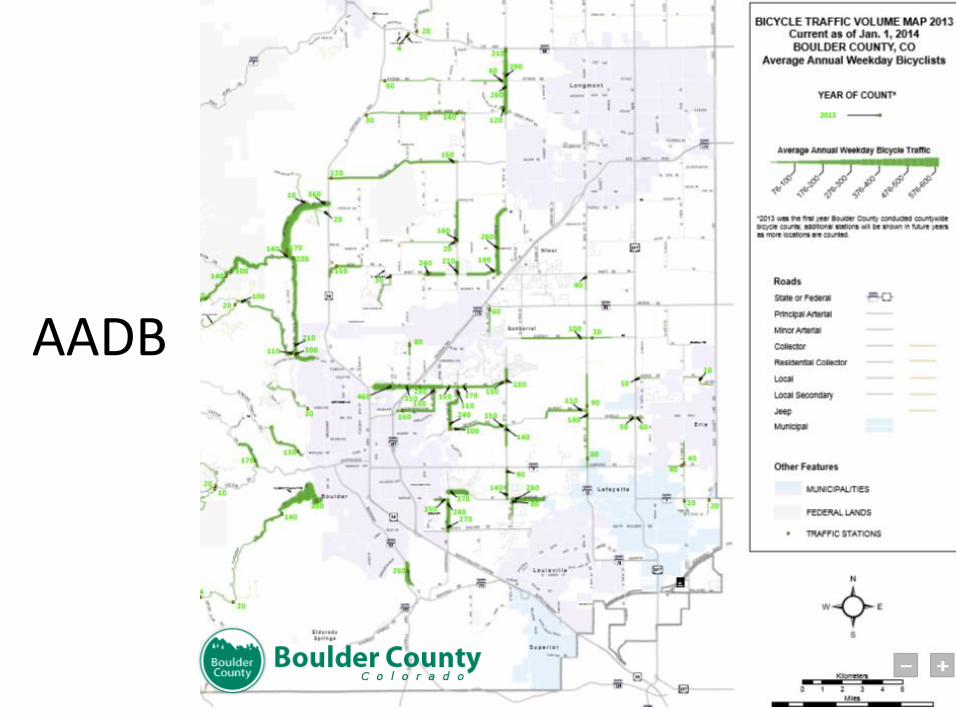
AADB
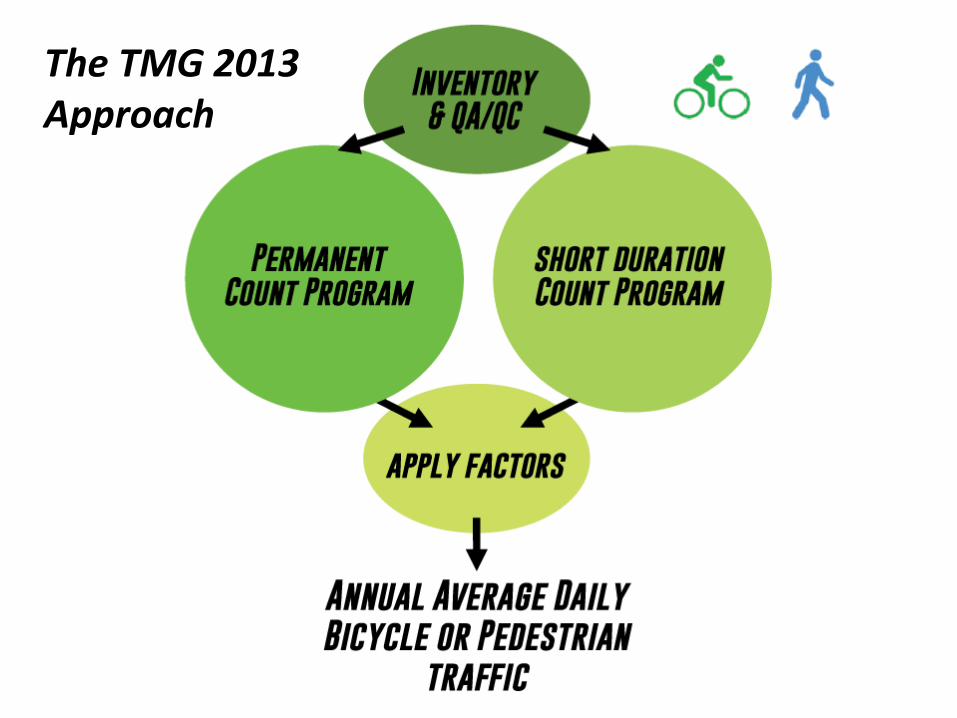
The TMG 2013 Approach
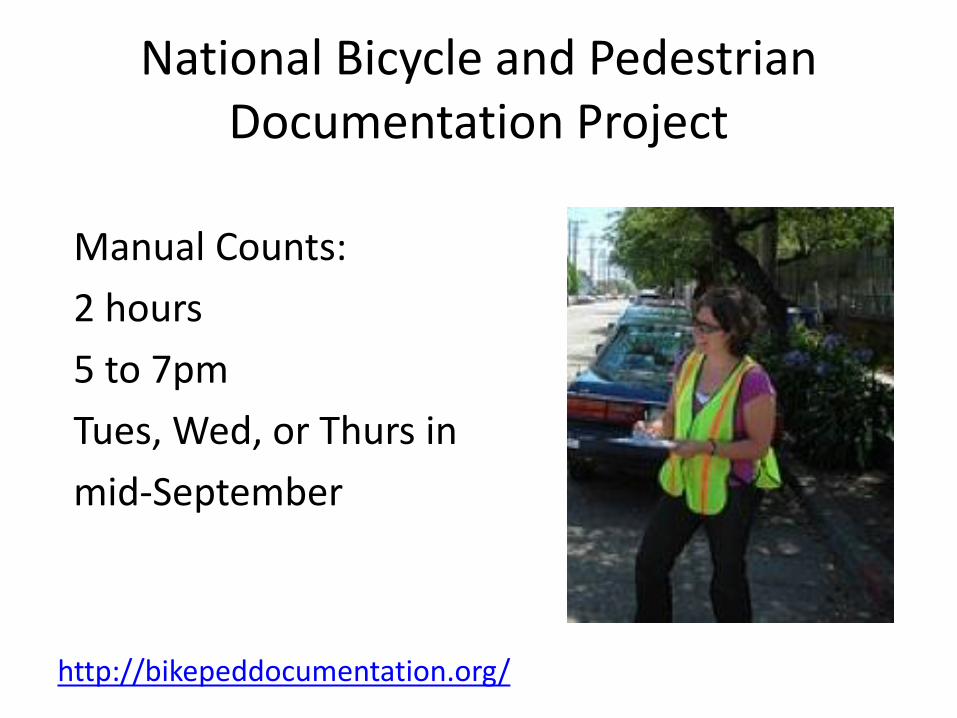
National Bicycle and Pedestrian Documentation Project
Manual Counts:
2 hours
5 to 7pm
Tues, Wed, or Thurs in
mid-September
http://bikepeddocumentation.org/
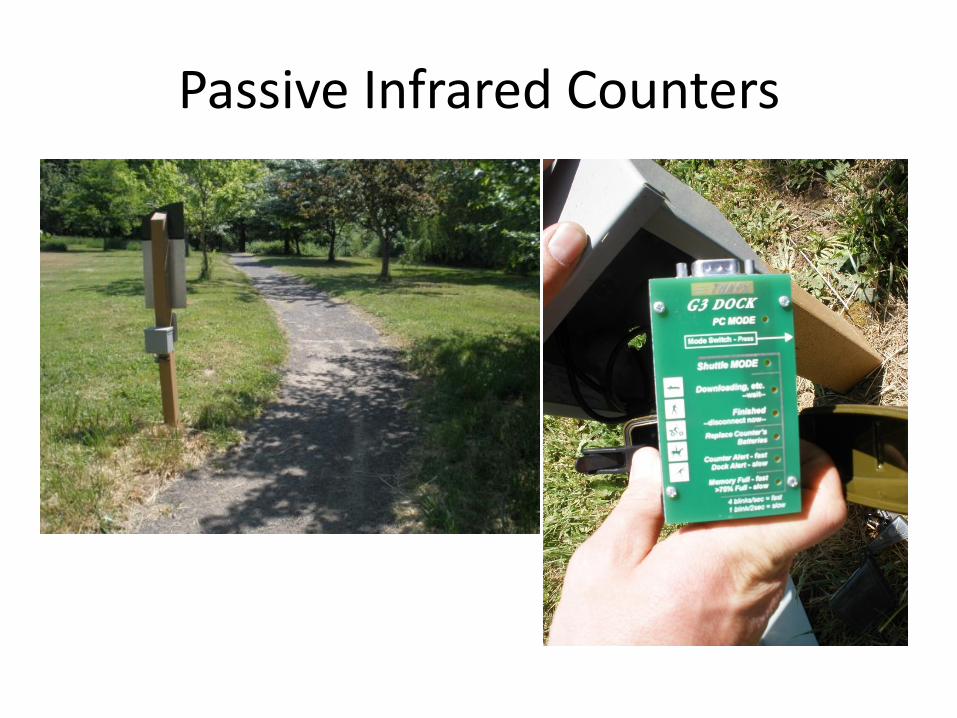
Passive Infrared Counters
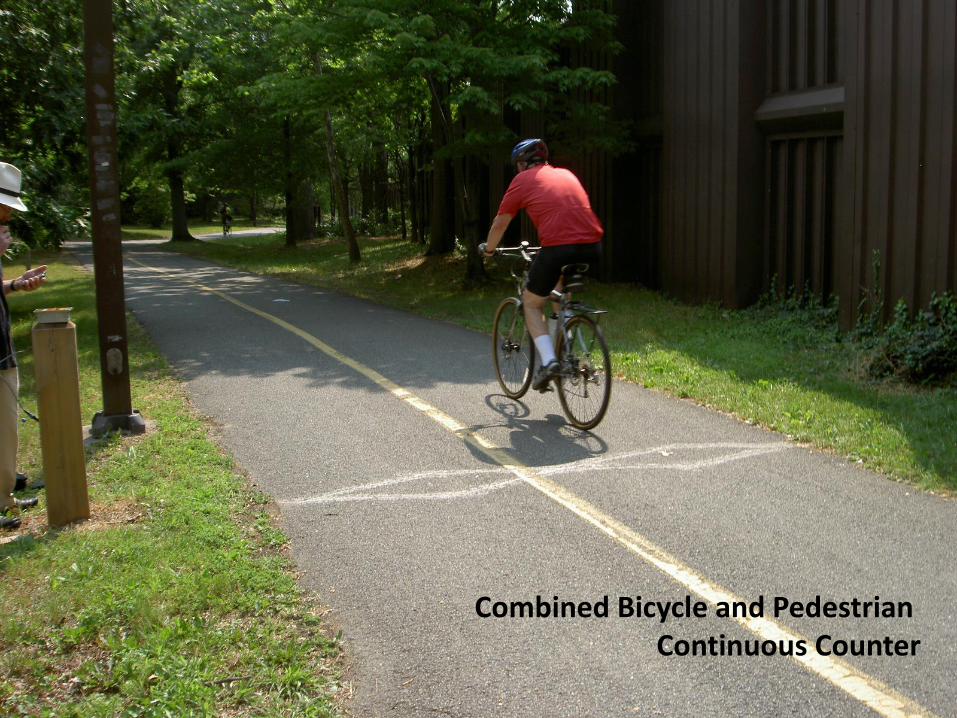
Combined Bicycle and Pedestrian Continuous Counter
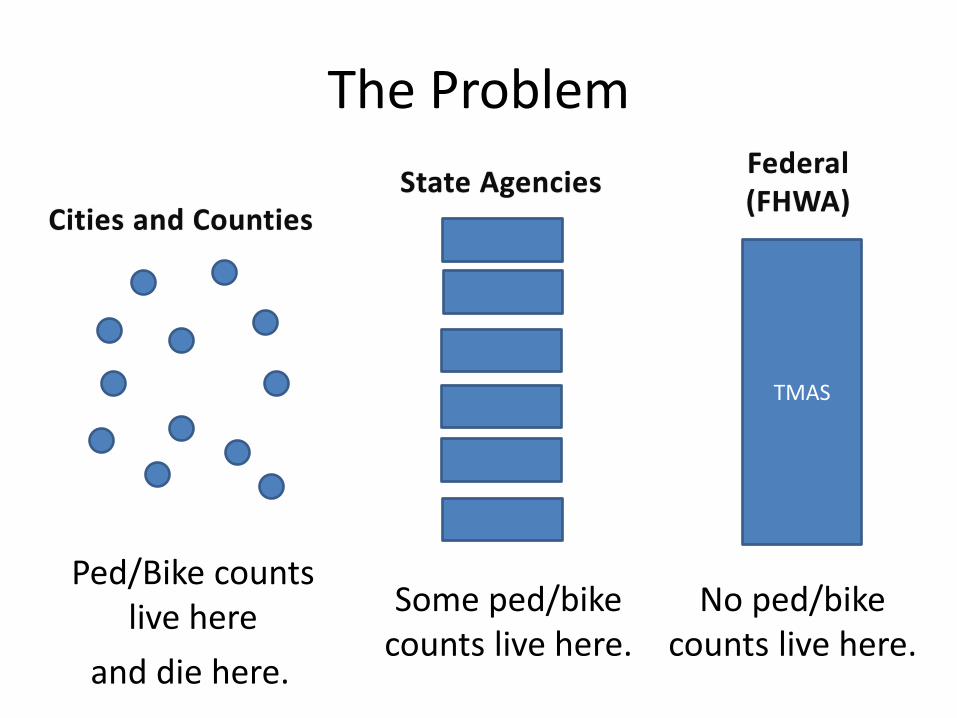
The Problem
Ped/Bike counts live here Some ped/bike
counts live here. and die here.
TMAS
No ped/bike counts live here.
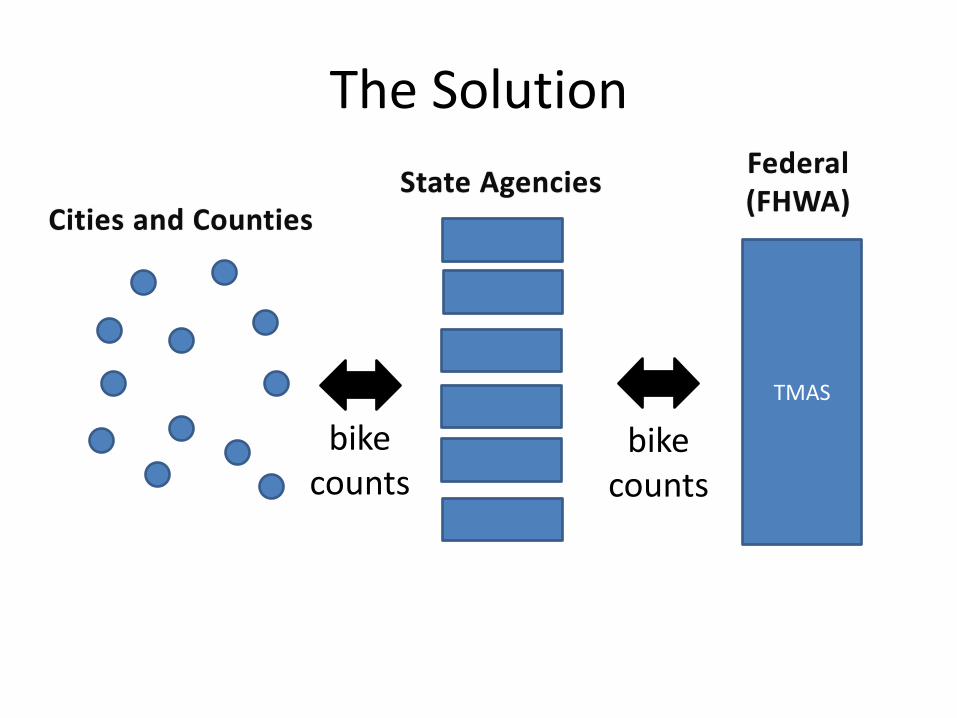
The Solution
bike counts
TMAS
bike counts
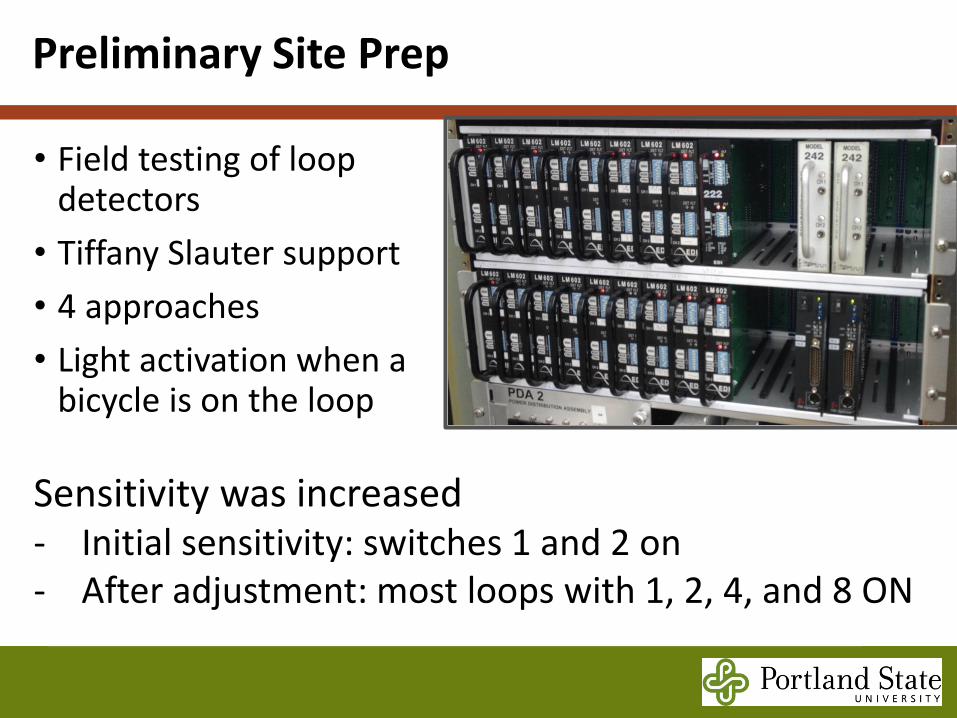
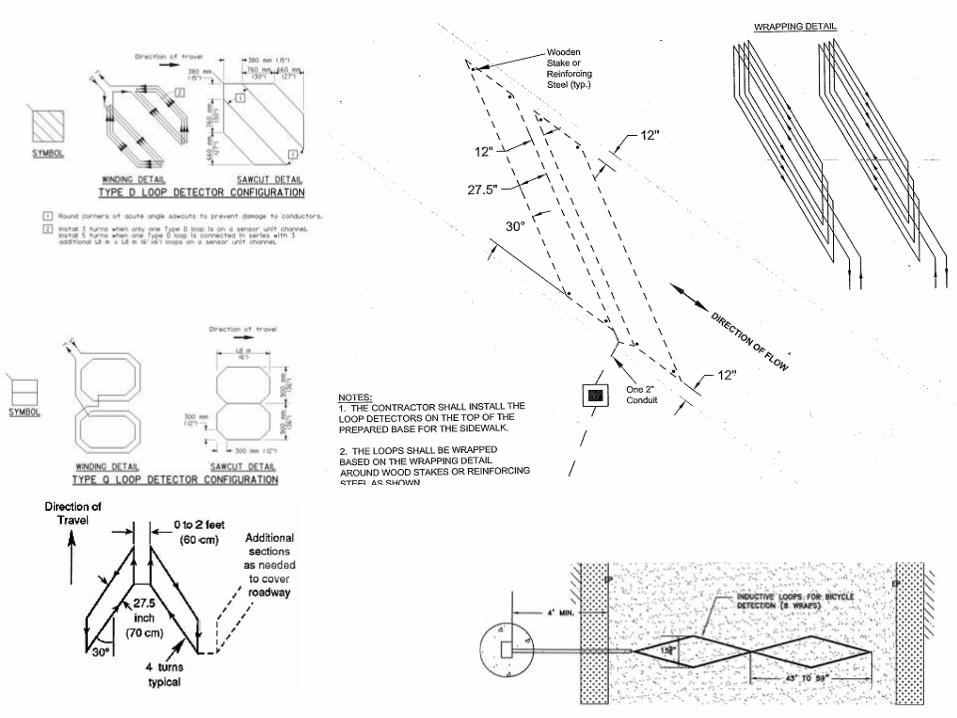
• Field testing of loop detectors
• Tiffany Slauter support
• 4 approaches
• Light activation when a bicycle is on the loop
Preliminary Site Prep
57
Sensitivity was increased - Initial sensitivity: switches 1 and 2 on - After adjustment: most loops with 1, 2, 4, and 8 ON
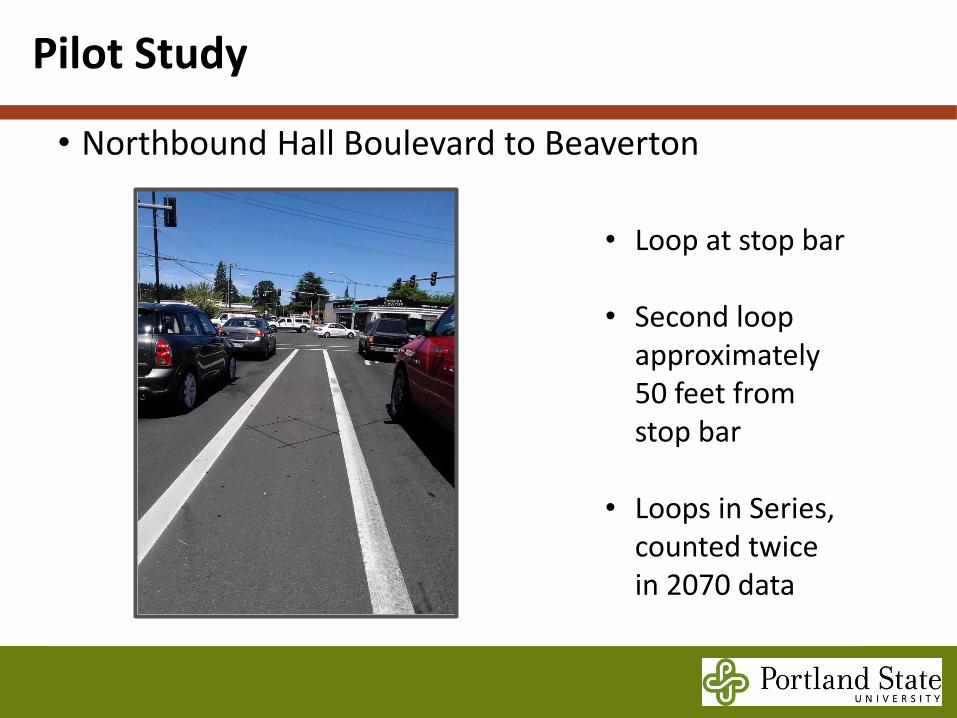
• Northbound Hall Boulevard to Beaverton
Pilot Study
58
• Loop at stop bar • Second loop
approximately 50 feet from stop bar
• Loops in Series, counted twice in 2070 data
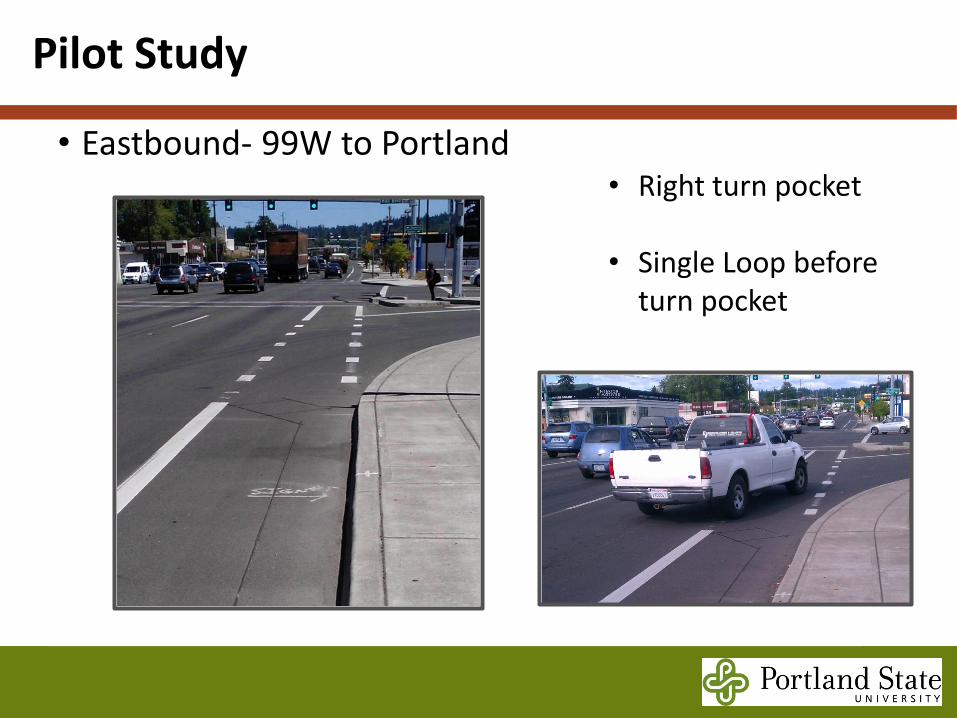
• Eastbound- 99W to Portland
Pilot Study
59
• Right turn pocket • Single Loop before
turn pocket
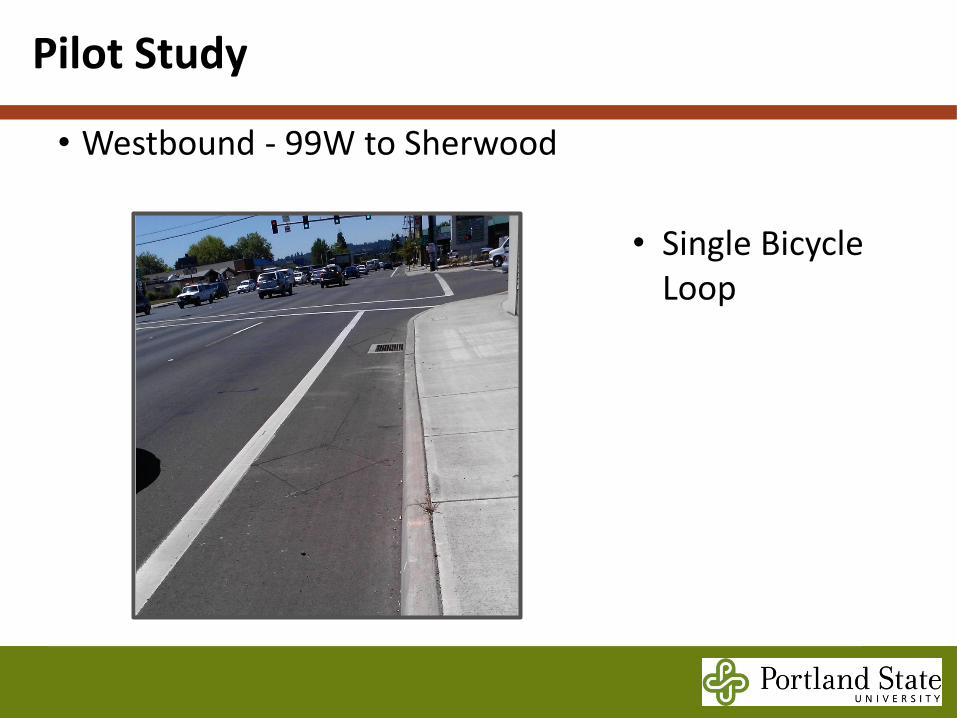
• Westbound - 99W to Sherwood
Pilot Study
60
• Single Bicycle Loop
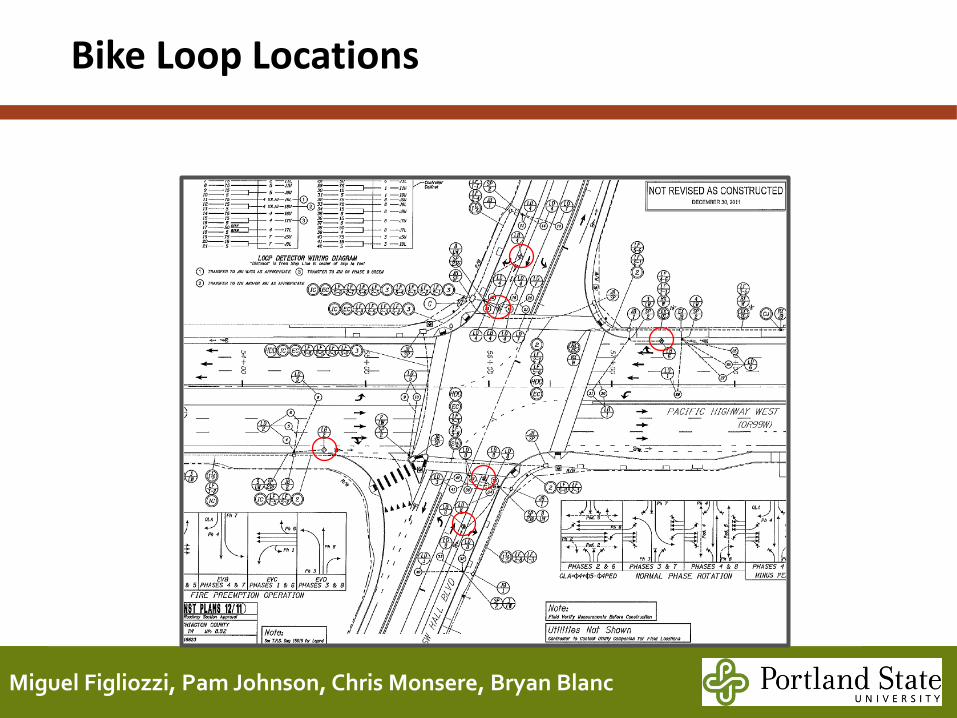
Miguel Figliozzi, Pam Johnson, Chris Monsere, Bryan Blanc
61
Bike Loop Locations
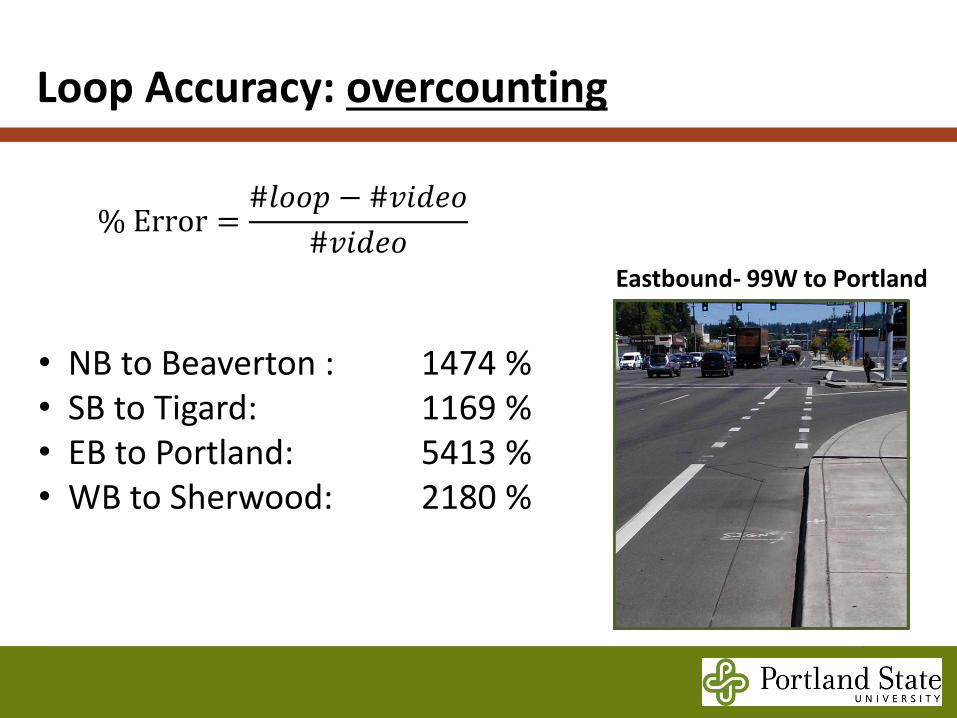
Loop Accuracy: overcounting
62
% Error =#𝑙𝑜𝑜𝑝 − #𝑣𝑖𝑑𝑒𝑜
#𝑣𝑖𝑑𝑒𝑜
• NB to Beaverton : 1474 % • SB to Tigard: 1169 % • EB to Portland: 5413 % • WB to Sherwood: 2180 %
Eastbound- 99W to Portland
Miguel Figliozzi, Pam Johnson, Chris Monsere, Bryan Blanc
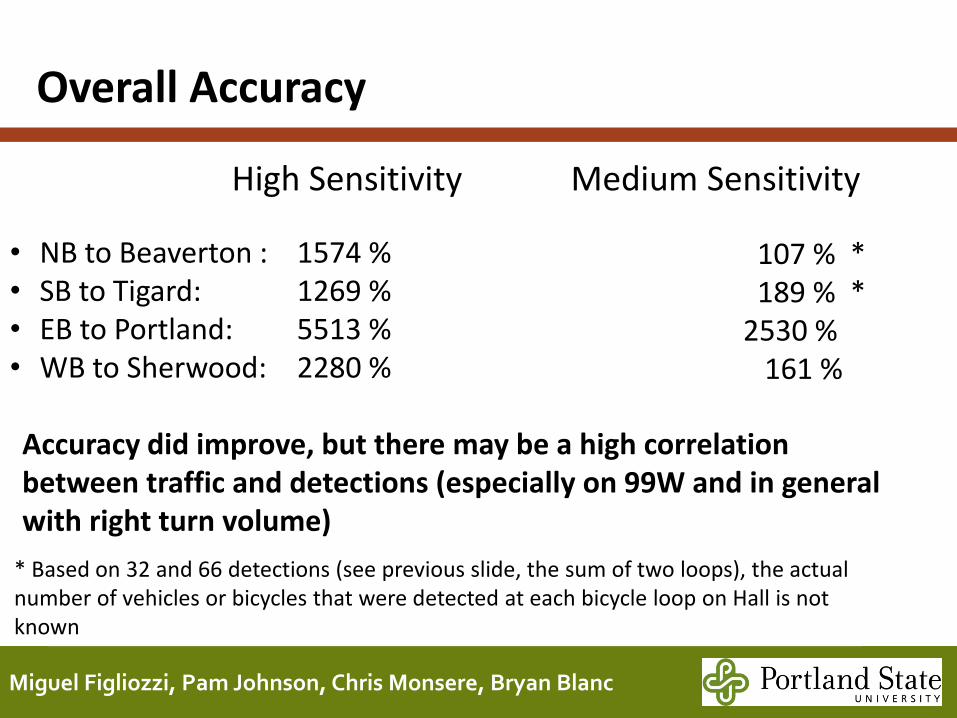
Overall Accuracy
63
107 % * 189 % * 2530 % 161 %
High Sensitivity
• NB to Beaverton : 1574 % • SB to Tigard: 1269 % • EB to Portland: 5513 % • WB to Sherwood: 2280 %
Medium Sensitivity
Accuracy did improve, but there may be a high correlation between traffic and detections (especially on 99W and in general with right turn volume)
* Based on 32 and 66 detections (see previous slide, the sum of two loops), the actual number of vehicles or bicycles that were detected at each bicycle loop on Hall is not known
Analysis - Bicycle Loops
64
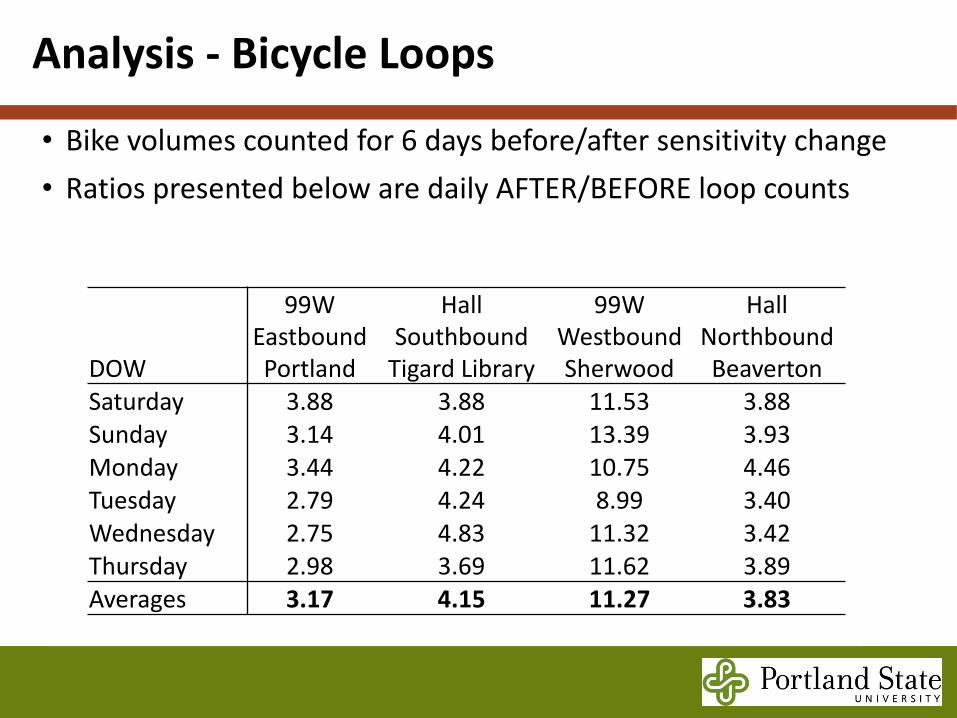
DOW
99W Eastbound Portland
Hall Southbound
Tigard Library
99W Westbound Sherwood
Hall Northbound Beaverton
Saturday 3.88 3.88 11.53 3.88 Sunday 3.14 4.01 13.39 3.93 Monday 3.44 4.22 10.75 4.46 Tuesday 2.79 4.24 8.99 3.40 Wednesday 2.75 4.83 11.32 3.42 Thursday 2.98 3.69 11.62 3.89 Averages 3.17 4.15 11.27 3.83
• Bike volumes counted for 6 days before/after sensitivity change
• Ratios presented below are daily AFTER/BEFORE loop counts
Analysis- Bicycle Loops
65
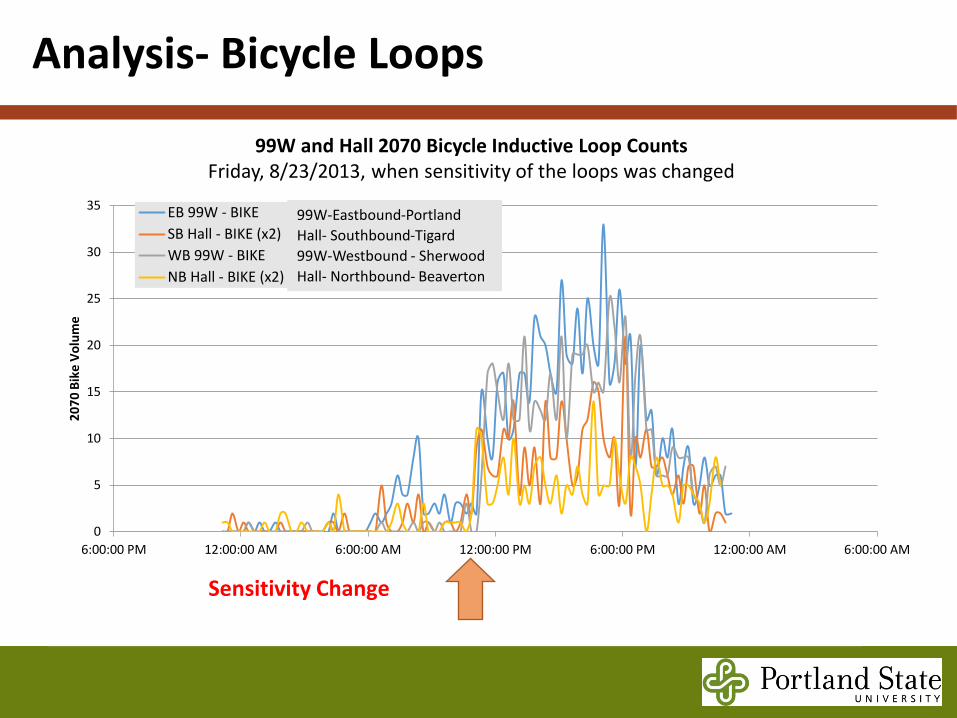
99W and Hall 2070 Bicycle Inductive Loop Counts Friday, 8/23/2013, when sensitivity of the loops was changed
0
5
10
15
20
25
30
35
6:00:00 PM 12:00:00 AM 6:00:00 AM 12:00:00 PM 6:00:00 PM 12:00:00 AM 6:00:00 AM
20
70
Bik
e V
olu
me
EB 99W - BIKE
SB Hall - BIKE (x2)
WB 99W - BIKE
NB Hall - BIKE (x2)
Sensitivity Change
99W-Eastbound-Portland
Hall- Southbound-Tigard
99W-Westbound - Sherwood
Hall- Northbound- Beaverton
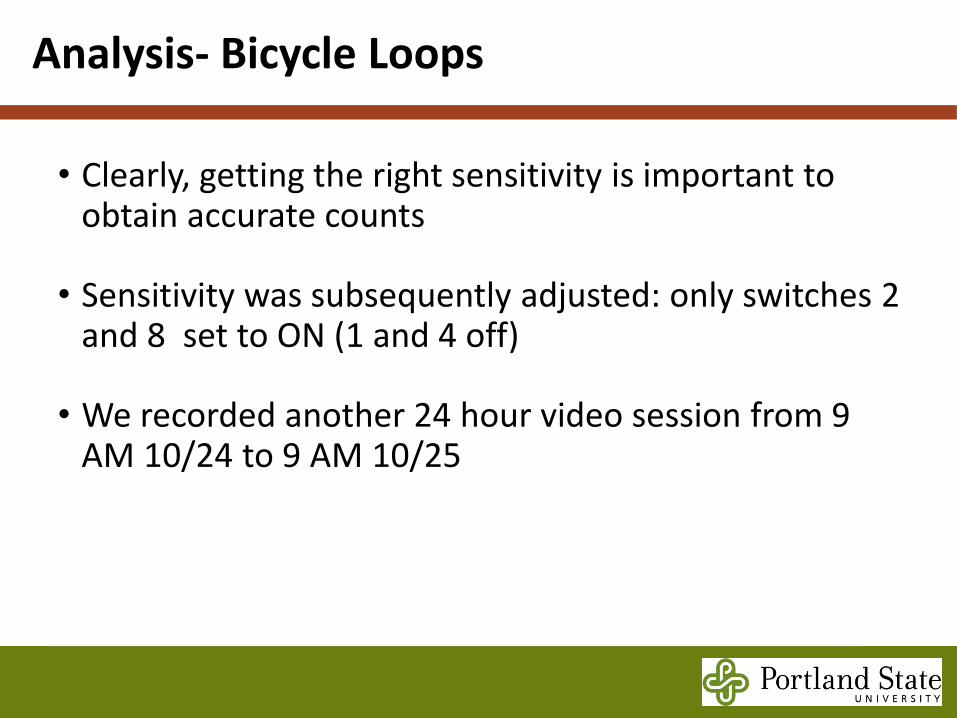
• Clearly, getting the right sensitivity is important to obtain accurate counts
• Sensitivity was subsequently adjusted: only switches 2 and 8 set to ON (1 and 4 off)
• We recorded another 24 hour video session from 9 AM 10/24 to 9 AM 10/25
Analysis- Bicycle Loops
66
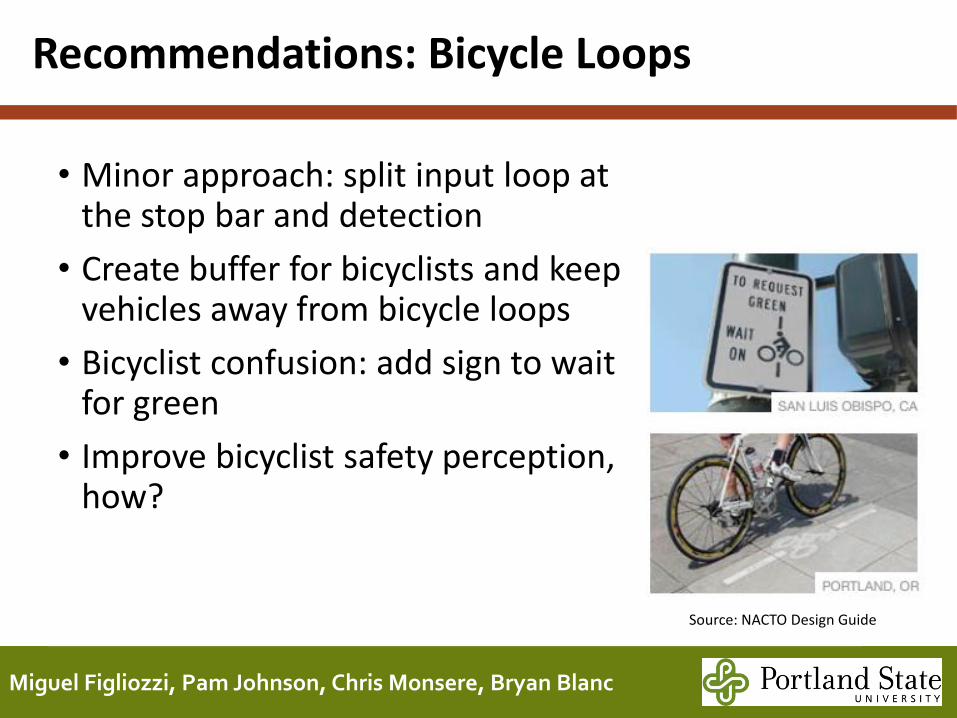
• Minor approach: split input loop at the stop bar and detection
• Create buffer for bicyclists and keep vehicles away from bicycle loops
• Bicyclist confusion: add sign to wait for green
• Improve bicyclist safety perception, how?
Miguel Figliozzi, Pam Johnson, Chris Monsere, Bryan Blanc
Recommendations: Bicycle Loops
67 Source: NACTO Design Guide
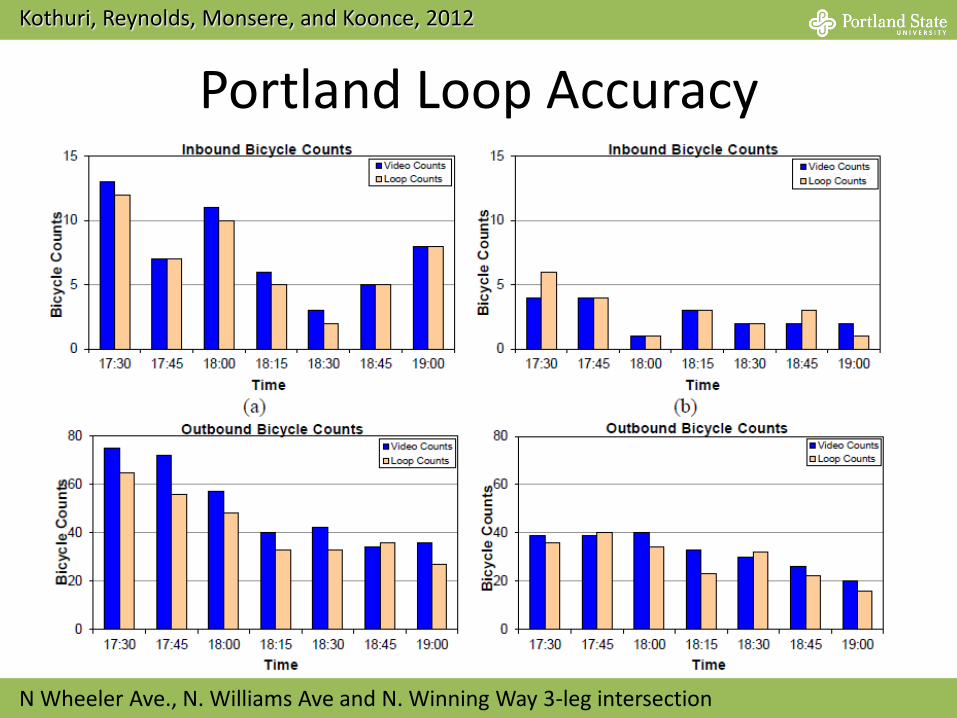
Portland Loop Accuracy
Kothuri, Reynolds, Monsere, and Koonce, 2012
N Wheeler Ave., N. Williams Ave and N. Winning Way 3-leg intersection
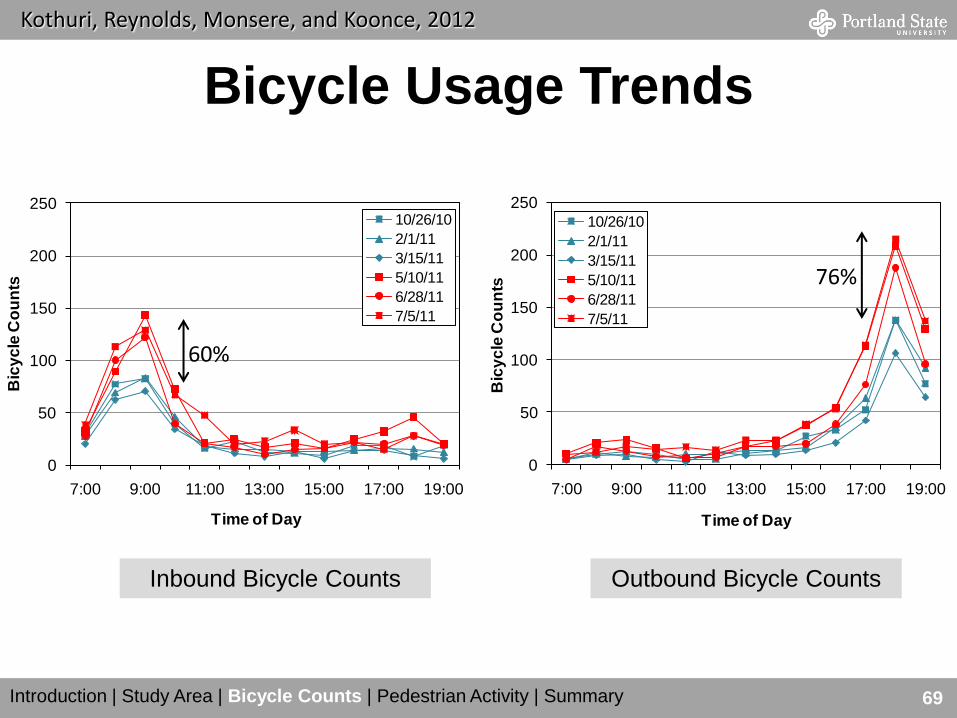
Bicycle Usage Trends
69
0
50
100
150
200
250
7:00 9:00 11:00 13:00 15:00 17:00 19:00
Bic
yc
le C
ou
nts
Time of Day
10/26/10
2/1/11
3/15/11
5/10/11
6/28/11
7/5/11
0
50
100
150
200
250
7:00 9:00 11:00 13:00 15:00 17:00 19:00B
icy
cle
Co
un
ts
Time of Day
10/26/10
2/1/11
3/15/11
5/10/11
6/28/11
7/5/11
60%
76%
Inbound Bicycle Counts Outbound Bicycle Counts
Introduction | Study Area | Bicycle Counts | Pedestrian Activity | Summary
Kothuri, Reynolds, Monsere, and Koonce, 2012
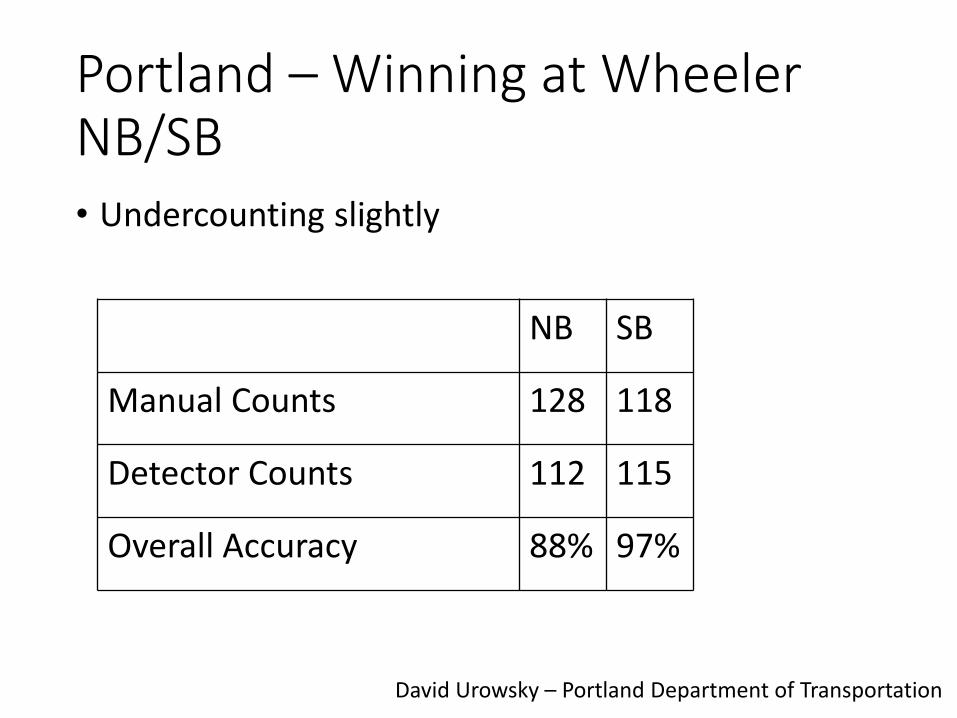
Portland – Winning at Wheeler NB/SB • Undercounting slightly
NB SB
Manual Counts 128 118
Detector Counts 112 115
Overall Accuracy 88% 97%
David Urowsky – Portland Department of Transportation
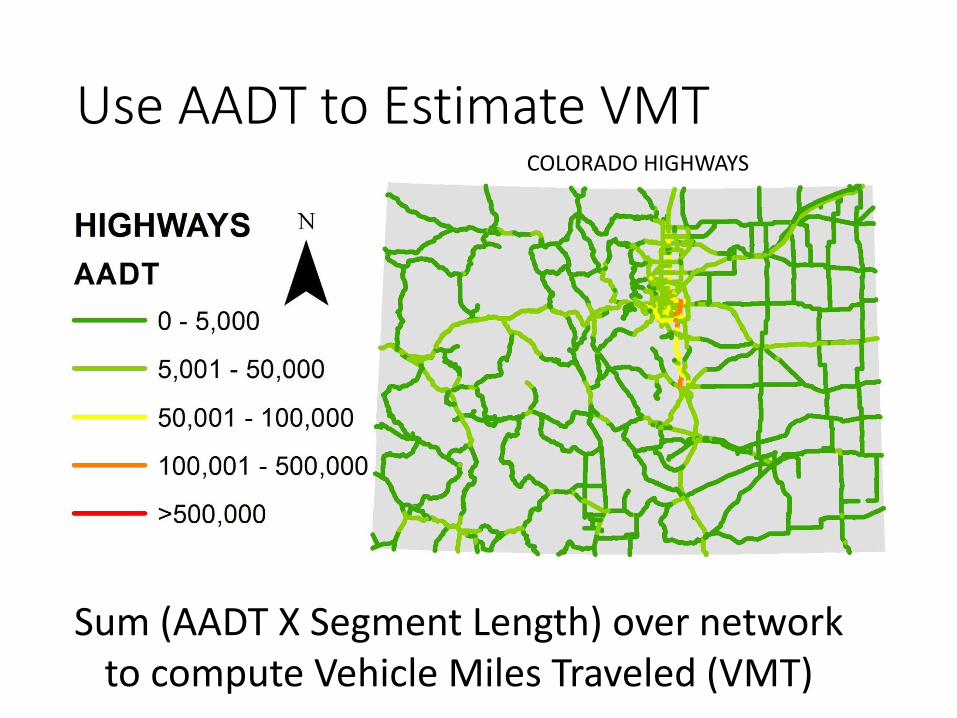
Use AADT to Estimate VMT
Sum (AADT X Segment Length) over network to compute Vehicle Miles Traveled (VMT)
COLORADO HIGHWAYS
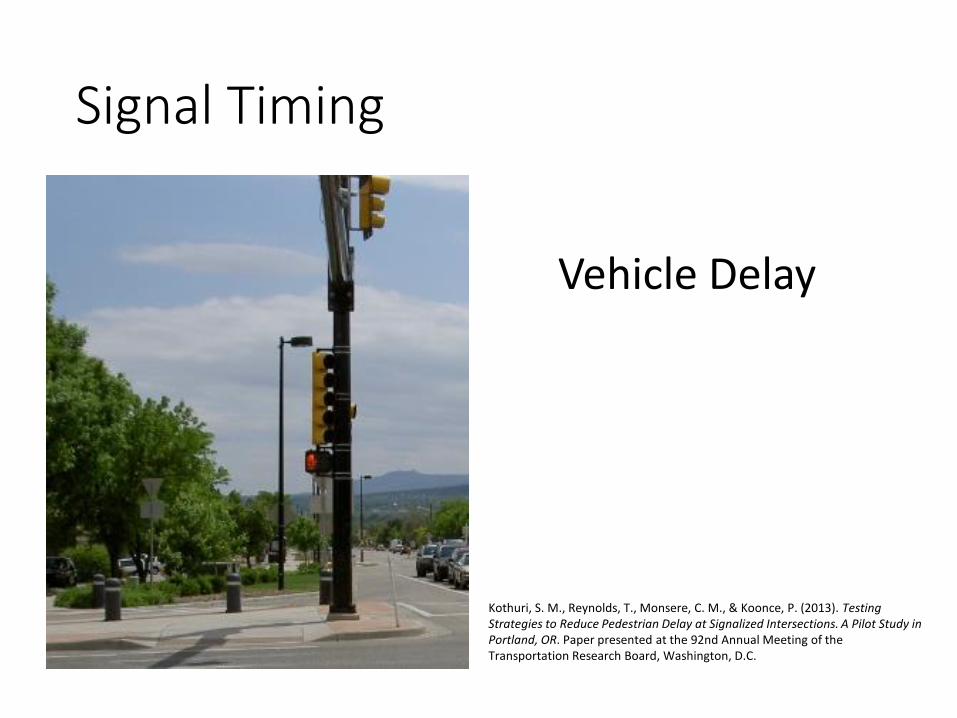
Signal Timing
Vehicle Delay
Kothuri, S. M., Reynolds, T., Monsere, C. M., & Koonce, P. (2013). Testing Strategies to Reduce Pedestrian Delay at Signalized Intersections. A Pilot Study in Portland, OR. Paper presented at the 92nd Annual Meeting of the Transportation Research Board, Washington, D.C.
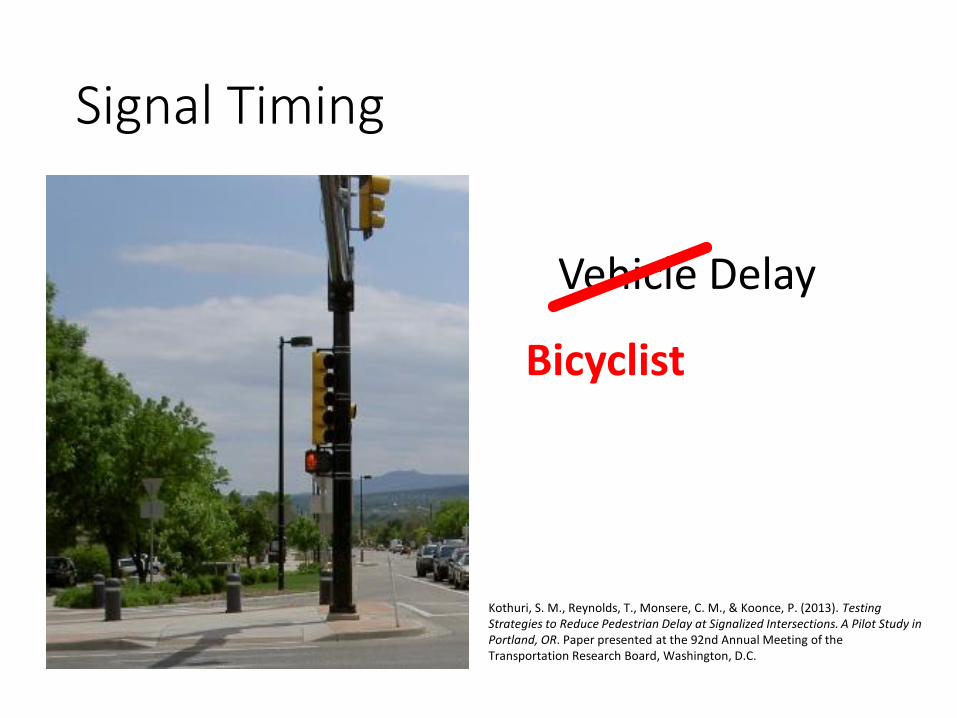
Signal Timing
Vehicle Delay
Kothuri, S. M., Reynolds, T., Monsere, C. M., & Koonce, P. (2013). Testing Strategies to Reduce Pedestrian Delay at Signalized Intersections. A Pilot Study in Portland, OR. Paper presented at the 92nd Annual Meeting of the Transportation Research Board, Washington, D.C.
Bicyclist
Results
• Overcounting (% Bikes Counted= 126%)
• If extra counts occur, a bicyclist is more frequently counted twice compared to three or five times
• Counting affected detection presence.
79.2%
74.4%
Christine Kendrick and Peter Koonce, City of Portland
76
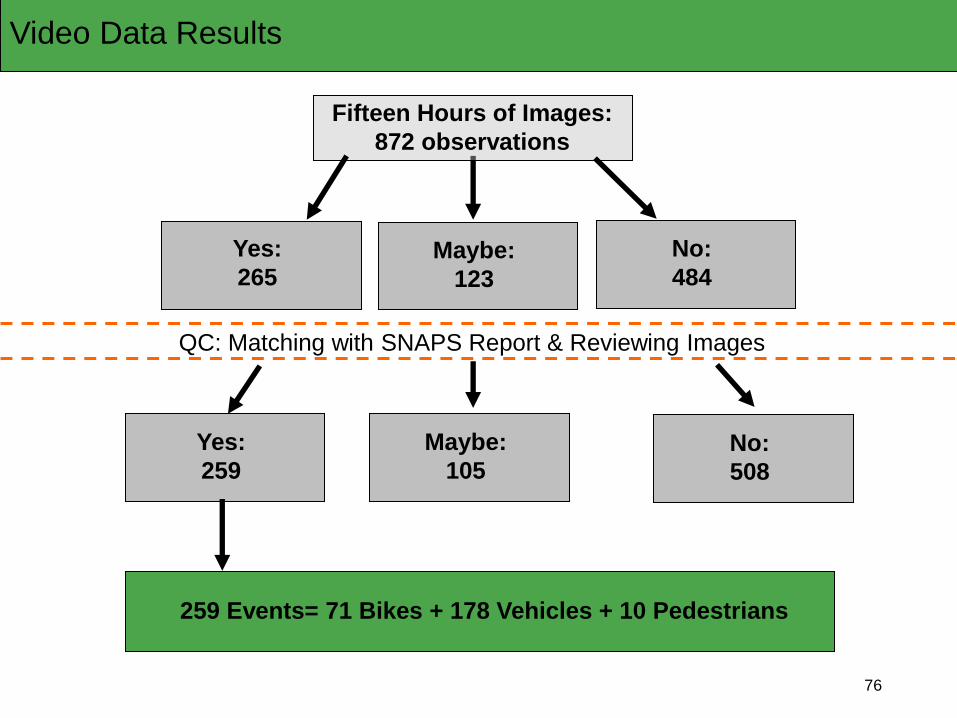
Fifteen Hours of Images:
872 observations
No:
484 Maybe:
123
Yes:
265
Video Data Results
No:
508
Maybe:
105
Yes:
259
QC: Matching with SNAPS Report & Reviewing Images
259 Events= 71 Bikes + 178 Vehicles + 10 Pedestrians
77
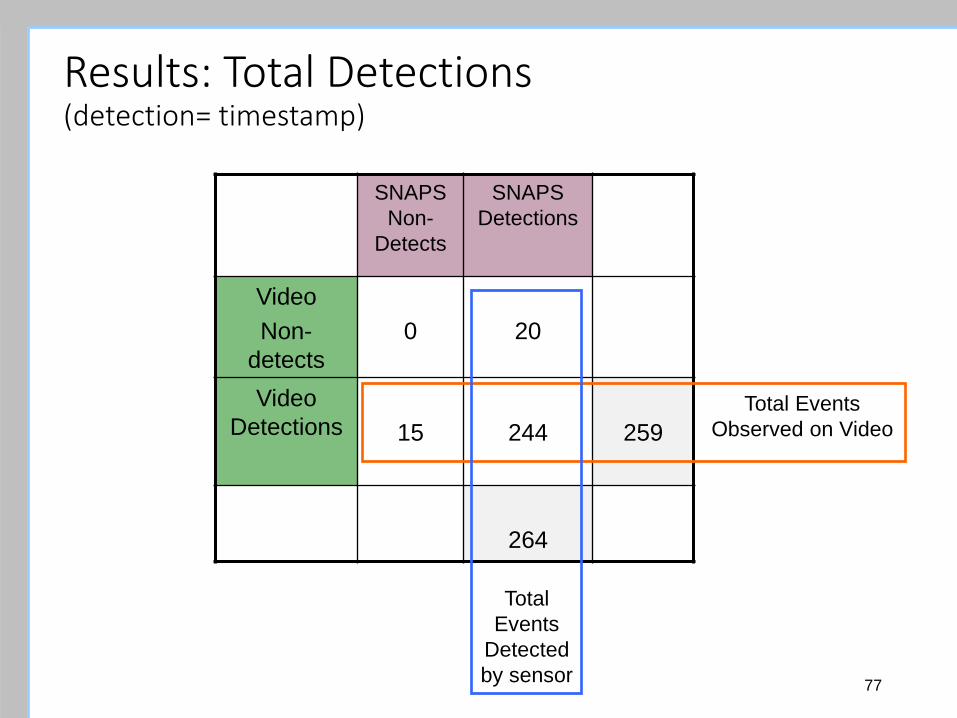
Results: Total Detections (detection= timestamp)
SNAPS
Non-
Detects
SNAPS
Detections
Video
Non-
detects
0
20
Video
Detections
15
244
259
264
Total Events
Observed on Video
Total
Events
Detected
by sensor
78
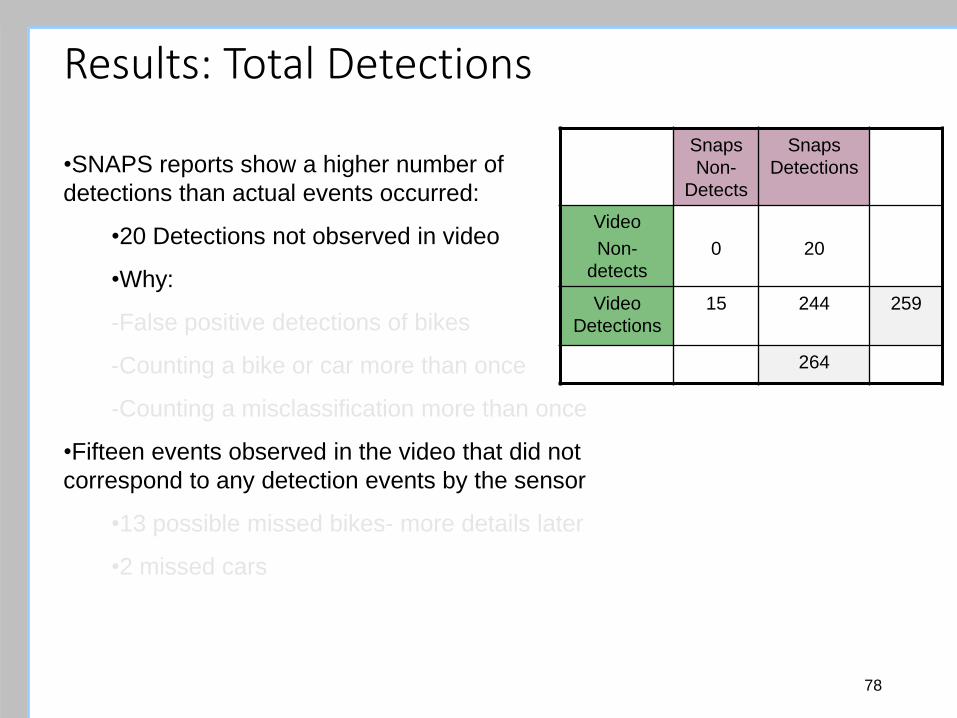
Results: Total Detections
Snaps
Non-
Detects
Snaps
Detections
Video
Non-
detects
0
20
Video
Detections
15 244
259
264
•SNAPS reports show a higher number of
detections than actual events occurred:
•20 Detections not observed in video
•Why:
-False positive detections of bikes
-Counting a bike or car more than once
-Counting a misclassification more than once
•Fifteen events observed in the video that did not
correspond to any detection events by the sensor
•13 possible missed bikes- more details later
•2 missed cars
79
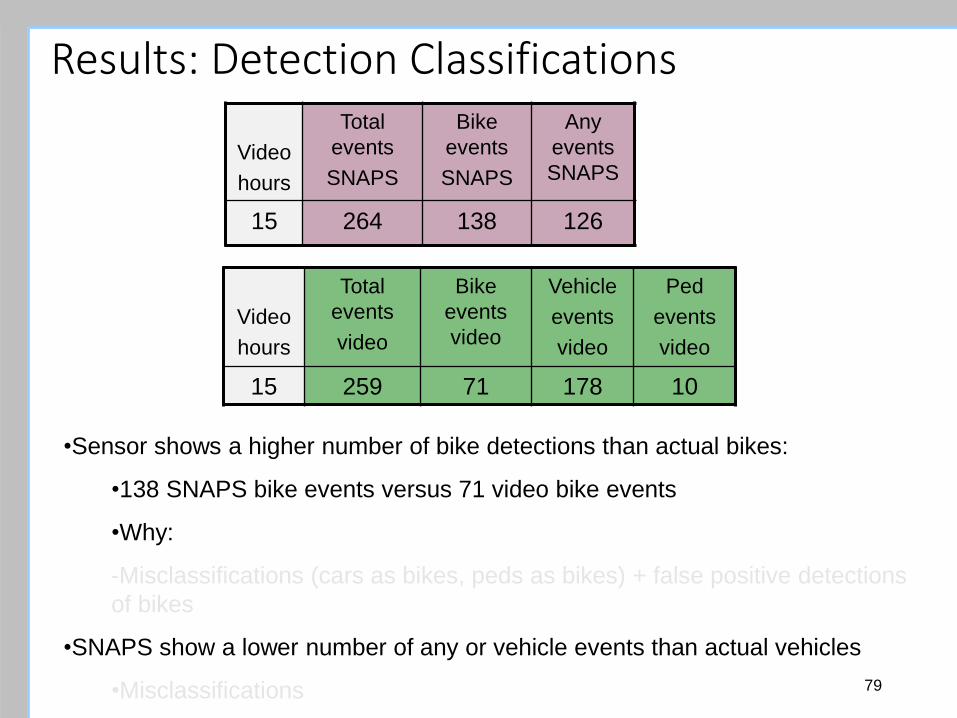
Results: Detection Classifications
Video
hours
Total
events
SNAPS
Bike
events
SNAPS
Any
events
SNAPS
15 264 138 126
Video
hours
Total
events
video
Bike
events
video
Vehicle
events
video
Ped
events
video
15 259 71 178 10
•Sensor shows a higher number of bike detections than actual bikes:
•138 SNAPS bike events versus 71 video bike events
•Why:
-Misclassifications (cars as bikes, peds as bikes) + false positive detections
of bikes
•SNAPS show a lower number of any or vehicle events than actual vehicles
•Misclassifications
80
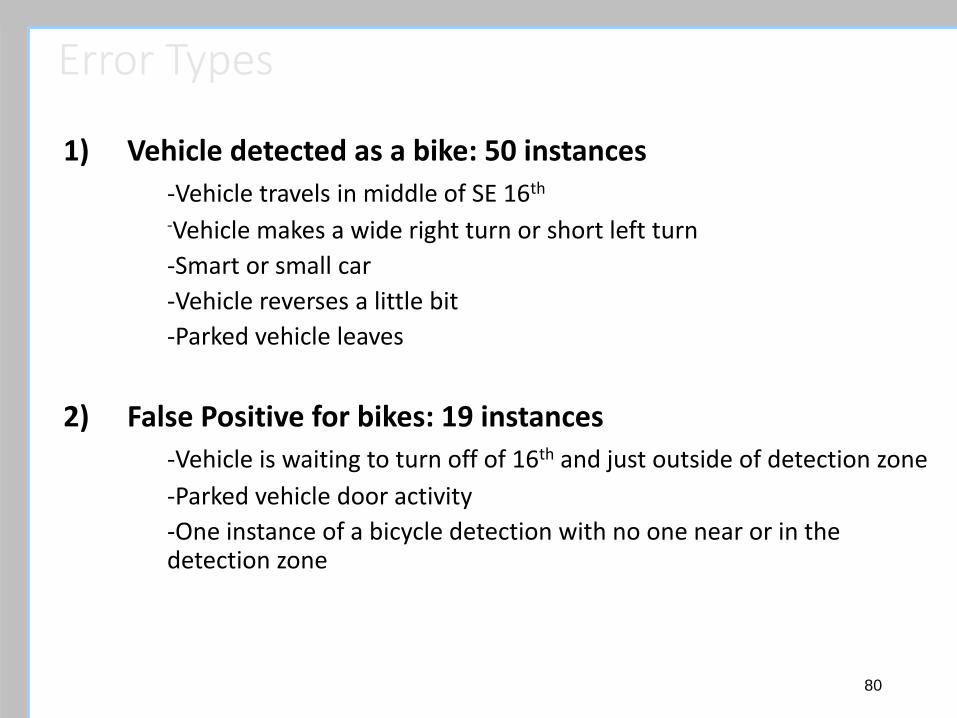
Error Types
1) Vehicle detected as a bike: 50 instances
-Vehicle travels in middle of SE 16th
-Vehicle makes a wide right turn or short left turn
-Smart or small car
-Vehicle reverses a little bit
-Parked vehicle leaves
2) False Positive for bikes: 19 instances
-Vehicle is waiting to turn off of 16th and just outside of detection zone
-Parked vehicle door activity
-One instance of a bicycle detection with no one near or in the detection zone
81
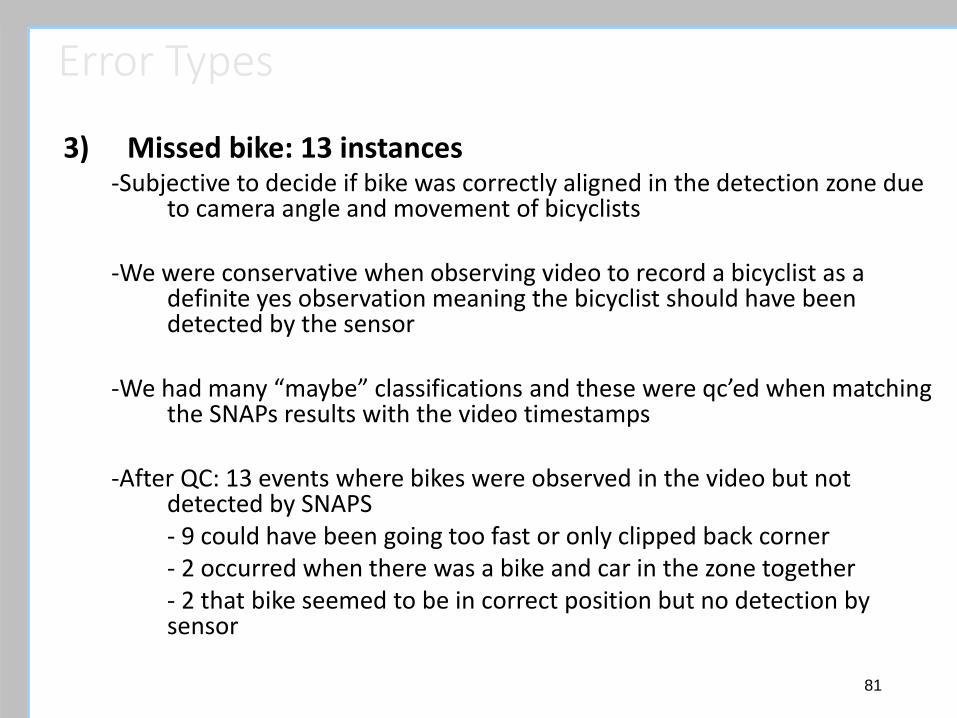
Error Types
3) Missed bike: 13 instances -Subjective to decide if bike was correctly aligned in the detection zone due
to camera angle and movement of bicyclists -We were conservative when observing video to record a bicyclist as a
definite yes observation meaning the bicyclist should have been detected by the sensor
-We had many “maybe” classifications and these were qc’ed when matching
the SNAPs results with the video timestamps -After QC: 13 events where bikes were observed in the video but not
detected by SNAPS - 9 could have been going too fast or only clipped back corner - 2 occurred when there was a bike and car in the zone together - 2 that bike seemed to be in correct position but no detection by
sensor
82
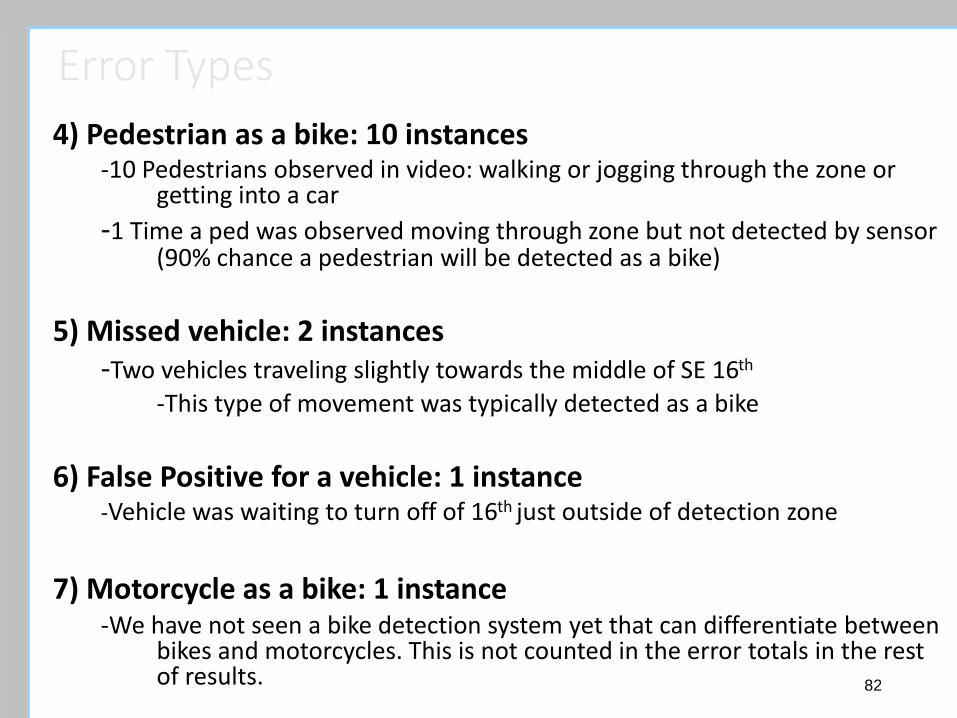
Error Types
4) Pedestrian as a bike: 10 instances -10 Pedestrians observed in video: walking or jogging through the zone or
getting into a car
-1 Time a ped was observed moving through zone but not detected by sensor (90% chance a pedestrian will be detected as a bike)
5) Missed vehicle: 2 instances -Two vehicles traveling slightly towards the middle of SE 16th
-This type of movement was typically detected as a bike
6) False Positive for a vehicle: 1 instance -Vehicle was waiting to turn off of 16th just outside of detection zone
7) Motorcycle as a bike: 1 instance -We have not seen a bike detection system yet that can differentiate between
bikes and motorcycles. This is not counted in the error totals in the rest of results.
83
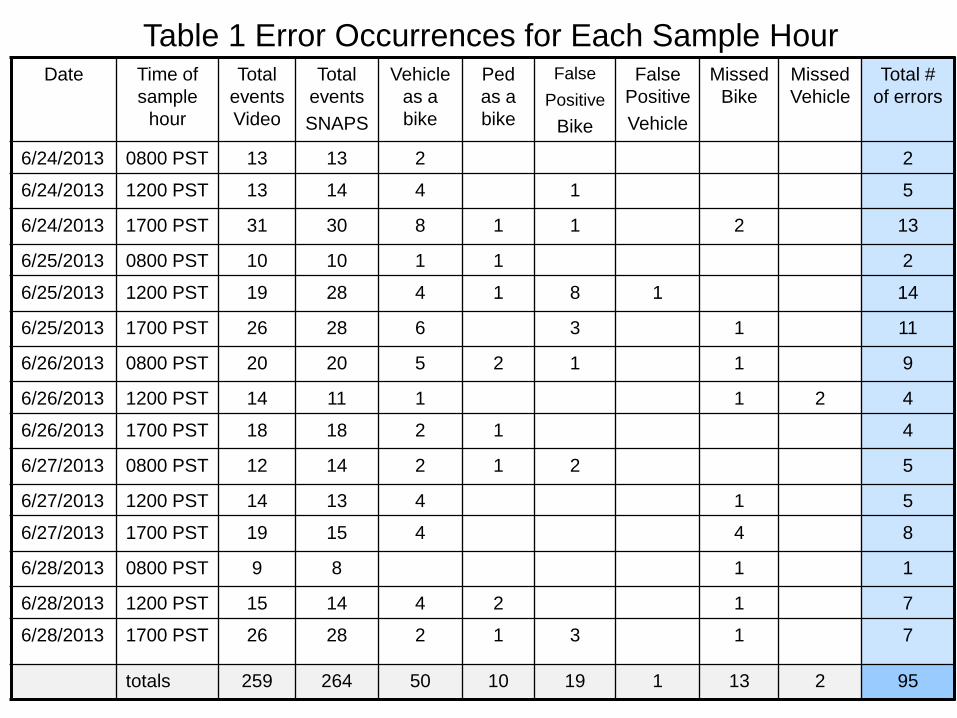
Date Time of
sample
hour
Total
events
Video
Total
events
SNAPS
Vehicle
as a
bike
Ped
as a
bike
False
Positive
Bike
False
Positive
Vehicle
Missed
Bike
Missed
Vehicle
Total #
of errors
6/24/2013 0800 PST 13 13 2 2
6/24/2013 1200 PST 13 14 4 1 5
6/24/2013 1700 PST 31 30 8 1 1 2 13
6/25/2013 0800 PST 10 10 1 1 2
6/25/2013 1200 PST 19 28 4 1 8 1 14
6/25/2013 1700 PST 26 28 6 3 1 11
6/26/2013 0800 PST 20 20 5 2 1 1 9
6/26/2013 1200 PST 14 11 1 1 2 4
6/26/2013 1700 PST 18 18 2 1 4
6/27/2013 0800 PST 12 14 2 1 2 5
6/27/2013 1200 PST 14 13 4 1 5
6/27/2013 1700 PST 19 15 4 4 8
6/28/2013 0800 PST 9 8 1 1
6/28/2013 1200 PST 15 14 4 2 1 7
6/28/2013 1700 PST 26 28 2 1 3 1 7
totals 259 264 50 10 19 1 13 2 95
Table 1 Error Occurrences for Each Sample Hour
84
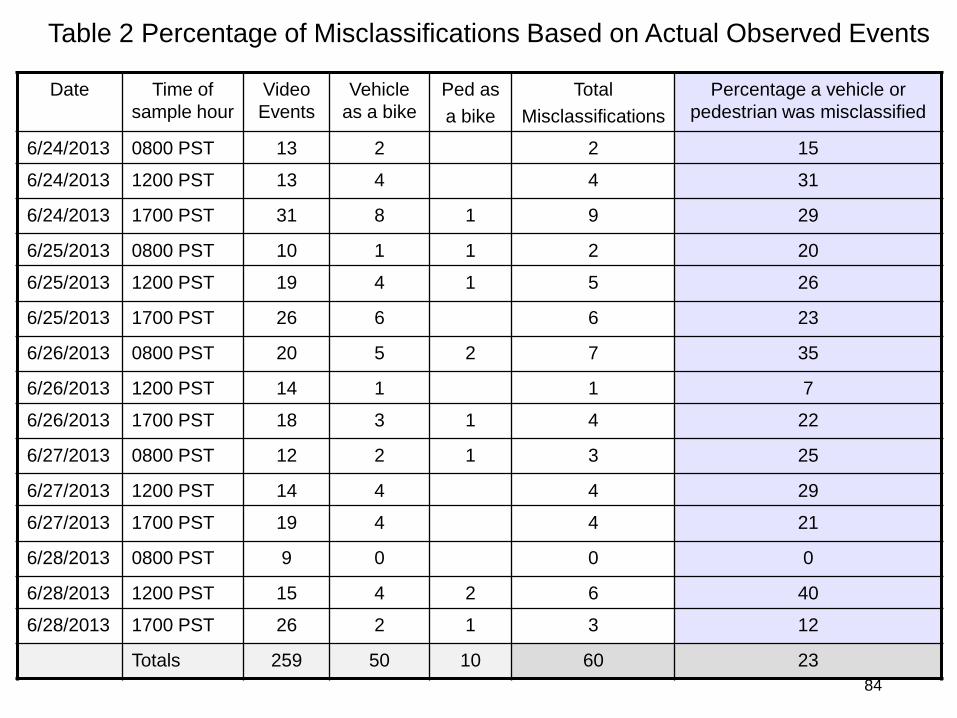
Date Time of
sample hour
Video
Events
Vehicle
as a bike
Ped as
a bike
Total
Misclassifications
Percentage a vehicle or
pedestrian was misclassified
6/24/2013 0800 PST 13 2 2 15
6/24/2013 1200 PST 13 4 4 31
6/24/2013 1700 PST 31 8 1 9 29
6/25/2013 0800 PST 10 1 1 2 20
6/25/2013 1200 PST 19 4 1 5 26
6/25/2013 1700 PST 26 6 6 23
6/26/2013 0800 PST 20 5 2 7 35
6/26/2013 1200 PST 14 1 1 7
6/26/2013 1700 PST 18 3 1 4 22
6/27/2013 0800 PST 12 2 1 3 25
6/27/2013 1200 PST 14 4 4 29
6/27/2013 1700 PST 19 4 4 21
6/28/2013 0800 PST 9 0 0 0
6/28/2013 1200 PST 15 4 2 6 40
6/28/2013 1700 PST 26 2 1 3 12
Totals 259 50 10 60 23
Table 2 Percentage of Misclassifications Based on Actual Observed Events
85
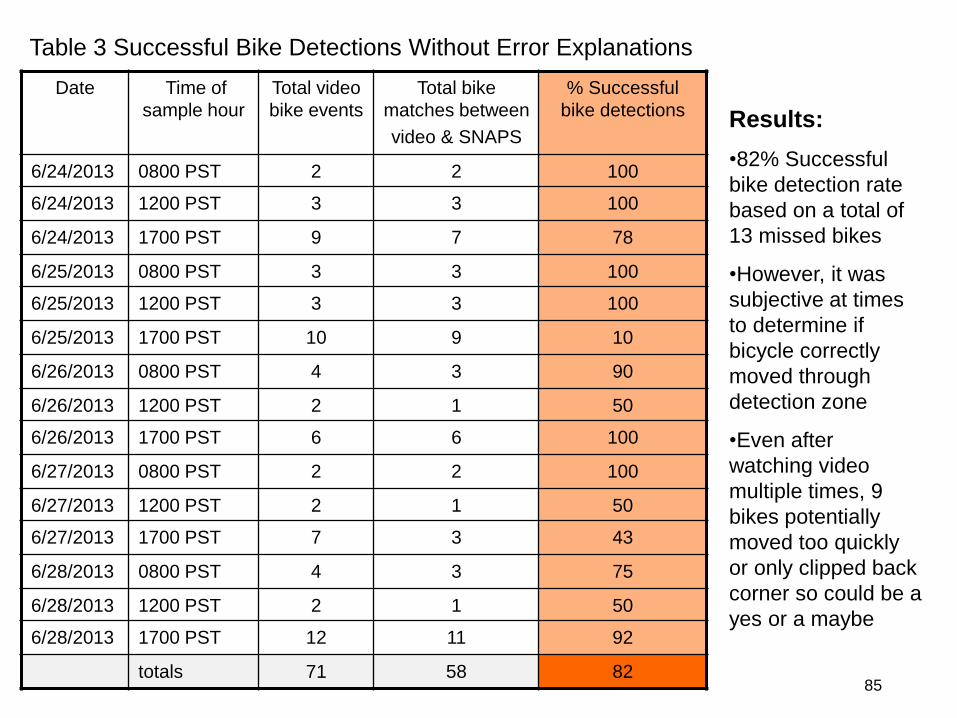
Date Time of
sample hour
Total video
bike events
Total bike
matches between
video & SNAPS
% Successful
bike detections
6/24/2013 0800 PST 2 2 100
6/24/2013 1200 PST 3 3 100
6/24/2013 1700 PST 9 7 78
6/25/2013 0800 PST 3 3 100
6/25/2013 1200 PST 3 3 100
6/25/2013 1700 PST 10 9 10
6/26/2013 0800 PST 4 3 90
6/26/2013 1200 PST 2 1 50
6/26/2013 1700 PST 6 6 100
6/27/2013 0800 PST 2 2 100
6/27/2013 1200 PST 2 1 50
6/27/2013 1700 PST 7 3 43
6/28/2013 0800 PST 4 3 75
6/28/2013 1200 PST 2 1 50
6/28/2013 1700 PST 12 11 92
totals 71 58 82
Table 3 Successful Bike Detections Without Error Explanations
Results:
•82% Successful
bike detection rate
based on a total of
13 missed bikes
•However, it was
subjective at times
to determine if
bicycle correctly
moved through
detection zone
•Even after
watching video
multiple times, 9
bikes potentially
moved too quickly
or only clipped back
corner so could be a
yes or a maybe