Embed Size (px)
Citation preview

USING PIVOT TABLES IN MICROSOFT EXCEL
LOCAL GOVERNMENT CORPORATION
RESOURCE 2015
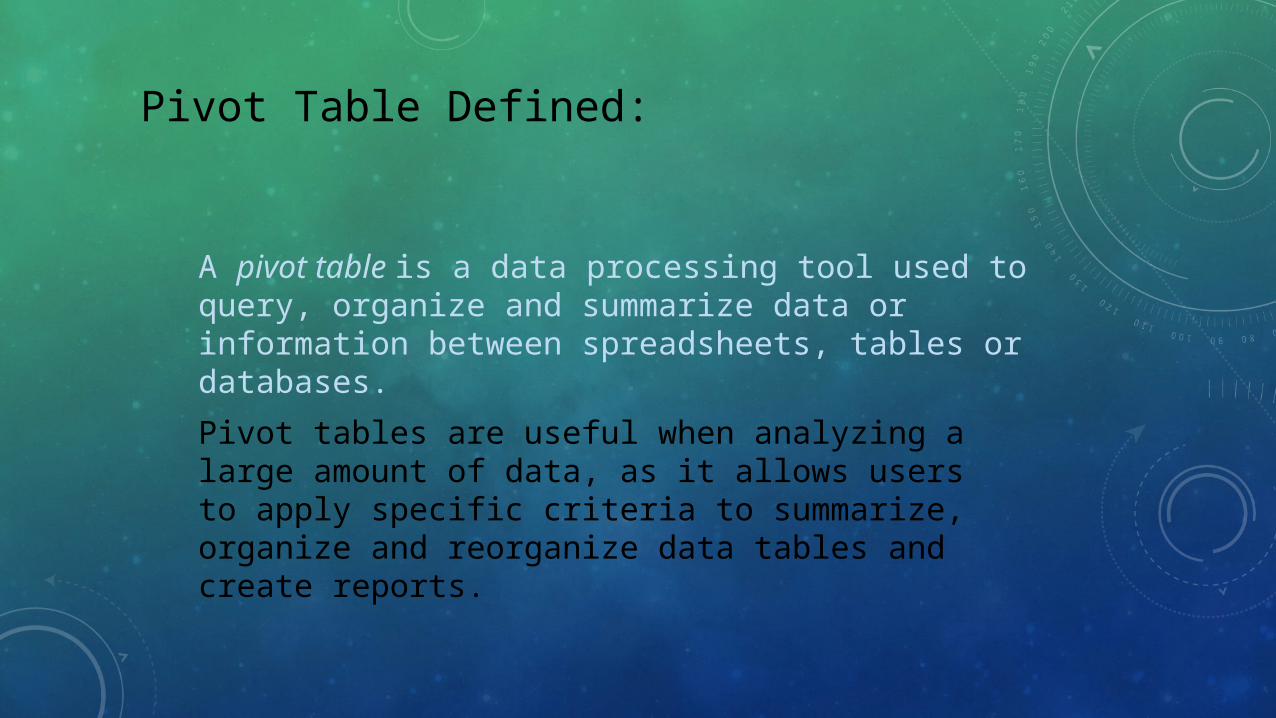
Pivot Table Defined:
A pivot table is a data processing tool used to query, organize and summarize data or information between spreadsheets, tables or databases.
Pivot tables are useful when analyzing a large amount of data, as it allows users to apply specific criteria to summarize, organize and reorganize data tables and create reports.

Effective PivotTables take a large set of data and simplify it
PivotTables are a more expedient way to summarize data than filtering or sorting functions in Excel, especially when the amount of data is large

When might PivotTables be useful in local government?
How many of <Certain Transaction> did <Entity> <Quantity> during <Time Period> ?
• Advanced Account Analysis• Transactional research for time or price trends• Historical payment or receipt patterns• Any scenario where vendor, date or price
variance or pattern analysis is needed for a large amount of raw data
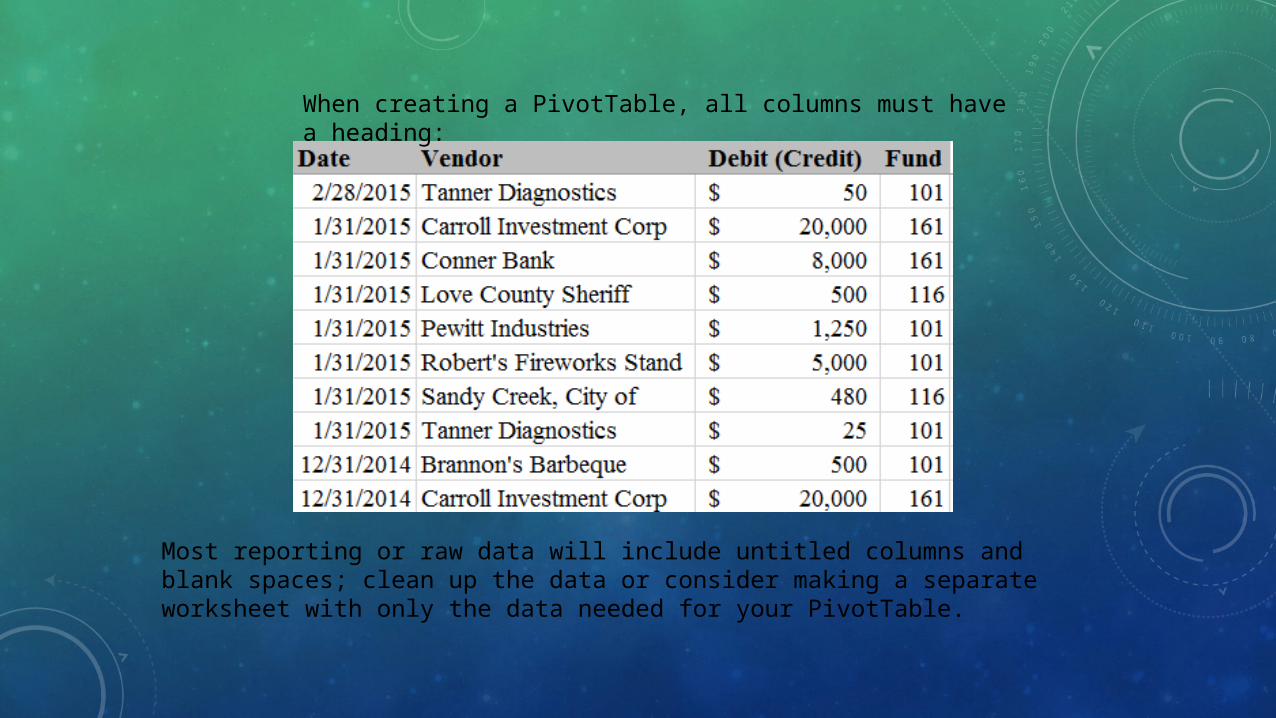
When creating a PivotTable, all columns must have a heading:
Most reporting or raw data will include untitled columns and blank spaces; clean up the data or consider making a separate worksheet with only the data needed for your PivotTable.
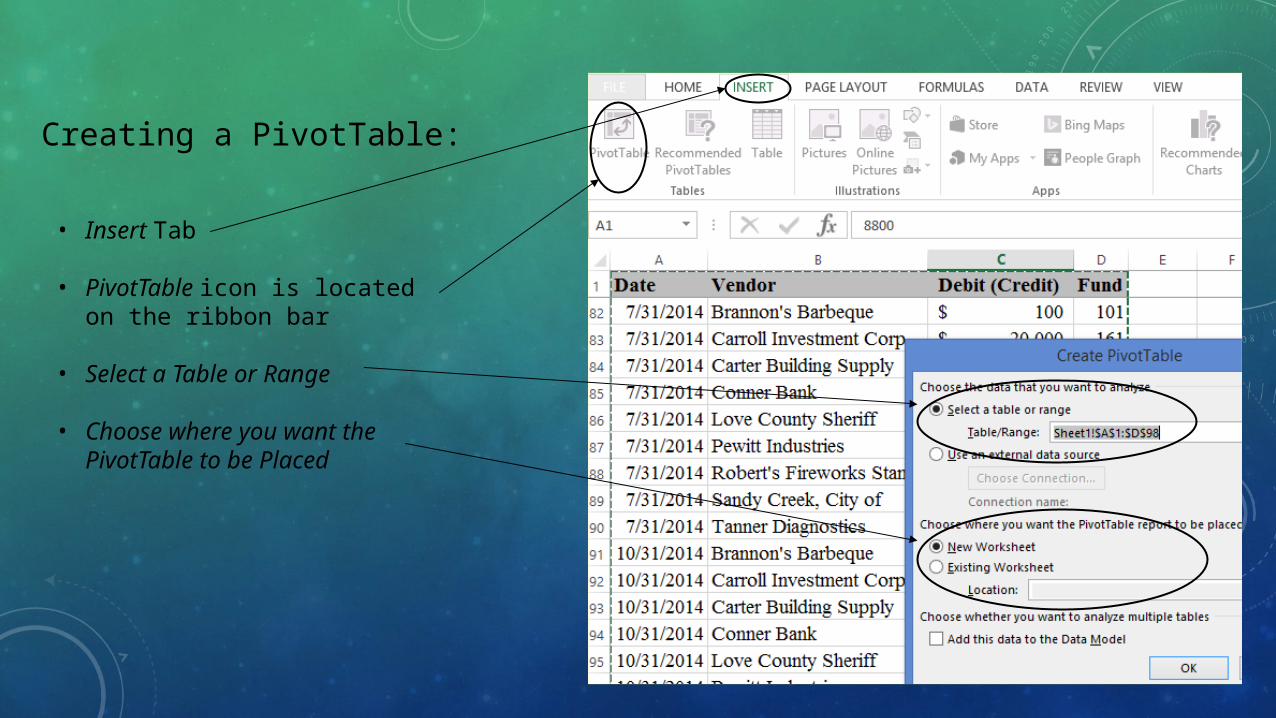
Creating a PivotTable:
• Insert Tab
• PivotTable icon is located on the ribbon bar
• Select a Table or Range
• Choose where you want the PivotTable to be Placed
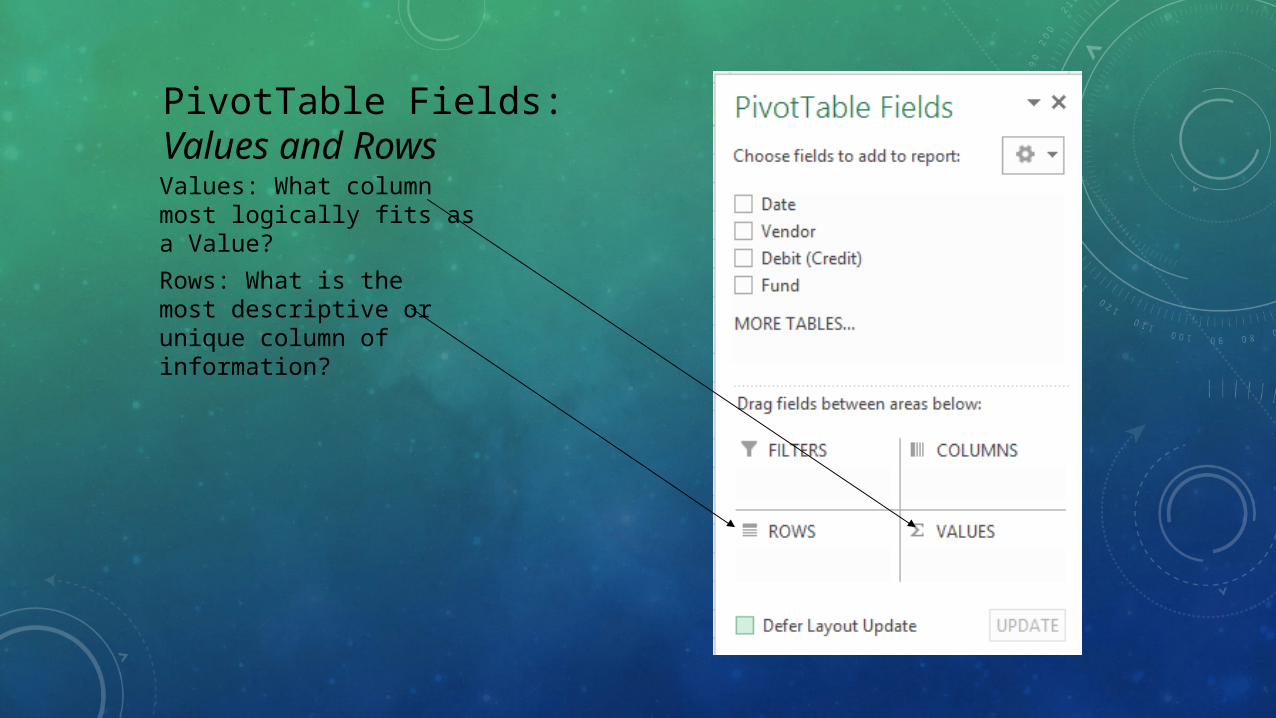
PivotTable Fields: Values and RowsValues: What column most logically fits as a Value?
Rows: What is the most descriptive or unique column of information?
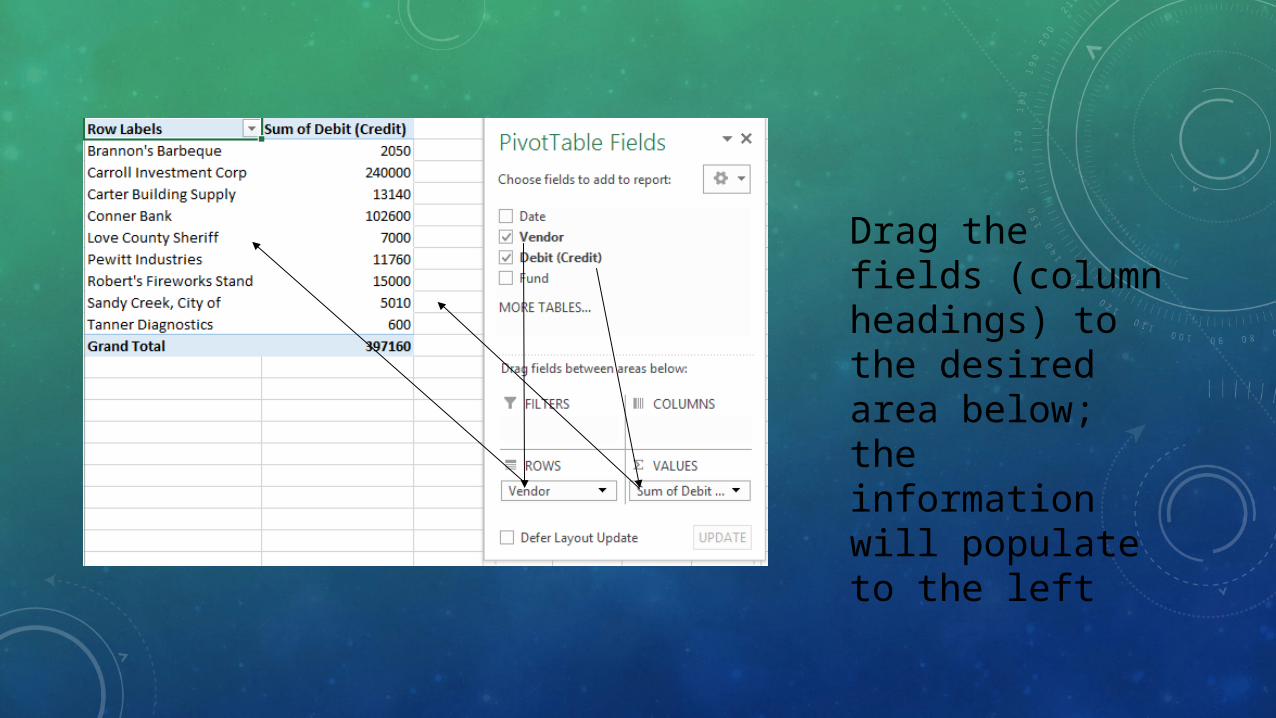
Drag the fields (column headings) to the desired area below; the information will populate to the left
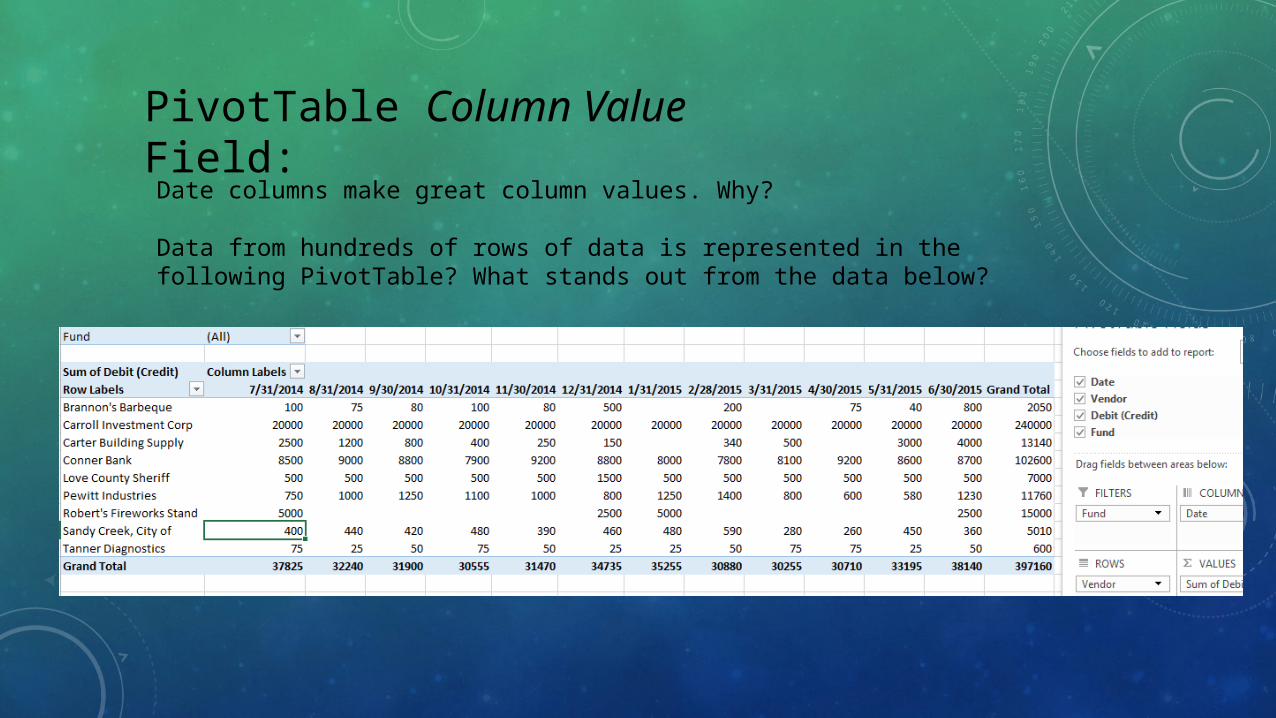
PivotTable Column Value Field:Date columns make great column values. Why?
Data from hundreds of rows of data is represented in the following PivotTable? What stands out from the data below?
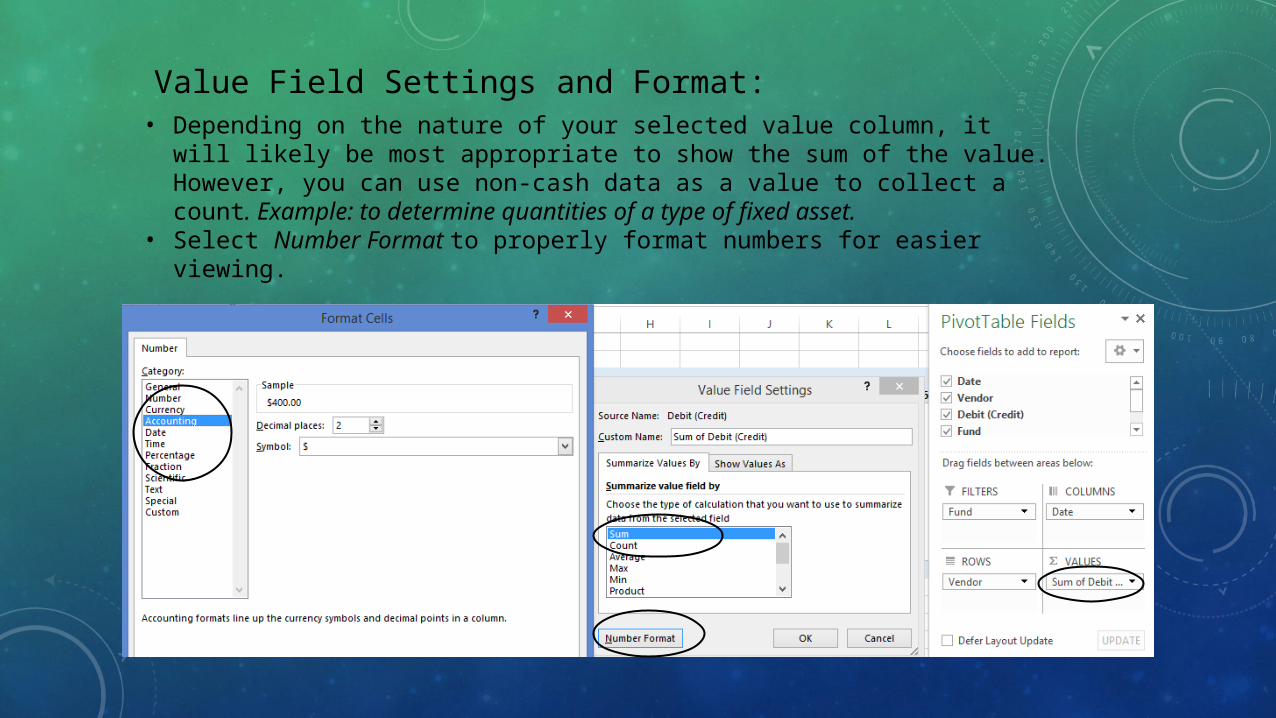
Value Field Settings and Format:• Depending on the nature of your selected value column, it will likely be
most appropriate to show the sum of the value. However, you can use non-cash data as a value to collect a count. Example: to determine quantities of a type of fixed asset.
• Select Number Format to properly format numbers for easier viewing.
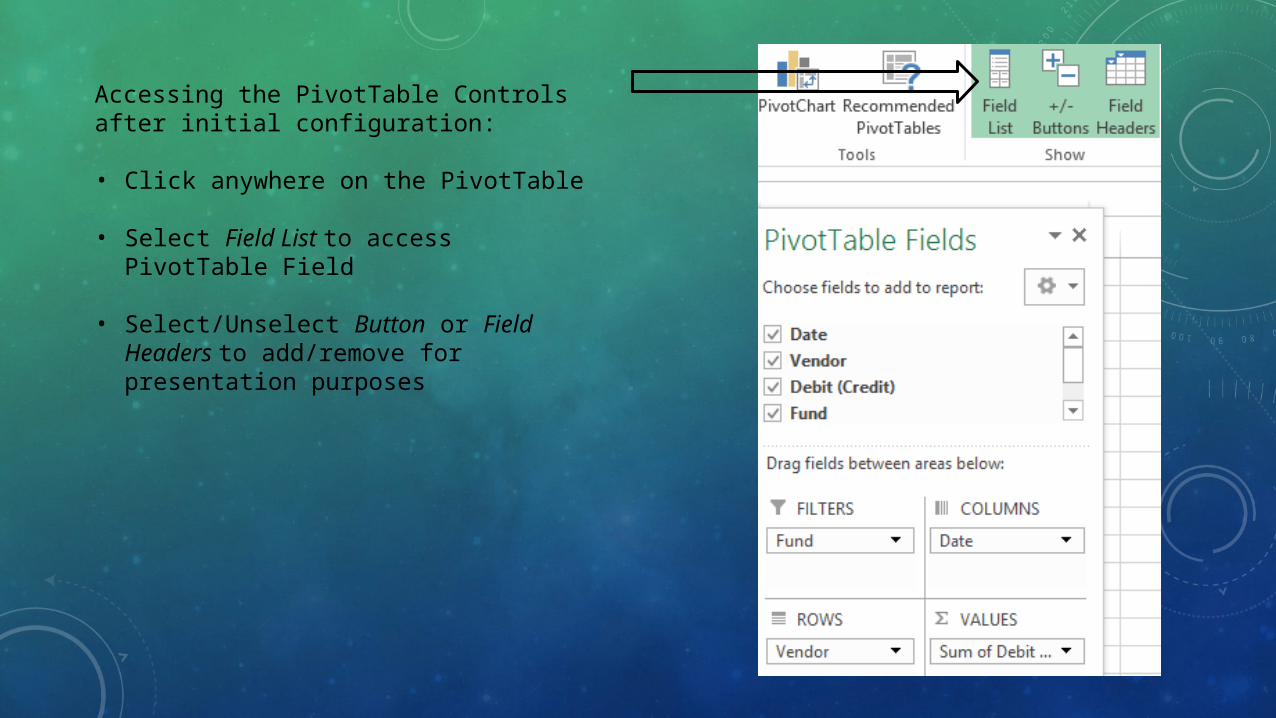
Accessing the PivotTable Controls after initial configuration:
• Click anywhere on the PivotTable
• Select Field List to access PivotTable Field
• Select/Unselect Button or Field Headers to add/remove for presentation purposes
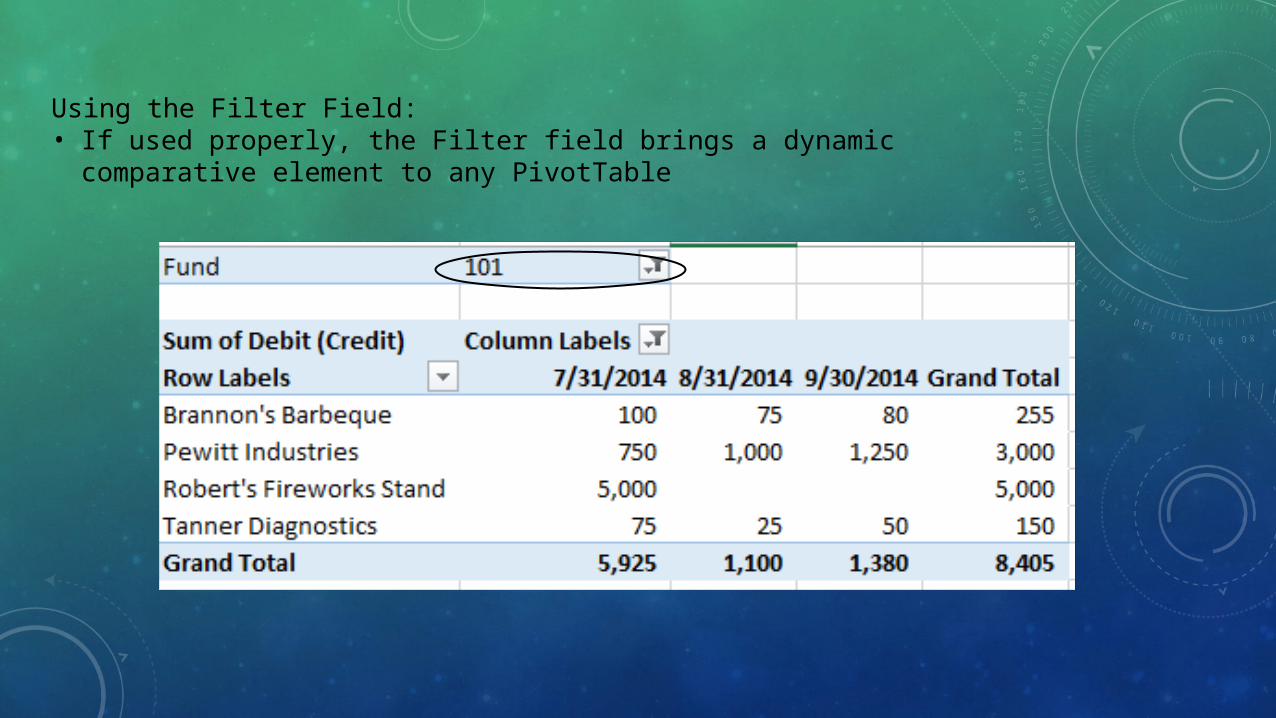
Using the Filter Field:• If used properly, the Filter field brings a dynamic comparative
element to any PivotTable
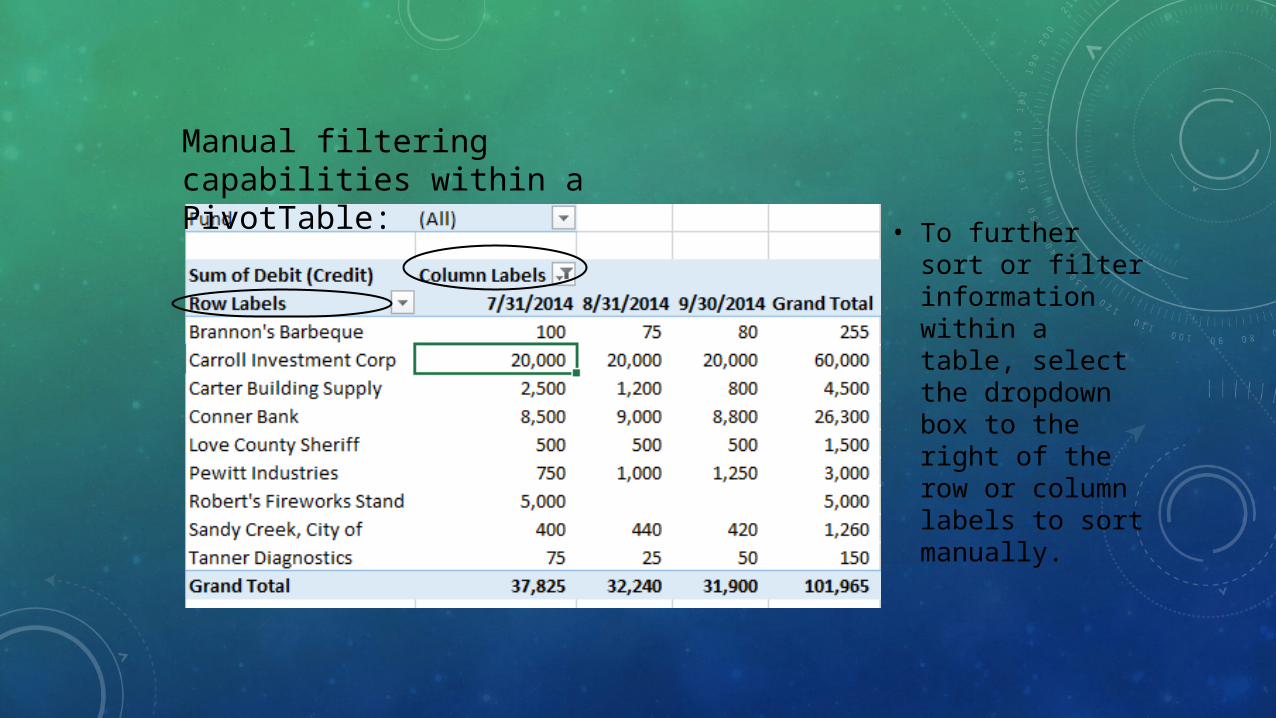
Manual filtering capabilities within a PivotTable:
• To further sort or filter information within a table, select the dropdown box to the right of the row or column labels to sort manually.


![Excel Training Pivot Tables[1]](https://img.pdfslide.us/doc/110x75/55cf8ab355034654898d1682/excel-training-pivot-tables1.jpg)