Embed Size (px)
Citation preview

Microsoft Excel – Pivot Tables
Introduction to Microsoft Excel Pivot tables
Please login to the computers and launch Microsoft Excel.
Rob JonesRoom WG43Education Technology Team Email: [email protected] Tel: 0121 414 4243

Microsoft Excel – Pivot Tables
Today's Session
Overview of pivot tables How to create a simple pivot table How to modify
Basic listingsCombining searches
Hands on walk through Exercise questions
Microsoft Excel – Pivot Tables
What is a pivot table?
Tool within Excel Provides a summary of data Can be used to produce graphs / charts More dynamic than just filters Uses drag and drop principle

Microsoft Excel – Pivot Tables
How are they created?
Create your datasetCould be list of gradesExport from webct
Ensure each column has a unique name Select the area
Microsoft Excel – Pivot Tables
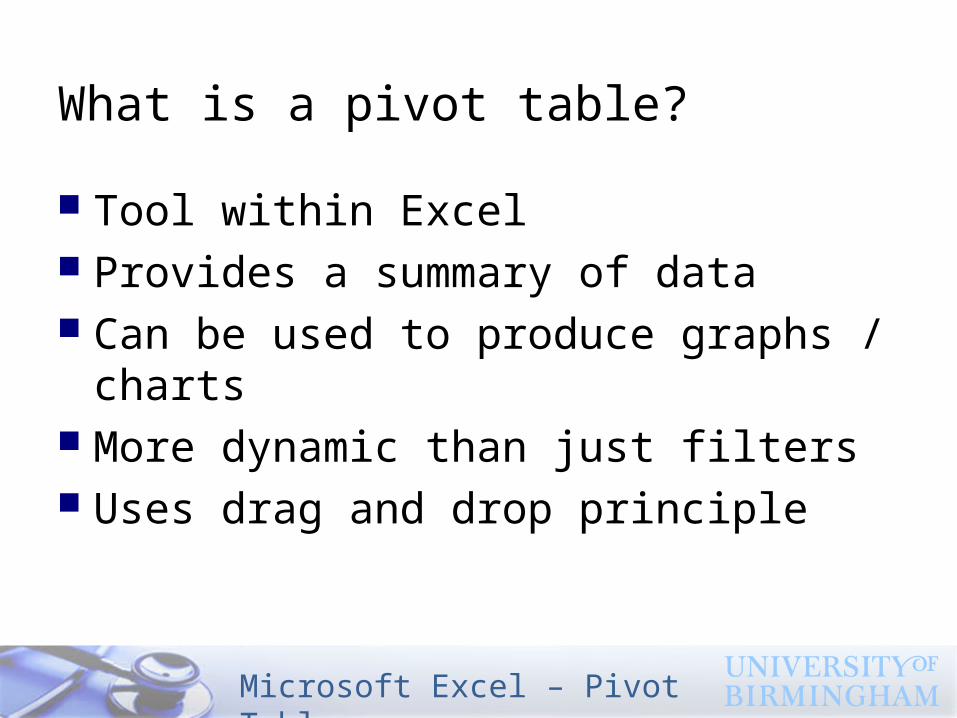
How to create one?
Open workbook > worksheet “Simple dataset” Data menu,
click PivotTable and PivotChart Report

Microsoft Excel – Pivot Tables
Step 1
Microsoft Excel – Pivot Tables
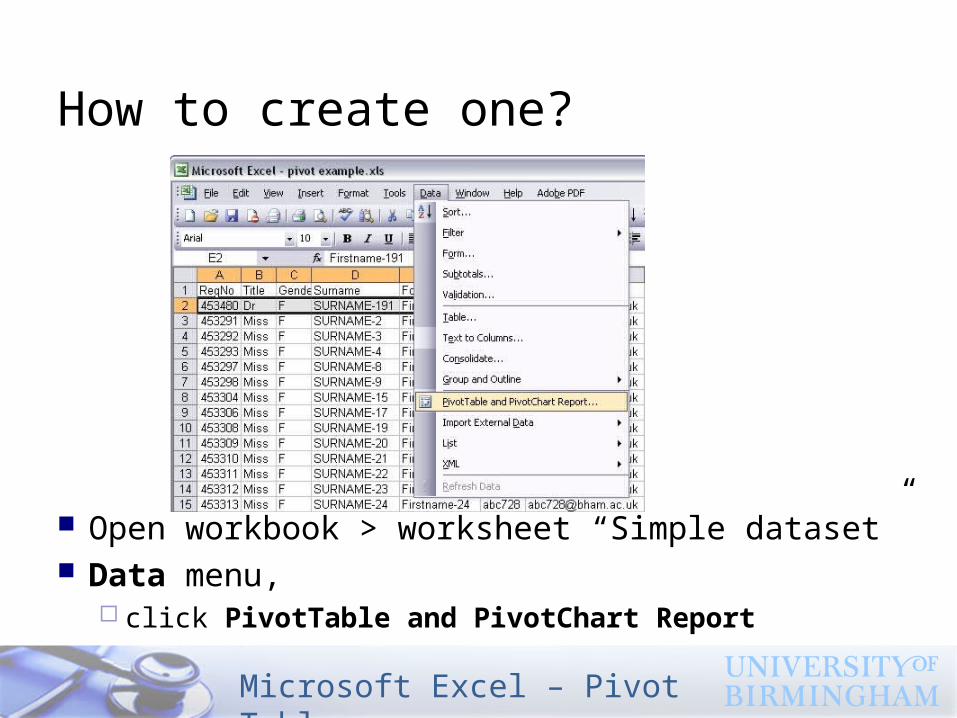
Step 2
Tip – if you select the dataset prior to trying to create the pivot table, the range will show here.
Selected range
Microsoft Excel – Pivot Tables
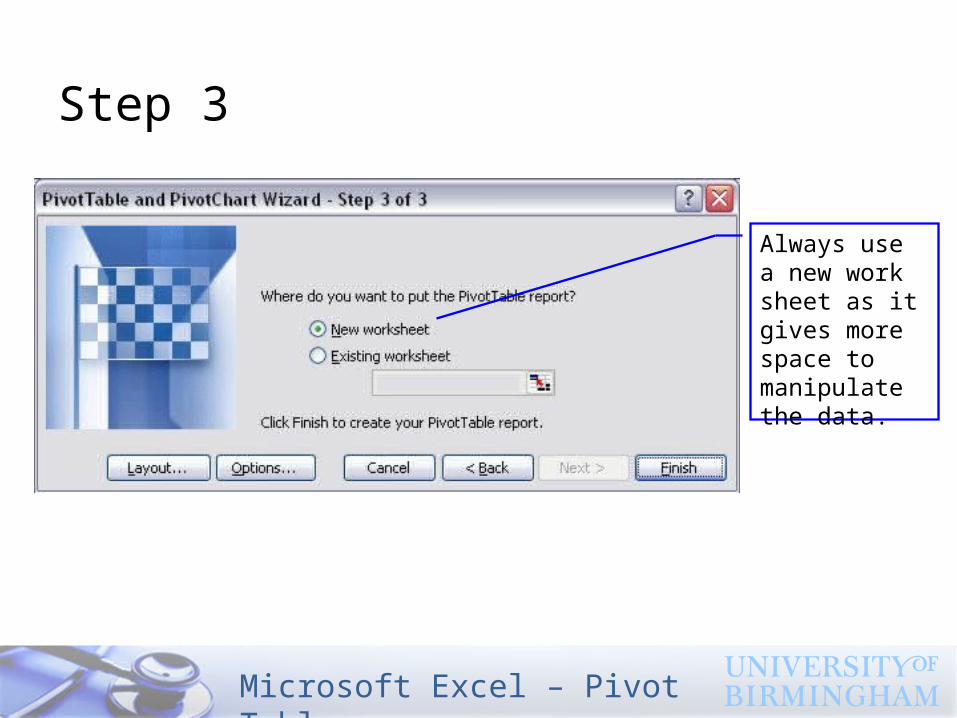
Step 3
Always use a new work sheet as it gives more space to manipulate the data.

Microsoft Excel – Pivot Tables
Pivot Toolbar
Refresh dataChart Wizard
Field List
Microsoft Excel – Pivot Tables
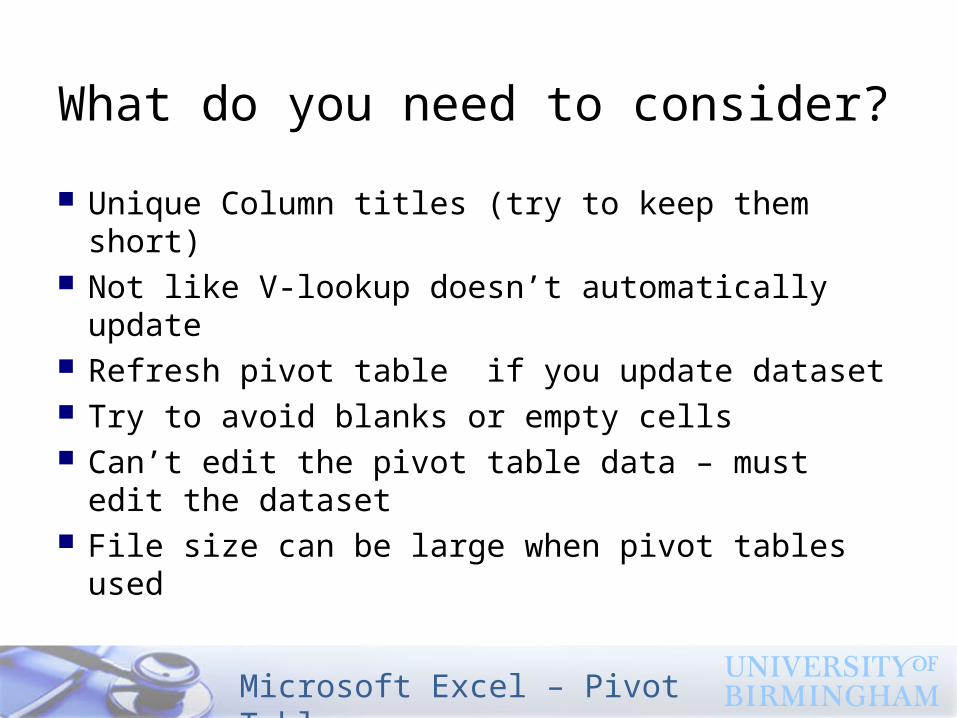
What do you need to consider?
Unique Column titles (try to keep them short) Not like V-lookup doesn’t automatically update Refresh pivot table if you update dataset Try to avoid blanks or empty cells Can’t edit the pivot table data – must edit the
dataset File size can be large when pivot tables used
Microsoft Excel – Pivot Tables
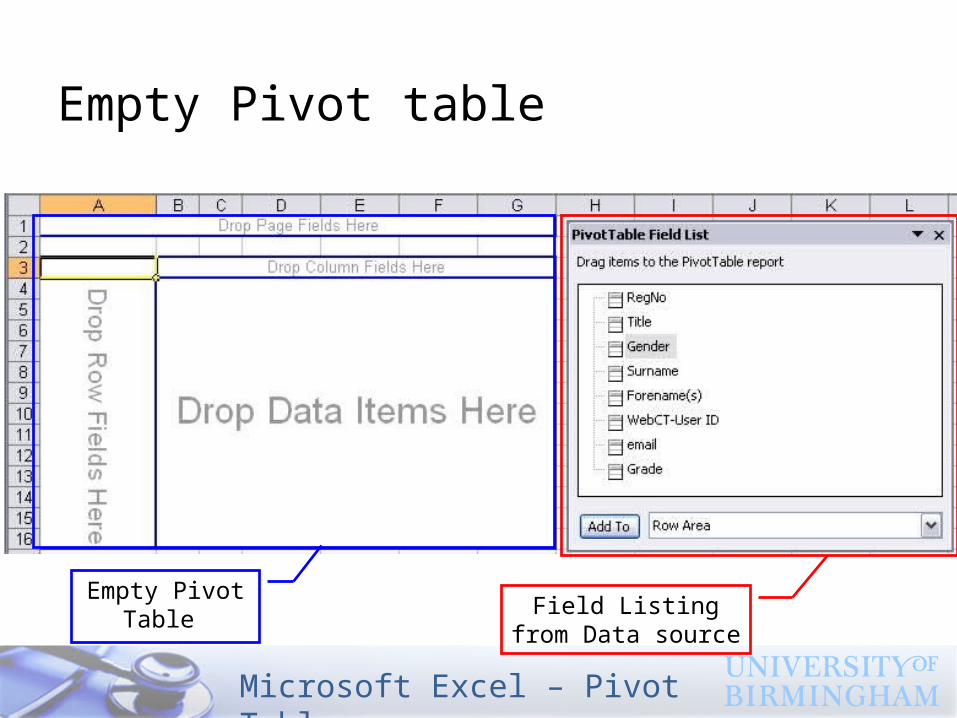
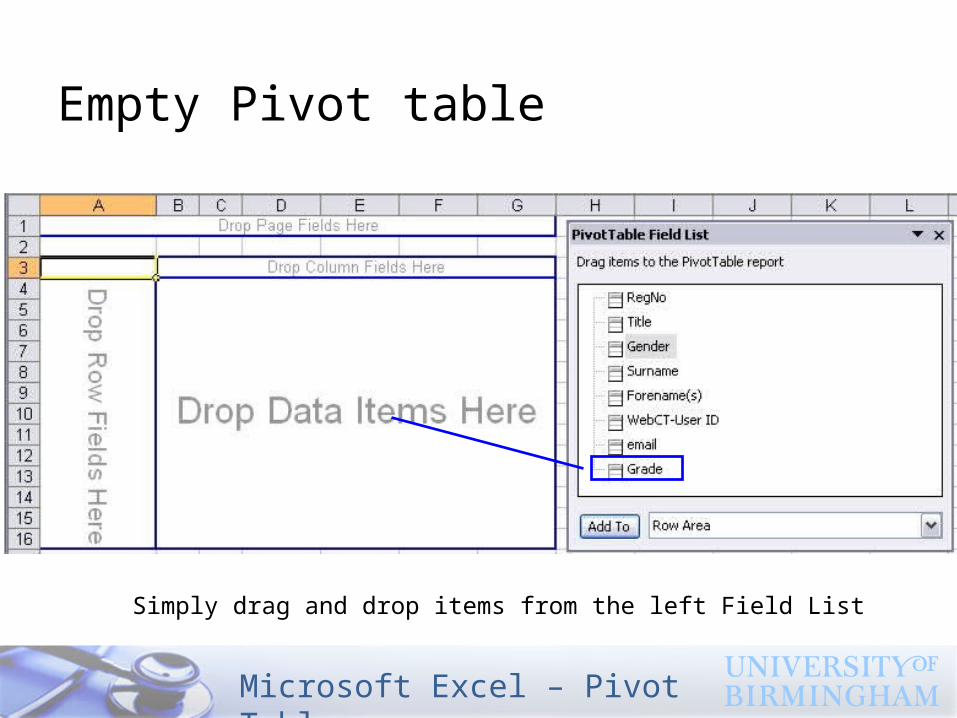
Empty Pivot table
Empty Pivot Table
Field Listing from Data source
Microsoft Excel – Pivot Tables
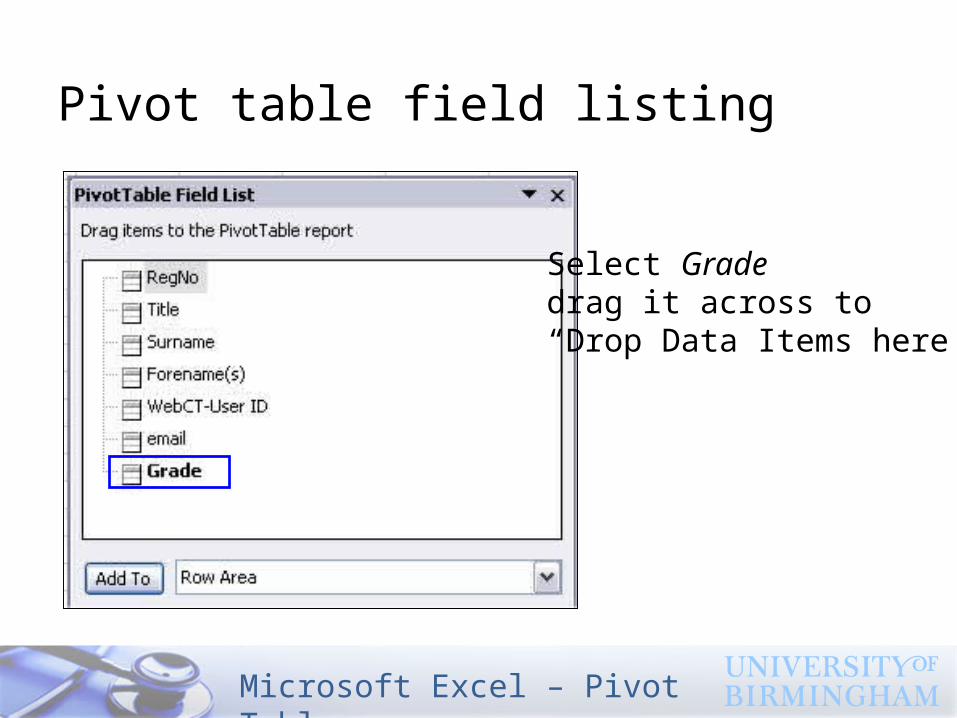
Pivot table field listing
Select Grade drag it across to “Drop Data Items here”
Microsoft Excel – Pivot Tables
Empty Pivot table
Simply drag and drop items from the left Field List
Microsoft Excel – Pivot Tables
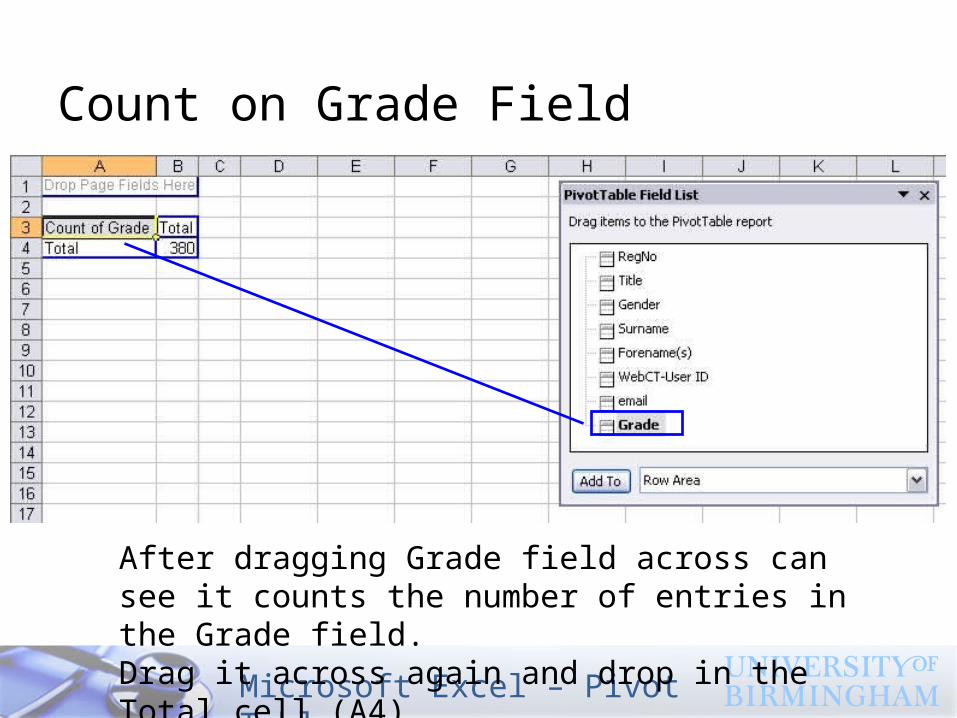
Count on Grade Field
After dragging Grade field across can see it counts the number of entries in the Grade field. Drag it across again and drop in the Total cell (A4)
Microsoft Excel – Pivot Tables
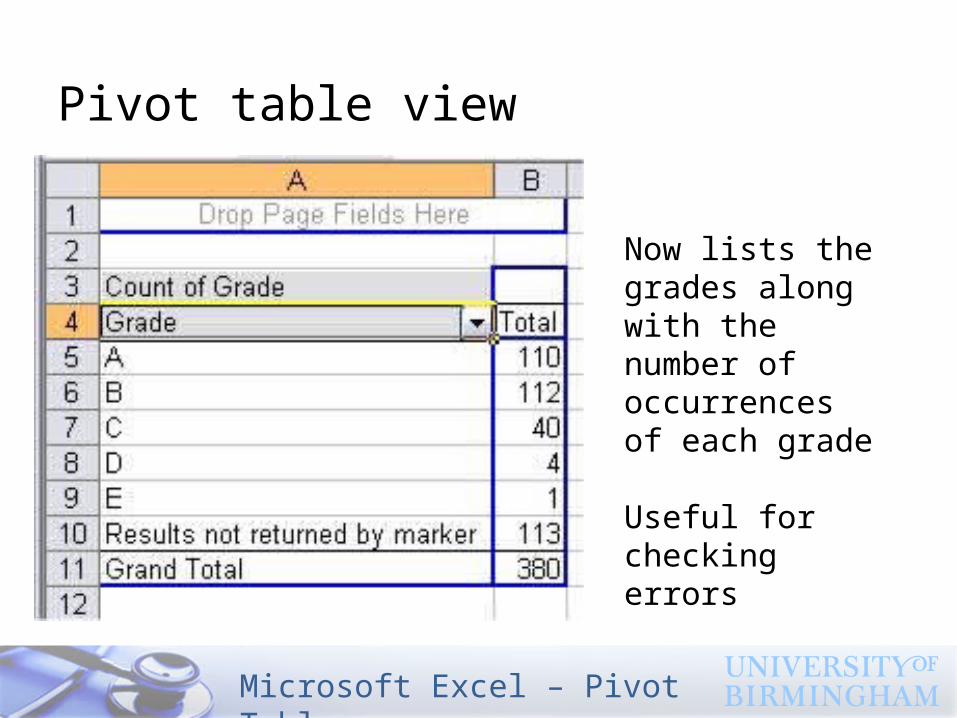
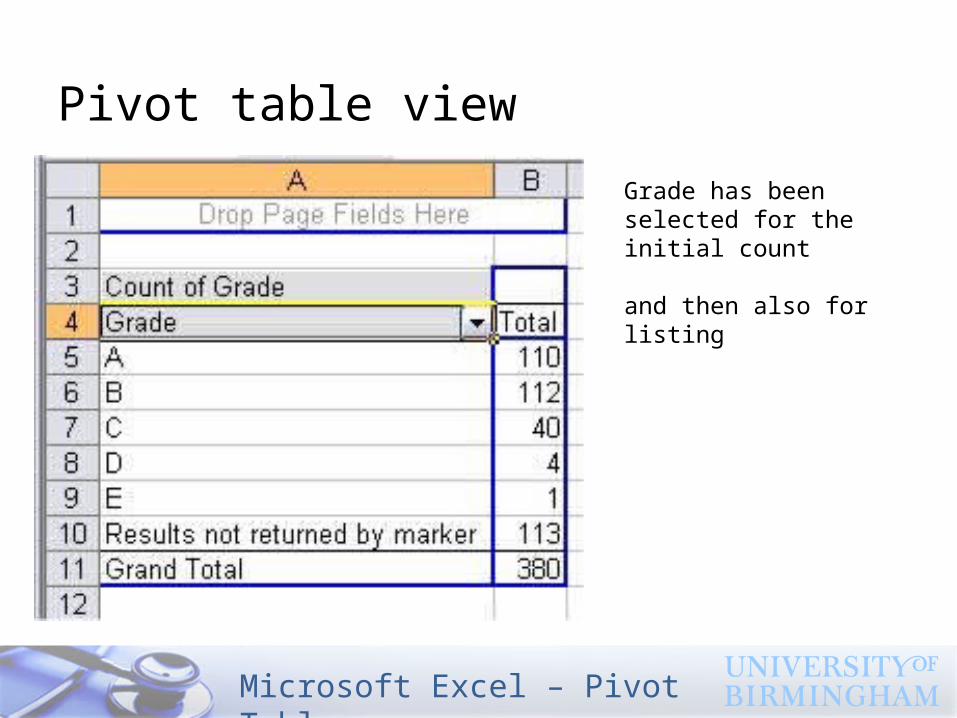
Pivot table view
Now lists the grades along with the number of occurrences of each grade
Useful for checking errors
Microsoft Excel – Pivot Tables
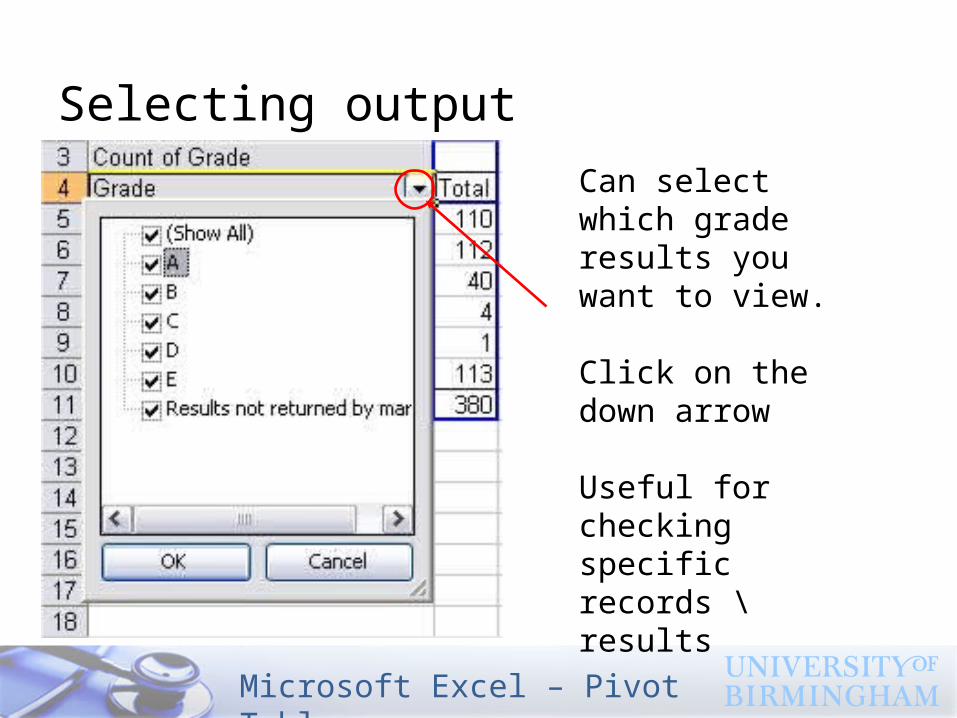
Selecting output
Can select which grade results you want to view.
Click on the down arrow
Useful for checking specific records \ results
Microsoft Excel – Pivot Tables
Pivot table view
Grade has been selected for the initial count
and then also for listing
Microsoft Excel – Pivot Tables
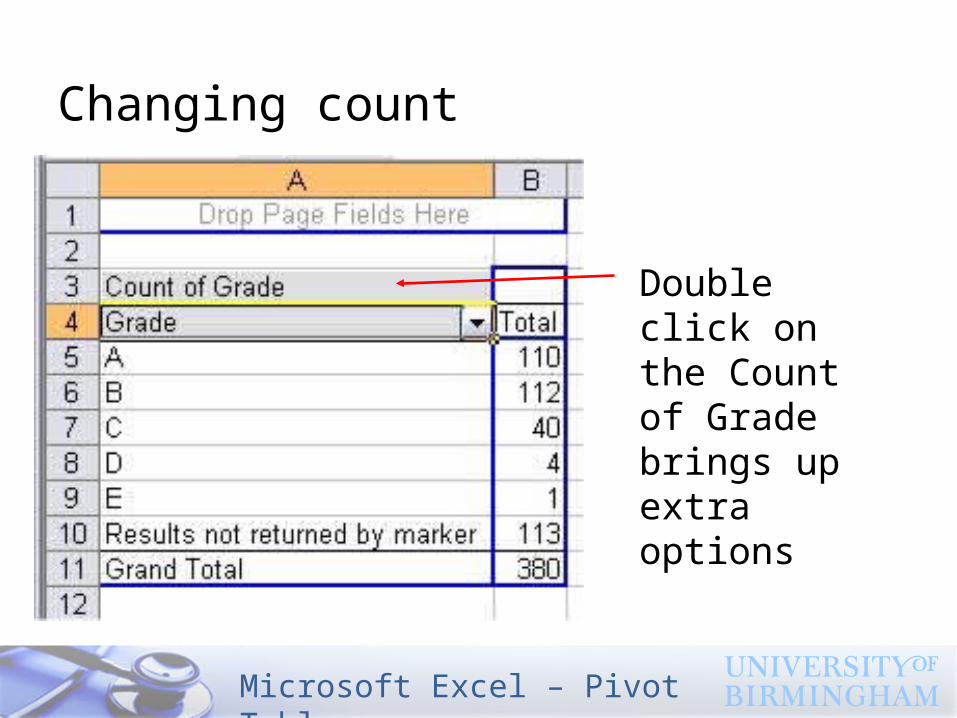
Changing count
Double click on the Count of Grade brings up extra options
Microsoft Excel – Pivot Tables
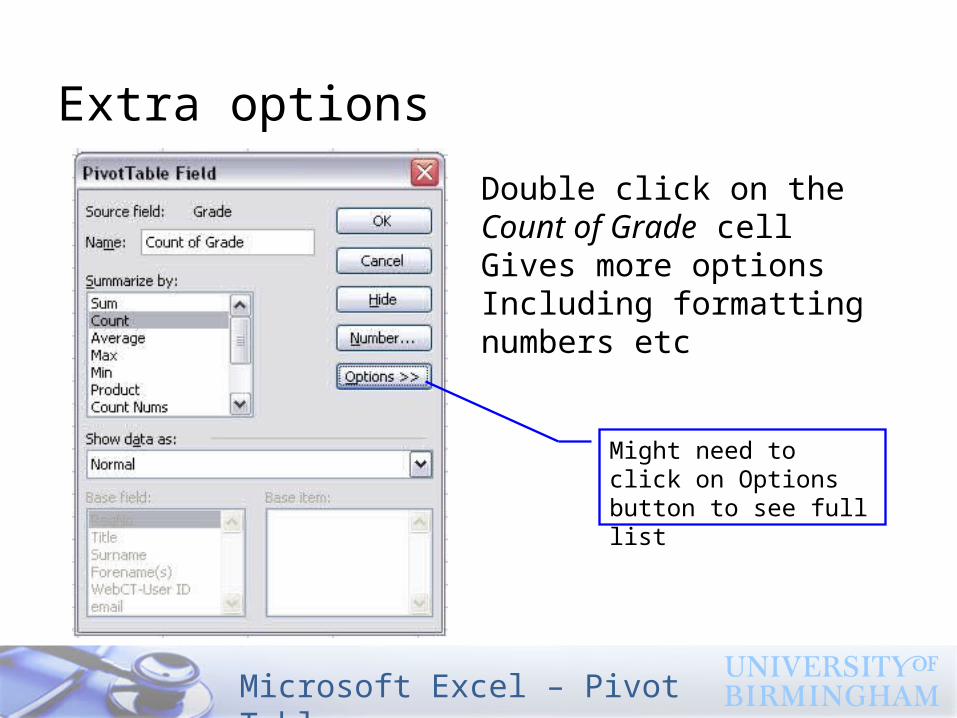
Extra options
Double click on the Count of Grade cellGives more options Including formatting numbers etc
Might need to click on Options button to see full list

Microsoft Excel – Pivot Tables
Creating percentages
Microsoft Excel – Pivot Tables
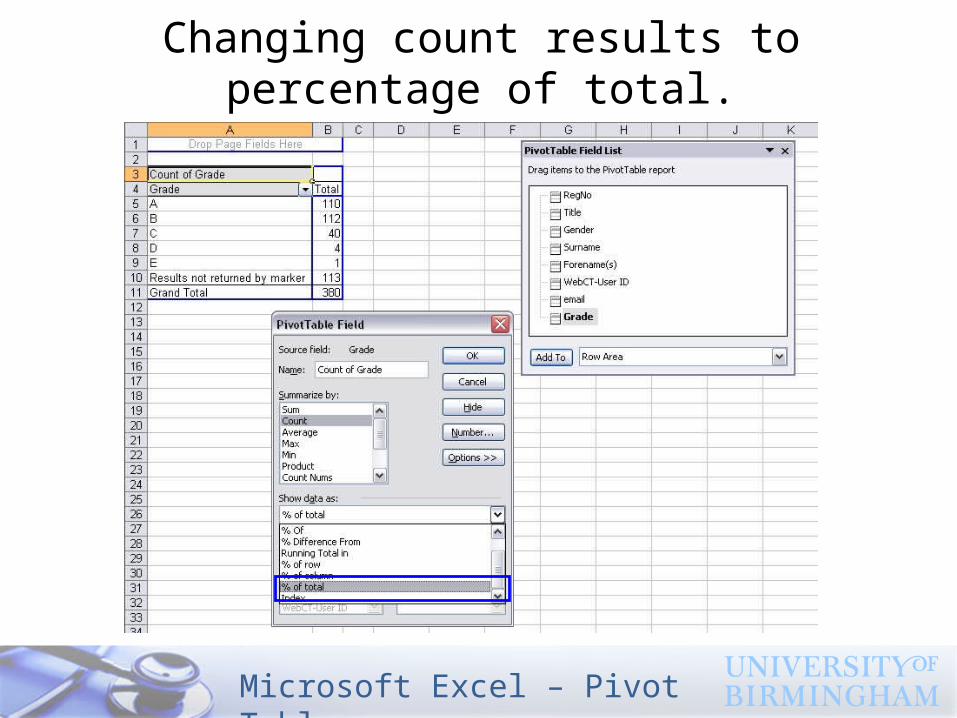
Changing count results to percentage of total.

Microsoft Excel – Pivot Tables
Change count to Percentage
Total column now shows percentages rather than simple numbers of students.Can format decimal places.
Microsoft Excel – Pivot Tables
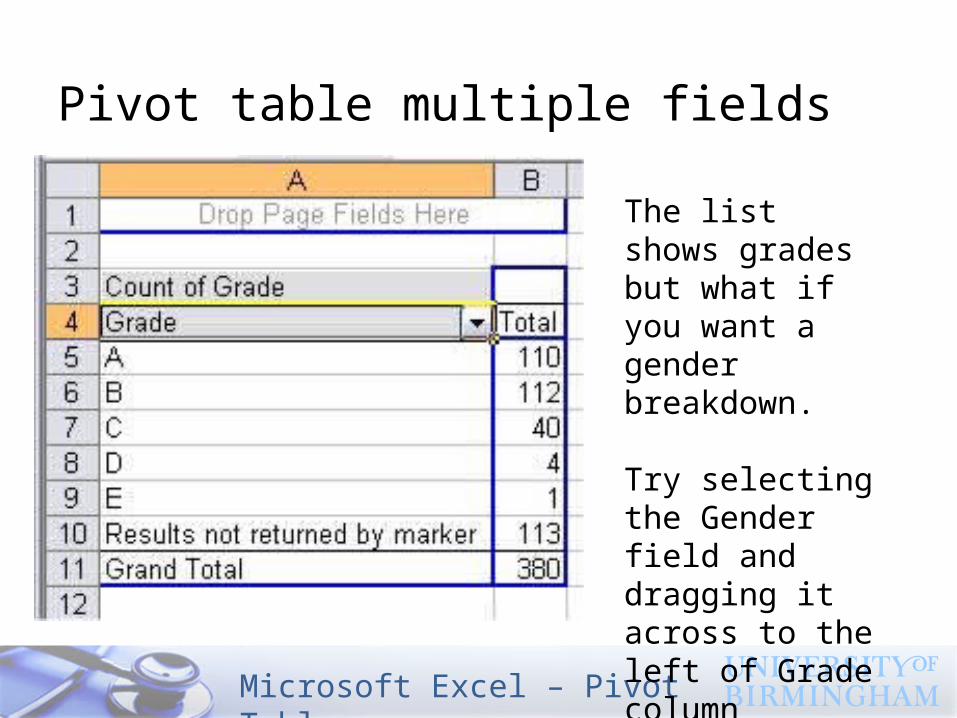
Pivot table multiple fields
The list shows grades but what if you want a gender breakdown.
Try selecting the Gender field and dragging it across to the left of Grade column

Microsoft Excel – Pivot Tables
Multiple Options
Table now shows gender and grades with totals
Microsoft Excel – Pivot Tables
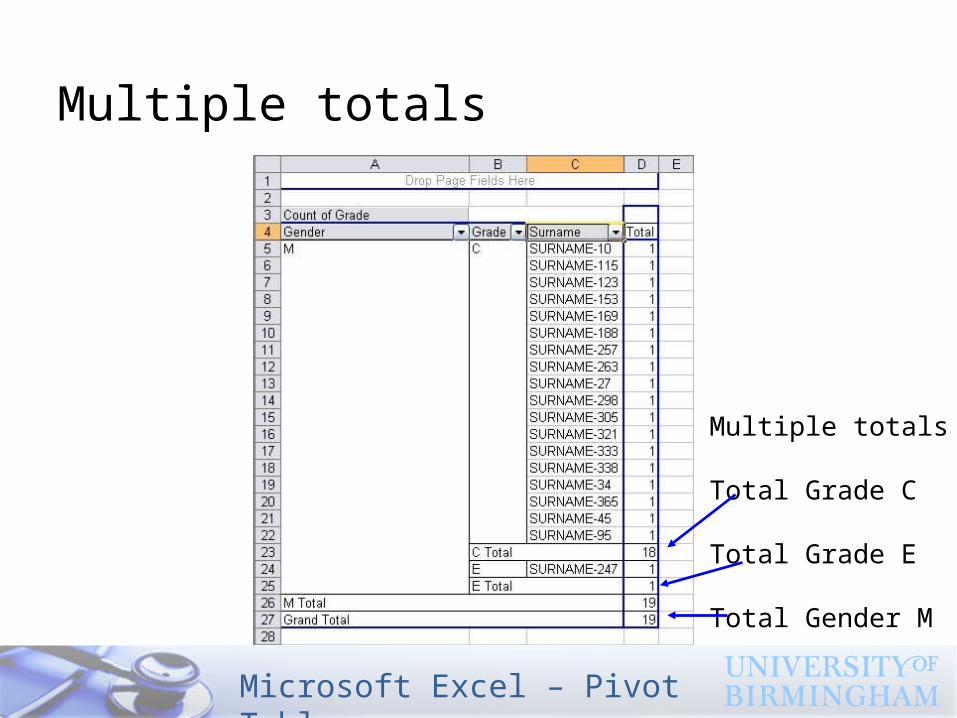
Multiple totals
Multiple totals
Total Grade C
Total Grade E
Total Gender M

Microsoft Excel – Pivot Tables
Pivot table view
Grade has been selected for the initial count
and then also for listing
Microsoft Excel – Pivot Tables
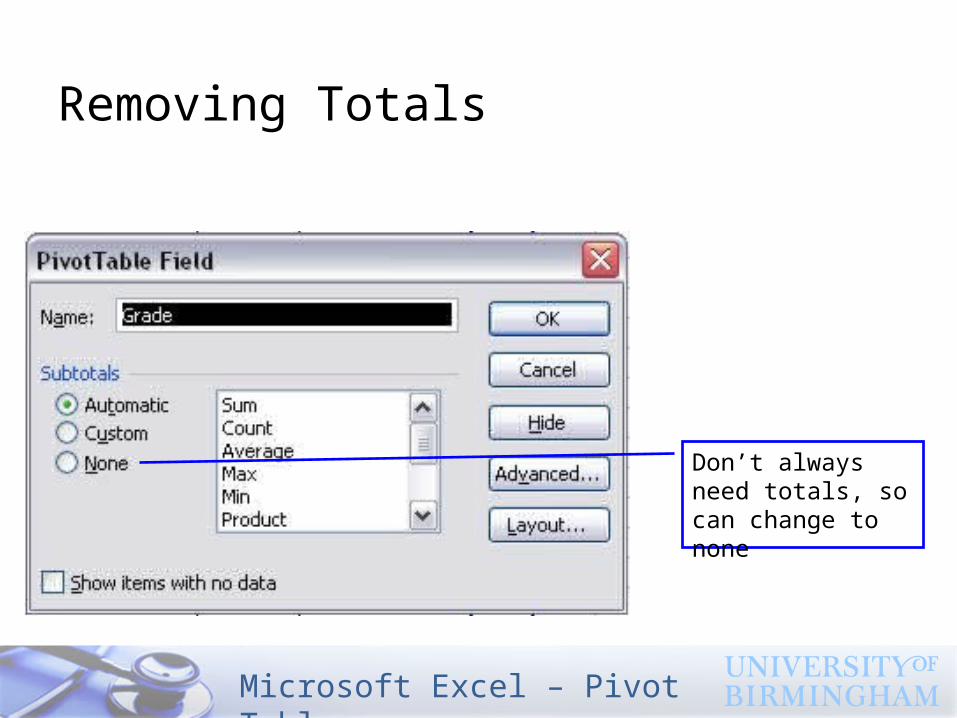
Removing Totals
Don’t always need totals, so can change to none
Microsoft Excel – Pivot Tables
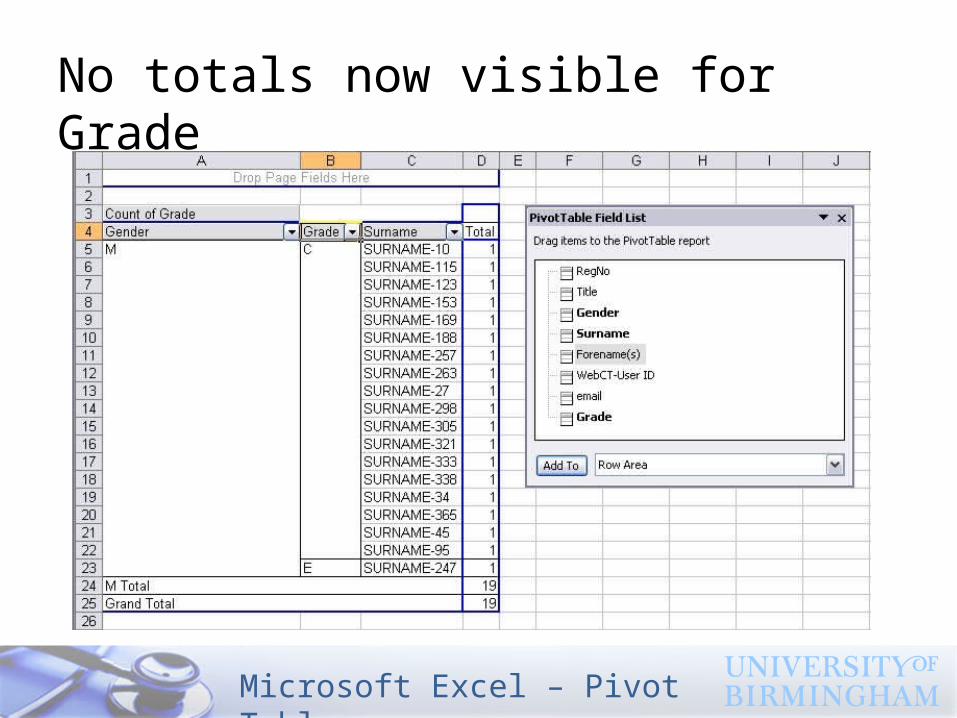
No totals now visible for Grade

Microsoft Excel – Pivot Tables
Questions and further details
Contact detailsRob JonesEducation Technology Team Room WG43Email: [email protected] Tel: 0121 414 4243
Microsoft Excel – Pivot Tables
Simple Dataset Exercises / activities
Find the following1. List of student names awarded a Grade A only 2. Change the Gender for the Dr (RegNo 453480) to
Male3. Gender breakdown of student with a Grade A only
actual number and percentage4. Percentage of students with a Grade D or E only5. Gender graph showing grades6. List people whose results are not yet returned, with
their email address

Microsoft Excel – Pivot Tables
Answers follow

Microsoft Excel – Pivot Tables
List of student names awarded a Grade A only
Microsoft Excel – Pivot Tables
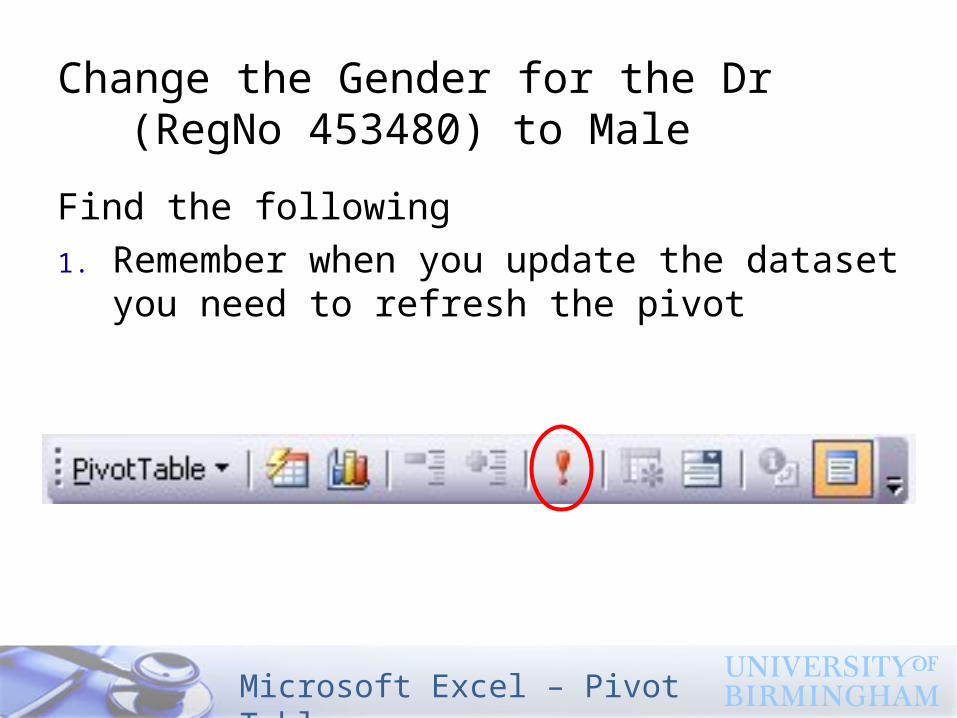
Change the Gender for the Dr (RegNo 453480) to Male
Find the following
1. Remember when you update the dataset you need to refresh the pivot
Microsoft Excel – Pivot Tables
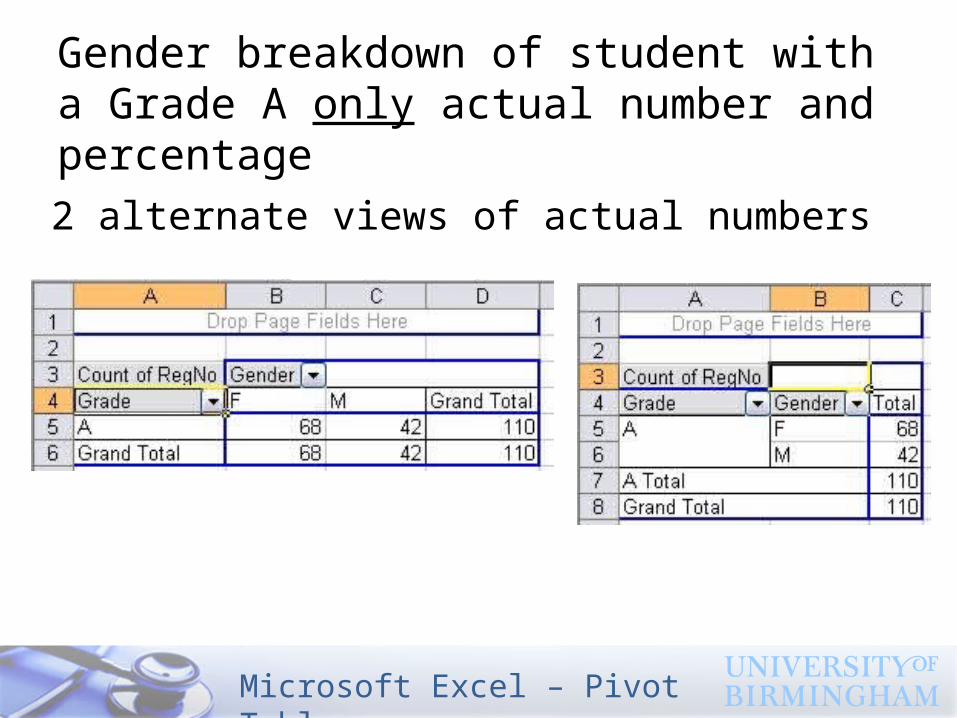
Gender breakdown of student with a Grade A only actual number and percentage
2 alternate views of actual numbers
Microsoft Excel – Pivot Tables
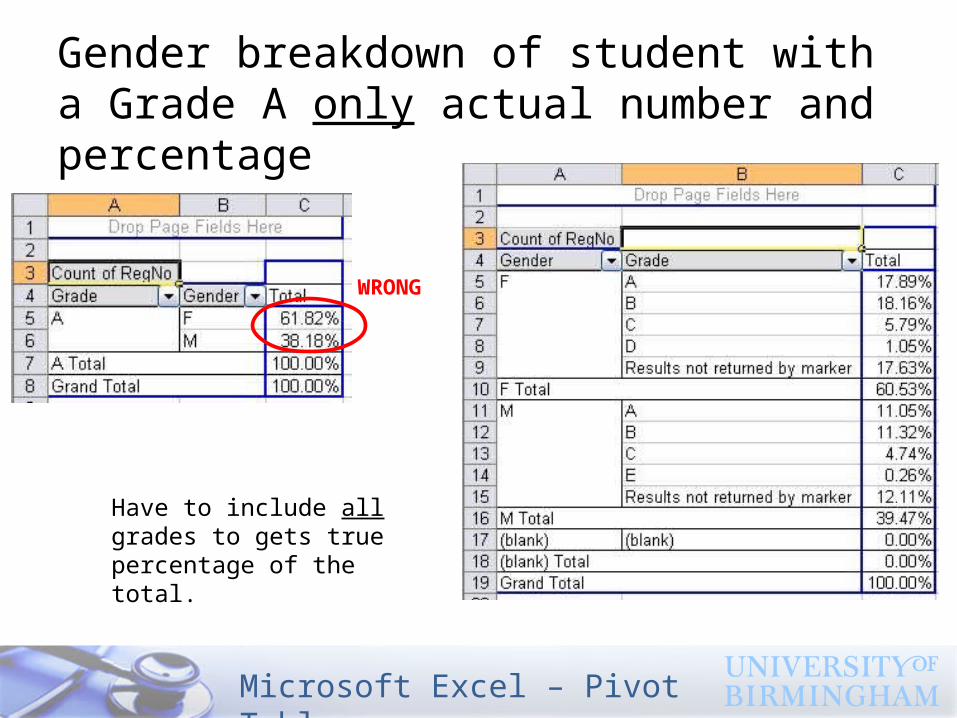
Gender breakdown of student with a Grade A only actual number and percentage
WRONG
Have to include all grades to gets true percentage of the total.
Microsoft Excel – Pivot Tables
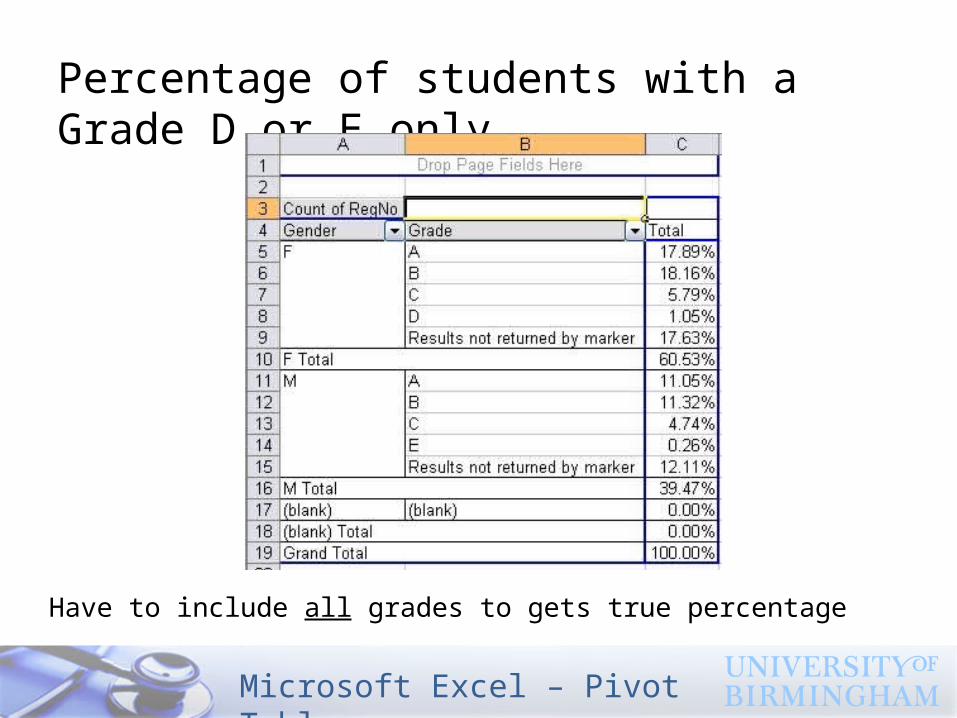
Percentage of students with a Grade D or E only
Have to include all grades to gets true percentage
Microsoft Excel – Pivot Tables
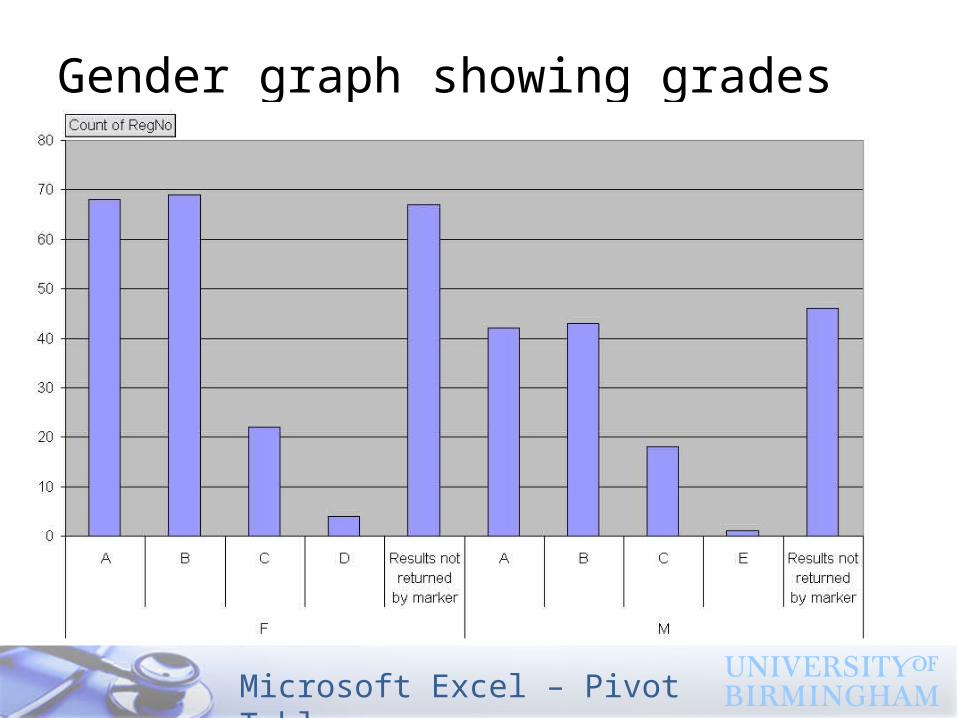
Gender graph showing grades

Microsoft Excel – Pivot Tables
List people whose results are not yet returned, with their email address
Microsoft Excel – Pivot Tables
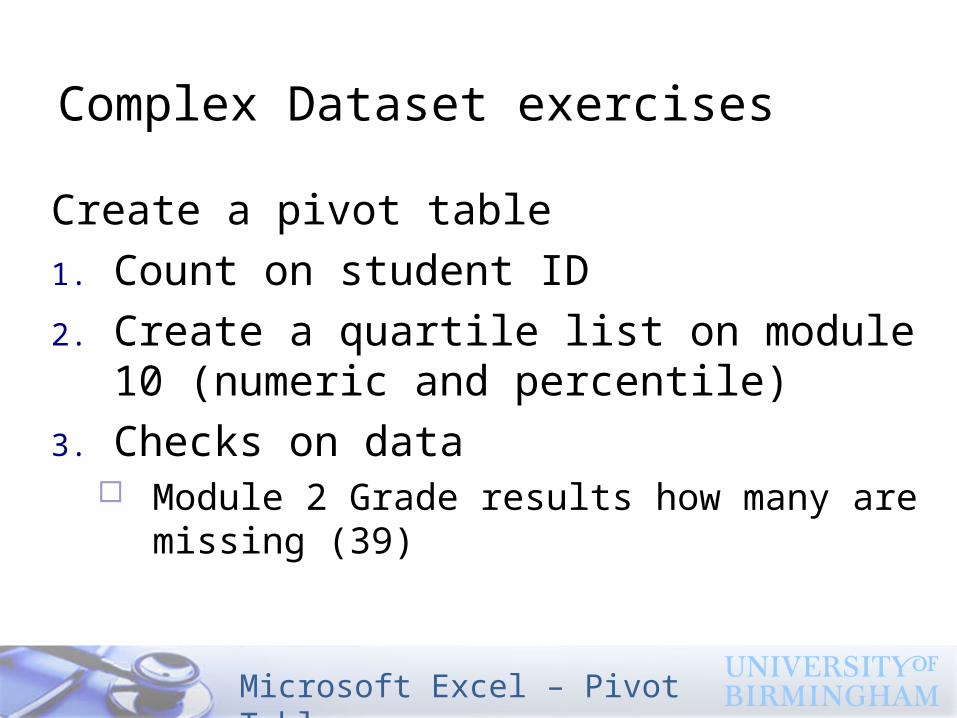
Complex Dataset exercises
Create a pivot table
1. Count on student ID
2. Create a quartile list on module 10 (numeric and percentile)
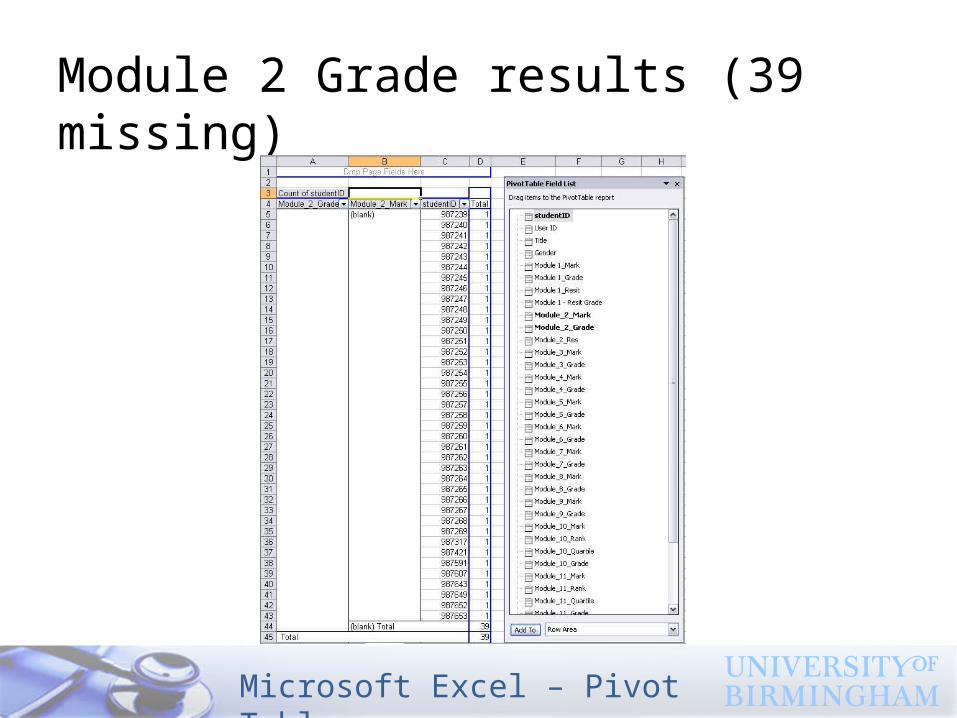
3. Checks on data Module 2 Grade results how many are
missing (39)
Microsoft Excel – Pivot Tables
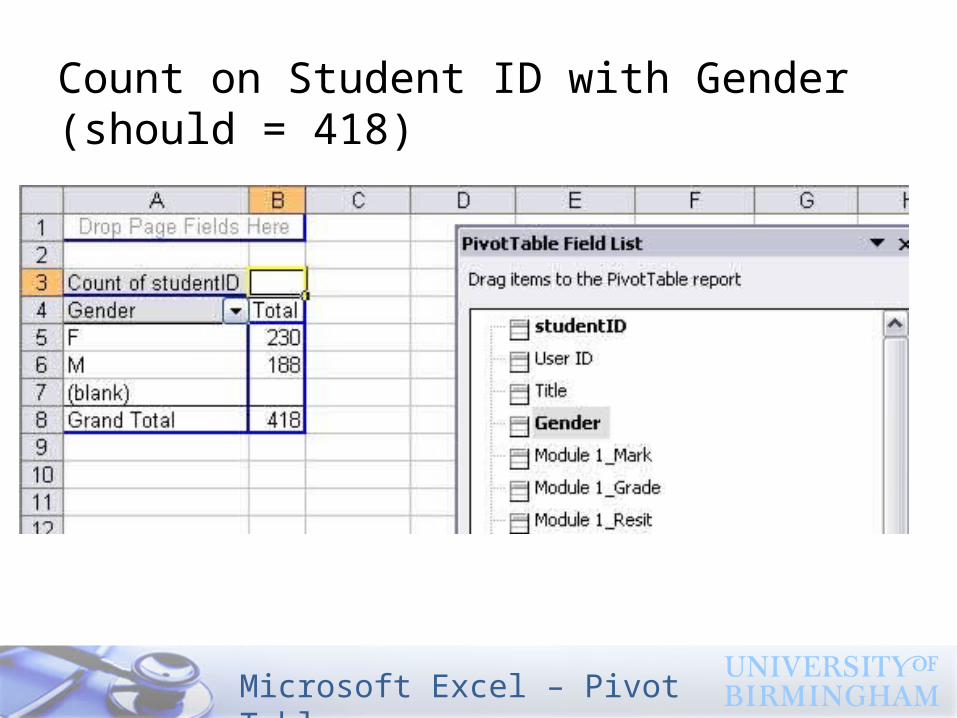
Count on Student ID with Gender (should = 418)
Microsoft Excel – Pivot Tables
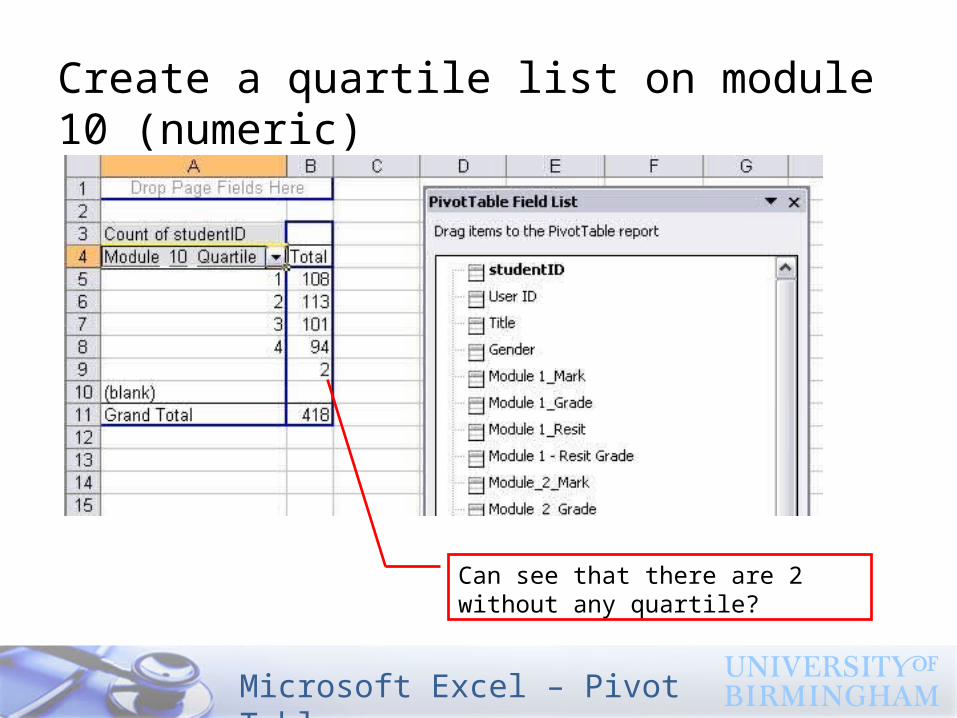
Create a quartile list on module 10 (numeric)
Can see that there are 2 without any quartile?
Microsoft Excel – Pivot Tables
Module 2 Grade results (39 missing)