Embed Size (px)
DESCRIPTION
Using Data to Make Graphs. What Is Data?. Data is information. An example: In my fifth grade class we took a pizza lovers survey. We learned that ten kids liked pepperoni pizza best. Nine kids liked sausage pizza best. Seven kids liked cheese pizza best. This information is called DATA. - PowerPoint PPT Presentation
Citation preview
GO ON
Using Data to Make Graphs

GO ON
What Is Data?
Data is information.
An example:
In my fifth grade class we took a pizza lovers survey.
We learned that ten kids liked pepperoni pizza best.
Nine kids liked sausage pizza best.
Seven kids liked cheese pizza best.
This information is called DATA.

GO ON
What Is Data?If a mom was planning a pizza party for the class, she would need the
pizza lovers survey DATA.I need to order 10
pepperoni, 9 sausage and 7 cheese pizzas.

GO ON
What Is Data?Your report card is another example of data.
Math: 88%
Reading: 94%
Science: 75%
Social Studies: 80%
Language Arts: 55%
My Language Arts teacher may
not like me.

GO ON
Data Is Everywhere.
TV
Books
Newspaper
There is way too much data
in school!

GO ON
How Do People Use Data?
We use data to make money.
The data from the test will help us cure your disease.
Data is needed to build things.

GO ON
Data Can Be Confusing.34
5532 88%
97%
76%
85%
100%
$134
.00
$231
.00
$450
.95
$319
.63
$750
.90

GO ON
We Use Graphs to Organize Data.
0102030405060708090
100
Math Reading Sci SS L. Arts
I know my parents will want to talk to my Language Arts
teacher.

GO ON
Graphs Make Data Easier to Understand.
Cows 124
Chickens 450
Turkeys 388
Horses 56
Mules 110
Below is data without a graph.
Animals on the farmChickens rule!
GO ON
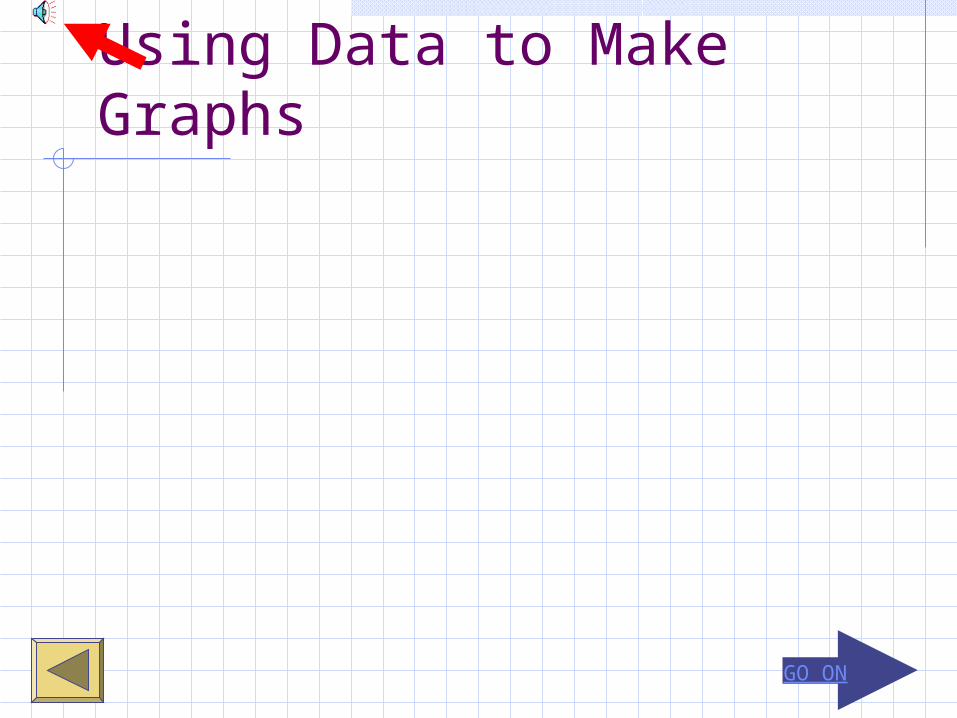
Data WITH A Graph.
Cows 124
Chickens
450
Turkeys 388
Horses 56
Mules 110
Animals on the farm
0
100
200
300
400
500
CowsChickensTurkeysHorsesMules

GO ON
Let’s Learn About Graphs.There are many different types of graphs.
Let’s learn about two kinds.
1. The bar graph
2. The line graph
0102030405060708090
100
Math Reading Sci SS L. Arts
0102030405060708090
100
Math Reading Sci SS L. Arts
GO ON
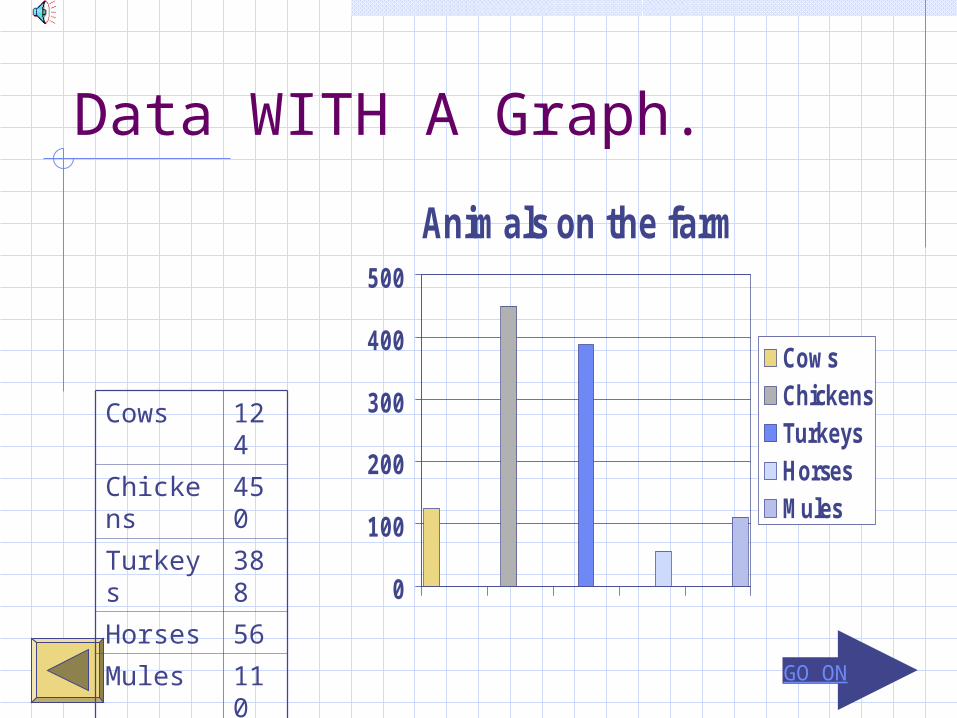
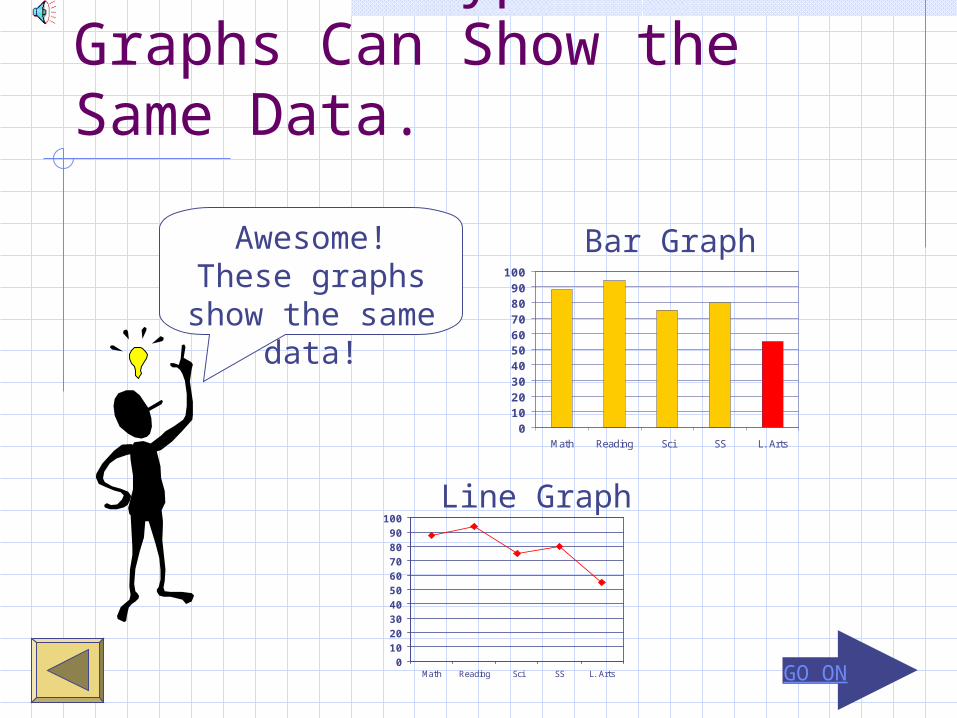
Different Types of Graphs Can Show the Same Data.
0102030405060708090
100
Math Reading Sci SS L. Arts
0102030405060708090
100
Math Reading Sci SS L. Arts
Awesome! These graphs
show the same data!
Bar Graph
Line Graph
GO ON
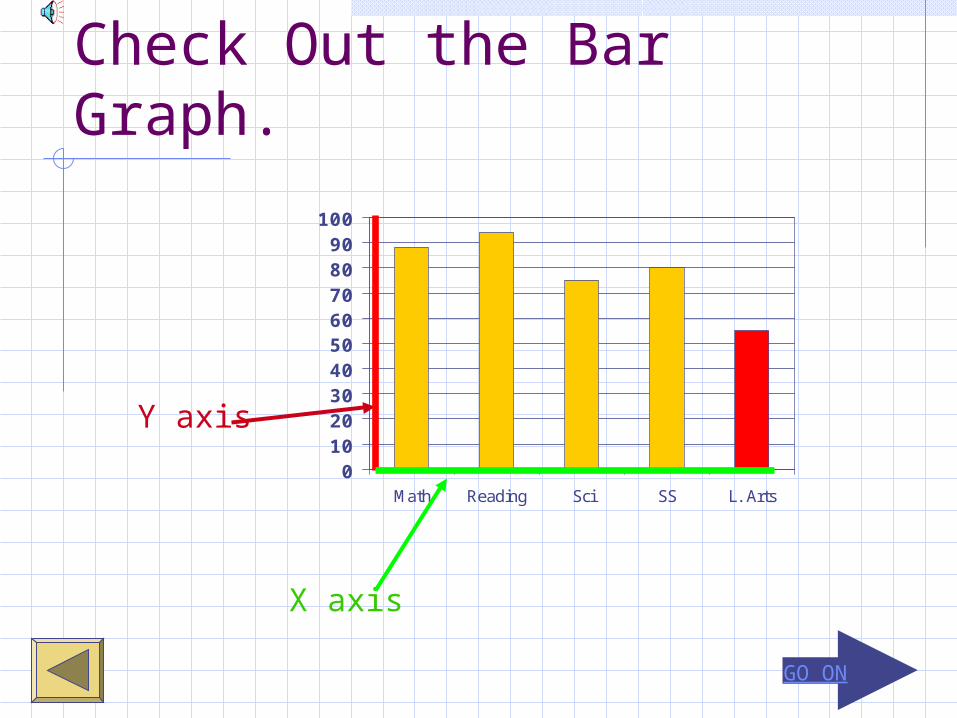
Check Out the Bar Graph.
0102030405060708090
100
Math Reading Sci SS L. Arts
X axis
Y axis

GO ON
Check Out the Line Graph.
0102030405060708090
100
Math Reading Sci SS L. Arts
Y axis
X axis

GO ON
How To Read A Bar Graph.
0102030405060708090
100
Math Reading Sci SS L. Arts
My Grades
55
90

GO ON
Learn More About Bar Graphs.
Animals on the farm
125
450
300
50
100
0
100
200
300
400
500
CowsChickensTurkeysHorsesMules

GO ON
A Challenge.
0
10
20
30
40
50
60
Which bar on the graph represents 45 feet?
Feet
GO ON
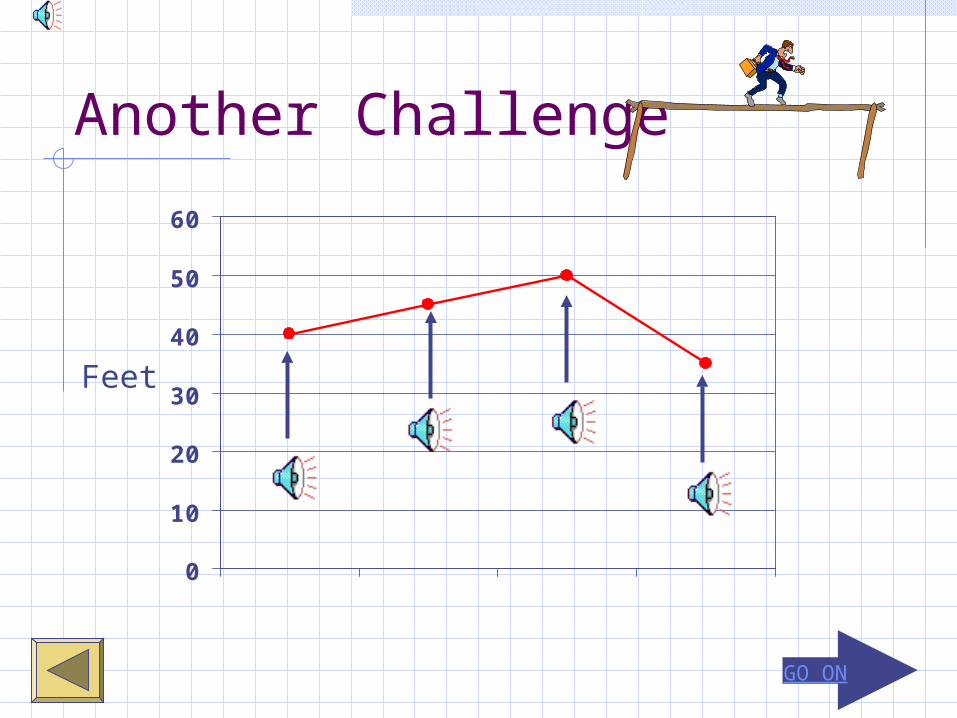
Another Challenge
0
10
20
30
40
50
60
Feet
GO ON
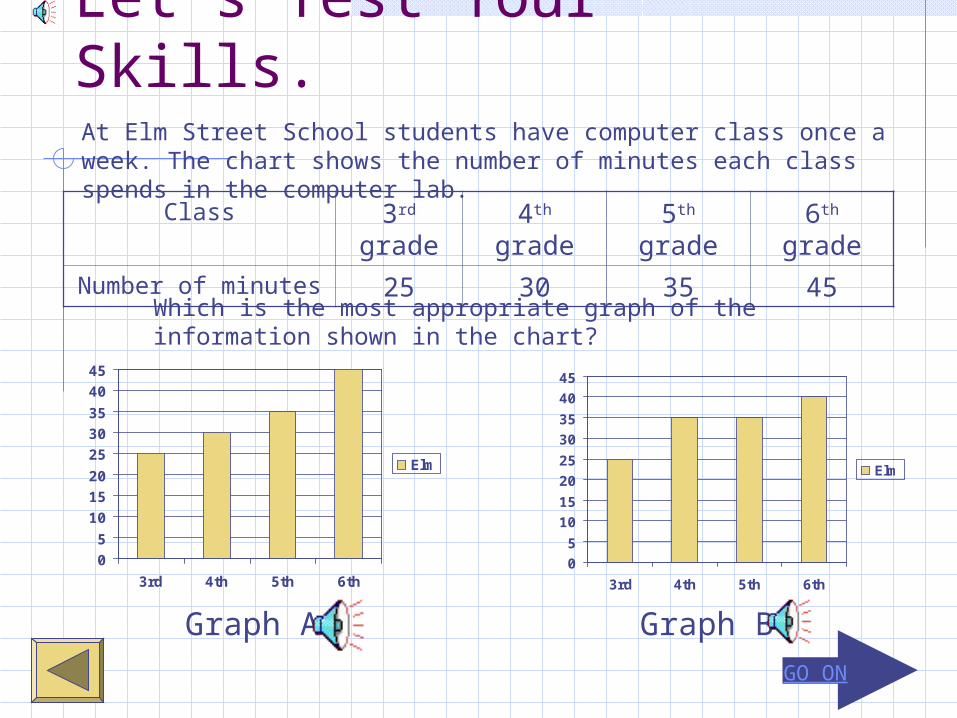
Let’s Test Your Skills.
Class 3rd grade
4th grade 5th grade 6th grade
Number of minutes 25 30 35 45
At Elm Street School students have computer class once a week. The chart shows the number of minutes each class spends in the computer lab.
05
101520
253035
4045
3rd 4th 5th 6th
Elm
05
1015
2025
3035
4045
3rd 4th 5th 6th
Elm
Which is the most appropriate graph of the information shown in the chart?
Graph A Graph B

GO ON
What Is Wrong With Graph B?
Class 3rd grade
4th grade 5th grade 6th grade
Number of minutes 25 30 35 45
At Elm Street School students have computer class once a week. The chart shows the number of minutes each class spends in the computer lab.
05
101520
253035
4045
3rd 4th 5th 6th
Elm
05
101520
253035
4045
3rd 4th 5th 6th
Elm
Which is the most appropriate graph of the information shown in the chart?
Graph A Graph B
GO ON
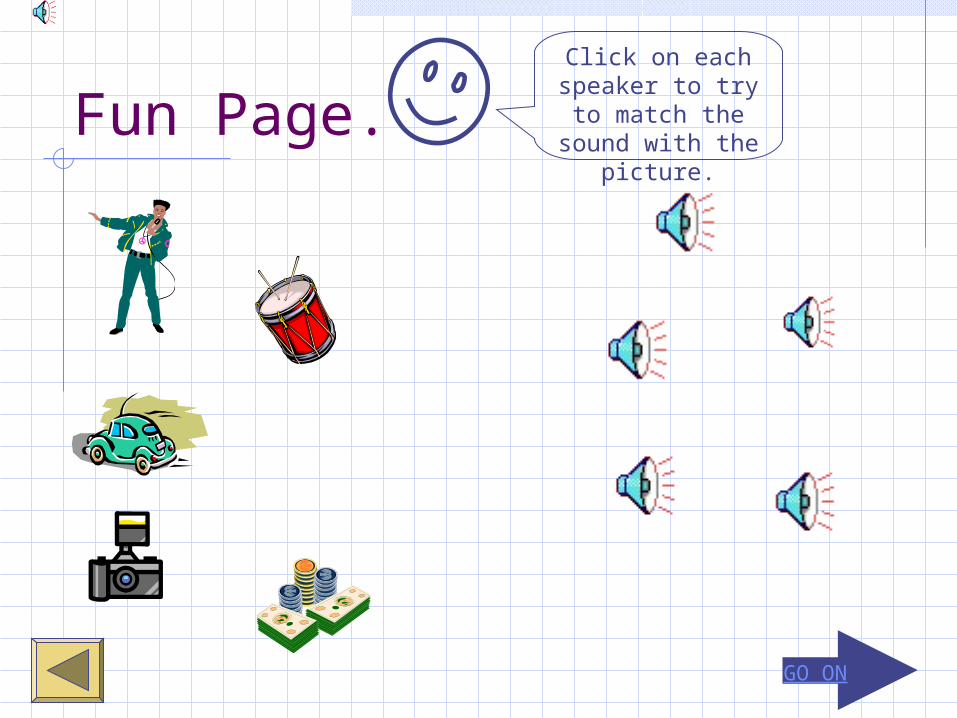
Fun Page.Click on each
speaker to try to match the sound with the picture.
GO ON
Congratulations, You Made It!
My brain hurts!