Embed Size (px)
Citation preview
Standards
Certification
Education & Training
Publishing
Conferences & Exhibits
Using Data from Municipal Water/Wastewater SCADA Systems (and Other Sources) to Make Smarter Operational, Maintenance, and Infrastructure Decisions
2013 ISA Water / Wastewater and Automatic Controls SymposiumAugust 6-8, 2013 – Orlando, Florida, USA
Speaker: Carey E. Hidaka, MSc, MBASmarter Water Solutions, IBM Software Group
2013 ISA WWAC Symposium Aug 6-8, 2013 – Orlando, Florida, USA 2
Presenter
Carey E. Hidaka, MSc, MBAIBM Software GroupClient Solutions ProfessionalSmarter Water ManagementCertified IBM Consultant
• 29 years of information technology experience and practiced for nine years as a consulting environmental engineer and registered Professional Engineer (PE, State of Illinois) where he focused on water resource planning and water and wastewater treatment plant designs and implementations for public and industrial sector clients.
• Subject matter expert in the development of Smarter Water solutions as a part of IBM’s Smarter Planet initiative.
• Published author in Journal of American Water Works Association, IBM Journal of Research and Development, Water Practice and Technology, and World Water
Smarter Water

Using Data from Municipal Water/Wastewater SCADA Sy stems (and Other Sources) to Make Smarter Operational, Ma intenance, and Infrastructure Decisions
August 7, 2013Carey Hidaka
IBM Software GroupSmarter Water
Slide 4
Presentation Outline
� Background – The Water / Wastewater Industry
� What Does “Smarter” Mean?
� Why Smarter Water Management?
� Examples of Smarter Water Management
� Summary
Slide 5
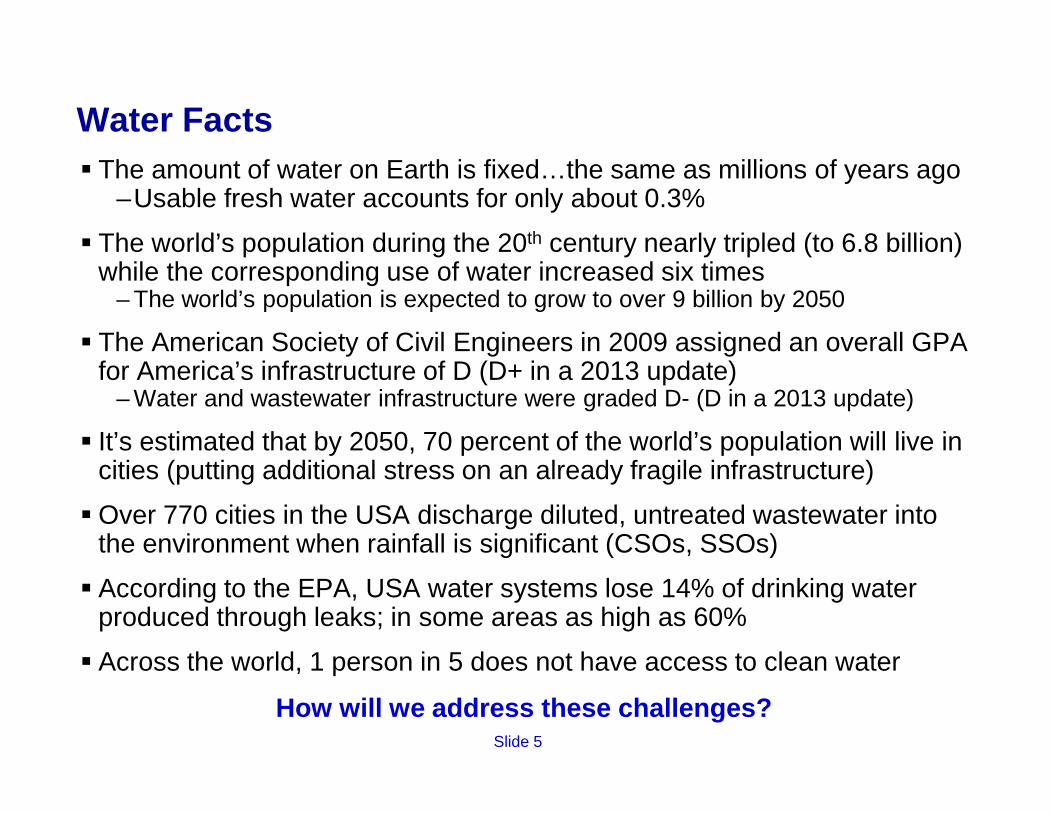
Water Facts� The amount of water on Earth is fixed…the same as millions of years ago
–Usable fresh water accounts for only about 0.3%
� The world’s population during the 20th century nearly tripled (to 6.8 billion) while the corresponding use of water increased six times
– The world’s population is expected to grow to over 9 billion by 2050
� The American Society of Civil Engineers in 2009 assigned an overall GPA for America’s infrastructure of D (D+ in a 2013 update)
– Water and wastewater infrastructure were graded D- (D in a 2013 update)
� It’s estimated that by 2050, 70 percent of the world’s population will live in cities (putting additional stress on an already fragile infrastructure)
� Over 770 cities in the USA discharge diluted, untreated wastewater into the environment when rainfall is significant (CSOs, SSOs)
� According to the EPA, USA water systems lose 14% of drinking water produced through leaks; in some areas as high as 60%
� Across the world, 1 person in 5 does not have access to clean water
How will we address these challenges?
Slide 6
The Water / Wastewater Industry Today
� Infrastructure and asset intensive– In many areas of the USA and world, infrastructure has exceeded its useful life– Water has buried assets…out of sight, out of mind
� Conservative– Uses traditional approaches to problem solving; new technologies are adopted
in a deliberate fashion– Tends to be reactive, not proactive
� Aging, experienced workforce (aka the “Gray Tsunami”)– A few veterans retain system knowledge/experience in their heads
� Operating and capital budgets are constrained– Do more with less
� Operating data resides in silos

Slide 7
Smarter Water: A System -of-Systems
Water Treatment
Storage & DistributionWastewater Treatment
Water Supply
Wastewater Collection
Slide 8
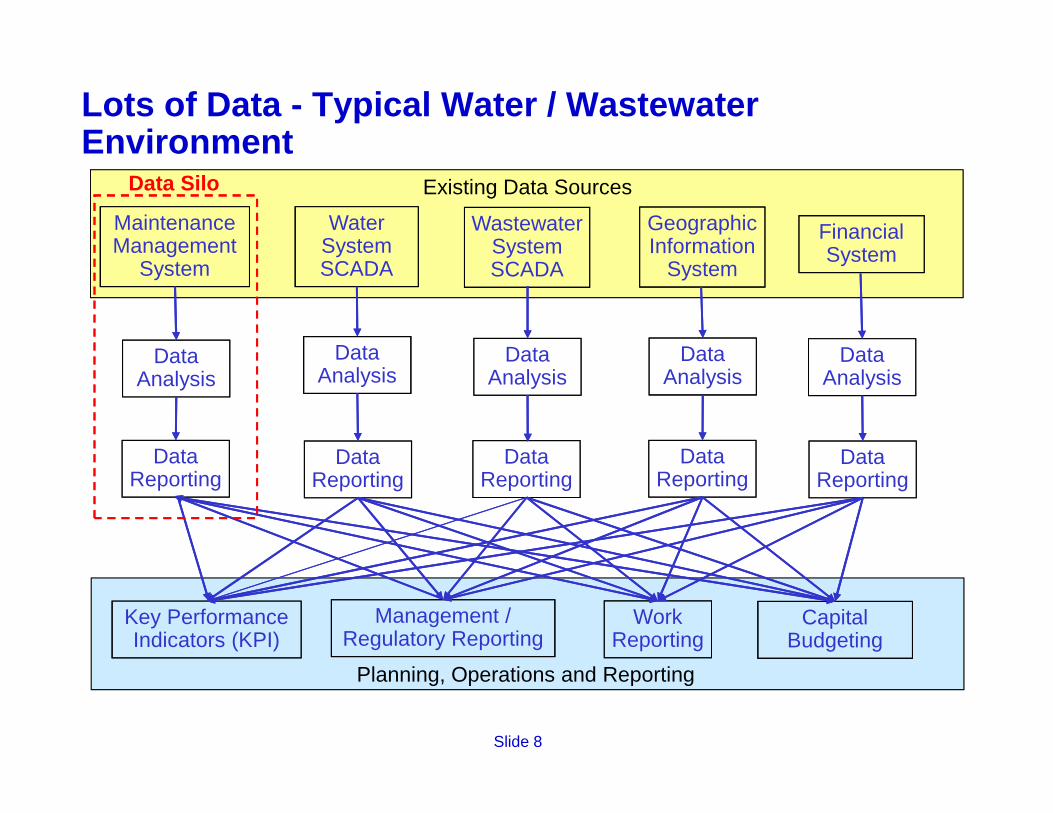
Lots of Data - Typical Water / Wastewater Environment
Maintenance Management
System
Water System SCADA
Wastewater System SCADA
Geographic Information
System
Financial System
Data Analysis
Data Reporting
Key Performance Indicators (KPI)
Management / Regulatory Reporting
Data Analysis
Data Analysis
Existing Data Sources
Data Analysis
Data Analysis
Data Reporting
Data Reporting
Data Reporting
Data Reporting
Work Reporting
Capital Budgeting
Planning, Operations and Reporting
Data Silo
Slide 9
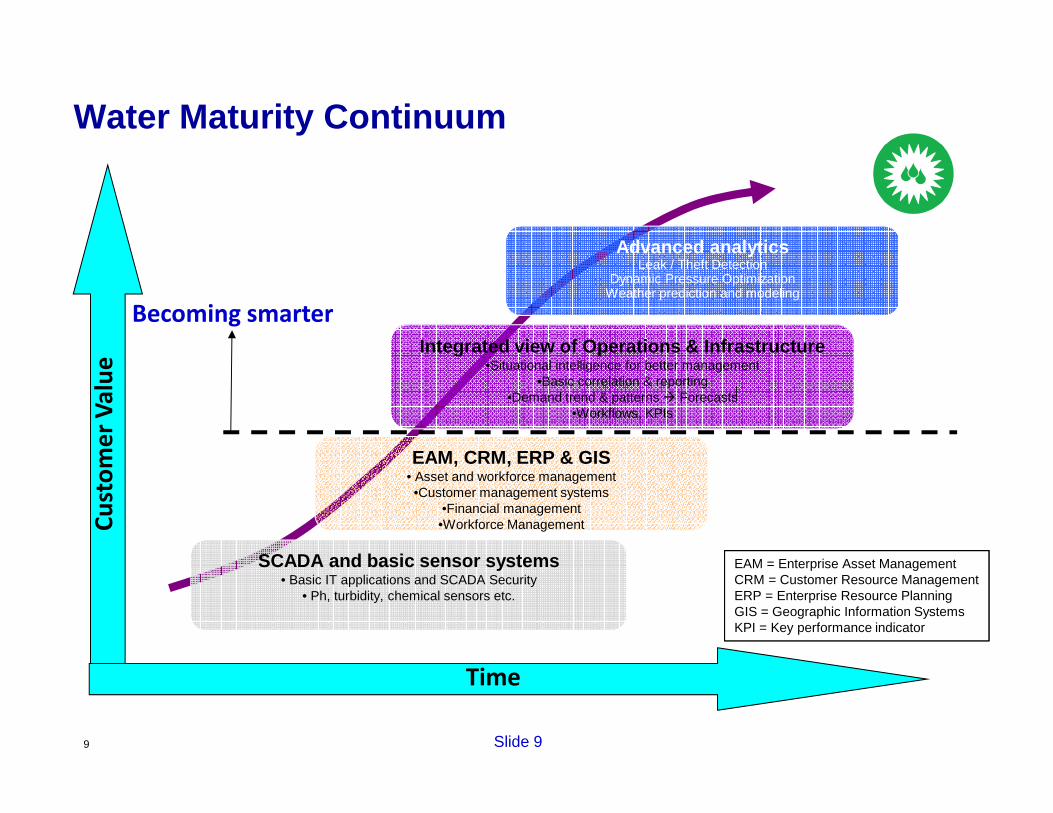
Water Maturity Continuum
9
Integrated view of Operations & Infrastructure•Situational intelligence for better management
•Basic correlation & reporting•Demand trend & patterns � Forecasts
•Workflows, KPIs
Advanced analyticsLeak / Theft Detection
Dynamic Pressure OptimizationWeather prediction and modeling
SCADA and basic sensor systems• Basic IT applications and SCADA Security
• Ph, turbidity, chemical sensors etc.
EAM, CRM, ERP & GIS• Asset and workforce management•Customer management systems
•Financial management•Workforce ManagementC
ust
om
er
Va
lue
Time
Becoming smarter
EAM = Enterprise Asset ManagementCRM = Customer Resource ManagementERP = Enterprise Resource PlanningGIS = Geographic Information SystemsKPI = Key performance indicator
Slide 10
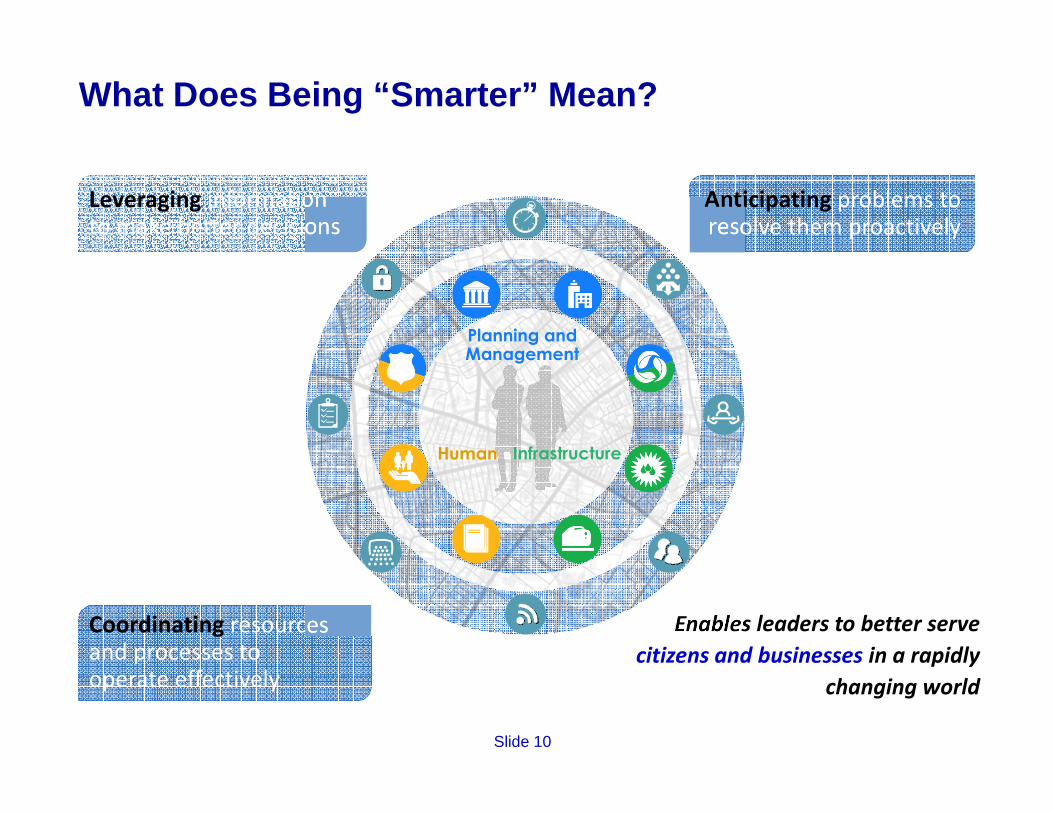
Enables leaders to better serve
citizens and businesses in a rapidly
changing world
Leveraging information to make better decisions
Anticipating problems to resolve them proactively
Coordinating resources and processes to operate effectively
What Does Being “Smarter” Mean?
InfrastructureHuman
Planning and Management
Slide 11
What is Smarter Water Management?
� Uses existing and new water/wastewater data– Operational data…SCADA systems and sensor-based data– Maintenance data (EAM, CMMS)
� Combined with other sources of data– Share data between disparate systems (operations, maintenance, asset
management)– Web-based data (USGS, weather)– Geographic Information System (GIS) data (demographics, soil type, etc.)
� To provide new insights and support better ways of making decisions (move up the Water Maturity Continuum)
– Visualization (graphs, charts)– Analytics (historical analysis, optimization)
� And have a positive impact on water/wastewater oper ations (and the environment)
– Improve water supply, reduce water main breaks/bursts– Reduce untreated wastewater discharges, improve capacity, management,
operations and maintenance (CMOM) capabilities– Reduce/optimize energy usage (reduce GHG emissions)
Slide 12
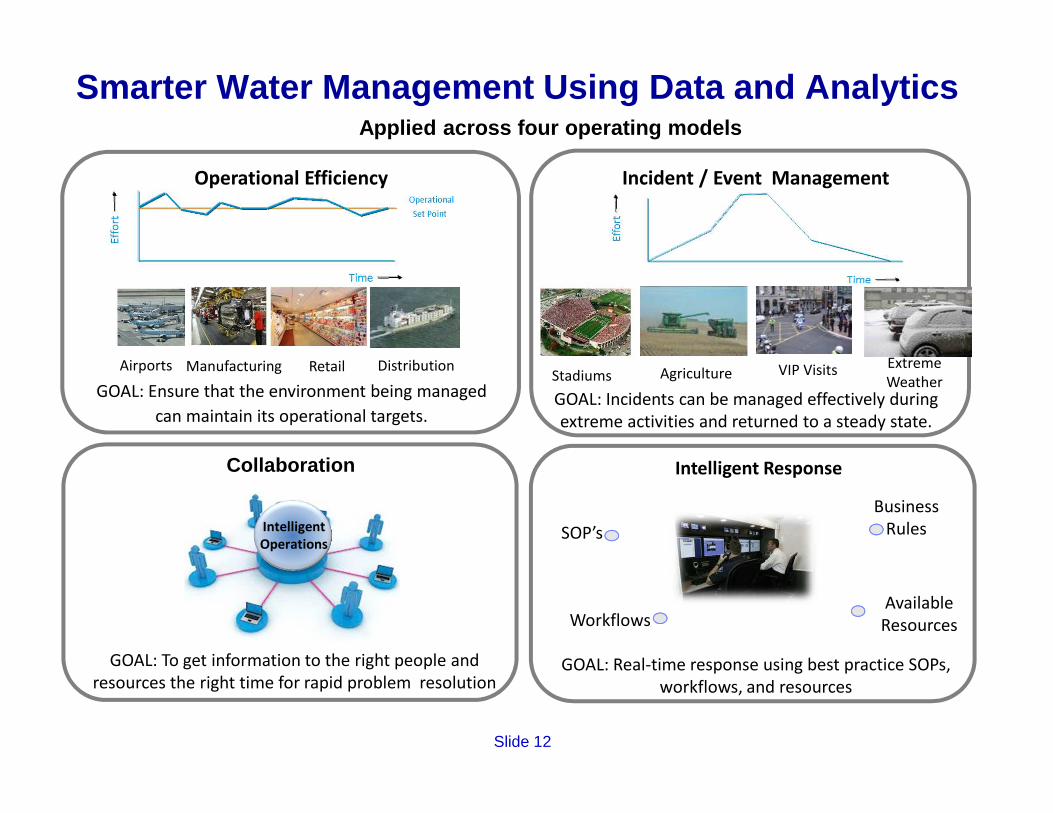
Applied across four operating models
Smarter Water Management Using Data and Analytics
Operational Efficiency Incident / Event Management
Airports Manufacturing Retail Distribution Stadiums VIP Visits
Extreme
Weather GOAL: Ensure that the environment being managed
can maintain its operational targets.GOAL: Incidents can be managed effectively during
extreme activities and returned to a steady state.
Agriculture
Collaboration Intelligent Response
GOAL: To get information to the right people and
resources the right time for rapid problem resolutionGOAL: Real-time response using best practice SOPs,
workflows, and resources
SOP’s
Workflows
Business
Rules
Available
Resources
Intelligent
Operations
Slide 13
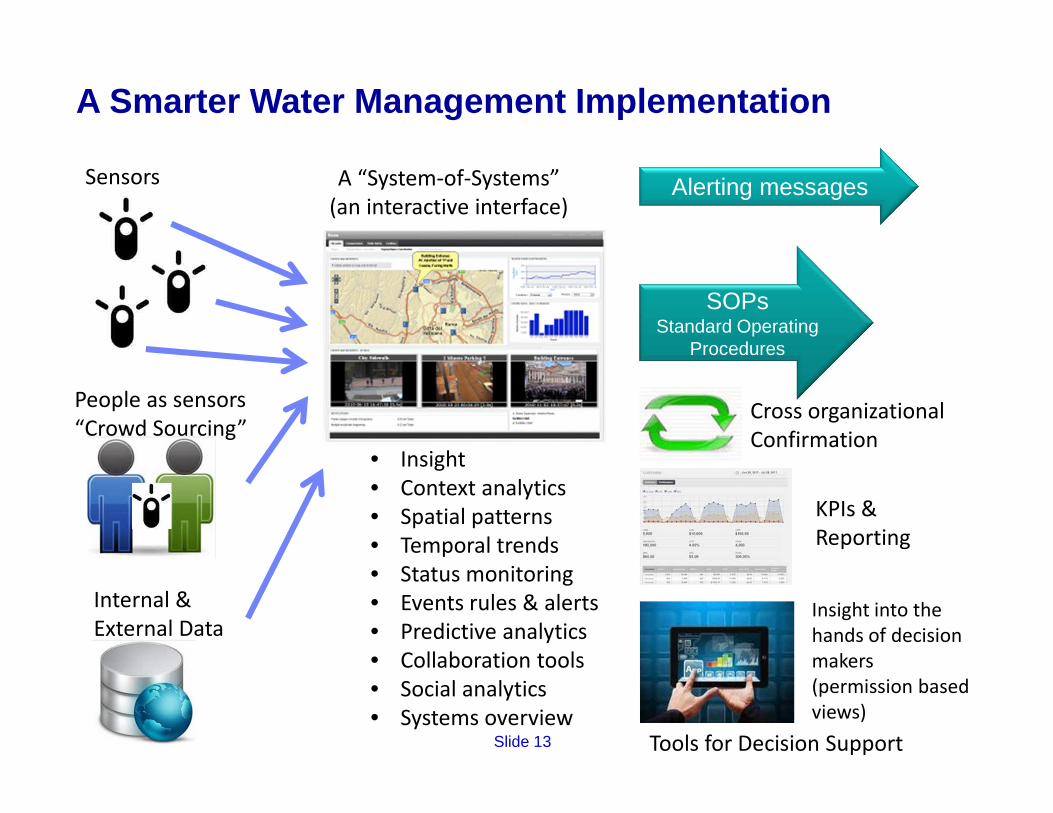
Sensors
People as sensors
“Crowd Sourcing”
Internal &
External Data
• Insight
• Context analytics
• Spatial patterns
• Temporal trends
• Status monitoring
• Events rules & alerts
• Predictive analytics
• Collaboration tools
• Social analytics
• Systems overview
Alerting messages
SOPsStandard Operating
Procedures
Cross organizational
Confirmation
Insight into the
hands of decision
makers
(permission based
views)
A “System-of-Systems”
(an interactive interface)
KPIs &
Reporting
Tools for Decision Support
A Smarter Water Management Implementation
Slide 14
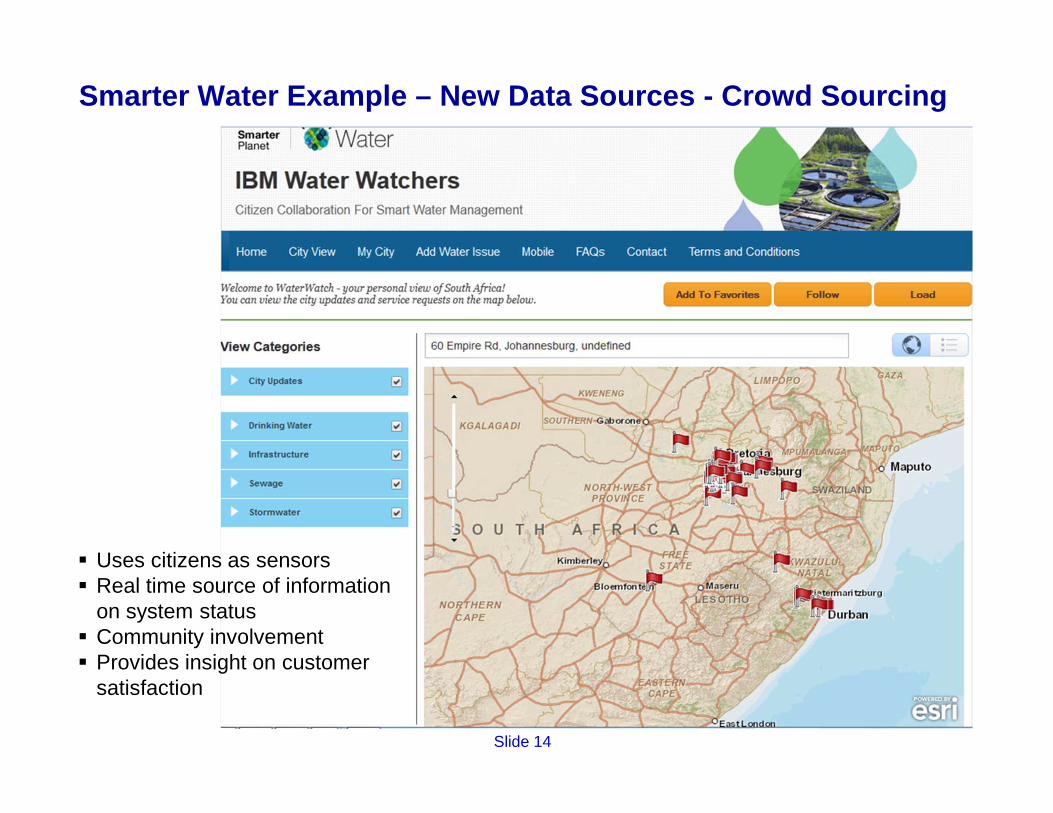
Smarter Water Example – New Data Sources - Crowd Sour cing
� Uses citizens as sensors� Real time source of information
on system status� Community involvement� Provides insight on customer
satisfaction
Slide 15
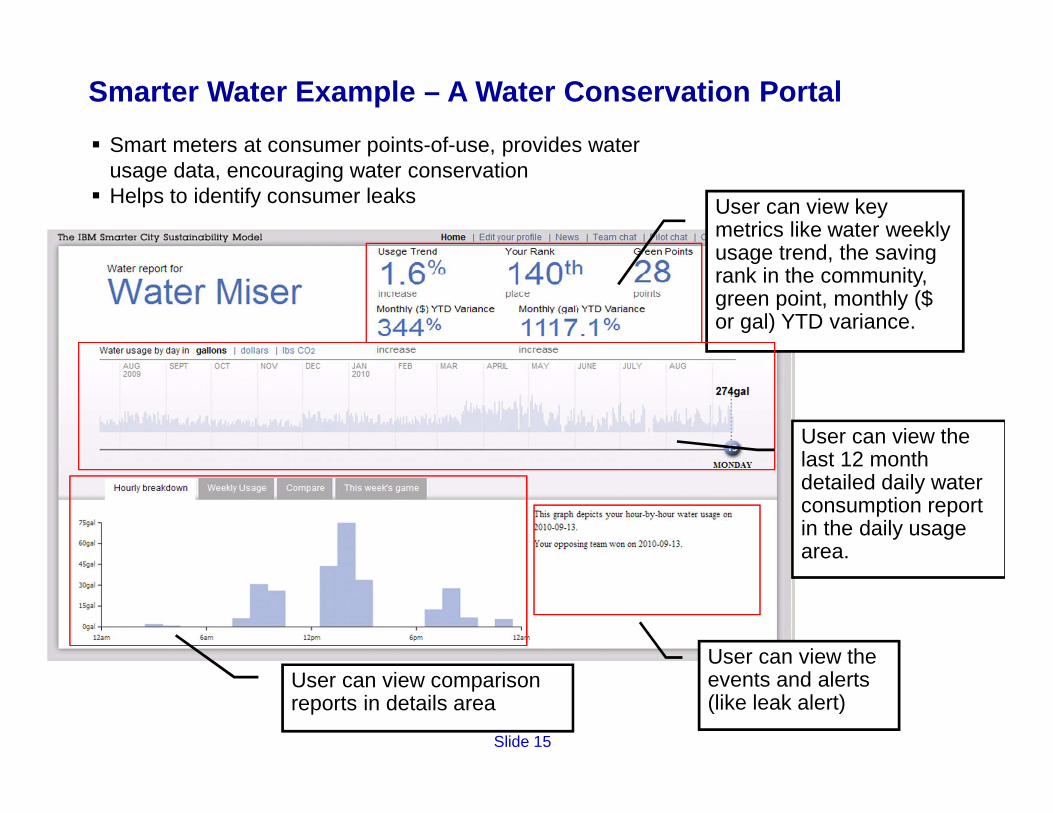
Smarter Water Example – A Water Conservation Portal
User can view key metrics like water weekly usage trend, the saving rank in the community, green point, monthly ($ or gal) YTD variance.
User can view the last 12 month detailed daily water consumption report in the daily usage area.
User can view the events and alerts (like leak alert)
User can view comparison reports in details area
� Smart meters at consumer points-of-use, provides water usage data, encouraging water conservation
� Helps to identify consumer leaks
Slide 16
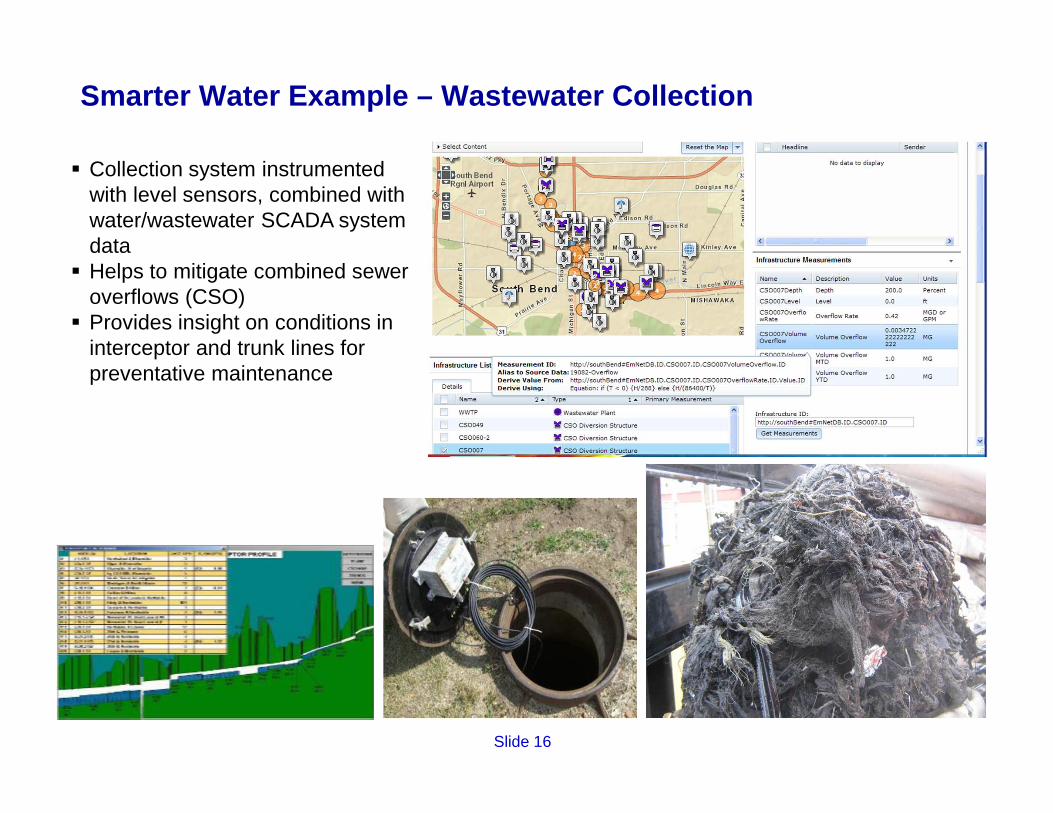
Smarter Water Example – Wastewater Collection
� Collection system instrumented with level sensors, combined with water/wastewater SCADA system data
� Helps to mitigate combined sewer overflows (CSO)
� Provides insight on conditions in interceptor and trunk lines for preventative maintenance
Slide 17
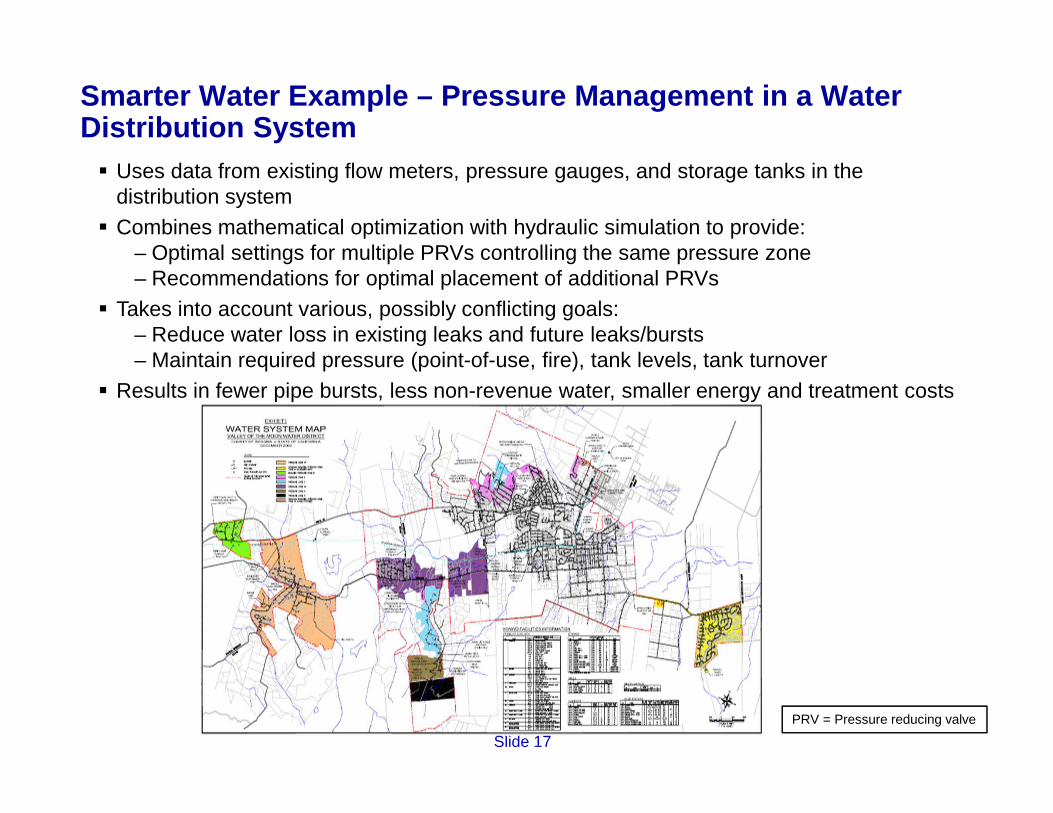
Smarter Water Example – Pressure Management in a Wat er Distribution System� Uses data from existing flow meters, pressure gauges, and storage tanks in the
distribution system� Combines mathematical optimization with hydraulic simulation to provide:
– Optimal settings for multiple PRVs controlling the same pressure zone– Recommendations for optimal placement of additional PRVs
� Takes into account various, possibly conflicting goals:– Reduce water loss in existing leaks and future leaks/bursts– Maintain required pressure (point-of-use, fire), tank levels, tank turnover
� Results in fewer pipe bursts, less non-revenue water, smaller energy and treatment costs
PRV = Pressure reducing valve
Slide 18
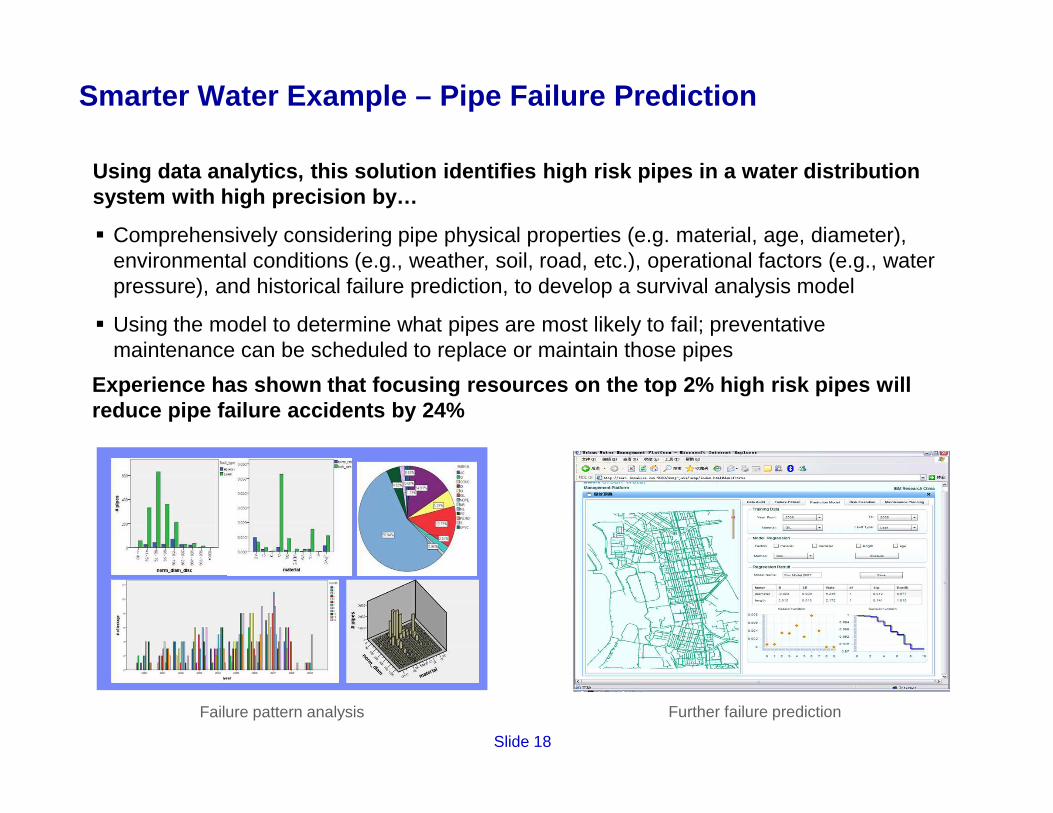
Smarter Water Example – Pipe Failure Prediction
� Comprehensively considering pipe physical properties (e.g. material, age, diameter), environmental conditions (e.g., weather, soil, road, etc.), operational factors (e.g., water pressure), and historical failure prediction, to develop a survival analysis model
� Using the model to determine what pipes are most likely to fail; preventative maintenance can be scheduled to replace or maintain those pipes
Failure pattern analysis Further failure prediction
Using data analytics, this solution identifies high risk pipes in a water distribution system with high precision by…
Experience has shown that focusing resources on the top 2% high risk pipes will reduce pipe failure accidents by 24%
Slide 19
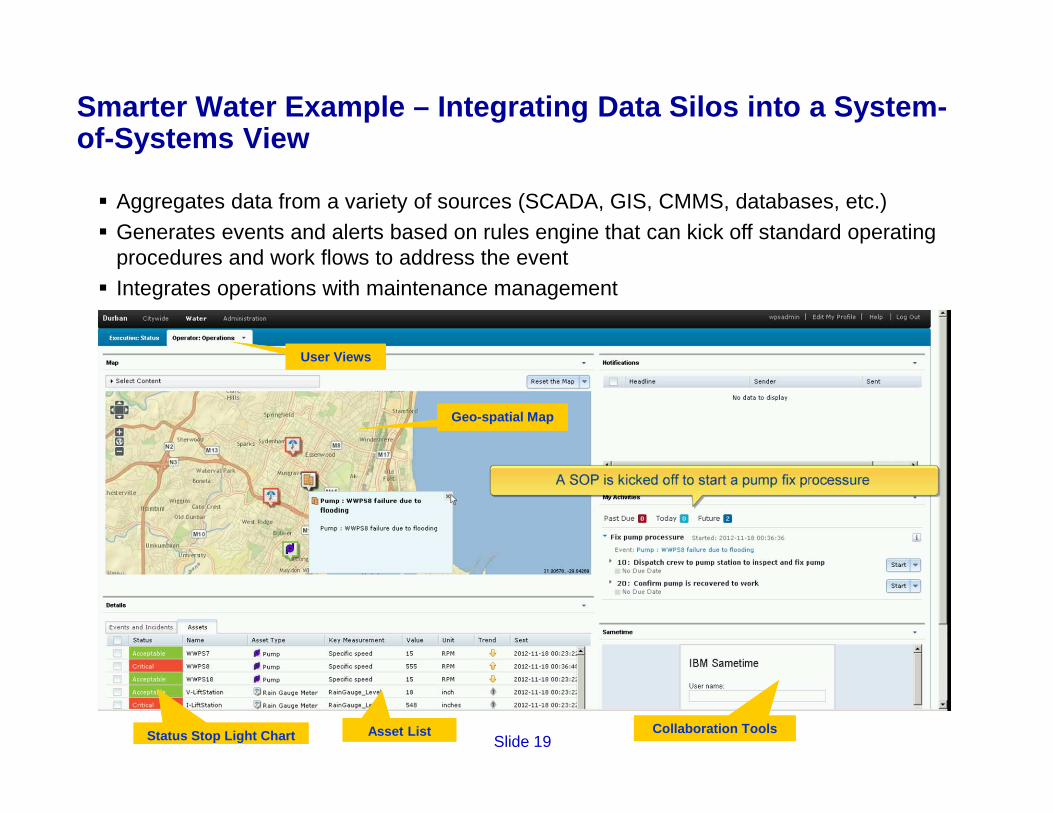
Smarter Water Example – Integrating Data Silos into a System -of-Systems View
Collaboration ToolsAsset List
Geo-spatial Map
User Views
Status Stop Light Chart
� Aggregates data from a variety of sources (SCADA, GIS, CMMS, databases, etc.)� Generates events and alerts based on rules engine that can kick off standard operating
procedures and work flows to address the event� Integrates operations with maintenance management

Slide 20
Summary
Innovative Water Management Technologies can help a ddress water challenges
1.Crumbling infrastructure2.Stormwater and wastewater management3.Water scarcity, conservation and non-revenue water
Innovation requires complementing traditional engine ering solutions to include data aggregation, visualization and anal ytics to stimulate new insights (Smarter Water Management)
� Volumes of water data exist in organizational silos– SCADA, GIS, CMMS, LIMS data– Web-based data (USGS, US Army Corps of Engineers, National Weather Service)
� Creating a “system-level view” can create new insights– For more efficient operations– For planning activities
� Data visualization can quickly determine trends
� Analytics applied to basic data can detect patterns and anomalies and may optimize outcomes