Embed Size (px)
Citation preview
MUNICIPAL WASTEWATER TREATMENT PLANT ENERGY EVALUATION
FOR TOWN OF TONAWANDA WASTEWATER TREATMENT PLANT
Agreement No. 7185
Prepared for
THE NEW YORK STATE ENERGY RESEARCH AND DEVELOPMENT AUTHORITY
Albany, NY
Prepared by
MALCOLM PIRNIE, INC. Buffalo, NY
Final October 2005
2255-063 i Wastewater Treatment Plant NYSERDA Submetering Town of Tonawanda
TABLE OF CONTENTS Section Page 1 INTRODUCTION ............................................................................................................................................ 1-1
1.1 Overall Project Description .............................................................................................................. 1-1 1.2 Facility Background .......................................................................................................................... 1-1 1.3 Scope and Objectives ....................................................................................................................... 1-2
1.3.1 Review of Historical Plant Performance and Energy Usage Data............................ 1-2 1.3.2 Electric Submetering....................................................................................................... 1-3 1.3.3 Identification of Energy Saving Opportunities through Equipment Replacement or Modification.................................................................... 1-4 1.3.4 Identification of Energy Savings Opportunities through Operational Changes ...................................................................................................... 1-4
2 CURRENT AND HISTORICAL OPERATIONS.......................................................................................... 2-1
2.1 Existing Treatment Processes .......................................................................................................... 2-1 2.1.1 Preliminary Screening..................................................................................................... 2-1 2.1.2 Influent Wastewater Pumping ...................................................................................... 2-1 2.1.3 Aerated Grit Removal..................................................................................................... 2-1 2.1.4 Secondary Treatment ..................................................................................................... 2-1 2.1.5 Solids Contact Clarification........................................................................................... 2-2 2.1.6 Tertiary Sand Filtration .................................................................................................. 2-2 2.1.7 Chlorine Disinfection...................................................................................................... 2-2 2.1.8 Solids Handling............................................................................................................... 2-3
2.2 Historical Energy Usage and Utility Billing................................................................................... 2-4 2.3 Natural Gas Summary ........................................................................................................................ 2-4 2.4 Summary of Energy Costs ................................................................................................................ 2-5 2.5 Summary of Historical Loadings and Effluent Quality................................................................. 2-5
3 ELECTRIC SUBMETERING PROGRAM..................................................................................................... 3-1
3.1 Description of Submetering Program and Submeter Locations.................................................. 3-1 3.1.1 Description of Program.................................................................................................. 3-1 3.1.2 Submeter Locations........................................................................................................ 3-1
3.2 Summary of Site Audit ...................................................................................................................... 3-2 3.3 Summary of Continuous Submetering............................................................................................ 3-2
3.3.1 High Pressure Service Water Pump ............................................................................. 3-2 3.3.2 Influent Wastewater Pumps.......................................................................................... 3-3 3.3.3 Incinerator Induced Draft Fan....................................................................................... 3-4 3.3.4 Zimpro Motor Control Feeders ..................................................................................... 3-4 3.3.5 Zimpro Fume Fan ............................................................................................................ 3-5
3.4 Summary of Instantaneous Submetering....................................................................................... 3-5 3.5 Summary of Entire Submetering Program....................................................................................... 3-6
4 PROCESS PERFORMANCE DURING SUBMETERING............................................................................ 4-1
4.1 Summary of Process Parameter Monitoring .................................................................................. 4-1 4.2 Relationship between Plant Process Data and Submetering Data............................................. 4-2
4.2.1 Main Influent Wastewater Pumps................................................................................ 4-2 4.2.2 High Pressure Service Water Pumps ........................................................................... 4-3 4.2.3 High Purity Oxygen Reactor (UNOX).......................................................................... 4-3
2255-063 ii Wastewater Treatment Plant NYSERDA Submetering Town of Tonawanda
TABLE OF CONTENTS (continued) Section Page
4.2.4 Return Activated Sludge Pumps .................................................................................. 4-3 4.2.5 Monomedia Filtration..................................................................................................... 4-4 4.2.6 Solids Handling............................................................................................................... 4-4 4.2.6.1 Waste Activated Sludge/Thickening .......................................................................... 4-4 4.2.6.2 Zimpro Wet Air Oxidation ............................................................................................. 4-5 4.2.6.3 Vacuum Filtration............................................................................................................ 4-5 4.2.6.4 Incinerator and Associated Solids Handling Equipment.......................................... 4-5 4.2.7 Other Equipment ............................................................................................................. 4-6
5 ENERGY SAVING MEASURES THROUGH CAPITAL IMPROVEMENTS........................................... 5-1
5.1 Capital Improvement Alternatives to Reduce Energy Usage and Costs .................................. 5-1 5.1.1 Replacement of Existing Sludge Stabilization and Dewatering Facilities with High Speed Dewatering Centrifuges ................................................................... 5-1 5.1.2 Modification or Replacement of UNOX Mixers with More Efficient Mixing Equipment........................................................................................................... 5-2 5.1.3 Replacement of Existing Cryogenic Oxygen Generation System with Vacuum-Assisted Pressure Swing Adsorption Technology................................... 5-2 5.1.4 High Pressure Service Water Pump Modifications ................................................... 5-3 5.1.5 Replacement of Constant Speed Standard Efficiency Motors with Premium Efficiency Motors ........................................................................................... 5-3
5.2 Estimate of Energy Usage, Demand, and Cost Savings .............................................................. 5-4 5.2.1 Replacement of Existing Sludge Stabilization and Dewatering Facilities with High Speed Dewatering Centrifuges ................................................................... 5-4 5.2.2 Modification or Replacement of UNOX Mixers with More Efficient Mixing Equipment........................................................................................................... 5-5 5.2.3 Replacement of Existing Cryogenic Oxygen Generation System with Vacuum-Assisted Pressure Swing Adsorption Technology................................... 5-6 5.2.4 High Pressure Service Water Pump Modifications ................................................... 5-7 5.2.5 Replacement of Constant Speed Standard Efficiency Motors with Premium Efficiency Motors ........................................................................................... 5-9
5.3 Estimate of Capital Costs and Simple Payback............................................................................. 5-9 5.3.1 Replacement of Existing Sludge Stabilization and Dewatering Facilities with High Speed Dewatering Centrifuges ................................................................... 5-9 5.3.2 Modification or Replacement of UNOX Mixers with More Efficient Mixing Equipment......................................................................................................... 5-10 5.3.3 Replacement of Existing Cryogenic Oxygen Generation System with Vacuum-Assisted Pressure Swing Adsorption Technology................................. 5-11 5.3.4 High Pressure Service Water Pump Modifications ................................................. 5-11 5.3.5 Replacement of Constant Speed Standard Efficiency Motors with Premium Efficiency Motors ......................................................................................... 5-12
6 ENERGY SAVING MEASURES THROUGH OPERATION MODIFICATIONS.................................... 6-1
6.1 Operational Modifications to Reduce Energy Usage and Costs ............................................... 6-1 6.1.1 Load Shifting ................................................................................................................... 6-1 6.1.2 Operational Modifications............................................................................................. 6-2
7 ENERGY SAVING MEASURES THROUGH LIGHTING/HVAC MODIFICATIONS............................ 7-1
7.1 Overview............................................................................................................................................. 7-1
2255-063 iii Wastewater Treatment Plant NYSERDA Submetering Town of Tonawanda
TABLE OF CONTENTS (continued) Section Page
7.1.1 Heating, Ventilating, and Air Conditioning Overview............................................... 7-1 7.1.2 Lighting Overview........................................................................................................... 7-1 7.2 HVAC and Lighting Alternatives to Reduce Energy Usage and Costs .................................... 7-1
7.2.1 HVAC................................................................................................................................ 7-1 7.2.2 Lighting ............................................................................................................................ 7-2
8 FINAL RECOMMENDATIONS.................................................................................................................... 8-1
8.1 Summary of Evaluations................................................................................................................... 8-1 8.2 Summary of Recommendations....................................................................................................... 8-1 TABLES Table On/Follows Page 2-1 Summary of Energy Costs................................................................................................................................ 2-5 2-2 Summary of WWTP Performance – Wet Stream Process........................................................................... 2-6 2-3 Summary of WWTP Performance – Solids Handling Processes ............................................................... 2-7 3-1 List of Motors Over 5 hp.................................................................................................................................. 3-1 3-2 Summary of Influent Pumps during the Submetering Period...................................................................... 3-3 3-3 Instantaneous Power Draw Measurement and Estimates of Hours in Operation................................... 3-6 3-4 Estimates of Electric Energy Usage and Costs ............................................................................................. 3-6 3-5 Summary of Major Equipment Total Estimated Electric Energy Usage and Costs at the WWTP..................................................................................................................................................... 3-7 4-1 Summary of Town of Tonawanda WWTP Performance during the Submetering Period
Compared to Historical Data............................................................................................................................ 4-2 5-1 Estimated Post-Construction Electric Energy Profile Summary for Centrifuge Equipment.................... 5-5 5-2 Summary of Estimated Electric Energy Usage and Savings for Stabilization/Dewatering System Replacement......................................................................................................................................... 5-5 5-3 Oxygen Transfer and Mixing Requirements.................................................................................................. 5-5 5-4 Summary of Estimated Electric Energy Usage and Savings for UNOX Mixer Replacement.................. 5-6 5-5 Summary of Estimated Electric Energy Usage and Savings for Oxygen Generation System Replacement......................................................................................................................................... 5-7 5-6 Summary of Estimated Electric Energy Usage and Savings for High Pressure Service Water Pump Modifications.............................................................................................................................. 5-9 5-7 Replacement of Select Motors with Premium Efficiency Motors............................................................... 5-9 7-1 Summary of Costs and Savings for HVAC Measures ................................................................................. 7-2 7-2 Summary of Costs and Savings for all Lighting Measures......................................................................... 7-2 8-1 Summary of Energy Savings Alternatives Presented in Sections 5, 6 and 7............................................ 8-1 8-2 Summary of Recommended Alternatives....................................................................................................... 8-2
2255-063 iv Wastewater Treatment Plant NYSERDA Submetering Town of Tonawanda
TABLE OF CONTENTS (continued)
FIGURES
Figure Follows Page 2-1 WWTP Wet Stream Process Train ................................................................................................................. 2-1 2-2 Solids Handling Process Train ........................................................................................................................ 2-1 2-3 Electric Demand and Usage............................................................................................................................. 2-4 2-4 Change in Demand (2001 to 2003)................................................................................................................... 2-4 2-5 Change in Electric Usage (2002 to 2003)........................................................................................................ 2-4 2-6 Total Plant Hourly kW Draw........................................................................................................................... 2-4 2-7 Natural Gas Usage (2002 to 2003) ................................................................................................................... 2-4 2-8 Influent TSS and BOD Loading ...................................................................................................................... 2-6 2-9 Electric Demand vs. Average Plant Flow....................................................................................................... 2-6 2-10 Electric Usage vs. Average Plant Flow.......................................................................................................... 2-6 2-11 Natural Gas Usage vs. Average Plant Flow.................................................................................................. 2-6 3-1 Overall Plant Electric Demand ......................................................................................................................... 3-2 3-2 Submetering – High Pressure Service Water Pump ..................................................................................... 3-2 3-3 Submetering – Influent Pumps........................................................................................................................ 3-3 3-4 Submetering – Induced Draft Fan................................................................................................................... 3-4 3-5 Submetering – Zimpro Motor Control Center Feeders ................................................................................ 3-4 3-6 Submetering – Zimpro Fume Fan.................................................................................................................... 3-5 3-7 Distribution of Electric Energy Cost Among Processes ............................................................................. 3-7 3-8 Distribution of Electric Usage Among Solids Handling Processes........................................................... 3-8 4-1 Submetering – BOD5 vs. Flow......................................................................................................................... 4-1 4-2 Submetering – BOD5 Loading vs. Flow......................................................................................................... 4-1 4-3 Submetering – TSS vs. Flow............................................................................................................................ 4-1 4-4 Submetering – TSS Loading vs. Flow............................................................................................................ 4-1 4-5 Average Daily Flow vs. Total Electric Energy Demand by Main Influent Pumps .................................. 4-2 4-6 Service Water vs. Total Electric Energy Demand by High Pressure Service Pumps.............................. 4-3 4-7 Thickened Sludge Inflow to Zimpro vs. Zimpro System Energy Demand................................................ 4-5 4-8 Submetering – Zimpro Operation.................................................................................................................... 4-5 5-1 High Pressure Service Pump Curves .............................................................................................................. 5-7
2255-063 1-1 Town of Tonawanda NYSERDA FlexTech Services Wastewater Treatment Plant Submetering
Section 1.0
INTRODUCTION
1.1 OVERALL PROJECT DESCRIPTION
The New York State Energy Research and Development Authority (NYSERDA) is currently sponsoring a
research program to evaluate submetering at wastewater treatment plants (WWTPs) throughout New York
State. The purpose of monitoring is to obtain detailed electric power use information through submetering
various unit processes and equipment and to determine if that information is a cost-effective tool for
identifying energy conservation measures. In addition to evaluating the usefulness of submetering, a
secondary goal of the program is to identify and evaluate energy cost savings measures at WWTPs and
make the findings available to other facilities in New York State.
1.2 FACILITY BACKGROUND
The Town of Tonawanda Wastewater Treatment Plant (WWTP) receives wastewater flow from the
separate sanitary sewer system serving the Town, as well as from two tributary communities: the Village of
Kenmore and the City of Tonawanda. The Tonawanda WWTP is an advanced tertiary treatment facility
that handles an average dry weather wastewater flow of 19.7 millions per day (MGD). Wet weather flows
to the WWTP can peak as high as 75 to 80 MGD.
The Tonawanda WWTP is a SC-3A customer. Transmission is at 23,000 volts and is stepped down at the
main plant transformer to 4,160 volts (V). Five out of the six 4,160 V lines coming out of the main plant
transformer that serve the main plant are stepped-down further to fifteen 480 V lines that serve individual
motor control centers. One 4,160 V service provided to the main plant is not stepped down and serves the
cryogenic oxygen generation facility for the plant’s UNOX process. Two additional 4,160 V lines are
provided from the main plant transformer to a step-down transformer adjacent to the solids handling
building. These lines are further stepped-down to 240 V to serve various applications at the solids handling
building.
Totalizer submetering is conducted at various locations in the plant’s electrical system. These locations
include the main electrical feed to the plant, six 4,160 V lines serving the main plant and two 240 V lines
serving the solids handling building. Component level submetering is not conducted at the plant. Presently,
the facility does not have a stand-by generator. However, the Town is planning to install a 2.0 Megawatt
(MW) generator to provide stand-by power for the entire facility in 2005.
2255-063 1-2 Town of Tonawanda NYSERDA FlexTech Services Wastewater Treatment Plant Submetering
The treatment processes at the WWTP include the following:
Preliminary treatment, including mechanically cleaned bar screens and aerated grit removal
Secondary biological treatment using high purity oxygen reactors (UNOX), bio-clarifiers and
solids contact clarifiers
Tertiary treatment using monomedia filters
Disinfection using chlorine gas
Solids handling consisting of sludge thickening, sludge stabilization using Zimpro, dewatering
using vacuum filters, and on-site incineration
A more detailed description of the Tonawanda treatment processes is presented in Section 2.0 of this report.
1.3 SCOPE AND OBJECTIVES
This study involved the following activities as part of the overall electric and natural gas use assessment
and electric submetering program.
1.3.1 Review of Historical Plant Performance and Energy Use Data
Data were obtained from the WWTP to establish a baseline for plant performance and energy usage at the
Town of Tonawanda WWTP. The baseline seeks to separate improvements related to power savings from
those that result from exogenous effects, such as changes in influent water quality, seasonal, and weekly
cycles, and/or energy market changes.
Data obtained from the Town’s WWTP included:
Average, minimum, and maximum daily flow.
Influent and final effluent total suspended solids (TSS) and biochemical oxygen demand (BOD).
Mixed liquor suspended solids (MLSS).
Return activated sludge (RAS) flow and TSS.
Waste activated sludge (WAS) flow.
Thickened sludge quantities and TSS concentration; thickened sludge pump operating records.
Zimpro effluent TSS and volatile suspended solids (VSS)
Vacuum filter operating records (number of units in operation, operating hours, sludge quantities
and solids percentage)
Incinerator operating records (number of units in operation, operating hours, sludge quantities and
solids percentage).
Plant service water flows and pressures, plant water pump operating records.
Oxygen generation data (quantity and purity).
2255-063 1-3 Town of Tonawanda NYSERDA FlexTech Services Wastewater Treatment Plant Submetering
Historical energy usage, including available metered data, two years of utility bills, and any
process changes recently undertaken or contemplated.
Recent energy consumption data for non-electric accounts, including natural gas.
Preventive and corrective maintenance records.
1.3.2 Electric Submetering
Continuous submetering and instantaneous power draw measurements were completed to assess the typical
electric usage of some of the larger motors (greater than 5 hp) at the WWTP. Continuous submetering
locations were selected based on the information gained during the site energy audit so that the larger and
most energy-intensive motors could be metered. Instantaneous power draw measurements were also
obtained on additional motors, particularly those that operated on a set schedule at a constant speed.
The continuous submetering data were used to capture diurnal variations in electric demand for major
pieces of equipment, as well as to provide a representative sample of energy usage, including electric
demand, as equipment cycles on and off. The following data were recorded at each location:
Load factor
Power factor
Demand (kW)
Usage (kWh)
Instantaneous submetering was conducted during a one-day site visit and the data were used to verify
expected energy demand at the treatment plant, as well as monitor changes in demand as equipment is
cycled on and off.
In addition, process data were collected for the duration of the submetering period including:
Service water pressure and flow.
Service water pump operating hours.
Sludge pump operating records (on and off times for WAS, RAS, and thickened sludge pump in
operation).
Zimpro and vacuum filter equipment on and off time.
Oxygen purity and quantity.
Vent gas purity.
Diurnal BOD concentrations on a bi-hourly basis for a two-day duration.
The process data collected were used to correlate electric energy usage to equipment operation and process
performance, and to evaluate energy savings opportunities through equipment replacement or modification
2255-063 1-4 Town of Tonawanda NYSERDA FlexTech Services Wastewater Treatment Plant Submetering
(Task 4) and through operational changes (Task 5). The data will also be used to establish basic energy
performance measures (metrics) for comparison of energy usage at the Town of Tonawanda WWTP to that
of other WWTPs in New York State.
1.3.3 Identification of Energy Saving Opportunities through Equipment Replacement or
Modification
Energy savings opportunities resulting from equipment replacement and/or process modification were
identified based on review of the submetering data. Some of these opportunities, while they may consume
more energy than existing process, may also serve to improve treatment at the plant, thereby saving
operational dollars in the plant’s overall budget.
1.3.4 Identification of Energy Savings Opportunities through Operational Changes
The submetering data were further reviewed to assess the impact of demand throughout the course of the
day and examined for energy saving opportunities through load shifting, peak shaving, and greater use of
real-time data in energy-related decision-making.
Load shifting would involve changing the time of use of certain loads to reduce the total facility demand
during peak periods in an attempt to reduce demand charges. Load shifting opportunities were evaluated
for major equipment. Peak shaving is the practice of dispatching on-site generating assets to reduce
dependence on the grid during peak demand periods. However, because Tonawanda currently does not
have on-site generation capabilities, peak shaving opportunities were not evaluated as part of this study.
This report summarizes the data evaluation and offers recommendations for opportunities to reduce energy
usage and thereby reduce costs at the Town of Tonawanda WWTP.
2255-063 2-1 Town of Tonawanda NYSERDA FlexTech Services Wastewater Treatment Plant Submetering
Section 2.0
CURRENT AND HISTORICAL OPERATIONS
This section presents a brief description of the existing treatment processes at the Town of Tonawanda
Wastewater Treatment Plant (WWTP), historical implementation of energy saving measures and the
resulting effect on effluent quality.
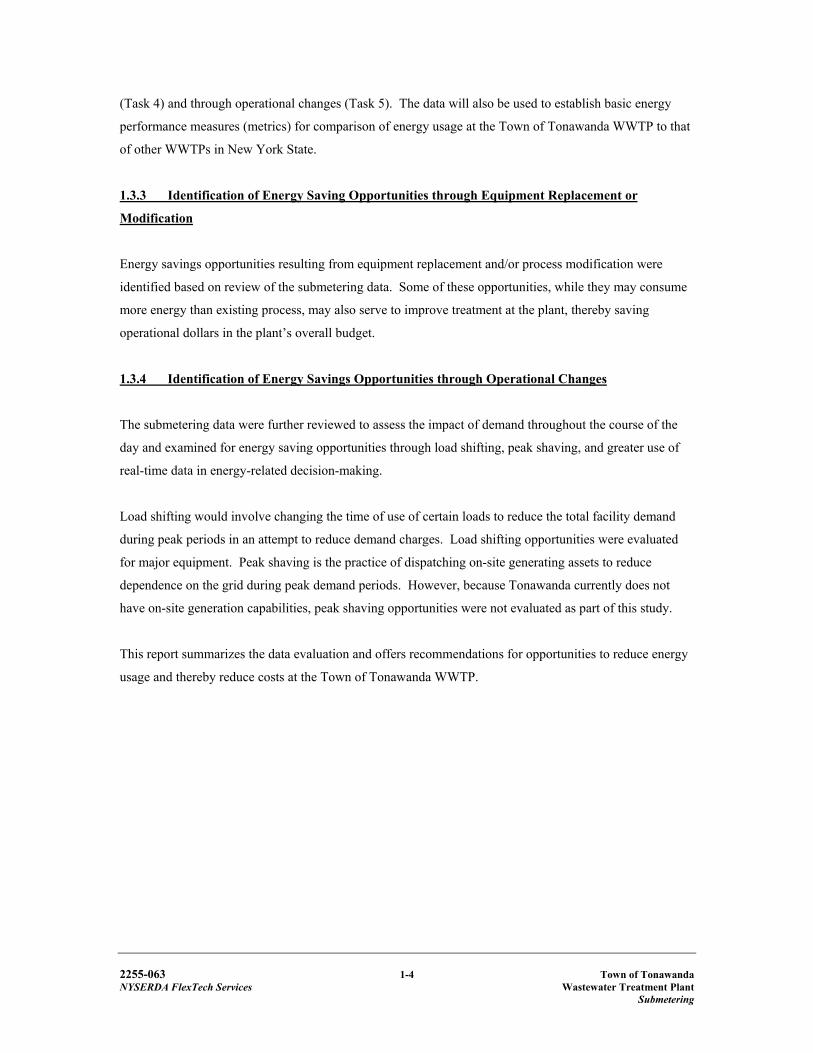
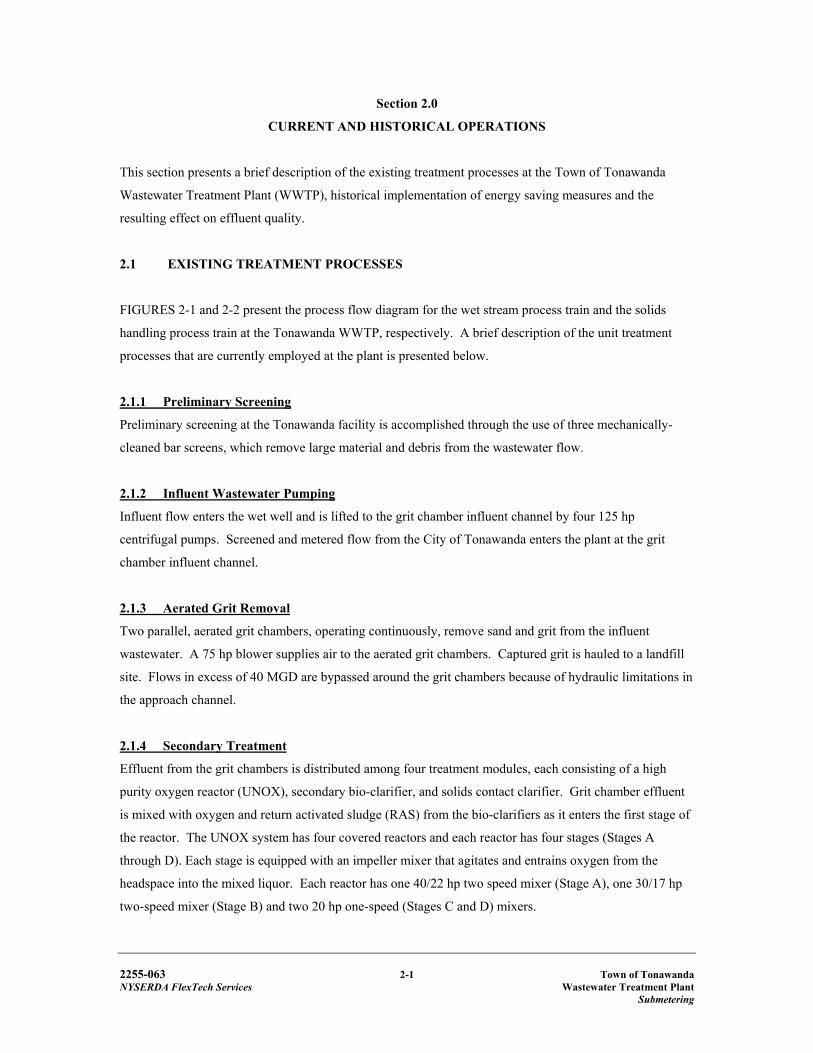
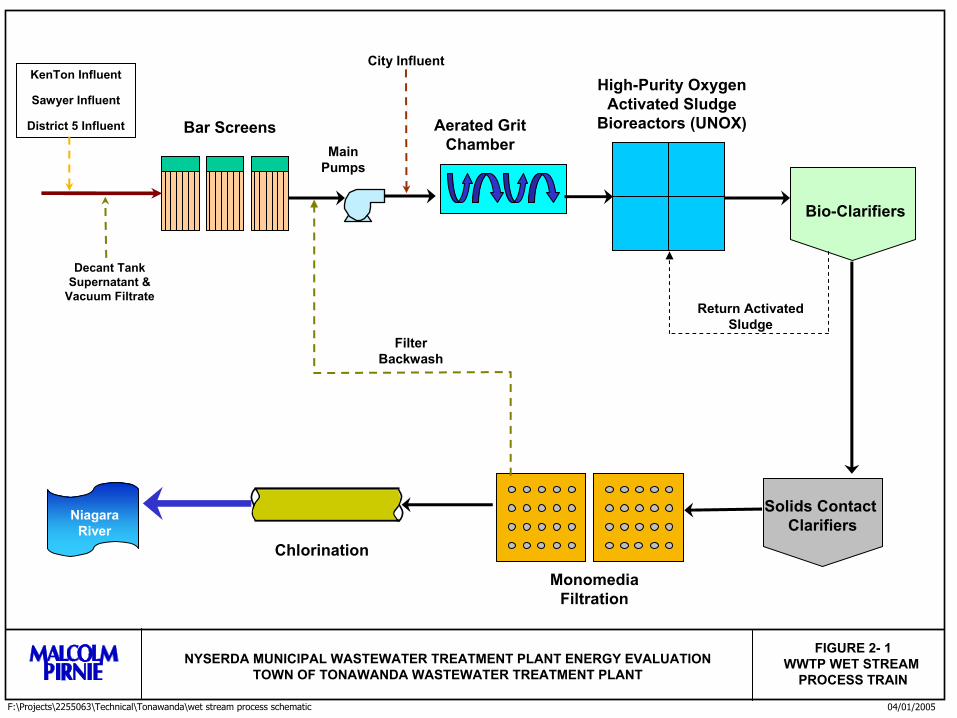
2.1 EXISTING TREATMENT PROCESSES
FIGURES 2-1 and 2-2 present the process flow diagram for the wet stream process train and the solids
handling process train at the Tonawanda WWTP, respectively. A brief description of the unit treatment
processes that are currently employed at the plant is presented below.
2.1.1 Preliminary Screening
Preliminary screening at the Tonawanda facility is accomplished through the use of three mechanically-
cleaned bar screens, which remove large material and debris from the wastewater flow.
2.1.2 Influent Wastewater Pumping
Influent flow enters the wet well and is lifted to the grit chamber influent channel by four 125 hp
centrifugal pumps. Screened and metered flow from the City of Tonawanda enters the plant at the grit
chamber influent channel.
2.1.3 Aerated Grit Removal
Two parallel, aerated grit chambers, operating continuously, remove sand and grit from the influent
wastewater. A 75 hp blower supplies air to the aerated grit chambers. Captured grit is hauled to a landfill
site. Flows in excess of 40 MGD are bypassed around the grit chambers because of hydraulic limitations in
the approach channel.
2.1.4 Secondary Treatment
Effluent from the grit chambers is distributed among four treatment modules, each consisting of a high
purity oxygen reactor (UNOX), secondary bio-clarifier, and solids contact clarifier. Grit chamber effluent
is mixed with oxygen and return activated sludge (RAS) from the bio-clarifiers as it enters the first stage of
the reactor. The UNOX system has four covered reactors and each reactor has four stages (Stages A
through D). Each stage is equipped with an impeller mixer that agitates and entrains oxygen from the
headspace into the mixed liquor. Each reactor has one 40/22 hp two speed mixer (Stage A), one 30/17 hp
two-speed mixer (Stage B) and two 20 hp one-speed (Stages C and D) mixers.
Solids Contact Clarifiers
Bio-Clarifiers
High-Purity Oxygen Activated Sludge
Bioreactors (UNOX)Bar Screens Aerated Grit Chamber
Chlorination
Monomedia Filtration
NiagaraRiver
City Influent
Decant Tank Supernatant &
Vacuum FiltrateReturn Activated
SludgeFilter
Backwash
KenTon Influent
Sawyer Influent
District 5 Influent
MainPumps
NYSERDA MUNICIPAL WASTEWATER TREATMENT PLANT ENERGY EVALUATIONTOWN OF TONAWANDA WASTEWATER TREATMENT PLANT
FIGURE 2- 1WWTP WET STREAM
PROCESS TRAIN
F:\Projects\2255063\Technical\Tonawanda\wet stream process schematic 04/01/2005
Ash
Bio-Clarifiers
To Landfill
WAS
Zimpro EffluentWAS
WAS – Waste Activated Sludge
Legend
Solids Contact
Clarifiers
Sludge Thickeners
Zimpro Feed
DecantTanks Vacuum
Filters
Incinerator
Dewatering Feed
Incinerator FeedZimpro Wet-Air
Oxidation
NYSERDA MUNICIPAL WASTEWATER TREATMENT PLANT ENERGY EVALUATIONTOWN OF TONAWANDA WASTEWATER TREATMENT PLANT
FIGURE 2- 2SOLIDS HANDLING
PROCESS TRAIN
F:\Projects\2255063\Technical\Tonawanda\solids_handling_flow_diagram 04/01/2005

2255-063 2-2 Town of Tonawanda NYSERDA FlexTech Services Wastewater Treatment Plant Submetering
Effluent from the UNOX reactors is conveyed by gravity to the four bio-clarifiers, which provide
secondary settling of the mixed liquor. A portion of the settled activated sludge is wasted and the
remaining portion is recycled back to the first stage of the UNOX reactor as RAS.
2.1.5 Solids Contact Clarification
Effluent from the bio-clarifiers flows by gravity into four square solids contact clarifiers. The original
purpose of the solids contact clarifiers was to provide phosphorous removal by chemical precipitation;
however, this is now accomplished by adding ferrous chloride to the wastewater in the collection system.
By doing so, excess phosphorous is precipitated in the bio-clarifiers. The solids contact clarifiers now
provide additional settling of the solids in the bio-clarifier effluent and capture of solids washed out from
the bio-clarifiers during high (storm induced) flows. Typically, flows above approximately 60 MGD are
bypassed around the solids contact clarifiers.
2.1.6 Tertiary Sand Filtration
Effluent from the solids contact tanks is applied to the sand filters to remove additional suspended solids.
There are four filters for each treatment module, with a total of 16 monomedia filters. The filter influent
channel arrangement allows for redistribution of the effluent from the solids contact clarifier tanks among
any number of filters. The filters are backwashed using plant effluent by two 50 hp centrifugal backwash
pumps. Backwash wastewater is returned to the main pump wet well. Flows above 48 MGD are bypassed
around the sand filters.
2.1.7 Chlorine Disinfection
Effluent from the sand filters is disinfected, metered, and discharged to the Niagara River through the
WWTP outfall pipe. Chlorine gas is used to provide disinfection at the WWTP and is added upstream of
the Parshall flume in the effluent channel. The chlorine contact time required for effluent disinfection is
provided in the outfall pipe.
2.1.8 Solids Handling
The waste activated sludge (WAS) from the secondary bio-clarifier is pumped to the sludge thickening
tanks (gravity) by eight 40 hp centrifugal sludge pumps. Waste sludge from the solids contact clarifiers is
also conveyed to the sludge thickening tanks. The thickened sludge is mixed with scum from the scum
holding tank and is pumped to Zimpro (via three 5 hp duplex plunger pumps with two 15 hp sludge
grinders). Zimpro is a high pressure and temperature stabilization process used to make the biological
sludge and scum mixture more dewaterable. The major electrical components in the Zimpro process
include six 40 hp high-pressure pumps, three 60 hp compressors, two 15 hp boiler motors, one 20 hp
solvent pump and one 30 hp fume fan. Stabilized sludge from this process is transferred to the decant tanks
for solids/liquid separation prior to dewatering. Sludge from the decant tanks is pumped to a sludge well
2255-063 2-3 Town of Tonawanda NYSERDA FlexTech Services Wastewater Treatment Plant Submetering
and then to the vacuum filters. The Town seasonally cycles dewatering processing between one larger
vacuum filter (one 75 hp vacuum pump) and three smaller vacuum filters (three 40 hp vacuum pumps).
The larger vacuum filter is typically used to dewater sludge during the six winter months, and the three
smaller vacuum filters are used during the six summer months. The vacuum filters dewater sludge and
produce a filter cake that is incinerated on site. Vacuum filtrate is returned to the head of the plant along
with decant supernatant. The major electrical components of the incineration facilities include one 125 hp
induced draft fan and one 40 hp fuel combustion air fan. Incinerator ash is trucked to a landfill for
disposal.
The wastewater at the Tonawanda WWTP consists of 85% residential and 15% industrial waste. There are
13 Significant Industrial Users (SUIs) in the Town. The plant is staffed 24 hours a day, seven days a week.
The Town has a staff of 16 operators, each of which is responsible for all processes that go on within the
plant (wet and dry stream processes). The number of operators staffed per shift is dependent on the day of
the week due to the weekly sludge-processing schedule. There are five operators per shift from Monday
through Wednesday, whereas there are three or four operators per shift on Thursday and Friday. On
weekends, two to three operators per shift are staffed. Sludge is typically processed and incinerated
Monday through Thursday each week.
Four 60 hp high-pressure pumps provide service water to the plant and two 15 hp low-pressure pumps
provide make-up water for the gravity thickeners. Typically, three high-pressure pumps and one low-
pressure pump are in operation.
2.2 HISTORICAL ENERGY USAGE AND UTILITY BILLING
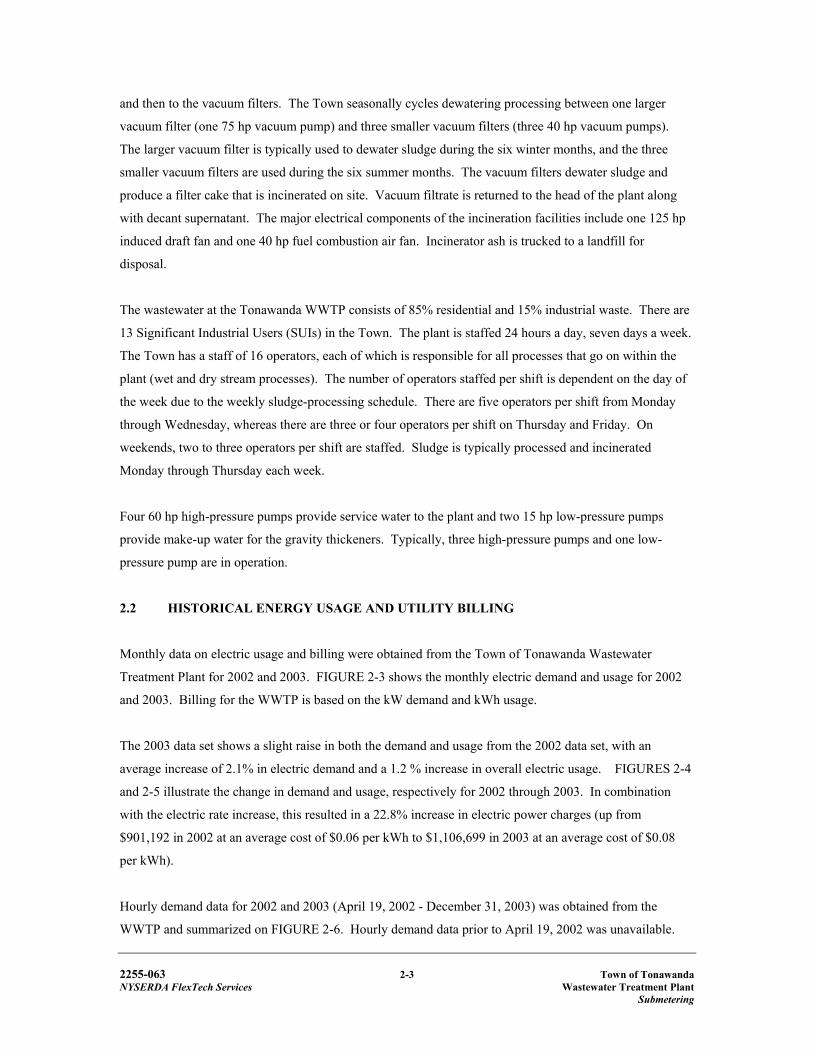
Monthly data on electric usage and billing were obtained from the Town of Tonawanda Wastewater
Treatment Plant for 2002 and 2003. FIGURE 2-3 shows the monthly electric demand and usage for 2002
and 2003. Billing for the WWTP is based on the kW demand and kWh usage.
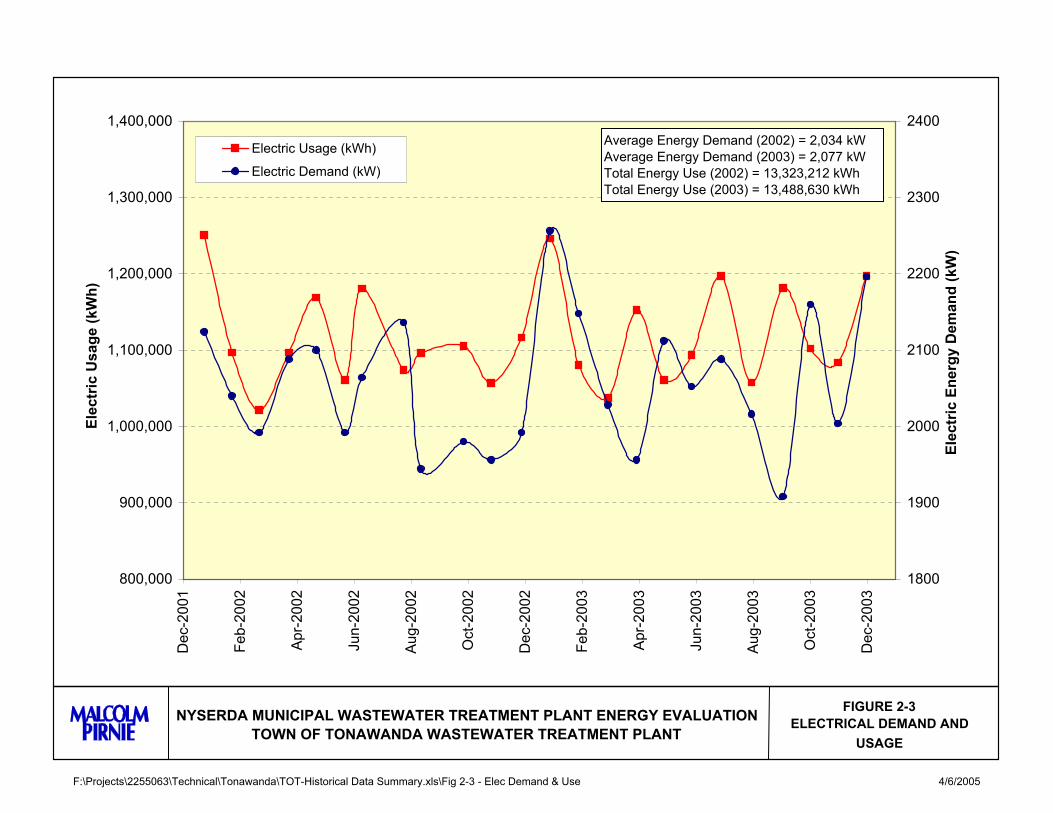
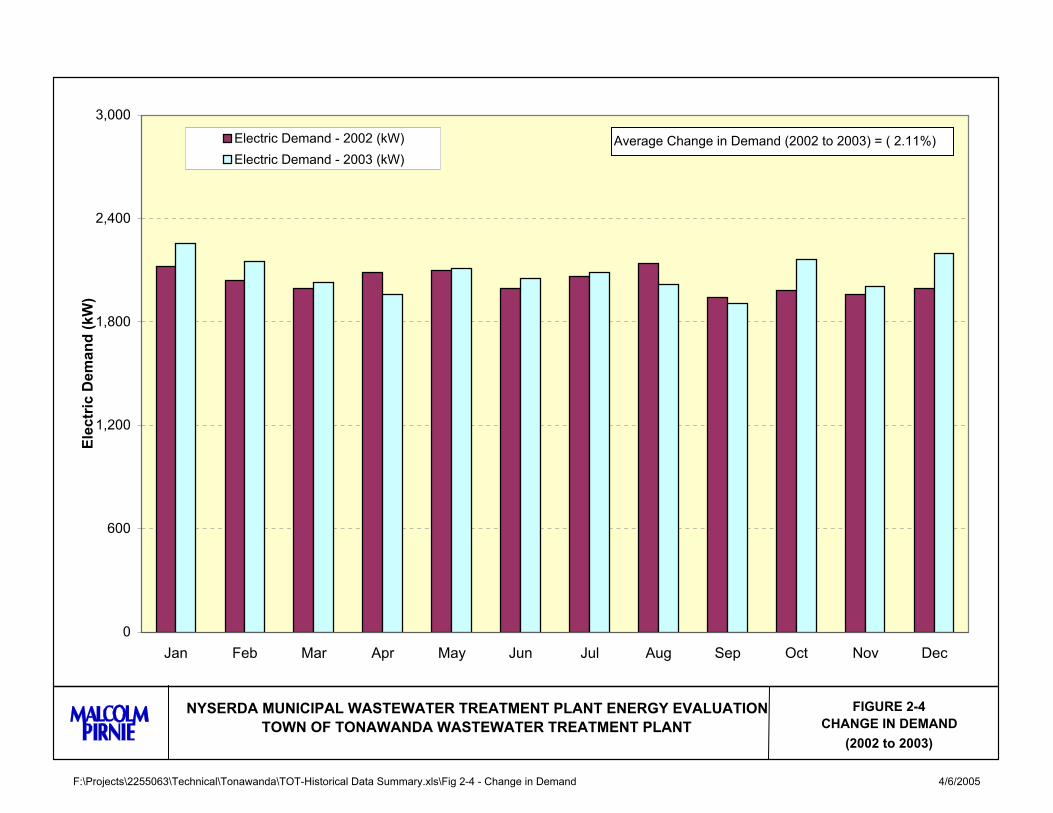
The 2003 data set shows a slight raise in both the demand and usage from the 2002 data set, with an
average increase of 2.1% in electric demand and a 1.2 % increase in overall electric usage. FIGURES 2-4
and 2-5 illustrate the change in demand and usage, respectively for 2002 through 2003. In combination
with the electric rate increase, this resulted in a 22.8% increase in electric power charges (up from
$901,192 in 2002 at an average cost of $0.06 per kWh to $1,106,699 in 2003 at an average cost of $0.08
per kWh).
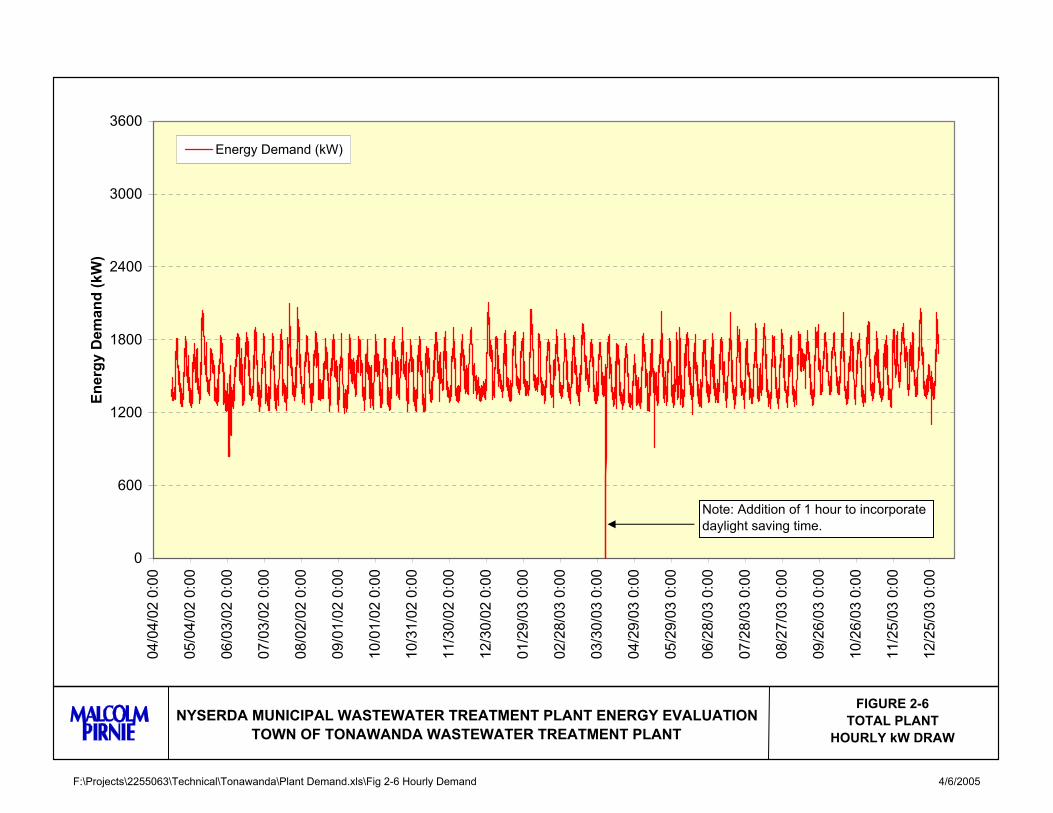
Hourly demand data for 2002 and 2003 (April 19, 2002 - December 31, 2003) was obtained from the
WWTP and summarized on FIGURE 2-6. Hourly demand data prior to April 19, 2002 was unavailable.
F:\Projects\2255063\Technical\Tonawanda\TOT-Historical Data Summary.xls\Fig 2-3 - Elec Demand & Use 4/6/2005
FIGURE 2-3ELECTRICAL DEMAND AND
USAGE
NYSERDA MUNICIPAL WASTEWATER TREATMENT PLANT ENERGY EVALUATIONTOWN OF TONAWANDA WASTEWATER TREATMENT PLANT
800,000
900,000
1,000,000
1,100,000
1,200,000
1,300,000
1,400,000
Dec
-200
1
Feb-
2002
Apr-
2002
Jun-
2002
Aug-
2002
Oct
-200
2
Dec
-200
2
Feb-
2003
Apr-
2003
Jun-
2003
Aug-
2003
Oct
-200
3
Dec
-200
3
Elec
tric
Usa
ge (k
Wh)
1800
1900
2000
2100
2200
2300
2400
Elec
tric
Ene
rgy
Dem
and
(kW
)
Electric Usage (kWh)
Electric Demand (kW)
Average Energy Demand (2002) = 2,034 kWAverage Energy Demand (2003) = 2,077 kWTotal Energy Use (2002) = 13,323,212 kWhTotal Energy Use (2003) = 13,488,630 kWh
F:\Projects\2255063\Technical\Tonawanda\TOT-Historical Data Summary.xls\Fig 2-4 - Change in Demand 4/6/2005
0
600
1,200
1,800
2,400
3,000
Jan Feb Mar Apr May Jun Jul Aug Sep Oct Nov Dec
Elec
tric
Dem
and
(kW
)
Electric Demand - 2002 (kW)Electric Demand - 2003 (kW)
Average Change in Demand (2002 to 2003) = ( 2.11%)
FIGURE 2-4CHANGE IN DEMAND
(2002 to 2003)
NYSERDA MUNICIPAL WASTEWATER TREATMENT PLANT ENERGY EVALUATIONTOWN OF TONAWANDA WASTEWATER TREATMENT PLANT
F:\Projects\2255063\Technical\Tonawanda\TOT-Historical Data Summary.xls\Fig 2-5 - Change in Usage 4/6/2005
FIGURE 2-5CHANGE IN USAGE
(2002 to 2003)
NYSERDA MUNICIPAL WASTEWATER TREATMENT PLANT ENERGY EVALUATIONTOWN OF TONAWANDA WASTEWATER TREATMENT PLANT
0
200,000
400,000
600,000
800,000
1,000,000
1,200,000
1,400,000
1,600,000
Jan Feb Mar Apr May Jun Jul Aug Sep Oct Nov Dec
Elec
tric
Usa
ge (k
Wh)
Electric Usage - 2002 (kWh)
Electric Usage - 2003 (kWh)Average Change in Usage (2002 to 2003) = (1.24%)
F:\Projects\2255063\Technical\Tonawanda\Plant Demand.xls\Fig 2-6 Hourly Demand 4/6/2005
FIGURE 2-6TOTAL PLANT
HOURLY kW DRAWNYSERDA MUNICIPAL WASTEWATER TREATMENT PLANT ENERGY EVALUATION
TOWN OF TONAWANDA WASTEWATER TREATMENT PLANT
0
600
1200
1800
2400
3000
3600
04/0
4/02
0:0
0
05/0
4/02
0:0
0
06/0
3/02
0:0
0
07/0
3/02
0:0
0
08/0
2/02
0:0
0
09/0
1/02
0:0
0
10/0
1/02
0:0
0
10/3
1/02
0:0
0
11/3
0/02
0:0
0
12/3
0/02
0:0
0
01/2
9/03
0:0
0
02/2
8/03
0:0
0
03/3
0/03
0:0
0
04/2
9/03
0:0
0
05/2
9/03
0:0
0
06/2
8/03
0:0
0
07/2
8/03
0:0
0
08/2
7/03
0:0
0
09/2
6/03
0:0
0
10/2
6/03
0:0
0
11/2
5/03
0:0
0
12/2
5/03
0:0
0
Ener
gy D
eman
d (k
W)
Energy Demand (kW)
Note: Addition of 1 hour to incorporate daylight saving time.
2255-063 2-4 Town of Tonawanda NYSERDA FlexTech Services Wastewater Treatment Plant Submetering
From FIGURE 2-6, the hourly demand typically fluctuates between approximately 1,200 kW to 1,800 kW.
A weekly pattern is observed with higher electric demand during the weekdays. This higher demand may
be associated with the solids handling processes during the week.
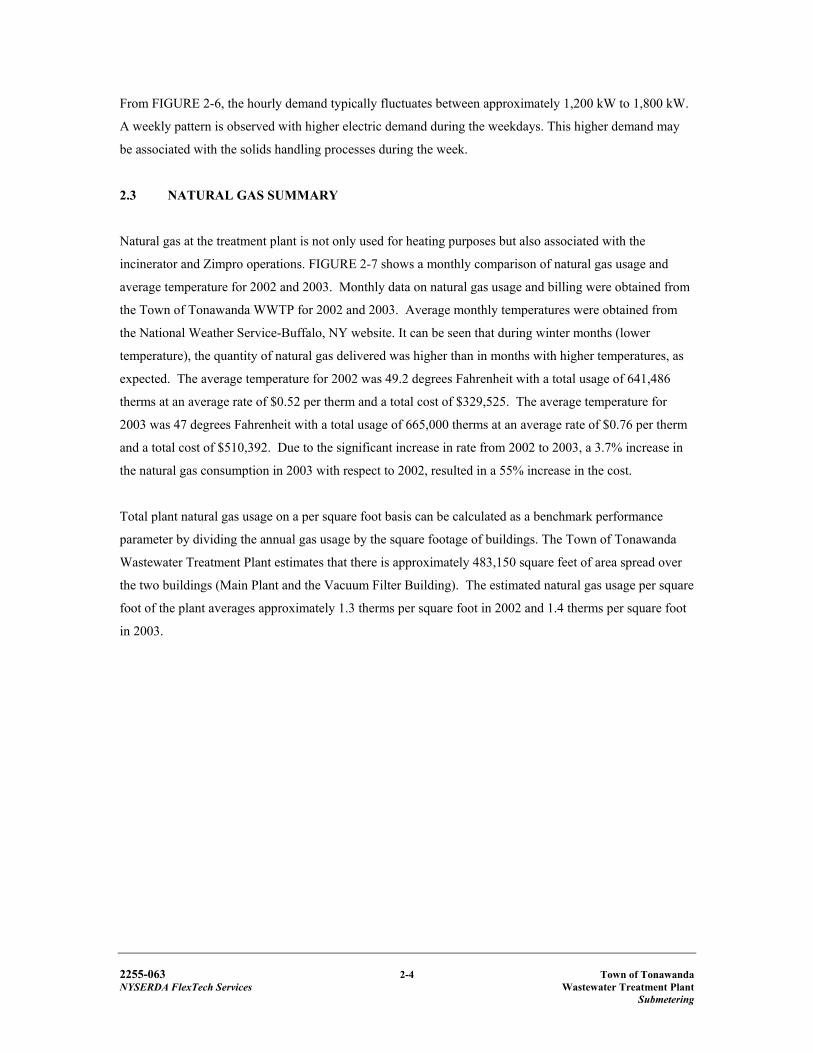
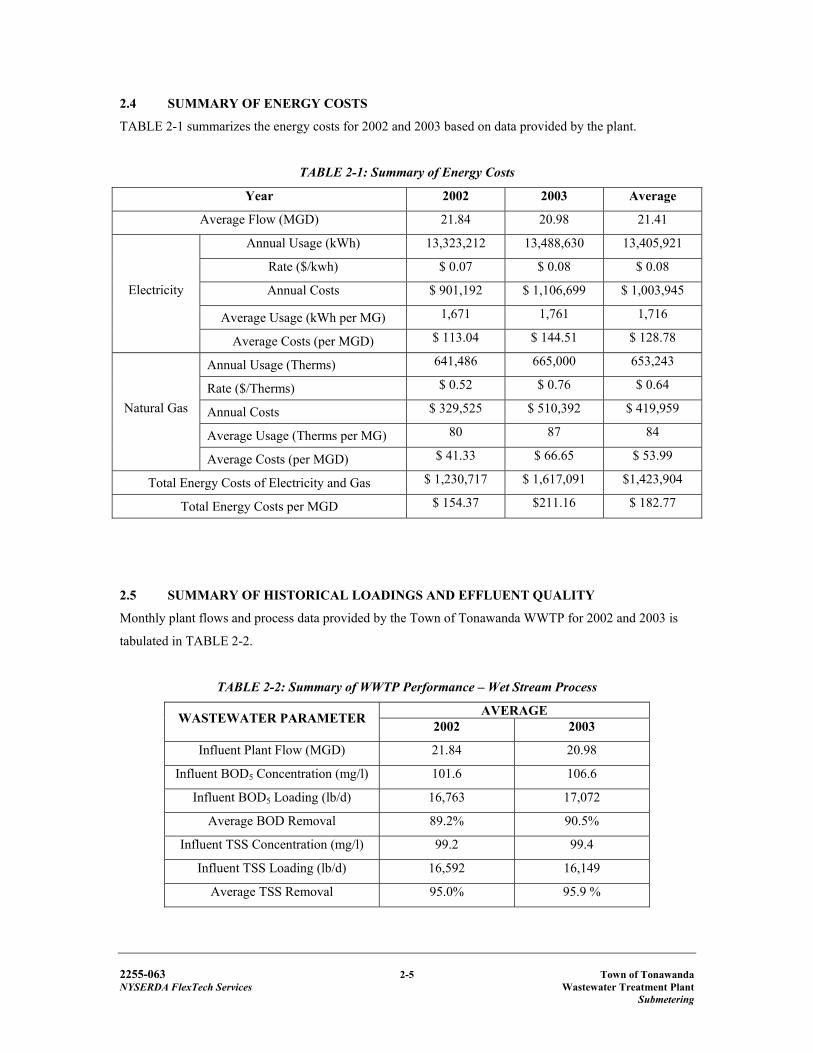
2.3 NATURAL GAS SUMMARY
Natural gas at the treatment plant is not only used for heating purposes but also associated with the
incinerator and Zimpro operations. FIGURE 2-7 shows a monthly comparison of natural gas usage and
average temperature for 2002 and 2003. Monthly data on natural gas usage and billing were obtained from
the Town of Tonawanda WWTP for 2002 and 2003. Average monthly temperatures were obtained from
the National Weather Service-Buffalo, NY website. It can be seen that during winter months (lower
temperature), the quantity of natural gas delivered was higher than in months with higher temperatures, as
expected. The average temperature for 2002 was 49.2 degrees Fahrenheit with a total usage of 641,486
therms at an average rate of $0.52 per therm and a total cost of $329,525. The average temperature for
2003 was 47 degrees Fahrenheit with a total usage of 665,000 therms at an average rate of $0.76 per therm
and a total cost of $510,392. Due to the significant increase in rate from 2002 to 2003, a 3.7% increase in
the natural gas consumption in 2003 with respect to 2002, resulted in a 55% increase in the cost.
Total plant natural gas usage on a per square foot basis can be calculated as a benchmark performance
parameter by dividing the annual gas usage by the square footage of buildings. The Town of Tonawanda
Wastewater Treatment Plant estimates that there is approximately 483,150 square feet of area spread over
the two buildings (Main Plant and the Vacuum Filter Building). The estimated natural gas usage per square
foot of the plant averages approximately 1.3 therms per square foot in 2002 and 1.4 therms per square foot
in 2003.
F:\Projects\2255063\Technical\Tonawanda\TOT-Historical Data Summary.xls\Fig 2-7 Natural Gas Usage 4/6/2005
FIGURE 2-7NATURAL GAS USAGE
(2002 to 2003)
0
20,000
40,000
60,000
80,000
100,000
Jan Feb Mar Apr May Jun Jul Aug Sep Oct Nov Dec
Nat
ural
Gas
Usa
ge (T
herm
s)0
20
40
60
80
100
120
140
160
Ave
rage
Tem
p (D
eg. F
)
Natural Gas Usage - 2002 Natural Gas Usage - 2003 Avg. Temp - 2002 Avg. Temp - 2003
NYSERDA MUNICIPAL WASTEWATER TREATMENT PLANT ENERGY EVALUATIONTOWN OF TONAWANDA WASTEWATER TREATMENT PLANT
2255-063 2-5 Town of Tonawanda NYSERDA FlexTech Services Wastewater Treatment Plant Submetering
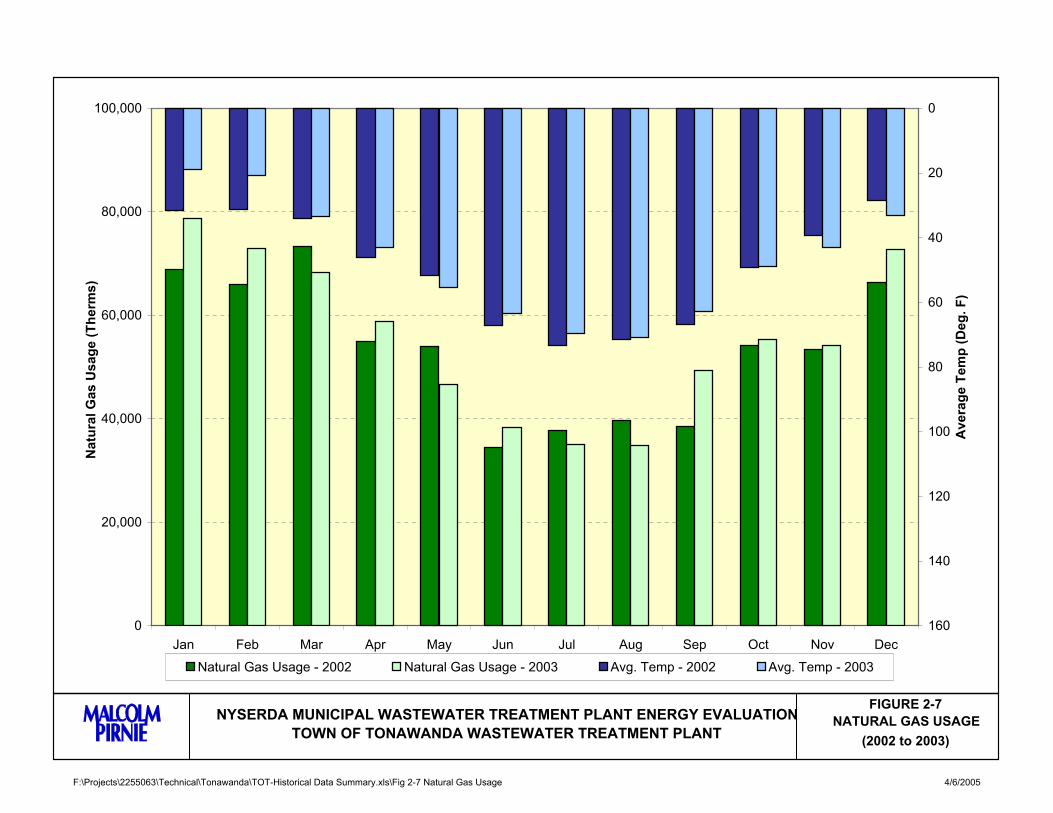
2.4 SUMMARY OF ENERGY COSTS
TABLE 2-1 summarizes the energy costs for 2002 and 2003 based on data provided by the plant.
TABLE 2-1: Summary of Energy Costs Year 2002 2003 Average
Average Flow (MGD) 21.84 20.98 21.41
Annual Usage (kWh) 13,323,212 13,488,630 13,405,921
Rate ($/kwh) $ 0.07 $ 0.08 $ 0.08
Annual Costs $ 901,192 $ 1,106,699 $ 1,003,945
Average Usage (kWh per MG) 1,671 1,761 1,716
Electricity
Average Costs (per MGD) $ 113.04 $ 144.51 $ 128.78
Annual Usage (Therms) 641,486 665,000 653,243
Rate ($/Therms) $ 0.52 $ 0.76 $ 0.64
Annual Costs $ 329,525 $ 510,392 $ 419,959
Average Usage (Therms per MG) 80 87 84
Natural Gas
Average Costs (per MGD) $ 41.33 $ 66.65 $ 53.99
Total Energy Costs of Electricity and Gas $ 1,230,717 $ 1,617,091 $1,423,904
Total Energy Costs per MGD $ 154.37 $211.16 $ 182.77
2.5 SUMMARY OF HISTORICAL LOADINGS AND EFFLUENT QUALITY
Monthly plant flows and process data provided by the Town of Tonawanda WWTP for 2002 and 2003 is
tabulated in TABLE 2-2.
TABLE 2-2: Summary of WWTP Performance – Wet Stream Process
AVERAGE WASTEWATER PARAMETER 2002 2003
Influent Plant Flow (MGD) 21.84 20.98
Influent BOD5 Concentration (mg/l) 101.6 106.6
Influent BOD5 Loading (lb/d) 16,763 17,072
Average BOD Removal 89.2% 90.5%
Influent TSS Concentration (mg/l) 99.2 99.4
Influent TSS Loading (lb/d) 16,592 16,149
Average TSS Removal 95.0% 95.9 %
2255-063 2-6 Town of Tonawanda NYSERDA FlexTech Services Wastewater Treatment Plant Submetering
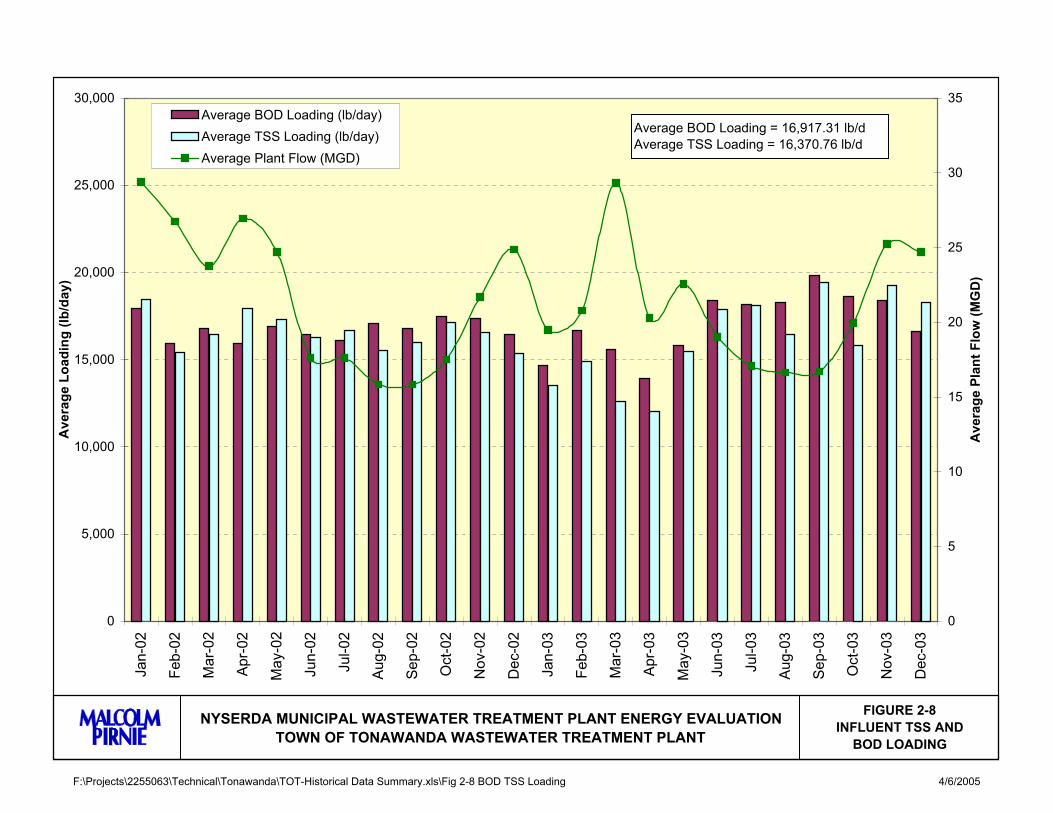
FIGURE 2-8 shows the relationship between influent BOD and TSS loadings and plant flow. There does
not appear to be a general trend in loadings with respect to flow. BOD and TSS loadings do not appear to
follow a seasonal pattern.
The WWTP has consistently achieved BOD and TSS removal efficiencies in excess of 85% and effluent
concentrations of both parameters are well below the monthly discharge permit limit of 30.0 mg/l each.
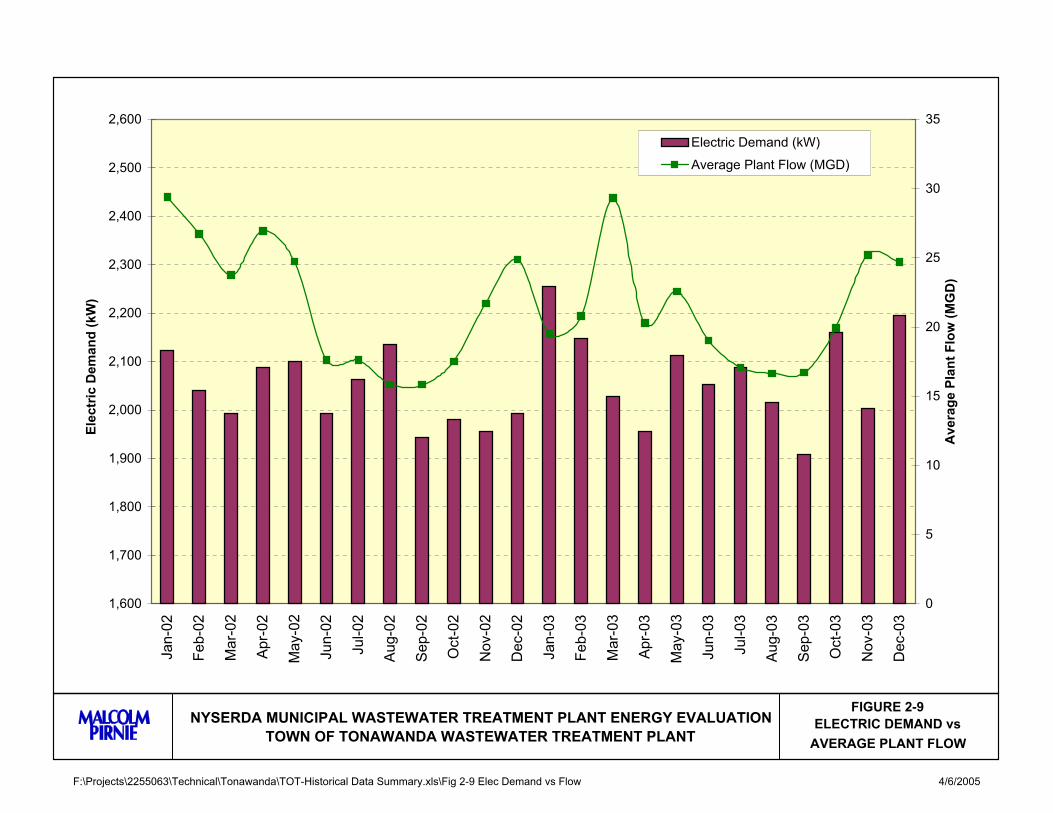
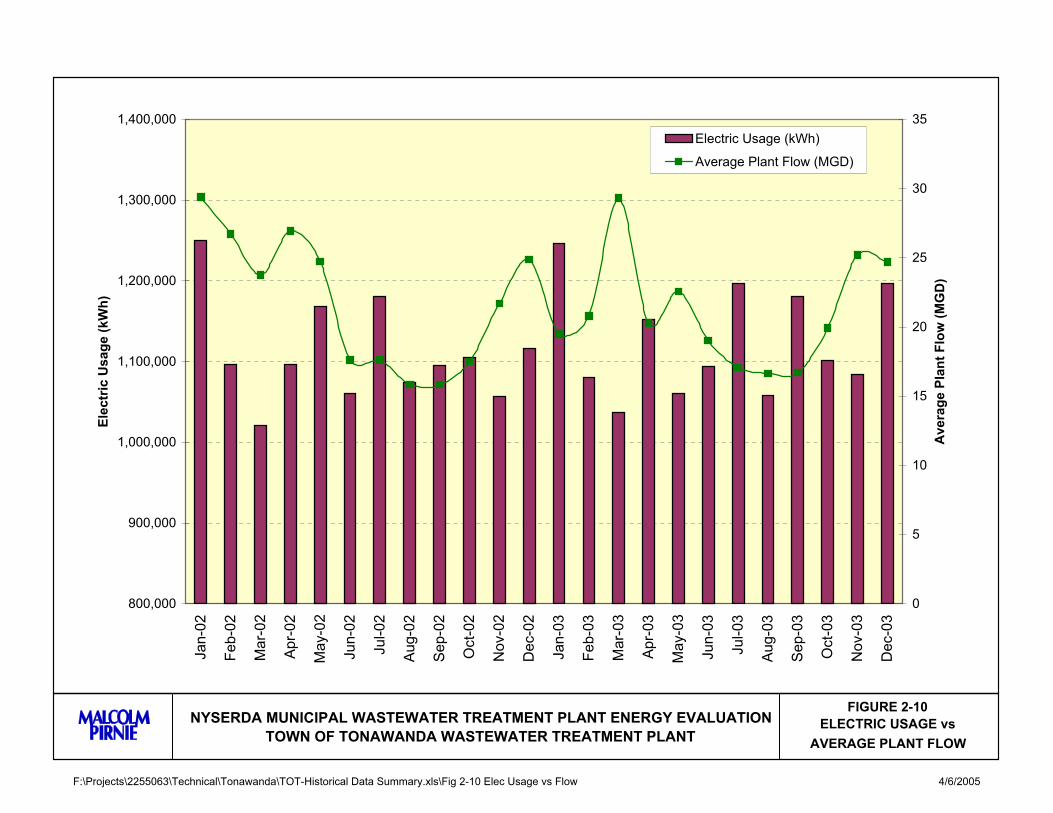
In order to evaluate the energy usage at the WWTP, the electric usage and demand data were compared to
WWTP flows to observe the effects of varying flows on energy usage. FIGURES 2-9 and 2-10 show the
average monthly plant flows along with electric demand and usage, respectively.
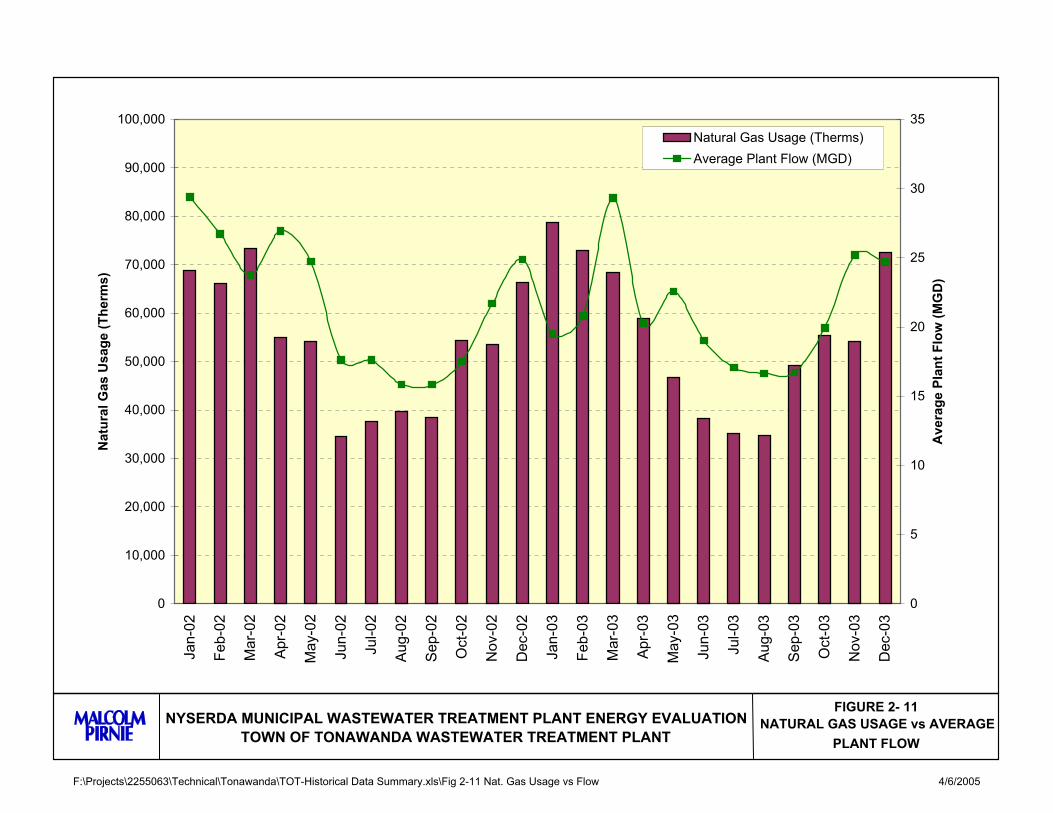
FIGURE 2-11 shows the natural gas consumption along with WWTP flows. From FIGURES 2-11 and 2-7,
it appears that the main factor influencing natural gas consumption is outdoor temperature, although natural
gas usage appears to be also influenced by plant flow. Because natural gas is also used by the Zimpro and
incineration processes, the increases in flow may also contribute to increased solids loadings and
potentially increased gas usage to process these solids.
Based on the historical data, approximately 15,029 and 15,510 pounds of BOD5 per day were removed for
the years 2002 and 2003, respectively. Therefore, the estimated electric energy usage per pound of BOD
removed for 2002 and 2003 averages about 2.4 kWh per lb of BOD removed. The average natural gas
usage is approximately 0.12 therms per pound of BOD removed.
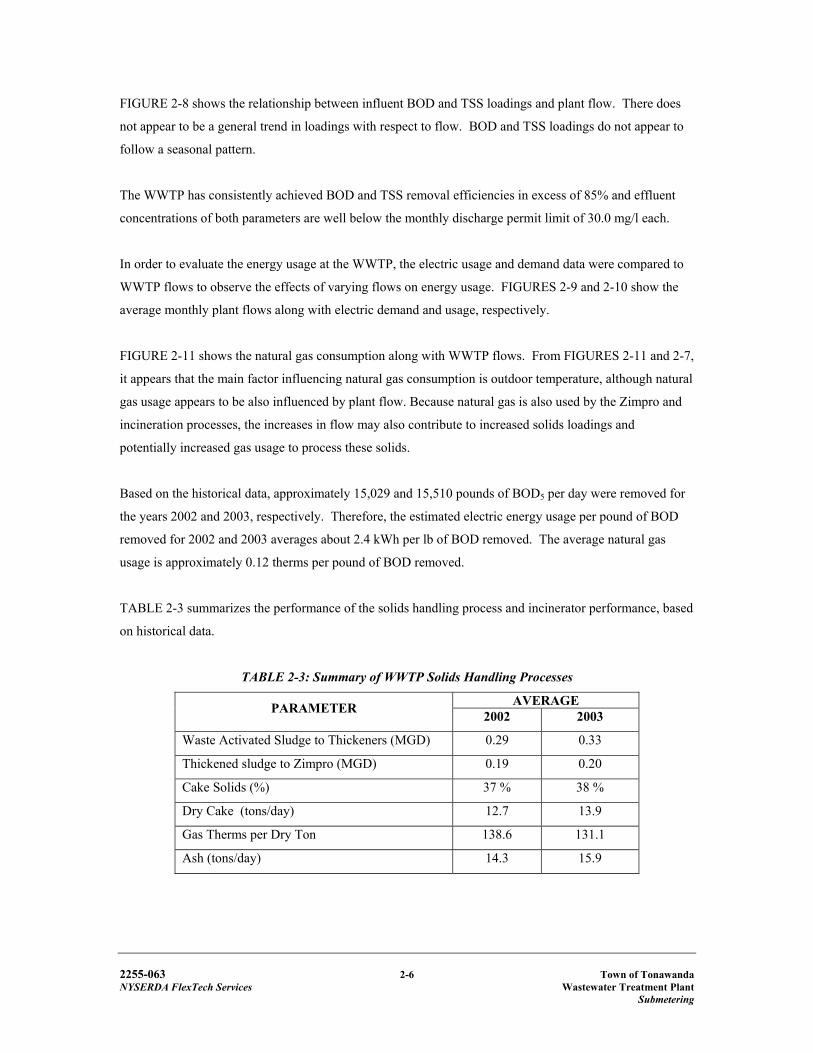
TABLE 2-3 summarizes the performance of the solids handling process and incinerator performance, based
on historical data.
TABLE 2-3: Summary of WWTP Solids Handling Processes
AVERAGE PARAMETER 2002 2003
Waste Activated Sludge to Thickeners (MGD) 0.29 0.33
Thickened sludge to Zimpro (MGD) 0.19 0.20
Cake Solids (%) 37 % 38 %
Dry Cake (tons/day) 12.7 13.9
Gas Therms per Dry Ton 138.6 131.1
Ash (tons/day) 14.3 15.9
F:\Projects\2255063\Technical\Tonawanda\TOT-Historical Data Summary.xls\Fig 2-8 BOD TSS Loading 4/6/2005
0
5,000
10,000
15,000
20,000
25,000
30,000
Jan-
02
Feb-
02
Mar
-02
Apr-
02
May
-02
Jun-
02
Jul-0
2
Aug-
02
Sep-
02
Oct
-02
Nov
-02
Dec
-02
Jan-
03
Feb-
03
Mar
-03
Apr-
03
May
-03
Jun-
03
Jul-0
3
Aug-
03
Sep-
03
Oct
-03
Nov
-03
Dec
-03
Ave
rage
Loa
ding
(lb/
day)
0
5
10
15
20
25
30
35
Ave
rage
Pla
nt F
low
(MG
D)
Average BOD Loading (lb/day)Average TSS Loading (lb/day)Average Plant Flow (MGD)
FIGURE 2-8INFLUENT TSS AND
BOD LOADING
NYSERDA MUNICIPAL WASTEWATER TREATMENT PLANT ENERGY EVALUATIONTOWN OF TONAWANDA WASTEWATER TREATMENT PLANT
Average BOD Loading = 16,917.31 lb/dAverage TSS Loading = 16,370.76 lb/d
F:\Projects\2255063\Technical\Tonawanda\TOT-Historical Data Summary.xls\Fig 2-9 Elec Demand vs Flow 4/6/2005
FIGURE 2-9ELECTRIC DEMAND vs
AVERAGE PLANT FLOW
NYSERDA MUNICIPAL WASTEWATER TREATMENT PLANT ENERGY EVALUATIONTOWN OF TONAWANDA WASTEWATER TREATMENT PLANT
1,600
1,700
1,800
1,900
2,000
2,100
2,200
2,300
2,400
2,500
2,600
Jan-
02
Feb-
02
Mar
-02
Apr-
02
May
-02
Jun-
02
Jul-0
2
Aug-
02
Sep-
02
Oct
-02
Nov
-02
Dec
-02
Jan-
03
Feb-
03
Mar
-03
Apr-
03
May
-03
Jun-
03
Jul-0
3
Aug-
03
Sep-
03
Oct
-03
Nov
-03
Dec
-03
Elec
tric
Dem
and
(kW
)
0
5
10
15
20
25
30
35
Ave
rage
Pla
nt F
low
(MG
D)
Electric Demand (kW)
Average Plant Flow (MGD)
F:\Projects\2255063\Technical\Tonawanda\TOT-Historical Data Summary.xls\Fig 2-10 Elec Usage vs Flow 4/6/2005
FIGURE 2-10ELECTRIC USAGE vs
AVERAGE PLANT FLOW
NYSERDA MUNICIPAL WASTEWATER TREATMENT PLANT ENERGY EVALUATIONTOWN OF TONAWANDA WASTEWATER TREATMENT PLANT
800,000
900,000
1,000,000
1,100,000
1,200,000
1,300,000
1,400,000
Jan-
02
Feb-
02
Mar
-02
Apr-
02
May
-02
Jun-
02
Jul-0
2
Aug-
02
Sep-
02
Oct
-02
Nov
-02
Dec
-02
Jan-
03
Feb-
03
Mar
-03
Apr-
03
May
-03
Jun-
03
Jul-0
3
Aug-
03
Sep-
03
Oct
-03
Nov
-03
Dec
-03
Elec
tric
Usa
ge (k
Wh)
0
5
10
15
20
25
30
35
Ave
rage
Pla
nt F
low
(MG
D)
Electric Usage (kWh)
Average Plant Flow (MGD)
F:\Projects\2255063\Technical\Tonawanda\TOT-Historical Data Summary.xls\Fig 2-11 Nat. Gas Usage vs Flow 4/6/2005
FIGURE 2- 11NATURAL GAS USAGE vs AVERAGE
PLANT FLOW
NYSERDA MUNICIPAL WASTEWATER TREATMENT PLANT ENERGY EVALUATIONTOWN OF TONAWANDA WASTEWATER TREATMENT PLANT
0
10,000
20,000
30,000
40,000
50,000
60,000
70,000
80,000
90,000
100,000
Jan-
02
Feb-
02
Mar
-02
Apr-
02
May
-02
Jun-
02
Jul-0
2
Aug-
02
Sep-
02
Oct
-02
Nov
-02
Dec
-02
Jan-
03
Feb-
03
Mar
-03
Apr-
03
May
-03
Jun-
03
Jul-0
3
Aug-
03
Sep-
03
Oct
-03
Nov
-03
Dec
-03
Nat
ural
Gas
Usa
ge (T
herm
s)
0
5
10
15
20
25
30
35
Ave
rage
Pla
nt F
low
(MG
D)
Natural Gas Usage (Therms)Average Plant Flow (MGD)
2255-063 3-1 Town of Tonawanda NYSERDA FlexTech Services Wastewater Treatment Plant Submetering
Section 3.0
ELECTRIC SUBMETERING PROGRAM
3.1 DESCRIPTION OF SUBMETERING PROGRAM AND SUBMETER LOCATIONS
3.1.1 Description of Program
Continuous submetering was conducted through installation of submeters with continuous recording
electronic data loggers (CREDLs). Continuous submetering was used to capture diurnal variations in
electric energy demand for major pieces of equipment, as well as provide a representative sample of
electric energy use, including measuring electric energy demand as equipment cycles on and off.
In conjunction with the continuous submetering program, daily process data were collected for both the wet
stream and solids handling processes. The summary of process data is further detailed in Section 4.0 of this
report.
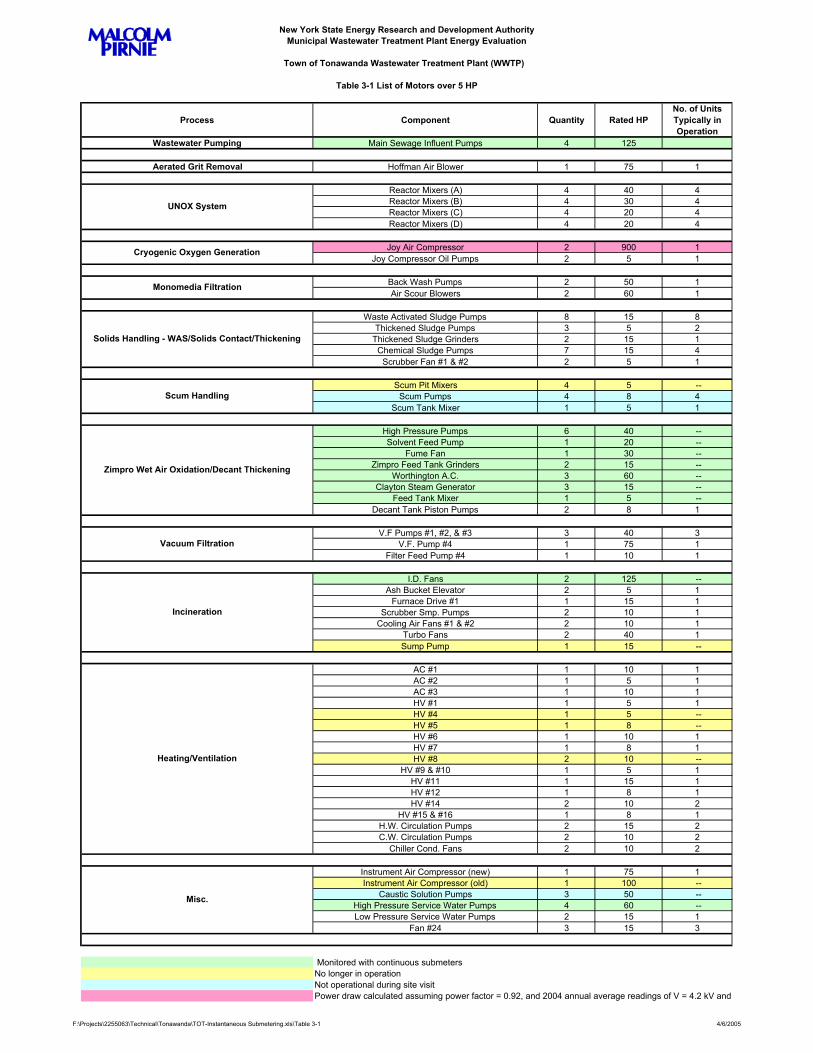
Instantaneous submetering was also conducted on representative pieces of equipment, usually those that
operated at a constant speed according to a set schedule and driven by motors rated at 5 hp or greater.
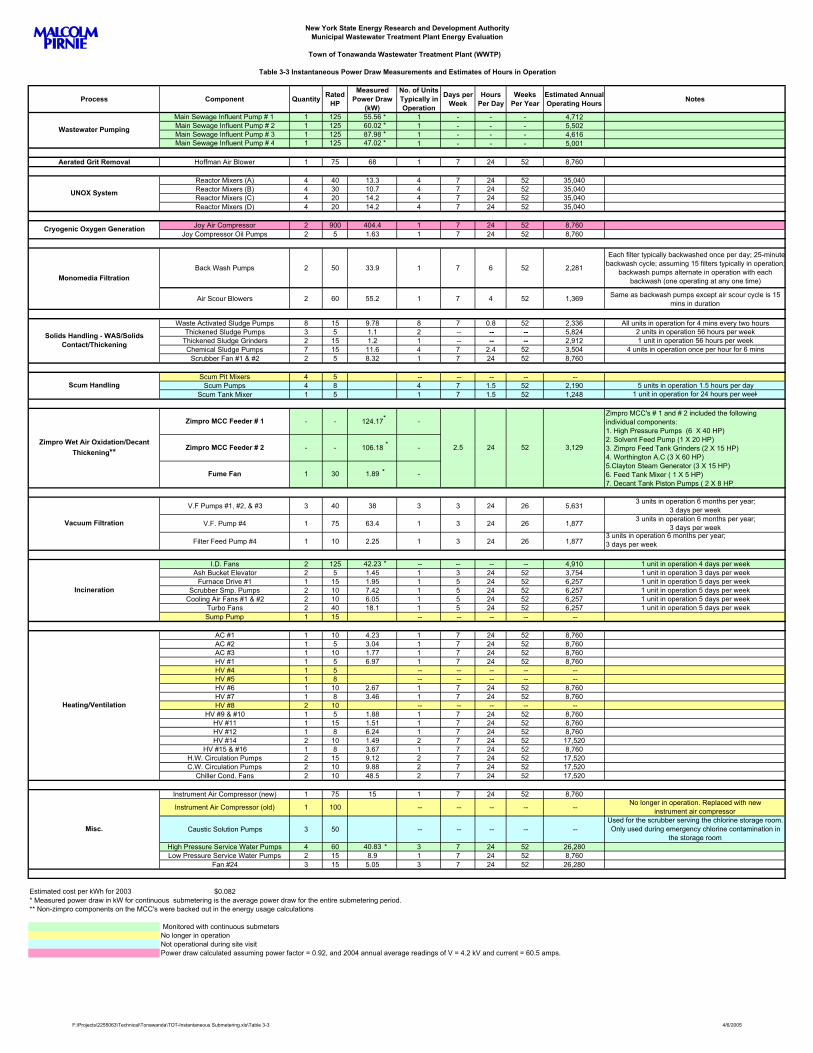
TABLE 3-1 summarizes the motors greater than 5 hp. The instantaneous readings and estimated operating
hours were then used to calculate estimated total electric energy use for the particular piece of equipment.
3.1.2 Submeter Locations
Based on a plant walk-through and existing plant information, continuously recording submeters were
installed in the following locations:
One submeter on one high pressure service water pump.
One submeter on each of the four main influent pumps (total of four).
One submeter on the induced draft fan for the incineration facilities.
One submeter on each of the two feeders to the Zimpro motor control center (total of two).
One submeter on the Zimpro fume fan.
The submeters were installed from July 21, 2004 to September 21, 2004, with the exception of the meters
on the influent pump No.2, induced draft fan, and on each of the two feeders to the Zimpro motor control
center which were installed from August 4, 2004 to September 21, 2004.
2255-063 3-2 Town of Tonawanda NYSERDA FlexTech Services Wastewater Treatment Plant Submetering
3.2 SUMMARY OF SITE AUDIT
A one-day on-site survey was conducted to:
Document existing equipment, operations and lighting.
Finalize the list of opportunities for energy improvements.
Finalize the submetering approach.
The submetering locations listed in Section 3.1.2 were finalized as a result of the site audit.
In addition, the site survey assessed the existing equipment at the plant with 5 hp or greater motors.
TABLE 3-1 lists all the motors in the plant with a size of 5 hp or greater. As shown by the data in TABLE
3-1, the motors that may use the most electric energy are those on the influent wastewater pumps, the
cryogenic plant air compressor, the aerated grit air blower, and the induced draft fan.
3.3 SUMMARY OF CONTINUOUS SUBMETERING
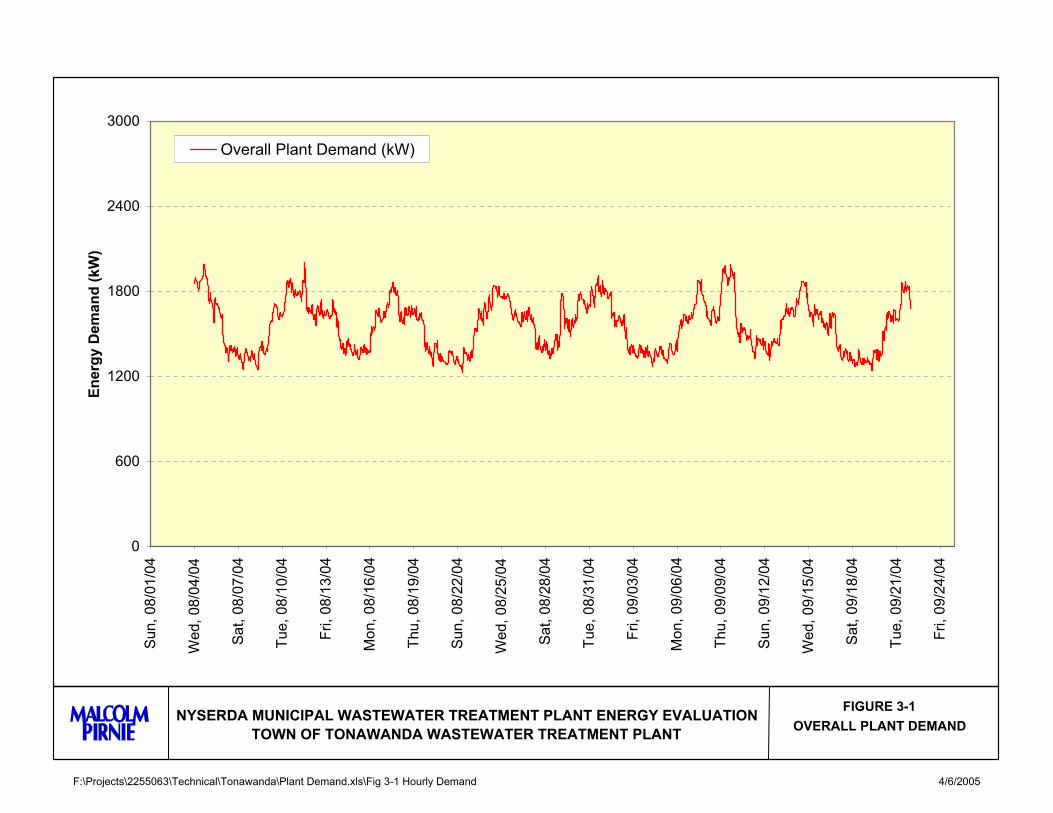
The following sections summarize the results from continuous submetering activities. The overall electric
energy demand for the Town’s WWTP is shown on FIGURE 3-1. Significant demand peaks were not
observed in the data, although a consistent trend of higher demand was observed during weekdays of each
week during the submetering period. This is likely due to the sludge processing and incinerator operations,
which only occur during weekdays (no weekend operation).
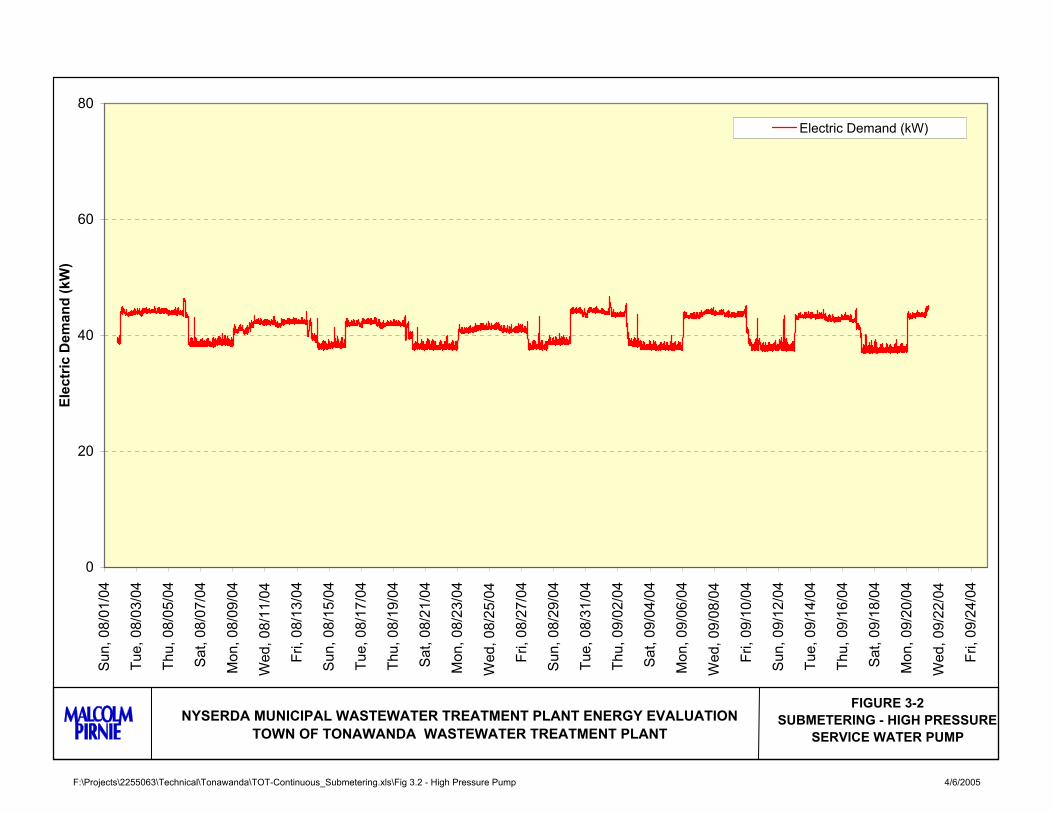
3.3.1 High Pressure Service Water Pump
There are four 60 hp high pressure pumps that provide service water to the plant. Each constant speed
pump is designed to handle approximately 1,100 gallons per minute (gpm) at a total dynamic head (TDH)
of 160 feet. Typically, three high pressure pumps are in operation. Only one of the four pumps was
metered during the continuous submetering and this pump was operational during the entire submetering
period; however the operation of all three pumps is identical. FIGURE 3-2 presents the electric energy
demand for the metered high pressure pump. The pattern of electric energy demand indicates consistent
higher demand during weekdays relative to the demands during weekends, which is consistent with the
pattern shown on FIGURE 3-1. This is due to the process water use for the incineration process, which
operates during the week. The high pressure service pump has an average electric energy demand of 40.8
kW (54.7 hp). The estimated usage for the high pressure pump during the submetering period was 60,708
kWh with an estimated cost of $ 5,005 based on the 2003 average cost per kWh of 8.24 cents.
Process Component Quantity Rated HPNo. of Units Typically in Operation
Wastewater Pumping Main Sewage Influent Pumps 4 125
Aerated Grit Removal Hoffman Air Blower 1 75 1
Reactor Mixers (A) 4 40 4Reactor Mixers (B) 4 30 4Reactor Mixers (C) 4 20 4Reactor Mixers (D) 4 20 4
Joy Air Compressor 2 900 1Joy Compressor Oil Pumps 2 5 1
Back Wash Pumps 2 50 1Air Scour Blowers 2 60 1
Waste Activated Sludge Pumps 8 15 8Thickened Sludge Pumps 3 5 2
Thickened Sludge Grinders 2 15 1Chemical Sludge Pumps 7 15 4
Scrubber Fan #1 & #2 2 5 1
Scum Pit Mixers 4 5 --Scum Pumps 4 8 4
Scum Tank Mixer 1 5 1
High Pressure Pumps 6 40 --Solvent Feed Pump 1 20 --
Fume Fan 1 30 --Zimpro Feed Tank Grinders 2 15 --
Worthington A.C. 3 60 --Clayton Steam Generator 3 15 --
Feed Tank Mixer 1 5 --Decant Tank Piston Pumps 2 8 1
V.F Pumps #1, #2, & #3 3 40 3V.F. Pump #4 1 75 1
Filter Feed Pump #4 1 10 1
I.D. Fans 2 125 --Ash Bucket Elevator 2 5 1
Furnace Drive #1 1 15 1Scrubber Smp. Pumps 2 10 1
Cooling Air Fans #1 & #2 2 10 1Turbo Fans 2 40 1Sump Pump 1 15 --
AC #1 1 10 1AC #2 1 5 1AC #3 1 10 1HV #1 1 5 1HV #4 1 5 --HV #5 1 8 --HV #6 1 10 1HV #7 1 8 1HV #8 2 10 --
HV #9 & #10 1 5 1HV #11 1 15 1HV #12 1 8 1HV #14 2 10 2
HV #15 & #16 1 8 1H.W. Circulation Pumps 2 15 2C.W. Circulation Pumps 2 10 2
Chiller Cond. Fans 2 10 2
Instrument Air Compressor (new) 1 75 1Instrument Air Compressor (old) 1 100 --
Caustic Solution Pumps 3 50 --High Pressure Service Water Pumps 4 60 --Low Pressure Service Water Pumps 2 15 1
Fan #24 3 15 3
Monitored with continuous submetersNo longer in operationNot operational during site visitPower draw calculated assuming power factor = 0.92, and 2004 annual average readings of V = 4.2 kV and
Misc.
Heating/Ventilation
Monomedia Filtration
Incineration
Vacuum Filtration
Zimpro Wet Air Oxidation/Decant Thickening
UNOX System
Cryogenic Oxygen Generation
Solids Handling - WAS/Solids Contact/Thickening
Scum Handling
New York State Energy Research and Development AuthorityMunicipal Wastewater Treatment Plant Energy Evaluation
Town of Tonawanda Wastewater Treatment Plant (WWTP)
Table 3-1 List of Motors over 5 HP
F:\Projects\2255063\Technical\Tonawanda\TOT-Instantaneous Submetering.xls\Table 3-1 4/6/2005
F:\Projects\2255063\Technical\Tonawanda\Plant Demand.xls\Fig 3-1 Hourly Demand 4/6/2005
FIGURE 3-1OVERALL PLANT DEMAND
NYSERDA MUNICIPAL WASTEWATER TREATMENT PLANT ENERGY EVALUATIONTOWN OF TONAWANDA WASTEWATER TREATMENT PLANT
0
600
1200
1800
2400
3000
Sun,
08/
01/0
4
Wed
, 08/
04/0
4
Sat,
08/0
7/04
Tue,
08/
10/0
4
Fri,
08/1
3/04
Mon
, 08/
16/0
4
Thu,
08/
19/0
4
Sun,
08/
22/0
4
Wed
, 08/
25/0
4
Sat,
08/2
8/04
Tue,
08/
31/0
4
Fri,
09/0
3/04
Mon
, 09/
06/0
4
Thu,
09/
09/0
4
Sun,
09/
12/0
4
Wed
, 09/
15/0
4
Sat,
09/1
8/04
Tue,
09/
21/0
4
Fri,
09/2
4/04
Ener
gy D
eman
d (k
W)
Overall Plant Demand (kW)
F:\Projects\2255063\Technical\Tonawanda\TOT-Continuous_Submetering.xls\Fig 3.2 - High Pressure Pump 4/6/2005
0
20
40
60
80S
un, 0
8/01
/04
Tue,
08/
03/0
4
Thu,
08/
05/0
4
Sat
, 08/
07/0
4
Mon
, 08/
09/0
4
Wed
, 08/
11/0
4
Fri,
08/1
3/04
Sun
, 08/
15/0
4
Tue,
08/
17/0
4
Thu,
08/
19/0
4
Sat
, 08/
21/0
4
Mon
, 08/
23/0
4
Wed
, 08/
25/0
4
Fri,
08/2
7/04
Sun
, 08/
29/0
4
Tue,
08/
31/0
4
Thu,
09/
02/0
4
Sat
, 09/
04/0
4
Mon
, 09/
06/0
4
Wed
, 09/
08/0
4
Fri,
09/1
0/04
Sun
, 09/
12/0
4
Tue,
09/
14/0
4
Thu,
09/
16/0
4
Sat
, 09/
18/0
4
Mon
, 09/
20/0
4
Wed
, 09/
22/0
4
Fri,
09/2
4/04
Elec
tric
Dem
and
(kW
)
Electric Demand (kW)
FIGURE 3-2SUBMETERING - HIGH PRESSURE
SERVICE WATER PUMPNYSERDA MUNICIPAL WASTEWATER TREATMENT PLANT ENERGY EVALUATION
TOWN OF TONAWANDA WASTEWATER TREATMENT PLANT
2255-063 3-3 Town of Tonawanda NYSERDA FlexTech Services Wastewater Treatment Plant Submetering
If the numbers obtained during submetering are extrapolated to an entire year, it is estimated that
approximately 357,654 kWh would be used by each high pressure pump per year. It is then estimated that
approximately 1,072,963 kWh would be used by the three high pressure pumps per year, which would
account for 8% ($88,466) of the total annual electric cost.
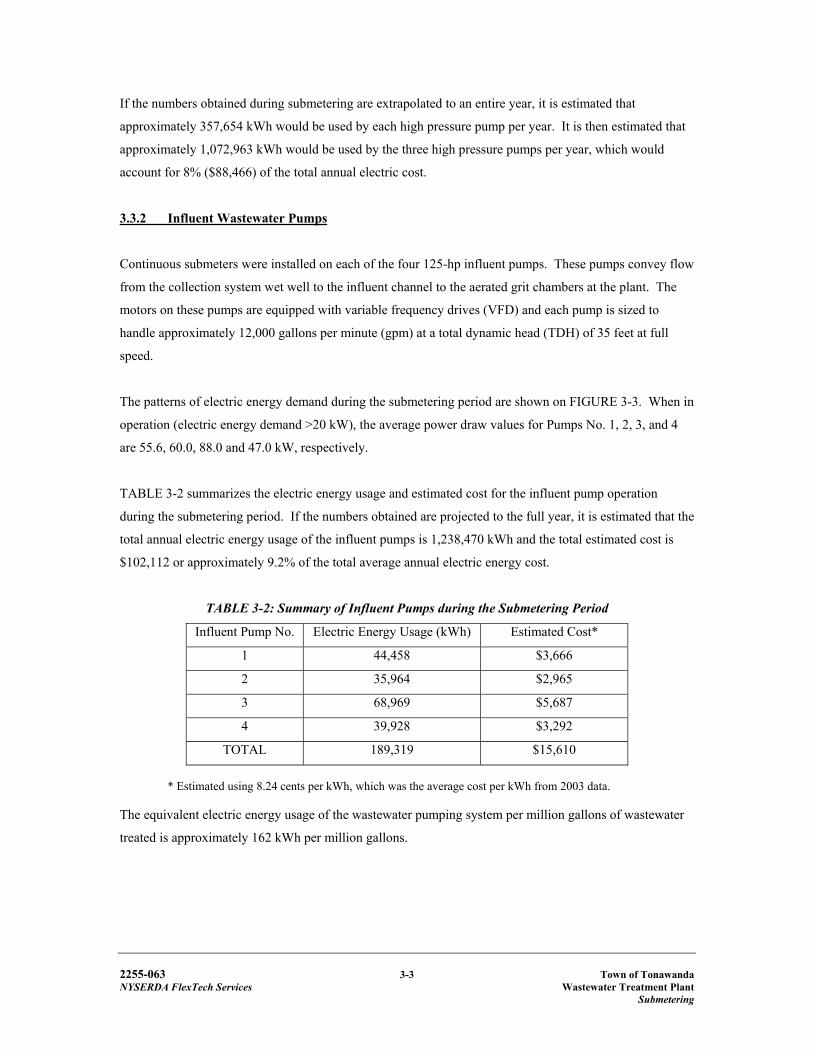
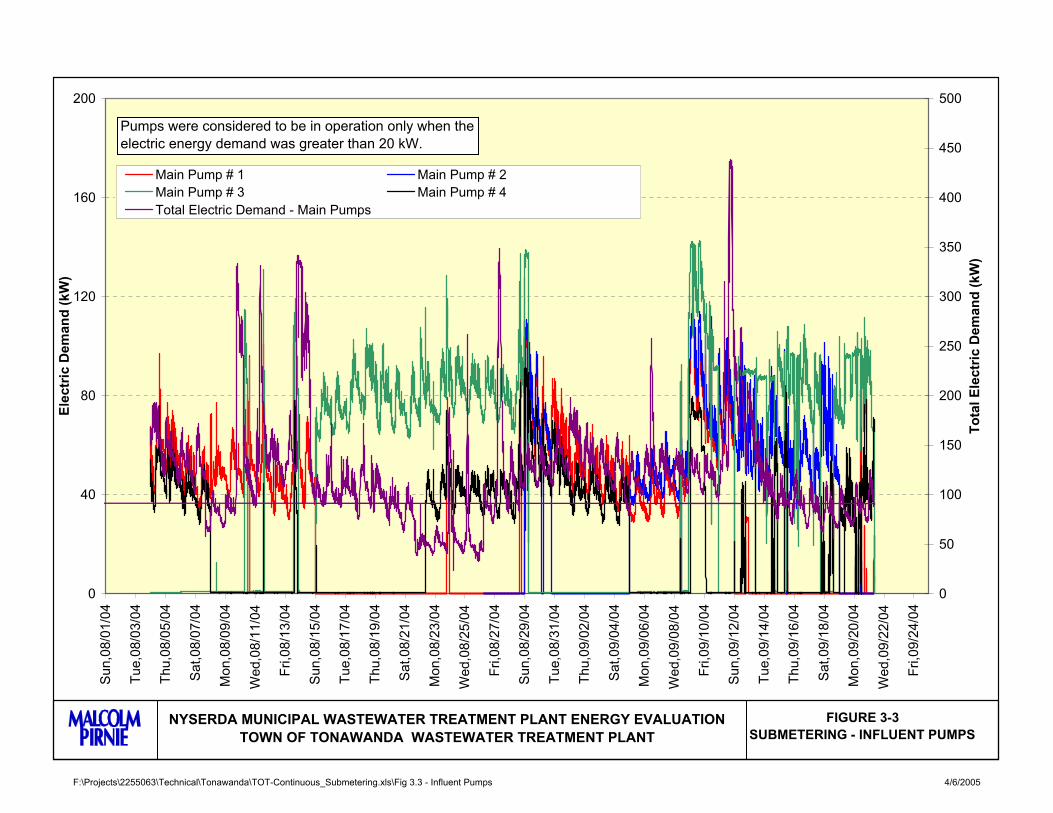
3.3.2 Influent Wastewater Pumps
Continuous submeters were installed on each of the four 125-hp influent pumps. These pumps convey flow
from the collection system wet well to the influent channel to the aerated grit chambers at the plant. The
motors on these pumps are equipped with variable frequency drives (VFD) and each pump is sized to
handle approximately 12,000 gallons per minute (gpm) at a total dynamic head (TDH) of 35 feet at full
speed.
The patterns of electric energy demand during the submetering period are shown on FIGURE 3-3. When in
operation (electric energy demand >20 kW), the average power draw values for Pumps No. 1, 2, 3, and 4
are 55.6, 60.0, 88.0 and 47.0 kW, respectively.
TABLE 3-2 summarizes the electric energy usage and estimated cost for the influent pump operation
during the submetering period. If the numbers obtained are projected to the full year, it is estimated that the
total annual electric energy usage of the influent pumps is 1,238,470 kWh and the total estimated cost is
$102,112 or approximately 9.2% of the total average annual electric energy cost.
TABLE 3-2: Summary of Influent Pumps during the Submetering Period
Influent Pump No. Electric Energy Usage (kWh) Estimated Cost*
1 44,458 $3,666
2 35,964 $2,965
3 68,969 $5,687
4 39,928 $3,292
TOTAL 189,319 $15,610
* Estimated using 8.24 cents per kWh, which was the average cost per kWh from 2003 data.
The equivalent electric energy usage of the wastewater pumping system per million gallons of wastewater
treated is approximately 162 kWh per million gallons.
F:\Projects\2255063\Technical\Tonawanda\TOT-Continuous_Submetering.xls\Fig 3.3 - Influent Pumps 4/6/2005
0
40
80
120
160
200S
un,0
8/01
/04
Tue,
08/0
3/04
Thu,
08/0
5/04
Sat
,08/
07/0
4
Mon
,08/
09/0
4
Wed
,08/
11/0
4
Fri,0
8/13
/04
Sun
,08/
15/0
4
Tue,
08/1
7/04
Thu,
08/1
9/04
Sat
,08/
21/0
4
Mon
,08/
23/0
4
Wed
,08/
25/0
4
Fri,0
8/27
/04
Sun
,08/
29/0
4
Tue,
08/3
1/04
Thu,
09/0
2/04
Sat
,09/
04/0
4
Mon
,09/
06/0
4
Wed
,09/
08/0
4
Fri,0
9/10
/04
Sun
,09/
12/0
4
Tue,
09/1
4/04
Thu,
09/1
6/04
Sat
,09/
18/0
4
Mon
,09/
20/0
4
Wed
,09/
22/0
4
Fri,0
9/24
/04
Elec
tric
Dem
and
(kW
)
0
50
100
150
200
250
300
350
400
450
500
Tota
l Ele
ctric
Dem
and
(kW
)
Main Pump # 1 Main Pump # 2Main Pump # 3 Main Pump # 4Total Electric Demand - Main Pumps
FIGURE 3-3SUBMETERING - INFLUENT PUMPS
NYSERDA MUNICIPAL WASTEWATER TREATMENT PLANT ENERGY EVALUATIONTOWN OF TONAWANDA WASTEWATER TREATMENT PLANT
Pumps were considered to be in operation only when the electric energy demand was greater than 20 kW.
2255-063 3-4 Town of Tonawanda NYSERDA FlexTech Services Wastewater Treatment Plant Submetering
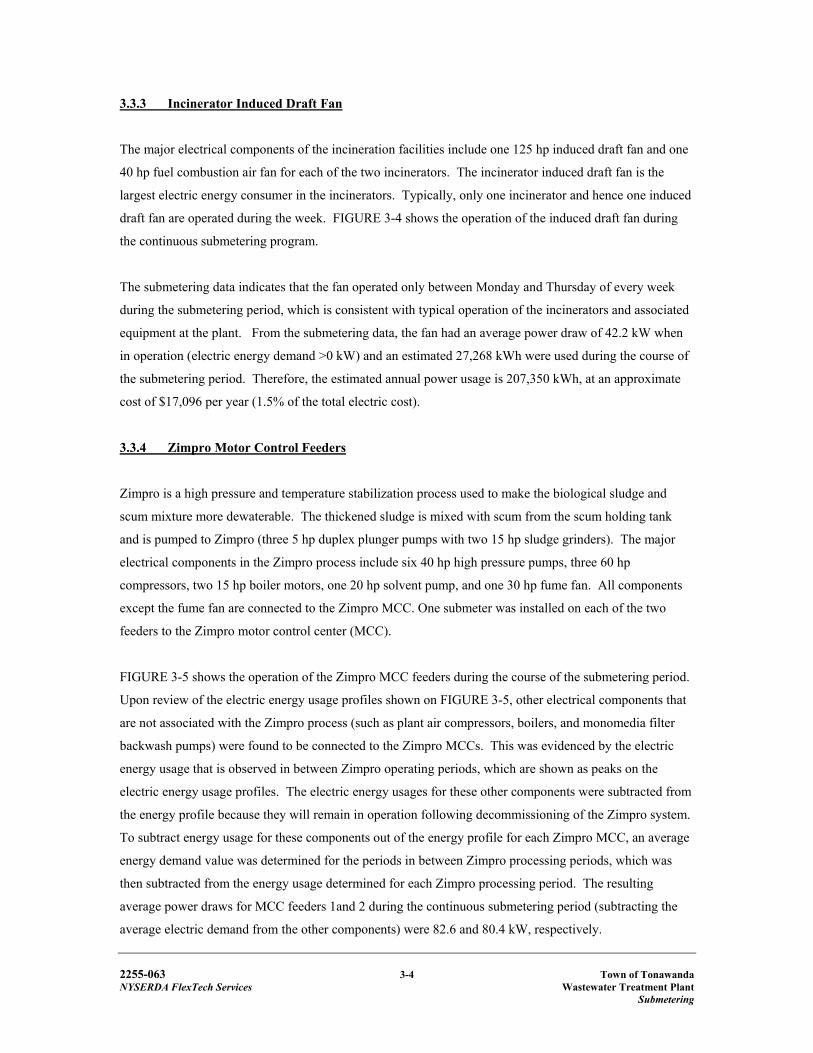
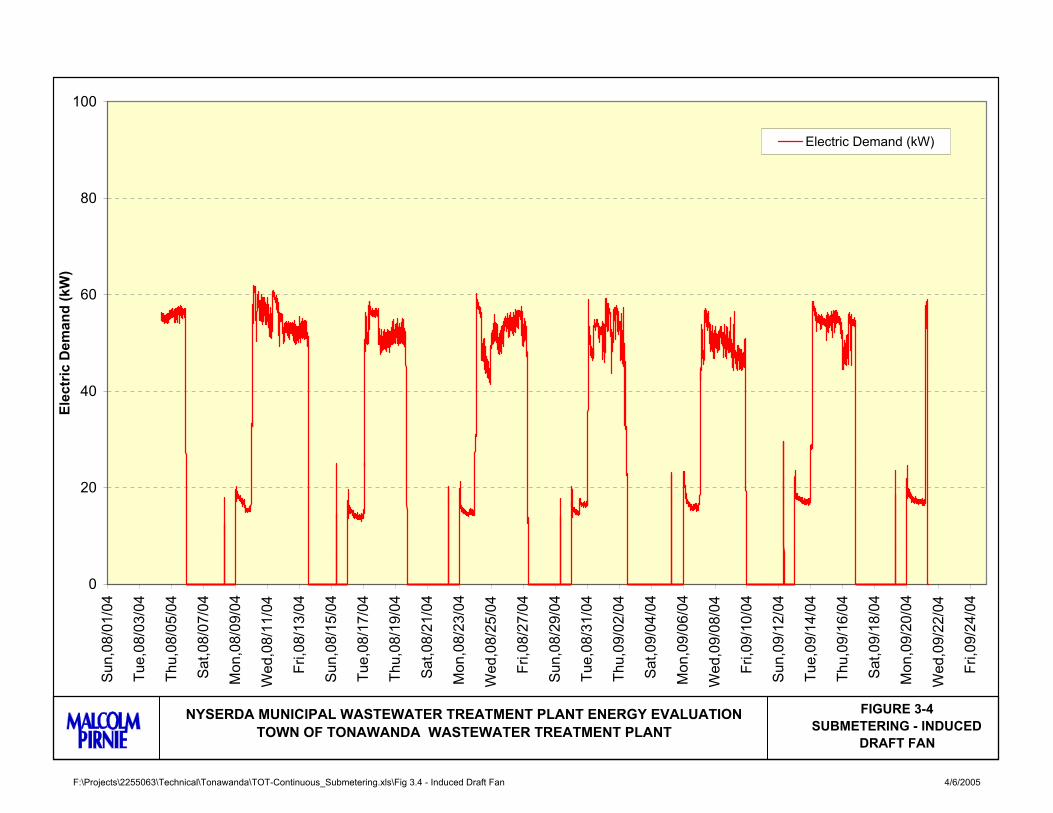
3.3.3 Incinerator Induced Draft Fan
The major electrical components of the incineration facilities include one 125 hp induced draft fan and one
40 hp fuel combustion air fan for each of the two incinerators. The incinerator induced draft fan is the
largest electric energy consumer in the incinerators. Typically, only one incinerator and hence one induced
draft fan are operated during the week. FIGURE 3-4 shows the operation of the induced draft fan during
the continuous submetering program.
The submetering data indicates that the fan operated only between Monday and Thursday of every week
during the submetering period, which is consistent with typical operation of the incinerators and associated
equipment at the plant. From the submetering data, the fan had an average power draw of 42.2 kW when
in operation (electric energy demand >0 kW) and an estimated 27,268 kWh were used during the course of
the submetering period. Therefore, the estimated annual power usage is 207,350 kWh, at an approximate
cost of $17,096 per year (1.5% of the total electric cost).
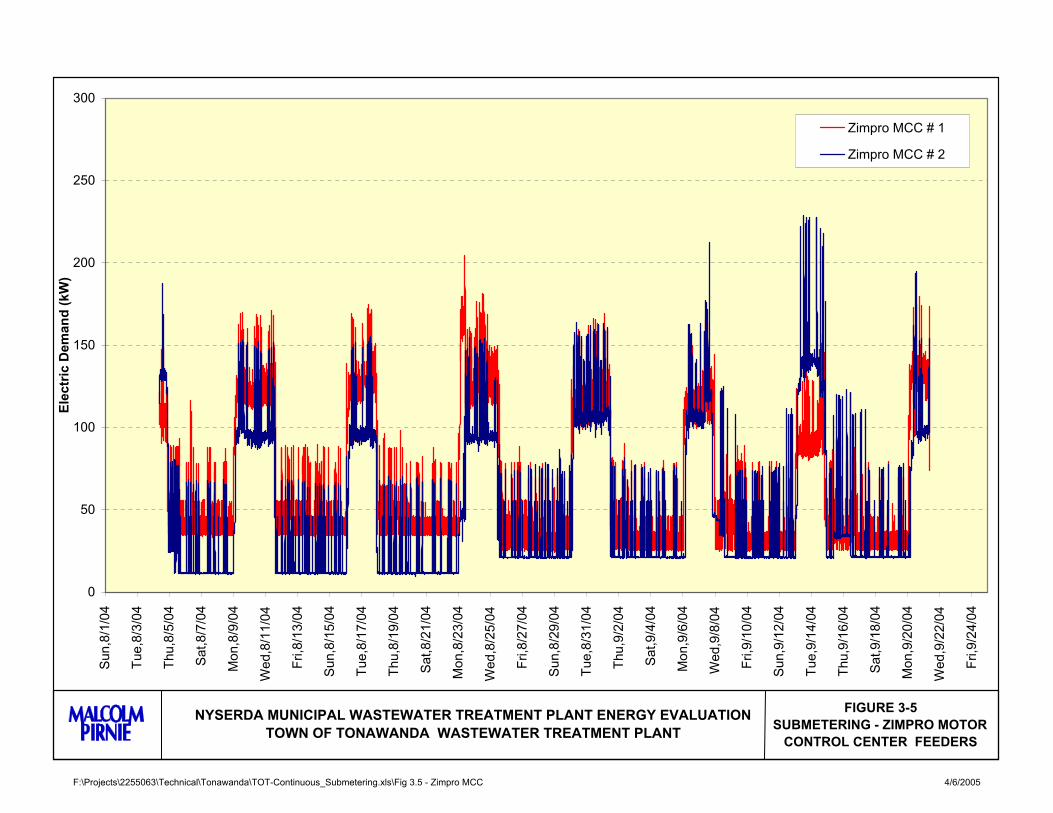
3.3.4 Zimpro Motor Control Feeders
Zimpro is a high pressure and temperature stabilization process used to make the biological sludge and
scum mixture more dewaterable. The thickened sludge is mixed with scum from the scum holding tank
and is pumped to Zimpro (three 5 hp duplex plunger pumps with two 15 hp sludge grinders). The major
electrical components in the Zimpro process include six 40 hp high pressure pumps, three 60 hp
compressors, two 15 hp boiler motors, one 20 hp solvent pump, and one 30 hp fume fan. All components
except the fume fan are connected to the Zimpro MCC. One submeter was installed on each of the two
feeders to the Zimpro motor control center (MCC).
FIGURE 3-5 shows the operation of the Zimpro MCC feeders during the course of the submetering period.
Upon review of the electric energy usage profiles shown on FIGURE 3-5, other electrical components that
are not associated with the Zimpro process (such as plant air compressors, boilers, and monomedia filter
backwash pumps) were found to be connected to the Zimpro MCCs. This was evidenced by the electric
energy usage that is observed in between Zimpro operating periods, which are shown as peaks on the
electric energy usage profiles. The electric energy usages for these other components were subtracted from
the energy profile because they will remain in operation following decommissioning of the Zimpro system.
To subtract energy usage for these components out of the energy profile for each Zimpro MCC, an average
energy demand value was determined for the periods in between Zimpro processing periods, which was
then subtracted from the energy usage determined for each Zimpro processing period. The resulting
average power draws for MCC feeders 1and 2 during the continuous submetering period (subtracting the
average electric demand from the other components) were 82.6 and 80.4 kW, respectively.
F:\Projects\2255063\Technical\Tonawanda\TOT-Continuous_Submetering.xls\Fig 3.4 - Induced Draft Fan 4/6/2005
0
20
40
60
80
100Su
n,08
/01/
04
Tue,
08/0
3/04
Thu,
08/0
5/04
Sat,0
8/07
/04
Mon
,08/
09/0
4
Wed
,08/
11/0
4
Fri,0
8/13
/04
Sun,
08/1
5/04
Tue,
08/1
7/04
Thu,
08/1
9/04
Sat,0
8/21
/04
Mon
,08/
23/0
4
Wed
,08/
25/0
4
Fri,0
8/27
/04
Sun,
08/2
9/04
Tue,
08/3
1/04
Thu,
09/0
2/04
Sat,0
9/04
/04
Mon
,09/
06/0
4
Wed
,09/
08/0
4
Fri,0
9/10
/04
Sun,
09/1
2/04
Tue,
09/1
4/04
Thu,
09/1
6/04
Sat,0
9/18
/04
Mon
,09/
20/0
4
Wed
,09/
22/0
4
Fri,0
9/24
/04
Elec
tric
Dem
and
(kW
)
Electric Demand (kW)
FIGURE 3-4SUBMETERING - INDUCED
DRAFT FAN
NYSERDA MUNICIPAL WASTEWATER TREATMENT PLANT ENERGY EVALUATIONTOWN OF TONAWANDA WASTEWATER TREATMENT PLANT
F:\Projects\2255063\Technical\Tonawanda\TOT-Continuous_Submetering.xls\Fig 3.5 - Zimpro MCC 4/6/2005
0
50
100
150
200
250
300Su
n,8/
1/04
Tue,
8/3/
04
Thu,
8/5/
04
Sat,8
/7/0
4
Mon
,8/9
/04
Wed
,8/1
1/04
Fri,8
/13/
04
Sun,
8/15
/04
Tue,
8/17
/04
Thu,
8/19
/04
Sat,8
/21/
04
Mon
,8/2
3/04
Wed
,8/2
5/04
Fri,8
/27/
04
Sun,
8/29
/04
Tue,
8/31
/04
Thu,
9/2/
04
Sat,9
/4/0
4
Mon
,9/6
/04
Wed
,9/8
/04
Fri,9
/10/
04
Sun,
9/12
/04
Tue,
9/14
/04
Thu,
9/16
/04
Sat,9
/18/
04
Mon
,9/2
0/04
Wed
,9/2
2/04
Fri,9
/24/
04
Elec
tric
Dem
and
(kW
)
Zimpro MCC # 1
Zimpro MCC # 2
FIGURE 3-5SUBMETERING - ZIMPRO MOTOR
CONTROL CENTER FEEDERS
NYSERDA MUNICIPAL WASTEWATER TREATMENT PLANT ENERGY EVALUATIONTOWN OF TONAWANDA WASTEWATER TREATMENT PLANT
2255-063 3-5 Town of Tonawanda NYSERDA FlexTech Services Wastewater Treatment Plant Submetering
The electric energy usage data gathered during the six-week monitoring period was then extrapolated to a
full year. The extrapolation was performed by determining the average weekly electric energy usage for
each of the Zimpro MCC feeders and multiplying those values by 52 weeks to obtain annual estimated
energy usage. Additionally, the average Zimpro operating time during the monitoring period was 2.2 days
per week. However, the Zimpro operation time depends on a number of plant operations and extraneous
factors such as seasonal changes in sludge age, wastewater temperature, and wet weather flows. Based on
plant historical operating records for the past three years, the annual average Zimpro operating time is 2.5
days per week. Therefore, prior to extrapolation to a full year, the average weekly energy usage values for
the Zimpro components were adjusted to account for the average operating duration of 2.5 days per week
on an annual basis as provided by the plant operating records. It is estimated that at this average demand,
the annual power usage is 498,749 kWh at a total annual cost of $41,121 (or approximately 3.7% of the
total electric usage at the plant).
3.3.5 Zimpro Fume Fan
As presented in Section 3.3.4, one of the electrical components in the Zimpro process is a 30 hp fume fan.
The fume fan is not connected to the Zimpro MCCs. Plant staff indicated that the fume fan motor is
equipped with a VFD and that the fan is operated at the lowest possible speed when in operation. FIGURE
3-6 shows the operation of the Zimpro fume fan during the course of the submetering period. Similar to the
Zimpro MCCs, there appears to be some other equipment connected to the same panel as the fume fan due
to the non-zero electric demand draw during periods when Zimpro is not operated. It is estimated that at
this average demand (2.64 kW), the annual power usage is 14,812 kWh at a total annual cost of $1,221 (or
approximately 0.1% of the total electric usage at the plant).
3.4 SUMMARY OF INSTANTANEOUS SUBMETERING
Instantaneous power draw measurements were obtained from motors greater than 5 hp at the plant for
equipment that is either in continuous use or operated on a set schedule. The resulting information was
collected to verify electric energy demand at the facility, as well as to monitor changes in electric energy
demand as the equipment is cycled on and off.
The instantaneous measurements were obtained using hand-held meters. TABLE 3-3 summarizes the
instantaneous power draw and estimated operating hours for each piece of equipment over 5 hp. It should
be noted that while the cryogenic plant air compressor is equipped with the largest size motor at the plant
(900 hp), obtaining continuous or instantaneous power draw readings for this equipment was not possible
due to the high voltage on this equipment (4,160 V). However, amperage readings on the existing meter
Process Component Quantity Rated HP
Measured Power Draw
(kW)
No. of Units Typically in Operation
Days per Week
Hours Per Day
Weeks Per Year
Estimated Annual Operating Hours Notes
Main Sewage Influent Pump # 1 1 125 55.56 1 - - - 4,712Main Sewage Influent Pump # 2 1 125 60.02 1 - - - 5,502Main Sewage Influent Pump # 3 1 125 87.98 1 - - - 4,616Main Sewage Influent Pump # 4 1 125 47.02 1 - - - 5,001
Aerated Grit Removal Hoffman Air Blower 1 75 68 1 7 24 52 8,760
Reactor Mixers (A) 4 40 13.3 4 7 24 52 35,040Reactor Mixers (B) 4 30 10.7 4 7 24 52 35,040Reactor Mixers (C) 4 20 14.2 4 7 24 52 35,040Reactor Mixers (D) 4 20 14.2 4 7 24 52 35,040
Joy Air Compressor 2 900 404.4 1 7 24 52 8,760Joy Compressor Oil Pumps 2 5 1.63 1 7 24 52 8,760
Back Wash Pumps 2 50 33.9 1 7 6 52 2,281
Each filter typically backwashed once per day; 25-minutebackwash cycle; assuming 15 filters typically in operation;
backwash pumps alternate in operation with each backwash (one operating at any one time)
Air Scour Blowers 2 60 55.2 1 7 4 52 1,369 Same as backwash pumps except air scour cycle is 15 mins in duration
Waste Activated Sludge Pumps 8 15 9.78 8 7 0.8 52 2,336 All units in operation for 4 mins every two hoursThickened Sludge Pumps 3 5 1.1 2 -- -- -- 5,824 2 units in operation 56 hours per week
Thickened Sludge Grinders 2 15 1.2 1 -- -- -- 2,912 1 unit in operation 56 hours per weekChemical Sludge Pumps 7 15 11.6 4 7 2.4 52 3,504 4 units in operation once per hour for 6 mins
Scrubber Fan #1 & #2 2 5 8.32 1 7 24 52 8,760
Scum Pit Mixers 4 5 -- -- -- -- --Scum Pumps 4 8 4 7 1.5 52 2,190 5 units in operation 1.5 hours per day
Scum Tank Mixer 1 5 1 7 1.5 52 1,248 1 unit in operation for 24 hours per week
V.F Pumps #1, #2, & #3 3 40 38 3 3 24 26 5,631 3 units in operation 6 months per year; 3 days per week
V.F. Pump #4 1 75 63.4 1 3 24 26 1,877 3 units in operation 6 months per year; 3 days per week
Filter Feed Pump #4 1 10 2.25 1 3 24 26 1,8773 units in operation 6 months per year; 3 days per week
I.D. Fans 2 125 42.23 -- -- -- -- 4,910 1 unit in operation 4 days per weekAsh Bucket Elevator 2 5 1.45 1 3 24 52 3,754 1 unit in operation 3 days per week
Furnace Drive #1 1 15 1.95 1 5 24 52 6,257 1 unit in operation 5 days per weekScrubber Smp. Pumps 2 10 7.42 1 5 24 52 6,257 1 unit in operation 5 days per week
Cooling Air Fans #1 & #2 2 10 6.05 1 5 24 52 6,257 1 unit in operation 5 days per weekTurbo Fans 2 40 18.1 1 5 24 52 6,257 1 unit in operation 5 days per weekSump Pump 1 15 -- -- -- -- --
AC #1 1 10 4.23 1 7 24 52 8,760AC #2 1 5 3.04 1 7 24 52 8,760AC #3 1 10 1.77 1 7 24 52 8,760HV #1 1 5 6.97 1 7 24 52 8,760HV #4 1 5 -- -- -- -- --HV #5 1 8 -- -- -- -- --HV #6 1 10 2.67 1 7 24 52 8,760HV #7 1 8 3.46 1 7 24 52 8,760HV #8 2 10 -- -- -- -- --
HV #9 & #10 1 5 1.88 1 7 24 52 8,760HV #11 1 15 1.51 1 7 24 52 8,760HV #12 1 8 6.24 1 7 24 52 8,760HV #14 2 10 1.49 2 7 24 52 17,520
HV #15 & #16 1 8 3.67 1 7 24 52 8,760H.W. Circulation Pumps 2 15 9.12 2 7 24 52 17,520C.W. Circulation Pumps 2 10 9.88 2 7 24 52 17,520
Chiller Cond. Fans 2 10 48.5 2 7 24 52 17,520
Instrument Air Compressor (new) 1 75 15 1 7 24 52 8,760
Instrument Air Compressor (old) 1 100 -- -- -- -- -- No longer in operation. Replaced with new instrument air compressor
Caustic Solution Pumps 3 50 -- -- -- -- --Used for the scrubber serving the chlorine storage room. Only used during emergency chlorine contamination in
the storage roomHigh Pressure Service Water Pumps 4 60 40.83 3 7 24 52 26,280Low Pressure Service Water Pumps 2 15 8.9 1 7 24 52 8,760
Fan #24 3 15 5.05 3 7 24 52 26,280
Estimated cost per kWh for 2003 $0.082* Measured power draw in kW for continuous submetering is the average power draw for the entire submetering period.** Non-zimpro components on the MCC's were backed out in the energy usage calculations
Monitored with continuous submetersNo longer in operationNot operational during site visitPower draw calculated assuming power factor = 0.92, and 2004 annual average readings of V = 4.2 kV and current = 60.5 amps.
Wastewater Pumping
New York State Energy Research and Development AuthorityMunicipal Wastewater Treatment Plant Energy Evaluation
Town of Tonawanda Wastewater Treatment Plant (WWTP)
Table 3-3 Instantaneous Power Draw Measurements and Estimates of Hours in Operation
UNOX System
Cryogenic Oxygen Generation
Solids Handling - WAS/Solids Contact/Thickening
Scum Handling
Monomedia Filtration
Misc.
Heating/Ventilation
30 1.89Fume Fan 1
Incineration
Vacuum Filtration
Zimpro Wet Air Oxidation/Decant Thickening** -
Zimpro MCC's # 1 and # 2 included the following individual components: 1. High Pressure Pumps (6 X 40 HP) 2. Solvent Feed Pump (1 X 20 HP) 3. Zimpro Feed Tank Grinders (2 X 15 HP) 4. Worthington A.C (3 X 60 HP) 5.Clayton Steam Generator (3 X 15 HP) 6. Feed Tank Mixer ( 1 X 5 HP) 7. Decant Tank Piston Pumps ( 2 X 8 HP)
-
2.5 24 52-
Zimpro MCC Feeder # 1
Zimpro MCC Feeder # 2 3,129
- - 124.17 -
- 106.18
*
*
*
*
*
****
F:\Projects\2255063\Technical\Tonawanda\TOT-Instantaneous Submetering.xls\Table 3-3 4/6/2005
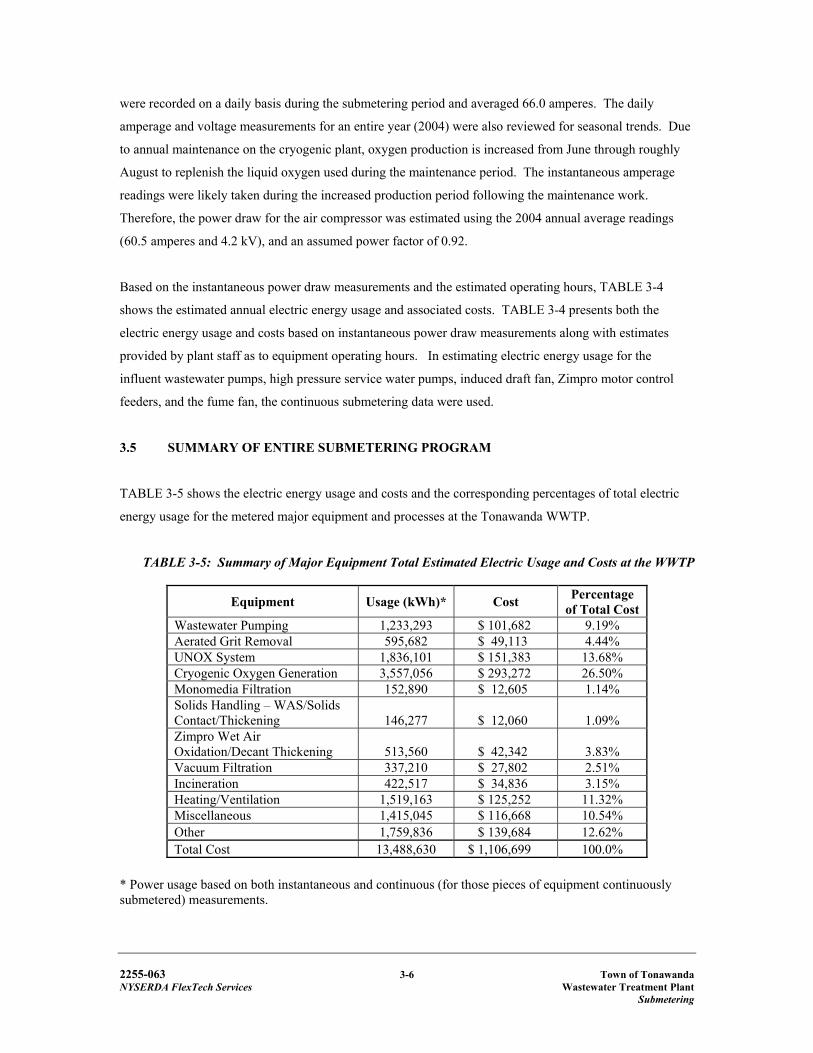
2255-063 3-6 Town of Tonawanda NYSERDA FlexTech Services Wastewater Treatment Plant Submetering
were recorded on a daily basis during the submetering period and averaged 66.0 amperes. The daily
amperage and voltage measurements for an entire year (2004) were also reviewed for seasonal trends. Due
to annual maintenance on the cryogenic plant, oxygen production is increased from June through roughly
August to replenish the liquid oxygen used during the maintenance period. The instantaneous amperage
readings were likely taken during the increased production period following the maintenance work.
Therefore, the power draw for the air compressor was estimated using the 2004 annual average readings
(60.5 amperes and 4.2 kV), and an assumed power factor of 0.92.
Based on the instantaneous power draw measurements and the estimated operating hours, TABLE 3-4
shows the estimated annual electric energy usage and associated costs. TABLE 3-4 presents both the
electric energy usage and costs based on instantaneous power draw measurements along with estimates
provided by plant staff as to equipment operating hours. In estimating electric energy usage for the
influent wastewater pumps, high pressure service water pumps, induced draft fan, Zimpro motor control
feeders, and the fume fan, the continuous submetering data were used.
3.5 SUMMARY OF ENTIRE SUBMETERING PROGRAM
TABLE 3-5 shows the electric energy usage and costs and the corresponding percentages of total electric
energy usage for the metered major equipment and processes at the Tonawanda WWTP.
TABLE 3-5: Summary of Major Equipment Total Estimated Electric Usage and Costs at the WWTP
Equipment Usage (kWh)* Cost Percentage of Total Cost
Wastewater Pumping 1,233,293 $ 101,682 9.19% Aerated Grit Removal 595,682 $ 49,113 4.44% UNOX System 1,836,101 $ 151,383 13.68% Cryogenic Oxygen Generation 3,557,056 $ 293,272 26.50% Monomedia Filtration 152,890 $ 12,605 1.14% Solids Handling – WAS/Solids Contact/Thickening 146,277 $ 12,060 1.09% Zimpro Wet Air Oxidation/Decant Thickening 513,560 $ 42,342 3.83% Vacuum Filtration 337,210 $ 27,802 2.51% Incineration 422,517 $ 34,836 3.15% Heating/Ventilation 1,519,163 $ 125,252 11.32% Miscellaneous 1,415,045 $ 116,668 10.54% Other 1,759,836 $ 139,684 12.62% Total Cost 13,488,630 $ 1,106,699 100.0%
* Power usage based on both instantaneous and continuous (for those pieces of equipment continuously submetered) measurements.
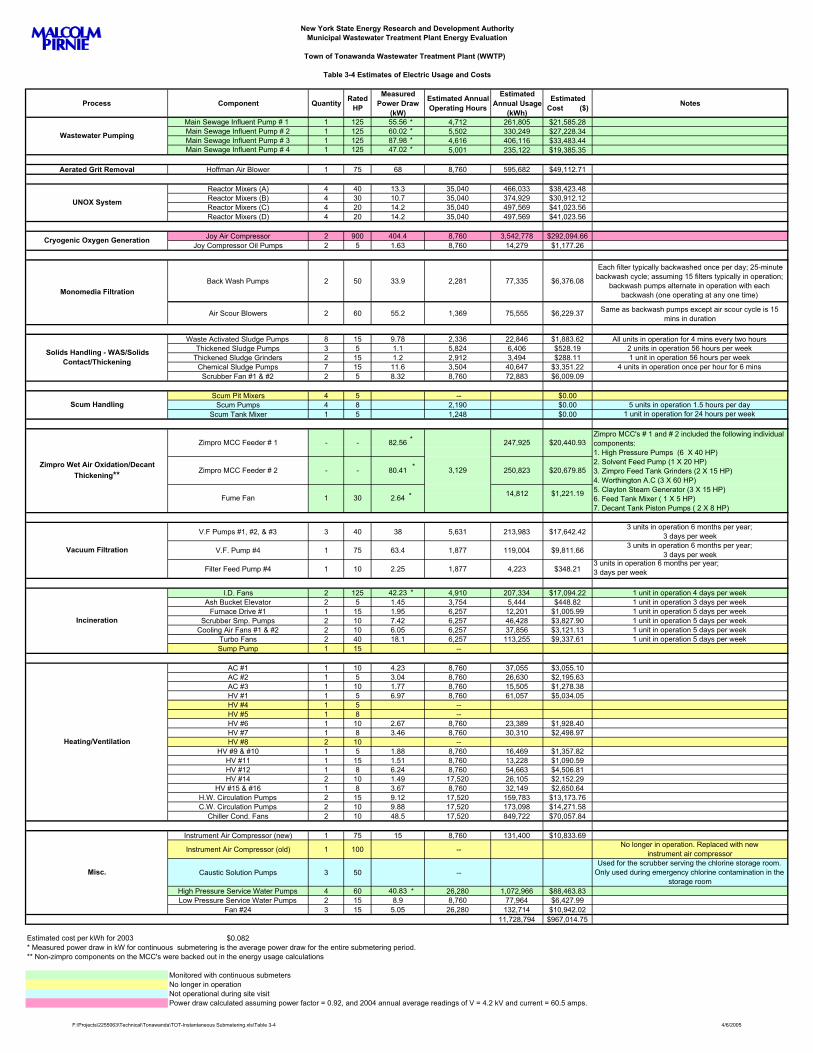
Process Component Quantity Rated HP
Measured Power Draw
(kW)
Estimated Annual Operating Hours
Estimated Annual Usage
(kWh)
Estimated Cost ($) Notes
Main Sewage Influent Pump # 1 1 125 55.56 4,712 261,805 $21,585.28Main Sewage Influent Pump # 2 1 125 60.02 5,502 330,249 $27,228.34Main Sewage Influent Pump # 3 1 125 87.98 4,616 406,116 $33,483.44Main Sewage Influent Pump # 4 1 125 47.02 5,001 235,122 $19,385.35
Aerated Grit Removal Hoffman Air Blower 1 75 68 8,760 595,682 $49,112.71
Reactor Mixers (A) 4 40 13.3 35,040 466,033 $38,423.48Reactor Mixers (B) 4 30 10.7 35,040 374,929 $30,912.12Reactor Mixers (C) 4 20 14.2 35,040 497,569 $41,023.56Reactor Mixers (D) 4 20 14.2 35,040 497,569 $41,023.56
Joy Air Compressor 2 900 404.4 8,760 3,542,778 $292,094.66Joy Compressor Oil Pumps 2 5 1.63 8,760 14,279 $1,177.26
Back Wash Pumps 2 50 33.9 2,281 77,335 $6,376.08
Each filter typically backwashed once per day; 25-minute backwash cycle; assuming 15 filters typically in operation;
backwash pumps alternate in operation with each backwash (one operating at any one time)
Air Scour Blowers 2 60 55.2 1,369 75,555 $6,229.37 Same as backwash pumps except air scour cycle is 15 mins in duration
Waste Activated Sludge Pumps 8 15 9.78 2,336 22,846 $1,883.62 All units in operation for 4 mins every two hoursThickened Sludge Pumps 3 5 1.1 5,824 6,406 $528.19 2 units in operation 56 hours per week
Thickened Sludge Grinders 2 15 1.2 2,912 3,494 $288.11 1 unit in operation 56 hours per weekChemical Sludge Pumps 7 15 11.6 3,504 40,647 $3,351.22 4 units in operation once per hour for 6 mins
Scrubber Fan #1 & #2 2 5 8.32 8,760 72,883 $6,009.09
Scum Pit Mixers 4 5 -- $0.00Scum Pumps 4 8 2,190 $0.00 5 units in operation 1.5 hours per day
Scum Tank Mixer 1 5 1,248 $0.00 1 unit in operation for 24 hours per week
V.F Pumps #1, #2, & #3 3 40 38 5,631 213,983 $17,642.423 units in operation 6 months per year;
3 days per week
V.F. Pump #4 1 75 63.4 1,877 119,004 $9,811.663 units in operation 6 months per year;
3 days per week
Filter Feed Pump #4 1 10 2.25 1,877 4,223 $348.213 units in operation 6 months per year; 3 days per week
I.D. Fans 2 125 42.23 4,910 207,334 $17,094.22 1 unit in operation 4 days per weekAsh Bucket Elevator 2 5 1.45 3,754 5,444 $448.82 1 unit in operation 3 days per week
Furnace Drive #1 1 15 1.95 6,257 12,201 $1,005.99 1 unit in operation 5 days per weekScrubber Smp. Pumps 2 10 7.42 6,257 46,428 $3,827.90 1 unit in operation 5 days per week
Cooling Air Fans #1 & #2 2 10 6.05 6,257 37,856 $3,121.13 1 unit in operation 5 days per weekTurbo Fans 2 40 18.1 6,257 113,255 $9,337.61 1 unit in operation 5 days per weekSump Pump 1 15 --
AC #1 1 10 4.23 8,760 37,055 $3,055.10AC #2 1 5 3.04 8,760 26,630 $2,195.63AC #3 1 10 1.77 8,760 15,505 $1,278.38HV #1 1 5 6.97 8,760 61,057 $5,034.05HV #4 1 5 --HV #5 1 8 --HV #6 1 10 2.67 8,760 23,389 $1,928.40HV #7 1 8 3.46 8,760 30,310 $2,498.97HV #8 2 10 --
HV #9 & #10 1 5 1.88 8,760 16,469 $1,357.82HV #11 1 15 1.51 8,760 13,228 $1,090.59HV #12 1 8 6.24 8,760 54,663 $4,506.81HV #14 2 10 1.49 17,520 26,105 $2,152.29
HV #15 & #16 1 8 3.67 8,760 32,149 $2,650.64H.W. Circulation Pumps 2 15 9.12 17,520 159,783 $13,173.76C.W. Circulation Pumps 2 10 9.88 17,520 173,098 $14,271.58
Chiller Cond. Fans 2 10 48.5 17,520 849,722 $70,057.84
Instrument Air Compressor (new) 1 75 15 8,760 131,400 $10,833.69
Instrument Air Compressor (old) 1 100 --No longer in operation. Replaced with new
instrument air compressor
Caustic Solution Pumps 3 50 --Used for the scrubber serving the chlorine storage room.
Only used during emergency chlorine contamination in the storage room
High Pressure Service Water Pumps 4 60 40.83 26,280 1,072,966 $88,463.83Low Pressure Service Water Pumps 2 15 8.9 8,760 77,964 $6,427.99
Fan #24 3 15 5.05 26,280 132,714 $10,942.0211,728,794 $967,014.75
Estimated cost per kWh for 2003 $0.082* Measured power draw in kW for continuous submetering is the average power draw for the entire submetering period.** Non-zimpro components on the MCC's were backed out in the energy usage calculations
Monitored with continuous submetersNo longer in operationNot operational during site visitPower draw calculated assuming power factor = 0.92, and 2004 annual average readings of V = 4.2 kV and current = 60.5 amps.
250,823
Zimpro MCC Feeder # 1
Zimpro MCC Feeder # 2 3,129
- - 82.56
- 80.41
Zimpro MCC's # 1 and # 2 included the following individual components: 1. High Pressure Pumps (6 X 40 HP) 2. Solvent Feed Pump (1 X 20 HP) 3. Zimpro Feed Tank Grinders (2 X 15 HP) 4. Worthington A.C (3 X 60 HP) 5. Clayton Steam Generator (3 X 15 HP) 6. Feed Tank Mixer ( 1 X 5 HP) 7. Decant Tank Piston Pumps ( 2 X 8 HP)
247,925
$20,679.85
14,812 $1,221.19
Misc.
Heating/Ventilation
30 2.64Fume Fan 1
Incineration
Vacuum Filtration
Zimpro Wet Air Oxidation/Decant Thickening** -
$20,440.93
UNOX System
Cryogenic Oxygen Generation
Solids Handling - WAS/Solids Contact/Thickening
Scum Handling
Monomedia Filtration
Wastewater Pumping
New York State Energy Research and Development AuthorityMunicipal Wastewater Treatment Plant Energy Evaluation
Town of Tonawanda Wastewater Treatment Plant (WWTP)
Table 3-4 Estimates of Electric Usage and Costs
*
*
*
*
*
****
F:\Projects\2255063\Technical\Tonawanda\TOT-Instantaneous Submetering.xls\Table 3-4 4/6/2005
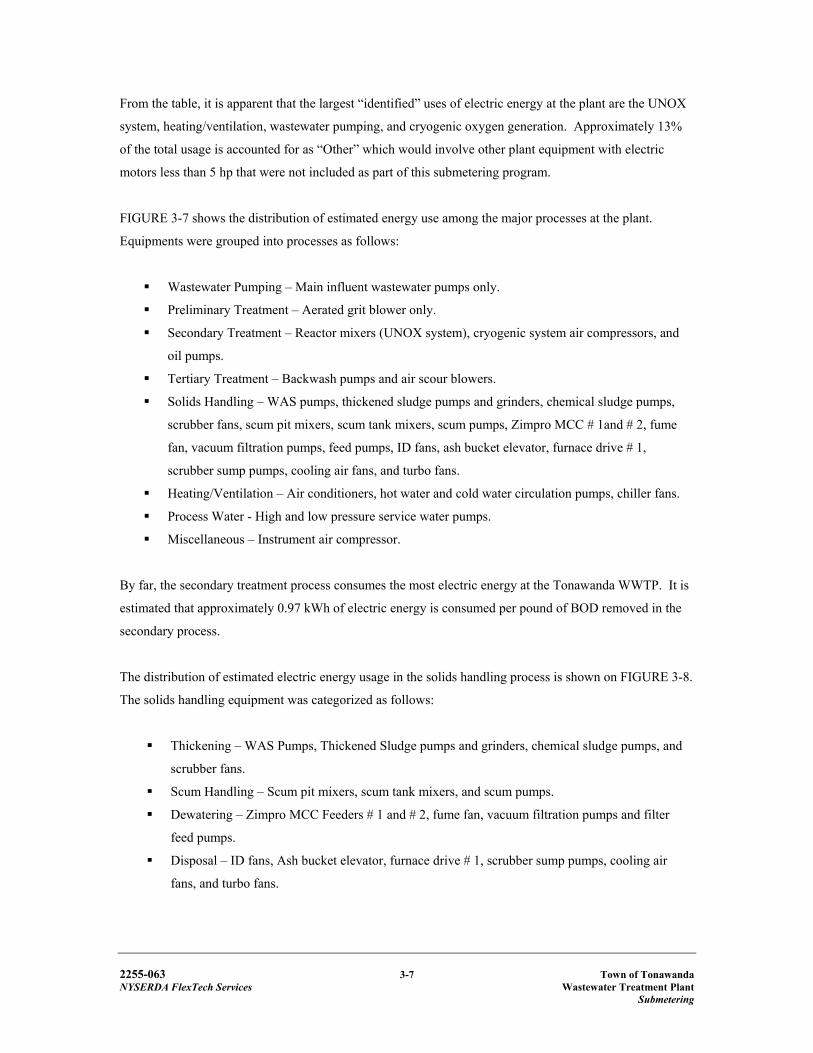
2255-063 3-7 Town of Tonawanda NYSERDA FlexTech Services Wastewater Treatment Plant Submetering
From the table, it is apparent that the largest “identified” uses of electric energy at the plant are the UNOX
system, heating/ventilation, wastewater pumping, and cryogenic oxygen generation. Approximately 13%
of the total usage is accounted for as “Other” which would involve other plant equipment with electric
motors less than 5 hp that were not included as part of this submetering program.
FIGURE 3-7 shows the distribution of estimated energy use among the major processes at the plant.
Equipments were grouped into processes as follows:
Wastewater Pumping – Main influent wastewater pumps only.
Preliminary Treatment – Aerated grit blower only.
Secondary Treatment – Reactor mixers (UNOX system), cryogenic system air compressors, and
oil pumps.
Tertiary Treatment – Backwash pumps and air scour blowers.
Solids Handling – WAS pumps, thickened sludge pumps and grinders, chemical sludge pumps,
scrubber fans, scum pit mixers, scum tank mixers, scum pumps, Zimpro MCC # 1and # 2, fume
fan, vacuum filtration pumps, feed pumps, ID fans, ash bucket elevator, furnace drive # 1,
scrubber sump pumps, cooling air fans, and turbo fans.
Heating/Ventilation – Air conditioners, hot water and cold water circulation pumps, chiller fans.
Process Water - High and low pressure service water pumps.
Miscellaneous – Instrument air compressor.
By far, the secondary treatment process consumes the most electric energy at the Tonawanda WWTP. It is
estimated that approximately 0.97 kWh of electric energy is consumed per pound of BOD removed in the
secondary process.
The distribution of estimated electric energy usage in the solids handling process is shown on FIGURE 3-8.
The solids handling equipment was categorized as follows:
Thickening – WAS Pumps, Thickened Sludge pumps and grinders, chemical sludge pumps, and
scrubber fans.
Scum Handling – Scum pit mixers, scum tank mixers, and scum pumps.
Dewatering – Zimpro MCC Feeders # 1 and # 2, fume fan, vacuum filtration pumps and filter
feed pumps.
Disposal – ID fans, Ash bucket elevator, furnace drive # 1, scrubber sump pumps, cooling air
fans, and turbo fans.
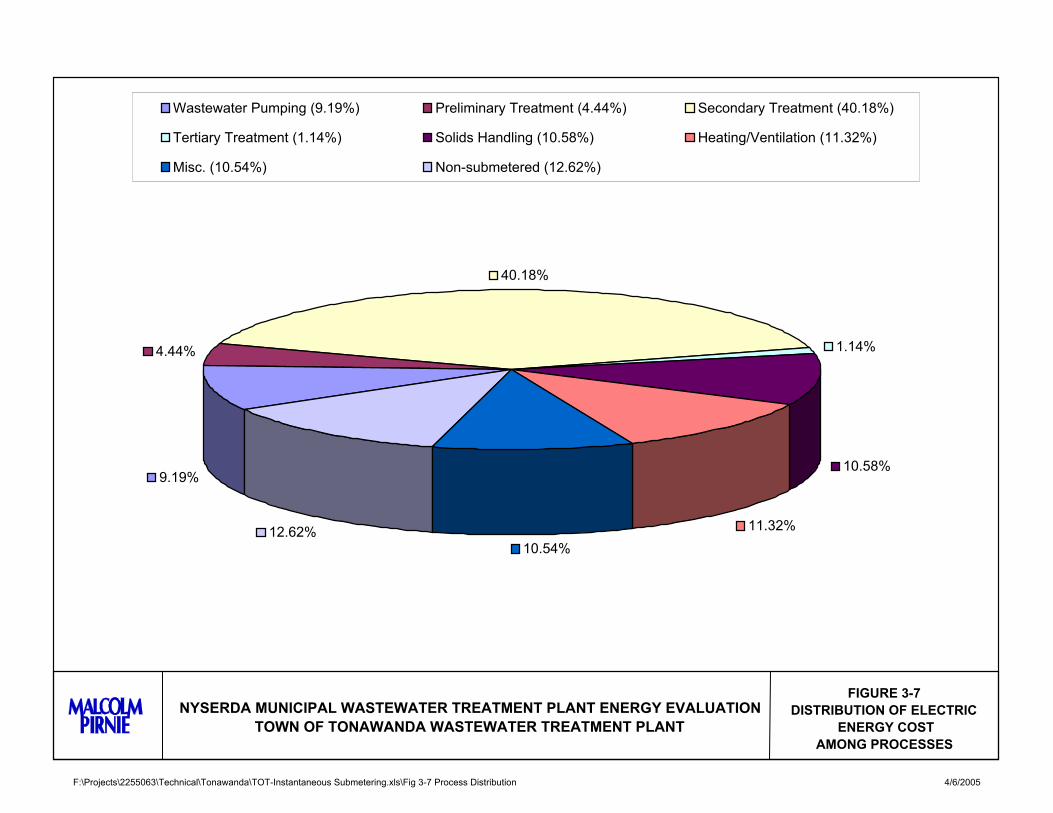
F:\Projects\2255063\Technical\Tonawanda\TOT-Instantaneous Submetering.xls\Fig 3-7 Process Distribution 4/6/2005
9.19%
4.44%
40.18%
1.14%
10.58%
11.32%10.54%
12.62%
Wastewater Pumping (9.19%) Preliminary Treatment (4.44%) Secondary Treatment (40.18%)
Tertiary Treatment (1.14%) Solids Handling (10.58%) Heating/Ventilation (11.32%)
Misc. (10.54%) Non-submetered (12.62%)
FIGURE 3-7DISTRIBUTION OF ELECTRIC
ENERGY COST AMONG PROCESSES
NYSERDA MUNICIPAL WASTEWATER TREATMENT PLANT ENERGY EVALUATIONTOWN OF TONAWANDA WASTEWATER TREATMENT PLANT
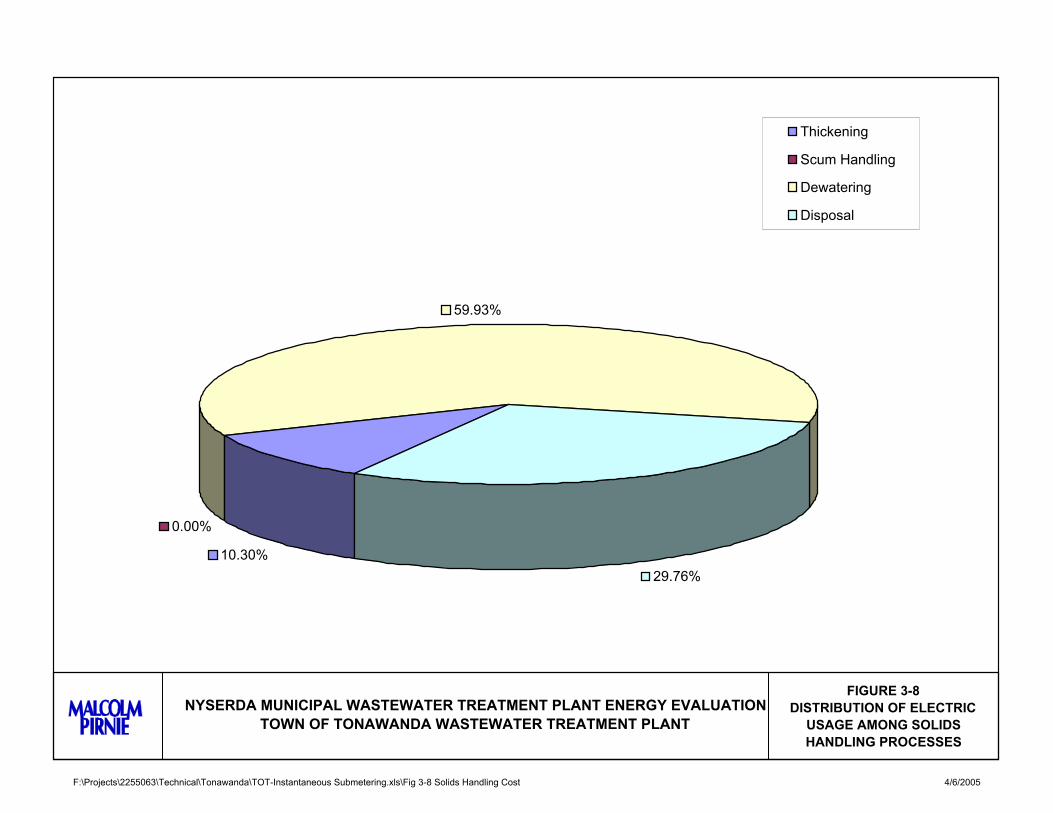
F:\Projects\2255063\Technical\Tonawanda\TOT-Instantaneous Submetering.xls\Fig 3-8 Solids Handling Cost 4/6/2005
10.30%
0.00%
59.93%
29.76%
Thickening
Scum Handling
Dewatering
Disposal
FIGURE 3-8DISTRIBUTION OF ELECTRIC
USAGE AMONG SOLIDS HANDLING PROCESSES
NYSERDA MUNICIPAL WASTEWATER TREATMENT PLANT ENERGY EVALUATIONTOWN OF TONAWANDA WASTEWATER TREATMENT PLANT

2255-063 3-8 Town of Tonawanda NYSERDA FlexTech Services Wastewater Treatment Plant Submetering
As expected, the dewatering (Zimpro Wet Air Oxidation and vacuum filtration) portion consumes the
majority of the electric energy in the solids handling processes.
2255-063 4-1 Town of Tonawanda NYSERDA FlexTech Services Wastewater Treatment Plant Submetering
Section 4.0
PROCESS PERFORMANCE DURING SUBMETERING
Process data were also collected during the continuous submetering period. These data were compared
with historical plant data to determine if the operation during submetering and corresponding energy usage
could be considered typical for the Town of Tonawanda WWTP.
4.1 SUMMARY OF PROCESS PERFORMANCE PARAMETER MONITORING
For the duration of the submetering program, the following daily process performance data were collected:
Influent flows, Influent and Effluent BOD5
Influent and Effluent TSS
Return Activated Sludge (RAS) flow rate
Waste Activated Sludge (WAS) flow rate
Oxygen Generation Data - Flow, oxygen gas purity, and vent gas purity
High Pressure Service Water flow rate and pressure
Zimpro and Vacuum Filtration process data (flow, percent solids)
FIGURE 4-1 shows the influent and effluent BOD5 concentrations during the course of the submetering
program. In general, the BOD5 concentrations are affected by plant flow during peak flows (BOD5 tends to
decrease with increase flow). FIGURE 4-2 shows the relationship between BOD5 loading (in pounds per
day) and plant flow. The figure shows no strong correlation between flow and influent BOD5 loading.
FIGURES 4-3 and 4-4 show the influent and effluent TSS concentrations and loadings and plant flows.
The data shows no strong correlation between TSS concentrations and plant flow. TSS loadings and flows
appear to have a stronger correlation with higher TSS loadings observed during periods of higher flow.
The return activated sludge flow rate was maintained at an average of 4.9 MGD. Approximately 2% of the
total activated sludge was wasted as WAS, at an average flow rate of 0.1 MGD.
The most relevant data are summarized in TABLE 4-1. Parameters were compared to historical values.
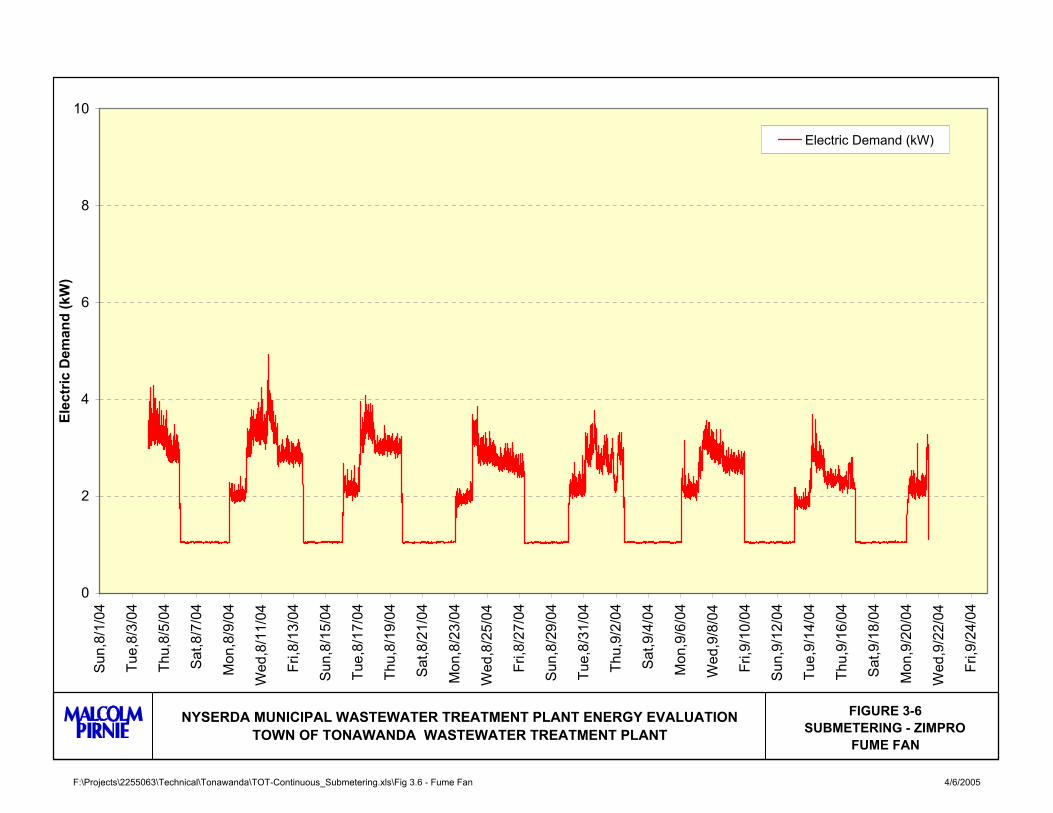
F:\Projects\2255063\Technical\Tonawanda\TOT-Continuous_Submetering.xls\Fig 3.6 - Fume Fan 4/6/2005
0
2
4
6
8
10S
un,8
/1/0
4
Tue,
8/3/
04
Thu,
8/5/
04
Sat
,8/7
/04
Mon
,8/9
/04
Wed
,8/1
1/04
Fri,8
/13/
04
Sun
,8/1
5/04
Tue,
8/17
/04
Thu,
8/19
/04
Sat
,8/2
1/04
Mon
,8/2
3/04
Wed
,8/2
5/04
Fri,8
/27/
04
Sun
,8/2
9/04
Tue,
8/31
/04
Thu,
9/2/
04
Sat
,9/4
/04
Mon
,9/6
/04
Wed
,9/8
/04
Fri,9
/10/
04
Sun
,9/1
2/04
Tue,
9/14
/04
Thu,
9/16
/04
Sat
,9/1
8/04
Mon
,9/2
0/04
Wed
,9/2
2/04
Fri,9
/24/
04
Elec
tric
Dem
and
(kW
)
Electric Demand (kW)
FIGURE 3-6SUBMETERING - ZIMPRO
FUME FAN
NYSERDA MUNICIPAL WASTEWATER TREATMENT PLANT ENERGY EVALUATIONTOWN OF TONAWANDA WASTEWATER TREATMENT PLANT
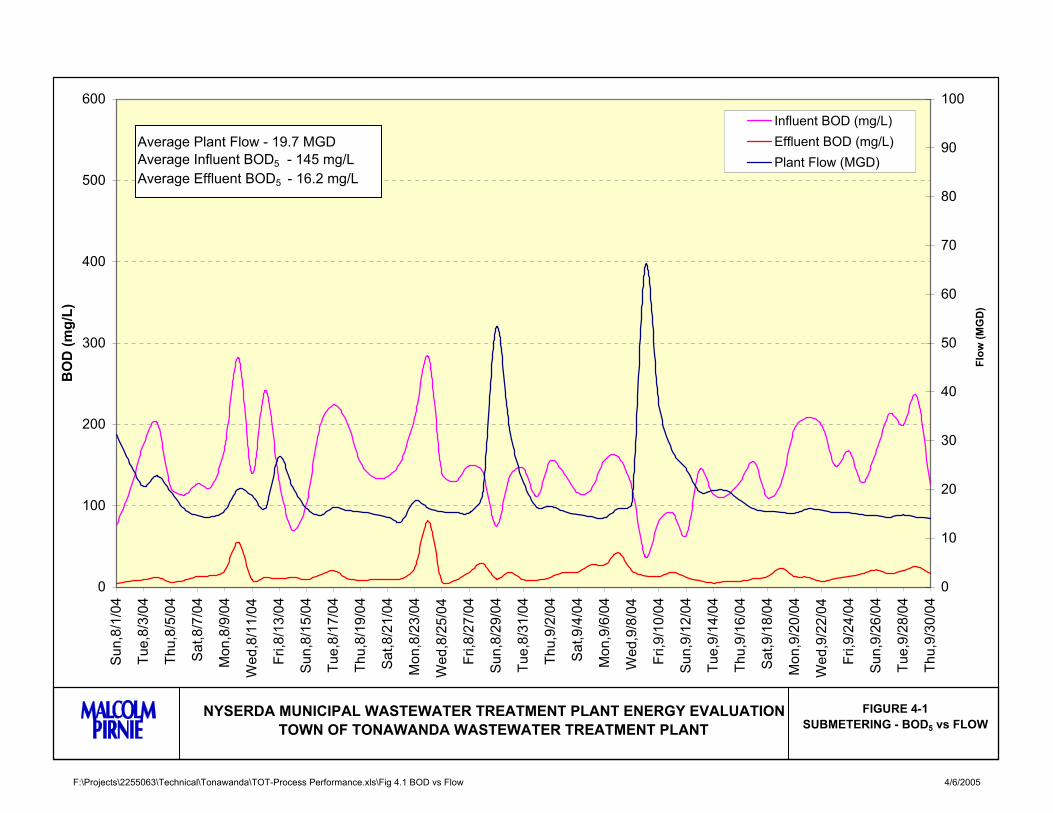
F:\Projects\2255063\Technical\Tonawanda\TOT-Process Performance.xls\Fig 4.1 BOD vs Flow 4/6/2005
0
100
200
300
400
500
600S
un,8
/1/0
4
Tue,
8/3/
04
Thu,
8/5/
04
Sat
,8/7
/04
Mon
,8/9
/04
Wed
,8/1
1/04
Fri,8
/13/
04
Sun
,8/1
5/04
Tue,
8/17
/04
Thu,
8/19
/04
Sat
,8/2
1/04
Mon
,8/2
3/04
Wed
,8/2
5/04
Fri,8
/27/
04
Sun
,8/2
9/04
Tue,
8/31
/04
Thu,
9/2/
04
Sat
,9/4
/04
Mon
,9/6
/04
Wed
,9/8
/04
Fri,9
/10/
04
Sun
,9/1
2/04
Tue,
9/14
/04
Thu,
9/16
/04
Sat
,9/1
8/04
Mon
,9/2
0/04
Wed
,9/2
2/04
Fri,9
/24/
04
Sun
,9/2
6/04
Tue,
9/28
/04
Thu,
9/30
/04
BO
D (m
g/L)
0
10
20
30
40
50
60
70
80
90
100
Flow
(MG
D)
Influent BOD (mg/L)Effluent BOD (mg/L)Plant Flow (MGD)
FIGURE 4-1SUBMETERING - BOD5 vs FLOW
NYSERDA MUNICIPAL WASTEWATER TREATMENT PLANT ENERGY EVALUATIONTOWN OF TONAWANDA WASTEWATER TREATMENT PLANT
Average Plant Flow - 19.7 MGDAverage Influent BOD5 - 145 mg/LAverage Effluent BOD5 - 16.2 mg/L
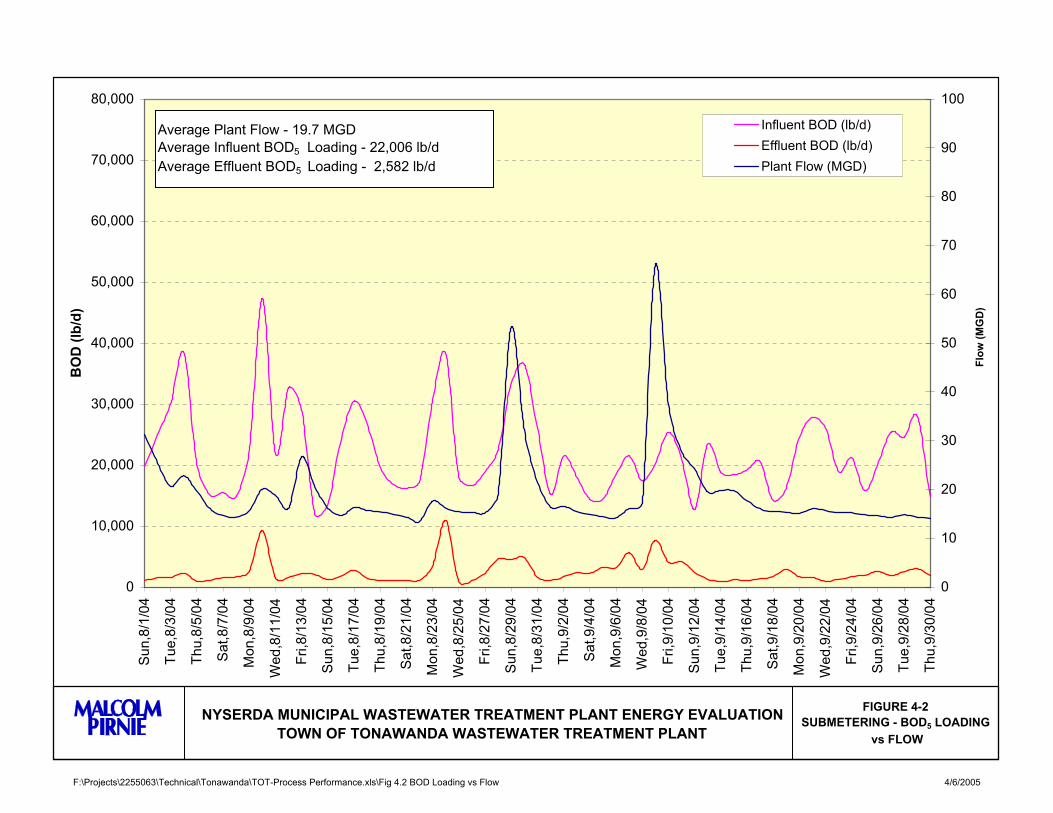
F:\Projects\2255063\Technical\Tonawanda\TOT-Process Performance.xls\Fig 4.2 BOD Loading vs Flow 4/6/2005
0
10,000
20,000
30,000
40,000
50,000
60,000
70,000
80,000
Sun
,8/1
/04
Tue,
8/3/
04
Thu,
8/5/
04
Sat
,8/7
/04
Mon
,8/9
/04
Wed
,8/1
1/04
Fri,8
/13/
04
Sun
,8/1
5/04
Tue,
8/17
/04
Thu,
8/19
/04
Sat
,8/2
1/04
Mon
,8/2
3/04
Wed
,8/2
5/04
Fri,8
/27/
04
Sun
,8/2
9/04
Tue,
8/31
/04
Thu,
9/2/
04
Sat
,9/4
/04
Mon
,9/6
/04
Wed
,9/8
/04
Fri,9
/10/
04
Sun
,9/1
2/04
Tue,
9/14
/04
Thu,
9/16
/04
Sat
,9/1
8/04
Mon
,9/2
0/04
Wed
,9/2
2/04
Fri,9
/24/
04
Sun
,9/2
6/04
Tue,
9/28
/04
Thu,
9/30
/04
BO
D (l
b/d)
0
10
20
30
40
50
60
70
80
90
100
Flow
(MG
D)
Influent BOD (lb/d)Effluent BOD (lb/d)Plant Flow (MGD)
FIGURE 4-2SUBMETERING - BOD5 LOADING
vs FLOW
NYSERDA MUNICIPAL WASTEWATER TREATMENT PLANT ENERGY EVALUATIONTOWN OF TONAWANDA WASTEWATER TREATMENT PLANT
Average Plant Flow - 19.7 MGDAverage Influent BOD5 Loading - 22,006 lb/dAverage Effluent BOD5 Loading - 2,582 lb/d
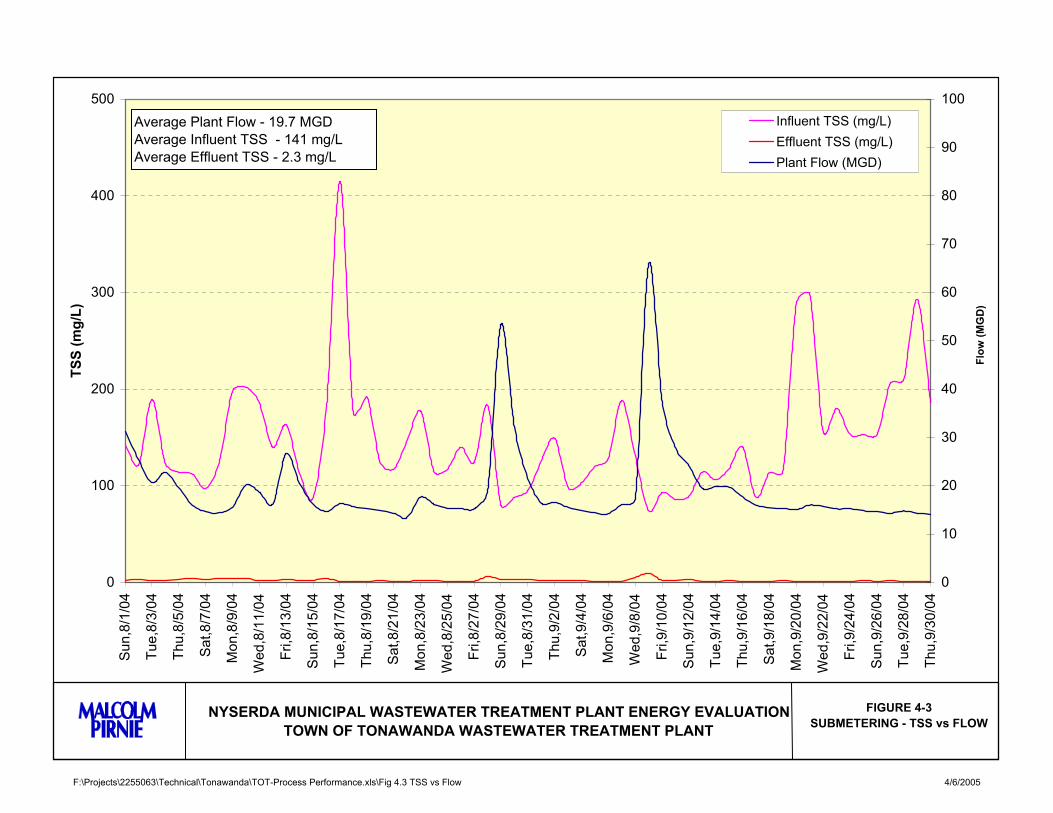
F:\Projects\2255063\Technical\Tonawanda\TOT-Process Performance.xls\Fig 4.3 TSS vs Flow 4/6/2005
0
100
200
300
400
500
Sun
,8/1
/04
Tue,
8/3/
04
Thu,
8/5/
04
Sat
,8/7
/04
Mon
,8/9
/04
Wed
,8/1
1/04
Fri,8
/13/
04
Sun
,8/1
5/04
Tue,
8/17
/04
Thu,
8/19
/04
Sat
,8/2
1/04
Mon
,8/2
3/04
Wed
,8/2
5/04
Fri,8
/27/
04
Sun
,8/2
9/04
Tue,
8/31
/04
Thu,
9/2/
04
Sat
,9/4
/04
Mon
,9/6
/04
Wed
,9/8
/04
Fri,9
/10/
04
Sun
,9/1
2/04
Tue,
9/14
/04
Thu,
9/16
/04
Sat
,9/1
8/04
Mon
,9/2
0/04
Wed
,9/2
2/04
Fri,9
/24/
04
Sun
,9/2
6/04
Tue,
9/28
/04
Thu,
9/30
/04
TSS
(mg/
L)
0
10
20
30
40
50
60
70
80
90
100
Flow
(MG
D)
Influent TSS (mg/L)Effluent TSS (mg/L)Plant Flow (MGD)
FIGURE 4-3SUBMETERING - TSS vs FLOW
NYSERDA MUNICIPAL WASTEWATER TREATMENT PLANT ENERGY EVALUATIONTOWN OF TONAWANDA WASTEWATER TREATMENT PLANT
Average Plant Flow - 19.7 MGDAverage Influent TSS - 141 mg/LAverage Effluent TSS - 2.3 mg/L
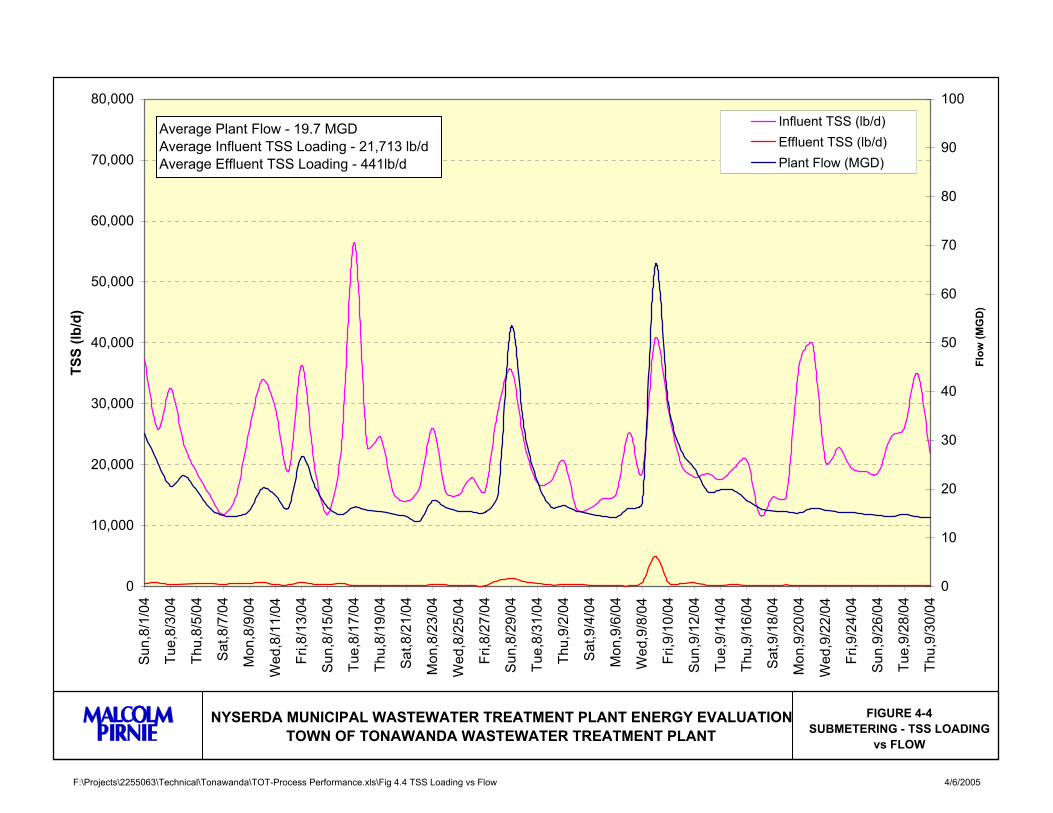
F:\Projects\2255063\Technical\Tonawanda\TOT-Process Performance.xls\Fig 4.4 TSS Loading vs Flow 4/6/2005
0
10,000
20,000
30,000
40,000
50,000
60,000
70,000
80,000
Sun
,8/1
/04
Tue,
8/3/
04
Thu,
8/5/
04
Sat
,8/7
/04
Mon
,8/9
/04
Wed
,8/1
1/04
Fri,8
/13/
04
Sun
,8/1
5/04
Tue,
8/17
/04
Thu,
8/19
/04
Sat
,8/2
1/04
Mon
,8/2
3/04
Wed
,8/2
5/04
Fri,8
/27/
04
Sun
,8/2
9/04
Tue,
8/31
/04
Thu,
9/2/
04
Sat
,9/4
/04
Mon
,9/6
/04
Wed
,9/8
/04
Fri,9
/10/
04
Sun
,9/1
2/04
Tue,
9/14
/04
Thu,
9/16
/04
Sat
,9/1
8/04
Mon
,9/2
0/04
Wed
,9/2
2/04
Fri,9
/24/
04
Sun
,9/2
6/04
Tue,
9/28
/04
Thu,
9/30
/04
TSS
(lb/d
)
0
10
20
30
40
50
60
70
80
90
100
Flow
(MG
D)
Influent TSS (lb/d)Effluent TSS (lb/d)Plant Flow (MGD)
FIGURE 4-4SUBMETERING - TSS LOADING
vs FLOW
NYSERDA MUNICIPAL WASTEWATER TREATMENT PLANT ENERGY EVALUATIONTOWN OF TONAWANDA WASTEWATER TREATMENT PLANT
Average Plant Flow - 19.7 MGDAverage Influent TSS Loading - 21,713 lb/dAverage Effluent TSS Loading - 441lb/d
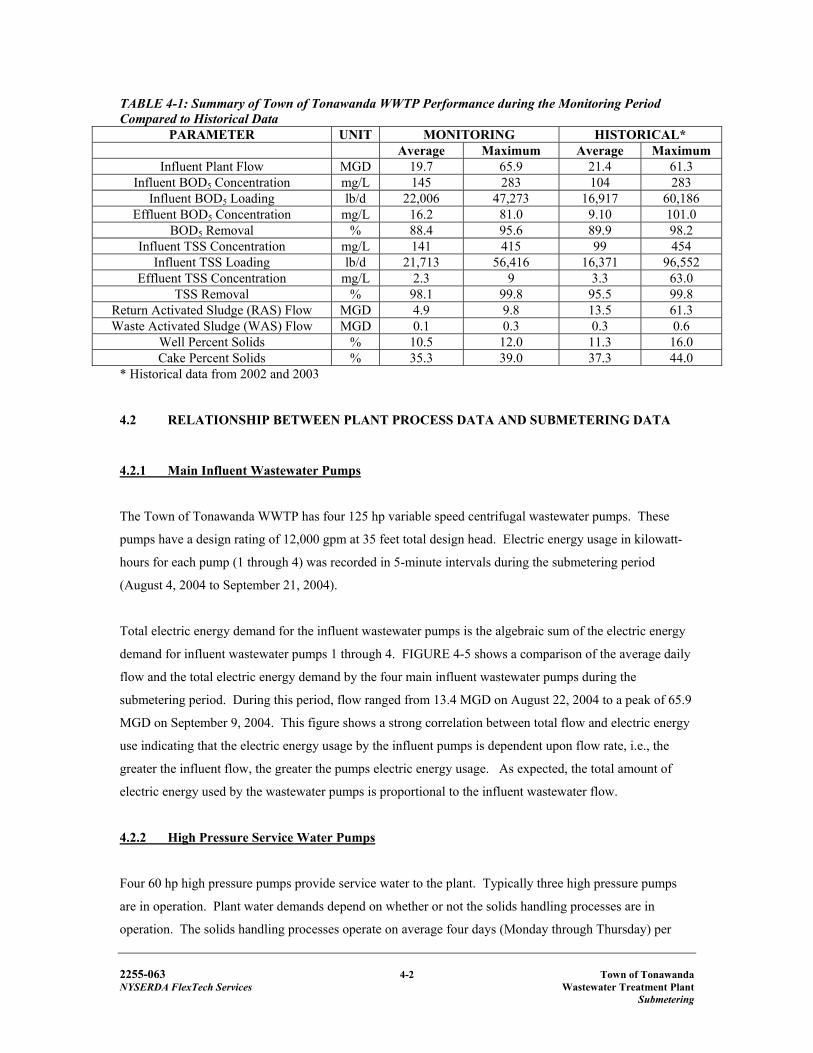
2255-063 4-2 Town of Tonawanda NYSERDA FlexTech Services Wastewater Treatment Plant Submetering
TABLE 4-1: Summary of Town of Tonawanda WWTP Performance during the Monitoring Period Compared to Historical Data
PARAMETER UNIT MONITORING HISTORICAL* Average Maximum Average Maximum
Influent Plant Flow MGD 19.7 65.9 21.4 61.3 Influent BOD5 Concentration mg/L 145 283 104 283
Influent BOD5 Loading lb/d 22,006 47,273 16,917 60,186 Effluent BOD5 Concentration mg/L 16.2 81.0 9.10 101.0
BOD5 Removal % 88.4 95.6 89.9 98.2 Influent TSS Concentration mg/L 141 415 99 454
Influent TSS Loading lb/d 21,713 56,416 16,371 96,552 Effluent TSS Concentration mg/L 2.3 9 3.3 63.0
TSS Removal % 98.1 99.8 95.5 99.8 Return Activated Sludge (RAS) Flow MGD 4.9 9.8 13.5 61.3 Waste Activated Sludge (WAS) Flow MGD 0.1 0.3 0.3 0.6
Well Percent Solids % 10.5 12.0 11.3 16.0 Cake Percent Solids % 35.3 39.0 37.3 44.0
* Historical data from 2002 and 2003
4.2 RELATIONSHIP BETWEEN PLANT PROCESS DATA AND SUBMETERING DATA
4.2.1 Main Influent Wastewater Pumps
The Town of Tonawanda WWTP has four 125 hp variable speed centrifugal wastewater pumps. These
pumps have a design rating of 12,000 gpm at 35 feet total design head. Electric energy usage in kilowatt-
hours for each pump (1 through 4) was recorded in 5-minute intervals during the submetering period
(August 4, 2004 to September 21, 2004).
Total electric energy demand for the influent wastewater pumps is the algebraic sum of the electric energy
demand for influent wastewater pumps 1 through 4. FIGURE 4-5 shows a comparison of the average daily
flow and the total electric energy demand by the four main influent wastewater pumps during the
submetering period. During this period, flow ranged from 13.4 MGD on August 22, 2004 to a peak of 65.9
MGD on September 9, 2004. This figure shows a strong correlation between total flow and electric energy
use indicating that the electric energy usage by the influent pumps is dependent upon flow rate, i.e., the
greater the influent flow, the greater the pumps electric energy usage. As expected, the total amount of
electric energy used by the wastewater pumps is proportional to the influent wastewater flow.
4.2.2 High Pressure Service Water Pumps
Four 60 hp high pressure pumps provide service water to the plant. Typically three high pressure pumps
are in operation. Plant water demands depend on whether or not the solids handling processes are in
operation. The solids handling processes operate on average four days (Monday through Thursday) per
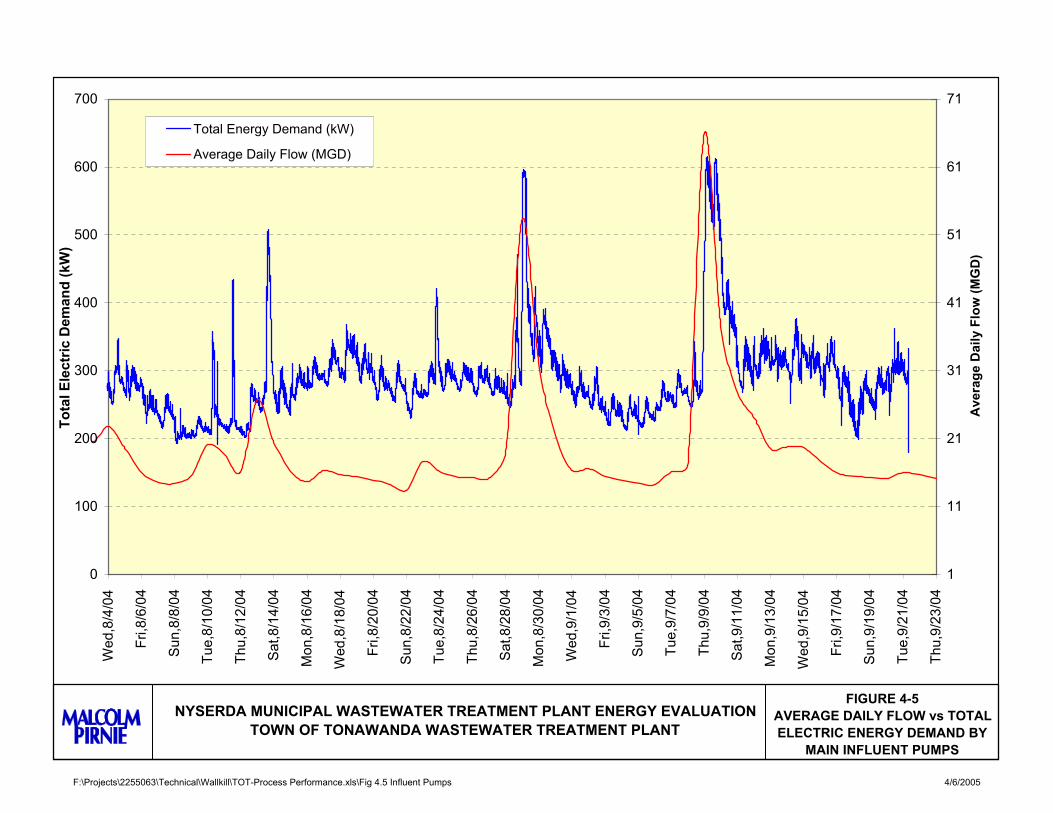
F:\Projects\2255063\Technical\Wallkill\TOT-Process Performance.xls\Fig 4.5 Influent Pumps 4/6/2005
0
100
200
300
400
500
600
700W
ed,8
/4/0
4
Fri,8
/6/0
4
Sun
,8/8
/04
Tue,
8/10
/04
Thu,
8/12
/04
Sat
,8/1
4/04
Mon
,8/1
6/04
Wed
,8/1
8/04
Fri,8
/20/
04
Sun
,8/2
2/04
Tue,
8/24
/04
Thu,
8/26
/04
Sat
,8/2
8/04
Mon
,8/3
0/04
Wed
,9/1
/04
Fri,9
/3/0
4
Sun
,9/5
/04
Tue,
9/7/
04
Thu,
9/9/
04
Sat
,9/1
1/04
Mon
,9/1
3/04
Wed
,9/1
5/04
Fri,9
/17/
04
Sun
,9/1
9/04
Tue,
9/21
/04
Thu,
9/23
/04
Tota
l Ele
ctric
Dem
and
(kW
)
1
11
21
31
41
51
61
71
Ave
rage
Dai
ly F
low
(MG
D)
Total Energy Demand (kW)
Average Daily Flow (MGD)
FIGURE 4-5AVERAGE DAILY FLOW vs TOTAL ELECTRIC ENERGY DEMAND BY
MAIN INFLUENT PUMPS
NYSERDA MUNICIPAL WASTEWATER TREATMENT PLANT ENERGY EVALUATIONTOWN OF TONAWANDA WASTEWATER TREATMENT PLANT
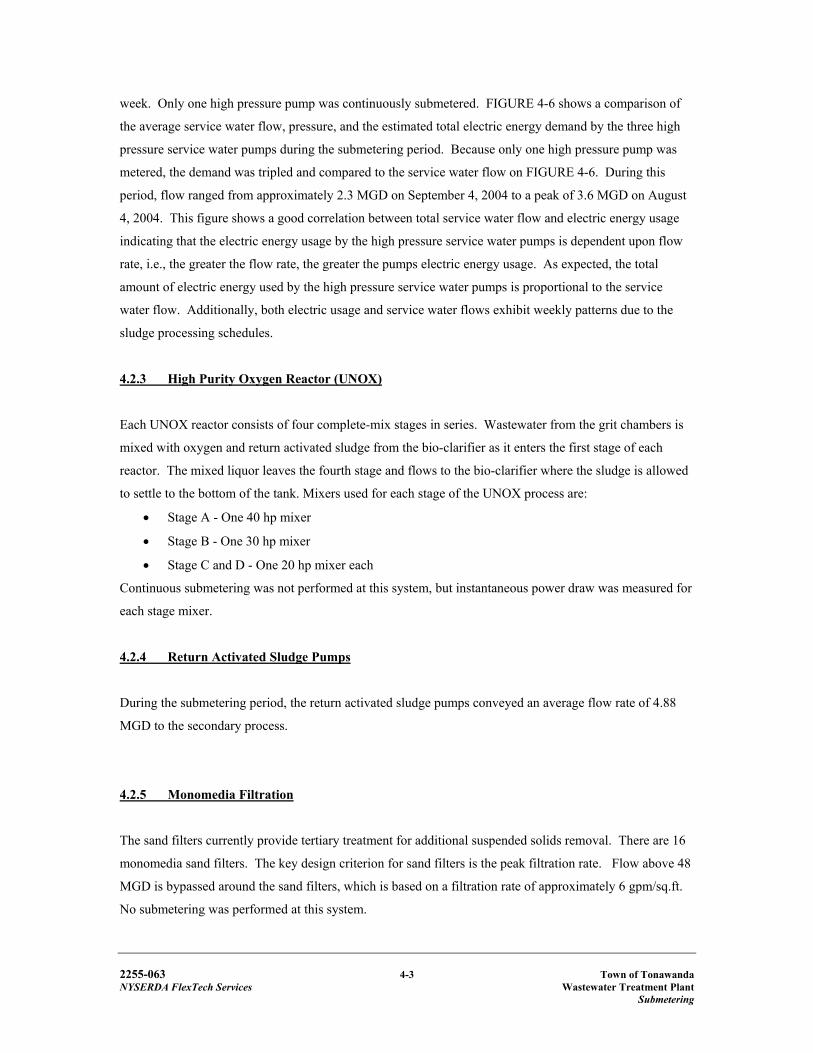
2255-063 4-3 Town of Tonawanda NYSERDA FlexTech Services Wastewater Treatment Plant Submetering
week. Only one high pressure pump was continuously submetered. FIGURE 4-6 shows a comparison of
the average service water flow, pressure, and the estimated total electric energy demand by the three high
pressure service water pumps during the submetering period. Because only one high pressure pump was
metered, the demand was tripled and compared to the service water flow on FIGURE 4-6. During this
period, flow ranged from approximately 2.3 MGD on September 4, 2004 to a peak of 3.6 MGD on August
4, 2004. This figure shows a good correlation between total service water flow and electric energy usage
indicating that the electric energy usage by the high pressure service water pumps is dependent upon flow
rate, i.e., the greater the flow rate, the greater the pumps electric energy usage. As expected, the total
amount of electric energy used by the high pressure service water pumps is proportional to the service
water flow. Additionally, both electric usage and service water flows exhibit weekly patterns due to the
sludge processing schedules.
4.2.3 High Purity Oxygen Reactor (UNOX)
Each UNOX reactor consists of four complete-mix stages in series. Wastewater from the grit chambers is
mixed with oxygen and return activated sludge from the bio-clarifier as it enters the first stage of each
reactor. The mixed liquor leaves the fourth stage and flows to the bio-clarifier where the sludge is allowed
to settle to the bottom of the tank. Mixers used for each stage of the UNOX process are:
• Stage A - One 40 hp mixer
• Stage B - One 30 hp mixer
• Stage C and D - One 20 hp mixer each
Continuous submetering was not performed at this system, but instantaneous power draw was measured for
each stage mixer.
4.2.4 Return Activated Sludge Pumps
During the submetering period, the return activated sludge pumps conveyed an average flow rate of 4.88
MGD to the secondary process.
4.2.5 Monomedia Filtration
The sand filters currently provide tertiary treatment for additional suspended solids removal. There are 16
monomedia sand filters. The key design criterion for sand filters is the peak filtration rate. Flow above 48
MGD is bypassed around the sand filters, which is based on a filtration rate of approximately 6 gpm/sq.ft.
No submetering was performed at this system.
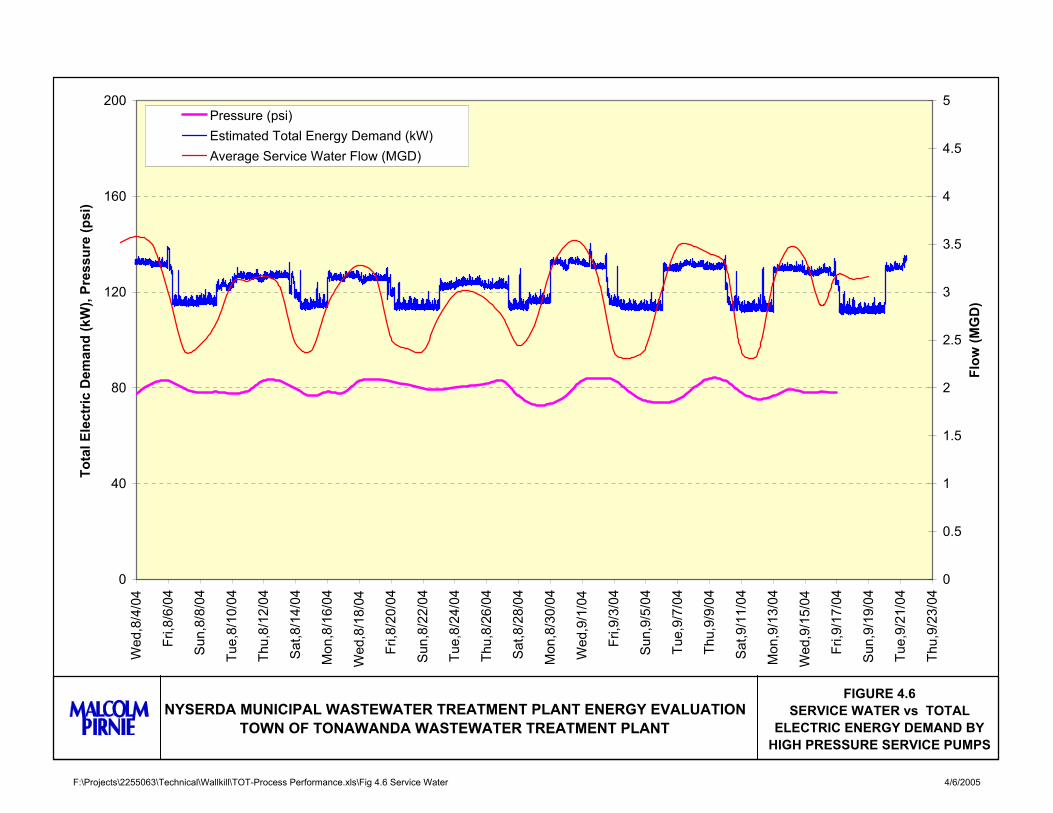
F:\Projects\2255063\Technical\Wallkill\TOT-Process Performance.xls\Fig 4.6 Service Water 4/6/2005
0
40
80
120
160
200
Wed
,8/4
/04
Fri,8
/6/0
4
Sun
,8/8
/04
Tue,
8/10
/04
Thu,
8/12
/04
Sat
,8/1
4/04
Mon
,8/1
6/04
Wed
,8/1
8/04
Fri,8
/20/
04
Sun
,8/2
2/04
Tue,
8/24
/04
Thu,
8/26
/04
Sat
,8/2
8/04
Mon
,8/3
0/04
Wed
,9/1
/04
Fri,9
/3/0
4
Sun
,9/5
/04
Tue,
9/7/
04
Thu,
9/9/
04
Sat
,9/1
1/04
Mon
,9/1
3/04
Wed
,9/1
5/04
Fri,9
/17/
04
Sun
,9/1
9/04
Tue,
9/21
/04
Thu,
9/23
/04
Tota
l Ele
ctric
Dem
and
(kW
), Pr
essu
re (p
si)
0
0.5
1
1.5
2
2.5
3
3.5
4
4.5
5
Flow
(MG
D)
Pressure (psi)Estimated Total Energy Demand (kW)Average Service Water Flow (MGD)
FIGURE 4.6SERVICE WATER vs TOTAL
ELECTRIC ENERGY DEMAND BY HIGH PRESSURE SERVICE PUMPS
NYSERDA MUNICIPAL WASTEWATER TREATMENT PLANT ENERGY EVALUATIONTOWN OF TONAWANDA WASTEWATER TREATMENT PLANT
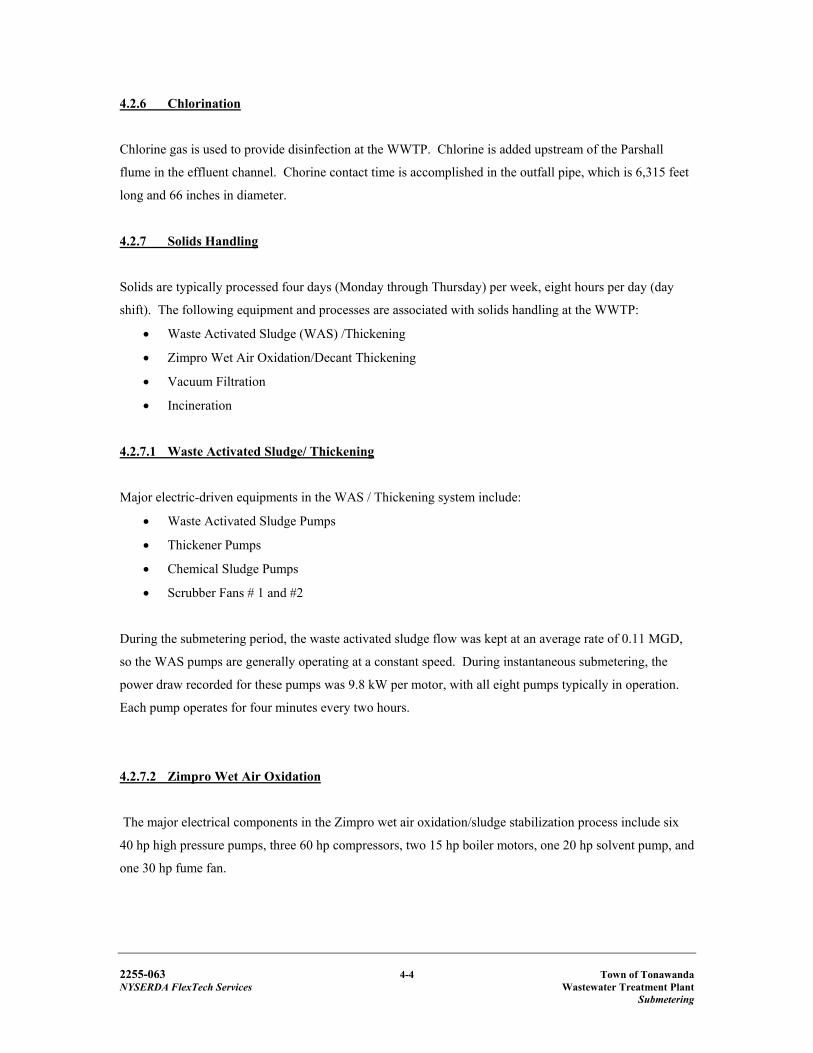
2255-063 4-4 Town of Tonawanda NYSERDA FlexTech Services Wastewater Treatment Plant Submetering
4.2.6 Chlorination
Chlorine gas is used to provide disinfection at the WWTP. Chlorine is added upstream of the Parshall
flume in the effluent channel. Chorine contact time is accomplished in the outfall pipe, which is 6,315 feet
long and 66 inches in diameter.
4.2.7 Solids Handling
Solids are typically processed four days (Monday through Thursday) per week, eight hours per day (day
shift). The following equipment and processes are associated with solids handling at the WWTP:
• Waste Activated Sludge (WAS) /Thickening
• Zimpro Wet Air Oxidation/Decant Thickening
• Vacuum Filtration
• Incineration
4.2.7.1 Waste Activated Sludge/ Thickening
Major electric-driven equipments in the WAS / Thickening system include:
• Waste Activated Sludge Pumps
• Thickener Pumps
• Chemical Sludge Pumps
• Scrubber Fans # 1 and #2
During the submetering period, the waste activated sludge flow was kept at an average rate of 0.11 MGD,
so the WAS pumps are generally operating at a constant speed. During instantaneous submetering, the
power draw recorded for these pumps was 9.8 kW per motor, with all eight pumps typically in operation.
Each pump operates for four minutes every two hours.
4.2.7.2 Zimpro Wet Air Oxidation
The major electrical components in the Zimpro wet air oxidation/sludge stabilization process include six
40 hp high pressure pumps, three 60 hp compressors, two 15 hp boiler motors, one 20 hp solvent pump, and
one 30 hp fume fan.
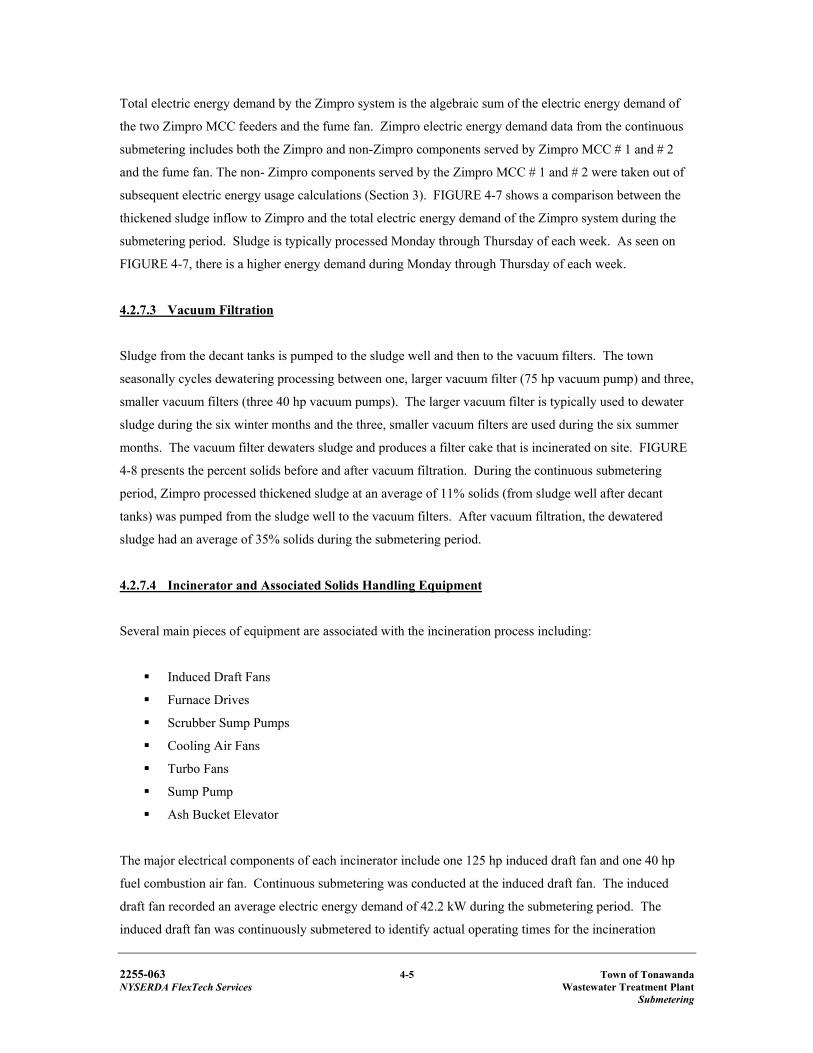
2255-063 4-5 Town of Tonawanda NYSERDA FlexTech Services Wastewater Treatment Plant Submetering
Total electric energy demand by the Zimpro system is the algebraic sum of the electric energy demand of
the two Zimpro MCC feeders and the fume fan. Zimpro electric energy demand data from the continuous
submetering includes both the Zimpro and non-Zimpro components served by Zimpro MCC # 1 and # 2
and the fume fan. The non- Zimpro components served by the Zimpro MCC # 1 and # 2 were taken out of
subsequent electric energy usage calculations (Section 3). FIGURE 4-7 shows a comparison between the
thickened sludge inflow to Zimpro and the total electric energy demand of the Zimpro system during the
submetering period. Sludge is typically processed Monday through Thursday of each week. As seen on
FIGURE 4-7, there is a higher energy demand during Monday through Thursday of each week.
4.2.7.3 Vacuum Filtration
Sludge from the decant tanks is pumped to the sludge well and then to the vacuum filters. The town
seasonally cycles dewatering processing between one, larger vacuum filter (75 hp vacuum pump) and three,
smaller vacuum filters (three 40 hp vacuum pumps). The larger vacuum filter is typically used to dewater
sludge during the six winter months and the three, smaller vacuum filters are used during the six summer
months. The vacuum filter dewaters sludge and produces a filter cake that is incinerated on site. FIGURE
4-8 presents the percent solids before and after vacuum filtration. During the continuous submetering
period, Zimpro processed thickened sludge at an average of 11% solids (from sludge well after decant
tanks) was pumped from the sludge well to the vacuum filters. After vacuum filtration, the dewatered
sludge had an average of 35% solids during the submetering period.
4.2.7.4 Incinerator and Associated Solids Handling Equipment
Several main pieces of equipment are associated with the incineration process including:
Induced Draft Fans
Furnace Drives
Scrubber Sump Pumps
Cooling Air Fans
Turbo Fans
Sump Pump
Ash Bucket Elevator
The major electrical components of each incinerator include one 125 hp induced draft fan and one 40 hp
fuel combustion air fan. Continuous submetering was conducted at the induced draft fan. The induced
draft fan recorded an average electric energy demand of 42.2 kW during the submetering period. The
induced draft fan was continuously submetered to identify actual operating times for the incineration
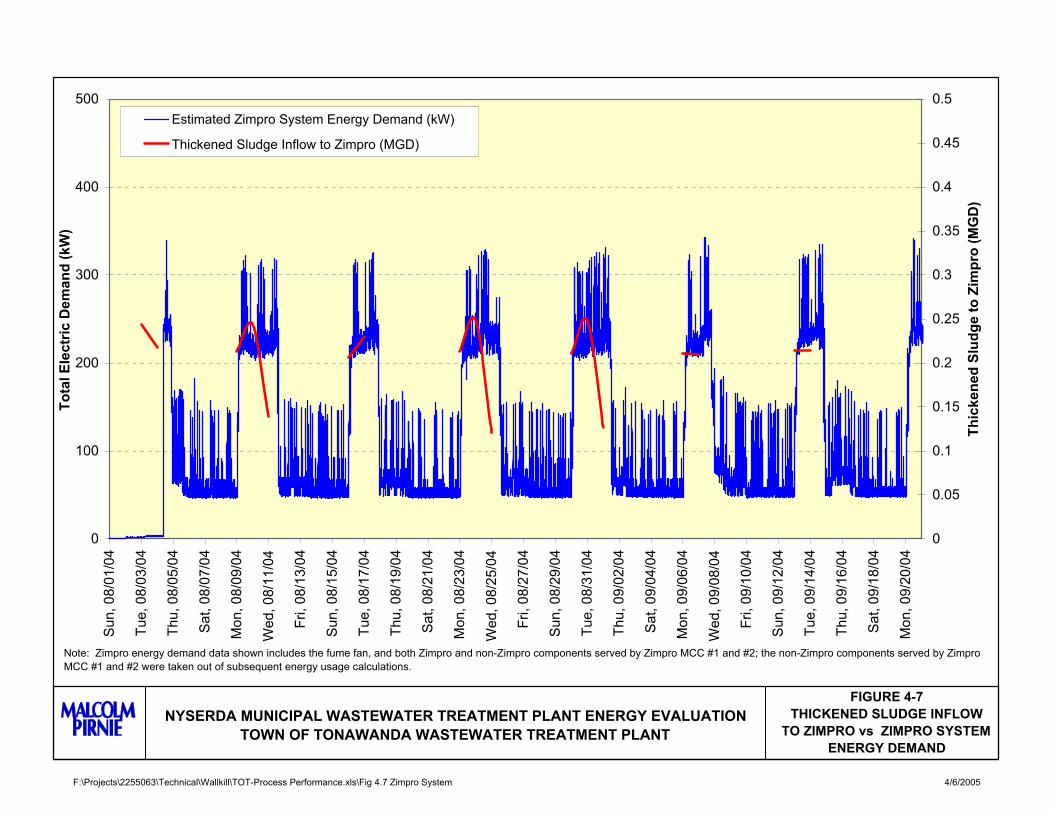
F:\Projects\2255063\Technical\Wallkill\TOT-Process Performance.xls\Fig 4.7 Zimpro System 4/6/2005
0
100
200
300
400
500S
un, 0
8/01
/04
Tue,
08/
03/0
4
Thu,
08/
05/0
4
Sat
, 08/
07/0
4
Mon
, 08/
09/0
4
Wed
, 08/
11/0
4
Fri,
08/1
3/04
Sun
, 08/
15/0
4
Tue,
08/
17/0
4
Thu,
08/
19/0
4
Sat
, 08/
21/0
4
Mon
, 08/
23/0
4
Wed
, 08/
25/0
4
Fri,
08/2
7/04
Sun
, 08/
29/0
4
Tue,
08/
31/0
4
Thu,
09/
02/0
4
Sat
, 09/
04/0
4
Mon
, 09/
06/0
4
Wed
, 09/
08/0
4
Fri,
09/1
0/04
Sun
, 09/
12/0
4
Tue,
09/
14/0
4
Thu,
09/
16/0
4
Sat
, 09/
18/0
4
Mon
, 09/
20/0
4
Tota
l Ele
ctric
Dem
and
(kW
)
0
0.05
0.1
0.15
0.2
0.25
0.3
0.35
0.4
0.45
0.5
Thic
kene
d Sl
udge
to Z
impr
o (M
GD
)
Estimated Zimpro System Energy Demand (kW)
Thickened Sludge Inflow to Zimpro (MGD)
FIGURE 4-7THICKENED SLUDGE INFLOW
TO ZIMPRO vs ZIMPRO SYSTEM ENERGY DEMAND
Note: Zimpro energy demand data shown includes the fume fan, and both Zimpro and non-Zimpro components served by Zimpro MCC #1 and #2; the non-Zimpro components served by Zimpro MCC #1 and #2 were taken out of subsequent energy usage calculations.
NYSERDA MUNICIPAL WASTEWATER TREATMENT PLANT ENERGY EVALUATIONTOWN OF TONAWANDA WASTEWATER TREATMENT PLANT
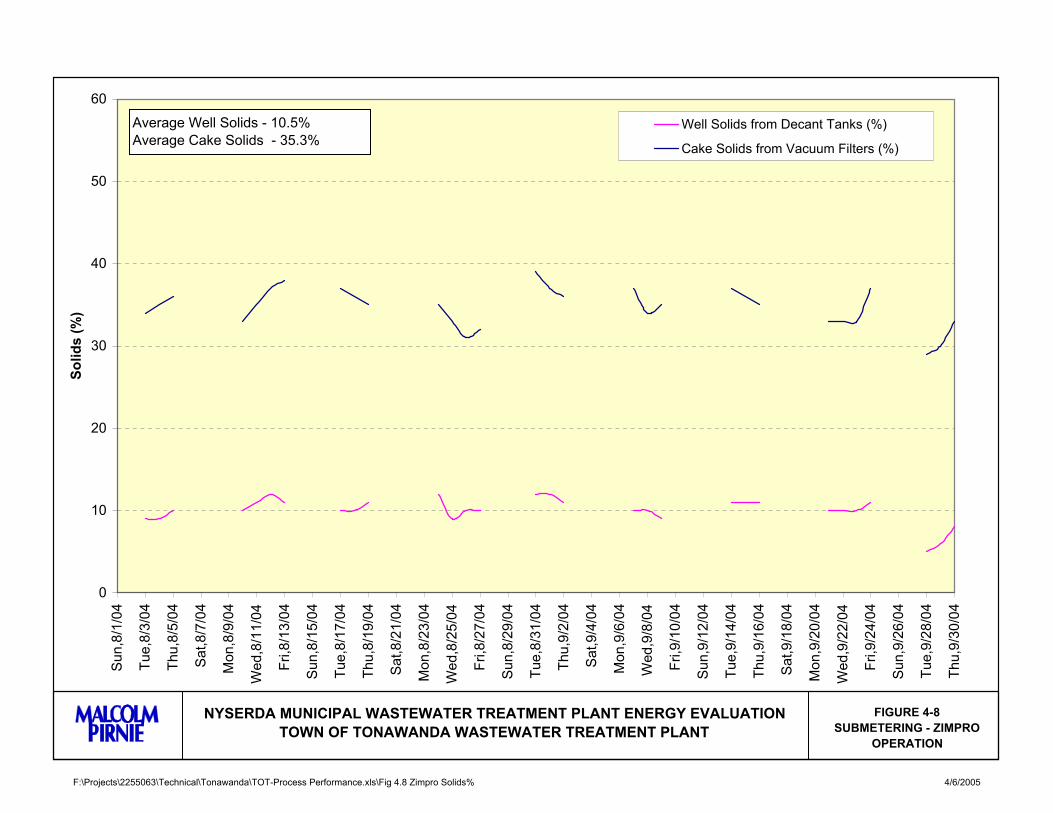
F:\Projects\2255063\Technical\Tonawanda\TOT-Process Performance.xls\Fig 4.8 Zimpro Solids% 4/6/2005
0
10
20
30
40
50
60S
un,8
/1/0
4
Tue,
8/3/
04
Thu,
8/5/
04
Sat
,8/7
/04
Mon
,8/9
/04
Wed
,8/1
1/04
Fri,8
/13/
04
Sun
,8/1
5/04
Tue,
8/17
/04
Thu,
8/19
/04
Sat
,8/2
1/04
Mon
,8/2
3/04
Wed
,8/2
5/04
Fri,8
/27/
04
Sun
,8/2
9/04
Tue,
8/31
/04
Thu,
9/2/
04
Sat
,9/4
/04
Mon
,9/6
/04
Wed
,9/8
/04
Fri,9
/10/
04
Sun
,9/1
2/04
Tue,
9/14
/04
Thu,
9/16
/04
Sat
,9/1
8/04
Mon
,9/2
0/04
Wed
,9/2
2/04
Fri,9
/24/
04
Sun
,9/2
6/04
Tue,
9/28
/04
Thu,
9/30
/04
Solid
s (%
)
Well Solids from Decant Tanks (%)
Cake Solids from Vacuum Filters (%)
FIGURE 4-8SUBMETERING - ZIMPRO
OPERATION
NYSERDA MUNICIPAL WASTEWATER TREATMENT PLANT ENERGY EVALUATIONTOWN OF TONAWANDA WASTEWATER TREATMENT PLANT
Average Well Solids - 10.5%Average Cake Solids - 35.3%

2255-063 4-6 Town of Tonawanda NYSERDA FlexTech Services Wastewater Treatment Plant Submetering
process and associated equipment. The plant staff indicated that the solids handling processes typically
operate for four days (Monday through Thursday) per week.
No data for the incineration process, except for plant water pump operation and induced fan operation,
were collected specifically for the submetering program; however, historical data (dry cake, ash) is
available and was previously summarized in TABLE 2-3.
4.2.8 Other Equipment
Other equipment at the plant includes:
• Lighting
• Grit collectors
• Instrument Air Compressor
• Caustic Solution Pumps
• Ancillary equipment for incinerators
• Ancillary equipment for Zimpro Wet Air Oxidation process
• Ancillary equipment for chlorination
For the above mechanical equipment, the small size of the associated motors and/or the low frequency of
use have indicated that any further evaluation of this equipment would most likely not yield significant cost
savings.
2255-063 5-1 Town of Tonawanda NYSERDA FlexTech Services Wastewater Treatment Plant Submetering
Section 5
ENERGY SAVING MEASURES THROUGH CAPITAL IMPROVEMENTS
5.1 CAPITAL IMPROVEMENT ALTERNATIVES TO REDUCE ENERGY USAGE
Section 4 evaluated the major equipment in use at the Tonawanda plant and compared it to process
performance. The detailed process and electric energy usage information collected during the monitoring
period was used to identify and evaluate energy conservation opportunities at the WWTP. Potential energy
saving opportunities associated with existing equipment replacement and installation of additional
equipment are discussed in this section.
5.1.1 Replacement of Existing Sludge Stabilization and Dewatering Facilities with High Speed Dewatering Centrifuges
In February 2003 the Town completed a WWTP Solids Handling Study. The study evaluated all of the
plant’s solids handling systems, together with potential improvements and present worth life cycle costs.
The study recommended replacement of the Zimpro sludge conditioning, decant thickening, and vacuum
filter processes with high-solids centrifuges. The centrifuge project is currently in the detailed design
phase, and the equipment procurement has been awarded to Westfalia Separator, Inc. When the project is
complete, the Zimpro system will be de-commissioned by the Town and the existing thickened sludge
pumps will convey thickened sludge and scum directly to the existing dewatering sludge well, from which
it will be pumped by new pumps to the new centrifuges.
The centrifuge project will include the following components:
• Installation of two, high-solids dewatering centrifuges in the existing dewatering building (including variable frequency drives (VFDs) and motor starter lineups).
• Structural improvements to the existing dewatering building to accommodate the new equipment.
• Installation of a new 460-volt, 3-phase motor control center with new 480-volt electrical service for the centrifuge units.
• Installation of three new 7.5 hp centrifuge feed pumps with VFDs.
• Installation of a new polymer feed system, including polymer feed pumps, VFDs, and polymer mixing units.
The intent is that one centrifuge will run 24 hours per day for a five-day dewatering week, and the other
will be on standby if the operating centrifuge experiences problems or requires maintenance. When
operated 24 hours per day for a seven-day operating week, one centrifuge will be able to handle peak
2255-063 5-2 Town of Tonawanda NYSERDA FlexTech Services Wastewater Treatment Plant Submetering
conditions with the other centrifuge on standby. The existing incineration facilities will be used to
incinerate dewatered sludge produced by the centrifuge system.
It should be noted that the existing sludge conveyors that transport dewatered sludge cake to the Town’s
incinerators, as well as the thickened sludge grinders, which macerate thickened sludge prior to being
conveyed to the Zimpro process, may also be replaced during the centrifuge project but are not included in
this evaluation because this equipment will be replaced in-kind as necessary.
5.1.2 Modification or Replacement of UNOX Mixers with More Efficient Mixing Equipment
Each of the four stages in each UNOX reactor (four reactors) is equipped with a mixer to provide
dissolution of oxygen and maintain sufficient mixing to prevent settling. The first stage (A) is equipped
with a two-speed motor (40/22 hp), the second stage (B) a 30/17 hp two-speed motor, and last two stages
(C and D) each have a 20-hp motor. The mixer motors in the first two stages are operated at the lower
speed in all trains, year-round. The mixers are the original units from 1978, and there is the potential for
modifying or replacing these mixers with more efficient mixing equipment that may reduce electric energy
usage.
5.1.3 Replacement of Existing Cryogenic Oxygen Generation System with Vacuum-Assisted
Pressure Swing Adsorption (VSPA) Technology
The existing cryogenic facility has one of the largest electric energy usages at the plant, and although the
equipment is in good condition due to proactive preventative maintenance, it may be nearing the end of its
useful life. Plant staff have noted that future equipment repairs, such as replacing the heat exchanger
component, may be costly. One option to potentially expensive repairs to the existing facilities is to replace
the cryogenic system with the newer, more efficient vacuum-assisted pressure swing adsorption (VPSA)
technology. The new VPSA technology produces a variable oxygen output, which is more energy efficient
than the cryogenic system; however, the capital costs for a VPSA system can be high.
5.1.4 High Pressure Service Water Pump Modifications The high pressure service water system in the Town’s plant is currently served by four 60-hp, constant
speed, vertical turbine pumps. The pumps also have standard efficiency motors. Based on discussions with
plant personnel, three of the four pumps are operated at all times with an alternating schedule. Several
modifications exist that may offer electric energy usage savings. The modifications reviewed as part of this
evaluation are as follows:
2255-063 5-3 Town of Tonawanda NYSERDA FlexTech Services Wastewater Treatment Plant Submetering
• Operation of two pumps with installation of new controls to bring a third pump online only as needed: Based on discussions with Town personnel, adequate pressure can be provided for the high pressure service water system with the operation of two pumps, as opposed to the three-pump operation scheme currently used. Town personnel indicated that three pumps are operated to ensure that the system has adequate pressure in the event that one of the pumps goes down and possibly during short, intermittent periods of higher water demand. As part of this modification, energy savings could be realized with operating two high pressure service water pumps and installation of new controls to bring a third backup pump into operation only if required. This modification would provide both reduced electric energy usage and the level of system backup preferred by Plant operators.
• Installation of VFDs and new controls with operation of two or three pumps: VFDs allow for
better adjustment to system conditions and lower usage of electric energy. Under this modification, VFDs would be installed for each of the four high pressure service water pumps and used to match the pump flow and head to the flow and head required in the system.
• Replacement of Constant Speed Standard Efficiency Motors with Premium Efficiency Motors:
The motors for the high pressure service water pumps are standard efficiency and candidate for replacement with premium efficiency motors. This replacement could translate into electric energy usage savings.
5.1.5 Replacement of Constant Speed Standard Efficiency Motors with Premium Efficiency
Motors
For reduction of electric energy usage and cost for constant speed motors, the switch from a standard
efficiency motor to premium efficiency motor can create significant cost savings, especially for those
motors which may run all or a majority of the time. Motors at the Town of Tonawanda WWTP of 5 hp and
greater which could potentially be eligible for replacement with premium efficiency motors include the
following:
• Main sewage influent pumps
• Solids handling system equipment
- Waste activated sludge (WAS) pumps - Thickened sludge pumps - Thickened sludge grinders - Chemical sludge pumps - Scrubber fans
• Incineration equipment
- I.D. fans - Ash bucket elevators - Cooling air fans - Turbo fans
• HVAC equipment
- HV Fans 1, 6, 11, 12, and 14
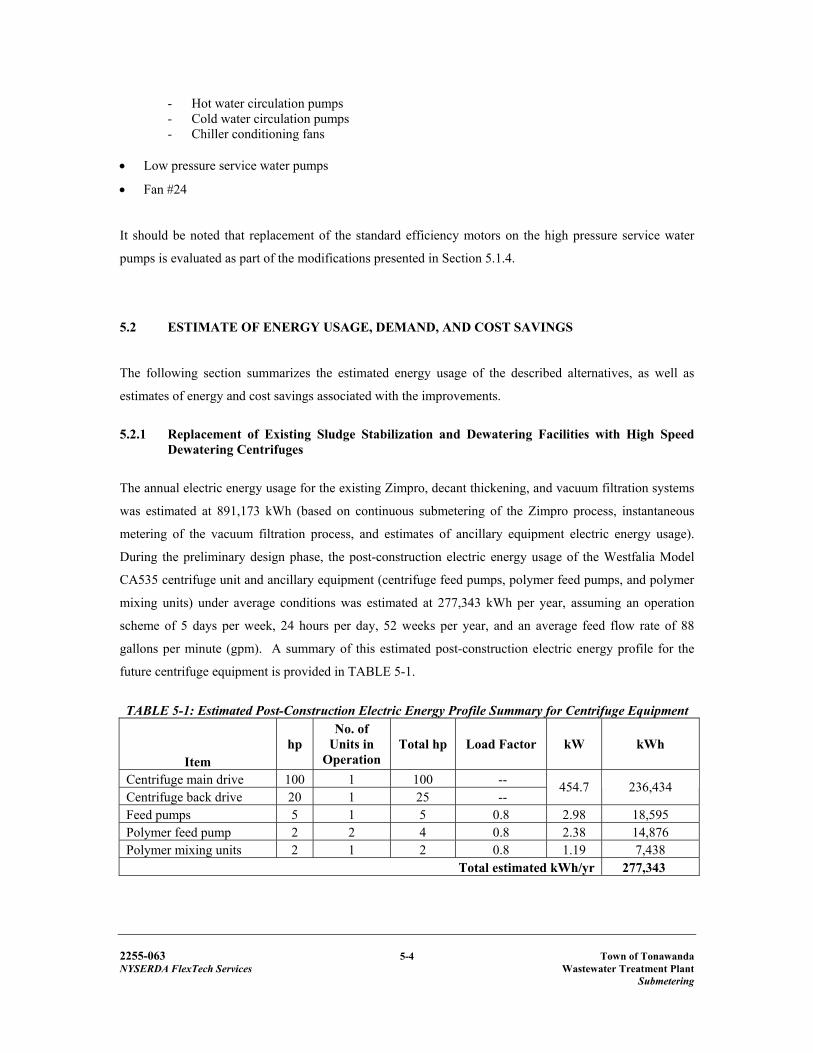
2255-063 5-4 Town of Tonawanda NYSERDA FlexTech Services Wastewater Treatment Plant Submetering
- Hot water circulation pumps - Cold water circulation pumps - Chiller conditioning fans
• Low pressure service water pumps
• Fan #24
It should be noted that replacement of the standard efficiency motors on the high pressure service water
pumps is evaluated as part of the modifications presented in Section 5.1.4.
5.2 ESTIMATE OF ENERGY USAGE, DEMAND, AND COST SAVINGS
The following section summarizes the estimated energy usage of the described alternatives, as well as
estimates of energy and cost savings associated with the improvements.
5.2.1 Replacement of Existing Sludge Stabilization and Dewatering Facilities with High Speed
Dewatering Centrifuges
The annual electric energy usage for the existing Zimpro, decant thickening, and vacuum filtration systems
was estimated at 891,173 kWh (based on continuous submetering of the Zimpro process, instantaneous
metering of the vacuum filtration process, and estimates of ancillary equipment electric energy usage).
During the preliminary design phase, the post-construction electric energy usage of the Westfalia Model
CA535 centrifuge unit and ancillary equipment (centrifuge feed pumps, polymer feed pumps, and polymer
mixing units) under average conditions was estimated at 277,343 kWh per year, assuming an operation
scheme of 5 days per week, 24 hours per day, 52 weeks per year, and an average feed flow rate of 88
gallons per minute (gpm). A summary of this estimated post-construction electric energy profile for the
future centrifuge equipment is provided in TABLE 5-1.
TABLE 5-1: Estimated Post-Construction Electric Energy Profile Summary for Centrifuge Equipment
Item hp
No. of Units in
Operation Total hp Load Factor kW kWh
Centrifuge main drive 100 1 100 -- Centrifuge back drive 20 1 25 --
454.7 236,434
Feed pumps 5 1 5 0.8 2.98 18,595 Polymer feed pump 2 2 4 0.8 2.38 14,876 Polymer mixing units 2 1 2 0.8 1.19 7,438
Total estimated kWh/yr 277,343
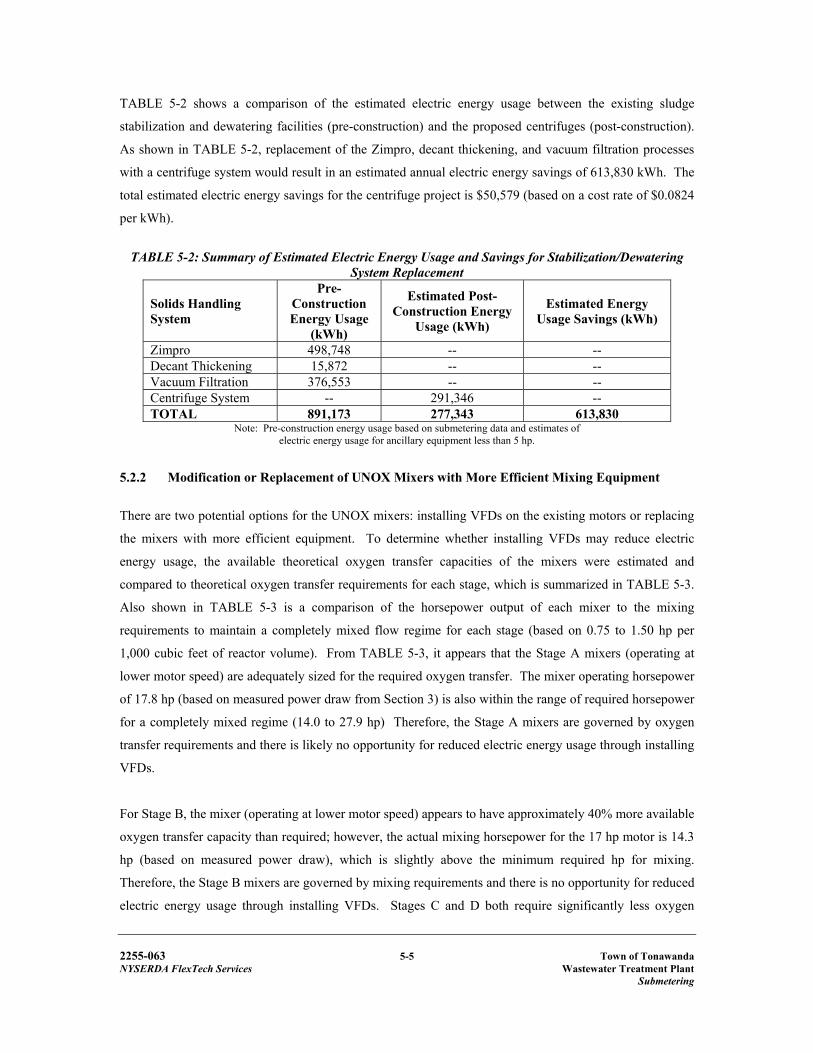
2255-063 5-5 Town of Tonawanda NYSERDA FlexTech Services Wastewater Treatment Plant Submetering
TABLE 5-2 shows a comparison of the estimated electric energy usage between the existing sludge
stabilization and dewatering facilities (pre-construction) and the proposed centrifuges (post-construction).
As shown in TABLE 5-2, replacement of the Zimpro, decant thickening, and vacuum filtration processes
with a centrifuge system would result in an estimated annual electric energy savings of 613,830 kWh. The
total estimated electric energy savings for the centrifuge project is $50,579 (based on a cost rate of $0.0824
per kWh).
TABLE 5-2: Summary of Estimated Electric Energy Usage and Savings for Stabilization/Dewatering System Replacement
Solids Handling System
Pre-Construction Energy Usage
(kWh)
Estimated Post-Construction Energy
Usage (kWh)
Estimated Energy Usage Savings (kWh)
Zimpro 498,748 -- -- Decant Thickening 15,872 -- -- Vacuum Filtration 376,553 -- -- Centrifuge System -- 291,346 -- TOTAL 891,173 277,343 613,830
Note: Pre-construction energy usage based on submetering data and estimates of electric energy usage for ancillary equipment less than 5 hp.
5.2.2 Modification or Replacement of UNOX Mixers with More Efficient Mixing Equipment
There are two potential options for the UNOX mixers: installing VFDs on the existing motors or replacing
the mixers with more efficient equipment. To determine whether installing VFDs may reduce electric
energy usage, the available theoretical oxygen transfer capacities of the mixers were estimated and
compared to theoretical oxygen transfer requirements for each stage, which is summarized in TABLE 5-3.
Also shown in TABLE 5-3 is a comparison of the horsepower output of each mixer to the mixing
requirements to maintain a completely mixed flow regime for each stage (based on 0.75 to 1.50 hp per
1,000 cubic feet of reactor volume). From TABLE 5-3, it appears that the Stage A mixers (operating at
lower motor speed) are adequately sized for the required oxygen transfer. The mixer operating horsepower
of 17.8 hp (based on measured power draw from Section 3) is also within the range of required horsepower
for a completely mixed regime (14.0 to 27.9 hp) Therefore, the Stage A mixers are governed by oxygen
transfer requirements and there is likely no opportunity for reduced electric energy usage through installing
VFDs.
For Stage B, the mixer (operating at lower motor speed) appears to have approximately 40% more available
oxygen transfer capacity than required; however, the actual mixing horsepower for the 17 hp motor is 14.3
hp (based on measured power draw), which is slightly above the minimum required hp for mixing.
Therefore, the Stage B mixers are governed by mixing requirements and there is no opportunity for reduced
electric energy usage through installing VFDs. Stages C and D both require significantly less oxygen
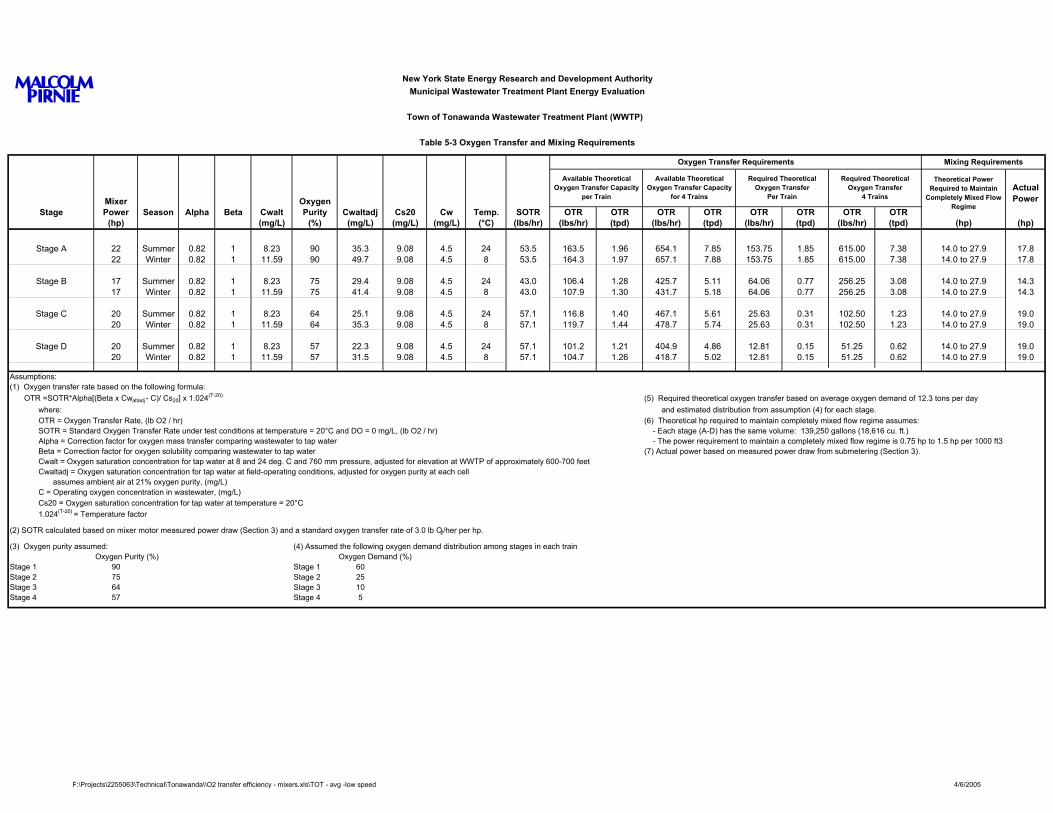
New York State Energy Research and Development AuthorityMunicipal Wastewater Treatment Plant Energy Evaluation
Town of Tonawanda Wastewater Treatment Plant (WWTP)
Table 5-3 Oxygen Transfer and Mixing Requirements
Mixer OxygenStage Power Season Alpha Beta Cwalt Purity Cwaltadj Cs20 Cw Temp. SOTR OTR OTR OTR OTR OTR OTR OTR OTR
(hp) (mg/L) (%) (mg/L) (mg/L) (mg/L) (°C) (lbs/hr) (lbs/hr) (tpd) (lbs/hr) (tpd) (lbs/hr) (tpd) (lbs/hr) (tpd) (hp) (hp)
Stage A 22 Summer 0.82 1 8.23 90 35.3 9.08 4.5 24 53.5 163.5 1.96 654.1 7.85 153.75 1.85 615.00 7.38 14.0 to 27.9 17.822 Winter 0.82 1 11.59 90 49.7 9.08 4.5 8 53.5 164.3 1.97 657.1 7.88 153.75 1.85 615.00 7.38 14.0 to 27.9 17.8
Stage B 17 Summer 0.82 1 8.23 75 29.4 9.08 4.5 24 43.0 106.4 1.28 425.7 5.11 64.06 0.77 256.25 3.08 14.0 to 27.9 14.317 Winter 0.82 1 11.59 75 41.4 9.08 4.5 8 43.0 107.9 1.30 431.7 5.18 64.06 0.77 256.25 3.08 14.0 to 27.9 14.3
Stage C 20 Summer 0.82 1 8.23 64 25.1 9.08 4.5 24 57.1 116.8 1.40 467.1 5.61 25.63 0.31 102.50 1.23 14.0 to 27.9 19.020 Winter 0.82 1 11.59 64 35.3 9.08 4.5 8 57.1 119.7 1.44 478.7 5.74 25.63 0.31 102.50 1.23 14.0 to 27.9 19.0
Stage D 20 Summer 0.82 1 8.23 57 22.3 9.08 4.5 24 57.1 101.2 1.21 404.9 4.86 12.81 0.15 51.25 0.62 14.0 to 27.9 19.020 Winter 0.82 1 11.59 57 31.5 9.08 4.5 8 57.1 104.7 1.26 418.7 5.02 12.81 0.15 51.25 0.62 14.0 to 27.9 19.0
Assumptions:(1) Oxygen transfer rate based on the following formula:
OTR =SOTR*Alpha[(Beta x Cwaltadj - C)/ Cs20] x 1.024(T-20) (5) Required theoretical oxygen transfer based on average oxygen demand of 12.3 tons per daywhere: and estimated distribution from assumption (4) for each stage.OTR = Oxygen Transfer Rate, (lb O2 / hr) (6) Theoretical hp required to maintain completely mixed flow regime assumes:SOTR = Standard Oxygen Transfer Rate under test conditions at temperature = 20°C and DO = 0 mg/L, (lb O2 / hr) - Each stage (A-D) has the same volume: 139,250 gallons (18,616 cu. ft.)Alpha = Correction factor for oxygen mass transfer comparing wastewater to tap water - The power requirement to maintain a completely mixed flow regime is 0.75 hp to 1.5 hp per 1000 ft3Beta = Correction factor for oxygen solubility comparing wastewater to tap water (7) Actual power based on measured power draw from submetering (Section 3).Cwalt = Oxygen saturation concentration for tap water at 8 and 24 deg. C and 760 mm pressure, adjusted for elevation at WWTP of approximately 600-700 feet Cwaltadj = Oxygen saturation concentration for tap water at field-operating conditions, adjusted for oxygen purity at each cell
assumes ambient air at 21% oxygen purity, (mg/L)C = Operating oxygen concentration in wastewater, (mg/L)Cs20 = Oxygen saturation concentration for tap water at temperature = 20°C1.024(T-20) = Temperature factor
(2) SOTR calculated based on mixer motor measured power draw (Section 3) and a standard oxygen transfer rate of 3.0 lb O2/her per hp.
(3) Oxygen purity assumed: (4) Assumed the following oxygen demand distribution among stages in each trainOxygen Purity (%) Oxygen Demand (%)
Stage 1 90 Stage 1 60Stage 2 75 Stage 2 25Stage 3 64 Stage 3 10Stage 4 57 Stage 4 5
Available Theoretical Oxygen Transfer Capacity
per Train
Available Theoretical Oxygen Transfer Capacity
for 4 Trains
Theoretical Power Required to Maintain
Completely Mixed Flow Regime
Required Theoretical Oxygen Transfer
4 Trains
Required Theoretical Oxygen Transfer
Per Train
Oxygen Transfer Requirements Mixing Requirements
Actual Power
F:\Projects\2255063\Technical\Tonawanda\\O2 transfer efficiency - mixers.xls\TOT - avg -low speed 4/6/2005
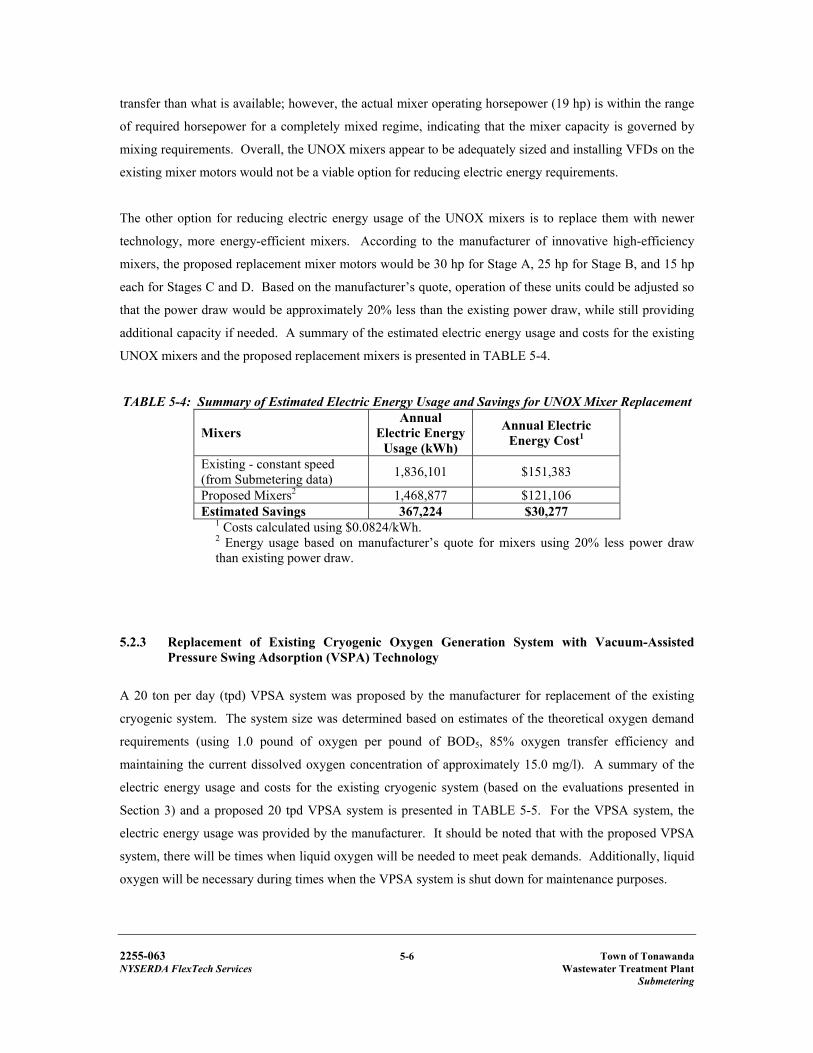
2255-063 5-6 Town of Tonawanda NYSERDA FlexTech Services Wastewater Treatment Plant Submetering
transfer than what is available; however, the actual mixer operating horsepower (19 hp) is within the range
of required horsepower for a completely mixed regime, indicating that the mixer capacity is governed by
mixing requirements. Overall, the UNOX mixers appear to be adequately sized and installing VFDs on the
existing mixer motors would not be a viable option for reducing electric energy requirements.
The other option for reducing electric energy usage of the UNOX mixers is to replace them with newer
technology, more energy-efficient mixers. According to the manufacturer of innovative high-efficiency
mixers, the proposed replacement mixer motors would be 30 hp for Stage A, 25 hp for Stage B, and 15 hp
each for Stages C and D. Based on the manufacturer’s quote, operation of these units could be adjusted so
that the power draw would be approximately 20% less than the existing power draw, while still providing
additional capacity if needed. A summary of the estimated electric energy usage and costs for the existing
UNOX mixers and the proposed replacement mixers is presented in TABLE 5-4.
TABLE 5-4: Summary of Estimated Electric Energy Usage and Savings for UNOX Mixer Replacement
Mixers Annual
Electric Energy Usage (kWh)
Annual Electric Energy Cost1
Existing - constant speed (from Submetering data) 1,836,101 $151,383
Proposed Mixers2 1,468,877 $121,106 Estimated Savings 367,224 $30,277
1 Costs calculated using $0.0824/kWh. 2 Energy usage based on manufacturer’s quote for mixers using 20% less power draw than existing power draw.
5.2.3 Replacement of Existing Cryogenic Oxygen Generation System with Vacuum-Assisted Pressure Swing Adsorption (VSPA) Technology
A 20 ton per day (tpd) VPSA system was proposed by the manufacturer for replacement of the existing
cryogenic system. The system size was determined based on estimates of the theoretical oxygen demand
requirements (using 1.0 pound of oxygen per pound of BOD5, 85% oxygen transfer efficiency and
maintaining the current dissolved oxygen concentration of approximately 15.0 mg/l). A summary of the
electric energy usage and costs for the existing cryogenic system (based on the evaluations presented in
Section 3) and a proposed 20 tpd VPSA system is presented in TABLE 5-5. For the VPSA system, the
electric energy usage was provided by the manufacturer. It should be noted that with the proposed VPSA
system, there will be times when liquid oxygen will be needed to meet peak demands. Additionally, liquid
oxygen will be necessary during times when the VPSA system is shut down for maintenance purposes.
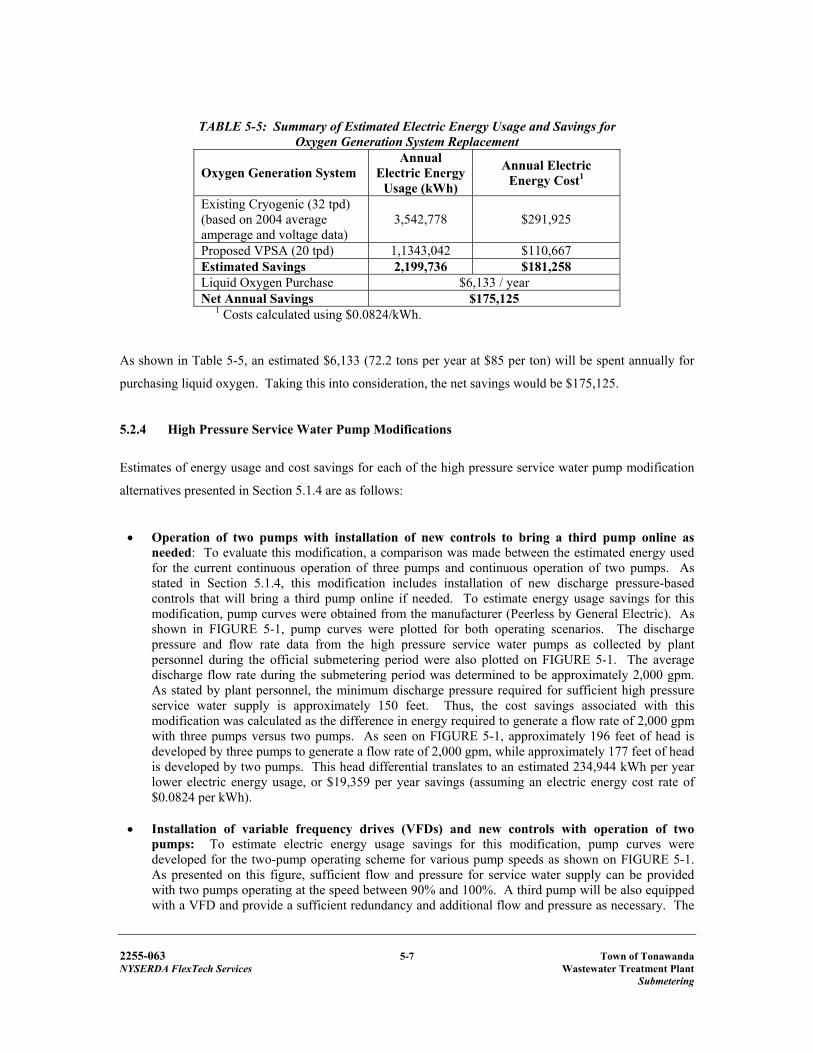
2255-063 5-7 Town of Tonawanda NYSERDA FlexTech Services Wastewater Treatment Plant Submetering
TABLE 5-5: Summary of Estimated Electric Energy Usage and Savings for Oxygen Generation System Replacement
Oxygen Generation System Annual
Electric Energy Usage (kWh)
Annual Electric Energy Cost1
Existing Cryogenic (32 tpd) (based on 2004 average amperage and voltage data)
3,542,778 $291,925
Proposed VPSA (20 tpd) 1,1343,042 $110,667 Estimated Savings 2,199,736 $181,258 Liquid Oxygen Purchase $6,133 / year Net Annual Savings $175,125
1 Costs calculated using $0.0824/kWh.
As shown in Table 5-5, an estimated $6,133 (72.2 tons per year at $85 per ton) will be spent annually for
purchasing liquid oxygen. Taking this into consideration, the net savings would be $175,125.
5.2.4 High Pressure Service Water Pump Modifications
Estimates of energy usage and cost savings for each of the high pressure service water pump modification
alternatives presented in Section 5.1.4 are as follows:
• Operation of two pumps with installation of new controls to bring a third pump online as needed: To evaluate this modification, a comparison was made between the estimated energy used for the current continuous operation of three pumps and continuous operation of two pumps. As stated in Section 5.1.4, this modification includes installation of new discharge pressure-based controls that will bring a third pump online if needed. To estimate energy usage savings for this modification, pump curves were obtained from the manufacturer (Peerless by General Electric). As shown in FIGURE 5-1, pump curves were plotted for both operating scenarios. The discharge pressure and flow rate data from the high pressure service water pumps as collected by plant personnel during the official submetering period were also plotted on FIGURE 5-1. The average discharge flow rate during the submetering period was determined to be approximately 2,000 gpm. As stated by plant personnel, the minimum discharge pressure required for sufficient high pressure service water supply is approximately 150 feet. Thus, the cost savings associated with this modification was calculated as the difference in energy required to generate a flow rate of 2,000 gpm with three pumps versus two pumps. As seen on FIGURE 5-1, approximately 196 feet of head is developed by three pumps to generate a flow rate of 2,000 gpm, while approximately 177 feet of head is developed by two pumps. This head differential translates to an estimated 234,944 kWh per year lower electric energy usage, or $19,359 per year savings (assuming an electric energy cost rate of $0.0824 per kWh).
• Installation of variable frequency drives (VFDs) and new controls with operation of two
pumps: To estimate electric energy usage savings for this modification, pump curves were developed for the two-pump operating scheme for various pump speeds as shown on FIGURE 5-1. As presented on this figure, sufficient flow and pressure for service water supply can be provided with two pumps operating at the speed between 90% and 100%. A third pump will be also equipped with a VFD and provide a sufficient redundancy and additional flow and pressure as necessary. The
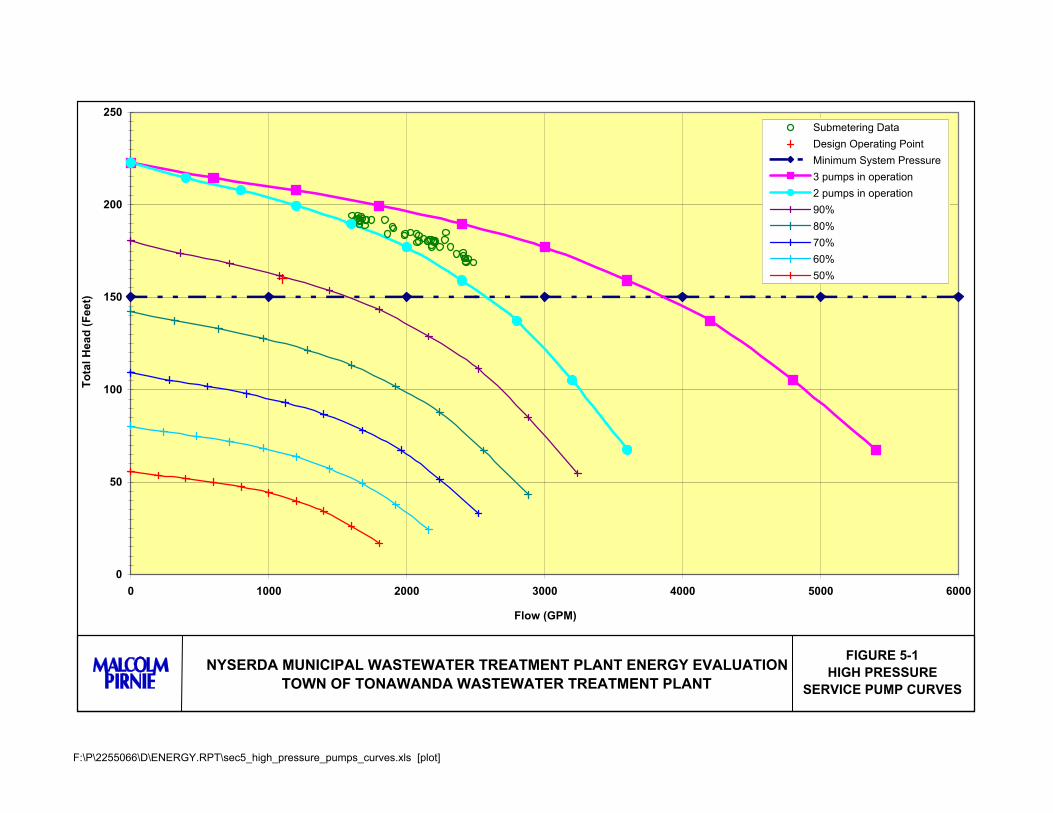
F:\P\2255066\D\ENERGY.RPT\sec5_high_pressure_pumps_curves.xls [plot]
0
50
100
150
200
250
0 1000 2000 3000 4000 5000 6000
Flow (GPM)
Tota
l Hea
d (F
eet)
Submetering DataDesign Operating PointMinimum System Pressure3 pumps in operation2 pumps in operation90%80%70%60%50%
FIGURE 5-1HIGH PRESSURE
SERVICE PUMP CURVES
NYSERDA MUNICIPAL WASTEWATER TREATMENT PLANT ENERGY EVALUATIONTOWN OF TONAWANDA WASTEWATER TREATMENT PLANT
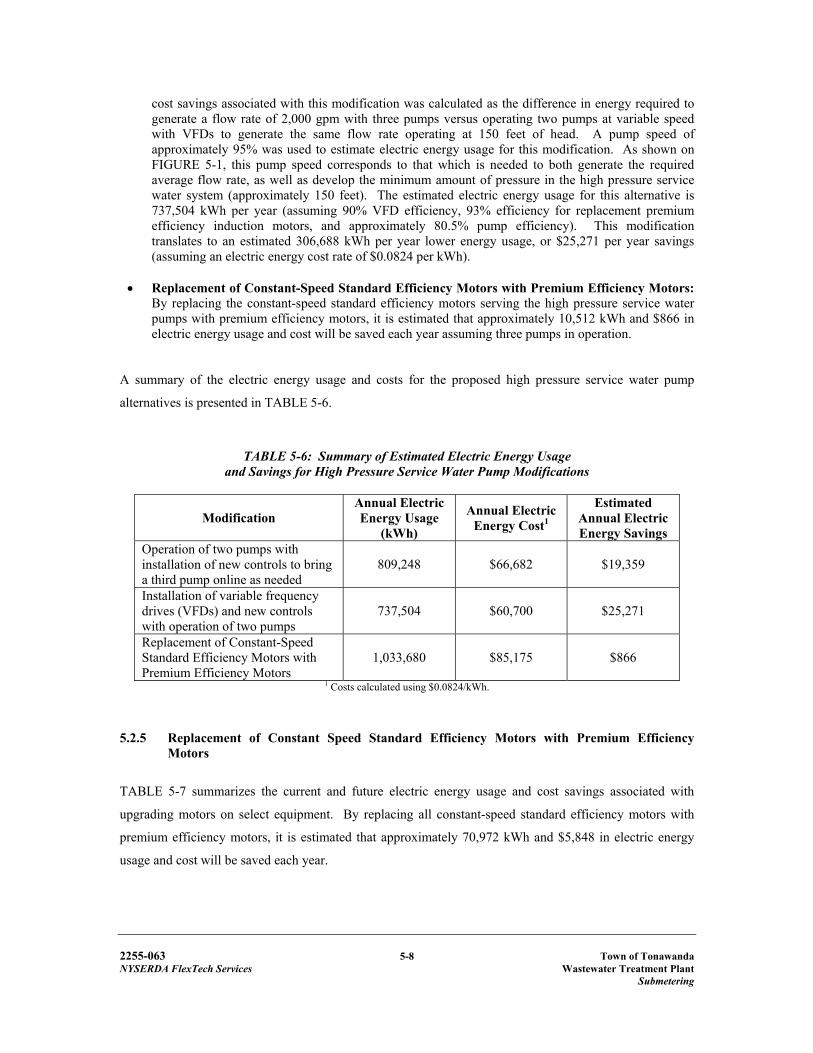
2255-063 5-8 Town of Tonawanda NYSERDA FlexTech Services Wastewater Treatment Plant Submetering
cost savings associated with this modification was calculated as the difference in energy required to generate a flow rate of 2,000 gpm with three pumps versus operating two pumps at variable speed with VFDs to generate the same flow rate operating at 150 feet of head. A pump speed of approximately 95% was used to estimate electric energy usage for this modification. As shown on FIGURE 5-1, this pump speed corresponds to that which is needed to both generate the required average flow rate, as well as develop the minimum amount of pressure in the high pressure service water system (approximately 150 feet). The estimated electric energy usage for this alternative is 737,504 kWh per year (assuming 90% VFD efficiency, 93% efficiency for replacement premium efficiency induction motors, and approximately 80.5% pump efficiency). This modification translates to an estimated 306,688 kWh per year lower energy usage, or $25,271 per year savings (assuming an electric energy cost rate of $0.0824 per kWh).
• Replacement of Constant-Speed Standard Efficiency Motors with Premium Efficiency Motors:
By replacing the constant-speed standard efficiency motors serving the high pressure service water pumps with premium efficiency motors, it is estimated that approximately 10,512 kWh and $866 in electric energy usage and cost will be saved each year assuming three pumps in operation.
A summary of the electric energy usage and costs for the proposed high pressure service water pump
alternatives is presented in TABLE 5-6.
TABLE 5-6: Summary of Estimated Electric Energy Usage and Savings for High Pressure Service Water Pump Modifications
Modification Annual Electric Energy Usage
(kWh)
Annual Electric Energy Cost1
Estimated Annual Electric Energy Savings
Operation of two pumps with installation of new controls to bring a third pump online as needed
809,248 $66,682 $19,359
Installation of variable frequency drives (VFDs) and new controls with operation of two pumps
737,504 $60,700 $25,271
Replacement of Constant-Speed Standard Efficiency Motors with Premium Efficiency Motors
1,033,680 $85,175 $866
1 Costs calculated using $0.0824/kWh.
5.2.5 Replacement of Constant Speed Standard Efficiency Motors with Premium Efficiency
Motors
TABLE 5-7 summarizes the current and future electric energy usage and cost savings associated with
upgrading motors on select equipment. By replacing all constant-speed standard efficiency motors with
premium efficiency motors, it is estimated that approximately 70,972 kWh and $5,848 in electric energy
usage and cost will be saved each year.
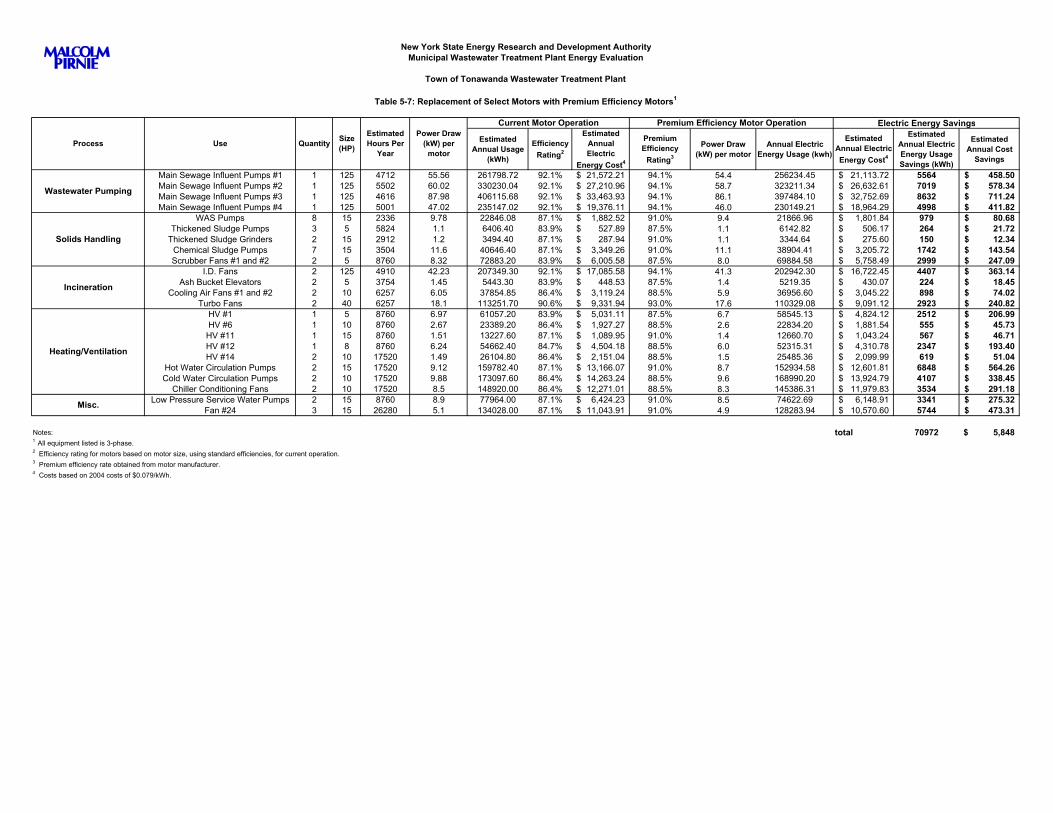
Electric Energy Savings
Estimated Annual Usage
(kWh)
Efficiency Rating2
Estimated Annual Electric
Energy Cost4
Premium Efficiency
Rating3
Power Draw (kW) per motor
Annual Electric Energy Usage (kwh)
Estimated Annual Electric Energy Cost4
Estimated Annual Electric Energy Usage Savings (kWh)
Estimated Annual Cost
Savings
Main Sewage Influent Pumps #1 1 125 4712 55.56 261798.72 92.1% 21,572.21$ 94.1% 54.4 256234.45 21,113.72$ 5564 458.50$ Main Sewage Influent Pumps #2 1 125 5502 60.02 330230.04 92.1% 27,210.96$ 94.1% 58.7 323211.34 26,632.61$ 7019 578.34$ Main Sewage Influent Pumps #3 1 125 4616 87.98 406115.68 92.1% 33,463.93$ 94.1% 86.1 397484.10 32,752.69$ 8632 711.24$ Main Sewage Influent Pumps #4 1 125 5001 47.02 235147.02 92.1% 19,376.11$ 94.1% 46.0 230149.21 18,964.29$ 4998 411.82$
WAS Pumps 8 15 2336 9.78 22846.08 87.1% 1,882.52$ 91.0% 9.4 21866.96 1,801.84$ 979 80.68$ Thickened Sludge Pumps 3 5 5824 1.1 6406.40 83.9% 527.89$ 87.5% 1.1 6142.82 506.17$ 264 21.72$
Thickened Sludge Grinders 2 15 2912 1.2 3494.40 87.1% 287.94$ 91.0% 1.1 3344.64 275.60$ 150 12.34$ Chemical Sludge Pumps 7 15 3504 11.6 40646.40 87.1% 3,349.26$ 91.0% 11.1 38904.41 3,205.72$ 1742 143.54$ Scrubber Fans #1 and #2 2 5 8760 8.32 72883.20 83.9% 6,005.58$ 87.5% 8.0 69884.58 5,758.49$ 2999 247.09$
I.D. Fans 2 125 4910 42.23 207349.30 92.1% 17,085.58$ 94.1% 41.3 202942.30 16,722.45$ 4407 363.14$ Ash Bucket Elevators 2 5 3754 1.45 5443.30 83.9% 448.53$ 87.5% 1.4 5219.35 430.07$ 224 18.45$
Cooling Air Fans #1 and #2 2 10 6257 6.05 37854.85 86.4% 3,119.24$ 88.5% 5.9 36956.60 3,045.22$ 898 74.02$ Turbo Fans 2 40 6257 18.1 113251.70 90.6% 9,331.94$ 93.0% 17.6 110329.08 9,091.12$ 2923 240.82$
HV #1 1 5 8760 6.97 61057.20 83.9% 5,031.11$ 87.5% 6.7 58545.13 4,824.12$ 2512 206.99$ HV #6 1 10 8760 2.67 23389.20 86.4% 1,927.27$ 88.5% 2.6 22834.20 1,881.54$ 555 45.73$ HV #11 1 15 8760 1.51 13227.60 87.1% 1,089.95$ 91.0% 1.4 12660.70 1,043.24$ 567 46.71$ HV #12 1 8 8760 6.24 54662.40 84.7% 4,504.18$ 88.5% 6.0 52315.31 4,310.78$ 2347 193.40$ HV #14 2 10 17520 1.49 26104.80 86.4% 2,151.04$ 88.5% 1.5 25485.36 2,099.99$ 619 51.04$
Hot Water Circulation Pumps 2 15 17520 9.12 159782.40 87.1% 13,166.07$ 91.0% 8.7 152934.58 12,601.81$ 6848 564.26$ Cold Water Circulation Pumps 2 10 17520 9.88 173097.60 86.4% 14,263.24$ 88.5% 9.6 168990.20 13,924.79$ 4107 338.45$
Chiller Conditioning Fans 2 10 17520 8.5 148920.00 86.4% 12,271.01$ 88.5% 8.3 145386.31 11,979.83$ 3534 291.18$ Low Pressure Service Water Pumps 2 15 8760 8.9 77964.00 87.1% 6,424.23$ 91.0% 8.5 74622.69 6,148.91$ 3341 275.32$
Fan #24 3 15 26280 5.1 134028.00 87.1% 11,043.91$ 91.0% 4.9 128283.94 10,570.60$ 5744 473.31$
Notes: total 70972 5,848$ 1 All equipment listed is 3-phase.2 Efficiency rating for motors based on motor size, using standard efficiencies, for current operation.3 Premium efficiency rate obtained from motor manufacturer.4 Costs based on 2004 costs of $0.079/kWh.
Heating/Ventilation
Misc.
Incineration
Solids Handling
Wastewater Pumping
Quantity Size (HP)
Estimated Hours Per
Year
Power Draw (kW) per
motor
New York State Energy Research and Development AuthorityMunicipal Wastewater Treatment Plant Energy Evaluation
Town of Tonawanda Wastewater Treatment Plant
Table 5-7: Replacement of Select Motors with Premium Efficiency Motors1
Process Use
Premium Efficiency Motor OperationCurrent Motor Operation
2255-063 5-9 Town of Tonawanda NYSERDA FlexTech Services Wastewater Treatment Plant Submetering
5.3 ESTIMATE OF CAPITAL COSTS AND SIMPLE PAYBACK
5.3.1 Replacement of Existing Sludge Stabilization and Dewatering Facilities with High Speed Dewatering Centrifuges
The opinion of probable construction cost for this project developed in the basis-of-design report is $3.04
million. When a 15 percent contingency and engineering costs are added, the construction budget
allocation is $4.37 million. The centrifuge project has a significant up-front capital expenditure. With
annual estimated electric energy savings of $48,492, this results in a payback period of approximately 90
years. However, electric energy savings associated with this project are only one of the benefits of
replacing the existing Zimpro, decant thickening, and vacuum filtration systems. The existing Zimpro
process requires a significant investment of operator and maintenance staff time, as well as a significant
capital investment to keep the existing system operational for the next 20 years. The Zimpro process is
near the end of its useful life and is in need of significant and expensive repairs. The high pressure pumps,
compressors, and heat exchangers, are all in need of replacement. Additionally, the centrifuge alternative
provides significant O&M cost savings due to reduction in plant operator labor costs and is safer and
cleaner relative to the existing processes.
When alternatives to upgrade the Town’s solids handling system were evaluated during the 2003 Solids
Handling study, the centrifuge project (currently in the detailed design phase) represented the alternative
with the lowest cost in terms of 20-year present worth and annualized costs over a 20-year period. Based
on a comparison of annualized costs, the Town would save approximately $500,000 per year over the next
20 years by moving forward with the centrifuge project as opposed to continued use of their existing
systems. This represents an approximate 8.7 year payback period for the centrifuge project relative to the
alternative that includes continued use of the existing solids handling system.
Aside from the financial benefit, the selected alternative also offers the following operational benefits
including:
• Enclosed centrifuge design minimizes odors, provides a safer working environment, eliminates mist and humidity moisture to prevent corrosion, and improves sanitary conditions and worker safety.
• Centrifuges offer increased operational flexibility and capability to process fluctuations in sludge feed characteristics with relatively consistent output quality.
• Eliminates the need for the Zimpro process.
• Centrifuges typically produce a more consistent sludge cake without sludge stabilization.
2255-063 5-10 Town of Tonawanda NYSERDA FlexTech Services Wastewater Treatment Plant Submetering
• Centrifuges typically have lower average maintenance requirements and costs than other dewatering technologies.
Thus, considering the electric energy savings, operational benefits, and the identification of the centrifuge
alternative as being the most economically-favorable when compared to other alternatives, replacement of
the existing solids handling system with centrifuges was recommended and is currently underway.
5.3.2 Modification or Replacement of UNOX Mixers with More Efficient Mixing Equipment
As presented in Section 5.2.2, modifying the existing mixer motors with VFDs does not appear to be a
viable option for reducing electric energy usage and was not further considered.
The estimated capital cost for replacing all mixers with a newer, more efficient technology is $593,400 for
all four trains (based on manufacturer’s quote with installation, plus 15% contingencies). Based on the
estimated savings of $30,277, the payback period would be 19.6 years. The payback is substantially larger
than what is considered to be attractive; therefore, replacement is not feasible at this time. However, the
existing units are over 26 years old and may be approaching the end of their useful life. If the units need
replacement in the future, the Town should consider the newer more efficient technology mixers to provide
some energy savings.
5.3.3 Replacement of Existing Cryogenic Oxygen Generation System with Vacuum-Assisted Pressure Swing Adsorption (VSPA) Technology
The estimated capital cost for the proposed 20 tpd VPSA system is $1,840,000, which includes installation
and 15% contingency (this does not include new liquid oxygen storage tanks). Based on the net savings of
$175,125 (electric energy cost savings minus the cost to purchase liquid oxygen for peak demands), the
estimated payback period is 10.5 years. Although the estimated payback is marginal, the Town may wish
to consider the VPSA system alternative should the existing cryogenic facility require significant capital
expenditures for repairs or replacement in the foreseeable future. If this should occur, the Town should
also consider confirming the actual oxygen requirements by developing a dynamic process model of the
UNOX system. The VPSA system electric energy usage was developed using “rule-of-thumb”
stoichiometric estimates for oxygen requirements, whereas a dynamic process model would provide a more
accurate representation of diurnal and seasonal oxygen requirements, and therefore provide more accurate
information for optimal VPSA system sizing.
2255-063 5-11 Town of Tonawanda NYSERDA FlexTech Services Wastewater Treatment Plant Submetering
5.3.4 High Pressure Service Water Pump Modifications
Estimates of capital costs and payback for each of the high pressure service water pump modifications
presented in Section 5.1.4 are as follows:
• Operation of two pumps with installation of new controls to bring a third pump online as needed: The estimated capital cost for installation of new controls for the high pressure service water pumps to allow for operation of two pumps is approximately $25,000, including a pump controller and associated equipment. With annual estimated savings of $19,359, this results in a payback period of approximately 1.3 years.
• Installation of variable frequency drives (VFDs) and new controls with operation of two
pumps: The estimated capital cost for the installation of VFDs and new controls is $83,000. With annual estimated savings of $25,271, this results in a payback period of approximately 3.3 years.
• Replacement of Constant-Speed Standard Efficiency Motors with Premium Efficiency Motors:
The estimated capital cost for replacing the constant speed standard efficiency motors for the high pressure service water pumps with premium efficiency motors is $13,180. With annual estimated savings of $866, this results in a payback period of approximately 15.2 years.
Based on this information, it is recommended that the Town implement the modification that includes
operation of two pumps with installation of new controls to bring a third pump online as needed.
5.3.5 Replacement of Constant Speed Standard Efficiency Motors with Premium Efficiency Motors
The estimated capital cost for replacing all constant speed standard efficiency motors with premium
efficiency motors is $76,935. With annual estimated savings of $5,848, this results in a payback period of
approximately 13.2 years.
However, of the list of constant speed motors candidate for replacement, six have an individual payback of
less than seven years. These motors include the thickener scrubber fans, HV fan #’s 1 and 12, hot and cold
water circulation pumps, and chiller conditioning fans. The estimated capital cost for replacing these
particular constant speed standard efficiency motors with premium efficiency motors is $7,310. With an
estimated savings of $1,841, replacement of these six types of motors would results in a payback period of
approximately 4.0 years.
2255-063 6-1 Town of Tonawanda NYSERDA FlexTech Services Wastewater Treatment Plant Submetering
Section 6
ENERGY SAVING MEASURES THROUGH OPERATION MODIFICATIONS
6.1 OPERATIONAL MODIFICATIONS TO REDUCE ENERGY USAGE
Typically, the major operational changes that can be made to reduce energy usage are load shifting, peak
shaving, and greater use of real-time data in energy-related decision making. Load shifting is the practice
of changing the time of use of certain loads to reduce the total facility demand during peak periods. Peak
shaving is the practice of dispatching on-site generating assets to reduce dependence on the grid during
peak demand periods. However, because the Town currently does not utilize anaerobic sludge digestion or
have on-site generation capabilities, peak-shaving opportunities were not evaluated as part of this study.
The increased use of real-time data by the installation and monitoring of permanent submeters can assist
the facility in making informed decisions regarding the usage of energy and offer alternatives for further
reducing energy.
6.1.1 Load Shifting
Hourly power draw data for the whole plant were used to provide an estimate of when peak electric energy
demand occurs at the plant. FIGURE 2-6 shows the hourly electric demand for the whole plant for half of
2002 and all of 2003. As seen on the figure, electric energy demand fluctuates in a regular pattern for the
whole plant. This observation is likely indicative that fluctuations in electric energy demand are largely a
function of the regular schedule of sludge processing at the plant. Some peaks are observed in the whole-
plant demand profile. However, these peaks do not happen regularly and are most likely attributed to
increased pumping during wet weather. The lack of other peaks in the energy usage profile at the plant
indicate the effectiveness of the Town, in previous projects, to successfully reduce daytime peak electric
energy loading. The energy demand profile for the whole plant for the submetering period, as shown on
Figure 3-1, also supports these findings. Additionally, most of the wet stream processes WWTP processes
are operated on a 24-hour, 7 days a week schedule. With the implementation of the centrifuge project and
conversion from a three day to a five day weekly sludge processing operation schedule, peaks in energy
demand at the plant will become dampened (equal to the estimated monthly energy demand savings
associated with implementation of the project; 300 kW).
Considering this information, there does not appear to be significant opportunities for further load shifting
at the Town’s plant.

2255-063 6-2 Town of Tonawanda NYSERDA FlexTech Services Wastewater Treatment Plant Submetering
6.1.2 Operational Modifications
Based on current operations and communications with the plant staff, no modifications to the operation of
the plant are recommended.
2255-063 7-1 Town of Tonawanda NYSERDA FlexTech Services Wastewater Treatment Plant Submetering
Section 7
ENERGY SAVING MEASURES THROUGH LIGHTING/HVAC MODIFICATIONS
7.1 OVERVIEW
7.1.1 HEATING, VENTILATING, AND AIR CONDITIONING OVERVIEW
The Town of Tonawanda Wastewater Treatment Plant is comprised of both the Vacuum Filter Building
(33,150 square feet) and Main Plant (450,000 square feet), which are connected by an underground tunnel.
Much of the facility’s process equipment is below ground. The administration area, located in the Main
Plant, is occupied from about 7:00 a.m. through 4:00 p.m. by office staff and twenty-four hours per day
seven days per week by maintenance or laboratory staff. Except for the administration area, the primary
function of the heating and cooling systems are not for comfort conditioning.
The heating systems are primarily comprised of hot water unit heaters in the Vacuum Filter Building and a
combination of central air-conditioning (A/C) units in the administration area and Heating and Ventilating
(H&V) units throughout the rest of the Main Building. One 85-ton air cooled direct expansion chiller
provides chilled water to four (4) A/C units. This chiller is in poor condition and needs replacing. The
heating and ventilating units are constant volume and provide heat & ventilation to rest of the facility. Four
(4) Weil-McClain hot water boilers produce hot water to each H&V unit. These boilers are old and
inefficient. The A/C units are also constant volume. AC-1, 2, and 3 have been recently replaced and are in
good condition.
7.1.2 LIGHTING OVERVIEW
During the site inspection the lighting ranged from inefficient 2-foot and 4-foot, T-12, 34 Watt, fluorescent
2,3 and 4 lamp fixtures to 90 through 300 Watt incandescent lamps to a range of High Intensity Discharge
(H.I.D) fixtures. These fixtures range from 100, 400 and 1,000 watt Metal Halide to 175, 250, and 1,000
Watt Mercury Vapor. The majority of the exit signs have inefficient 2-lamp 40 Watt incandescent bulbs.
Data collected through site visits indicate that many energy conservation measures (ECMs) opportunities
exist.
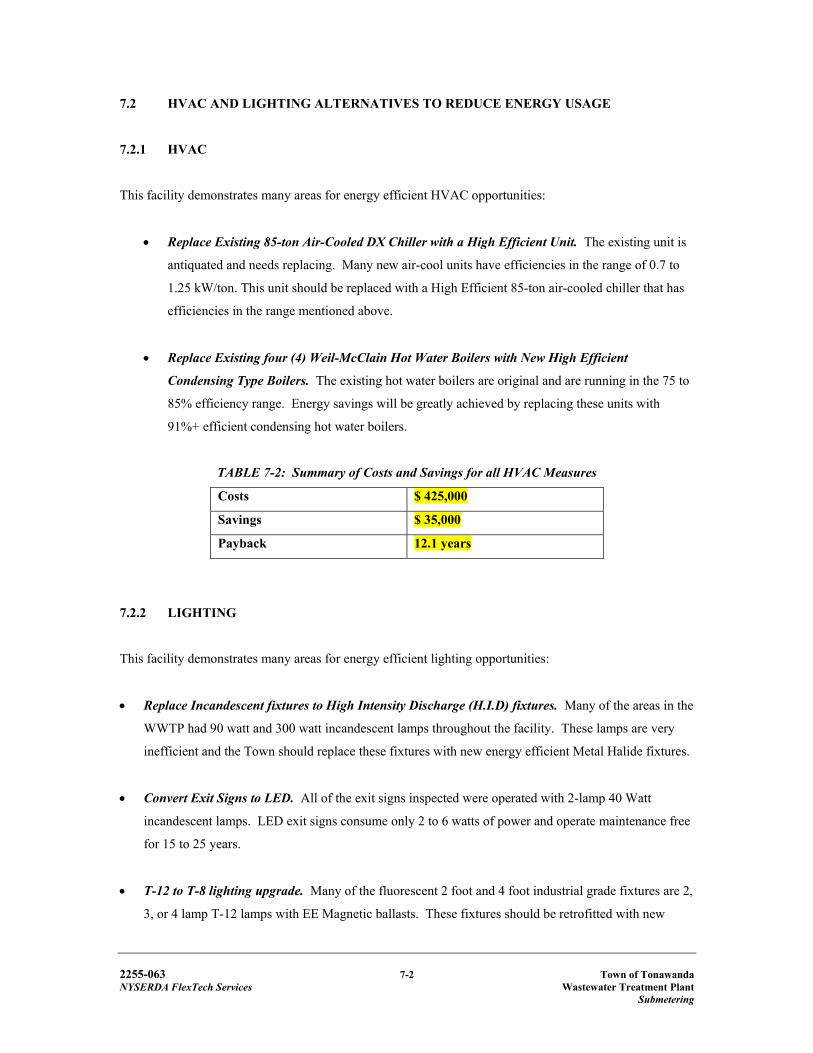
2255-063 7-2 Town of Tonawanda NYSERDA FlexTech Services Wastewater Treatment Plant Submetering
7.2 HVAC AND LIGHTING ALTERNATIVES TO REDUCE ENERGY USAGE
7.2.1 HVAC
This facility demonstrates many areas for energy efficient HVAC opportunities:
• Replace Existing 85-ton Air-Cooled DX Chiller with a High Efficient Unit. The existing unit is
antiquated and needs replacing. Many new air-cool units have efficiencies in the range of 0.7 to
1.25 kW/ton. This unit should be replaced with a High Efficient 85-ton air-cooled chiller that has
efficiencies in the range mentioned above.
• Replace Existing four (4) Weil-McClain Hot Water Boilers with New High Efficient
Condensing Type Boilers. The existing hot water boilers are original and are running in the 75 to
85% efficiency range. Energy savings will be greatly achieved by replacing these units with
91%+ efficient condensing hot water boilers.
TABLE 7-2: Summary of Costs and Savings for all HVAC Measures
Costs $ 425,000
Savings $ 35,000
Payback 12.1 years
7.2.2 LIGHTING
This facility demonstrates many areas for energy efficient lighting opportunities:
• Replace Incandescent fixtures to High Intensity Discharge (H.I.D) fixtures. Many of the areas in the
WWTP had 90 watt and 300 watt incandescent lamps throughout the facility. These lamps are very
inefficient and the Town should replace these fixtures with new energy efficient Metal Halide fixtures.
• Convert Exit Signs to LED. All of the exit signs inspected were operated with 2-lamp 40 Watt
incandescent lamps. LED exit signs consume only 2 to 6 watts of power and operate maintenance free
for 15 to 25 years.
• T-12 to T-8 lighting upgrade. Many of the fluorescent 2 foot and 4 foot industrial grade fixtures are 2,
3, or 4 lamp T-12 lamps with EE Magnetic ballasts. These fixtures should be retrofitted with new
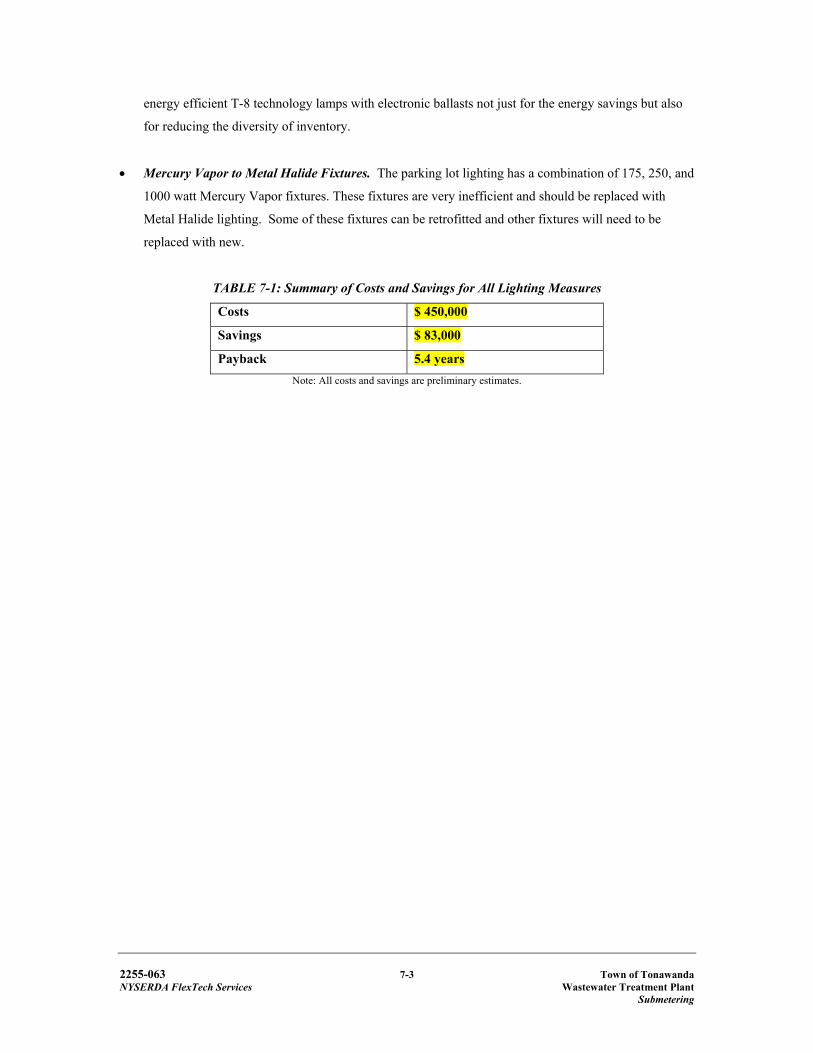
2255-063 7-3 Town of Tonawanda NYSERDA FlexTech Services Wastewater Treatment Plant Submetering
energy efficient T-8 technology lamps with electronic ballasts not just for the energy savings but also
for reducing the diversity of inventory.
• Mercury Vapor to Metal Halide Fixtures. The parking lot lighting has a combination of 175, 250, and
1000 watt Mercury Vapor fixtures. These fixtures are very inefficient and should be replaced with
Metal Halide lighting. Some of these fixtures can be retrofitted and other fixtures will need to be
replaced with new.
TABLE 7-1: Summary of Costs and Savings for All Lighting Measures
Costs $ 450,000
Savings $ 83,000
Payback 5.4 years Note: All costs and savings are preliminary estimates.
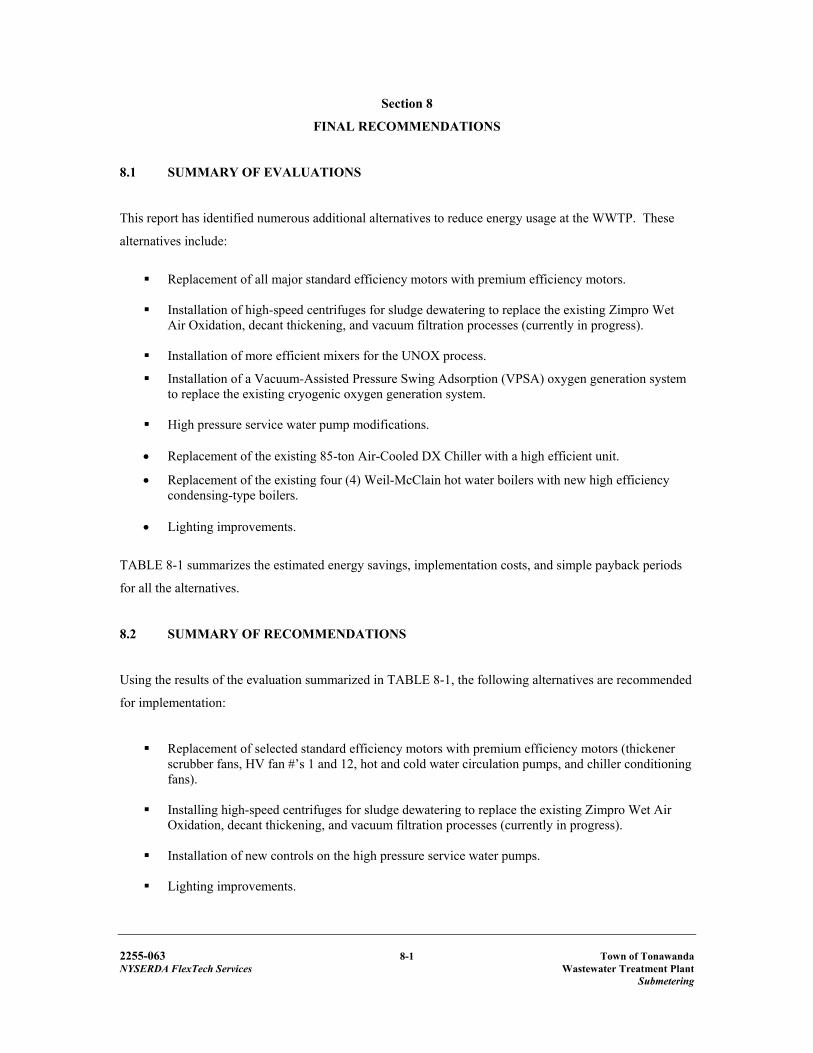
2255-063 8-1 Town of Tonawanda NYSERDA FlexTech Services Wastewater Treatment Plant Submetering
Section 8
FINAL RECOMMENDATIONS
8.1 SUMMARY OF EVALUATIONS
This report has identified numerous additional alternatives to reduce energy usage at the WWTP. These
alternatives include:
Replacement of all major standard efficiency motors with premium efficiency motors.
Installation of high-speed centrifuges for sludge dewatering to replace the existing Zimpro Wet
Air Oxidation, decant thickening, and vacuum filtration processes (currently in progress).
Installation of more efficient mixers for the UNOX process.
Installation of a Vacuum-Assisted Pressure Swing Adsorption (VPSA) oxygen generation system to replace the existing cryogenic oxygen generation system.
High pressure service water pump modifications.
• Replacement of the existing 85-ton Air-Cooled DX Chiller with a high efficient unit.
• Replacement of the existing four (4) Weil-McClain hot water boilers with new high efficiency condensing-type boilers.
• Lighting improvements.
TABLE 8-1 summarizes the estimated energy savings, implementation costs, and simple payback periods
for all the alternatives.
8.2 SUMMARY OF RECOMMENDATIONS
Using the results of the evaluation summarized in TABLE 8-1, the following alternatives are recommended
for implementation:
Replacement of selected standard efficiency motors with premium efficiency motors (thickener scrubber fans, HV fan #’s 1 and 12, hot and cold water circulation pumps, and chiller conditioning fans).
Installing high-speed centrifuges for sludge dewatering to replace the existing Zimpro Wet Air Oxidation, decant thickening, and vacuum filtration processes (currently in progress).
Installation of new controls on the high pressure service water pumps.
Lighting improvements.
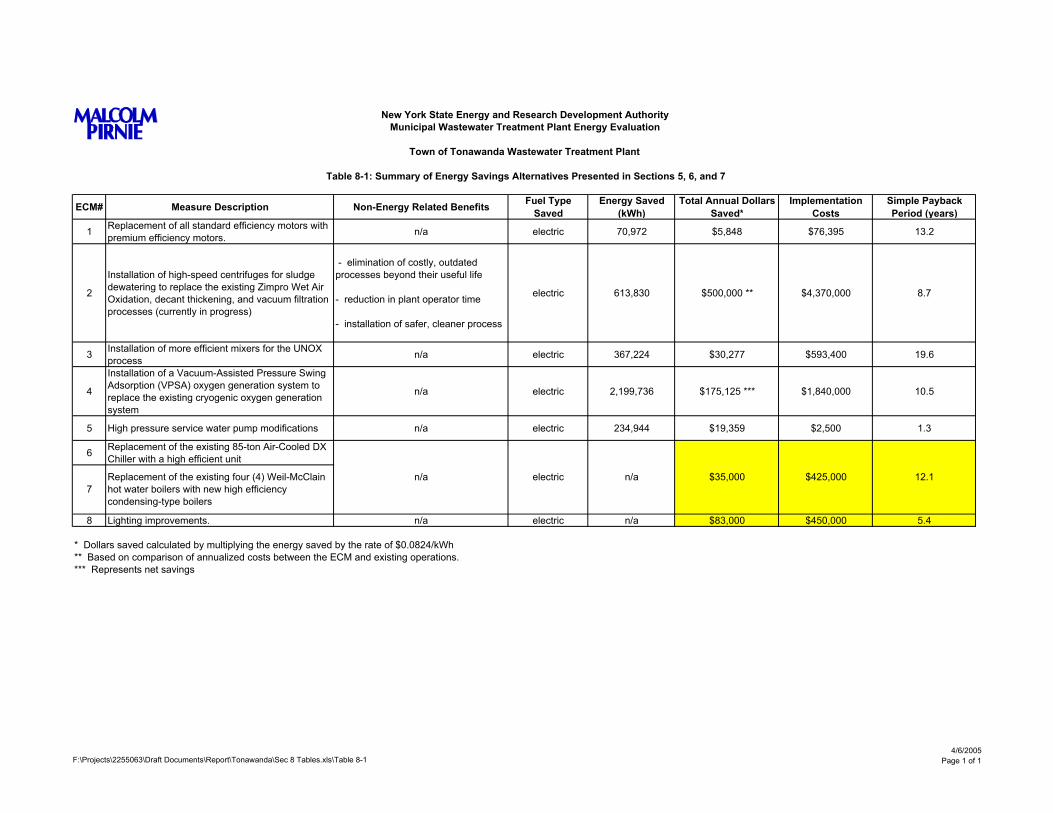
New York State Energy and Research Development AuthorityMunicipal Wastewater Treatment Plant Energy Evaluation
Town of Tonawanda Wastewater Treatment Plant
Table 8-1: Summary of Energy Savings Alternatives Presented in Sections 5, 6, and 7
ECM# Measure Description Non-Energy Related Benefits Fuel Type Saved
Energy Saved (kWh)
Total Annual Dollars Saved*
Implementation Costs
Simple Payback Period (years)
1 Replacement of all standard efficiency motors with premium efficiency motors. n/a electric 70,972 $5,848 $76,395 13.2
2
Installation of high-speed centrifuges for sludge dewatering to replace the existing Zimpro Wet Air Oxidation, decant thickening, and vacuum filtration processes (currently in progress)
- elimination of costly, outdated processes beyond their useful life
- reduction in plant operator time
- installation of safer, cleaner process
electric 613,830 $500,000 ** $4,370,000 8.7
3 Installation of more efficient mixers for the UNOX process n/a electric 367,224 $30,277 $593,400 19.6
4
Installation of a Vacuum-Assisted Pressure Swing Adsorption (VPSA) oxygen generation system to replace the existing cryogenic oxygen generation system
n/a electric 2,199,736 $175,125 *** $1,840,000 10.5
5 High pressure service water pump modifications n/a electric 234,944 $19,359 $2,500 1.3
6 Replacement of the existing 85-ton Air-Cooled DX Chiller with a high efficient unit
8 Lighting improvements. n/a electric n/a $83,000 $450,000 5.4
* Dollars saved calculated by multiplying the energy saved by the rate of $0.0824/kWh
*** Represents net savings
$425,000 12.1
** Based on comparison of annualized costs between the ECM and existing operations.
n/a electric n/a $35,000 Replacement of the existing four (4) Weil-McClain hot water boilers with new high efficiency condensing-type boilers
7
F:\Projects\2255063\Draft Documents\Report\Tonawanda\Sec 8 Tables.xls\Table 8-14/6/2005
Page 1 of 1
2255-063 8-2 Town of Tonawanda NYSERDA FlexTech Services Wastewater Treatment Plant Submetering
The remaining alternatives are not recommended due to long payback periods.
TABLE 8-2 contains a summary of the costs to implement the recommended alternatives only, as well as a
summary of potential savings. The recommended alternatives offer a reasonable payback of 8 years, if
implemented together.
Additionally, there are other equipment replacements that are not considered attractive at the present time.
However, the existing equipment is approaching the end of its useful life and may have to be replaced in
the near future. When this occurs, the Town should consider replacing the original equipment with more
efficient, newer generation equipment. These future replacements may include:
• Installation of a Vacuum-Assisted Pressure Swing Adsorption (VPSA) oxygen generation system to replace the existing cryogenic oxygen generation system.
• Installation of more efficient mixers for the UNOX process.
• Replacement of the existing 85-ton Air-Cooled DX Chiller with a high efficient unit.
• Replacement of the existing four (4) Weil-McClain hot water boilers with new high efficiency condensing-type boilers.
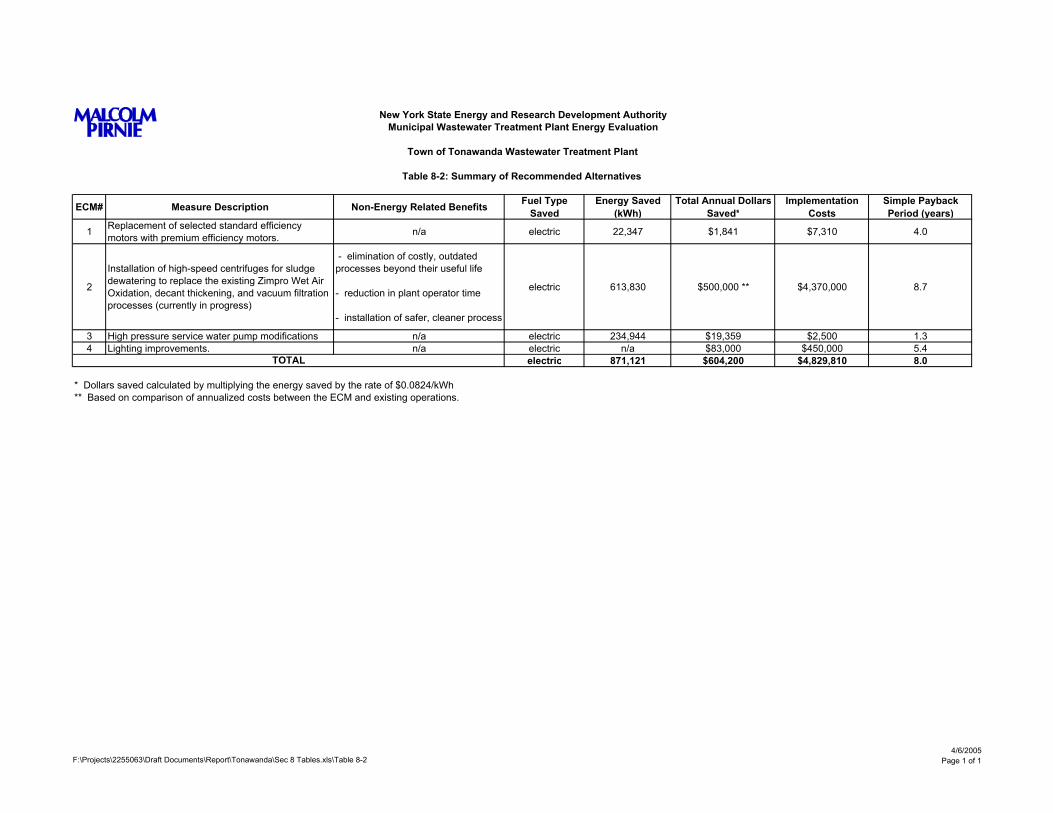
New York State Energy and Research Development AuthorityMunicipal Wastewater Treatment Plant Energy Evaluation
Town of Tonawanda Wastewater Treatment Plant
Table 8-2: Summary of Recommended Alternatives
ECM# Measure Description Non-Energy Related Benefits Fuel Type Saved
Energy Saved (kWh)
Total Annual Dollars Saved*
Implementation Costs
Simple Payback Period (years)
1 Replacement of selected standard efficiency motors with premium efficiency motors. n/a electric 22,347 $1,841 $7,310 4.0
2
Installation of high-speed centrifuges for sludge dewatering to replace the existing Zimpro Wet Air Oxidation, decant thickening, and vacuum filtration processes (currently in progress)
- elimination of costly, outdated processes beyond their useful life
- reduction in plant operator time
- installation of safer, cleaner process
electric 613,830 $500,000 ** $4,370,000 8.7
3 High pressure service water pump modifications n/a electric 234,944 $19,359 $2,500 1.34 Lighting improvements. n/a electric n/a $83,000 $450,000 5.4
electric 871,121 $604,200 $4,829,810 8.0
* Dollars saved calculated by multiplying the energy saved by the rate of $0.0824/kWh** Based on comparison of annualized costs between the ECM and existing operations.
TOTAL
F:\Projects\2255063\Draft Documents\Report\Tonawanda\Sec 8 Tables.xls\Table 8-24/6/2005
Page 1 of 1