Embed Size (px)
Citation preview
Avestia Publishing
Journal of Fluid Flow, Heat and Mass Transfer (JFFHMT)
Volume 6, Year 2019
Journal ISSN: 2368-6111
DOI: 10.11159/jffhmt.2019.001
Date Received: 2018-06-28
Date Accepted: 2018-08-18
Date Published: 2019-02-07
1
Using CFD in the Design Process of a Toilet Bowl
António Gameiro Lopes 1, Vítor A. F. Costa2 1 ADAI-LAETA, Departamento de Engenharia Mecânica Universidade de Coimbra, 3030-788 Coimbra, Portugal
[email protected] 2 Centro de Tecnologia Mecânica e Automação, Departamento de Engenharia Mecânica Universidade de Aveiro, Campus Universitário de Santiago, 3810-193 Aveiro, Portugal
Abstract - In this work, a water flow analysis study was performed, leading to a toilet bowl satisfying, simultaneously, functionality, design and present standard requirements. An existing toilet bowl was used as the starting point, which was experimentally tested for discharge analysis and flow visualization. The numerical simulation of the water discharge in the existing bowl was conducted using the software package ANSYS-CFX, and the results compared with the experimental data. This workflow allowed to tune the parameters and options considered in the numerical simulations. Comparisons and validation included mainly the gravity induced water mass flow rate, the water flow spreading and action over the toilet bowl inner surface, and the non-spreading of the discharged water out of the top of the toilet bowl. Once the numerical model has been validated against experiment data, different designs of the toilet bowl and different discharge conditions can be tested in what concerns the aforementioned requisites through a much easier, less expensive, and quick process than a trial-and-error approach using prototype toilet bowl pieces and experimental analysis.
Keywords: Toilet bowl design, Numerical simulation, Water flow discharge, Validation, New designs © Copyright 2018 Authors - This is an Open Access article published under the Creative Commons Attribution License terms (http://creativecommons.org/licenses/by/3.0). Unrestricted use, distribution, and reproduction in any medium are permitted, provided the original work is properly cited.
1. Introduction The standards and requirements for domestic
utility service systems, such as resources (water energy and other) consumption, functionality, user-friendliness, compactness, and design, have been significantly increased. These increasing requirements are also associated with shorter lifetimes of the home elements,
thus frequently requiring new solutions to the market in short times, through affordable processes. CFD can help especially when fluid flows are present, reducing time and costs of the design and development phases, even if requiring specialized knowledge. If this is true in general, it is also the case when the toilet bowl is the home element under consideration.
Increasing design and compactness requirements, combined with water consumption reductions and increasingly demanding standard requirements, need to be considered when proposing new toilet bowls to the market. Considering the European manufacturers and market, the present relevant Standards are the NF EN 33 [1] and the NF EN 997 [2]. This is an area, or product, where CFD can help towards faster, cheaper, different, newer and better solutions. No similar optimization studies were found in the literature, even if some studies can be found concerning CFD simulation of the discharge flow in toilet bowls.
The application of CFD for water flow studies was previously carried out by the authors involving the study of a WC cistern discharge [3]. In this work, simulation of the gravity-driven discharge flow was done with the purpose of optimizing the shape of the discharge valve, leading to a minimization of losses and to higher discharge rates in the same time period. Wang et al. [4] numerically simulated a siphon jet toilet, the main emphasis and interest being on the siphon system and on the siphon tube bend. The digital toilet model was built based on the data measured with the curve and surface fitting technology, and the k- turbulence model was used for flow modelling. Hu et al. [5] conducted the numerical simulation of the multiphase flow in the flushing process of a wash-down toilet using FLUENT software. Starting with a two-phase flow simulation and
2
assuming that there was no sewage but water in the trap seal, they proceeded to a more realistic three-phase flow simulation. Some validation was made considering results of flush tests, leading to what they called the digital wash-down toilet.
Lischka [6] presented an animation created from the numerical simulation of the water discharge in a toilet system obtained using OpenFOAM. Although the visualization seems quite realistic, no details were given on the used simulation parameters and/or operating conditions.
Mui et al. [7] used FLUENT to numerically simulate the ventilation in a whole residential washroom after water closet flushing, emphasis being on the exhaust flow to minimize the bioaerosol infection risk. Main attention was on the airflow and on the bioaerosol particle dispersion in the air after water closet flushing, and not in the water flushing process itself.
The approach followed in the present work includes the experimental flow visualization of the discharge process in an existing toilet bowl, and its corresponding numerical simulation. Main parameters under analysis using both the experimental and numerical results are the water flow rate, the water flow action and spreading over the inner surface of the toilet bowl (for cleaning action and dejects transportation), and the non-spreading of the discharged water out of the top of the toilet bowl (that could occur for high water discharge rates if the bowl design is inappropriate). Water flow visualization and video recording are used for the observation of the water flow spreading over the inner surface of the toilet bowl, and of the non-spreading of the discharged water out of the top of the toilet bowl. Only visualization data were used for comparison and validation purposes, since, due to experimental constrains, it was not possible to obtain quantitative data regarding the water film characteristics (velocity and depth).
Experimental and numerical results are compared, and the parameters considered for the numerical simulations adjusted if/when needed in order to approximate the numerical results to the experimental ones. This is thus a phase of analysis, tuning and validation of the numerical simulations.
Once confidence achieved on the numerical setup, this approach allows the study for different toilet bowl geometries and designs, as well as for different discharge conditions.
2. SunLife toilet bowl 2.1. Geometry and experimental procedure
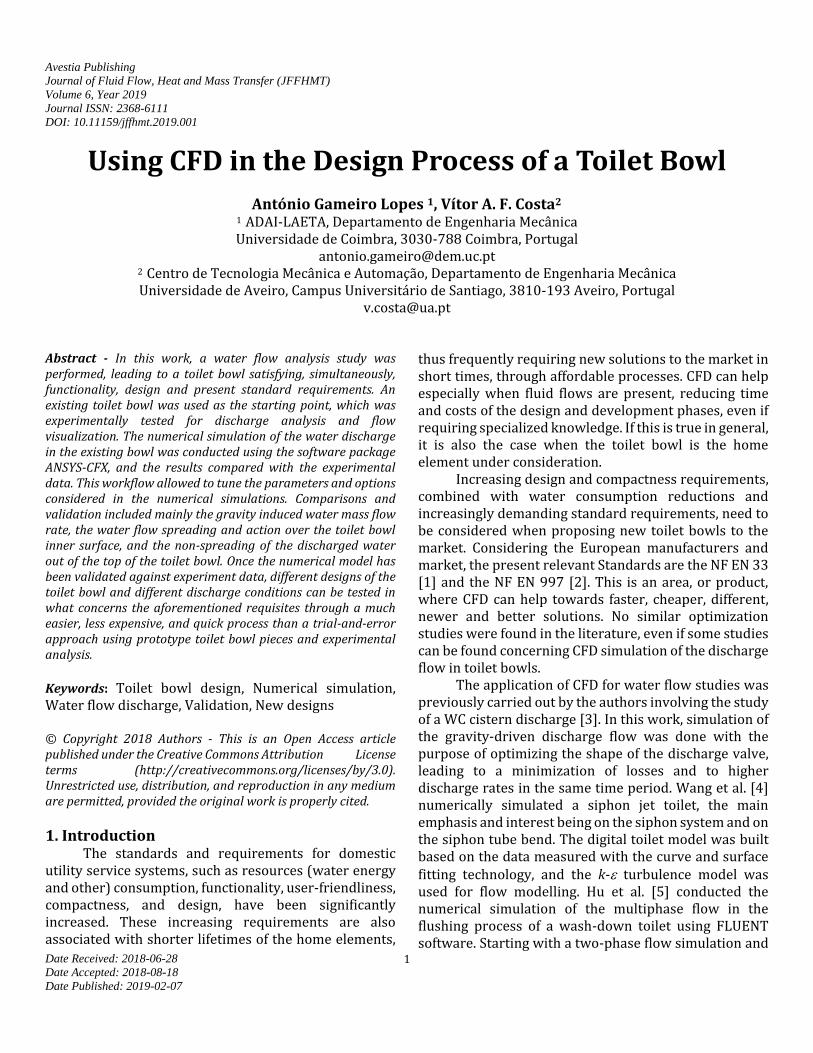
The toilet bowl considered in the first phase of this study is the SunLife model from Sanindusa, a Portuguese company, which is shown in Figure 1. This is an already existing bowl, that was chosen with the purpose of testing and validating the numerical simulation procedure. The discharge is made using a standard installation, where an elevated cistern provides a gravity-driven water discharge flow. The water is supplied through a 5.5 cm diameter pipe, and enters the bowl both laterally, producing a vortex-type flow and vertically through 3 entrances, enhancing the discharge of solid residues. The exit pipe is 8 cm in diameter. Visualization of the water flow spreading over the inner surface of the toilet bowl is made considering three different level/contour lines registered in the inner surface of the toilet bowl. Water discharged into the bowl is coloured to obtain a higher contrast with the white colour of the inner bowl surface.
Figure 1. CAD model of the SunLife toilet bowl model from
Sanindusa.
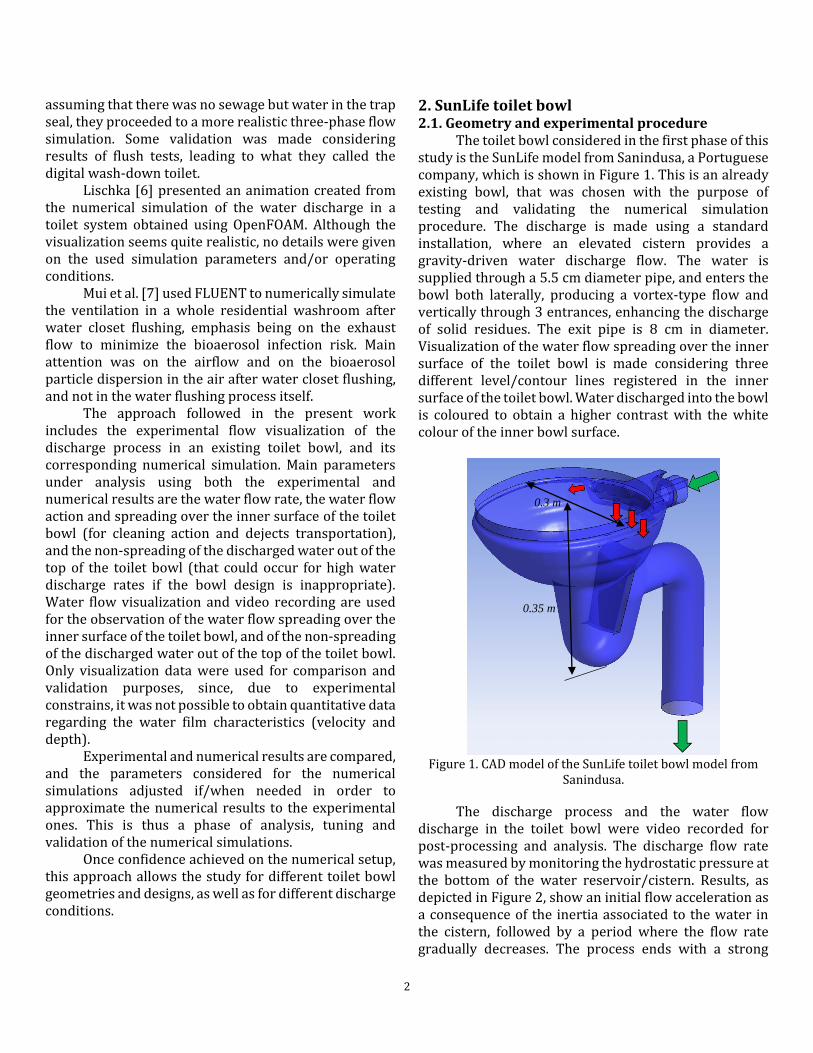
The discharge process and the water flow discharge in the toilet bowl were video recorded for post-processing and analysis. The discharge flow rate was measured by monitoring the hydrostatic pressure at the bottom of the water reservoir/cistern. Results, as depicted in Figure 2, show an initial flow acceleration as a consequence of the inertia associated to the water in the cistern, followed by a period where the flow rate gradually decreases. The process ends with a strong
0.35 m
0.3 m
3
deceleration, after which the cistern is essentially empty. Simulations were performed for a water flow rate 0.85 L/s, which corresponds to the initial stages after the flow acceleration.
Figure 2. Water volume in the cistern as a function of time for
the SunLife bowl model.
3. Numerical simulation 3.1. Problem physics
This is a complex problem of gravity-driven fluid flow, the water entering the bowl at several locations (Figure 1) and producing a complex pattern of free-surface interaction. Although a constant flow rate was imposed to compare simulations with observations at a specific stage of the discharge process, unsteadiness associated with the complex interactions between both phases (water and air) had to be taken into account. Accordingly, a transient approach was adopted.
The numerical simulations were conducted in ANSYS CFX V18.0 [8] using the standard fluids - Air at 25 ºC and Water - selected from the available library. The free surface flow calculation was performed using the homogeneous model, both fluids sharing the same velocity and turbulence fields at the water-air interface. Corresponding equations for mass and momentum conservation are:
. V 0t
(1)
. . M
VV V p S
t
(2)
where is density, p is pressure, t is time, V is the velocity vector and SM is a general source term where buoyancy forces are included. The stress tensor is given by:
2
.3
T
V V V
(3)
The air-water interaction was modelled using a
surface tension coefficient of 0.0728 N/m. The k- turbulence model [9] was adopted to take
into account the effects of velocity fluctuations upon the mean flow field. The fundamental equations are:
tj k
j j k j
k kU k P
t x x x
(4)
tj 1 k 2 k
j j j
kU C P C
t x x x k
(5)
where k represents the turbulent kinetic energy and is its dissipation rate. Pk is the production term and
t is
the turbulent viscosity, given by:
2
t
kC
(6)
Values of constants are 1.0k , 1.3 , 0.09C ,
1 1.44C and 2 1.92C .
For the type of flow in the present geometry, turbulence intensity does not play a significant role, since no separation regions are present. At the water inlet, a turbulence intensity of 5% was assigned, based on estimations. At the outlet, conservative conditions were applied and pressure was set to atmospheric. The top boundary is an open boundary, where the air is free to enter or leave the domain. At solid surfaces, a no-slip condition was assigned.
3.2. Mesh and time step dependency study
The adopted mesh was of unstructured type. An inflation layer of structured elements with total thickness 2 cm was created near solid boundaries, with the dual purpose of resolving the boundary layer and better capture the steep gradients in the air-water interface. For the mesh-dependency tests, 3 different meshes were considered, with main characteristics as
0
1
2
3
4
5
6
7
0 5 10 15
v [l
]
t [s]
4
listed in Table 1. In this table, some mesh quality statistics are presented: minimum and maximum aspect ratio and skewness (average and root mean square, in brackets). The high values of aspect ratio result from the inflation layer near the walls, necessary to ensure a good resolution in the direction normal to the boundary. Skewness is rather low for all meshes, which is a good indicator of mesh quality, necessary to keep discretization errors at low level.
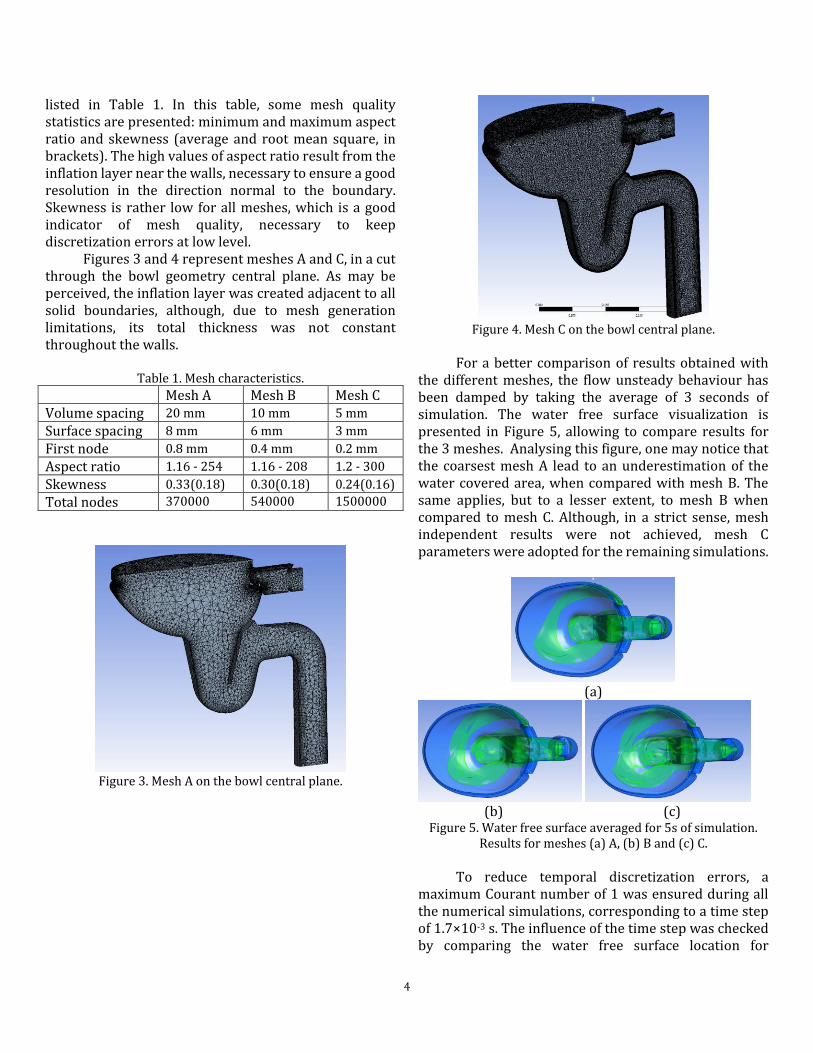
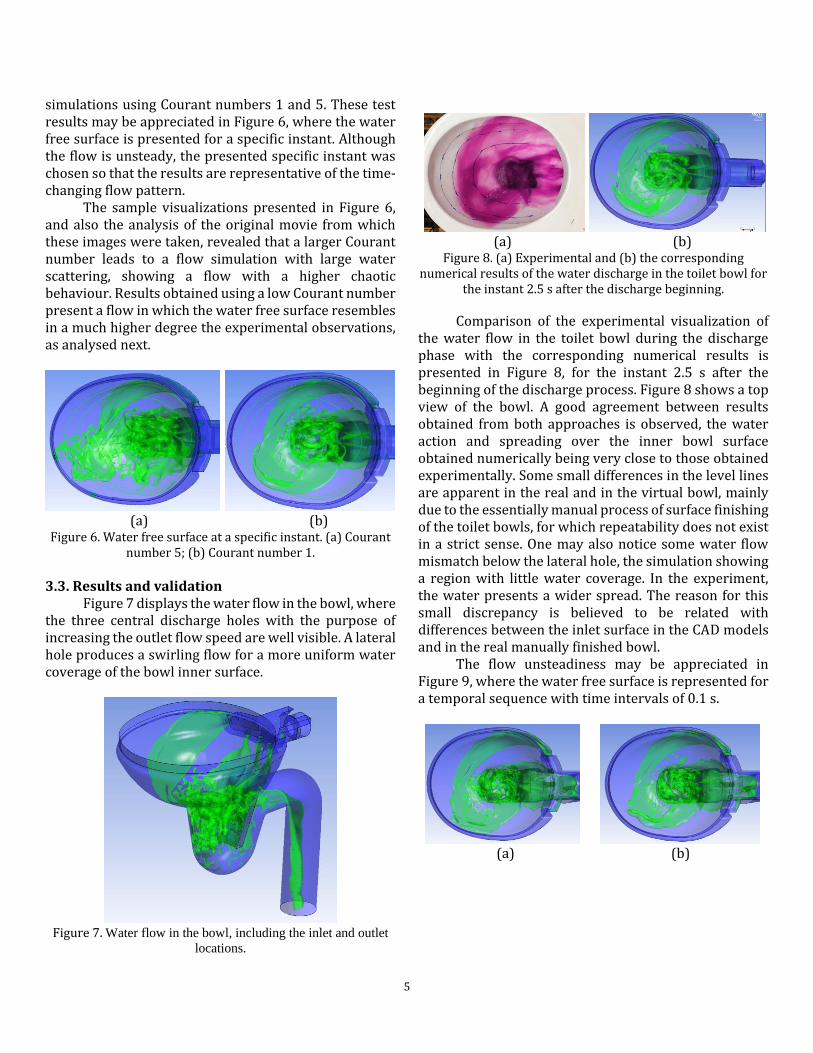
Figures 3 and 4 represent meshes A and C, in a cut through the bowl geometry central plane. As may be perceived, the inflation layer was created adjacent to all solid boundaries, although, due to mesh generation limitations, its total thickness was not constant throughout the walls.
Table 1. Mesh characteristics.
Mesh A Mesh B Mesh C Volume spacing 20 mm 10 mm 5 mm
Surface spacing 8 mm 6 mm 3 mm
First node 0.8 mm 0.4 mm 0.2 mm
Aspect ratio 1.16 - 254 1.16 - 208 1.2 - 300
Skewness 0.33(0.18) 0.30(0.18) 0.24(0.16)
Total nodes 370000 540000 1500000
Figure 3. Mesh A on the bowl central plane.
Figure 4. Mesh C on the bowl central plane.
For a better comparison of results obtained with
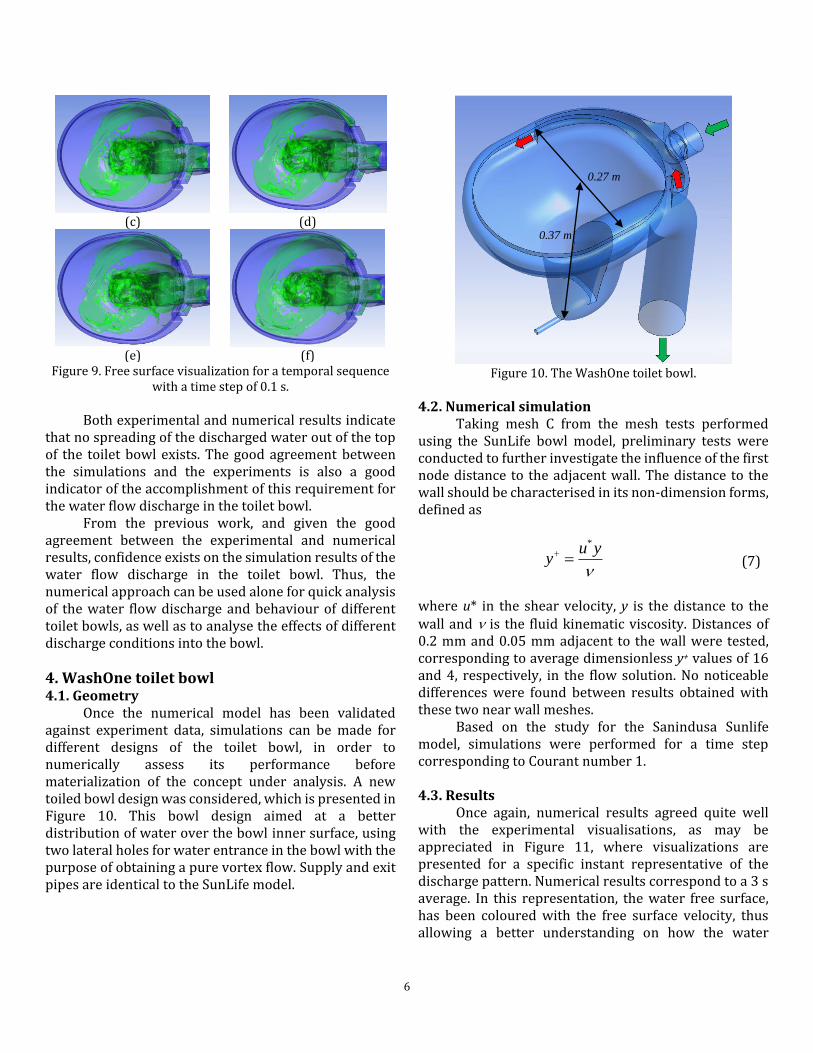
the different meshes, the flow unsteady behaviour has been damped by taking the average of 3 seconds of simulation. The water free surface visualization is presented in Figure 5, allowing to compare results for the 3 meshes. Analysing this figure, one may notice that the coarsest mesh A lead to an underestimation of the water covered area, when compared with mesh B. The same applies, but to a lesser extent, to mesh B when compared to mesh C. Although, in a strict sense, mesh independent results were not achieved, mesh C parameters were adopted for the remaining simulations.
(a)
(b) (c)
Figure 5. Water free surface averaged for 5s of simulation. Results for meshes (a) A, (b) B and (c) C.
To reduce temporal discretization errors, a
maximum Courant number of 1 was ensured during all the numerical simulations, corresponding to a time step of 1.7×10⁻³ s. The influence of the time step was checked by comparing the water free surface location for
5
simulations using Courant numbers 1 and 5. These test results may be appreciated in Figure 6, where the water free surface is presented for a specific instant. Although the flow is unsteady, the presented specific instant was chosen so that the results are representative of the time-changing flow pattern.
The sample visualizations presented in Figure 6, and also the analysis of the original movie from which these images were taken, revealed that a larger Courant number leads to a flow simulation with large water scattering, showing a flow with a higher chaotic behaviour. Results obtained using a low Courant number present a flow in which the water free surface resembles in a much higher degree the experimental observations, as analysed next.
(a) (b) Figure 6. Water free surface at a specific instant. (a) Courant
number 5; (b) Courant number 1. 3.3. Results and validation
Figure 7 displays the water flow in the bowl, where the three central discharge holes with the purpose of increasing the outlet flow speed are well visible. A lateral hole produces a swirling flow for a more uniform water coverage of the bowl inner surface.
Figure 7. Water flow in the bowl, including the inlet and outlet
locations.
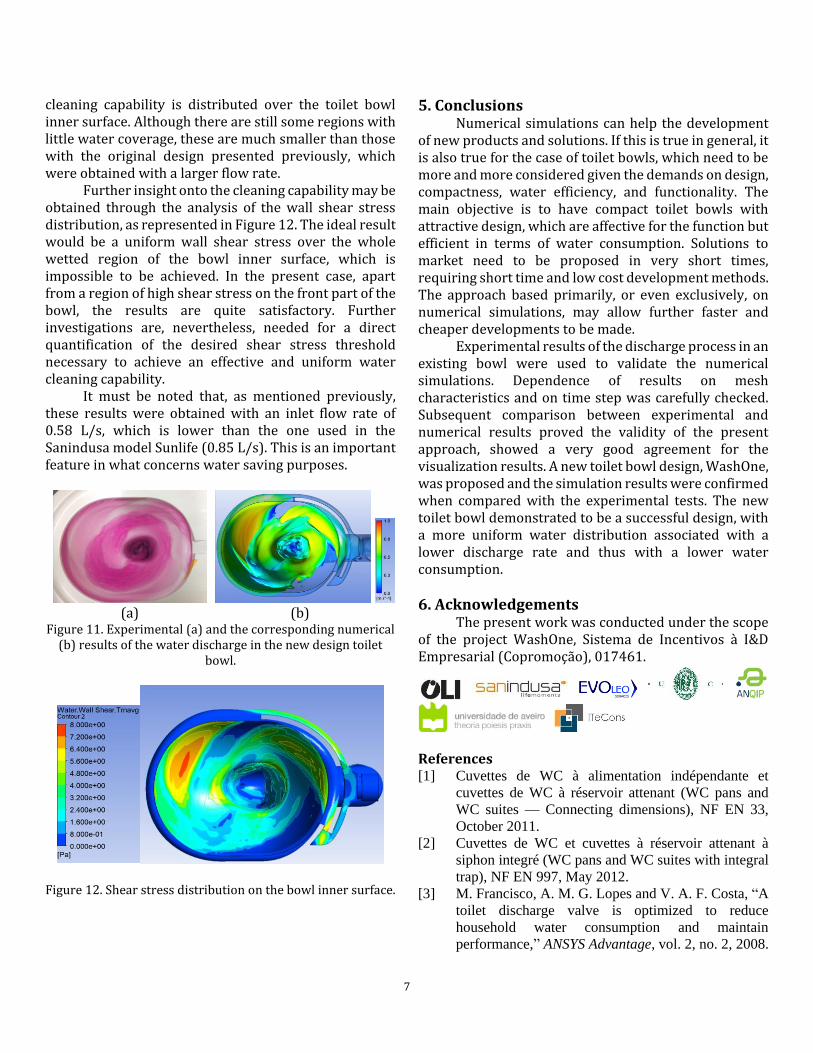
(a) (b)
Figure 8. (a) Experimental and (b) the corresponding numerical results of the water discharge in the toilet bowl for
the instant 2.5 s after the discharge beginning.
Comparison of the experimental visualization of the water flow in the toilet bowl during the discharge phase with the corresponding numerical results is presented in Figure 8, for the instant 2.5 s after the beginning of the discharge process. Figure 8 shows a top view of the bowl. A good agreement between results obtained from both approaches is observed, the water action and spreading over the inner bowl surface obtained numerically being very close to those obtained experimentally. Some small differences in the level lines are apparent in the real and in the virtual bowl, mainly due to the essentially manual process of surface finishing of the toilet bowls, for which repeatability does not exist in a strict sense. One may also notice some water flow mismatch below the lateral hole, the simulation showing a region with little water coverage. In the experiment, the water presents a wider spread. The reason for this small discrepancy is believed to be related with differences between the inlet surface in the CAD models and in the real manually finished bowl.
The flow unsteadiness may be appreciated in Figure 9, where the water free surface is represented for a temporal sequence with time intervals of 0.1 s.
(a) (b)
6
(c) (d)
(e) (f)
Figure 9. Free surface visualization for a temporal sequence with a time step of 0.1 s.
Both experimental and numerical results indicate
that no spreading of the discharged water out of the top of the toilet bowl exists. The good agreement between the simulations and the experiments is also a good indicator of the accomplishment of this requirement for the water flow discharge in the toilet bowl.
From the previous work, and given the good agreement between the experimental and numerical results, confidence exists on the simulation results of the water flow discharge in the toilet bowl. Thus, the numerical approach can be used alone for quick analysis of the water flow discharge and behaviour of different toilet bowls, as well as to analyse the effects of different discharge conditions into the bowl.
4. WashOne toilet bowl 4.1. Geometry
Once the numerical model has been validated against experiment data, simulations can be made for different designs of the toilet bowl, in order to numerically assess its performance before materialization of the concept under analysis. A new toiled bowl design was considered, which is presented in Figure 10. This bowl design aimed at a better distribution of water over the bowl inner surface, using two lateral holes for water entrance in the bowl with the purpose of obtaining a pure vortex flow. Supply and exit pipes are identical to the SunLife model.
Figure 10. The WashOne toilet bowl.
4.2. Numerical simulation
Taking mesh C from the mesh tests performed using the SunLife bowl model, preliminary tests were conducted to further investigate the influence of the first node distance to the adjacent wall. The distance to the wall should be characterised in its non-dimension forms, defined as
*u y
y
(7)
where u* in the shear velocity, y is the distance to the wall and is the fluid kinematic viscosity. Distances of 0.2 mm and 0.05 mm adjacent to the wall were tested, corresponding to average dimensionless y+ values of 16 and 4, respectively, in the flow solution. No noticeable differences were found between results obtained with these two near wall meshes.
Based on the study for the Sanindusa Sunlife model, simulations were performed for a time step corresponding to Courant number 1.
4.3. Results
Once again, numerical results agreed quite well with the experimental visualisations, as may be appreciated in Figure 11, where visualizations are presented for a specific instant representative of the discharge pattern. Numerical results correspond to a 3 s average. In this representation, the water free surface, has been coloured with the free surface velocity, thus allowing a better understanding on how the water
0.37 m
0.27 m
7
cleaning capability is distributed over the toilet bowl inner surface. Although there are still some regions with little water coverage, these are much smaller than those with the original design presented previously, which were obtained with a larger flow rate.
Further insight onto the cleaning capability may be obtained through the analysis of the wall shear stress distribution, as represented in Figure 12. The ideal result would be a uniform wall shear stress over the whole wetted region of the bowl inner surface, which is impossible to be achieved. In the present case, apart from a region of high shear stress on the front part of the bowl, the results are quite satisfactory. Further investigations are, nevertheless, needed for a direct quantification of the desired shear stress threshold necessary to achieve an effective and uniform water cleaning capability.
It must be noted that, as mentioned previously, these results were obtained with an inlet flow rate of 0.58 L/s, which is lower than the one used in the Sanindusa model Sunlife (0.85 L/s). This is an important feature in what concerns water saving purposes.
(a) (b) Figure 11. Experimental (a) and the corresponding numerical
(b) results of the water discharge in the new design toilet bowl.
Figure 12. Shear stress distribution on the bowl inner surface.
5. Conclusions Numerical simulations can help the development
of new products and solutions. If this is true in general, it is also true for the case of toilet bowls, which need to be more and more considered given the demands on design, compactness, water efficiency, and functionality. The main objective is to have compact toilet bowls with attractive design, which are affective for the function but efficient in terms of water consumption. Solutions to market need to be proposed in very short times, requiring short time and low cost development methods. The approach based primarily, or even exclusively, on numerical simulations, may allow further faster and cheaper developments to be made.
Experimental results of the discharge process in an existing bowl were used to validate the numerical simulations. Dependence of results on mesh characteristics and on time step was carefully checked. Subsequent comparison between experimental and numerical results proved the validity of the present approach, showed a very good agreement for the visualization results. A new toilet bowl design, WashOne, was proposed and the simulation results were confirmed when compared with the experimental tests. The new toilet bowl demonstrated to be a successful design, with a more uniform water distribution associated with a lower discharge rate and thus with a lower water consumption.
6. Acknowledgements The present work was conducted under the scope
of the project WashOne, Sistema de Incentivos à I&D Empresarial (Copromoção), 017461.
References [1] Cuvettes de WC à alimentation indépendante et
cuvettes de WC à réservoir attenant (WC pans and
WC suites — Connecting dimensions), NF EN 33,
October 2011.
[2] Cuvettes de WC et cuvettes à réservoir attenant à
siphon integré (WC pans and WC suites with integral
trap), NF EN 997, May 2012.
[3] M. Francisco, A. M. G. Lopes and V. A. F. Costa, “A
toilet discharge valve is optimized to reduce
household water consumption and maintain
performance,” ANSYS Advantage, vol. 2, no. 2, 2008.
8
[4] Y. Wang, G. Xiu and H. Tan, “CAD and CAE
analysis for siphon jet toilet,” Physics Procedia, vol.
19, pp. 472–476, 2011.
[5] J. G. Hu, Y. Sun and Z. Zhang, “Numerical simulation
and experimental validation of three-dimensional
unsteady multi-phase flow in flushing process of
toilets,” Applied Mechanics and Materials, vols. 444-
445, pp. 304-311, 2014.
[6] C. Lischka. (2018, June). Bathroom toilet CFD
simulation using OpenFOAM [Online]. Available:
http://www.vibrantbuzz.com/video/-
d_zYeqebco/bathroom-toilet-cfd-simulation-using-
openfoam
[7] K. W. Mui, L. T. Wong, H. C. Yu, C. T. Cheung and
N. Li, “Exhaust ventilation performance in residential
washrooms for bioaerosol particle removal after water
closet flushing,” Building Services Engineering
Research and Technology, vol. 38, no. 1, pp. 32–46,
2017.
[8] ANSYS CFX V18.0. User´s Manual. 2017.
[9] B. E. Launder and D. B. Spalding, “The numerical
computation of turbulent flows,” Computer Methods
in Applied Mechanics and Engineering, vol. 3, pp.
269–289, 1974.