Embed Size (px)
Citation preview
8
1 INTRODUCTION
Compressive strength of hydraulic cement is an important parameter in the quality control of concrete. Stan-dard sand is used as a filler material in testing hydraulic cement. Shape and size of sand grain depend on the composition of parent rock formation and fracture process. The composition of sand is highly variable, de-pending on the local rock sources and conditions, but the most common constituent of sand is silica (silicon dioxide, SiO2), usually available in the form of quartz. The first prerequisite for being standard sand is that, it’s geological origin needs to be known via geo-referencing. Many countries, for example, China, Japan, In-dia and United Kingdom already have defined standard sands from respective local origins. Though many at-tempts were taken by earlier researchers in Bangladesh to replace Ottawa sand, all attempts were unsuccessful for the selection of wrong source of sand as they used river bed sand which contains relatively lesser amount of silica compared to that of Ottawa sand. However, geological sand deposit not only contains relatively larg-er amount of silica compared to that of river bed sand but also offer the opportunity of getting dependable supply over the time. Our objective in this section is to identify sand with high silica content from a known and well located geological formation. In ASTM [ASTM C778] procedure Ottawa Sand is used for testing of hydraulic cement mortar. Though sand is found abundantly in many places in Bangladesh, most of these are not suitable for the replacement of Otta-wa sand because of dissimilarities from engineering specification. To satisfy engineering specification, the lo-cation and properties of sand must satisfy the following requirements.
1. Geo-referenced origin 2. Easy access for mining 3. Size and perpetuality of the deposits 4. Gradation of sand grain 5. Size and shape of sand grain
4th Annual Paper Meet and 1st Civil Engineering Congress, December 22-24, 2011, Dhaka, Bangladesh ISBN: 978-984-33-4363-5Noor, Amin, Bhuiyan, Chowdhury and Kakoli (eds) www.iebconferences.info
Use of selected silica deposits of Bangladesh as standard sand in testing compressive strength of hydraulic cement mortars: A proposal for strength correlation
M.M. Haque, M.Z.R. Siddiqi, M.A. Rahman, M.S. Islam & A.F.M.S. Amin Bangladesh University of Engineering and Technology, Dhaka 1000, Bangladesh
M.K. Alam Geological Survey of Bangladesh
ABSTRACT: An investigation is conducted to study the possibility of using selected silica deposits of Ban-gladesh as standard sand in testing compressive strength of hydraulic cements. To this end, silica sands col-lected from geo-referenced Dupi Tila formation of Bangladesh located near to ground surface were mechani-cally and chemically processed to remove physical and chemical impurities. Collected deposits show uniformity in grain size and mineralogical composition. X-ray diffraction analysis was conducted to deter-mine chemical composition. Shape and surface morphology of the grains were observed in Scanning Electron Microscope. Cement cubes prepared using the sand samples were compared with those prepared with Ottawa sand in ASTM standard for compressive strength. Finally strength correlations for the samples obtained after mechanical and chemical processing were established, which show close and dependable resemblance with Ottawa sand. Keywords: Standard sand, Silica deposit, Strength Correlation
9
6. Chemical composition of sand 7. Color of sand grain
In an attempt to replace Ottawa sand with locally available sand in hydraulic cement mortar test a thorough survey of the available literature was carried out. Formation of soil deposits in Bangladesh, geology of sites, availability of sand at sites, methods of investigation of sand deposits, methods of proportioning of sand grain, properties of constituting materials of mortar were covered in this review. The sand deposits collected from source were thoroughly washed by water and acid to purify. For determination of chemical composition, X-ray diffraction (XRD) analysis was conducted. Scanning Electron Microscope (SEM) observation was per-formed to assess the shape of locally available sand. Using local sand, number of batches of mortar was cast while Bureau of Research and Testing Consultation, Bangladesh University of Engineering and Technology (BRTC, BUET) had tested the same cement samples using Ottawa sand. In testing cement mortar, ASTM specifications were thoroughly followed. The strength of cement mortar using indigenous sand was compared with that of Ottawa sand and the correlation of strength was developed.
2 GEOLOGICAL ORIGIN
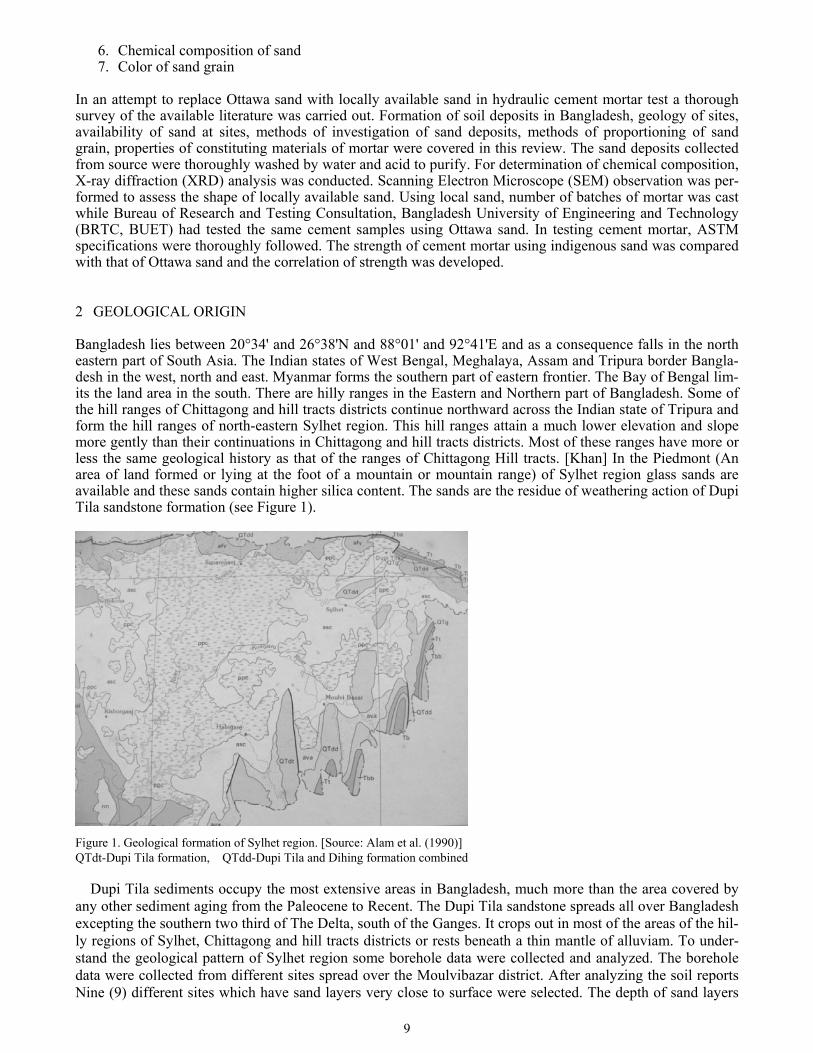
Bangladesh lies between 20°34' and 26°38'N and 88°01' and 92°41'E and as a consequence falls in the north eastern part of South Asia. The Indian states of West Bengal, Meghalaya, Assam and Tripura border Bangla-desh in the west, north and east. Myanmar forms the southern part of eastern frontier. The Bay of Bengal lim-its the land area in the south. There are hilly ranges in the Eastern and Northern part of Bangladesh. Some of the hill ranges of Chittagong and hill tracts districts continue northward across the Indian state of Tripura and form the hill ranges of north-eastern Sylhet region. This hill ranges attain a much lower elevation and slope more gently than their continuations in Chittagong and hill tracts districts. Most of these ranges have more or less the same geological history as that of the ranges of Chittagong Hill tracts. [Khan] In the Piedmont (An area of land formed or lying at the foot of a mountain or mountain range) of Sylhet region glass sands are available and these sands contain higher silica content. The sands are the residue of weathering action of Dupi Tila sandstone formation (see Figure 1).
Figure 1. Geological formation of Sylhet region. [Source: Alam et al. (1990)] QTdt-Dupi Tila formation, QTdd-Dupi Tila and Dihing formation combined
Dupi Tila sediments occupy the most extensive areas in Bangladesh, much more than the area covered by any other sediment aging from the Paleocene to Recent. The Dupi Tila sandstone spreads all over Bangladesh excepting the southern two third of The Delta, south of the Ganges. It crops out in most of the areas of the hil-ly regions of Sylhet, Chittagong and hill tracts districts or rests beneath a thin mantle of alluviam. To under-stand the geological pattern of Sylhet region some borehole data were collected and analyzed. The borehole data were collected from different sites spread over the Moulvibazar district. After analyzing the soil reports Nine (9) different sites which have sand layers very close to surface were selected. The depth of sand layers
10
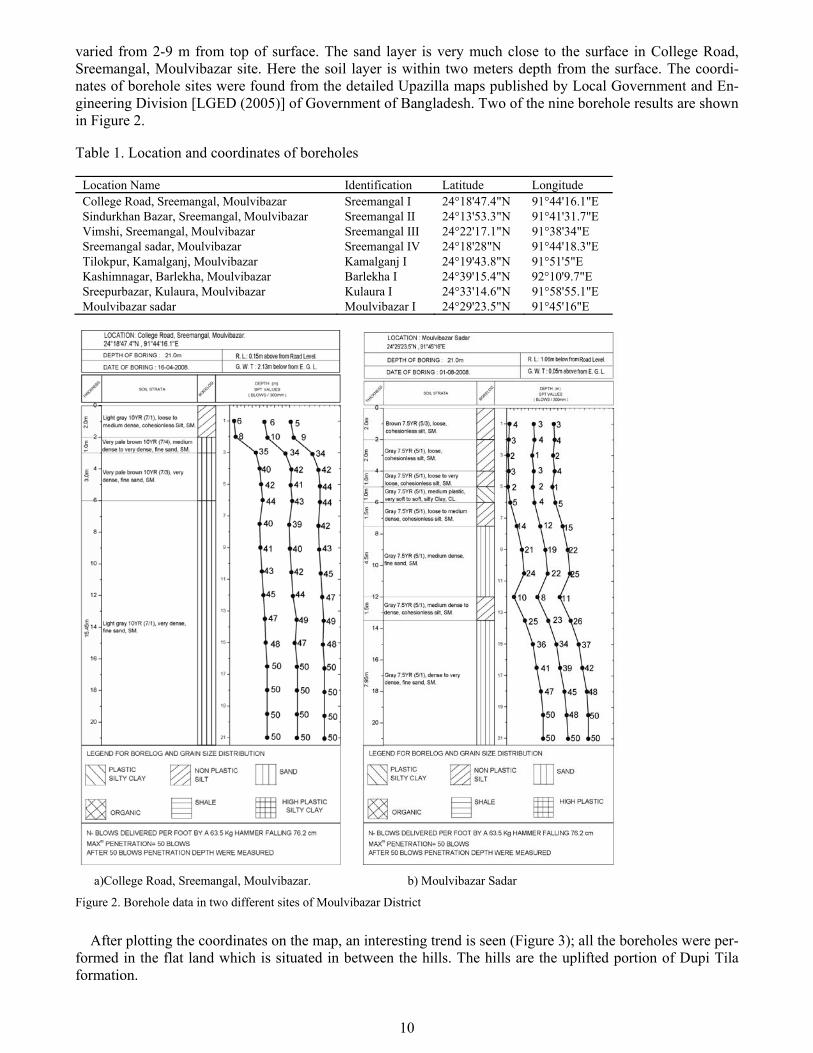
varied from 2-9 m from top of surface. The sand layer is very much close to the surface in College Road, Sreemangal, Moulvibazar site. Here the soil layer is within two meters depth from the surface. The coordi-nates of borehole sites were found from the detailed Upazilla maps published by Local Government and En-gineering Division [LGED (2005)] of Government of Bangladesh. Two of the nine borehole results are shown in Figure 2.
Table 1. Location and coordinates of boreholes
Location Name Identification Latitude Longitude College Road, Sreemangal, Moulvibazar Sreemangal I 24°18'47.4"N 91°44'16.1"E Sindurkhan Bazar, Sreemangal, Moulvibazar Sreemangal II 24°13'53.3"N 91°41'31.7"E Vimshi, Sreemangal, Moulvibazar Sreemangal III 24°22'17.1"N 91°38'34"E Sreemangal sadar, Moulvibazar Sreemangal IV 24°18'28"N 91°44'18.3"E Tilokpur, Kamalganj, Moulvibazar Kamalganj I 24°19'43.8"N 91°51'5"E Kashimnagar, Barlekha, Moulvibazar Barlekha I 24°39'15.4"N 92°10'9.7"E Sreepurbazar, Kulaura, Moulvibazar Kulaura I 24°33'14.6"N 91°58'55.1"E Moulvibazar sadar Moulvibazar I 24°29'23.5"N 91°45'16"E
a)College Road, Sreemangal, Moulvibazar. b) Moulvibazar Sadar
Figure 2. Borehole data in two different sites of Moulvibazar District
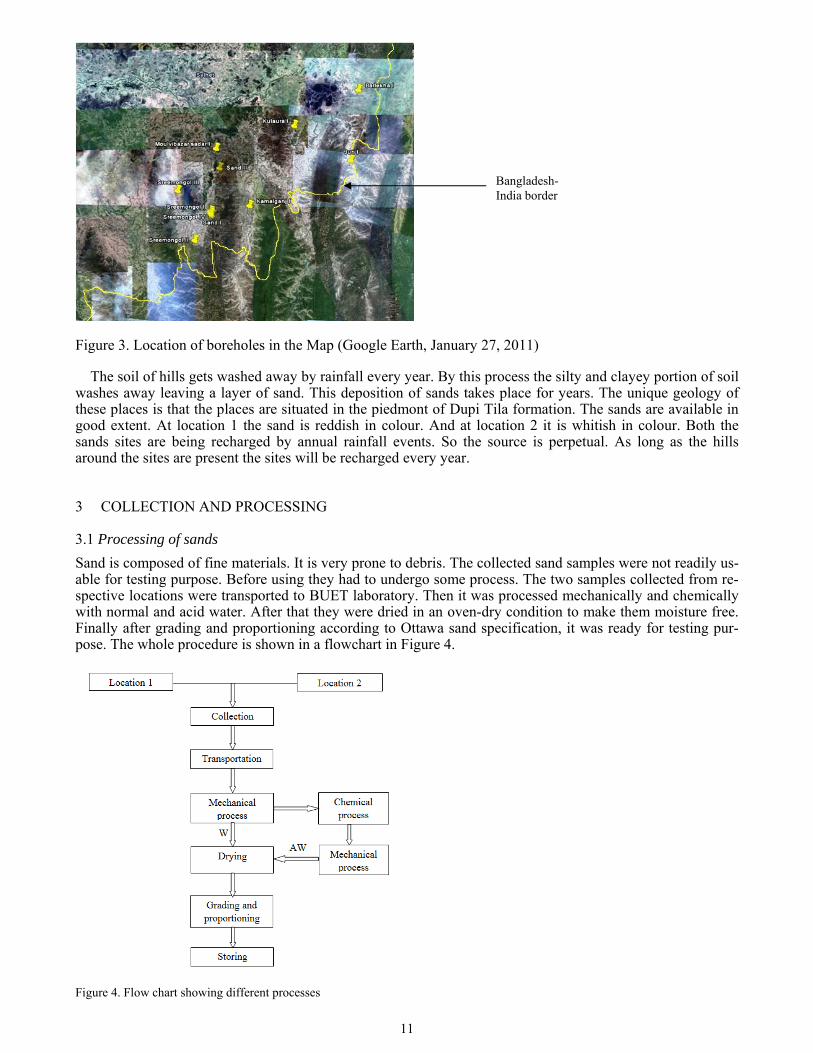
After plotting the coordinates on the map, an interesting trend is seen (Figure 3); all the boreholes were per-formed in the flat land which is situated in between the hills. The hills are the uplifted portion of Dupi Tila formation.
11
Figure 3. Location of boreholes in the Map (Google Earth, January 27, 2011)
The soil of hills gets washed away by rainfall every year. By this process the silty and clayey portion of soil washes away leaving a layer of sand. This deposition of sands takes place for years. The unique geology of these places is that the places are situated in the piedmont of Dupi Tila formation. The sands are available in good extent. At location 1 the sand is reddish in colour. And at location 2 it is whitish in colour. Both the sands sites are being recharged by annual rainfall events. So the source is perpetual. As long as the hills around the sites are present the sites will be recharged every year.
3 COLLECTION AND PROCESSING
3.1 Processing of sands
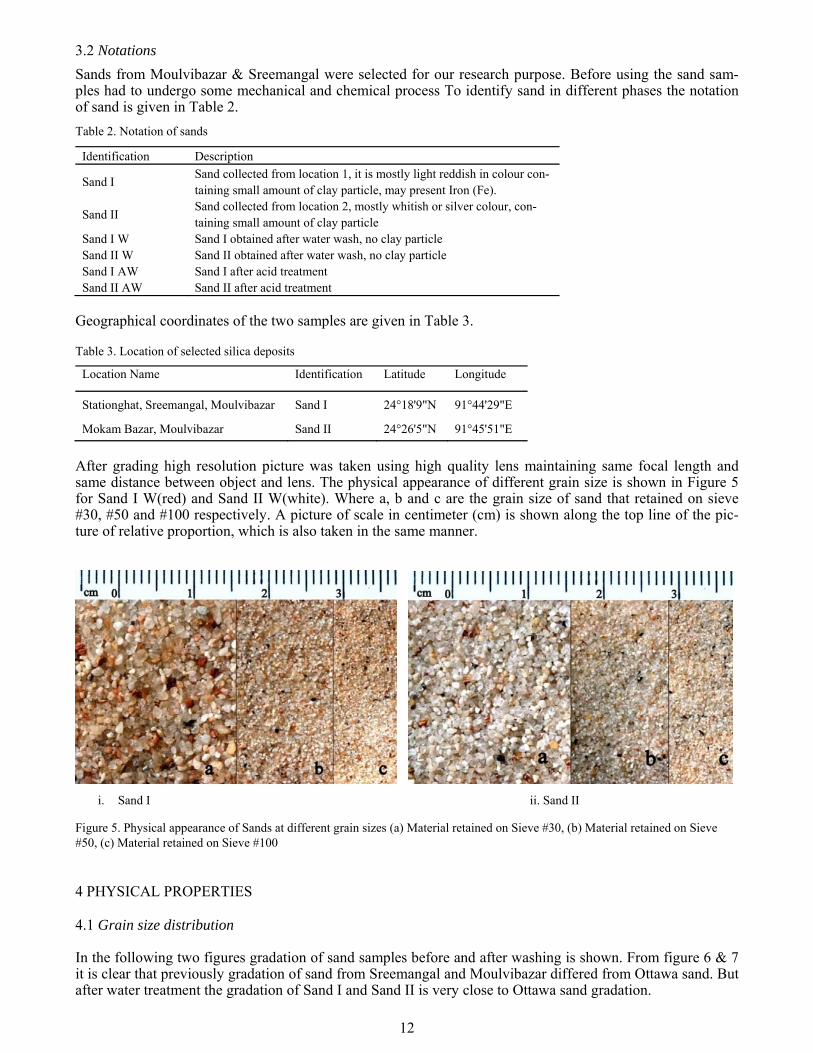
Sand is composed of fine materials. It is very prone to debris. The collected sand samples were not readily us-able for testing purpose. Before using they had to undergo some process. The two samples collected from re-spective locations were transported to BUET laboratory. Then it was processed mechanically and chemically with normal and acid water. After that they were dried in an oven-dry condition to make them moisture free. Finally after grading and proportioning according to Ottawa sand specification, it was ready for testing pur-pose. The whole procedure is shown in a flowchart in Figure 4.
Figure 4. Flow chart showing different processes
Bangladesh-India border
12
3.2 Notations
Sands from Moulvibazar & Sreemangal were selected for our research purpose. Before using the sand sam-ples had to undergo some mechanical and chemical process To identify sand in different phases the notation of sand is given in Table 2.
Table 2. Notation of sands
Identification Description
Sand I Sand collected from location 1, it is mostly light reddish in colour con-taining small amount of clay particle, may present Iron (Fe).
Sand II Sand collected from location 2, mostly whitish or silver colour, con-taining small amount of clay particle
Sand I W Sand I obtained after water wash, no clay particle Sand II W Sand II obtained after water wash, no clay particle Sand I AW Sand I after acid treatment Sand II AW Sand II after acid treatment
Geographical coordinates of the two samples are given in Table 3.
Table 3. Location of selected silica deposits
Location Name Identification Latitude Longitude
Stationghat, Sreemangal, Moulvibazar Sand I 24°18'9"N 91°44'29"E
Mokam Bazar, Moulvibazar Sand II 24°26'5"N 91°45'51"E
After grading high resolution picture was taken using high quality lens maintaining same focal length and same distance between object and lens. The physical appearance of different grain size is shown in Figure 5 for Sand I W(red) and Sand II W(white). Where a, b and c are the grain size of sand that retained on sieve #30, #50 and #100 respectively. A picture of scale in centimeter (cm) is shown along the top line of the pic-ture of relative proportion, which is also taken in the same manner.
i. Sand I ii. Sand II
Figure 5. Physical appearance of Sands at different grain sizes (a) Material retained on Sieve #30, (b) Material retained on Sieve #50, (c) Material retained on Sieve #100
4 PHYSICAL PROPERTIES
4.1 Grain size distribution
In the following two figures gradation of sand samples before and after washing is shown. From figure 6 & 7 it is clear that previously gradation of sand from Sreemangal and Moulvibazar differed from Ottawa sand. But after water treatment the gradation of Sand I and Sand II is very close to Ottawa sand gradation.

13
Figure 6. Gradation curves of sand samples before processing Figure 7. Gradation curves of samples after processing Mix sand indicates the sand by which cement mortar test was performed. So it is the proportioning ratio for all sand (Sand I W, Sand I AW, Sand II W and Sand II AW). Samples were prepared by proportioning grains according to average typical gradation values of Ottawa sand. Sand I and Sand II are the original sand col-lected from field. Sand I have more fine particles than that of Sand II. But both the Sand I and Sand II has more fine particles and larger size particle is less than that of Ottawa sand. The relative proportion of small sized particle for mix is greater than that of Ottawa sand and larger size particle is less than that of Ottawa sand.
4.2 Absorption capacity and specific gravity
Specific gravity and absorption capacity are determined using standard test procedure. The values obtained from tests are given in Table 4. Table 4. Specific gravity and absorption capacity of different sample
Sand ID
Absorption Capacity %
Specific Gravity
Bulk Bulk (SSD) Apparent
Sand-I 0.58 2.51 2.52 2.54Sand-II 0.28 2.66 2.66 2.68Sand-I W 0.52 2.61 2.63 2.65Sand-II W 0.54 2.61 2.62 2.65Sand-I AW 0.58 2.59 2.61 2.63Sand-II AW 0.36 2.63 2.64 2.65Ottawa 0.16 2.64 2.64 2.65
Specific gravities of the tested sands are close to the typical Ottawa sand value. It’s lesser in case of Sand I only, due to the presence of greater clay content. In case of Sand I specific gravity after water washing in-creases but after acid treatment it decreases. In case of Sand II specific gravity decreases, then increases for water and acid treatment respectively.
5. MEASUREMENTS AND OBSERVATIONS
Although there are many applications of Ottawa sand, we concentrated in the compressive strength characte-ristics of locally available sand and compared the result with the strength of Ottawa sand. To explain the strength characteristics it is necessary to evaluate some other physical and chemical properties of both Ottawa and locally available sand.
5.1 Shape
To identify shape of locally available sand Scanning Electron Microscope (SEM) is used and this is per-formed in SEM laboratory, Centre of Excellence, University of Dhaka. Shapes of figures obtained from SEM are given in Figure 8 through Figure 15.

14
Figure 8. Shape of Sand I W (#30) Figure 9. Shape of Sand I AW (#30)
Figure 10. Shape of Sand I W (#100) Figure 11. Shape of Sand I AW (#100)
Figure 12. Shape of Sand II W (#30) Figure 13. Shape of Sand II AW (#30)
Figure 14. Shape of Sand II W (#100) Figure 15. Shape of Sand II AW (#100)
The SEM analysis images show that selected sands are angular in nature. Shape is an important parameter of sand grains for compressive strength. Strength can be affected by shape, if sufficient angularity is present. In that case lower strength is obtained compared to Ottawa sand. Shape of Ottawa sand is rounded and its shape is more or less uniform. Thus variation in test results does not happen due to the shape of Ottawa. From Figure 8 through Figure 15 it is also seen that, Sand II has less angularity compared to that of Sand I. It is also seen that most of hand washed samples (i.e. W series) are angular for all sizes for both Sand I and Sand II. But after acid washing the angularity is reduced at very small extent.
15
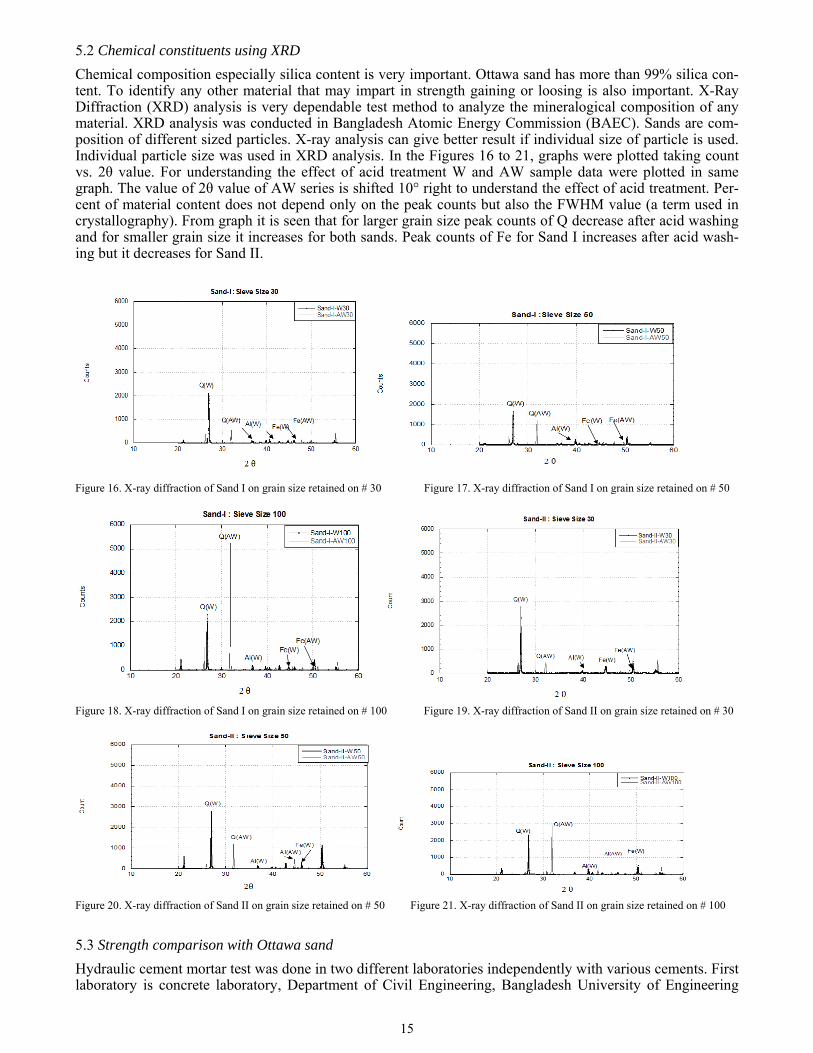
5.2 Chemical constituents using XRD
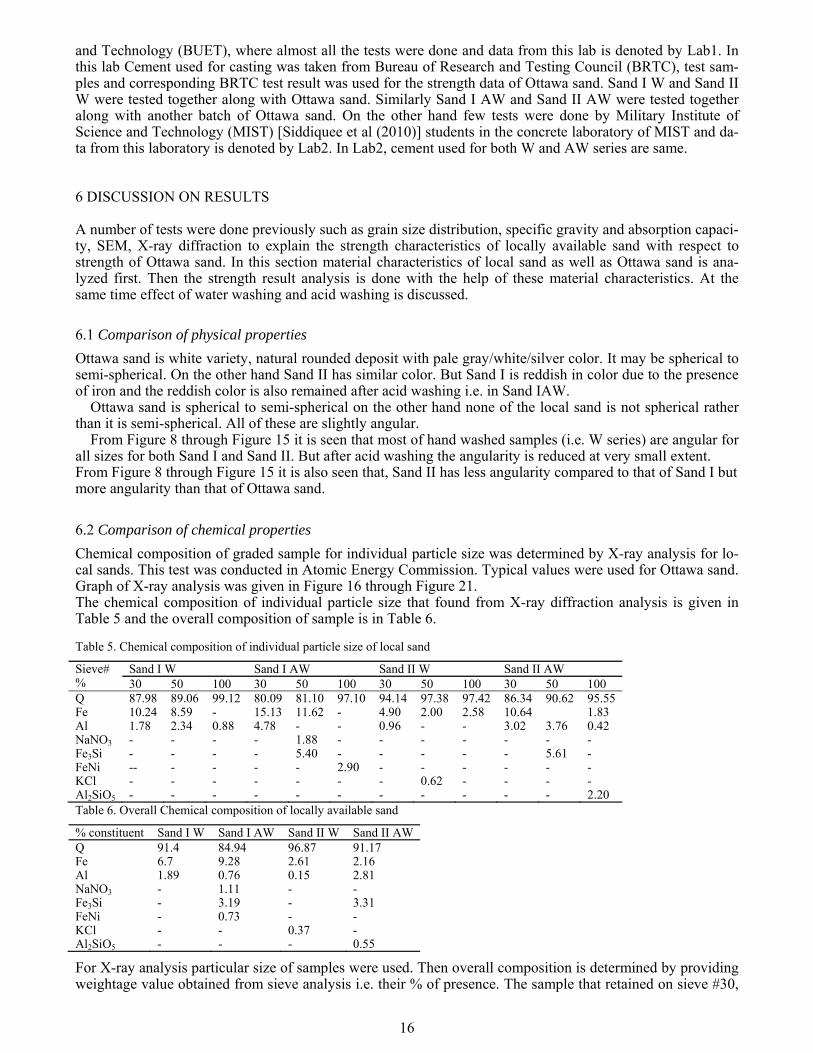
Chemical composition especially silica content is very important. Ottawa sand has more than 99% silica con-tent. To identify any other material that may impart in strength gaining or loosing is also important. X-Ray Diffraction (XRD) analysis is very dependable test method to analyze the mineralogical composition of any material. XRD analysis was conducted in Bangladesh Atomic Energy Commission (BAEC). Sands are com-position of different sized particles. X-ray analysis can give better result if individual size of particle is used. Individual particle size was used in XRD analysis. In the Figures 16 to 21, graphs were plotted taking count vs. 2θ value. For understanding the effect of acid treatment W and AW sample data were plotted in same graph. The value of 2θ value of AW series is shifted 10° right to understand the effect of acid treatment. Per-cent of material content does not depend only on the peak counts but also the FWHM value (a term used in crystallography). From graph it is seen that for larger grain size peak counts of Q decrease after acid washing and for smaller grain size it increases for both sands. Peak counts of Fe for Sand I increases after acid wash-ing but it decreases for Sand II.
Figure 16. X-ray diffraction of Sand I on grain size retained on # 30 Figure 17. X-ray diffraction of Sand I on grain size retained on # 50
Figure 18. X-ray diffraction of Sand I on grain size retained on # 100 Figure 19. X-ray diffraction of Sand II on grain size retained on # 30
Figure 20. X-ray diffraction of Sand II on grain size retained on # 50 Figure 21. X-ray diffraction of Sand II on grain size retained on # 100
5.3 Strength comparison with Ottawa sand
Hydraulic cement mortar test was done in two different laboratories independently with various cements. First laboratory is concrete laboratory, Department of Civil Engineering, Bangladesh University of Engineering
16
and Technology (BUET), where almost all the tests were done and data from this lab is denoted by Lab1. In this lab Cement used for casting was taken from Bureau of Research and Testing Council (BRTC), test sam-ples and corresponding BRTC test result was used for the strength data of Ottawa sand. Sand I W and Sand II W were tested together along with Ottawa sand. Similarly Sand I AW and Sand II AW were tested together along with another batch of Ottawa sand. On the other hand few tests were done by Military Institute of Science and Technology (MIST) [Siddiquee et al (2010)] students in the concrete laboratory of MIST and da-ta from this laboratory is denoted by Lab2. In Lab2, cement used for both W and AW series are same.
6 DISCUSSION ON RESULTS
A number of tests were done previously such as grain size distribution, specific gravity and absorption capaci-ty, SEM, X-ray diffraction to explain the strength characteristics of locally available sand with respect to strength of Ottawa sand. In this section material characteristics of local sand as well as Ottawa sand is ana-lyzed first. Then the strength result analysis is done with the help of these material characteristics. At the same time effect of water washing and acid washing is discussed.
6.1 Comparison of physical properties
Ottawa sand is white variety, natural rounded deposit with pale gray/white/silver color. It may be spherical to semi-spherical. On the other hand Sand II has similar color. But Sand I is reddish in color due to the presence of iron and the reddish color is also remained after acid washing i.e. in Sand IAW.
Ottawa sand is spherical to semi-spherical on the other hand none of the local sand is not spherical rather than it is semi-spherical. All of these are slightly angular.
From Figure 8 through Figure 15 it is seen that most of hand washed samples (i.e. W series) are angular for all sizes for both Sand I and Sand II. But after acid washing the angularity is reduced at very small extent. From Figure 8 through Figure 15 it is also seen that, Sand II has less angularity compared to that of Sand I but more angularity than that of Ottawa sand.
6.2 Comparison of chemical properties
Chemical composition of graded sample for individual particle size was determined by X-ray analysis for lo-cal sands. This test was conducted in Atomic Energy Commission. Typical values were used for Ottawa sand. Graph of X-ray analysis was given in Figure 16 through Figure 21. The chemical composition of individual particle size that found from X-ray diffraction analysis is given in Table 5 and the overall composition of sample is in Table 6.
Table 5. Chemical composition of individual particle size of local sand
Sieve# %
Sand I W Sand I AW Sand II W Sand II AW30 50 100 30 50 100 30 50 100 30 50 100
Q 87.98 89.06 99.12 80.09 81.10 97.10 94.14 97.38 97.42 86.34 90.62 95.55 Fe 10.24 8.59 - 15.13 11.62 - 4.90 2.00 2.58 10.64 1.83 Al 1.78 2.34 0.88 4.78 - - 0.96 - - 3.02 3.76 0.42 NaNO3 - - - - 1.88 - - - - - - - Fe3Si - - - - 5.40 - - - - - 5.61 - FeNi -- - - - - 2.90 - - - - - - KCl - - - - - - - 0.62 - - - - Al2SiO5 - - - - - - - - - - - 2.20 Table 6. Overall Chemical composition of locally available sand
% constituent Sand I W Sand I AW Sand II W Sand II AWQ 91.4 84.94 96.87 91.17Fe 6.7 9.28 2.61 2.16Al 1.89 0.76 0.15 2.81NaNO3 - 1.11 - -Fe3Si - 3.19 - 3.31FeNi - 0.73 - -KCl - - 0.37 -Al2SiO5 - - - 0.55
For X-ray analysis particular size of samples were used. Then overall composition is determined by providing weightage value obtained from sieve analysis i.e. their % of presence. The sample that retained on sieve #30,
17
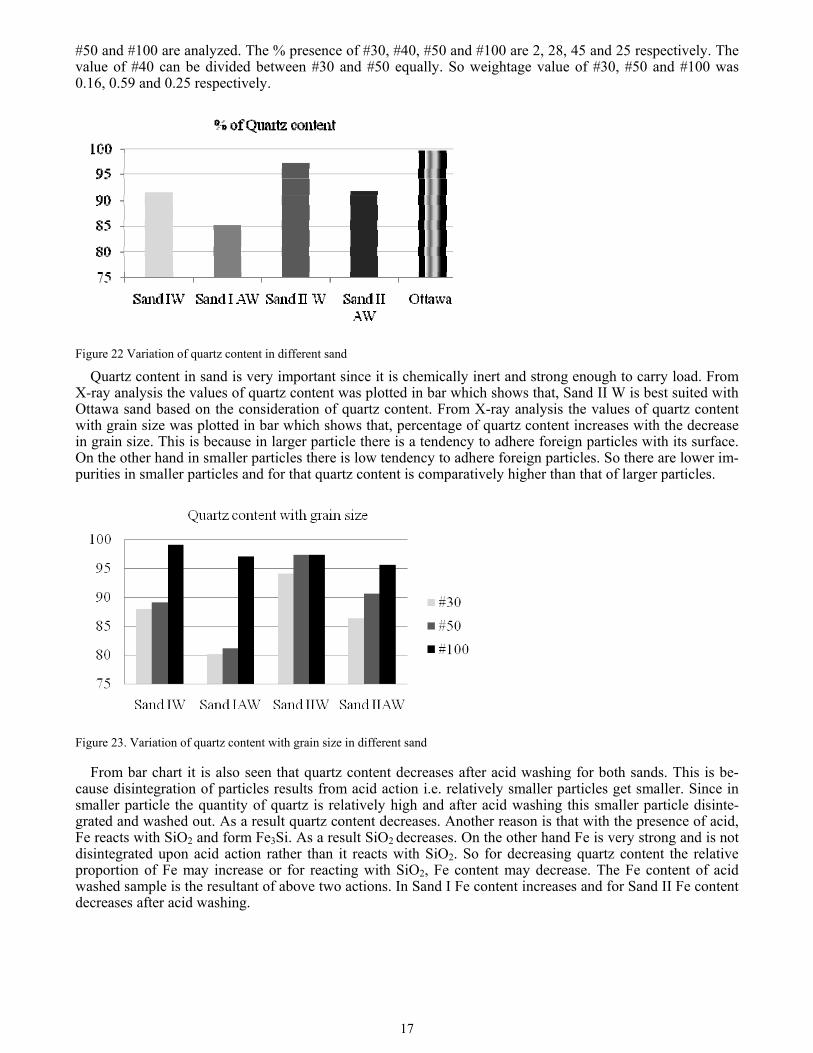
#50 and #100 are analyzed. The % presence of #30, #40, #50 and #100 are 2, 28, 45 and 25 respectively. The value of #40 can be divided between #30 and #50 equally. So weightage value of #30, #50 and #100 was 0.16, 0.59 and 0.25 respectively.
Figure 22 Variation of quartz content in different sand
Quartz content in sand is very important since it is chemically inert and strong enough to carry load. From X-ray analysis the values of quartz content was plotted in bar which shows that, Sand II W is best suited with Ottawa sand based on the consideration of quartz content. From X-ray analysis the values of quartz content with grain size was plotted in bar which shows that, percentage of quartz content increases with the decrease in grain size. This is because in larger particle there is a tendency to adhere foreign particles with its surface. On the other hand in smaller particles there is low tendency to adhere foreign particles. So there are lower im-purities in smaller particles and for that quartz content is comparatively higher than that of larger particles.
Figure 23. Variation of quartz content with grain size in different sand
From bar chart it is also seen that quartz content decreases after acid washing for both sands. This is be-cause disintegration of particles results from acid action i.e. relatively smaller particles get smaller. Since in smaller particle the quantity of quartz is relatively high and after acid washing this smaller particle disinte-grated and washed out. As a result quartz content decreases. Another reason is that with the presence of acid, Fe reacts with SiO2 and form Fe3Si. As a result SiO2 decreases. On the other hand Fe is very strong and is not disintegrated upon acid action rather than it reacts with SiO2. So for decreasing quartz content the relative proportion of Fe may increase or for reacting with SiO2, Fe content may decrease. The Fe content of acid washed sample is the resultant of above two actions. In Sand I Fe content increases and for Sand II Fe content decreases after acid washing.
18
6.3 Graph with correlation for strength
For correlation any order of polynomial may be used but in that case the significance of each coefficient must relate with the property of sand. In this work, contribution of adhered materials and angularity of sand grain were considered as the key property. Second order polynomials were used.
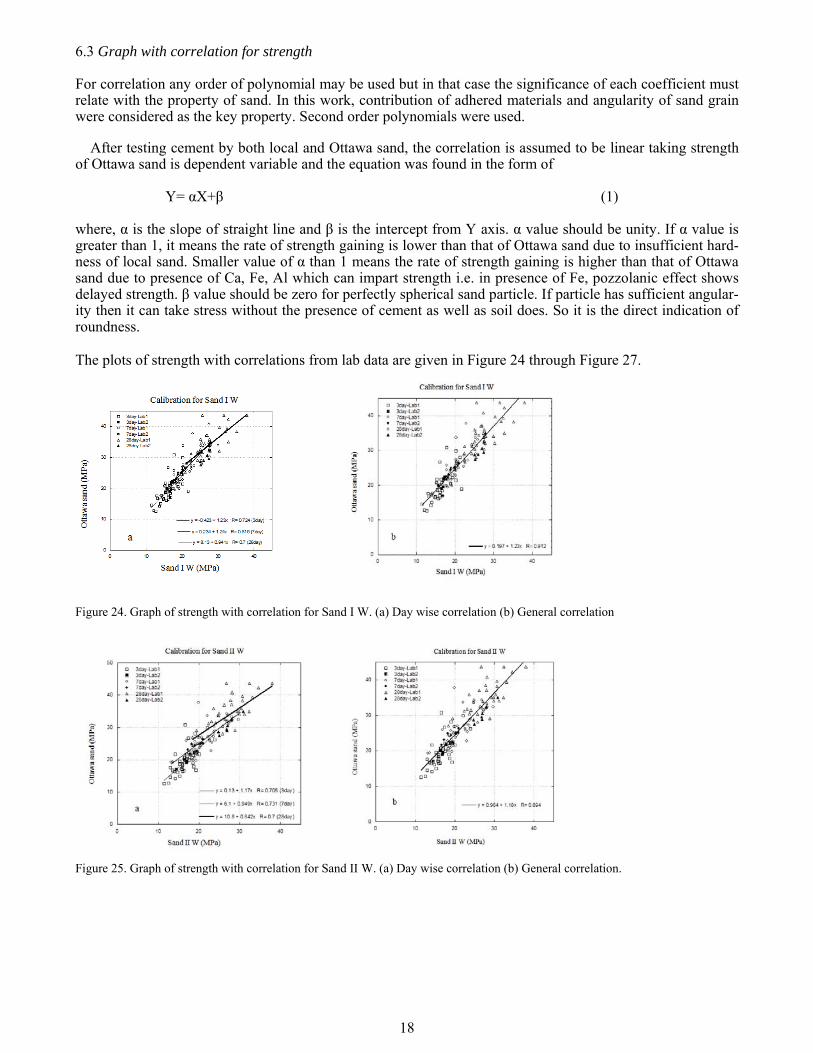
After testing cement by both local and Ottawa sand, the correlation is assumed to be linear taking strength of Ottawa sand is dependent variable and the equation was found in the form of
Y= αX+β (1)
where, α is the slope of straight line and β is the intercept from Y axis. α value should be unity. If α value is greater than 1, it means the rate of strength gaining is lower than that of Ottawa sand due to insufficient hard-ness of local sand. Smaller value of α than 1 means the rate of strength gaining is higher than that of Ottawa sand due to presence of Ca, Fe, Al which can impart strength i.e. in presence of Fe, pozzolanic effect shows delayed strength. β value should be zero for perfectly spherical sand particle. If particle has sufficient angular-ity then it can take stress without the presence of cement as well as soil does. So it is the direct indication of roundness. The plots of strength with correlations from lab data are given in Figure 24 through Figure 27.
Figure 24. Graph of strength with correlation for Sand I W. (a) Day wise correlation (b) General correlation
Figure 25. Graph of strength with correlation for Sand II W. (a) Day wise correlation (b) General correlation.
19
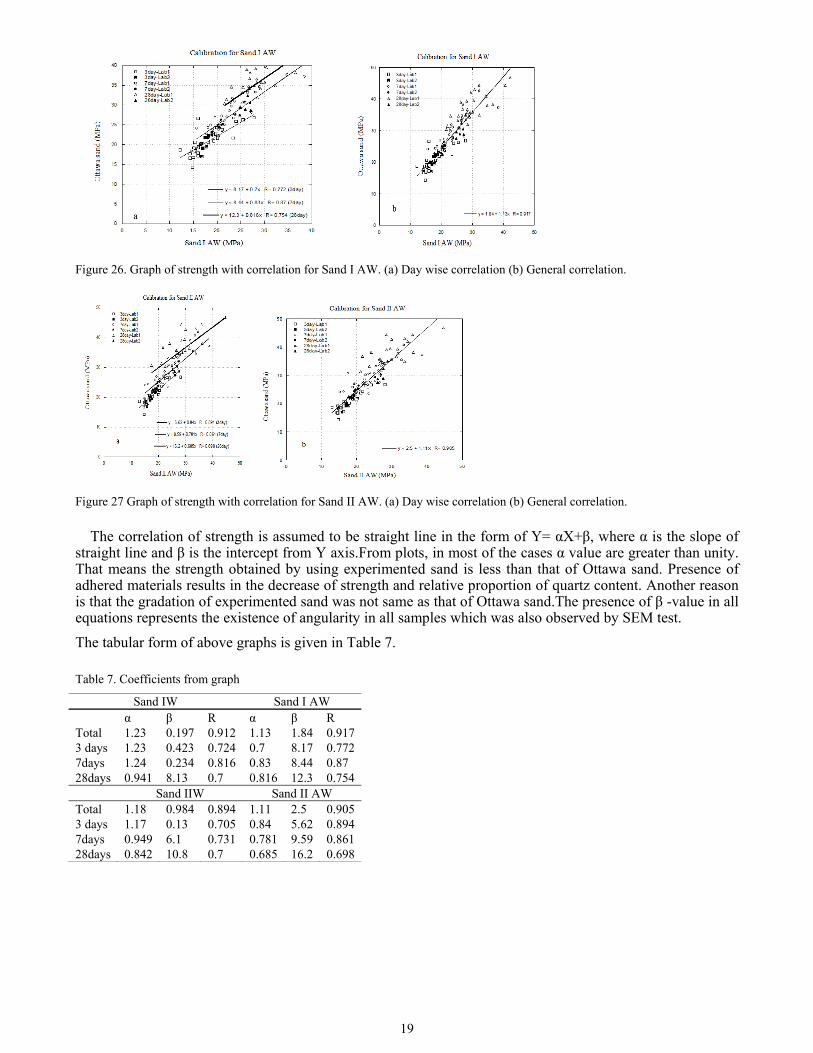
Figure 26. Graph of strength with correlation for Sand I AW. (a) Day wise correlation (b) General correlation.
Figure 27 Graph of strength with correlation for Sand II AW. (a) Day wise correlation (b) General correlation.
The correlation of strength is assumed to be straight line in the form of Y= αX+β, where α is the slope of straight line and β is the intercept from Y axis.From plots, in most of the cases α value are greater than unity. That means the strength obtained by using experimented sand is less than that of Ottawa sand. Presence of adhered materials results in the decrease of strength and relative proportion of quartz content. Another reason is that the gradation of experimented sand was not same as that of Ottawa sand.The presence of β -value in all equations represents the existence of angularity in all samples which was also observed by SEM test.
The tabular form of above graphs is given in Table 7.
Table 7. Coefficients from graph
Sand IW Sand I AW α β R α β R Total 1.23 0.197 0.912 1.13 1.84 0.917 3 days 1.23 0.423 0.724 0.7 8.17 0.772 7days 1.24 0.234 0.816 0.83 8.44 0.87 28days 0.941 8.13 0.7 0.816 12.3 0.754 Sand IIW Sand II AW Total 1.18 0.984 0.894 1.11 2.5 0.905 3 days 1.17 0.13 0.705 0.84 5.62 0.894 7days 0.949 6.1 0.731 0.781 9.59 0.861 28days 0.842 10.8 0.7 0.685 16.2 0.698
20
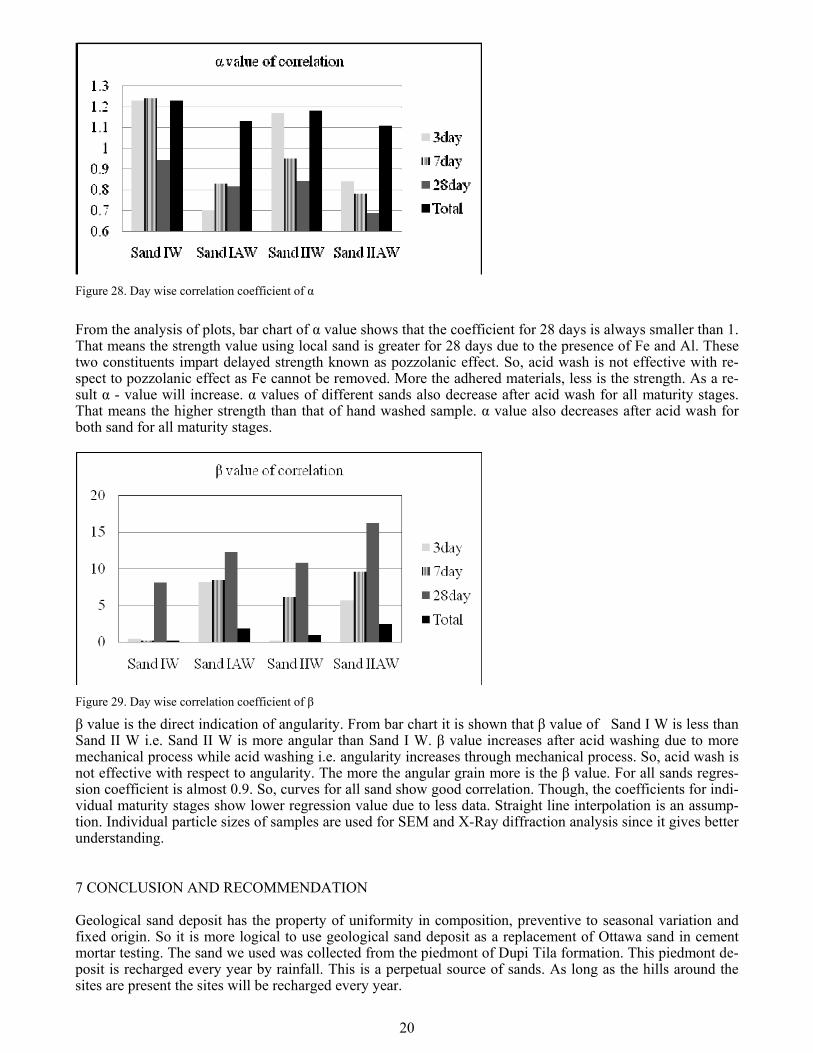
Figure 28. Day wise correlation coefficient of α
From the analysis of plots, bar chart of α value shows that the coefficient for 28 days is always smaller than 1. That means the strength value using local sand is greater for 28 days due to the presence of Fe and Al. These two constituents impart delayed strength known as pozzolanic effect. So, acid wash is not effective with re-spect to pozzolanic effect as Fe cannot be removed. More the adhered materials, less is the strength. As a re-sult α - value will increase. α values of different sands also decrease after acid wash for all maturity stages. That means the higher strength than that of hand washed sample. α value also decreases after acid wash for both sand for all maturity stages.
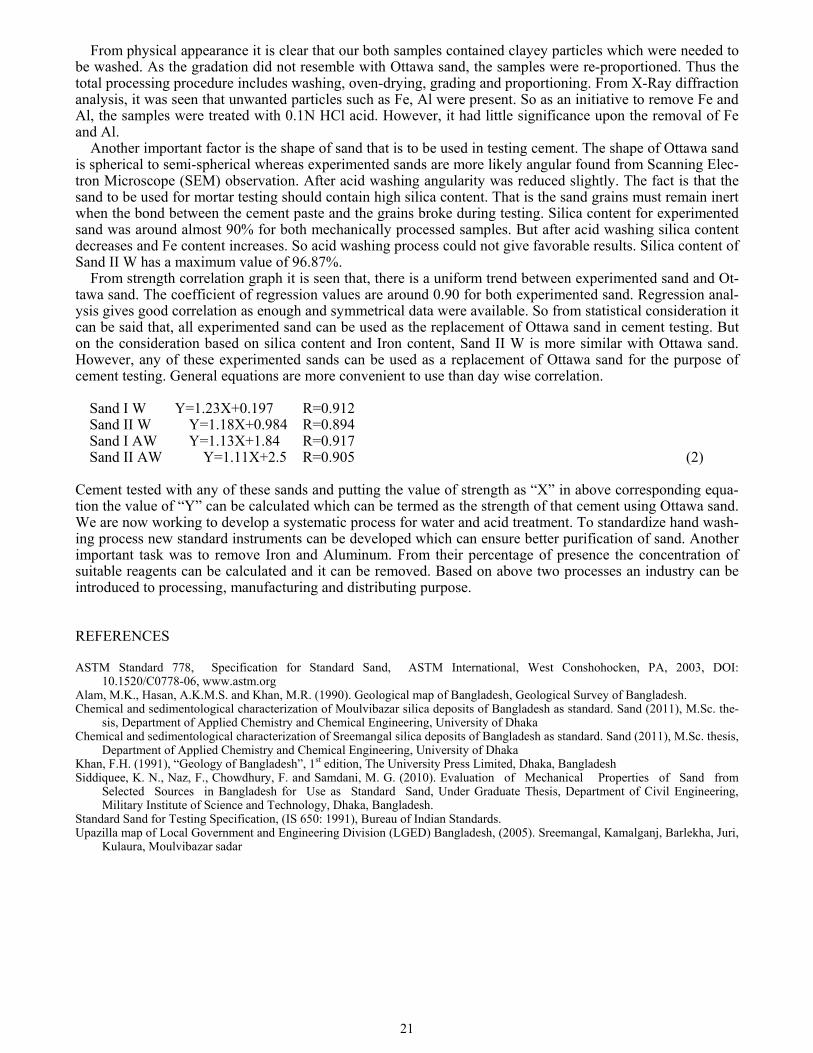
Figure 29. Day wise correlation coefficient of β
β value is the direct indication of angularity. From bar chart it is shown that β value of Sand I W is less than Sand II W i.e. Sand II W is more angular than Sand I W. β value increases after acid washing due to more mechanical process while acid washing i.e. angularity increases through mechanical process. So, acid wash is not effective with respect to angularity. The more the angular grain more is the β value. For all sands regres-sion coefficient is almost 0.9. So, curves for all sand show good correlation. Though, the coefficients for indi-vidual maturity stages show lower regression value due to less data. Straight line interpolation is an assump-tion. Individual particle sizes of samples are used for SEM and X-Ray diffraction analysis since it gives better understanding.
7 CONCLUSION AND RECOMMENDATION
Geological sand deposit has the property of uniformity in composition, preventive to seasonal variation and fixed origin. So it is more logical to use geological sand deposit as a replacement of Ottawa sand in cement mortar testing. The sand we used was collected from the piedmont of Dupi Tila formation. This piedmont de-posit is recharged every year by rainfall. This is a perpetual source of sands. As long as the hills around the sites are present the sites will be recharged every year.
21
From physical appearance it is clear that our both samples contained clayey particles which were needed to be washed. As the gradation did not resemble with Ottawa sand, the samples were re-proportioned. Thus the total processing procedure includes washing, oven-drying, grading and proportioning. From X-Ray diffraction analysis, it was seen that unwanted particles such as Fe, Al were present. So as an initiative to remove Fe and Al, the samples were treated with 0.1N HCl acid. However, it had little significance upon the removal of Fe and Al.
Another important factor is the shape of sand that is to be used in testing cement. The shape of Ottawa sand is spherical to semi-spherical whereas experimented sands are more likely angular found from Scanning Elec-tron Microscope (SEM) observation. After acid washing angularity was reduced slightly. The fact is that the sand to be used for mortar testing should contain high silica content. That is the sand grains must remain inert when the bond between the cement paste and the grains broke during testing. Silica content for experimented sand was around almost 90% for both mechanically processed samples. But after acid washing silica content decreases and Fe content increases. So acid washing process could not give favorable results. Silica content of Sand II W has a maximum value of 96.87%.
From strength correlation graph it is seen that, there is a uniform trend between experimented sand and Ot-tawa sand. The coefficient of regression values are around 0.90 for both experimented sand. Regression anal-ysis gives good correlation as enough and symmetrical data were available. So from statistical consideration it can be said that, all experimented sand can be used as the replacement of Ottawa sand in cement testing. But on the consideration based on silica content and Iron content, Sand II W is more similar with Ottawa sand. However, any of these experimented sands can be used as a replacement of Ottawa sand for the purpose of cement testing. General equations are more convenient to use than day wise correlation.
Sand I W Y=1.23X+0.197 R=0.912 Sand II W Y=1.18X+0.984 R=0.894 Sand I AW Y=1.13X+1.84 R=0.917 Sand II AW Y=1.11X+2.5 R=0.905 (2) Cement tested with any of these sands and putting the value of strength as “X” in above corresponding equa-tion the value of “Y” can be calculated which can be termed as the strength of that cement using Ottawa sand. We are now working to develop a systematic process for water and acid treatment. To standardize hand wash-ing process new standard instruments can be developed which can ensure better purification of sand. Another important task was to remove Iron and Aluminum. From their percentage of presence the concentration of suitable reagents can be calculated and it can be removed. Based on above two processes an industry can be introduced to processing, manufacturing and distributing purpose.
REFERENCES
ASTM Standard 778, Specification for Standard Sand, ASTM International, West Conshohocken, PA, 2003, DOI: 10.1520/C0778-06, www.astm.org
Alam, M.K., Hasan, A.K.M.S. and Khan, M.R. (1990). Geological map of Bangladesh, Geological Survey of Bangladesh. Chemical and sedimentological characterization of Moulvibazar silica deposits of Bangladesh as standard. Sand (2011), M.Sc. the-
sis, Department of Applied Chemistry and Chemical Engineering, University of Dhaka Chemical and sedimentological characterization of Sreemangal silica deposits of Bangladesh as standard. Sand (2011), M.Sc. thesis,
Department of Applied Chemistry and Chemical Engineering, University of Dhaka Khan, F.H. (1991), “Geology of Bangladesh”, 1st edition, The University Press Limited, Dhaka, Bangladesh Siddiquee, K. N., Naz, F., Chowdhury, F. and Samdani, M. G. (2010). Evaluation of Mechanical Properties of Sand from
Selected Sources in Bangladesh for Use as Standard Sand, Under Graduate Thesis, Department of Civil Engineering, Military Institute of Science and Technology, Dhaka, Bangladesh.
Standard Sand for Testing Specification, (IS 650: 1991), Bureau of Indian Standards. Upazilla map of Local Government and Engineering Division (LGED) Bangladesh, (2005). Sreemangal, Kamalganj, Barlekha, Juri,
Kulaura, Moulvibazar sadar