Embed Size (px)
Citation preview
Use of remote sensing in monitoring algal blooms in
inland water bodies
Anabel A. Lamaro
[email protected]@fcnym.unlp.edu
.ar
Fortaleza 1- 12 November 2010
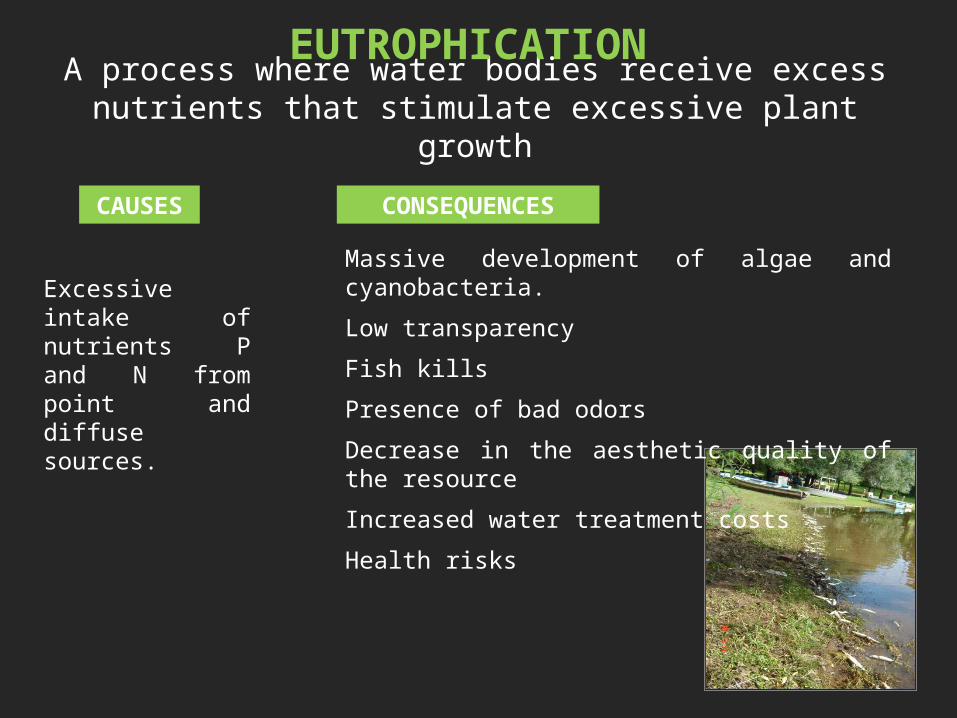
A process where water bodies receive excess nutrients that stimulate excessive plant growth
EUTROPHICATION
CONSEQUENCESCAUSES
Excessive intake of nutrients P and N from point and diffuse sources.
Massive development of algae and cyanobacteria.
Low transparency
Fish kills
Presence of bad odors
Decrease in the aesthetic quality of the resource
Increased water treatment costs
Health risks
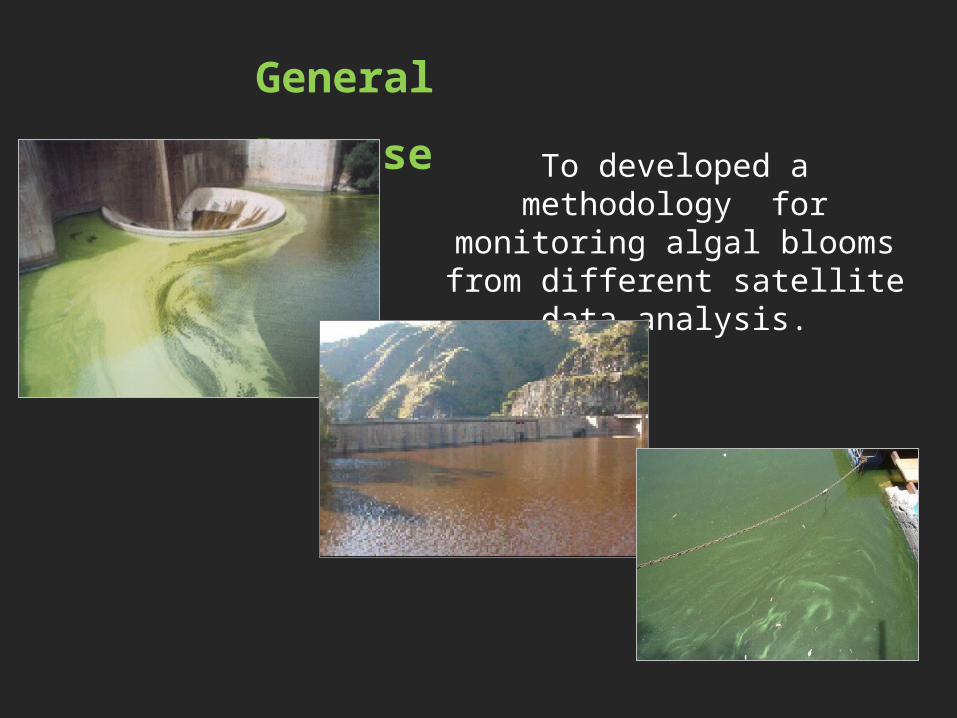
General
PurposeTo developed a methodology for monitoring algal blooms from different satellite data
analysis.
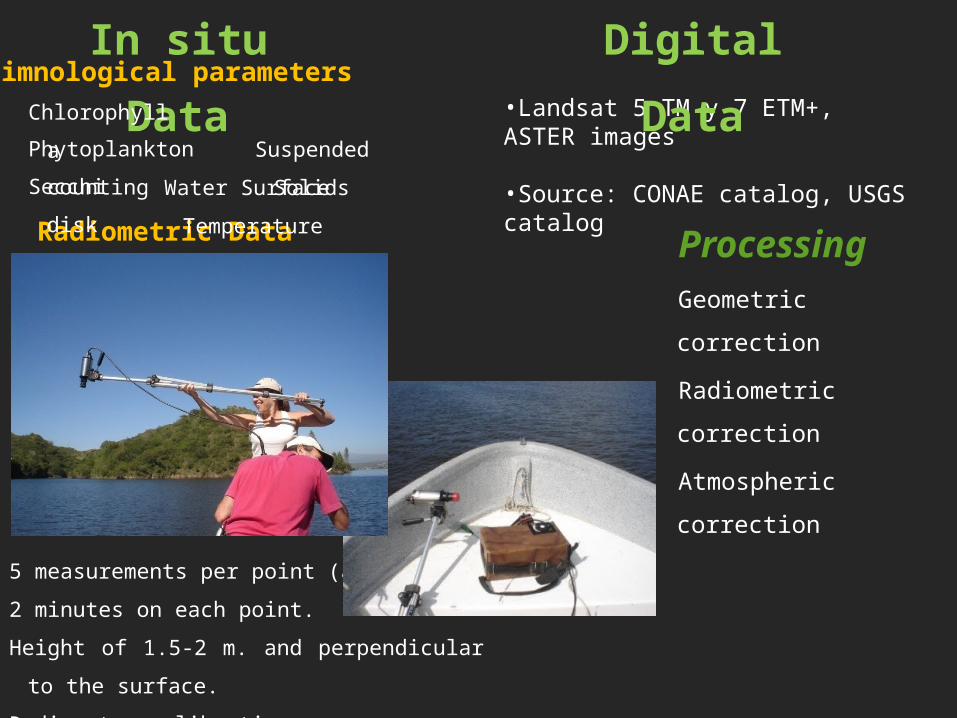
In situ
Data
Radiometric Data
5 measurements per point (average).
2 minutes on each point.
Height of 1.5-2 m. and perpendicular to the
surface.
Radiometer calibration.
Suspended
SolidsSecchi disk Water Surface
Temperature
Limnological parametersChlorophyll a
Phytoplankton
counting
•Landsat 5 TM y 7 ETM+, ASTER images
•Source: CONAE catalog, USGS catalog
Processing Geometric correction
Radiometric
correction
Atmospheric
correction
Digital
Data
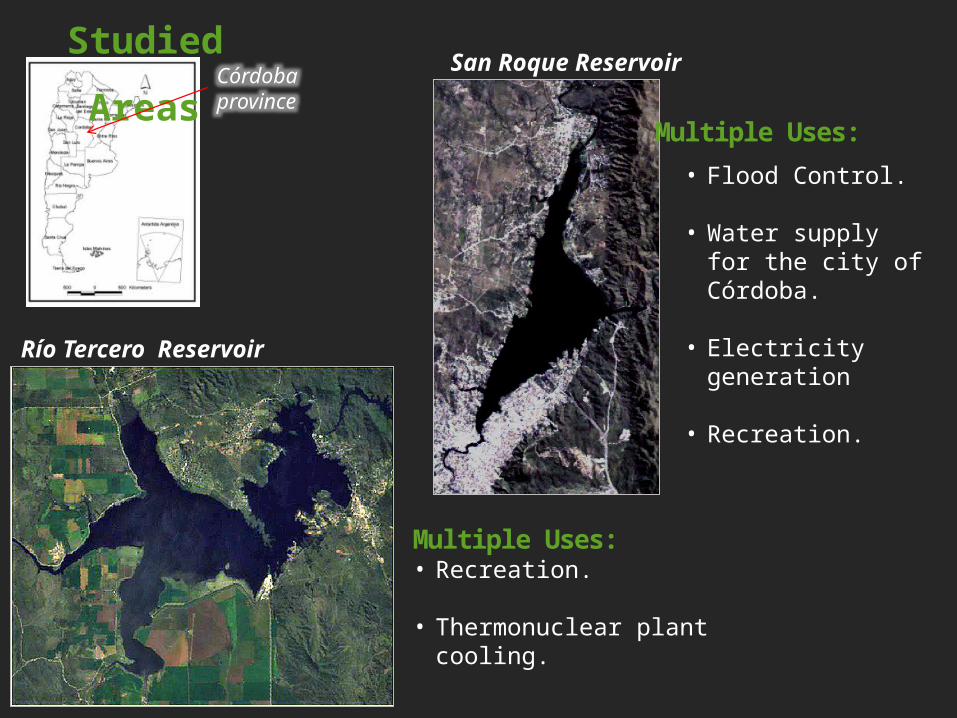
Río Tercero Reservoir
Studied
AreasCórdoba province
Multiple Uses: • Recreation.
• Thermonuclear plant cooling.
San Roque Reservoir
• Flood Control.
• Water supply for the city of Córdoba.
• Electricity generation
• Recreation.
Multiple Uses:
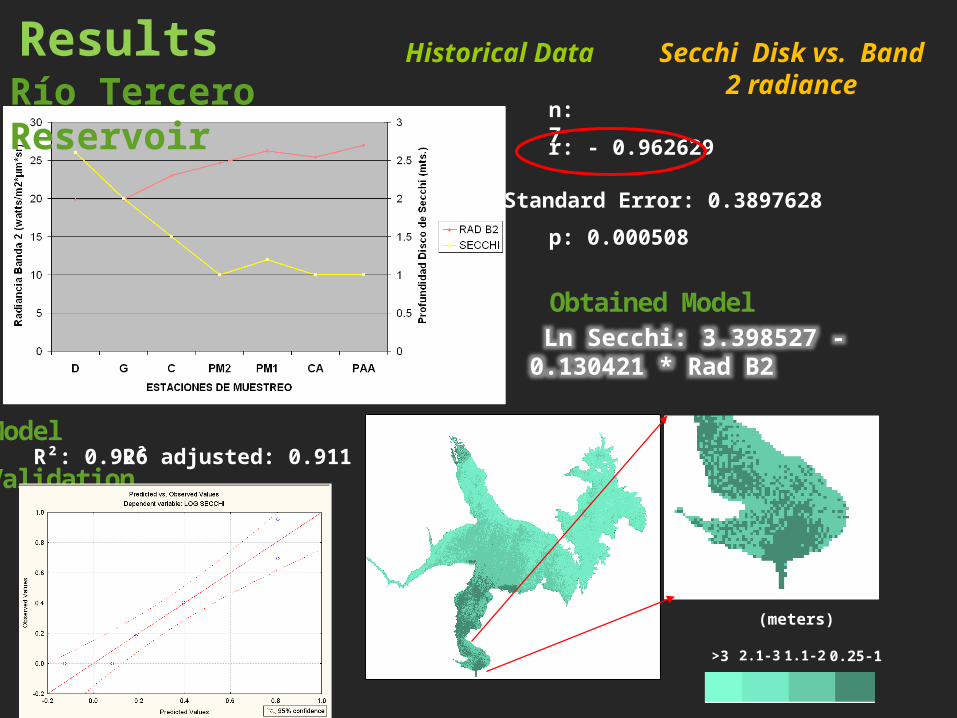
Ln Secchi: 3.398527 - 0.130421 * Rad B2Obtained Model
r: - 0.962629
p: 0.000508
Standard Error: 0.3897628
n: 7
Secchi Disk vs. Band 2 radiance
R²: 0.926Model
ValidationR² adjusted: 0.911
(meters)
0.25-11.1-22.1-3>3
Río Tercero Reservoir
Historical Data
Results
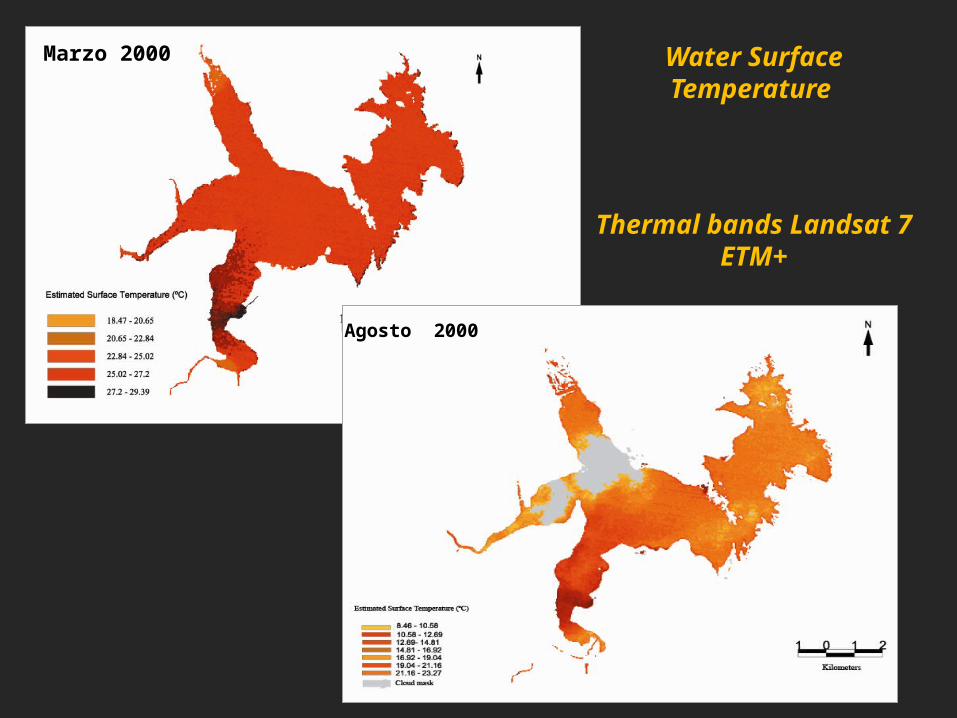
Water Surface Temperature
Thermal bands Landsat 7 ETM+
Marzo 2000
Agosto 2000
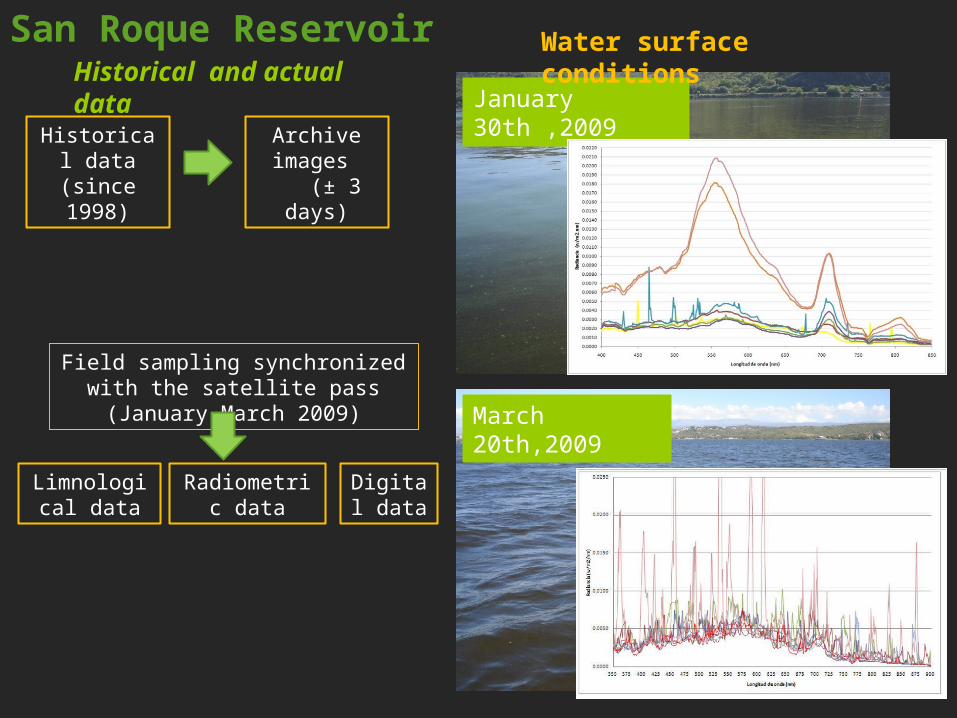
Archive images (± 3 days)
Radiometric data
Digital data
Limnological data
Historical data (since
1998)
Historical and actual data
San Roque Reservoir
Field sampling synchronized with the satellite pass (January-
March 2009)
January 30th ,2009
March 20th,2009
Water surface conditions
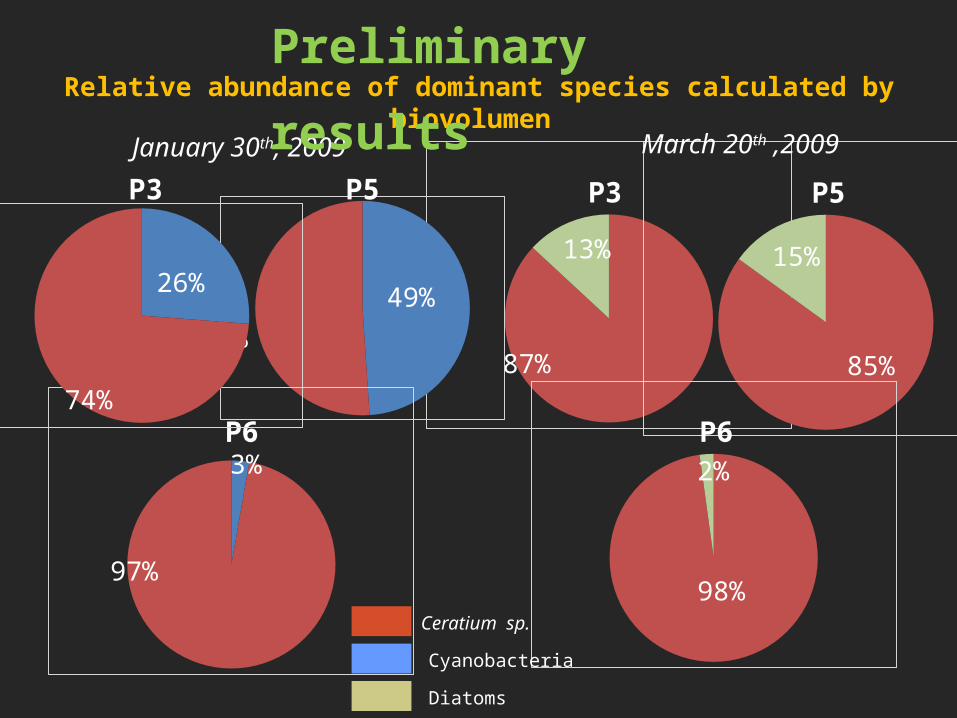
P3 P5
P6
March 20th ,2009
98%
87% 85%
13%
15%
2%
January 30th, 2009
P6
3%
97%
49%
51%
P3
74%
26%
P5
Ceratium sp.
Cyanobacteria
Diatoms
Relative abundance of dominant species calculated by biovolumen
Preliminary
results
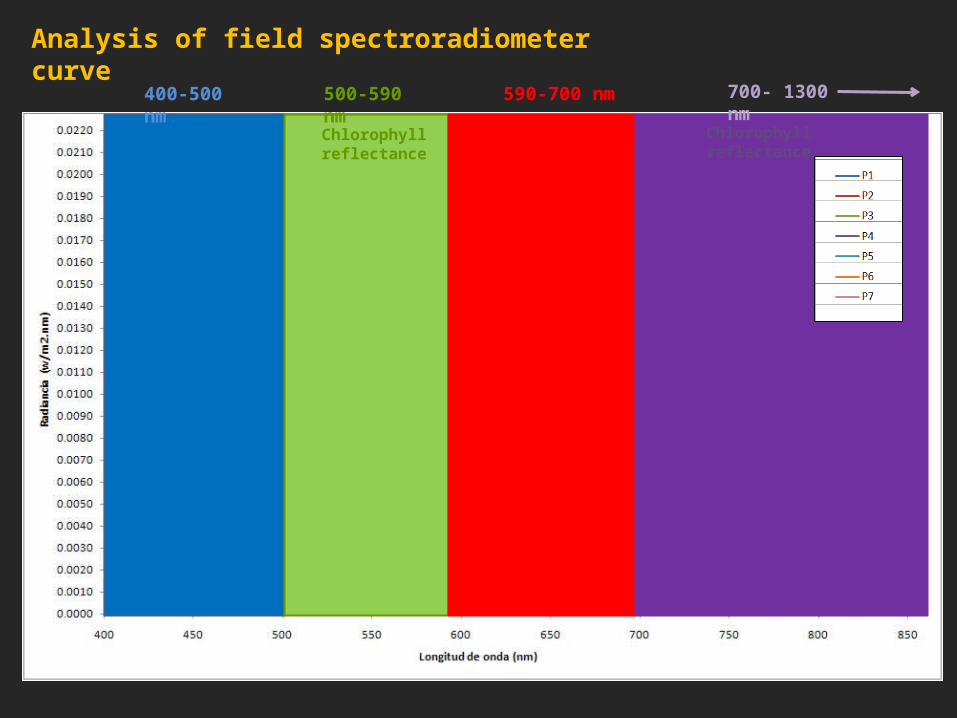
400-500 nm
500-590 nm
590-700 nm
700- 1300 nm
Analysis of field spectroradiometer curve
Chlorophyll reflectance
Chlorophyll absortion
Chlorophyll reflectance
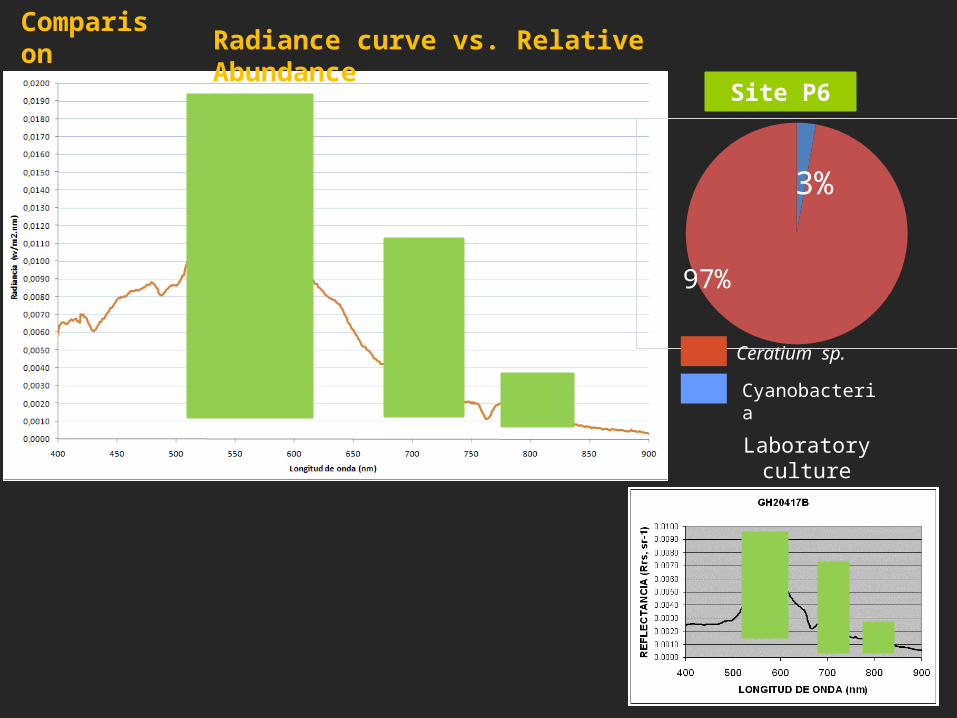
3%
97%
Site P6
Ceratium sp.
Cyanobacteria
Comparison Radiance curve vs. Relative
Abundance
Laboratory culture
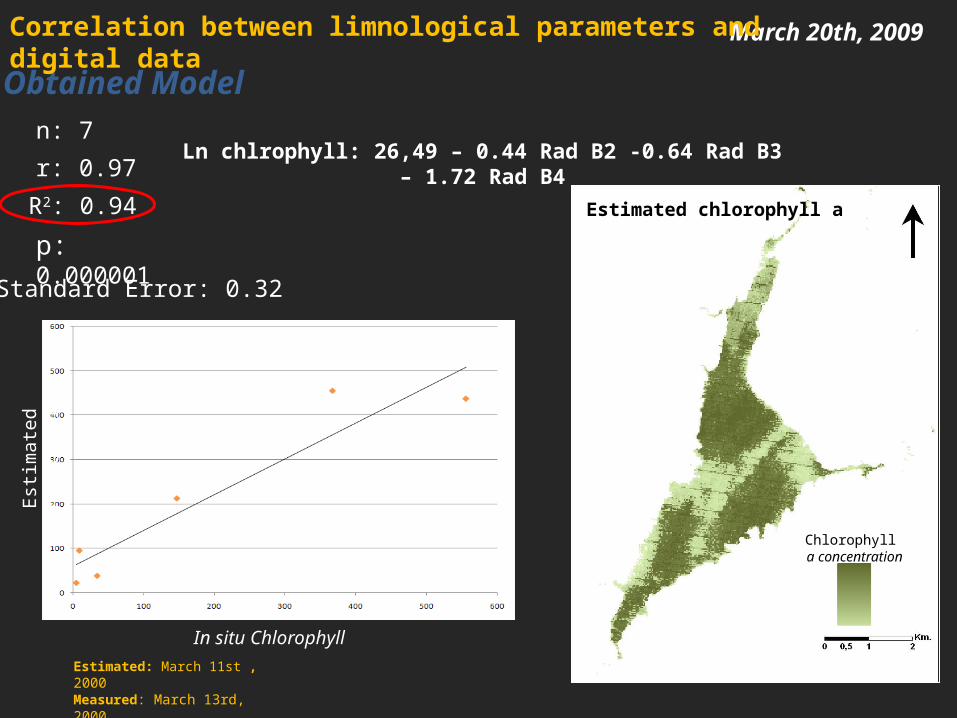
March 20th, 2009
Obtained Model
r: 0.97
p: 0.000001Standard Error: 0.32
n: 7
R2: 0.94
Ln chlrophyll: 26,49 – 0.44 Rad B2 -0.64 Rad B3 – 1.72 Rad B4
In situ Chlorophyll
Est
imate
d
Chlo
rop
hyll
Estimated: March 11st , 2000Measured: March 13rd, 2000
Correlation between limnological parameters and digital data
Estimated chlorophyll a
400
50
225
Chlorophyll a concentration
• We are working with water treatment company for the future application of these methodologies in the Rio de la Plata estuary.• Oil spill monitoring in ocean water, near offshore platforms using RADAR images.
To incorporate products of sea surface temperature, ocean color and others (from AVHRR, SeaWifs, Modis, Meris) to help to identify:
Marine currentsThermal fronts Turbidity Phytoplankton (blooms or HAB’s)Sources of pollution
IN A NEAR FUTUREFor Fisheries Research and
Development…
ACTUAL WORKS
• Water Quality Monitoring in Sectors of Uruguay River and in inland water bodies (i.e Ramsar sites, reserves, protected areas).
Thank you!