Embed Size (px)
Citation preview
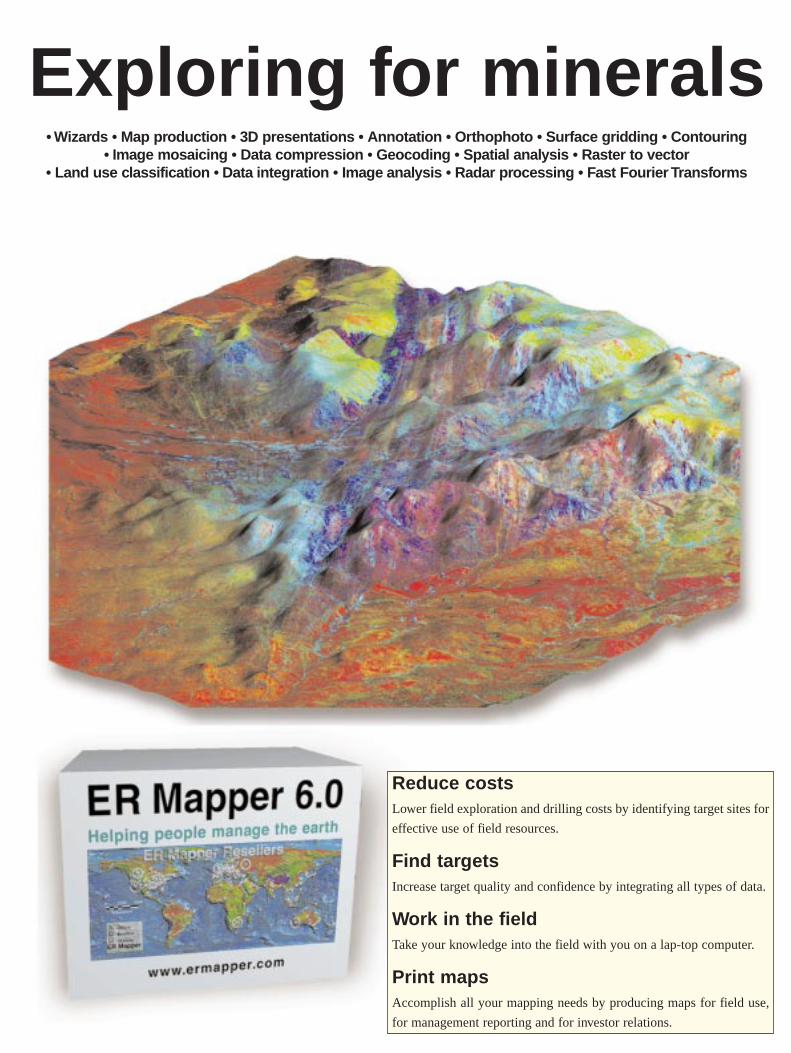
Exploring for minerals• Wizards • Map production • 3D presentations • Annotation • Orthophoto • Surface gridding • Contouring
• Image mosaicing • Data compression • Geocoding • Spatial analysis • Raster to vector • Land use classification • Data integration • Image analysis • Radar processing • Fast Fourier Transforms
Reduce costsLower field exploration and drilling costs by identifying target sites for
effective use of field resources.
Find targetsIncrease target quality and confidence by integrating all types of data.
Work in the fieldTake your knowledge into the field with you on a lap-top computer.
Print mapsAccomplish all your mapping needs by producing maps for field use,
for management reporting and for investor relations.
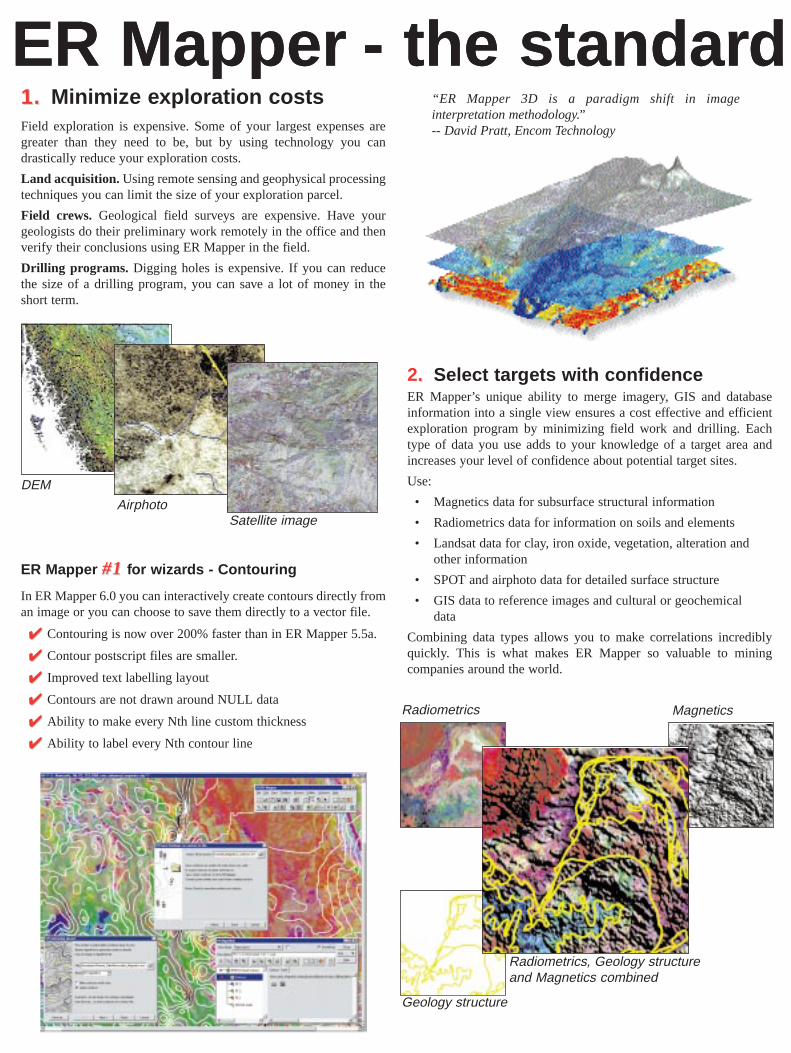
ER Mapper - the standard ER Mapper - the standard “ER Mapper 3D is a paradigm shift in imageinterpretation methodology.”-- David Pratt, Encom Technology
DEM
AirphotoSatellite image
Radiometrics
Geology structure
Magnetics
Radiometrics, Geology structureand Magnetics combined
2.. Select targets with confidenceER Mapper’s unique ability to merge imagery, GIS and databaseinformation into a single view ensures a cost effective and efficientexploration program by minimizing field work and drilling. Eachtype of data you use adds to your knowledge of a target area andincreases your level of confidence about potential target sites.
Use:
• Magnetics data for subsurface structural information
• Radiometrics data for information on soils and elements
• Landsat data for clay, iron oxide, vegetation, alteration andother information
• SPOT and airphoto data for detailed surface structure
• GIS data to reference images and cultural or geochemicaldata
Combining data types allows you to make correlations incrediblyquickly. This is what makes ER Mapper so valuable to miningcompanies around the world.
1.1. Minimize exploration costsField exploration is expensive. Some of your largest expenses aregreater than they need to be, but by using technology you candrastically reduce your exploration costs.
Land acquisition. Using remote sensing and geophysical processingtechniques you can limit the size of your exploration parcel.
Field crews. Geological field surveys are expensive. Have yourgeologists do their preliminary work remotely in the office and thenverify their conclusions using ER Mapper in the field.
Drilling programs. Digging holes is expensive. If you can reducethe size of a drilling program, you can save a lot of money in theshort term.
ER Mapper #1#1 for wizards - Contouring
In ER Mapper 6.0 you can interactively create contours directly froman image or you can choose to save them directly to a vector file.
✔✔✔✔ Contouring is now over 200% faster than in ER Mapper 5.5a.
✔✔✔✔ Contour postscript files are smaller.
✔✔✔✔ Improved text labelling layout
✔✔✔✔ Contours are not drawn around NULL data
✔✔✔✔ Ability to make every Nth line custom thickness
✔✔✔✔ Ability to label every Nth contour line
for mineral explorationfor mineral exploration
4. Quality maps and presentationsWith ER Mapper’s easy to use map creation system you can createsuperb maps on demand.
Field maps. Create maps integrating all your exploration data, togive your geologists up-to-date information. Include GIS data, aswell as imagery.
Maps for investors to see. Professional presentations can make allthe difference to a business decision. Print vivid maps for investorand prospectus reports, showing exploration leases, and target areas,prospect potential, and exploration progress.
5.5. Try for yourselfEvaluate ER Mapper with the free CD-ROM which contains:
• The complete ER Mapper software
• Online manuals
• 14 day evaluation licence
• Over 500Mb of sample data
The world’s most well known geological and geophysicalorganizations use ER Mapper, including:
Aberfoyle, AGSO, Anglo-American, Barrick, BHP, CRA/RTZ,DeBeers, Geological Survey of Canada, GSV, Finnish GeologicalSurvey, Homestake, INCO, Kidston Gold Mines, MIM, Newmont,Placer Dome, USGS, Western Mining Corporation, West AustralianMines Dept...
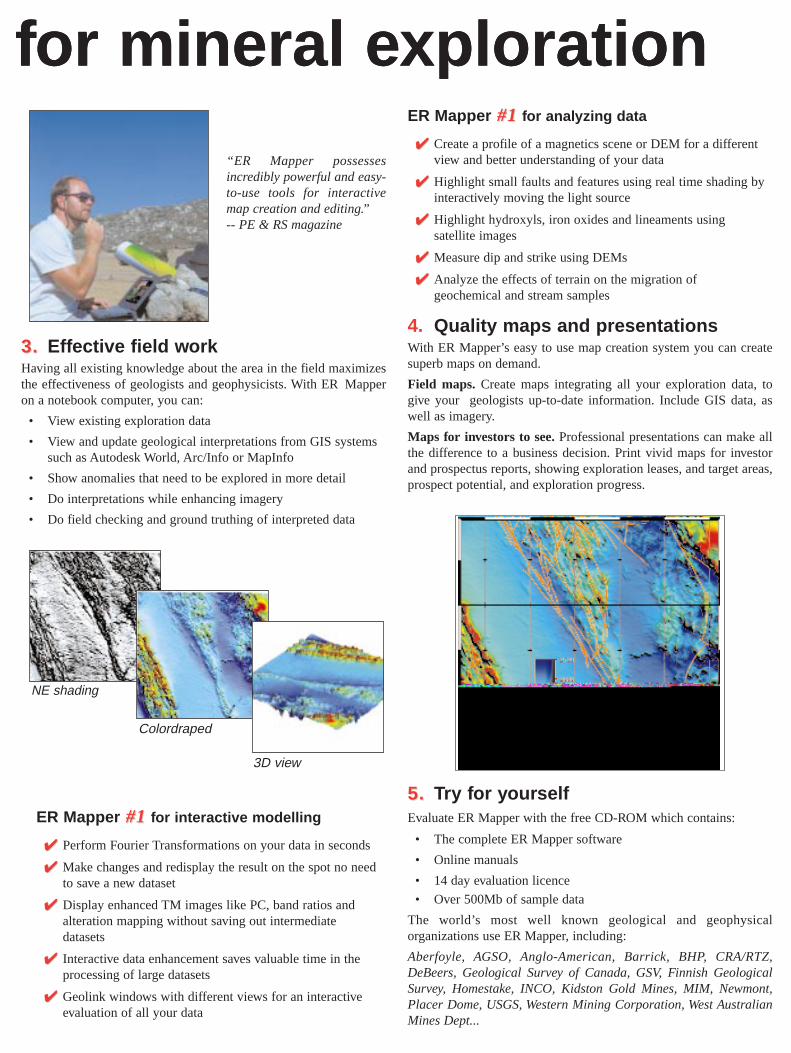
NE shading
Colordraped
3D view
“ER Mapper possessesincredibly powerful and easy-to-use tools for interactivemap creation and editing.”-- PE & RS magazine
ER Mapper #1#1 for analyzing data
✔✔✔✔ Create a profile of a magnetics scene or DEM for a differentview and better understanding of your data
✔✔✔✔ Highlight small faults and features using real time shading byinteractively moving the light source
✔✔✔✔ Highlight hydroxyls, iron oxides and lineaments usingsatellite images
✔✔✔✔ Measure dip and strike using DEMs
✔✔✔✔ Analyze the effects of terrain on the migration ofgeochemical and stream samples
ER Mapper #1#1 for interactive modelling
✔✔✔✔ Perform Fourier Transformations on your data in seconds
✔✔✔✔ Make changes and redisplay the result on the spot no needto save a new dataset
✔✔✔✔ Display enhanced TM images like PC, band ratios andalteration mapping without saving out intermediatedatasets
✔✔✔✔ Interactive data enhancement saves valuable time in theprocessing of large datasets
✔✔✔✔ Geolink windows with different views for an interactiveevaluation of all your data
3.3. Effective field workHaving all existing knowledge about the area in the field maximizesthe effectiveness of geologists and geophysicists. With ER Mapperon a notebook computer, you can:
• View existing exploration data
• View and update geological interpretations from GIS systemssuch as Autodesk World, Arc/Info or MapInfo
• Show anomalies that need to be explored in more detail
• Do interpretations while enhancing imagery
• Do field checking and ground truthing of interpreted data
Application by David Pratt & David Farquhar-Smith,Encom Technology Pty Ltd, AustraliaEncom Technology routinely usesER Mapper for its international mineraland petroleum exploration projects. Its3D capabilities have greatly improvedour ability to understand datasets inareas of significant topographic relief. Arecent project for base metal explorationin Northern Africa integrated LandsatTM and SPOT satellite data withaeromagnetic and electromagneticgeophysical survey images.
With the terrain relief of some 3000metres, the project area presented somespecial problems. The Landsat data wasacquired at 6:48 a.m., and as a resultmuch of the scene has extensiveshadows cast from the high mountainterrain. This is excellent for mappingstructures with surface expression, butthe shadows dominate any contrasts thatcould be associated with changes in rocktype or alteration associated withmineralisation events.
Evidence of the terrain shadows is easilyseen in the RGB (741) image.
Minimisation of the shadow effect canbe achieved by ratioing different imagebands on the assumption that eachwavelength band is equally affected inthe shadow zone. This assumes that thediffuse reflection characteristics of theground surface is similar on theilluminated and shadow side of theterrain. Atmospheric back scatter mustalso be removed from the TM channelsprior to ratioing.
Case study — 3D mineral exploration
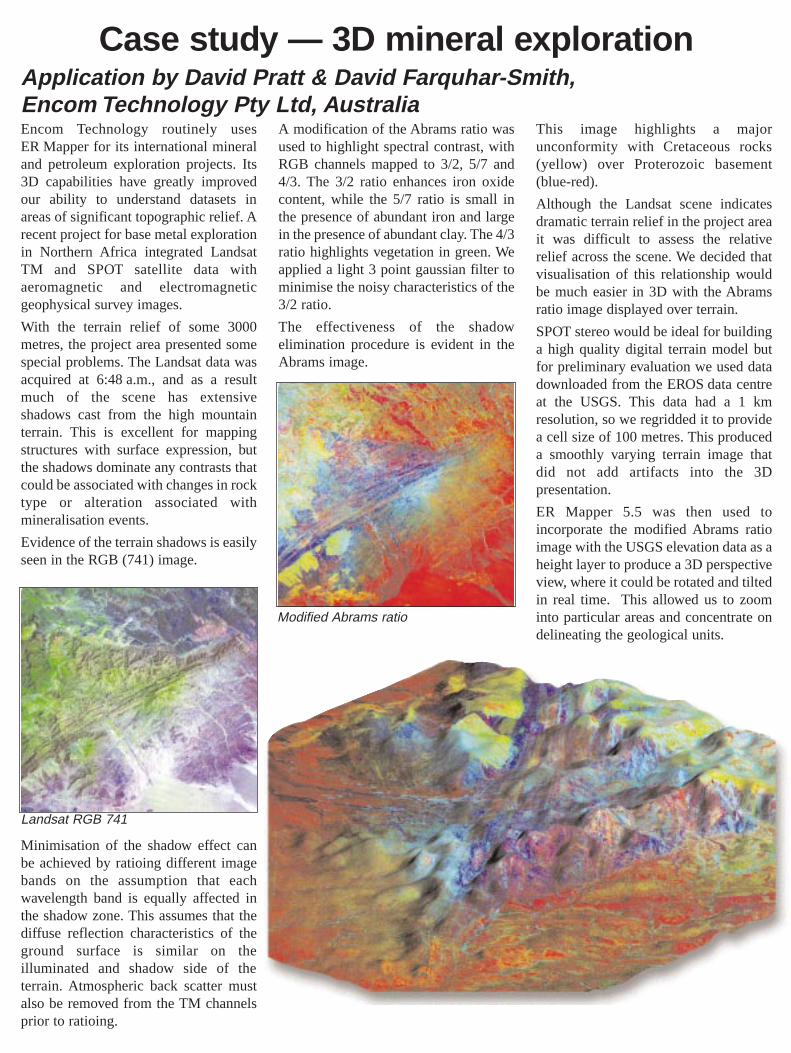
A modification of the Abrams ratio wasused to highlight spectral contrast, withRGB channels mapped to 3/2, 5/7 and4/3. The 3/2 ratio enhances iron oxidecontent, while the 5/7 ratio is small inthe presence of abundant iron and largein the presence of abundant clay. The 4/3ratio highlights vegetation in green. Weapplied a light 3 point gaussian filter tominimise the noisy characteristics of the3/2 ratio.
The effectiveness of the shadowelimination procedure is evident in theAbrams image.
Landsat RGB 741
This image highlights a majorunconformity with Cretaceous rocks(yellow) over Proterozoic basement(blue-red).
Although the Landsat scene indicatesdramatic terrain relief in the project areait was difficult to assess the relativerelief across the scene. We decided thatvisualisation of this relationship wouldbe much easier in 3D with the Abramsratio image displayed over terrain.
SPOT stereo would be ideal for buildinga high quality digital terrain model butfor preliminary evaluation we used datadownloaded from the EROS data centreat the USGS. This data had a 1 kmresolution, so we regridded it to providea cell size of 100 metres. This produceda smoothly varying terrain image thatdid not add artifacts into the 3Dpresentation.
ER Mapper 5.5 was then used toincorporate the modified Abrams ratioimage with the USGS elevation data as aheight layer to produce a 3D perspectiveview, where it could be rotated and tiltedin real time. This allowed us to zoominto particular areas and concentrate ondelineating the geological units.
Modified Abrams ratio
Advantages of ER Mapper:✔✔ Ability to enhance magnetic images (by manipulating
histogram displays, sun-shading, and specialisedmathematical transforms) to bring out subtle features.
✔✔ Ability to integrate different datasets on a single imagee.g. shaded magnetics overlain by radiometrics, shadedmagnetics overlain by Landsat TM, to see relationshipsbetween different datasets and provide an integratedinterpretation of the geology e.g. The Landsat image(Figures 4, 5) provides a good indication of the granitoid-greenstone contact to the east in areas where it is poorlydefined on the magnetics.
✔✔ Ability to enhance Landsat TM data using band ratioing(formulas).
✔✔ Ability to display multiple datasets simultaneously andvisualise the same area for all windows using the geolinktool.
✔✔ Ability to rectify scanned aerial photos using the SPOTimage as a reference.
✔✔ Ability to add vector annotation to an image eg. Magneticinterpretation over Landsat TM image (Figure 6).
System:ER Mapper version 5.5 on a Digital Celebris XL with
dual Pentium 166 MHz processors and 64 Mb RAM, runningWindows NT 3.51.
Landsat TM Data - The Landsat data bands can be ratioed
using ER Mapper to enhance the regolith response (TM bands 5/7,4/7, 4/2 displayed as an RGB ternary image). For example, inFigures 4 and 5, discrete regolith units are enhanced (e.g. purpleareas on the eastern side indicating granitoid rocks). The Landsatdata are also useful in identifying areas of transported cover(generally unprospective), related to streams (dark blue areas), andpotentially more prospective in-situ soils. Identifying these differentregolith regimes is important in planning and interpreting soilsampling programs.
SPOT Data - The excellent spatial resolution of SPOT
Panchromatic data (10 m) (Figure 6) allows easy identification ofgeneral landforms (e.g. ridges, streams, vegetation density) and thistype of imagery can be used as a base map or for rectifying scannedaerial photos.
Application by RGCEXPLORATION, Perth, WesternAustralia
Case study — Exploring for Gold
In the search for gold deposits in Archaean greenstone belts, it isimportant to understand the geology, the structure and the regolith ofthe area of interest. In this example, RGC used aeromagnetic,radiometric, Landsat and SPOT data to help identify different rocktypes, geological structures and regolith units in a gold explorationprogram within the Yilgarn Craton of Western Australia.
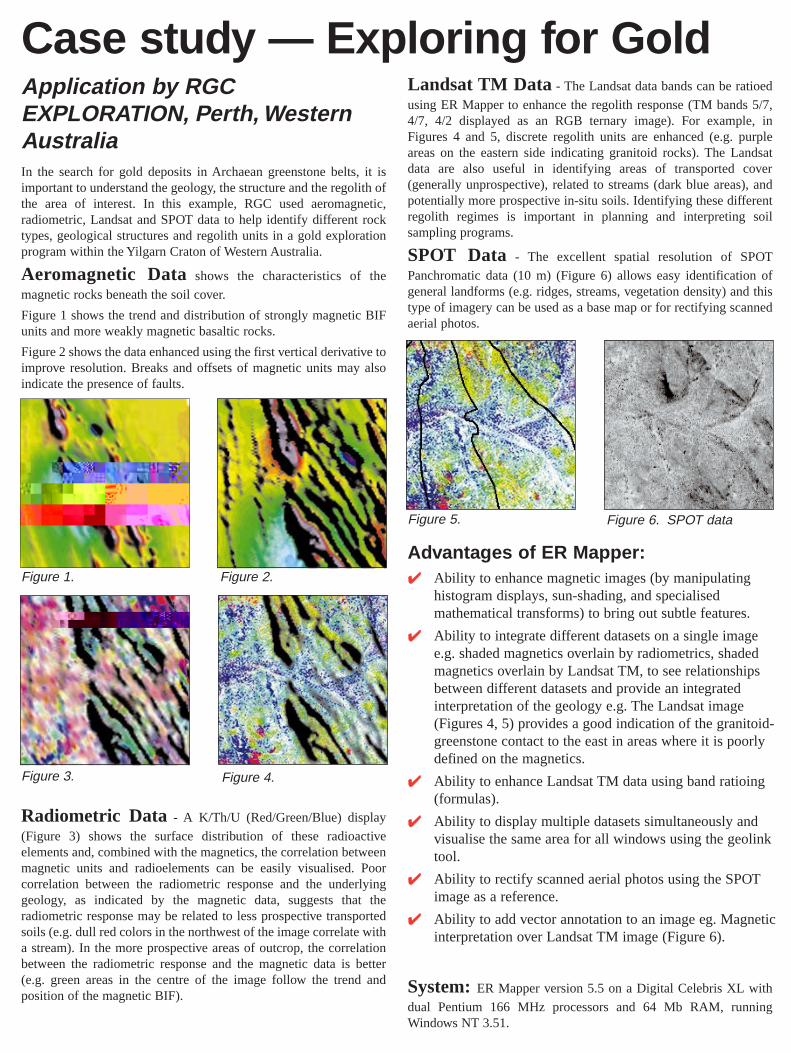
Aeromagnetic Data shows the characteristics of the
magnetic rocks beneath the soil cover.
Figure 1 shows the trend and distribution of strongly magnetic BIFunits and more weakly magnetic basaltic rocks.
Figure 2 shows the data enhanced using the first vertical derivative toimprove resolution. Breaks and offsets of magnetic units may alsoindicate the presence of faults.
Radiometric Data - A K/Th/U (Red/Green/Blue) display
(Figure 3) shows the surface distribution of these radioactiveelements and, combined with the magnetics, the correlation betweenmagnetic units and radioelements can be easily visualised. Poorcorrelation between the radiometric response and the underlyinggeology, as indicated by the magnetic data, suggests that theradiometric response may be related to less prospective transportedsoils (e.g. dull red colors in the northwest of the image correlate witha stream). In the more prospective areas of outcrop, the correlationbetween the radiometric response and the magnetic data is better(e.g. green areas in the centre of the image follow the trend andposition of the magnetic BIF).
Figure 2.Figure 1.
Figure 3. Figure 4.
Figure 6. SPOT data Figure 5.
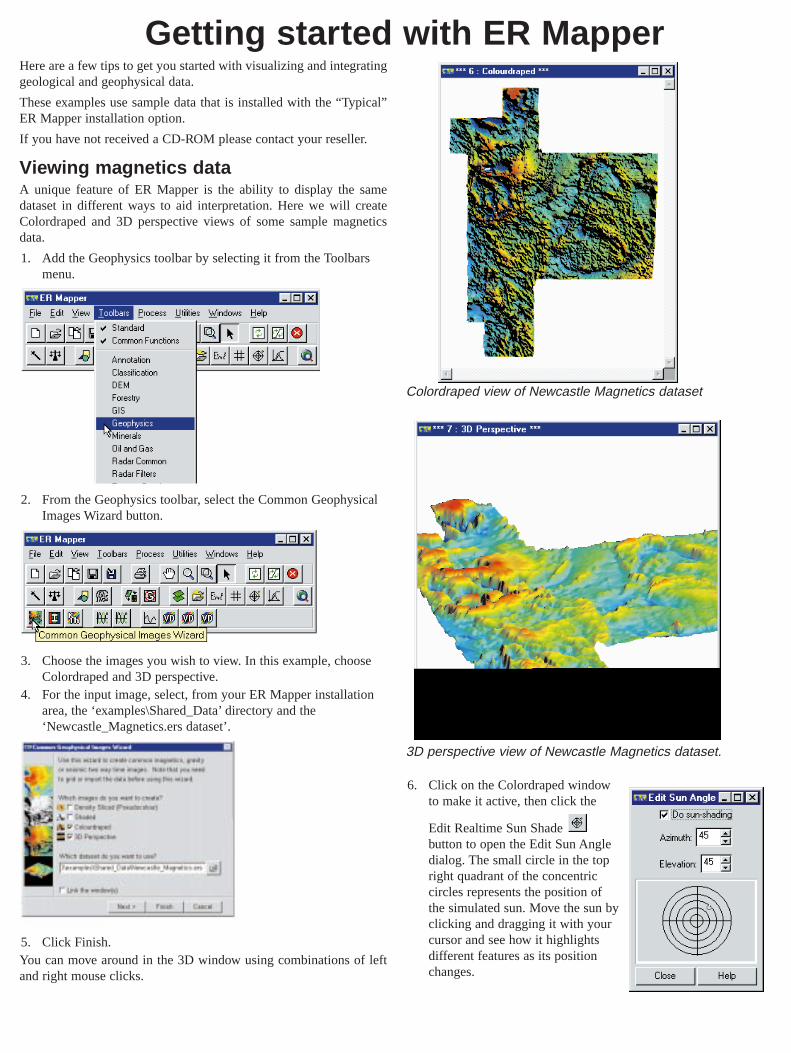
Colordraped view of Newcastle Magnetics dataset
3D perspective view of Newcastle Magnetics dataset.
6. Click on the Colordraped windowto make it active, then click the
Edit Realtime Sun Shade button to open the Edit Sun Angledialog. The small circle in the topright quadrant of the concentriccircles represents the position ofthe simulated sun. Move the sun byclicking and dragging it with yourcursor and see how it highlightsdifferent features as its positionchanges.
Getting started with ER MapperHere are a few tips to get you started with visualizing and integratinggeological and geophysical data.
These examples use sample data that is installed with the “Typical”ER Mapper installation option.
If you have not received a CD-ROM please contact your reseller.
Viewing magnetics dataA unique feature of ER Mapper is the ability to display the samedataset in different ways to aid interpretation. Here we will createColordraped and 3D perspective views of some sample magneticsdata.
1. Add the Geophysics toolbar by selecting it from the Toolbarsmenu.
2. From the Geophysics toolbar, select the Common GeophysicalImages Wizard button.
3. Choose the images you wish to view. In this example, chooseColordraped and 3D perspective.
4. For the input image, select, from your ER Mapper installationarea, the ‘examples\Shared_Data’ directory and the‘Newcastle_Magnetics.ers dataset’.
5. Click Finish.You can move around in the 3D window using combinations of leftand right mouse clicks.
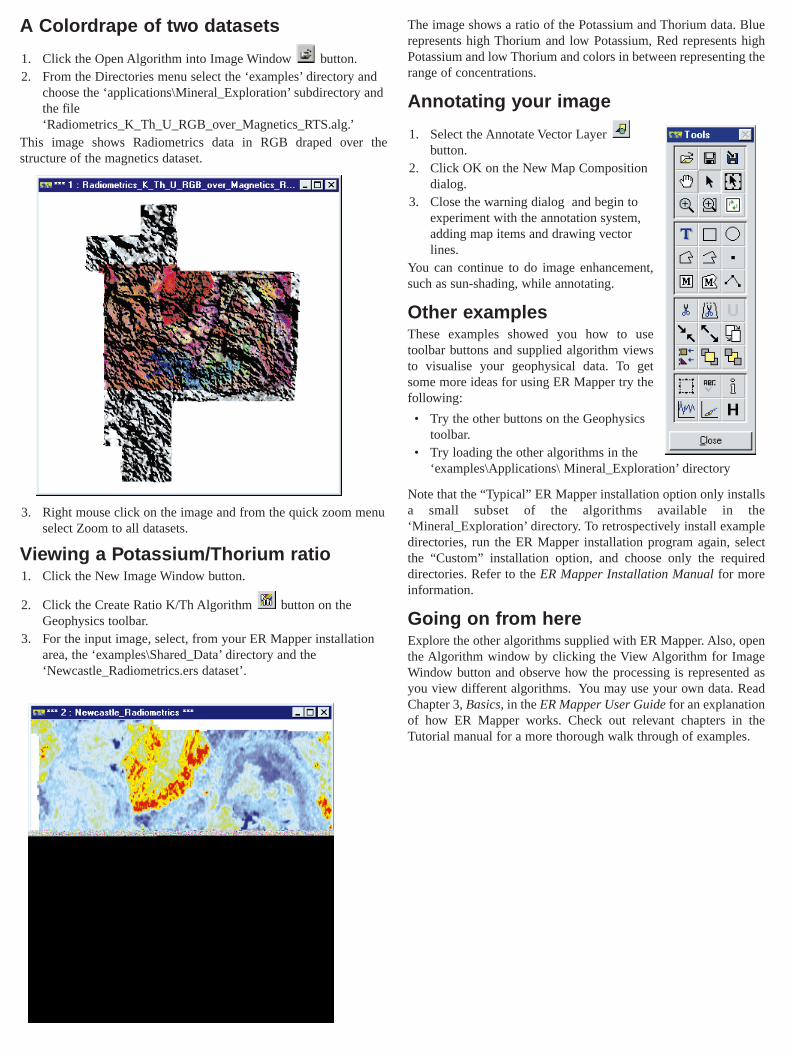
A Colordrape of two datasets
1. Click the Open Algorithm into Image Window button.2. From the Directories menu select the ‘examples’ directory and
choose the ‘applications\Mineral_Exploration’ subdirectory andthe file‘Radiometrics_K_Th_U_RGB_over_Magnetics_RTS.alg.’
This image shows Radiometrics data in RGB draped over thestructure of the magnetics dataset.
3. Right mouse click on the image and from the quick zoom menuselect Zoom to all datasets.
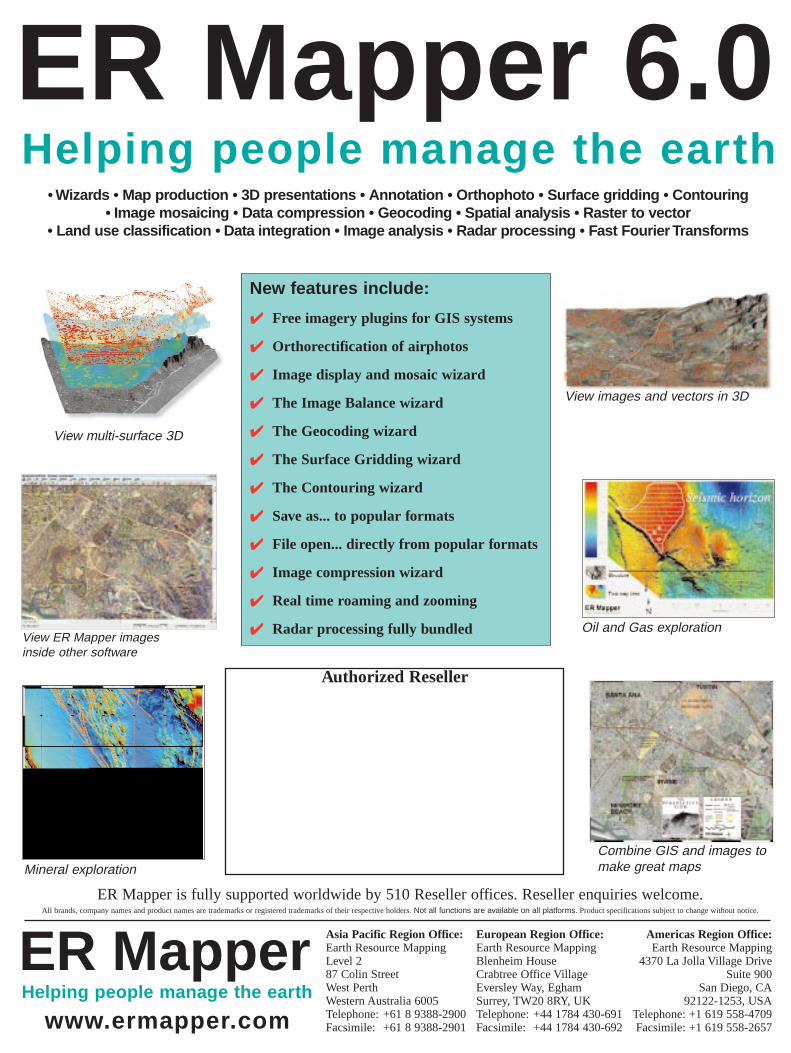
Viewing a Potassium/Thorium ratio 1. Click the New Image Window button.
2. Click the Create Ratio K/Th Algorithm button on theGeophysics toolbar.
3. For the input image, select, from your ER Mapper installationarea, the ‘examples\Shared_Data’ directory and the‘Newcastle_Radiometrics.ers dataset’.
The image shows a ratio of the Potassium and Thorium data. Bluerepresents high Thorium and low Potassium, Red represents highPotassium and low Thorium and colors in between representing therange of concentrations.
Annotating your image
1. Select the Annotate Vector Layer button.
2. Click OK on the New Map Compositiondialog.
3. Close the warning dialog and begin toexperiment with the annotation system,adding map items and drawing vectorlines.
You can continue to do image enhancement,such as sun-shading, while annotating.
Other examplesThese examples showed you how to usetoolbar buttons and supplied algorithm viewsto visualise your geophysical data. To getsome more ideas for using ER Mapper try thefollowing:
• Try the other buttons on the Geophysicstoolbar.
• Try loading the other algorithms in the ‘examples\Applications\ Mineral_Exploration’ directory
Note that the “Typical” ER Mapper installation option only installsa small subset of the algorithms available in the‘Mineral_Exploration’ directory. To retrospectively install exampledirectories, run the ER Mapper installation program again, selectthe “Custom” installation option, and choose only the requireddirectories. Refer to the ER Mapper Installation Manualfor moreinformation.
Going on from hereExplore the other algorithms supplied with ER Mapper. Also, openthe Algorithm window by clicking the View Algorithm for ImageWindow button and observe how the processing is represented asyou view different algorithms. You may use your own data. ReadChapter 3,Basics, in the ER Mapper User Guidefor an explanationof how ER Mapper works. Check out relevant chapters in theTutorial manual for a more thorough walk through of examples.
View ER Mapper images inside other software
Combine GIS and images tomake great maps
Oil and Gas exploration
Mineral exploration
View multi-surface 3D
ER Mapper 6.0Helping people manage the earth
• Wizards • Map production • 3D presentations • Annotation • Orthophoto • Surface gridding • Contouring• Image mosaicing • Data compression • Geocoding • Spatial analysis • Raster to vector
• Land use classification • Data integration • Image analysis • Radar processing • Fast Fourier Transforms
New features include:
✔✔✔✔ Free imagery plugins for GIS systems
✔✔✔✔ Orthorectification of airphotos
✔✔✔✔ Image display and mosaic wizard
✔✔✔✔ The Image Balance wizard
✔✔✔✔ The Geocoding wizard
✔✔✔✔ The Surface Gridding wizard
✔✔✔✔ The Contouring wizard
✔✔✔✔ Save as... to popular formats
✔✔✔✔ File open... directly from popular formats
✔✔✔✔ Image compression wizard
✔✔✔✔ Real time roaming and zooming
✔✔✔✔ Radar processing fully bundled
Asia Pacific Region Office:Earth Resource MappingLevel 287 Colin StreetWest PerthWestern Australia 6005Telephone: +61 8 9388-2900Facsimile: +61 8 9388-2901
European Region Office:Earth Resource MappingBlenheim HouseCrabtree Office Village Eversley Way, EghamSurrey, TW20 8RY, UKTelephone: +44 1784 430-691Facsimile: +44 1784 430-692
Americas Region Office:Earth Resource Mapping
4370 La Jolla Village DriveSuite 900
San Diego, CA92122-1253, USA
Telephone: +1 619 558-4709Facsimile: +1 619 558-2657
ER MapperHelping people manage the earth
www.ermapper.com
All brands, company names and product names are trademarks or registered trademarks of their respective holders.Not all functions are available on all platforms. Product specifications subject to change without notice.
ER Mapper is fully supported worldwide by 510 Reseller offices. Reseller enquiries welcome.
View images and vectors in 3D
Authorized Reseller