Embed Size (px)
Citation preview
Summary of Performance and Financial Information 2016
Creating prosperity for self-sustaining, repopulating and economically thriving communities.
United States Department of Agriculture
U S D A 2 0 1 6 S U M M A R Y O F P E R F O R M A N C E A N D F I N A N C I A L I N F O R M A T I O N 1
About This Summary The U.S. Department of Agriculture (USDA) Summary of Performance and Financial Information for Fiscal Year (FY) 2016 includes the most relevant performance and financial information in a brief, user-friendly format that is easily understood by a reader with little technical background in these areas. The goal of this summary is to increase accountability of agency heads and program managers by making the financial and performance information more transparent and accessible to Congress, the public, and other key constituencies. USDA’s plans and reports are available at www.performance.gov and www.usda.gov/performance.
Who We Are and What We Do President Abraham Lincoln founded the U.S. Department of Agriculture (USDA) in 1862 with the goal of providing effective leadership to the Nation on food, agriculture, natural resources, and related issues. Since 1862, the dedicated public servants at USDA help millions of Americans every day. As Americans, you are part of the USDA story that has had a tradition of excellence in public service for over 150 years.
We would like you to learn more about USDA and the Agencies and Offices that touch every American, every day. More information about the Department, our history, and our leaders can be found at www.usda.gov.
2 U S D A 2 0 1 6 S U M M A R Y O F P E R F O R M A N C E A N D F I N A N C I A L I N F O R M A T I O N
Strategic Plan and Program Performance USDA Performance, Goals, and Results FY 2016 The U.S. Department of Agriculture’s (USDA) mission is to provide leadership on food, agriculture, natural resources, rural development, nutrition, and related issues based on sound public policy, the best available science, and efficient management. Through implementing our mission, the Department aspires to achieve five strategic goals as reflected in USDA’s 2014--2018 Strategic Plan:
• Assist rural communities to create prosperity so they are self-sustaining, re-populating, and economically thriving;
• Ensure our national forests and private working lands are conserved, restored, and made more resilient to climate change, while enhancing our water resources;
• Help America promote agricultural production and biotechnology exports as America works to increase food security;
• Ensure that all of America’s children have access to safe, nutritious, and balanced meals; and
• Create a USDA for the 21st century that is high-performing, efficient, and adaptable.
USDA has also established five Agency Priority Goals (APGs) for fiscal years (FY) 2016 and 2017 that identify near-term goals to help USDA progress toward meeting our longer term strategic goals and objectives. USDA’s APGs are as follows:
• Access and Opportunity for Beginning Farmers and Ranchers;
• Soil Health and Sustainability;
U S D A 2 0 1 6 S U M M A R Y O F P E R F O R M A N C E A N D F I N A N C I A L I N F O R M A T I O N 3
• Increasing assistance for rural, persistent poverty communities;
• Pollinator Habitat Health; and
• Increased food security and diet quality.
More information and reports on the APGs and quarterly progress can be found at http://www.performance.gov/agency/department-agriculture?view=public#apg.
For purposes of the Agency Financial Report (AFR), a performance summary is provided using the Department’s key performance indicators as a mechanism to gauge progress in achieving priorities, goals, and strategic objectives. In FY 2016, USDA had 38 key performance indicators, as reflected in the Department’s FY 2016 Annual Performance Plan (http://www.obpa.usda.gov/budsum/fy16budsum.pdf).
The following tables and discussion provide a high-level description of key focus areas for the Department that are being tracked and managed through USDA’s performance management process, in alignment with the Department’s strategic goals and objectives. The tables provide key performance indicator historical results, and includes target and actual results for the year.
Performance information and a detailed discussion of results for the Department’s FY 2016 performance goals, assessment methodologies, metrics, external reviews, and documentation of performance data will be presented in the FY 2016 USDA Annual Performance Report. The report is planned to be released with the President’s 2018 budget in February and will be available on the USDA Performance Improvement and Accountability website.
The data used by the Department to measure performance is collected using a standardized methodology. This methodology has been vetted by federally employed scientists and policymakers, and, ultimately, the leadership and Under Secretaries of each respective mission area. All attest to the completeness, reliability, and quality of the data.
4 U S D A 2 0 1 6 S U M M A R Y O F P E R F O R M A N C E A N D F I N A N C I A L I N F O R M A T I O N
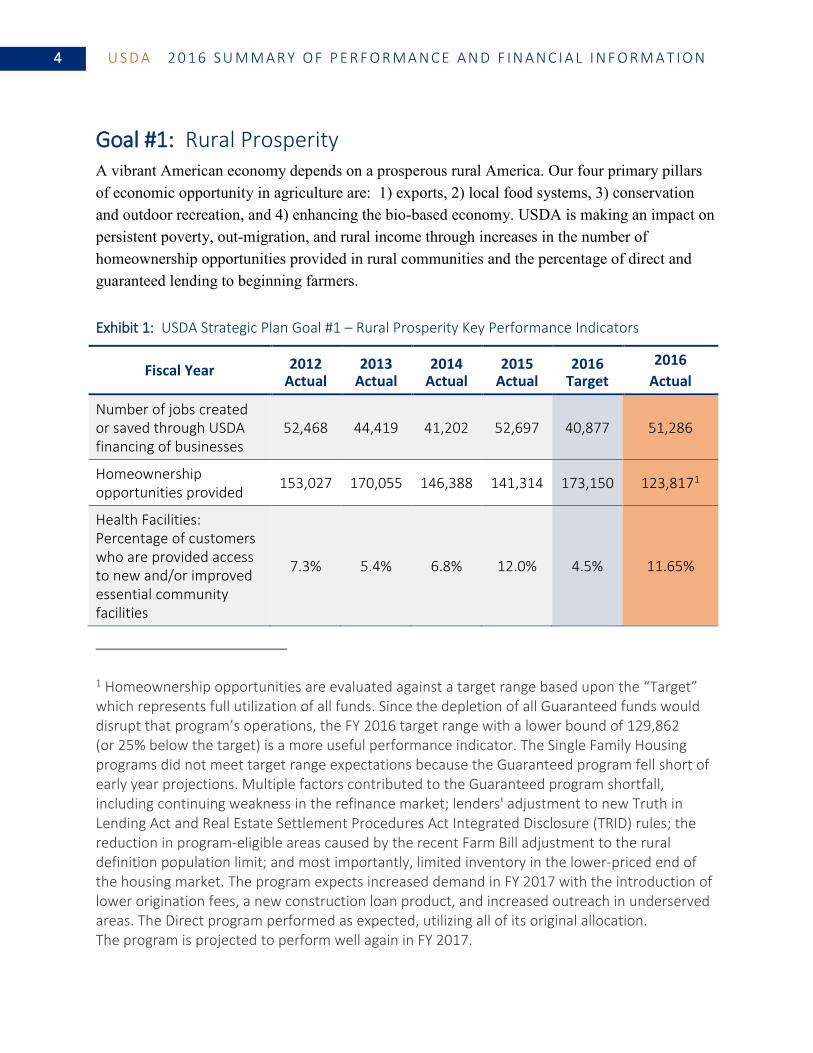
Goal #1: Rural Prosperity A vibrant American economy depends on a prosperous rural America. Our four primary pillars of economic opportunity in agriculture are: 1) exports, 2) local food systems, 3) conservation and outdoor recreation, and 4) enhancing the bio-based economy. USDA is making an impact on persistent poverty, out-migration, and rural income through increases in the number of homeownership opportunities provided in rural communities and the percentage of direct and guaranteed lending to beginning farmers.
Exhibit 1: USDA Strategic Plan Goal #1 – Rural Prosperity Key Performance Indicators
Fiscal Year 2012 Actual
2013 Actual
2014 Actual
2015 Actual
2016 Target
2016 Actual
Number of jobs created or saved through USDA financing of businesses
52,468 44,419 41,202 52,697 40,877 51,286
Homeownership opportunities provided 153,027 170,055 146,388 141,314 173,150 123,8171
Health Facilities: Percentage of customers who are provided access to new and/or improved essential community facilities
7.3% 5.4% 6.8% 12.0% 4.5% 11.65%
1 Homeownership opportunities are evaluated against a target range based upon the “Target” which represents full utilization of all funds. Since the depletion of all Guaranteed funds would disrupt that program’s operations, the FY 2016 target range with a lower bound of 129,862 (or 25% below the target) is a more useful performance indicator. The Single Family Housing programs did not meet target range expectations because the Guaranteed program fell short of early year projections. Multiple factors contributed to the Guaranteed program shortfall, including continuing weakness in the refinance market; lenders' adjustment to new Truth in Lending Act and Real Estate Settlement Procedures Act Integrated Disclosure (TRID) rules; the reduction in program-eligible areas caused by the recent Farm Bill adjustment to the rural definition population limit; and most importantly, limited inventory in the lower-priced end of the housing market. The program expects increased demand in FY 2017 with the introduction of lower origination fees, a new construction loan product, and increased outreach in underserved areas. The Direct program performed as expected, utilizing all of its original allocation. The program is projected to perform well again in FY 2017.
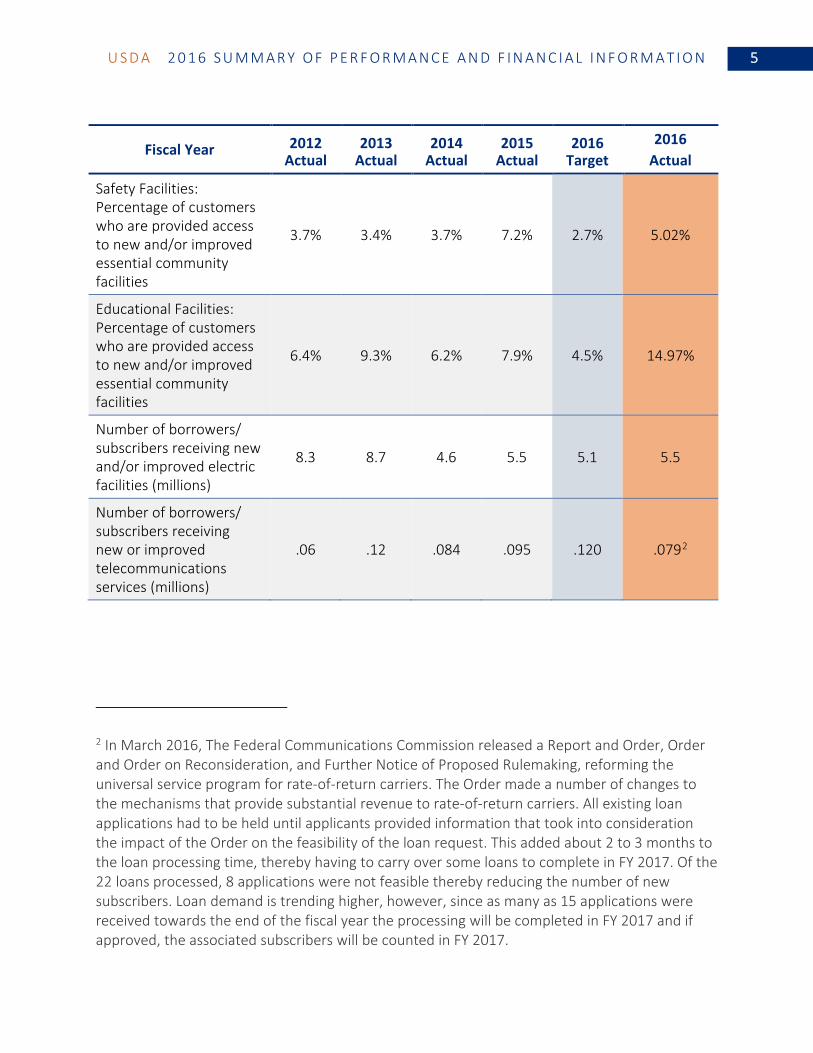
U S D A 2 0 1 6 S U M M A R Y O F P E R F O R M A N C E A N D F I N A N C I A L I N F O R M A T I O N 5
Fiscal Year 2012 Actual
2013 Actual
2014 Actual
2015 Actual
2016 Target
2016 Actual
Safety Facilities: Percentage of customers who are provided access to new and/or improved essential community facilities
3.7% 3.4% 3.7% 7.2% 2.7% 5.02%
Educational Facilities: Percentage of customers who are provided access to new and/or improved essential community facilities
6.4% 9.3% 6.2% 7.9% 4.5% 14.97%
Number of borrowers/ subscribers receiving new and/or improved electric facilities (millions)
8.3 8.7 4.6 5.5 5.1 5.5
Number of borrowers/ subscribers receiving new or improved telecommunications services (millions)
.06 .12 .084 .095 .120 .0792
2 In March 2016, The Federal Communications Commission released a Report and Order, Order and Order on Reconsideration, and Further Notice of Proposed Rulemaking, reforming the universal service program for rate-of-return carriers. The Order made a number of changes to the mechanisms that provide substantial revenue to rate-of-return carriers. All existing loan applications had to be held until applicants provided information that took into consideration the impact of the Order on the feasibility of the loan request. This added about 2 to 3 months to the loan processing time, thereby having to carry over some loans to complete in FY 2017. Of the 22 loans processed, 8 applications were not feasible thereby reducing the number of new subscribers. Loan demand is trending higher, however, since as many as 15 applications were received towards the end of the fiscal year the processing will be completed in FY 2017 and if approved, the associated subscribers will be counted in FY 2017.
6 U S D A 2 0 1 6 S U M M A R Y O F P E R F O R M A N C E A N D F I N A N C I A L I N F O R M A T I O N
Fiscal Year 2012 Actual
2013 Actual
2014 Actual
2015 Actual
2016 Target
2016 Actual
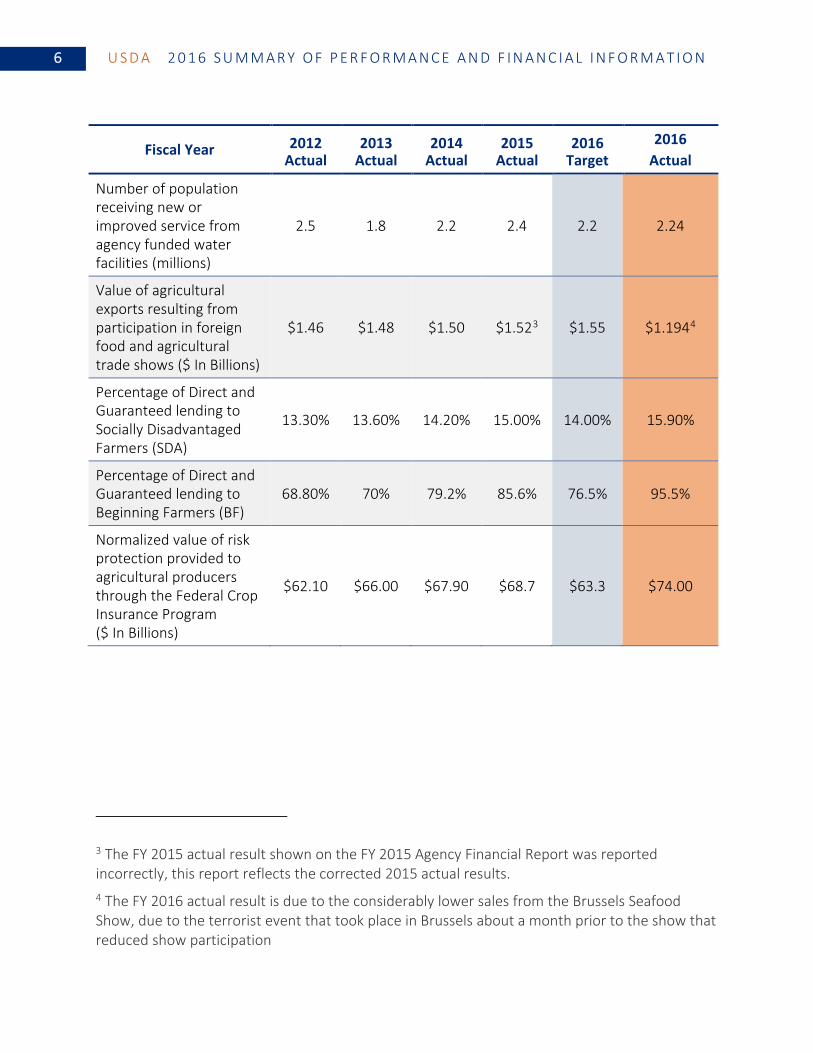
Number of population receiving new or improved service from agency funded water facilities (millions)
2.5 1.8 2.2 2.4 2.2 2.24
Value of agricultural exports resulting from participation in foreign food and agricultural trade shows ($ In Billions)
$1.46 $1.48 $1.50 $1.523 $1.55 $1.1944
Percentage of Direct and Guaranteed lending to Socially Disadvantaged Farmers (SDA)
13.30% 13.60% 14.20% 15.00% 14.00% 15.90%
Percentage of Direct and Guaranteed lending to Beginning Farmers (BF)
68.80% 70% 79.2% 85.6% 76.5% 95.5%
Normalized value of risk protection provided to agricultural producers through the Federal Crop Insurance Program ($ In Billions)
$62.10 $66.00 $67.90 $68.7 $63.3 $74.00
3 The FY 2015 actual result shown on the FY 2015 Agency Financial Report was reported incorrectly, this report reflects the corrected 2015 actual results. 4 The FY 2016 actual result is due to the considerably lower sales from the Brussels Seafood Show, due to the terrorist event that took place in Brussels about a month prior to the show that reduced show participation
U S D A 2 0 1 6 S U M M A R Y O F P E R F O R M A N C E A N D F I N A N C I A L I N F O R M A T I O N 7
Fiscal Year 2012 Actual
2013 Actual
2014 Actual
2015 Actual
2016 Target
2016 Actual
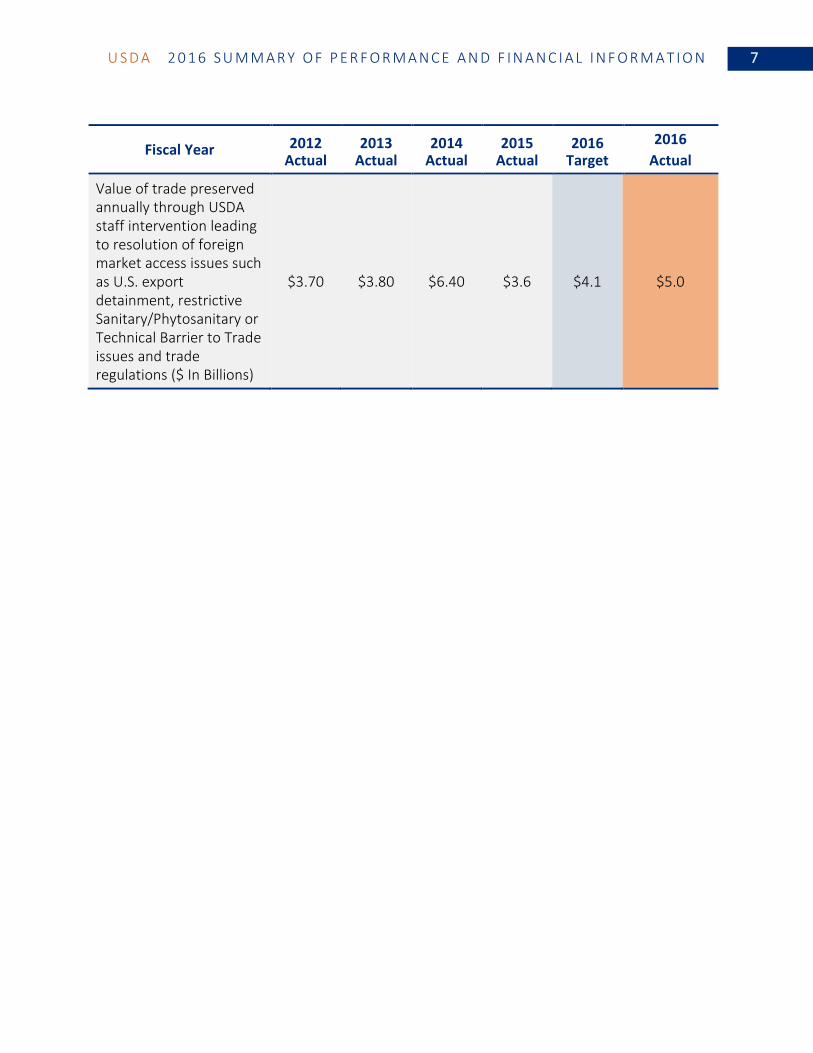
Value of trade preserved annually through USDA staff intervention leading to resolution of foreign market access issues such as U.S. export detainment, restrictive Sanitary/Phytosanitary or Technical Barrier to Trade issues and trade regulations ($ In Billions)
$3.70 $3.80 $6.40 $3.6 $4.1 $5.0
8 U S D A 2 0 1 6 S U M M A R Y O F P E R F O R M A N C E A N D F I N A N C I A L I N F O R M A T I O N
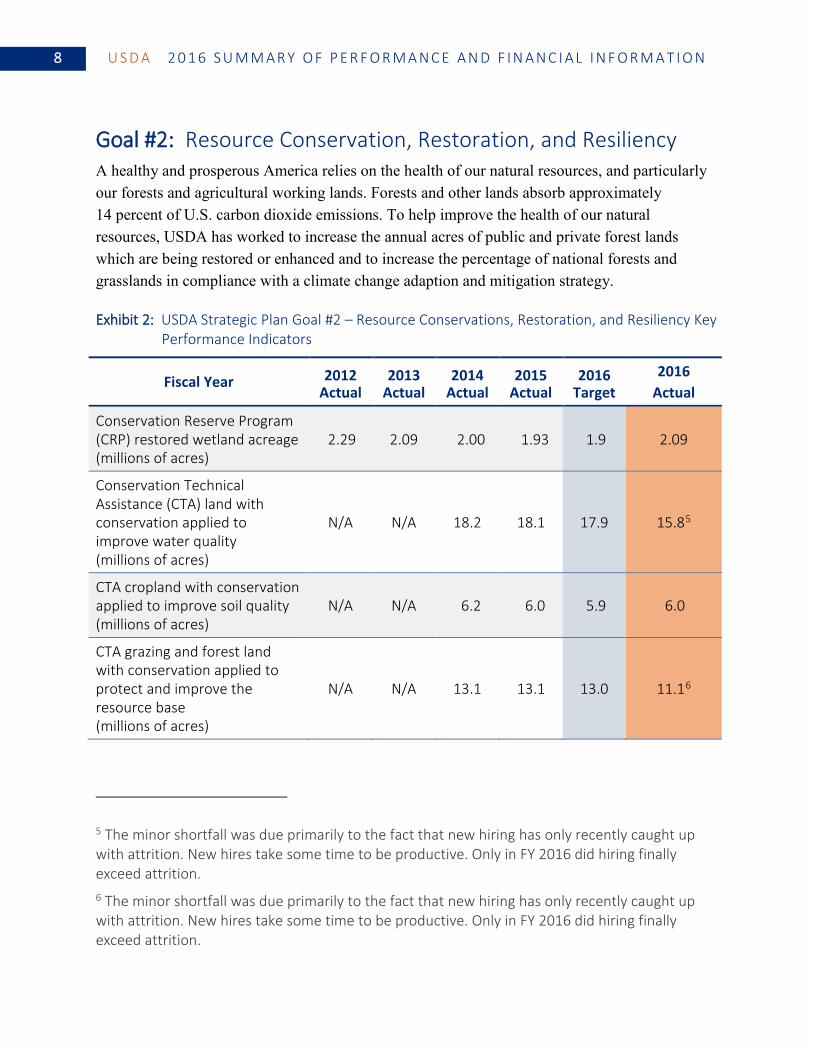
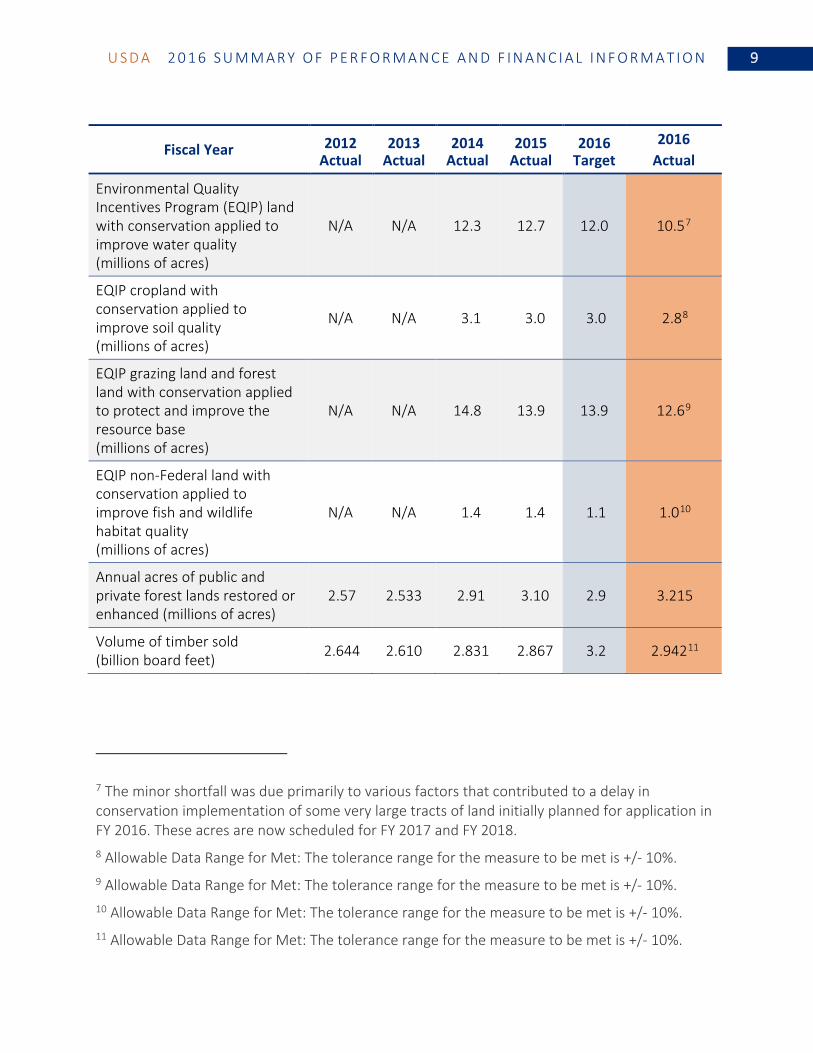
Goal #2: Resource Conservation, Restoration, and Resiliency A healthy and prosperous America relies on the health of our natural resources, and particularly our forests and agricultural working lands. Forests and other lands absorb approximately 14 percent of U.S. carbon dioxide emissions. To help improve the health of our natural resources, USDA has worked to increase the annual acres of public and private forest lands which are being restored or enhanced and to increase the percentage of national forests and grasslands in compliance with a climate change adaption and mitigation strategy.
Exhibit 2: USDA Strategic Plan Goal #2 – Resource Conservations, Restoration, and Resiliency Key Performance Indicators
Fiscal Year 2012 Actual
2013 Actual
2014 Actual
2015 Actual
2016 Target
2016 Actual
Conservation Reserve Program (CRP) restored wetland acreage (millions of acres)
2.29 2.09 2.00 1.93 1.9 2.09
Conservation Technical Assistance (CTA) land with conservation applied to improve water quality (millions of acres)
N/A N/A 18.2 18.1 17.9 15.85
CTA cropland with conservation applied to improve soil quality (millions of acres)
N/A N/A 6.2 6.0 5.9 6.0
CTA grazing and forest land with conservation applied to protect and improve the resource base (millions of acres)
N/A N/A 13.1 13.1 13.0 11.16
5 The minor shortfall was due primarily to the fact that new hiring has only recently caught up with attrition. New hires take some time to be productive. Only in FY 2016 did hiring finally exceed attrition. 6 The minor shortfall was due primarily to the fact that new hiring has only recently caught up with attrition. New hires take some time to be productive. Only in FY 2016 did hiring finally exceed attrition.
U S D A 2 0 1 6 S U M M A R Y O F P E R F O R M A N C E A N D F I N A N C I A L I N F O R M A T I O N 9
Fiscal Year 2012 Actual
2013 Actual
2014 Actual
2015 Actual
2016 Target
2016 Actual
Environmental Quality Incentives Program (EQIP) land with conservation applied to improve water quality (millions of acres)
N/A N/A 12.3 12.7 12.0 10.57
EQIP cropland with conservation applied to improve soil quality (millions of acres)
N/A N/A 3.1 3.0 3.0 2.88
EQIP grazing land and forest land with conservation applied to protect and improve the resource base (millions of acres)
N/A N/A 14.8 13.9 13.9 12.69
EQIP non-Federal land with conservation applied to improve fish and wildlife habitat quality (millions of acres)
N/A N/A 1.4 1.4 1.1 1.010
Annual acres of public and private forest lands restored or enhanced (millions of acres)
2.57 2.533 2.91 3.10 2.9 3.215
Volume of timber sold (billion board feet) 2.644 2.610 2.831 2.867 3.2 2.94211
7 The minor shortfall was due primarily to various factors that contributed to a delay in conservation implementation of some very large tracts of land initially planned for application in FY 2016. These acres are now scheduled for FY 2017 and FY 2018. 8 Allowable Data Range for Met: The tolerance range for the measure to be met is +/- 10%. 9 Allowable Data Range for Met: The tolerance range for the measure to be met is +/- 10%. 10 Allowable Data Range for Met: The tolerance range for the measure to be met is +/- 10%. 11 Allowable Data Range for Met: The tolerance range for the measure to be met is +/- 10%.
1 0 U S D A 2 0 1 6 S U M M A R Y O F P E R F O R M A N C E A N D F I N A N C I A L I N F O R M A T I O N
Fiscal Year 2012 Actual
2013 Actual
2014 Actual
2015 Actual
2016 Target
2016 Actual
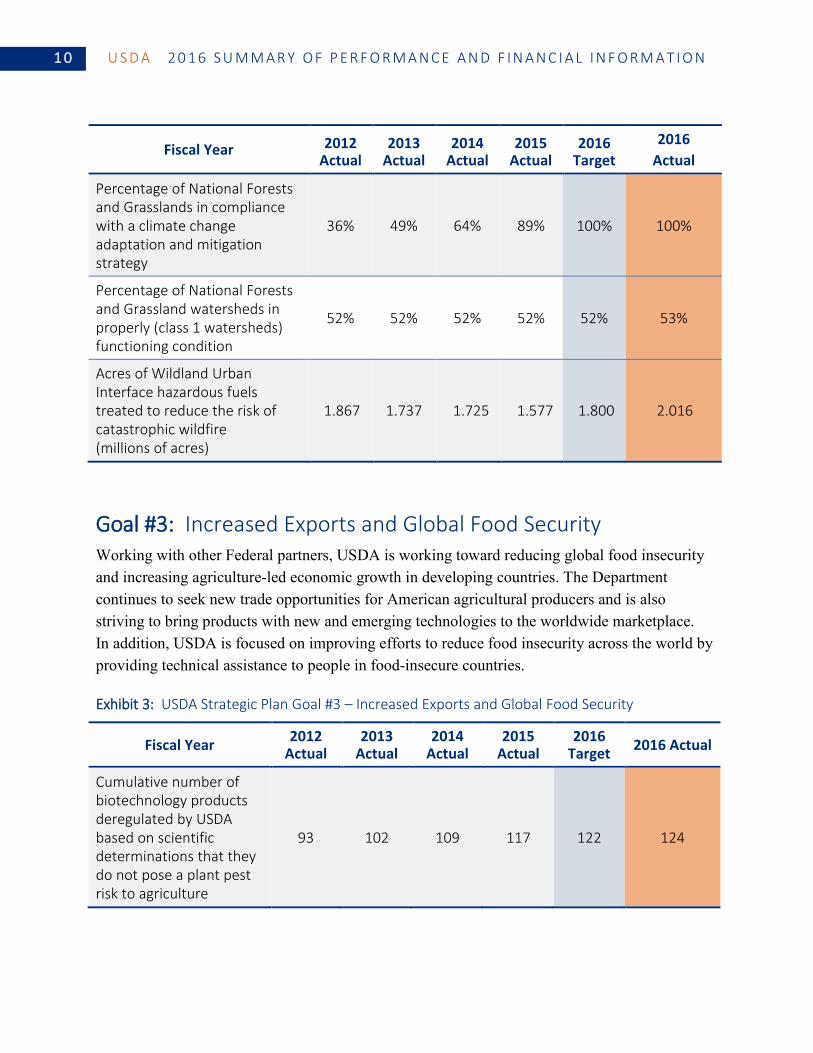
Percentage of National Forests and Grasslands in compliance with a climate change adaptation and mitigation strategy
36% 49% 64% 89% 100% 100%
Percentage of National Forests and Grassland watersheds in properly (class 1 watersheds) functioning condition
52% 52% 52% 52% 52% 53%
Acres of Wildland Urban Interface hazardous fuels treated to reduce the risk of catastrophic wildfire (millions of acres)
1.867 1.737 1.725 1.577 1.800 2.016
Goal #3: Increased Exports and Global Food Security Working with other Federal partners, USDA is working toward reducing global food insecurity and increasing agriculture-led economic growth in developing countries. The Department continues to seek new trade opportunities for American agricultural producers and is also striving to bring products with new and emerging technologies to the worldwide marketplace. In addition, USDA is focused on improving efforts to reduce food insecurity across the world by providing technical assistance to people in food-insecure countries.
Exhibit 3: USDA Strategic Plan Goal #3 – Increased Exports and Global Food Security
Fiscal Year 2012 Actual
2013 Actual
2014 Actual
2015 Actual
2016 Target 2016 Actual
Cumulative number of biotechnology products deregulated by USDA based on scientific determinations that they do not pose a plant pest risk to agriculture
93 102 109 117 122 124
U S D A 2 0 1 6 S U M M A R Y O F P E R F O R M A N C E A N D F I N A N C I A L I N F O R M A T I O N 1 1
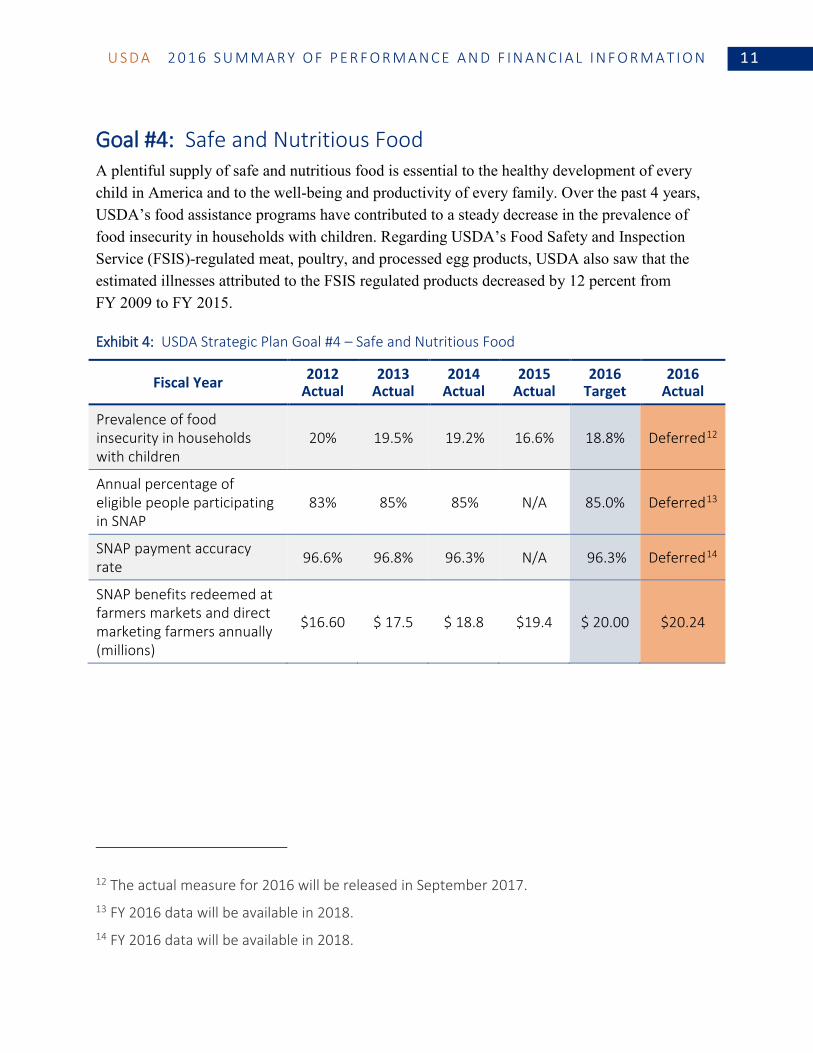
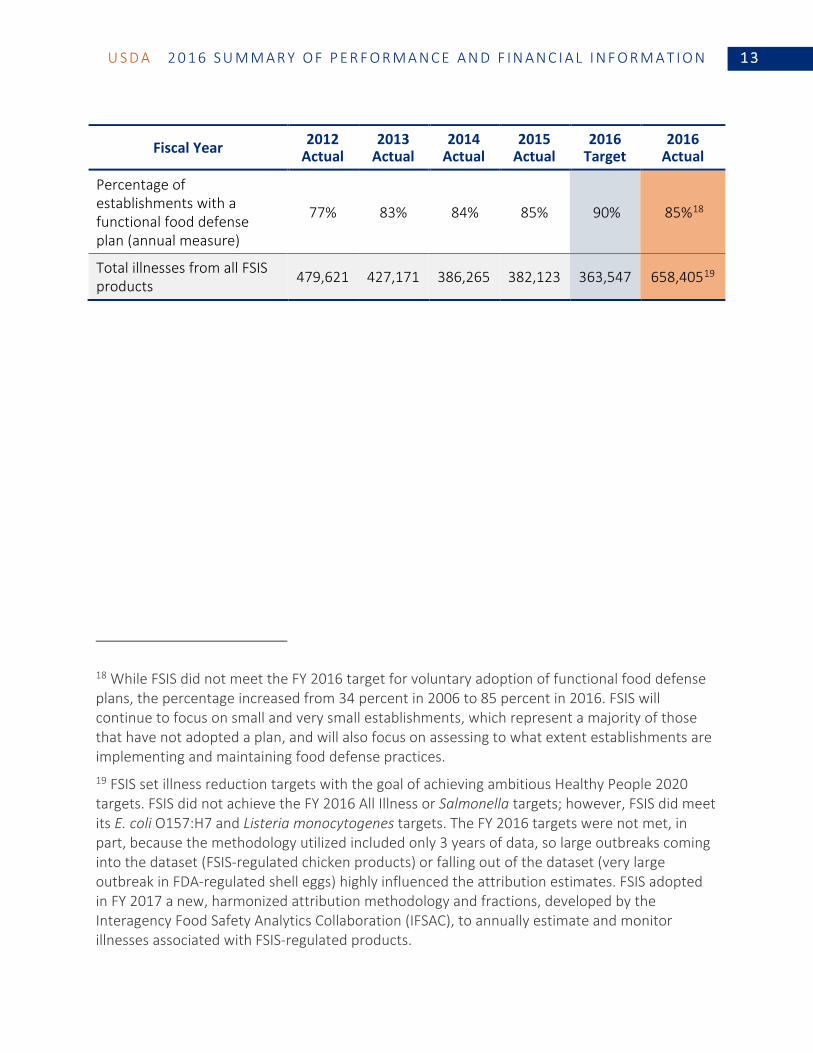
Goal #4: Safe and Nutritious Food A plentiful supply of safe and nutritious food is essential to the healthy development of every child in America and to the well-being and productivity of every family. Over the past 4 years, USDA’s food assistance programs have contributed to a steady decrease in the prevalence of food insecurity in households with children. Regarding USDA’s Food Safety and Inspection Service (FSIS)-regulated meat, poultry, and processed egg products, USDA also saw that the estimated illnesses attributed to the FSIS regulated products decreased by 12 percent from FY 2009 to FY 2015.
Exhibit 4: USDA Strategic Plan Goal #4 – Safe and Nutritious Food
Fiscal Year 2012 Actual
2013 Actual
2014 Actual
2015 Actual
2016 Target
2016 Actual
Prevalence of food insecurity in households with children
20% 19.5% 19.2% 16.6% 18.8% Deferred12
Annual percentage of eligible people participating in SNAP
83% 85% 85% N/A 85.0% Deferred13
SNAP payment accuracy rate 96.6% 96.8% 96.3% N/A 96.3% Deferred14
SNAP benefits redeemed at farmers markets and direct marketing farmers annually (millions)
$16.60 $ 17.5 $ 18.8 $19.4 $ 20.00 $20.24
12 The actual measure for 2016 will be released in September 2017. 13 FY 2016 data will be available in 2018. 14 FY 2016 data will be available in 2018.
1 2 U S D A 2 0 1 6 S U M M A R Y O F P E R F O R M A N C E A N D F I N A N C I A L I N F O R M A T I O N
Fiscal Year 2012 Actual
2013 Actual
2014 Actual
2015 Actual
2016 Target
2016 Actual
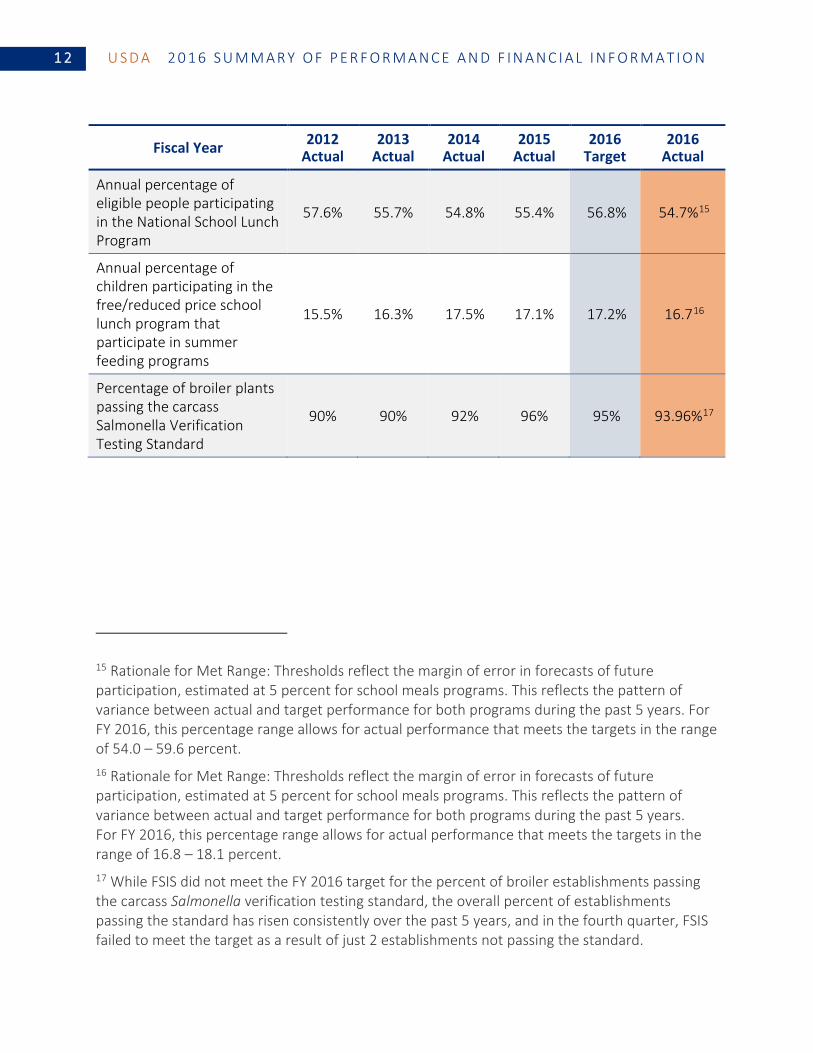
Annual percentage of eligible people participating in the National School Lunch Program
57.6% 55.7% 54.8% 55.4% 56.8% 54.7%15
Annual percentage of children participating in the free/reduced price school lunch program that participate in summer feeding programs
15.5% 16.3% 17.5% 17.1% 17.2% 16.716
Percentage of broiler plants passing the carcass Salmonella Verification Testing Standard
90% 90% 92% 96% 95% 93.96%17
15 Rationale for Met Range: Thresholds reflect the margin of error in forecasts of future participation, estimated at 5 percent for school meals programs. This reflects the pattern of variance between actual and target performance for both programs during the past 5 years. For FY 2016, this percentage range allows for actual performance that meets the targets in the range of 54.0 – 59.6 percent. 16 Rationale for Met Range: Thresholds reflect the margin of error in forecasts of future participation, estimated at 5 percent for school meals programs. This reflects the pattern of variance between actual and target performance for both programs during the past 5 years. For FY 2016, this percentage range allows for actual performance that meets the targets in the range of 16.8 – 18.1 percent. 17 While FSIS did not meet the FY 2016 target for the percent of broiler establishments passing the carcass Salmonella verification testing standard, the overall percent of establishments passing the standard has risen consistently over the past 5 years, and in the fourth quarter, FSIS failed to meet the target as a result of just 2 establishments not passing the standard.
U S D A 2 0 1 6 S U M M A R Y O F P E R F O R M A N C E A N D F I N A N C I A L I N F O R M A T I O N 1 3
Fiscal Year 2012 Actual
2013 Actual
2014 Actual
2015 Actual
2016 Target
2016 Actual
Percentage of establishments with a functional food defense plan (annual measure)
77% 83% 84% 85% 90% 85%18
Total illnesses from all FSIS products 479,621 427,171 386,265 382,123 363,547 658,40519
18 While FSIS did not meet the FY 2016 target for voluntary adoption of functional food defense plans, the percentage increased from 34 percent in 2006 to 85 percent in 2016. FSIS will continue to focus on small and very small establishments, which represent a majority of those that have not adopted a plan, and will also focus on assessing to what extent establishments are implementing and maintaining food defense practices. 19 FSIS set illness reduction targets with the goal of achieving ambitious Healthy People 2020 targets. FSIS did not achieve the FY 2016 All Illness or Salmonella targets; however, FSIS did meet its E. coli O157:H7 and Listeria monocytogenes targets. The FY 2016 targets were not met, in part, because the methodology utilized included only 3 years of data, so large outbreaks coming into the dataset (FSIS-regulated chicken products) or falling out of the dataset (very large outbreak in FDA-regulated shell eggs) highly influenced the attribution estimates. FSIS adopted in FY 2017 a new, harmonized attribution methodology and fractions, developed by the Interagency Food Safety Analytics Collaboration (IFSAC), to annually estimate and monitor illnesses associated with FSIS-regulated products.
1 4 U S D A 2 0 1 6 S U M M A R Y O F P E R F O R M A N C E A N D F I N A N C I A L I N F O R M A T I O N
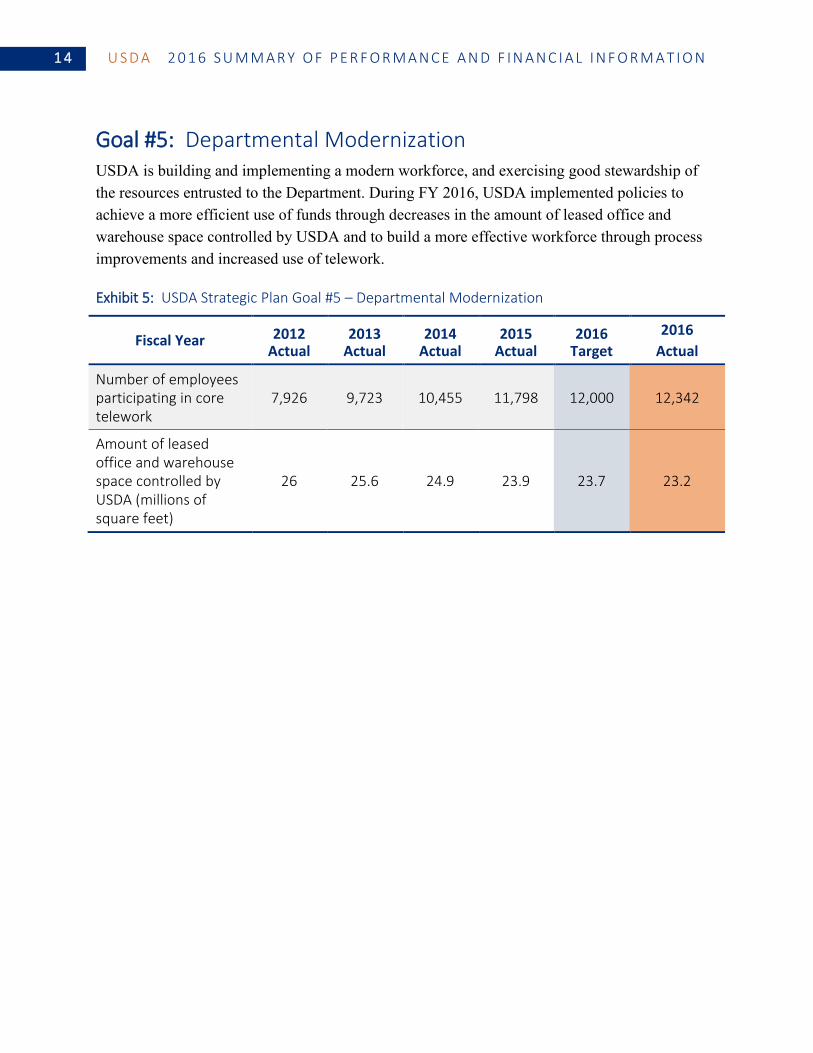
Goal #5: Departmental Modernization USDA is building and implementing a modern workforce, and exercising good stewardship of the resources entrusted to the Department. During FY 2016, USDA implemented policies to achieve a more efficient use of funds through decreases in the amount of leased office and warehouse space controlled by USDA and to build a more effective workforce through process improvements and increased use of telework.
Exhibit 5: USDA Strategic Plan Goal #5 – Departmental Modernization
Fiscal Year 2012 Actual
2013 Actual
2014 Actual
2015 Actual
2016 Target
2016 Actual
Number of employees participating in core telework
7,926 9,723 10,455 11,798 12,000 12,342
Amount of leased office and warehouse space controlled by USDA (millions of square feet)
26 25.6 24.9 23.9 23.7 23.2
U S D A 2 0 1 6 S U M M A R Y O F P E R F O R M A N C E A N D F I N A N C I A L I N F O R M A T I O N 1 5
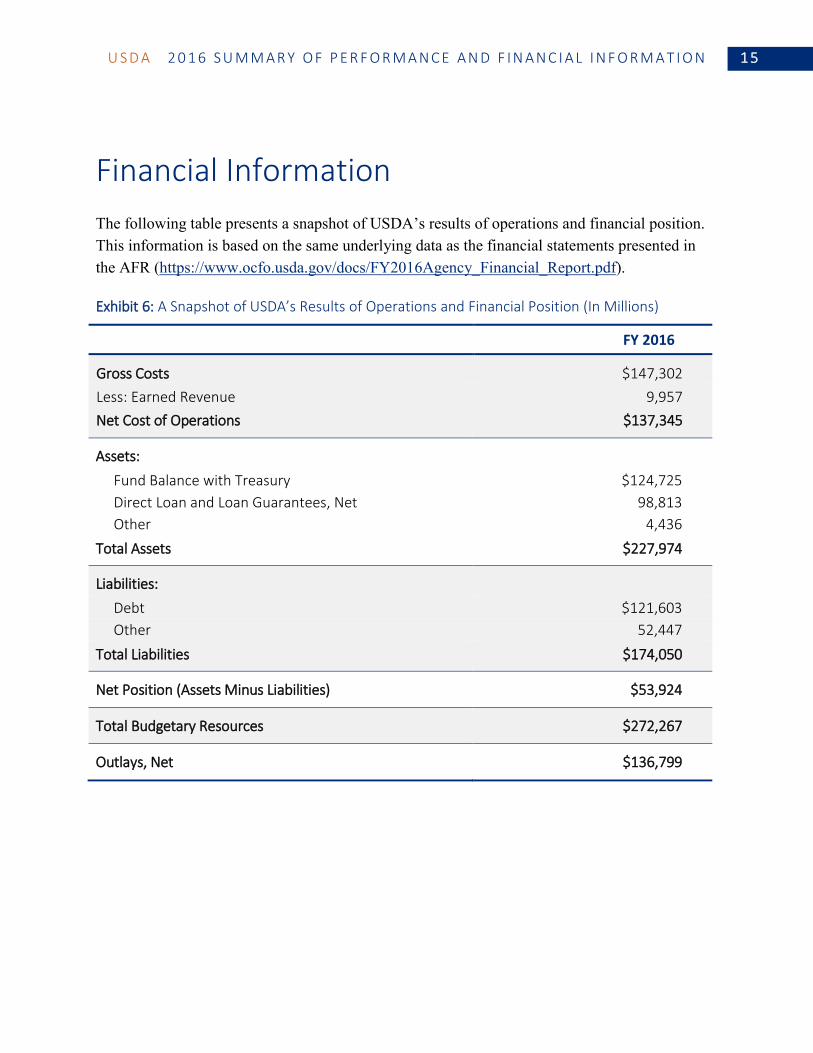
Financial Information The following table presents a snapshot of USDA’s results of operations and financial position. This information is based on the same underlying data as the financial statements presented in the AFR (https://www.ocfo.usda.gov/docs/FY2016Agency_Financial_Report.pdf).
Exhibit 6: A Snapshot of USDA’s Results of Operations and Financial Position (In Millions)
Line Item FY 2016
Gross Costs $147,302 Less: Earned Revenue 9,957 Net Cost of Operations $137,345
Assets: Fund Balance with Treasury $124,725 Direct Loan and Loan Guarantees, Net 98,813 Other 4,436 Total Assets $227,974
Liabilities: Debt $121,603 Other 52,447
Total Liabilities $174,050
Net Position (Assets Minus Liabilities) $53,924
Total Budgetary Resources $272,267
Outlays, Net $136,799
1 6 U S D A 2 0 1 6 S U M M A R Y O F P E R F O R M A N C E A N D F I N A N C I A L I N F O R M A T I O N
Significant Management Challenges The Reports Consolidation Act of 2000 requires the USDA Office of Inspector General (OIG) to report annually on the most serious management challenges facing the Department.
On August 26, 2016, the OIG reported the following major management challenges. A detailed description of the challenges and assessment of the Department’s progress in addressing these challenges may be found in the FY 2016 AFR.
• USDA Needs to Improve Oversight and Accountability for its Programs.
• Information Technology Security Needs Continuing Improvement.
• USDA Needs to Strengthen Program Performance and Performance Measures.
• USDA Needs to Strengthen Controls Over Improper Payments and Financial Management.
• USDA Needs to Improve Outreach Efforts.
• Food Safety Inspections Need Improved Controls.
• Food and Nutrition Service (FNS) Needs to Strengthen Supplemental Nutrition Assistance Program (SNAP) Management Controls.