Embed Size (px)
Citation preview
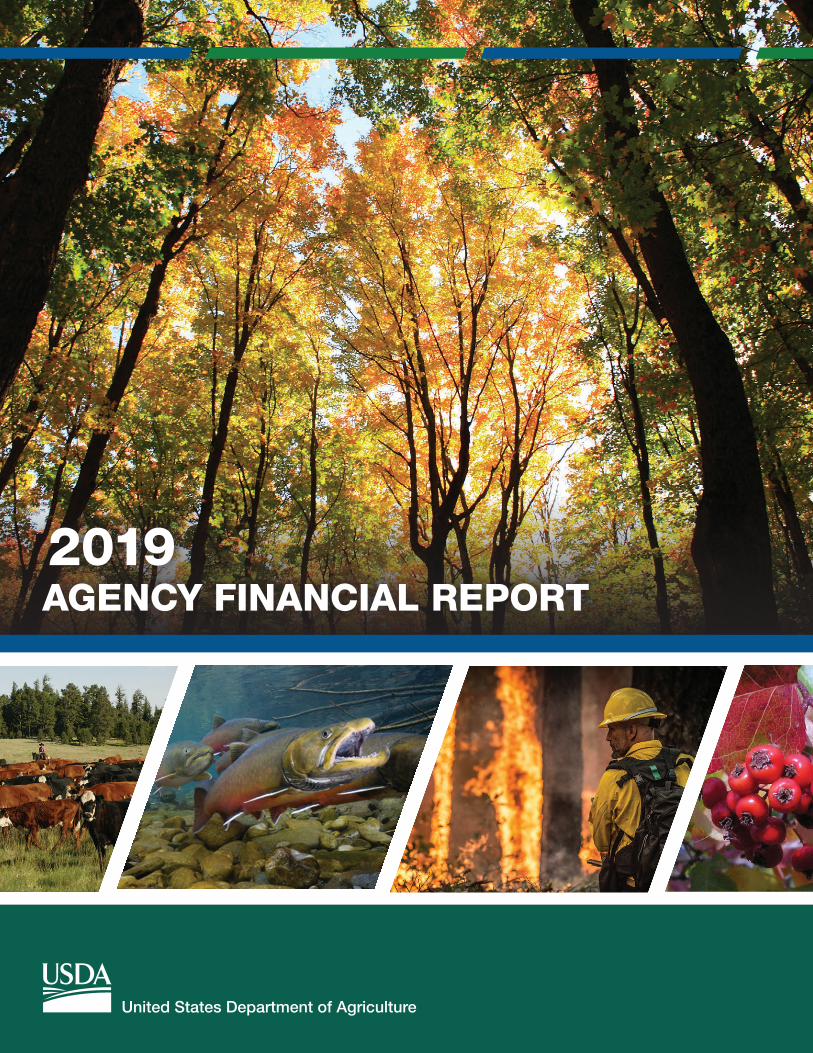
2019AGENCY FINANCIAL REPORT
United States Department of Agriculture
SECTION I | MANAGEMENT’S DISCUSSION AND ANALYSIS i
USDA’s Non-Discrimination Statement In accordance with Federal civil rights law and U.S. Department of Agriculture (USDA) civil rights regulations and policies, USDA, its Mission Areas, agencies, staff offices, employees, and institutions participating in or administering USDA programs are prohibited from discriminating based on race, color, national origin, religion, sex, gender identity (including gender expression), sexual orientation, disability, age, marital status, family/parental status, income derived from a public assistance program, political beliefs, or reprisal or retaliation for prior civil rights activity, in any program or activity conducted or funded by USDA (not all bases apply to all programs). Remedies and complaint filing deadlines vary by program or incident.
Program information may be made available in languages other than English. Persons with disabilities who require alternative means of communication to obtain program information (e.g., Braille, large print, audiotape, or American Sign Language) should contact the responsible Mission Area, agency, or staff office; the USDA TARGET Center at (202) 720-2600 (voice and TTY); or the Federal Relay Service at (800) 877-8339.
To file a program discrimination complaint, a complainant should complete a Form AD 3027, USDA Program Discrimination Complaint Form, which can be obtained online, from any USDA office, by calling (866) 632-9992, or by writing a letter addressed to USDA. The letter must contain the complainant’s name, address, telephone number, and a written description of the alleged discriminatory action in sufficient detail to inform the Assistant Secretary for Civil Rights (ASCR) about the nature and date of an alleged civil rights violation. The completed AD-3027 form or letter must be submitted to USDA by:
(1) Mail: U.S. Department of Agriculture Office of the Assistant Secretary for Civil Rights 1400 Independence Avenue, SW Washington, D.C. 20250-9410;
(2) Fax: (833) 256-1665 or (202) 690-7442; or
(3) Email: [email protected]
USDA is an equal opportunity provider, employer, and lender.
ii USDA AGENCY FINANCIAL REPORT | 2019
About the Report The purpose of the U.S. Department of Agriculture (USDA) fiscal year (FY) 2019 Agency Financial Report (AFR) is to inform Congress, the President, and the American people how USDA has used Federal resources entrusted to the Department in FY 2019. USDA strives to provide leadership on food, agriculture, natural resources, rural development, nutrition, and related issues based on public policy, the best available science, and effective management. USDA provides economic opportunity through innovation designed to ensure rural America thrives; promotes agriculture production to better nourish Americans while also helping to feed others throughout the world; and preserves our Nation’s natural resources through conservation, restored forests, improved watersheds, and healthy private working lands. USDA has demonstrated good stewardship of taxpayer resources by putting in place well-controlled and well-managed business lines and financial management systems and processes. USDA has chosen to produce both an AFR and an Annual Performance Report (APR) for FY 2019. USDA will include its FY 2019 APR with its Congressional Budget Justification and will post this AFR online at www.usda.gov.
This AFR provides high-level financial and highlighted performance results with assessments of controls, a summary of challenges, and USDA stewardship information. The AFR enables the President, Congress, and the public to assess USDA accomplishments and understand its financial position. USDA’s end-of-fiscal-year financial position includes, but is not limited to, financial statements, notes to the financial statements, and a report of the independent auditors. The report satisfies the reporting requirements contained in the following laws and regulations:
▪ Chief Financial Officers Act of 1990;
▪ Federal Managers’ Financial Integrity Act of 1982;
▪ Federal Financial Management Improvement Act of 1996;
▪ Government Performance and Results Act (GPRA) of 1993;
▪ GPRA Modernization Act of 2010;
▪ Government Management Reform Act of 1994;
▪ Improper Payments Information Act of 2002;
▪ Improper Payments Elimination and Recovery Act of 2010;
▪ Improper Payments Elimination and Recovery Improvement Act of 2012 (IPERIA);
▪ Office of Management and Budget Circular A-123, Management’s Responsibility for Enterprise Risk Management and Internal Controls;
▪ Office of Management and Budget Circular A-136, Financial Reporting Requirements; and
▪ Reports Consolidation Act of 2000.
SECTION I | MANAGEMENT’S DISCUSSION AND ANALYSIS iii
The AFR is a detailed report on USDA’s progress toward achieving the goals and objectives described in the Agency’s Strategic Plan and Annual Performance Plan, including progress on the strategic objectives, performance goals, and Agency Priority Goals. The report will be delivered to Congress with the annual budget submission.
This report is to be posted on these Web sites: Performance.gov and www.usda.gov.
iv USDA AGENCY FINANCIAL REPORT | 2019
Table of Contents MESSAGE FROM SECRETARY PERDUE ................................................................................................... v
SECTION I: MANAGEMENT’S DISCUSSION AND ANALYSIS ...................................................................... 1 About USDA ........................................................................................................................................................... 1 USDA Organization Chart ....................................................................................................................................... 3 USDA Mission Areas............................................................................................................................................... 4 USDA Program Performance ................................................................................................................................. 7 Future Demands, Risks, Uncertainties, Events, Conditions, and Trends ............................................................. 15 Financial Statement Highlights ............................................................................................................................ 16 Statement of Assurance ...................................................................................................................................... 26 Federal Managers’ Financial Integrity Act Report on Management Control ...................................................... 27 Compliance with Laws and Regulations ............................................................................................................... 34 Improper Payments Elimination and Recovery Act of 2010 as Amended ........................................................... 39 Federal Financial Management Improvement Act Report on Financial Management Systems Background ...... 40 Financial Management Systems Strategy ............................................................................................................ 42 Other Management Information, Initiatives, and Issues ..................................................................................... 47
SECTION II: FINANCIAL INFORMATION ................................................................................................. 50 Message from the Office of the Chief Financial Officer ....................................................................................... 50 Independent Auditors Report .............................................................................................................................. 52 Agency Response to Auditors Report .................................................................................................................. 61 Financial Statements ........................................................................................................................................... 62 Notes to the Financial Statements....................................................................................................................... 67 Required Supplementary Stewardship Information .......................................................................................... 148 Required Supplementary Information ............................................................................................................... 159
SECTION III: OTHER INFORMATION .................................................................................................... 164 Response to Management Challenges .............................................................................................................. 164 Summary of Financial Statement Audit and Management Assurances ............................................................ 174 Payment Integrity .............................................................................................................................................. 176 Fraud Reduction Report .................................................................................................................................... 230 Inspector General Act Amendments of 1988: Management’s Report on Audit Follow Up .............................. 234 Reduce the Footprint ......................................................................................................................................... 247 Civil Monetary Penalties .................................................................................................................................... 248
ABBREVIATIONS—ACRONYMS ........................................................................................................... 262
SECTION I | MANAGEMENT’S DISCUSSION AND ANALYSIS v
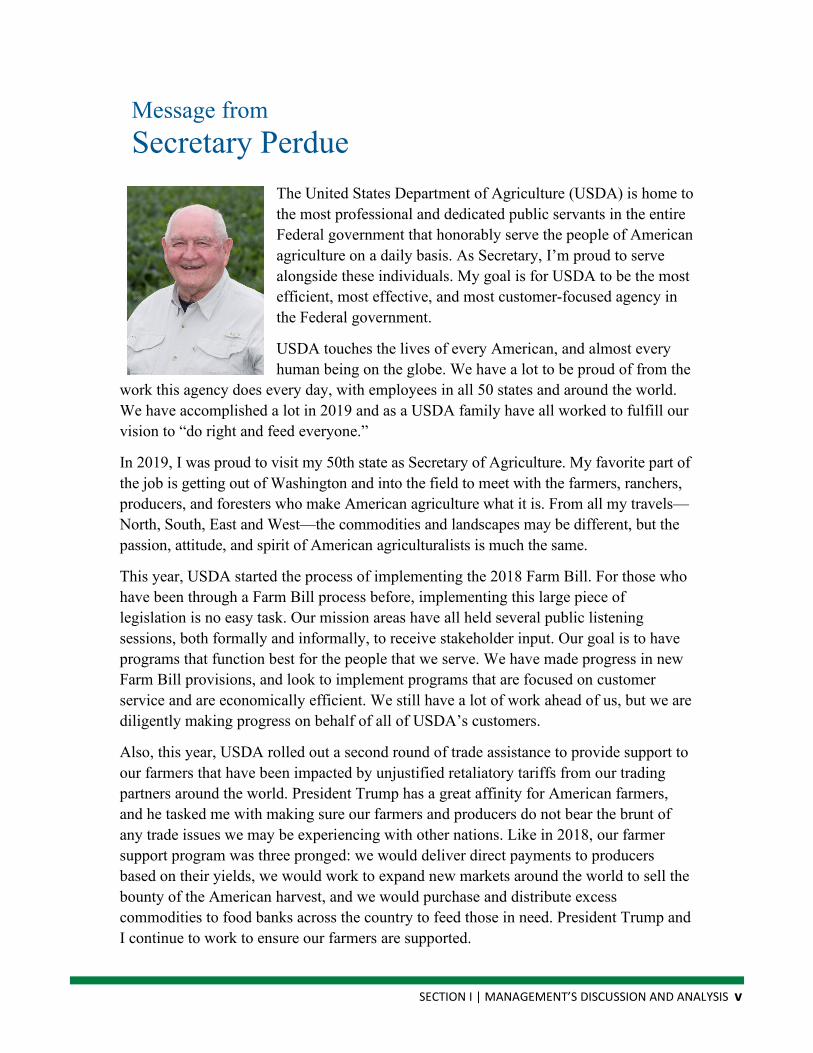
Message from Secretary Perdue
The United States Department of Agriculture (USDA) is home to the most professional and dedicated public servants in the entire Federal government that honorably serve the people of American agriculture on a daily basis. As Secretary, I’m proud to serve alongside these individuals. My goal is for USDA to be the most efficient, most effective, and most customer-focused agency in the Federal government.
USDA touches the lives of every American, and almost every human being on the globe. We have a lot to be proud of from the
work this agency does every day, with employees in all 50 states and around the world. We have accomplished a lot in 2019 and as a USDA family have all worked to fulfill our vision to “do right and feed everyone.”
In 2019, I was proud to visit my 50th state as Secretary of Agriculture. My favorite part of the job is getting out of Washington and into the field to meet with the farmers, ranchers, producers, and foresters who make American agriculture what it is. From all my travels—North, South, East and West—the commodities and landscapes may be different, but the passion, attitude, and spirit of American agriculturalists is much the same.
This year, USDA started the process of implementing the 2018 Farm Bill. For those who have been through a Farm Bill process before, implementing this large piece of legislation is no easy task. Our mission areas have all held several public listening sessions, both formally and informally, to receive stakeholder input. Our goal is to have programs that function best for the people that we serve. We have made progress in new Farm Bill provisions, and look to implement programs that are focused on customer service and are economically efficient. We still have a lot of work ahead of us, but we are diligently making progress on behalf of all of USDA’s customers.
Also, this year, USDA rolled out a second round of trade assistance to provide support to our farmers that have been impacted by unjustified retaliatory tariffs from our trading partners around the world. President Trump has a great affinity for American farmers, and he tasked me with making sure our farmers and producers do not bear the brunt of any trade issues we may be experiencing with other nations. Like in 2018, our farmer support program was three pronged: we would deliver direct payments to producers based on their yields, we would work to expand new markets around the world to sell the bounty of the American harvest, and we would purchase and distribute excess commodities to food banks across the country to feed those in need. President Trump and I continue to work to ensure our farmers are supported.
vi USDA AGENCY FINANCIAL REPORT | 2019
As we look forward to 2020, USDA will continue to be facts-based and data-focused as we work every day to best serve our customers, both producers and consumers. Making sure Americans who earn their livelihood in the agriculture industry are thriving is near and dear to my heart. USDA will continue to be unapologetic advocates for American agriculture and work tirelessly to solve the issues facing farm families. The farmers, ranchers, producers, and foresters are the heart of this country and they deserve the best we have to offer. I know that is what they receive from our USDA family.
Sincerely,
Sonny Perdue U.S. Secretary of Agriculture
November 19, 2019
SECTION I | MANAGEMENT’S DISCUSSION AND ANALYSIS 1
Section I
Management’s Discussion and Analysis
About USDA On May 15, 1862, President Abraham Lincoln signed legislation to establish the United States Department of Agriculture (USDA), and, two and a half years later in his final message to Congress, Lincoln called USDA “The People’s Department.” Through our work on food, agriculture, economic development, science, natural resource conservation, and other issues, USDA has impacted the lives of generations of Americans.
We would like you to learn more about USDA and the Agencies and Offices that touch every American every day. Information about the Department, our history, and our leaders can be found at www.usda.gov.
MISSION STATEMENT Provide leadership on agriculture, food, natural resources, rural infrastructure, nutrition, and related issues through fact-based, data-driven, and customer-focused decisions.
VISION STATEMENT “Do right and feed everyone.”
CORE VALUES We expect and require complete honesty and integrity in all we do.
We make commitments with care and live up to them.
We own up to problems and are always responsive.
We provide service to our customers on time, every time.
We guard, conserve, and preserve USDA resources the taxpayers have entrusted to us.
2 USDA AGENCY FINANCIAL REPORT | 2019
STAKEHOLDER ENGAGEMENT USDA regularly consults with external stakeholders, including State and local officials and Members of Congress, as well as USDA’s customers, partners, landowners, policy experts, and industry and consumer groups regarding our programs’ effectiveness. Recent examples include the Interagency Task Force on Agriculture and Rural Prosperity Roundtables and the Back to Our Roots Listening Tour. These consultations have been used to validate the strategic goals, objectives, and performance measures outlined in the USDA Strategic Plan.
SECTION I | MANAGEMENT’S DISCUSSION AND ANALYSIS 3
-
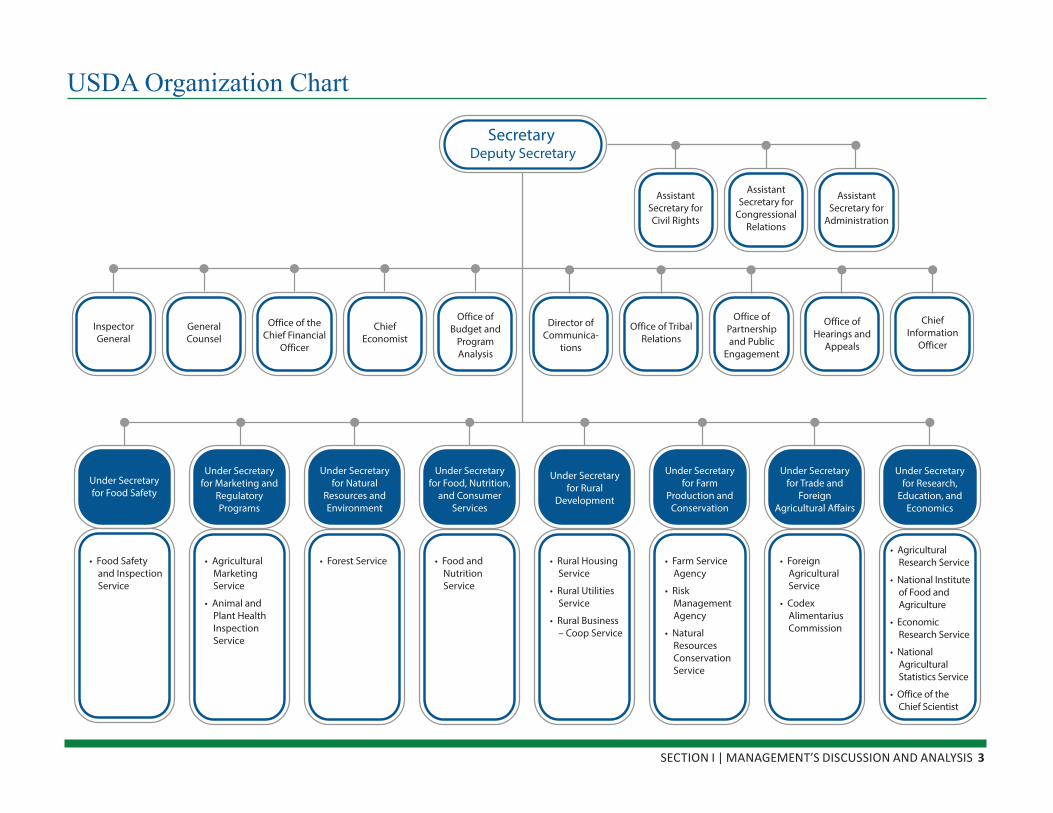
USDA Organization Chart
Secretary Deputy Secretary
Assistant Secretary for Civil Rights
Assistant Secretary for
Congressional Relations
Assistant Secretary for
Administration
Inspector General
General Counsel
Office of the Chief Financial
Officer
Chief Economist
Office of Budget and
Program Analysis
Director of Communica
tions
Office of Tribal Relations
Office of Partnership and Public
Engagement
Office of Hearings and
Appeals
Chief Information
Officer
Under Secretary for Food Safety
• Food Safety and Inspection Service
Under Secretary for Marketing and
Regulatory Programs
• Agricultural Marketing Service
• Animal and Plant Health Inspection Service
Under Secretary for Natural
Resources and Environment
• Forest Service
Under Secretary for Food, Nutrition,
and Consumer Services
• Food and Nutrition Service
Under Secretary for Rural
Development
• Rural Housing Service
• Rural Utilities Service
• Rural Business – Coop Service
Under Secretary for Farm
Production and Conservation
• Farm Service Agency
• Risk Management Agency
• Natural Resources Conservation Service
Under Secretary for Trade and
Foreign Agricultural Affairs
• Foreign Agricultural Service
• Codex Alimentarius Commission
Under Secretary for Research,
Education, and Economics
• Agricultural Research Service
• National Institute of Food and Agriculture
• Economic Research Service
• National Agricultural Statistics Service
• Office of the Chief Scientist

4 USDA AGENCY FINANCIAL REPORT | 2019
USDA Mission Areas
FARM PRODUCTION AND CONSERVATION Farm Production and Conservation (FPAC) is the Department’s focal point for the Nation’s farmers and ranchers and other stewards of private agricultural lands and non-industrial private forest lands. FPAC agencies implement programs designed to mitigate the significant risks of farming through crop insurance, conservation programs, farm safety net programs, lending, and disaster programs.
▪ Farm Service Agency (FSA)
▪ Natural Resources Conservation Service (NRCS)
▪ Risk Management Agency (RMA)
FOOD, NUTRITION, AND CONSUMER SERVICES Food, Nutrition, and Consumer Services works to harness the Nation’s agricultural abundance to end hunger and improve health in the United States. Its operating agency, the Food and Nutrition Service, administers federal domestic nutrition assistance programs and includes the Center for Nutrition Policy and Promotion, which links scientific research to the nutrition needs of consumers through science-based dietary guidance, nutrition policy coordination, and nutrition education.
▪ Food and Nutrition Service (FNS)
FOOD SAFETY Food Safety is the USDA public health agency responsible for protecting the public’s health by ensuring the safety of the Nation’s commercial supply of meat, poultry, and processed egg products. FSIS ensures food safety through the authorities of the Federal Meat Inspection Act (FMIA), the Poultry Products Inspection Act, and the Egg Products Inspection Act, as well as humane animal handling through the Humane Methods of Slaughter Act.
▪ Food Safety and Inspection Service (FSIS)
SECTION I | MANAGEMENT’S DISCUSSION AND ANALYSIS 5
MARKETING AND REGULATORY PROGRAMS Marketing and Regulatory Programs (MRP) facilitates domestic and international marketing of U.S. agricultural products, protects U.S. plant and animal health, regulates genetically engineered organisms, administers the Animal Welfare Act, and carries out wildlife damage management activities. MRP agencies are active participants in setting national and international standards.
▪ Agricultural Marketing Service (AMS)
▪ Animal and Plant Health Inspection Service (APHIS)
NATURAL RESOURCES AND ENVIRONMENT The mission of the Natural Resources and Environment is to sustain the health, diversity, and productivity of the Nation’s forests and grasslands to meet the needs of present and future generations.
▪ Forest Service (FS)
RESEARCH, EDUCATION, AND ECONOMICS Research, Education, and Economics is dedicated to the creation of a safe, sustainable, competitive U.S. food, fuel, and fiber system, and to building strong communities, families, and youth through integrated research, analysis, and education.
▪ Agricultural Research Service (ARS)
▪ Economic Research Service (ERS)
▪ National Agricultural Statistics Service (NASS)
▪ National Institute of Food and Agriculture (NIFA)
RURAL DEVELOPMENT Rural Development fosters opportunity and economic security in rural America by investing in infrastructure, opening doors to better jobs, access to innovation, technology, and the promise of rural prosperity. The mission area is a catalyst for rural prosperity by improving high-speed internet access; providing affordable rural housing; connecting rural skill sets to jobs of the future; modernizing roads, bridges, and water systems; and ensuring communities have access to health care. Through loans, grants, and partnerships with local leaders, Rural Development provides tools and resources that ensure rural families, businesses, and communities have the help they need to prosper today and in the future.
▪ Rural Business Service
▪ Rural Utilities Service
▪ Rural Housing Service
6 USDA AGENCY FINANCIAL REPORT | 2019
TRADE AND FOREIGN AGRICULTURAL AFFAIRS Trade and Foreign Agricultural Affairs’ (TFAA) role is to provide our farmers and ranchers with opportunities to compete in the global marketplace. TFAA is the Department’s lead on trade policy with the primary responsibility of ensuring USDA speaks with a unified voice on international agricultural issues domestically and abroad. Within TFAA, the Foreign Agricultural Service is the lead U.S. agency tasked with promoting exports of U.S. agricultural products through market intelligence, trade policy, trade capacity building, and trade promotion programs. This work is carried out by staff in Washington, as well as a global network of 93 offices covering 171 countries. Also, within TFAA, the U.S. Codex Office coordinates U.S. participation in the Codex Alimentarius Commission, a United Nations body that sets international food standards while protecting consumer health and ensuring fair trade practices.
▪ Foreign Agricultural Service
▪ U.S. Codex Program
SECTION I | MANAGEMENT’S DISCUSSION AND ANALYSIS 7
USDA Program Performance
USDA PERFORMANCE AND RESULTS FOR FY 2019 The U.S. Department of Agriculture’s (USDA) mission is to provide leadership on food, agriculture, natural resources, rural development, nutrition, and related issues based on sound public policy, the best available science, and efficient management.
For purposes of the Agency Financial Report (AFR), a performance summary is provided using the Department’s key performance indicators as a mechanism to gauge progress in achieving its mission. In fiscal year (FY) 2019, USDA had 34 key performance measures.
The following tables and discussion provide a high-level description of the Department’s key focus areas that are being tracked and managed through USDA’s performance management process. The tables provide historical results of key performance indicators and include FY 2019 preliminary results indicating anticipation in meeting/not meeting performance targets.
Final performance information and a detailed discussion of the Department’s FY 2019 performance results, assessment methodologies, metrics, external reviews, and documentation of performance data will be presented in the FY 2019 USDA Annual Performance Report. The report is planned to be released with the President’s 2021 budget in February and will be available on the USDA Performance Improvement and Accountability website.
The data used by the Department to measure performance is collected using a standardized methodology. This methodology has been vetted by federally employed scientists and policymakers, and, ultimately, the leadership and Under Secretaries of each respective mission area. All attest to the completeness, reliability, and quality of the data.
8 USDA AGENCY FINANCIAL REPORT | 2019
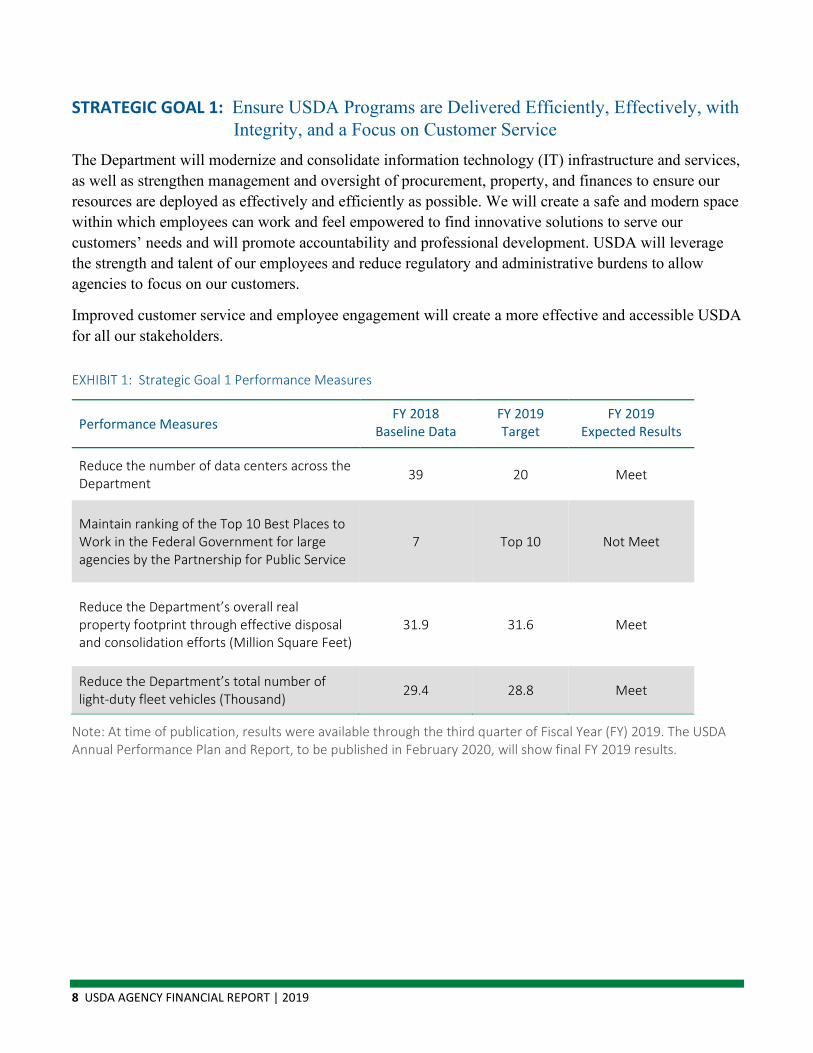
STRATEGIC GOAL 1: Ensure USDA Programs are Delivered Efficiently, Effectively, with Integrity, and a Focus on Customer Service
The Department will modernize and consolidate information technology (IT) infrastructure and services, as well as strengthen management and oversight of procurement, property, and finances to ensure our resources are deployed as effectively and efficiently as possible. We will create a safe and modern space within which employees can work and feel empowered to find innovative solutions to serve our customers’ needs and will promote accountability and professional development. USDA will leverage the strength and talent of our employees and reduce regulatory and administrative burdens to allow agencies to focus on our customers.
Improved customer service and employee engagement will create a more effective and accessible USDA for all our stakeholders.
EXHIBIT 1: Strategic Goal 1 Performance Measures
Performance Measures FY 2018
Baseline Data FY 2019 Target
FY 2019 Expected Results
Reduce the number of data centers across the Department 39 20 Meet
Maintain ranking of the Top 10 Best Places to Work in the Federal Government for large agencies by the Partnership for Public Service
7 Top 10 Not Meet
Reduce the Department’s overall real property footprint through effective disposal and consolidation efforts (Million Square Feet)
31.9 31.6 Meet
Reduce the Department’s total number of light-duty fleet vehicles (Thousand) 29.4 28.8 Meet
Note: At time of publication, results were available through the third quarter of Fiscal Year (FY) 2019. The USDA Annual Performance Plan and Report, to be published in February 2020, will show final FY 2019 results.
SECTION I | MANAGEMENT’S DISCUSSION AND ANALYSIS 9
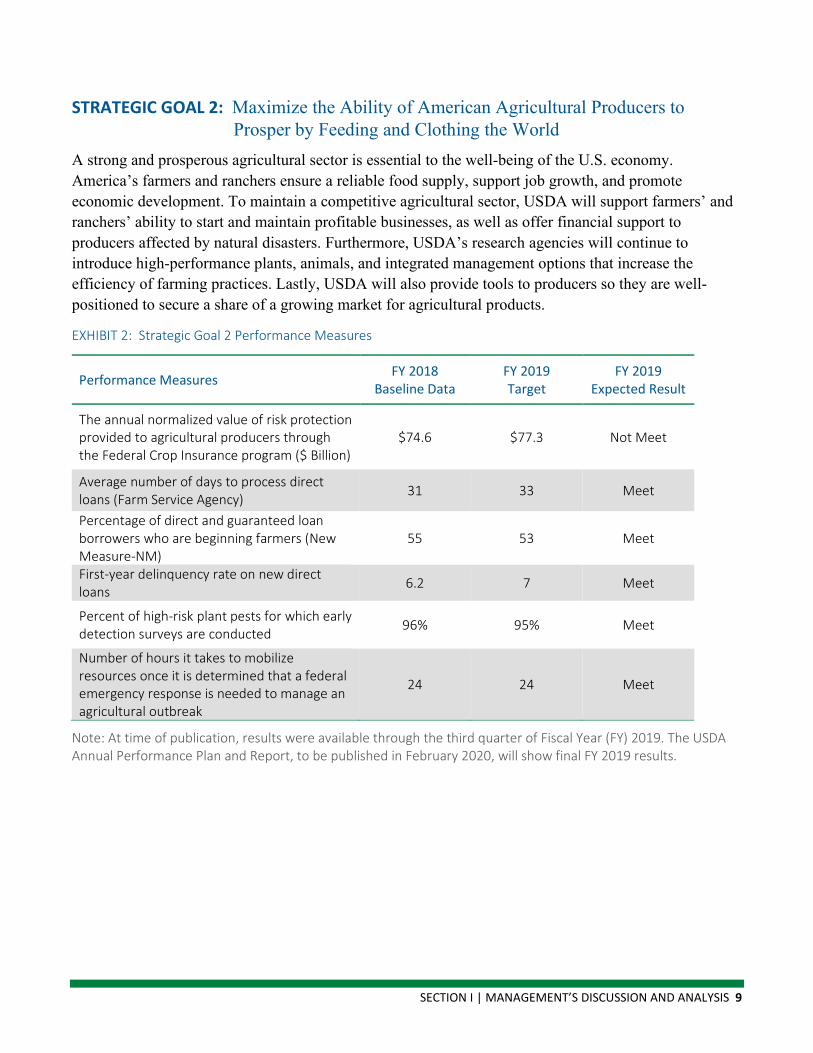
STRATEGIC GOAL 2: Maximize the Ability of American Agricultural Producers to Prosper by Feeding and Clothing the World
A strong and prosperous agricultural sector is essential to the well-being of the U.S. economy. America’s farmers and ranchers ensure a reliable food supply, support job growth, and promote economic development. To maintain a competitive agricultural sector, USDA will support farmers’ and ranchers’ ability to start and maintain profitable businesses, as well as offer financial support to producers affected by natural disasters. Furthermore, USDA’s research agencies will continue to introduce high-performance plants, animals, and integrated management options that increase the efficiency of farming practices. Lastly, USDA will also provide tools to producers so they are well-positioned to secure a share of a growing market for agricultural products.
EXHIBIT 2: Strategic Goal 2 Performance Measures
Performance Measures FY 2018 Baseline Data
FY 2019 Target
FY 2019 Expected Result
The annual normalized value of risk protection provided to agricultural producers through the Federal Crop Insurance program ($ Billion)
$74.6 $77.3 Not Meet
Average number of days to process direct loans (Farm Service Agency) 31 33 Meet
Percentage of direct and guaranteed loan borrowers who are beginning farmers (New Measure-NM)
55 53 Meet
First-year delinquency rate on new direct loans 6.2 7 Meet
Percent of high-risk plant pests for which early detection surveys are conducted 96% 95% Meet
Number of hours it takes to mobilize resources once it is determined that a federal emergency response is needed to manage an agricultural outbreak
24 24 Meet
Note: At time of publication, results were available through the third quarter of Fiscal Year (FY) 2019. The USDA Annual Performance Plan and Report, to be published in February 2020, will show final FY 2019 results.

10 USDA AGENCY FINANCIAL REPORT | 2019
STRATEGIC GOAL 3: Promote American Agricultural Products and Exports Expanding international marketing opportunities for U.S. farmers and exporters is critical to business and income growth across rural America. It is essential for USDA to continue its efforts to promote American agricultural products and exports through promotional activities, development of international standards, removal of trade barriers by monitoring and enforcing existing trade agreements, and negotiation of new trade agreements that benefit the U.S. agricultural economy. USDA will also partner with developing countries to move them along the agricultural market continuum from developing economies to developed economies with promising demand potential. Ultimately, this work will build the foundations for future markets and create long-term international relationships that advance U.S. agriculture’s exports.
EXHIBIT 3: Strategic Goal 3 Performance Measures
Performance Measures FY 2018 Baseline Data
FY 2019 Target
FY 2019 Expected Result
Value of agricultural exports resulting from participation in foreign food and agricultural trade shows ($ Billion)
$2.13 $1.75 Meet
Value of trade preserved through resolution of foreign market access issues such as U.S. export detainment, restrictive Secure Payment System (SPS) and Technical Barriers to Trade (TBT) issues, and trade regulations ($ Billion)
$12.8 $5.50 Not Meet1
Note: At time of publication, results were available through the third quarter of Fiscal Year (FY) 2019. The USDA Annual Performance Plan and Report, to be published in February 2020, will show final FY 2019 results.
1 FAS will not meet its target of $5.5B for FY 2019. Recent adverse effects of other countries’ tariff and non-tariff barriers are a significant challenge.

SECTION I | MANAGEMENT’S DISCUSSION AND ANALYSIS 11
STRATEGIC GOAL 4: Facilitate Rural Prosperity and Economic Development USDA promotes rural prosperity and economic development by financing investments in rural utilities, housing, and businesses. When rural Americans share the same level of infrastructure services as the country’s urban areas, rural communities can make even greater economic contributions with healthy businesses and families. Just as economic and social science research informs decision-makers regarding current trends in rural America and gaps in existing markets, USDA may then provide benefits to rural American businesses and citizens. USDA will leverage funds, stimulate private-public partnerships, and engage in collaboration to build rural infrastructure including the following: broadband, community facilities, safe and affordable housing, and health services and facilities. The Department will also provide capacity building to help underserved communities become thriving communities.
EXHIBIT 4: Strategic Goal 4 Performance Measures
Performance Measures FY 2018 Baseline Data
FY 2019 Target
FY 2019 Expected Result
Health Facilities: Percent of customers who are provided access to new and/or improved essential community facilities
5.0% 6.8% Not Meet
Number of borrowers’ subscribers receiving new and/or improved telecommunication services (Million, Noncumulative)
0.158 0.139 Meet
Percent of RD commercial/infrastructure investments that leverage non-federal funding (%)2
77% 78% Meet
Percent of RD assistance that went to distressed communities (%) 11% 12% Meet
Note: At time of publication, results were available through the third quarter of Fiscal Year (FY) 2019. The USDA Annual Performance Plan and Report, to be published in February 2020, will show final FY 2019 results.
2 New definition of Leverage for Rural Development: The total dollar amount of financial contributions from both the applicant and other non-federal sources contributed alongside an RD grant, loan, or guarantee during time of obligation. For guarantees, leverage includes the total dollar amount of the guaranteed loan.
12 USDA AGENCY FINANCIAL REPORT | 2019
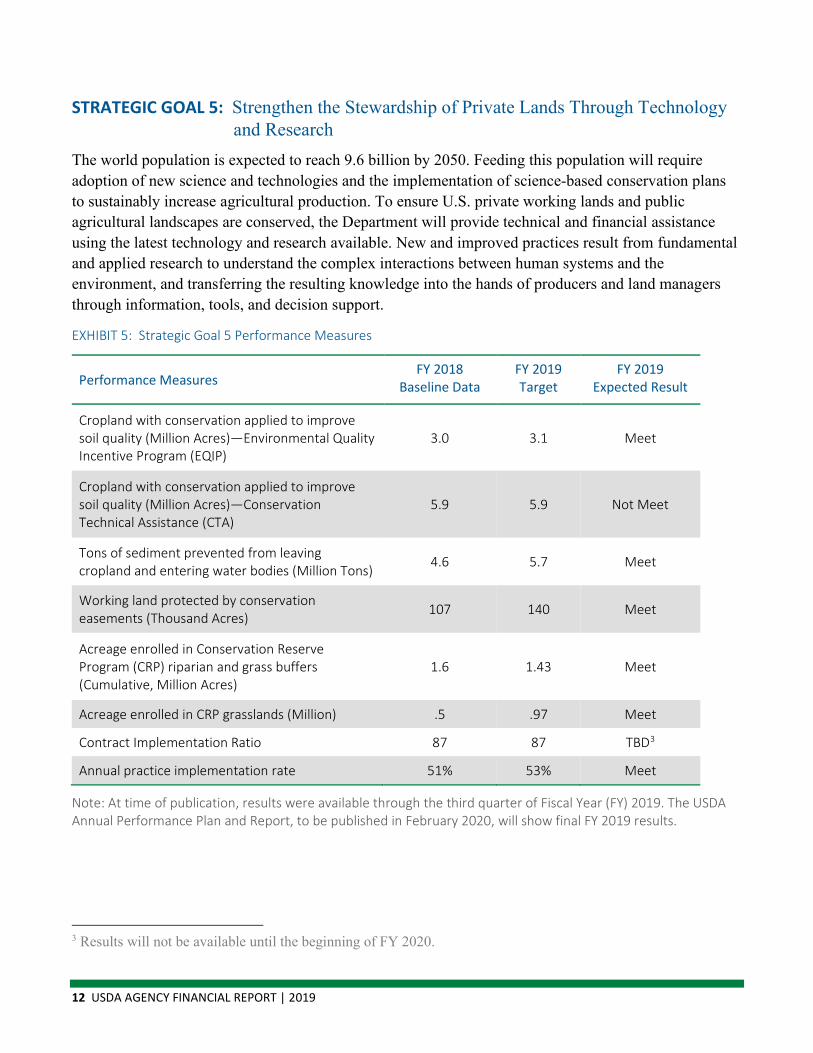
STRATEGIC GOAL 5: Strengthen the Stewardship of Private Lands Through Technology and Research
The world population is expected to reach 9.6 billion by 2050. Feeding this population will require adoption of new science and technologies and the implementation of science-based conservation plans to sustainably increase agricultural production. To ensure U.S. private working lands and public agricultural landscapes are conserved, the Department will provide technical and financial assistance using the latest technology and research available. New and improved practices result from fundamental and applied research to understand the complex interactions between human systems and the environment, and transferring the resulting knowledge into the hands of producers and land managers through information, tools, and decision support.
EXHIBIT 5: Strategic Goal 5 Performance Measures
Performance Measures FY 2018
Baseline Data FY 2019 Target
FY 2019 Expected Result
Cropland with conservation applied to improve soil quality (Million Acres)—Environmental Quality Incentive Program (EQIP)
3.0 3.1 Meet
Cropland with conservation applied to improve soil quality (Million Acres)—Conservation Technical Assistance (CTA)
5.9 5.9 Not Meet
Tons of sediment prevented from leaving cropland and entering water bodies (Million Tons) 4.6 5.7 Meet
Working land protected by conservation easements (Thousand Acres) 107 140 Meet
Acreage enrolled in Conservation Reserve Program (CRP) riparian and grass buffers (Cumulative, Million Acres)
1.6 1.43 Meet
Acreage enrolled in CRP grasslands (Million) .5 .97 Meet
Contract Implementation Ratio 87 87 TBD3
Annual practice implementation rate 51% 53% Meet
Note: At time of publication, results were available through the third quarter of Fiscal Year (FY) 2019. The USDA Annual Performance Plan and Report, to be published in February 2020, will show final FY 2019 results.
3 Results will not be available until the beginning of FY 2020.
SECTION I | MANAGEMENT’S DISCUSSION AND ANALYSIS 13
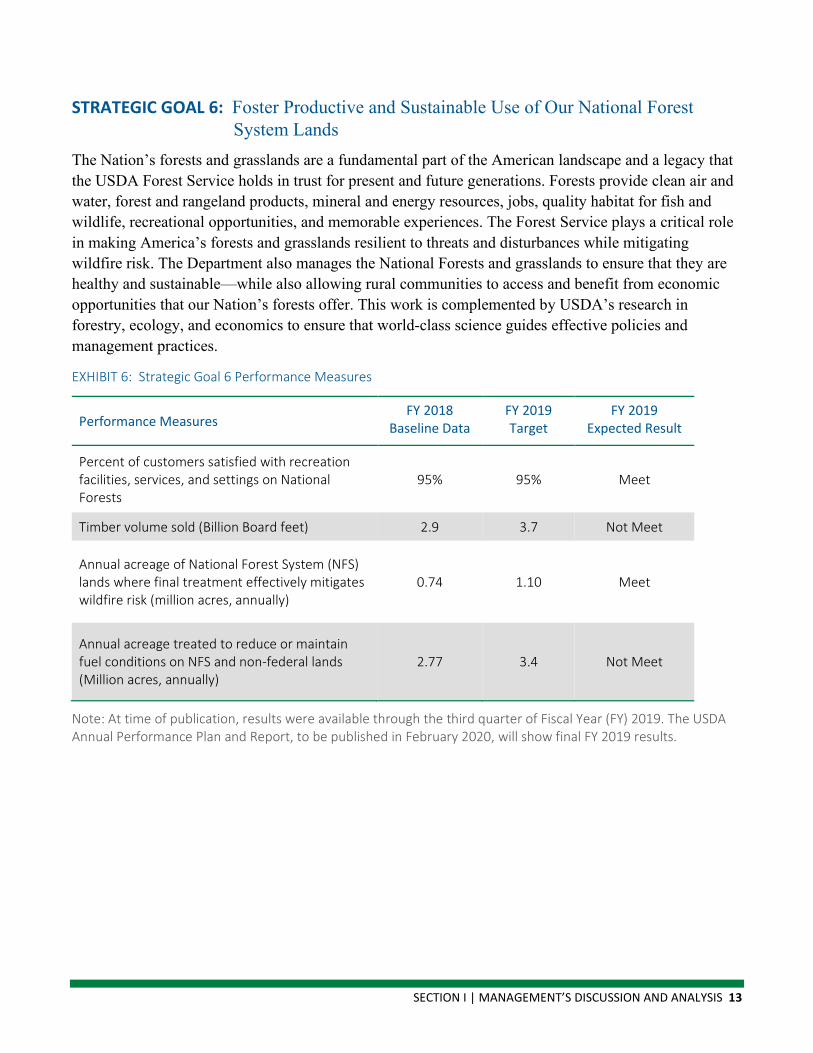
STRATEGIC GOAL 6: Foster Productive and Sustainable Use of Our National Forest System Lands
The Nation’s forests and grasslands are a fundamental part of the American landscape and a legacy that the USDA Forest Service holds in trust for present and future generations. Forests provide clean air and water, forest and rangeland products, mineral and energy resources, jobs, quality habitat for fish and wildlife, recreational opportunities, and memorable experiences. The Forest Service plays a critical role in making America’s forests and grasslands resilient to threats and disturbances while mitigating wildfire risk. The Department also manages the National Forests and grasslands to ensure that they are healthy and sustainable—while also allowing rural communities to access and benefit from economic opportunities that our Nation’s forests offer. This work is complemented by USDA’s research in forestry, ecology, and economics to ensure that world-class science guides effective policies and management practices.
EXHIBIT 6: Strategic Goal 6 Performance Measures
Performance Measures FY 2018
Baseline Data FY 2019 Target
FY 2019 Expected Result
Percent of customers satisfied with recreation facilities, services, and settings on National Forests
95% 95% Meet
Timber volume sold (Billion Board feet) 2.9 3.7 Not Meet
Annual acreage of National Forest System (NFS) lands where final treatment effectively mitigates wildfire risk (million acres, annually)
0.74 1.10 Meet
Annual acreage treated to reduce or maintain fuel conditions on NFS and non-federal lands (Million acres, annually)
2.77 3.4 Not Meet
Note: At time of publication, results were available through the third quarter of Fiscal Year (FY) 2019. The USDA Annual Performance Plan and Report, to be published in February 2020, will show final FY 2019 results.
14 USDA AGENCY FINANCIAL REPORT | 2019
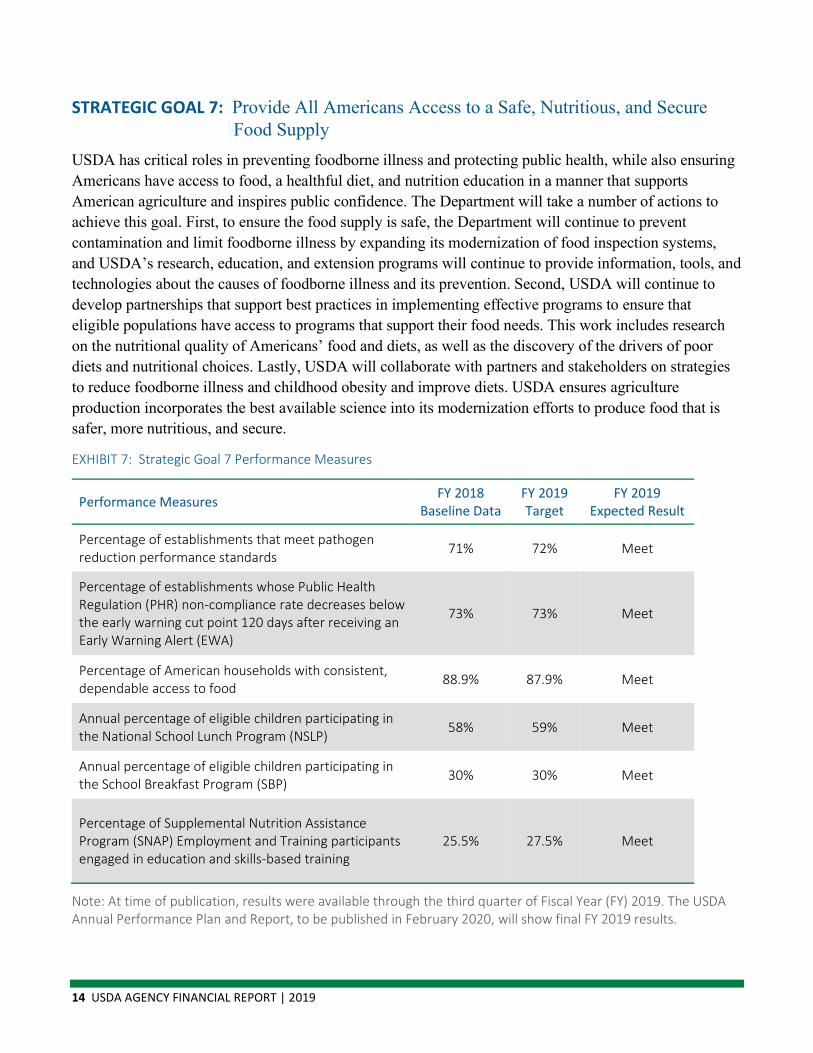
STRATEGIC GOAL 7: Provide All Americans Access to a Safe, Nutritious, and Secure Food Supply
USDA has critical roles in preventing foodborne illness and protecting public health, while also ensuring Americans have access to food, a healthful diet, and nutrition education in a manner that supports American agriculture and inspires public confidence. The Department will take a number of actions to achieve this goal. First, to ensure the food supply is safe, the Department will continue to prevent contamination and limit foodborne illness by expanding its modernization of food inspection systems, and USDA’s research, education, and extension programs will continue to provide information, tools, and technologies about the causes of foodborne illness and its prevention. Second, USDA will continue to develop partnerships that support best practices in implementing effective programs to ensure that eligible populations have access to programs that support their food needs. This work includes research on the nutritional quality of Americans’ food and diets, as well as the discovery of the drivers of poor diets and nutritional choices. Lastly, USDA will collaborate with partners and stakeholders on strategies to reduce foodborne illness and childhood obesity and improve diets. USDA ensures agriculture production incorporates the best available science into its modernization efforts to produce food that is safer, more nutritious, and secure.
EXHIBIT 7: Strategic Goal 7 Performance Measures
Performance Measures FY 2018 Baseline Data
FY 2019 Target
FY 2019 Expected Result
Percentage of establishments that meet pathogen reduction performance standards 71% 72% Meet
Percentage of establishments whose Public Health Regulation (PHR) non-compliance rate decreases below the early warning cut point 120 days after receiving an Early Warning Alert (EWA)
73% 73% Meet
Percentage of American households with consistent, dependable access to food 88.9% 87.9% Meet
Annual percentage of eligible children participating in the National School Lunch Program (NSLP) 58% 59% Meet
Annual percentage of eligible children participating in the School Breakfast Program (SBP) 30% 30% Meet
Percentage of Supplemental Nutrition Assistance Program (SNAP) Employment and Training participants engaged in education and skills-based training
25.5% 27.5% Meet
Note: At time of publication, results were available through the third quarter of Fiscal Year (FY) 2019. The USDA Annual Performance Plan and Report, to be published in February 2020, will show final FY 2019 results.

SECTION I | MANAGEMENT’S DISCUSSION AND ANALYSIS 15
Future Demands, Risks, Uncertainties, Events, Conditions, and Trends Farmers and ranchers operate in highly competitive markets, both domestically and internationally. Rapid shifts in consumer demands associated with quality, convenience, taste, and nutrition dictate that farming, ranching, and marketing infrastructures become more fluid and responsive. National security is a significant, ongoing priority for USDA. The Department’s science research, education, and extension services will continue to be the foundation for understanding developments and making advances in solving agricultural and societal challenges. USDA is working with the U.S. Department of Homeland Security to help protect agriculture from intentional and accidental acts that might impact America’s food supply or natural resources.
EXTERNAL FACTORS THAT CHALLENGE USDA’S ABILITY TO ACHIEVE ITS GOALS INCLUDE THE FOLLOWING:
▪ Weather-related hardships, including disasters related to the increasing intensity and duration of extreme weather and climate change, both domestically and internationally;
▪ The risk of catastrophic fire, depending on weather, drought conditions, and the expanding number of communities in the wildland-urban interface;
▪ Non-weather-related hardships and other uncontrollable events, both domestically and internationally;
▪ Domestic and international macroeconomic factors, including consumer purchasing power, the strength of the U.S. dollar, and political changes abroad that could impact domestic and global markets greatly at any time;
▪ Sharp fluctuations in farm prices, interest rates, and unemployment that could impact the ability of farmers, other rural residents, communities, and businesses to qualify for credit and manage debt;
▪ The impact of future economic conditions and actions by a variety of Federal, State, and local Governments that could influence the sustainability of rural infrastructure;
▪ The increased movement of people and goods, which provides the opportunity for crop and animal pests and diseases to move quickly across domestic and international boundaries;
▪ Potential exposure to hazardous substances, which may threaten human health as well as the environment; and
▪ The ability of the public and private sectors to collaborate effectively on food safety, security, and related emergency preparedness efforts.

16 USDA AGENCY FINANCIAL REPORT | 2019
Financial Statement Highlights
CONSOLIDATED BALANCE SHEETS
Total Assets Total assets for FY 2019 were $265,095 million, compared to $238,774 million for FY 2018, an increase of $26,321 million, or 11 percent. The following exhibit presents FY 2019 total assets.
EXHIBIT 8: Total Assets ($ millions)
58%
39%
1% 1% 1%
Fund Balance with Treasury - $153,468
Direct Loan and Loan Guarantees, Net - $104,255
General Property, Plant and Equipment, Net - $2,249
Accounts Receivable, Net - $3,914
Other - $1,209
Direct Loan and Loan Guarantees, Net, is one of the largest assets on the USDA Balance Sheet. RD offers both direct and guaranteed loan products for rural housing and rural business infrastructure. These products represent 86 percent of the total Department loan programs. Loan programs administered by FSA represent 11 percent of the total. FSA supports farmers who are temporarily unable to obtain private, commercial credit. The remaining 2 percent represents commodity loans and credit programs administered by the CCC. These loans are used to improve economic stability and provide an adequate supply of agricultural commodities. CCC credit programs provide international food assistance, expand international markets, and provide domestic low cost financing to protect farm income and prices. The following exhibit presents significant changes in total assets.

SECTION I | MANAGEMENT’S DISCUSSION AND ANALYSIS 17
The following exhibit presents significant changes in total assets.
EXHIBIT 9: Significant Changes in Assets ($ millions)
$2,308 $2,722
$21,118
$0
$2,000
$4,000
$6,000
$8,000
$10,000
$12,000
$14,000
$16,000
$18,000
$20,000Direct Loan and Loan Guarantees, Net Accounts Receivable, Net Fund Balance with Treasury
Increase in Direct Loan and Loan Guarantees, Net mainly due to RD loans receivable outstanding, loans acquired and subsidy cost; and new loans issued by FSA.
Increase in Accounts Receivable, Net mainly due to RMA deferring collection of any unpaid producer premium without interest by two months, as a result of the widespread severe flooding and excess moisture conditions in many parts of the nation, which caused catastrophic crop damage.
Increase in Fund Balance with Treasury mainly due to AMS custom receipts received from the Department of Homeland Security, and unobligated balance brought forward for Section 32; RD repaid less debt for the Rural Electric and Telephone Financing Account, Rural Housing Insurance Fund, and Single Family Housing Liquidating programs resulting in higher cash balances; FSA received additional appropriations for the Wildfires and Hurricanes Indemnity, Emergency Conservation, and Emergency Forest Restoration programs due to natural disasters; NRCS carryover of funding for the Watershed and Flood Prevention Operations account to mitigate damage caused by hurricanes, wildfires, and other natural disasters; and additional supplemental appropriations received for the Disaster Relief Act and reduced fire-related activity at Forest Service.
18 USDA AGENCY FINANCIAL REPORT | 2019
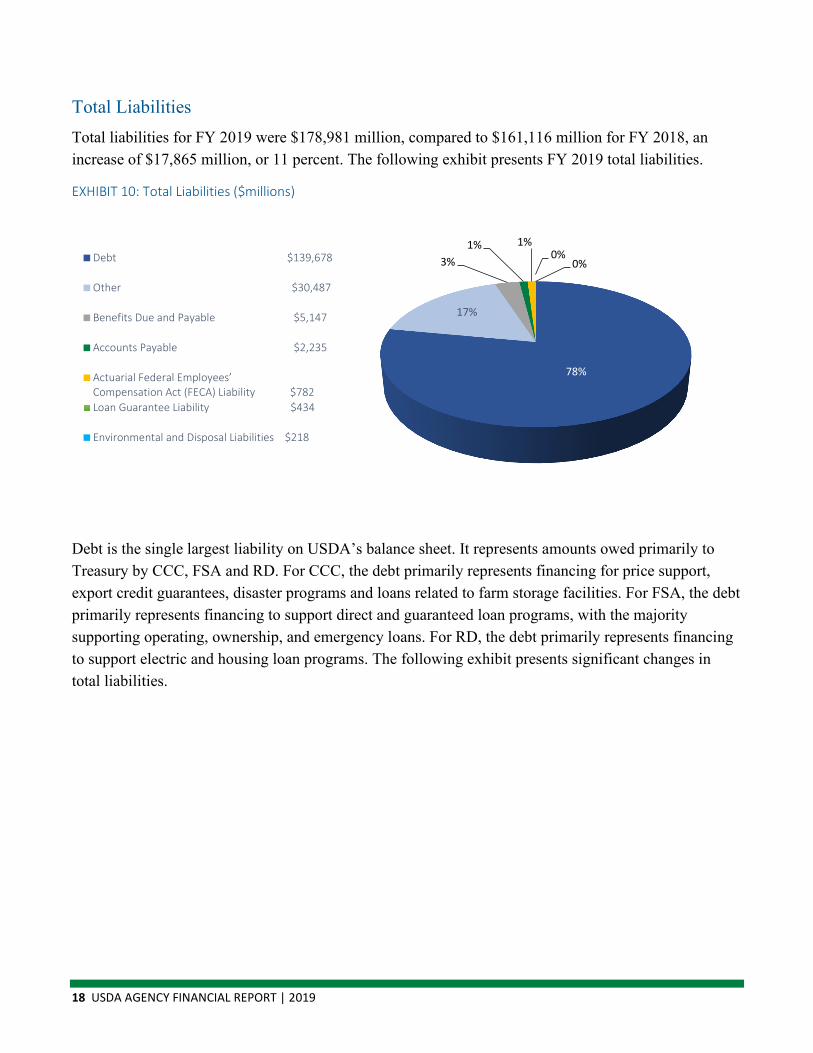
Total Liabilities Total liabilities for FY 2019 were $178,981 million, compared to $161,116 million for FY 2018, an increase of $17,865 million, or 11 percent. The following exhibit presents FY 2019 total liabilities.
EXHIBIT 10: Total Liabilities ($millions)
78%
17%
3%1% 1%
0%0%Debt $139,678
Other $30,487
Benefits Due and Payable $5,147
Accounts Payable $2,235
Actuarial Federal Employees’ Compensation Act (FECA) Liability $782 Loan Guarantee Liability $434
Environmental and Disposal Liabilities $218
Debt is the single largest liability on USDA’s balance sheet. It represents amounts owed primarily to Treasury by CCC, FSA and RD. For CCC, the debt primarily represents financing for price support, export credit guarantees, disaster programs and loans related to farm storage facilities. For FSA, the debt primarily represents financing to support direct and guaranteed loan programs, with the majority supporting operating, ownership, and emergency loans. For RD, the debt primarily represents financing to support electric and housing loan programs. The following exhibit presents significant changes in total liabilities.
SECTION I | MANAGEMENT’S DISCUSSION AND ANALYSIS 19
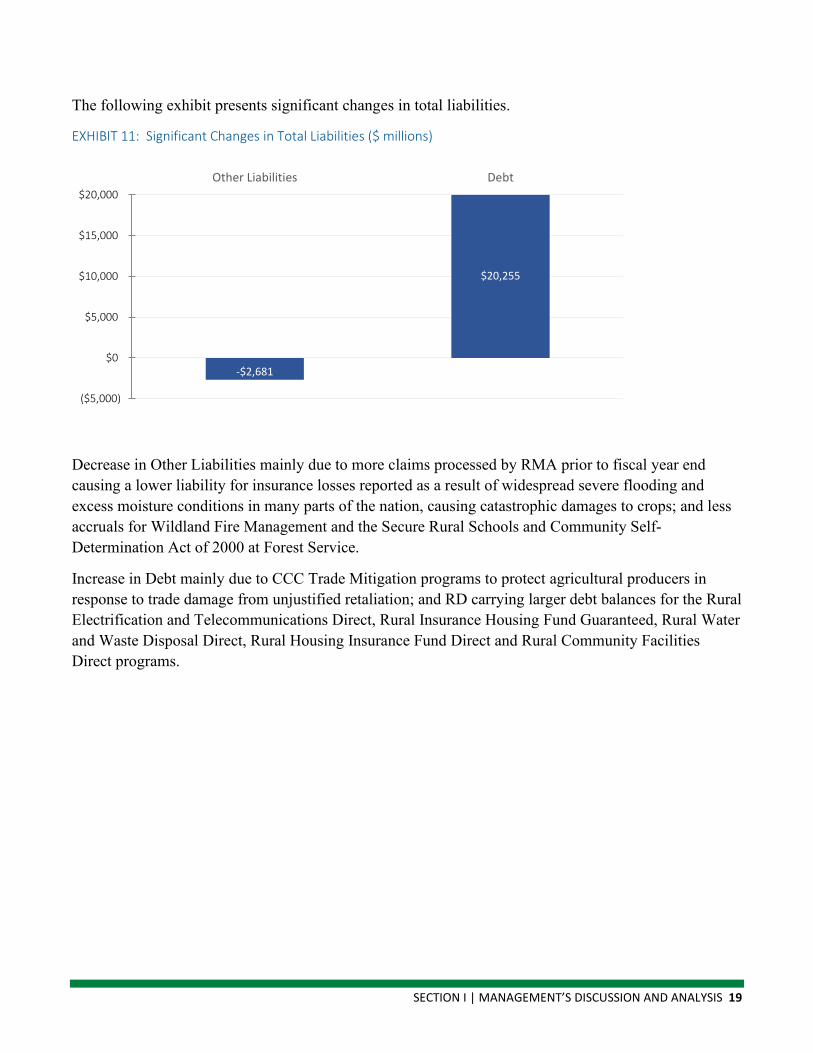
The following exhibit presents significant changes in total liabilities.
EXHIBIT 11: Significant Changes in Total Liabilities ($ millions)
-$2,681
$20,255
($5,000)
$0
$5,000
$10,000
$15,000
$20,000Other Liabilities Debt
Decrease in Other Liabilities mainly due to more claims processed by RMA prior to fiscal year end causing a lower liability for insurance losses reported as a result of widespread severe flooding and excess moisture conditions in many parts of the nation, causing catastrophic damages to crops; and less accruals for Wildland Fire Management and the Secure Rural Schools and Community Self-Determination Act of 2000 at Forest Service.
Increase in Debt mainly due to CCC Trade Mitigation programs to protect agricultural producers in response to trade damage from unjustified retaliation; and RD carrying larger debt balances for the Rural Electrification and Telecommunications Direct, Rural Insurance Housing Fund Guaranteed, Rural Water and Waste Disposal Direct, Rural Housing Insurance Fund Direct and Rural Community Facilities Direct programs.
20 USDA AGENCY FINANCIAL REPORT | 2019
CONSOLIDATED STATEMENTS OF NET COST
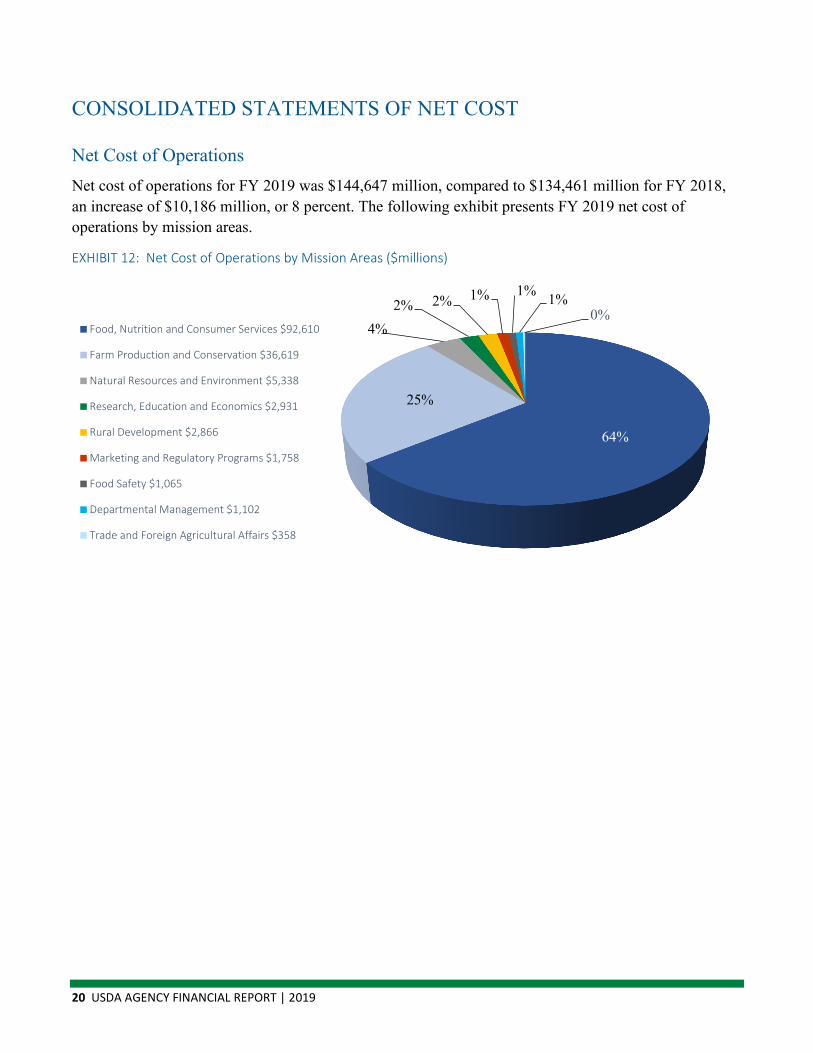
Net Cost of Operations Net cost of operations for FY 2019 was $144,647 million, compared to $134,461 million for FY 2018, an increase of $10,186 million, or 8 percent. The following exhibit presents FY 2019 net cost of operations by mission areas.
EXHIBIT 12: Net Cost of Operations by Mission Areas ($millions)
64%
25%
4%2% 2% 1% 1% 1%
0%Food, Nutrition and Consumer Services $92,610
Farm Production and Conservation $36,619
Natural Resources and Environment $5,338
Research, Education and Economics $2,931
Rural Development $2,866
Marketing and Regulatory Programs $1,758
Food Safety $1,065
Departmental Management $1,102
Trade and Foreign Agricultural Affairs $358
SECTION I | MANAGEMENT’S DISCUSSION AND ANALYSIS 21
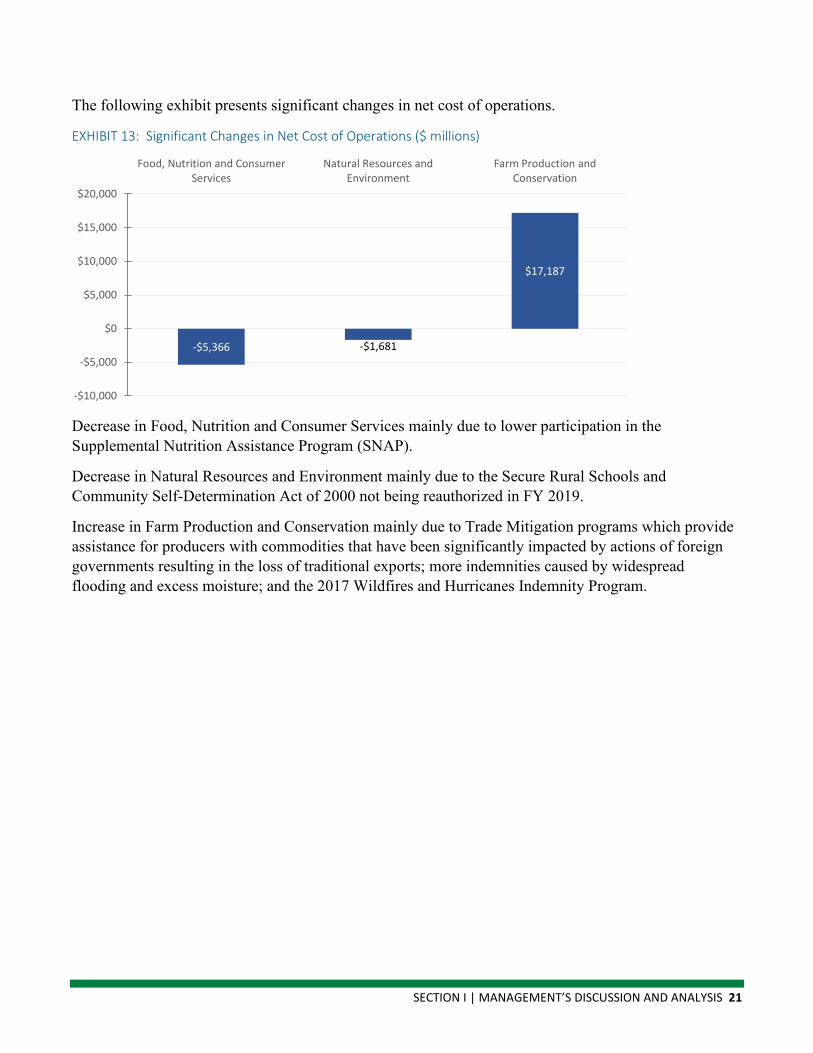
The following exhibit presents significant changes in net cost of operations.
EXHIBIT 13: Significant Changes in Net Cost of Operations ($ millions)
-$5,366 -$1,681
$17,187
-$10,000
-$5,000
$0
$5,000
$10,000
$15,000
$20,000
Food, Nutrition and ConsumerServices
Natural Resources andEnvironment
Farm Production andConservation
Decrease in Food, Nutrition and Consumer Services mainly due to lower participation in the Supplemental Nutrition Assistance Program (SNAP).
Decrease in Natural Resources and Environment mainly due to the Secure Rural Schools and Community Self-Determination Act of 2000 not being reauthorized in FY 2019.
Increase in Farm Production and Conservation mainly due to Trade Mitigation programs which provide assistance for producers with commodities that have been significantly impacted by actions of foreign governments resulting in the loss of traditional exports; more indemnities caused by widespread flooding and excess moisture; and the 2017 Wildfires and Hurricanes Indemnity Program.
22 USDA AGENCY FINANCIAL REPORT | 2019
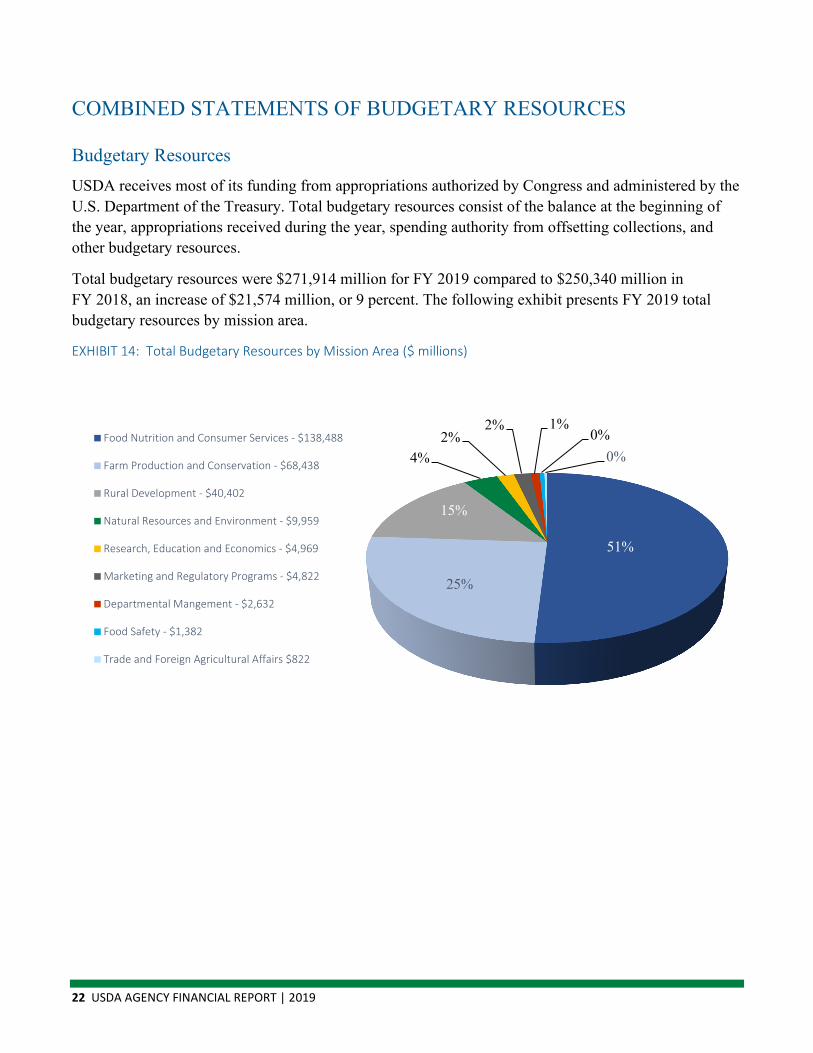
COMBINED STATEMENTS OF BUDGETARY RESOURCES
Budgetary Resources USDA receives most of its funding from appropriations authorized by Congress and administered by the U.S. Department of the Treasury. Total budgetary resources consist of the balance at the beginning of the year, appropriations received during the year, spending authority from offsetting collections, and other budgetary resources.
Total budgetary resources were $271,914 million for FY 2019 compared to $250,340 million in FY 2018, an increase of $21,574 million, or 9 percent. The following exhibit presents FY 2019 total budgetary resources by mission area.
EXHIBIT 14: Total Budgetary Resources by Mission Area ($ millions)
51%
25%
15%
4%2%
2% 1%0%
0%Food Nutrition and Consumer Services - $138,488
Farm Production and Conservation - $68,438
Rural Development - $40,402
Natural Resources and Environment - $9,959
Research, Education and Economics - $4,969
Marketing and Regulatory Programs - $4,822
Departmental Mangement - $2,632
Food Safety - $1,382
Trade and Foreign Agricultural Affairs $822
SECTION I | MANAGEMENT’S DISCUSSION AND ANALYSIS 23
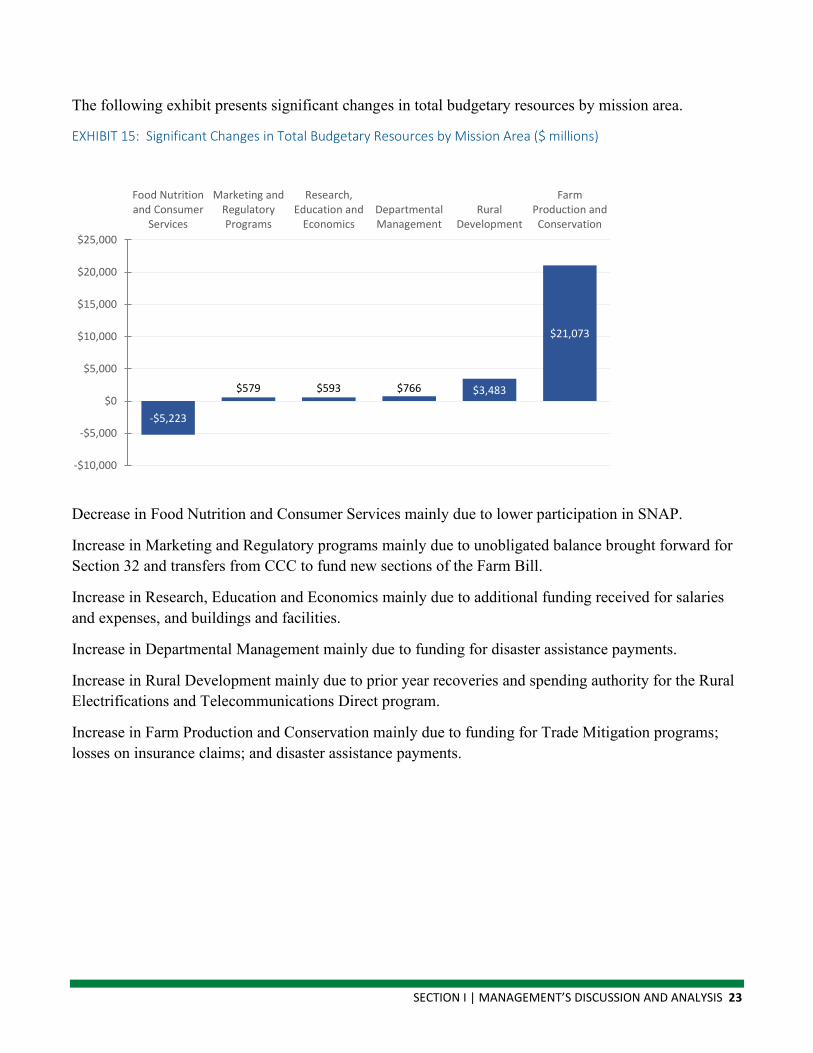
The following exhibit presents significant changes in total budgetary resources by mission area.
EXHIBIT 15: Significant Changes in Total Budgetary Resources by Mission Area ($ millions)
-$5,223
$579 $593 $766 $3,483
$21,073
-$10,000
-$5,000
$0
$5,000
$10,000
$15,000
$20,000
$25,000
Food Nutritionand Consumer
Services
Marketing andRegulatoryPrograms
Research,Education and
EconomicsDepartmentalManagement
RuralDevelopment
FarmProduction andConservation
Decrease in Food Nutrition and Consumer Services mainly due to lower participation in SNAP.
Increase in Marketing and Regulatory programs mainly due to unobligated balance brought forward for Section 32 and transfers from CCC to fund new sections of the Farm Bill.
Increase in Research, Education and Economics mainly due to additional funding received for salaries and expenses, and buildings and facilities.
Increase in Departmental Management mainly due to funding for disaster assistance payments.
Increase in Rural Development mainly due to prior year recoveries and spending authority for the Rural Electrifications and Telecommunications Direct program.
Increase in Farm Production and Conservation mainly due to funding for Trade Mitigation programs; losses on insurance claims; and disaster assistance payments.

24 USDA AGENCY FINANCIAL REPORT | 2019
Net Outlays Net Outlays were $151,882 million for FY 2019, compared to $140,418 million in FY 2018, an increase of $11,464 million or 8 percent. The following exhibit presents FY 2019 net outlays by mission area.
EXHIBIT 16: Net Outlays by Mission Area ($ millions)
61%
27%
4%3%
2%2% 1%
0%
0%
Food Nutrition and Consumer Services - $92,577
Farm Production and Conservation - $41,847
Natural Resources and Environment - $5,573
Rural Development - $5,035
Research, Education and Economics - $2,814
Marketing and Regulatory Programs - $2,446
Food Safety - $1,037
Trade and Foreign Agricultural Affairs $321
Departmental Management - $232

SECTION I | MANAGEMENT’S DISCUSSION AND ANALYSIS 25
The following exhibit presents significant changes in net outlays by mission area.
EXHIBIT 17: Significant Changes in Net Outlays ($ millions)
-$4,651 -$925
$16,396
-$10,000
-$5,000
$0
$5,000
$10,000
$15,000
$20,000Food and Nutrition Service
Natural Resources andEnvironment
Farm Production andConservation
Decrease in Food Nutrition and Consumer Services mainly due to lower participation in SNAP.
Decrease in Natural Resources and Environment mainly due to significantly lower fire season.
Increase in Farm Production and Conservation mainly due to Trade Mitigation programs; more losses caused by widespread flooding and excess moisture, and deferred collection of any unpaid producer premiums.

26 USDA AGENCY FINANCIAL REPORT | 2019
Statement of Assurance Annually, the U.S. Department of Agriculture (USDA) assesses its financial management systems and internal controls over the effectiveness of operations and reporting with applicable laws and regulations and financial reporting. The assessment included the safeguarding of assets and compliance with applicable laws and regulations in accordance with the requirements of the Office of Management and Budget (OMB) Circular No. A-123, Management’s Responsibility for Enterprise Risk Management and Internal Control.
USDA is providing modified assurance that USDA’s systems of internal control comply with the Federal Managers’ Financial Integrity Act (FMFIA) objectives. As a result of the assessments conducted, USDA’s systems of internal control meet the objectives of the FMFIA and the Federal Financial Management Improvement Act (FFMIA), with the exception of two material weaknesses in internal control related to (1) information technology and (2) financial management. There was also one instance of financial system non-conformance which is also a noncompliance with FFMIA. In addition, USDA identified three instances of non-compliance with laws and regulations. Management is providing reasonable assurance that the internal controls over operations are effective. The details of the exceptions are provided in the FMFIA, FFMIA, and Summary of Financial Statement Audit and Management Assurances sections of this report. No other material weaknesses were found in the design of the internal control over (1) the effectiveness and efficiency of operations and compliance with applicable laws and regulations as of September 30, 2019 and (2) internal control over reporting as of June 30, 2019.
Sonny Perdue Secretary of Agriculture
November 19, 2019

SECTION I | MANAGEMENT’S DISCUSSION AND ANALYSIS 27
Federal Managers’ Financial Integrity Act Report on Management Control
BACKGROUND The Federal Managers’ Financial Integrity Act (FMFIA) requires ongoing evaluations of internal controls and financial management systems. These evaluations lead to an annual statement of assurance that:
▪ Obligations and costs comply with applicable laws and regulations;
▪ Federal assets are safeguarded against fraud, waste, abuse, and mismanagement;
▪ Transactions are accounted for and properly recorded; and
▪ Financial management systems conform to standards, principles, and other requirements to ensure that federal managers have timely, relevant, and consistent financial information for decision-making purposes.
The U.S. Department of Agriculture (USDA) evaluated its internal controls in accordance with Office of Management and Budget (OMB) Circular No. A-123, Management’s Responsibility for Enterprise Risk Management and Internal Control.
The Department operates a comprehensive internal control program. This program ensures compliance with the requirements of FMFIA and other laws, and OMB Circular No. A-123, Appendices A through D. All USDA managers must ensure their programs operate efficiently and effectively, and comply with relevant laws. They must also ensure financial management systems conform to applicable laws, standards, principles, and related requirements. In conjunction with the Office of Inspector General (OIG) and the Government Accountability Office (GAO), USDA’s management works decisively to determine the root causes of its material weaknesses so that it can direct resources to focus on their remediation.
USDA remains committed to reducing and eliminating the risks associated with its deficiencies. It also strives to efficiently and effectively operate its programs in compliance with FMFIA and other applicable laws and regulations.
28 USDA AGENCY FINANCIAL REPORT | 2019
FISCAL YEAR (FY) 2019 RESULTS The Department has two existing material weaknesses in internal controls over financial reporting: Information Technology (IT) and financial management. The material weakness for financial management is due to improvements needed in accounting and internal controls related to the Natural Resources Conservation Service (NRCS) and Commodity Credit Corporation (CCC). The Risk Management Agency resolved the material weakness related to internal controls over estimating losses on insurance claims. USDA also has one existing system non-conformance related to Funds Control Management within the CCC, which will be resolved by the end of fiscal year (FY) 2021.
The Food and Nutrition Service (FNS) and the Farm Service Agency (FSA) are non-compliant with laws and regulations related to the Improper Payments Elimination and Recovery Act of 2010, as amended.
USDA has identified violations or potential violations with the Anti-deficiency Act (ADA). Five ADA violations were reported to the President and Congress during FY 2019 with an additional eight violations in the process of being reported. The Office of the General Counsel determined six potential instances were not ADA violations; and five more are pending results from research and investigation for a determination as to whether or not violations actually occurred. A detailed description and summary of the Department’s ADAs can be found in the Compliance with Laws and Regulations section of this report.
The Secretary’s Statement of Assurance provides modified assurance that USDA’s system of internal control complies with FMFIA objectives. For additional details on the results reported in USDA’s Consolidated Financial Statements Audit Report, see the Summary of Financial Statement Audit and Management Assurances section of this report.
SECTION I | MANAGEMENT’S DISCUSSION AND ANALYSIS 29
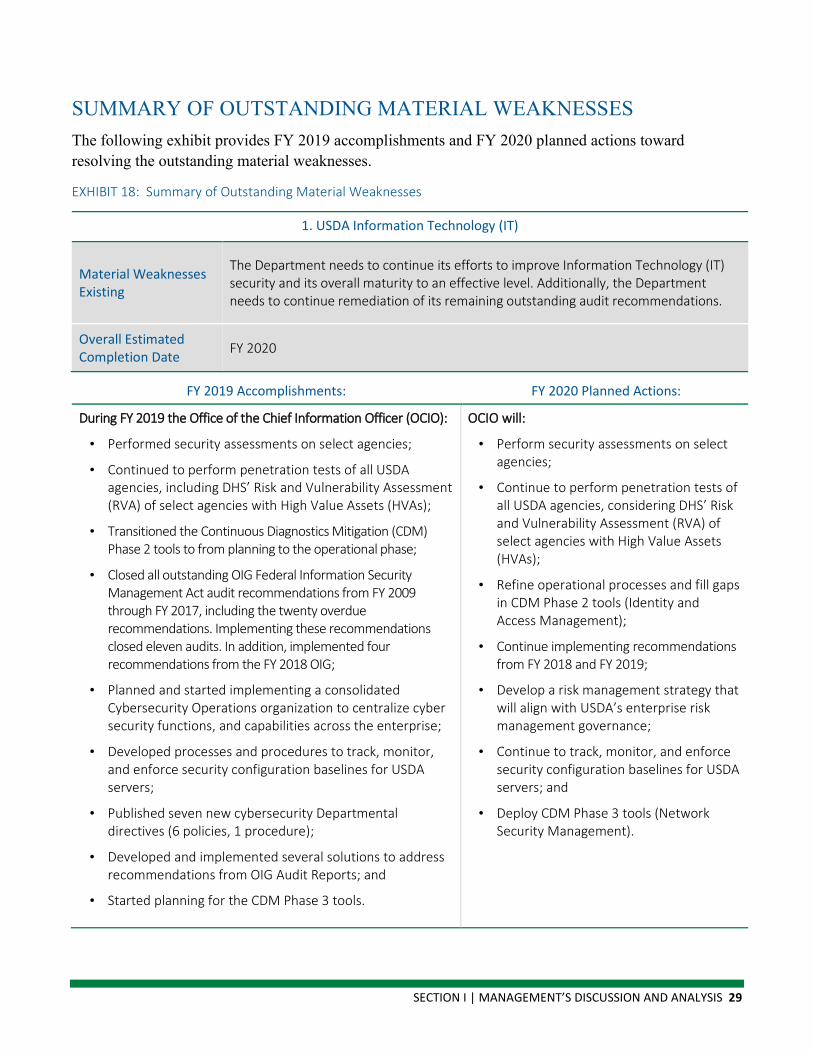
SUMMARY OF OUTSTANDING MATERIAL WEAKNESSES The following exhibit provides FY 2019 accomplishments and FY 2020 planned actions toward resolving the outstanding material weaknesses.
EXHIBIT 18: Summary of Outstanding Material Weaknesses
1. USDA Information Technology (IT)
Material Weaknesses Existing
The Department needs to continue its efforts to improve Information Technology (IT) security and its overall maturity to an effective level. Additionally, the Department needs to continue remediation of its remaining outstanding audit recommendations.
Overall Estimated Completion Date FY 2020
FY 2019 Accomplishments: FY 2020 Planned Actions:
During FY 2019 the Office of the Chief Information Officer (OCIO):
• Performed security assessments on select agencies;
• Continued to perform penetration tests of all USDA agencies, including DHS’ Risk and Vulnerability Assessment (RVA) of select agencies with High Value Assets (HVAs);
• Transitioned the Continuous Diagnostics Mitigation (CDM) Phase 2 tools to from planning to the operational phase;
• Closed all outstanding OIG Federal Information Security Management Act audit recommendations from FY 2009 through FY 2017, including the twenty overdue recommendations. Implementing these recommendations closed eleven audits. In addition, implemented four recommendations from the FY 2018 OIG;
• Planned and started implementing a consolidated Cybersecurity Operations organization to centralize cyber security functions, and capabilities across the enterprise;
• Developed processes and procedures to track, monitor, and enforce security configuration baselines for USDA servers;
• Published seven new cybersecurity Departmental directives (6 policies, 1 procedure);
• Developed and implemented several solutions to address recommendations from OIG Audit Reports; and
• Started planning for the CDM Phase 3 tools.
OCIO will:
• Perform security assessments on select agencies;
• Continue to perform penetration tests of all USDA agencies, considering DHS’ Risk and Vulnerability Assessment (RVA) of select agencies with High Value Assets (HVAs);
• Refine operational processes and fill gaps in CDM Phase 2 tools (Identity and Access Management);
• Continue implementing recommendations from FY 2018 and FY 2019;
• Develop a risk management strategy that will align with USDA’s enterprise risk management governance;
• Continue to track, monitor, and enforce security configuration baselines for USDA servers; and
• Deploy CDM Phase 3 tools (Network Security Management).
30 USDA AGENCY FINANCIAL REPORT | 2019
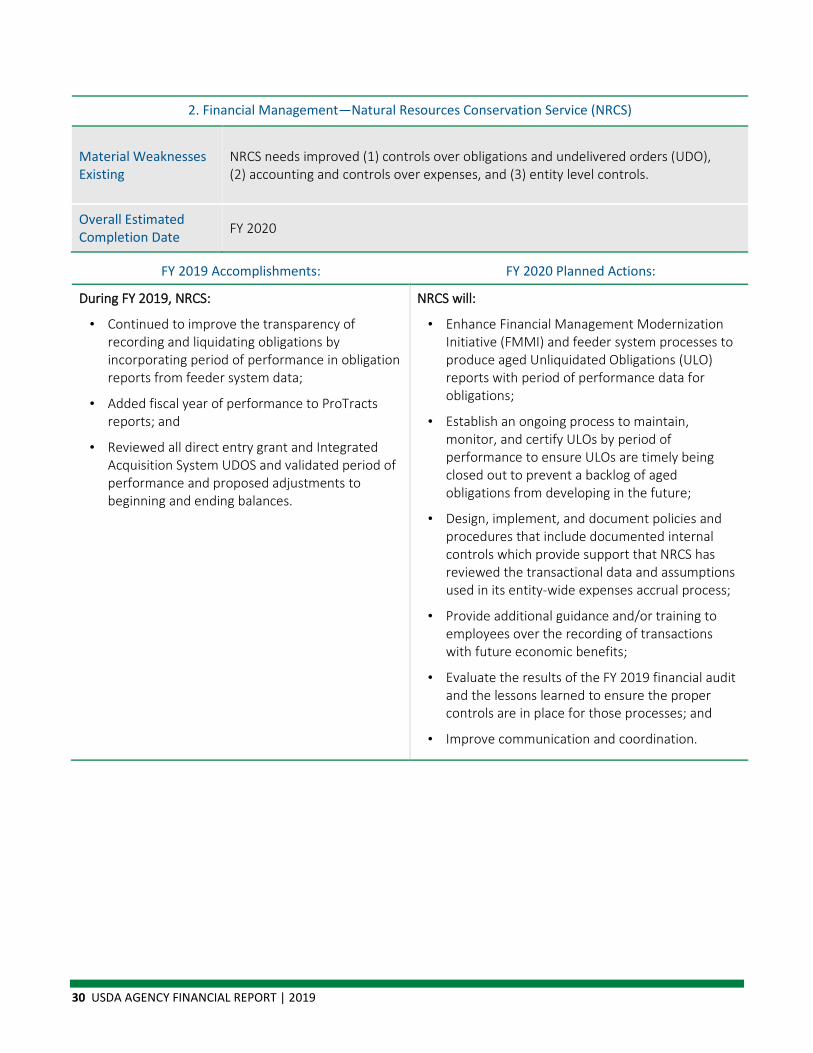
2. Financial Management—Natural Resources Conservation Service (NRCS)
Material Weaknesses Existing
NRCS needs improved (1) controls over obligations and undelivered orders (UDO), (2) accounting and controls over expenses, and (3) entity level controls.
Overall Estimated Completion Date FY 2020
FY 2019 Accomplishments: FY 2020 Planned Actions:
During FY 2019, NRCS:
• Continued to improve the transparency of recording and liquidating obligations by incorporating period of performance in obligation reports from feeder system data;
• Added fiscal year of performance to ProTracts reports; and
• Reviewed all direct entry grant and Integrated Acquisition System UDOS and validated period of performance and proposed adjustments to beginning and ending balances.
NRCS will:
• Enhance Financial Management Modernization Initiative (FMMI) and feeder system processes to produce aged Unliquidated Obligations (ULO) reports with period of performance data for obligations;
• Establish an ongoing process to maintain, monitor, and certify ULOs by period of performance to ensure ULOs are timely being closed out to prevent a backlog of aged obligations from developing in the future;
• Design, implement, and document policies and procedures that include documented internal controls which provide support that NRCS has reviewed the transactional data and assumptions used in its entity-wide expenses accrual process;
• Provide additional guidance and/or training to employees over the recording of transactions with future economic benefits;
• Evaluate the results of the FY 2019 financial audit and the lessons learned to ensure the proper controls are in place for those processes; and
• Improve communication and coordination.
SECTION I | MANAGEMENT’S DISCUSSION AND ANALYSIS 31
2. Financial Management—Commodity Credit Corporation (CCC)
Material Weaknesses Existing
CCC needs to address material weaknesses related to Accounting Estimates and Accounting for Budgetary Transactions.
Overall Estimated Completion Date FY 2020
FY 2019 Accomplishments: FY 2020 Planned Actions:
During FY 2019 CCC:
• Continued to implement effective manual, compensating UDO (Undelivered Orders) monitoring controls at the program level. These controls assess the accuracy & validity of open obligations on a regular basis;
• Provided necessary training to County field personnel on the requirements of OMB A-11 for recording obligations, and ensured program handbooks were updated regarding execution and related accounting;
• Began a process to implement effective automated and/or manual controls to evaluate the relationship between a Conservation Reserve Program (CRP) annual rental contracts and CRP cost share contracts; and developed and implemented data analytic routines and management review controls related to program UDO populations to identify and correct abnormalities in the data;
• Updated documentation and continued to strengthen management controls related to the annual Agriculture Risk Coverage and Price Loss Coverage (ARC/PLC) UDO calculation to ensure that it is performed at a level of precision to include relevant and accurate data elements, such as enrollments and crop prices that reflect the documentation submitted by the producer and approved by management;
• Implemented processes, procedures, and controls to ensure accurate recognition of adjustments to delivered orders are posted into the accounting systems and performed periodic reviews of the accounting events to validate the results of recorded transactions;
CCC will:
• Continue to implement effective UDO monitoring controls at the program level throughout of the organization;
• Create a review and approval process for apportionments that include Budget, Financial Management, Economics and Policy Analysis, and Agency Program leadership to ensure estimates are fully vetted and amounts requested are sufficient;
• Implement continuous monitoring of the relationship between the CRP annual rental contracts and CRP cost share contracts, and the continuous monitoring of CRP cost share data;
• Update Standard Operating Procedure and checklist to include evaluation process for USAID’s cash adjustment, validate controls are working effectively, and document the root cause of deficiency and implement corresponding compensating controls;
• Continue development of a reconciliation/ analysis process for beginning of year balance for borrowing authority carried forward;
• Continue to monitor process for items requiring resolution and validate balance changes;
• Periodically review and update accounting standards and validate that resulting changes have been tested and implemented; and
• Continue with the execution of the existing OMB A-123, Appendix A Corrective Action Plan over Accounting Estimates by further improving and enhancing the analysis, review, and recordation process.
32 USDA AGENCY FINANCIAL REPORT | 2019
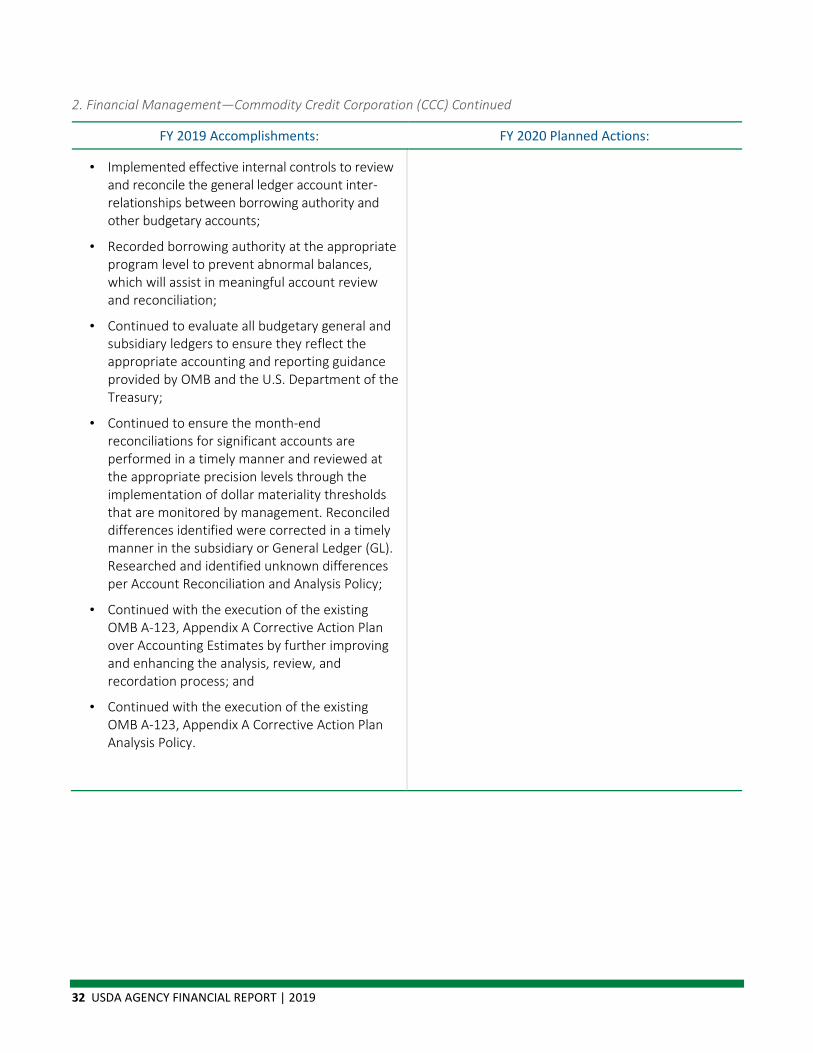
2. Financial Management—Commodity Credit Corporation (CCC) Continued
FY 2019 Accomplishments: FY 2020 Planned Actions:
• Implemented effective internal controls to review and reconcile the general ledger account inter-relationships between borrowing authority and other budgetary accounts;
• Recorded borrowing authority at the appropriate program level to prevent abnormal balances, which will assist in meaningful account review and reconciliation;
• Continued to evaluate all budgetary general and subsidiary ledgers to ensure they reflect the appropriate accounting and reporting guidance provided by OMB and the U.S. Department of the Treasury;
• Continued to ensure the month-end reconciliations for significant accounts are performed in a timely manner and reviewed at the appropriate precision levels through the implementation of dollar materiality thresholds that are monitored by management. Reconciled differences identified were corrected in a timely manner in the subsidiary or General Ledger (GL). Researched and identified unknown differences per Account Reconciliation and Analysis Policy;
• Continued with the execution of the existing OMB A-123, Appendix A Corrective Action Plan over Accounting Estimates by further improving and enhancing the analysis, review, and recordation process; and
• Continued with the execution of the existing OMB A-123, Appendix A Corrective Action Plan Analysis Policy.
SECTION I | MANAGEMENT’S DISCUSSION AND ANALYSIS 33
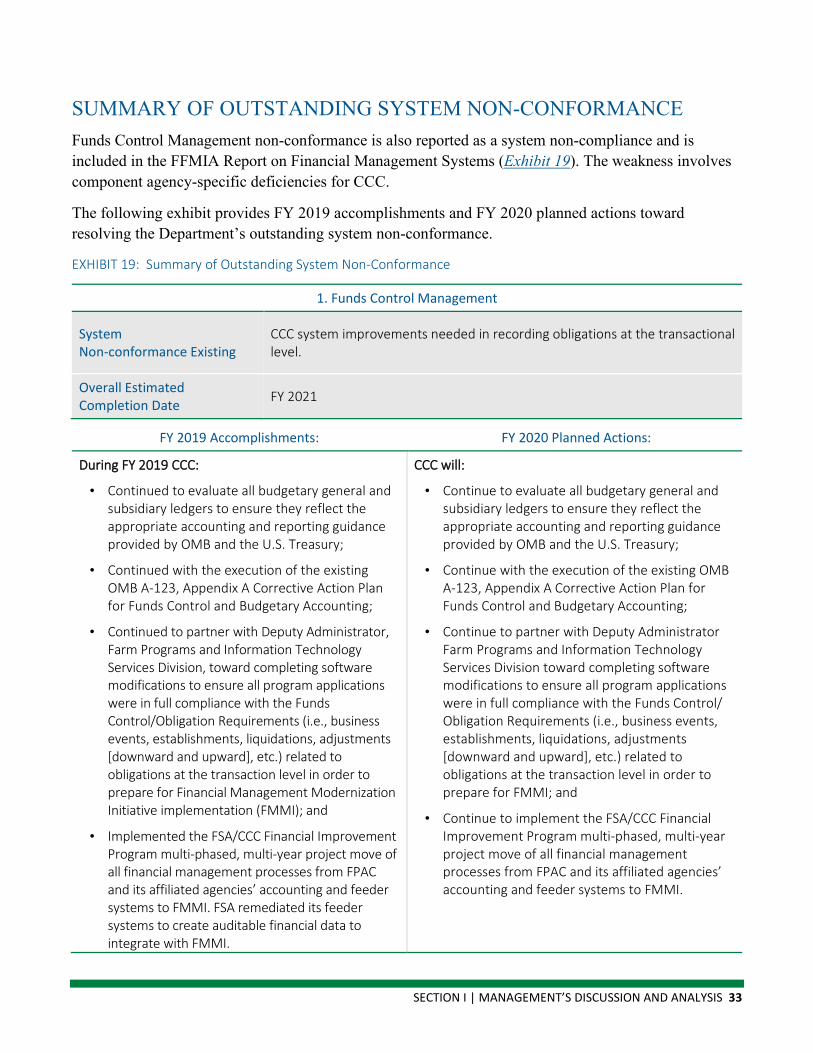
SUMMARY OF OUTSTANDING SYSTEM NON-CONFORMANCE Funds Control Management non-conformance is also reported as a system non-compliance and is included in the FFMIA Report on Financial Management Systems (Exhibit 19). The weakness involves component agency-specific deficiencies for CCC.
The following exhibit provides FY 2019 accomplishments and FY 2020 planned actions toward resolving the Department’s outstanding system non-conformance.
EXHIBIT 19: Summary of Outstanding System Non-Conformance
1. Funds Control Management
System Non-conformance Existing
CCC system improvements needed in recording obligations at the transactional level.
Overall Estimated Completion Date FY 2021
FY 2019 Accomplishments: FY 2020 Planned Actions:
During FY 2019 CCC:
• Continued to evaluate all budgetary general and subsidiary ledgers to ensure they reflect the appropriate accounting and reporting guidance provided by OMB and the U.S. Treasury;
• Continued with the execution of the existing OMB A-123, Appendix A Corrective Action Plan for Funds Control and Budgetary Accounting;
• Continued to partner with Deputy Administrator, Farm Programs and Information Technology Services Division, toward completing software modifications to ensure all program applications were in full compliance with the Funds Control/Obligation Requirements (i.e., business events, establishments, liquidations, adjustments [downward and upward], etc.) related to obligations at the transaction level in order to prepare for Financial Management Modernization Initiative implementation (FMMI); and
• Implemented the FSA/CCC Financial Improvement Program multi-phased, multi-year project move of all financial management processes from FPAC and its affiliated agencies’ accounting and feeder systems to FMMI. FSA remediated its feeder systems to create auditable financial data to integrate with FMMI.
CCC will:
• Continue to evaluate all budgetary general and subsidiary ledgers to ensure they reflect the appropriate accounting and reporting guidance provided by OMB and the U.S. Treasury;
• Continue with the execution of the existing OMB A-123, Appendix A Corrective Action Plan for Funds Control and Budgetary Accounting;
• Continue to partner with Deputy Administrator Farm Programs and Information Technology Services Division toward completing software modifications to ensure all program applications were in full compliance with the Funds Control/ Obligation Requirements (i.e., business events, establishments, liquidations, adjustments [downward and upward], etc.) related to obligations at the transaction level in order to prepare for FMMI; and
• Continue to implement the FSA/CCC Financial Improvement Program multi-phased, multi-year project move of all financial management processes from FPAC and its affiliated agencies’ accounting and feeder systems to FMMI.

34 USDA AGENCY FINANCIAL REPORT | 2019
Compliance with Laws and Regulations USDA remains noncompliant, or potentially noncompliant with the Anti-deficiency Act (ADA) identified in the following table, as well as in the Improper Payments Elimination and Recovery Act of 2010 (IPERA) as Amended and Federal Financial Management Improvement Act sections of this report.
The Department has developed strategies to reduce and/or mitigate these violations during FY 2020. The following tables provide further details of each violation.
ANTI-DEFICIENCY ACT EXHIBIT 20: Five ADA Violations were Reported to the President and Congress During 2019
Agency: Commodity Credit Corporation (CCC)
Violation: Expenditures for CCC interest to the U.S. Department of the Treasury (Treasury) exceeded amounts initially apportioned by the Office of Management and Budget (OMB). CCC expended approximately $46.1 million in interest to Treasury, more than the apportioned amount of $29.9 million. The ADA violation totaled $16,205,195.04.
Year Identified
FY 2016
Agency: Office of the Chief Financial Officer/ National Finance Center (OCFO/NFC)
Violation: The NFC managed web pages for the New Orleans chapter of the Association of Government Accountants (AGA), which is a non-governmental organization, on the NFC Web site at no cost to AGA. An investigation into this situation determined in FY 2017 that NFC has been maintaining the AGA web pages since 1999. The ADA violation was less than $5.
Year Identified
FY 2017
Agency: Farm Service Agency
Violation: A violation of ADA, 31 U.S.C. 1342 occurred in FSA’s Salaries and Expenses account in the total amount of $149.79. The violation occurred between January 20, 2018, and January 23, 2018, during the government shutdown when 41 field office staff verified 120 deposits to properly record collections.
Year Identified
FY 2018
Agency: CCC
Violation: Noninsured Crop Disaster Assistance Program (NAP) Frost Freeze (FFN)— During the reclassification process in FY 2018, CCC discovered NAP payments exceeded apportionments by $888.
Year Identified
FY 2018
Agency: CCC
Violation: (NEW): Pima Agriculture Cotton Trust Fund — An Inter/Intra-Agency Agreement (IAA) for $124,500 administrative fees was initiated and funds were certified to start the IAA process. On April 17, 2019, $14,943,071.01 was disbursed for payments to manufacturers/producers leaving only $64,927.99 left for FY 2019. When the IAA for the $124,500 administrative fee was approved on May 20, 2019, it now exceeded the funds available for FY 2019 by $59,572.01.
Year Identified
FY 2019
SECTION I | MANAGEMENT’S DISCUSSION AND ANALYSIS 35
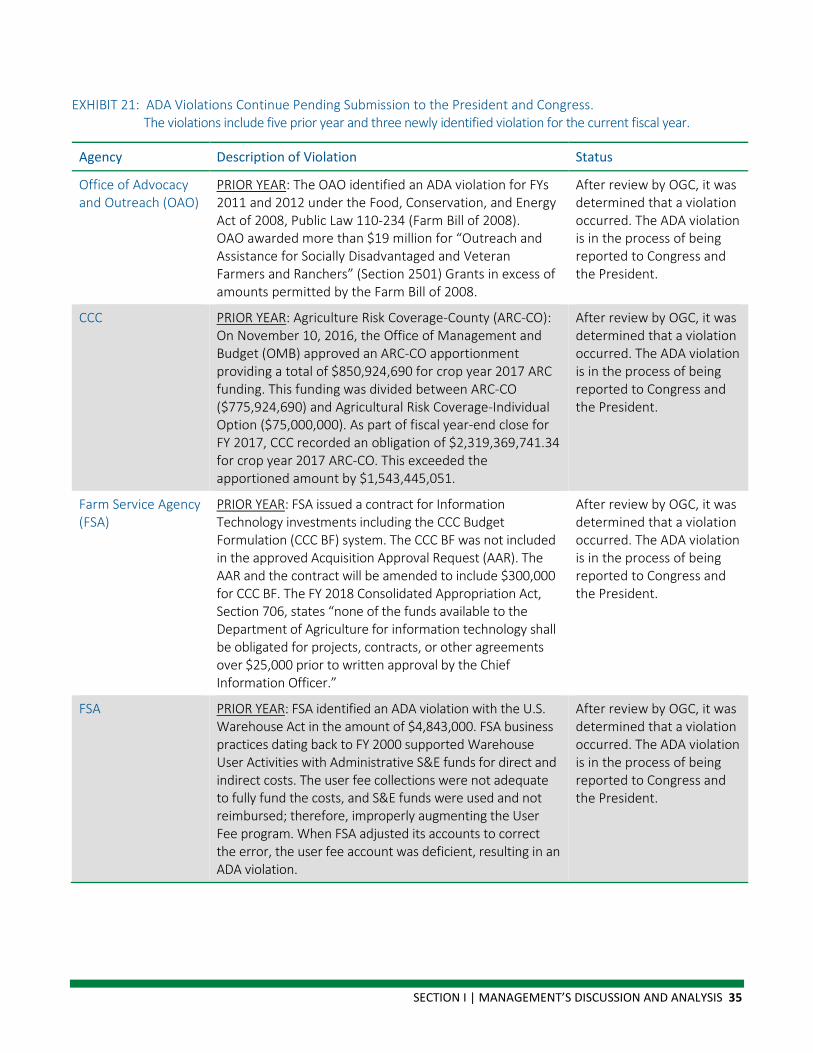
EXHIBIT 21: ADA Violations Continue Pending Submission to the President and Congress. The violations include five prior year and three newly identified violation for the current fiscal year.
Agency Description of Violation Status
Office of Advocacy and Outreach (OAO)
PRIOR YEAR: The OAO identified an ADA violation for FYs 2011 and 2012 under the Food, Conservation, and Energy Act of 2008, Public Law 110-234 (Farm Bill of 2008). OAO awarded more than $19 million for “Outreach and Assistance for Socially Disadvantaged and Veteran Farmers and Ranchers” (Section 2501) Grants in excess of amounts permitted by the Farm Bill of 2008.
After review by OGC, it was determined that a violation occurred. The ADA violation is in the process of being reported to Congress and the President.
CCC PRIOR YEAR: Agriculture Risk Coverage-County (ARC-CO): On November 10, 2016, the Office of Management and Budget (OMB) approved an ARC-CO apportionment providing a total of $850,924,690 for crop year 2017 ARC funding. This funding was divided between ARC-CO ($775,924,690) and Agricultural Risk Coverage-Individual Option ($75,000,000). As part of fiscal year-end close for FY 2017, CCC recorded an obligation of $2,319,369,741.34 for crop year 2017 ARC-CO. This exceeded the apportioned amount by $1,543,445,051.
After review by OGC, it was determined that a violation occurred. The ADA violation is in the process of being reported to Congress and the President.
Farm Service Agency (FSA)
PRIOR YEAR: FSA issued a contract for Information Technology investments including the CCC Budget Formulation (CCC BF) system. The CCC BF was not included in the approved Acquisition Approval Request (AAR). The AAR and the contract will be amended to include $300,000 for CCC BF. The FY 2018 Consolidated Appropriation Act, Section 706, states “none of the funds available to the Department of Agriculture for information technology shall be obligated for projects, contracts, or other agreements over $25,000 prior to written approval by the Chief Information Officer.”
After review by OGC, it was determined that a violation occurred. The ADA violation is in the process of being reported to Congress and the President.
FSA PRIOR YEAR: FSA identified an ADA violation with the U.S. Warehouse Act in the amount of $4,843,000. FSA business practices dating back to FY 2000 supported Warehouse User Activities with Administrative S&E funds for direct and indirect costs. The user fee collections were not adequate to fully fund the costs, and S&E funds were used and not reimbursed; therefore, improperly augmenting the User Fee program. When FSA adjusted its accounts to correct the error, the user fee account was deficient, resulting in an ADA violation.
After review by OGC, it was determined that a violation occurred. The ADA violation is in the process of being reported to Congress and the President.

36 USDA AGENCY FINANCIAL REPORT | 2019
Agency Description of Violation Status
CCC Prior Year: Agriculture Risk Coverage (ARC)—In FY 2018, CCC identified crop year 2017 enrollments for the ARC program that exceeded available funding. The ARC program does not check funds availability at the time of approval. It is checked at the time of payment. When the payment run occurred, the program area identified that there were not enough funds for all Crop Year 2017 contracts approved in FY 2018. This resulted in a $1,797,297 funding deficit and ADA violation.
After review by OGC, it was determined that a violation occurred. The ADA violation is in the process of being reported to Congress and the President.
ERS FY 2019 (NEW): Employee training—During the Government Shutdown in January 2019, online training was taken by an employee in furlough status. The training was a benefit to ERS, and ERS accepted the voluntary services in violation of 31 USC 1342. The ADA violation was approximately $1,503.
After review by OGC, it was determined that a violation occurred. The ADA violation is in the process of being reported to Congress and the President.
ARS FY 2019 (NEW): Unauthorized work during the shutdown—An employee entered documentation into a contract file during the government shutdown. This resulted in an ADA violation in the amount of $11.03.
After review by OGC, it was determined that a violation occurred. The ADA violation is in the process of being reported to Congress and the President.
NRCS FY 2019 (NEW): Computer equipment was purchased in the amount of $41,065 without getting the requisite information technology acquisition form signed and approved.
After review by OGC, it was determined that a violation occurred. The ADA violation is in the process of being reported to Congress and the President.
SECTION I | MANAGEMENT’S DISCUSSION AND ANALYSIS 37
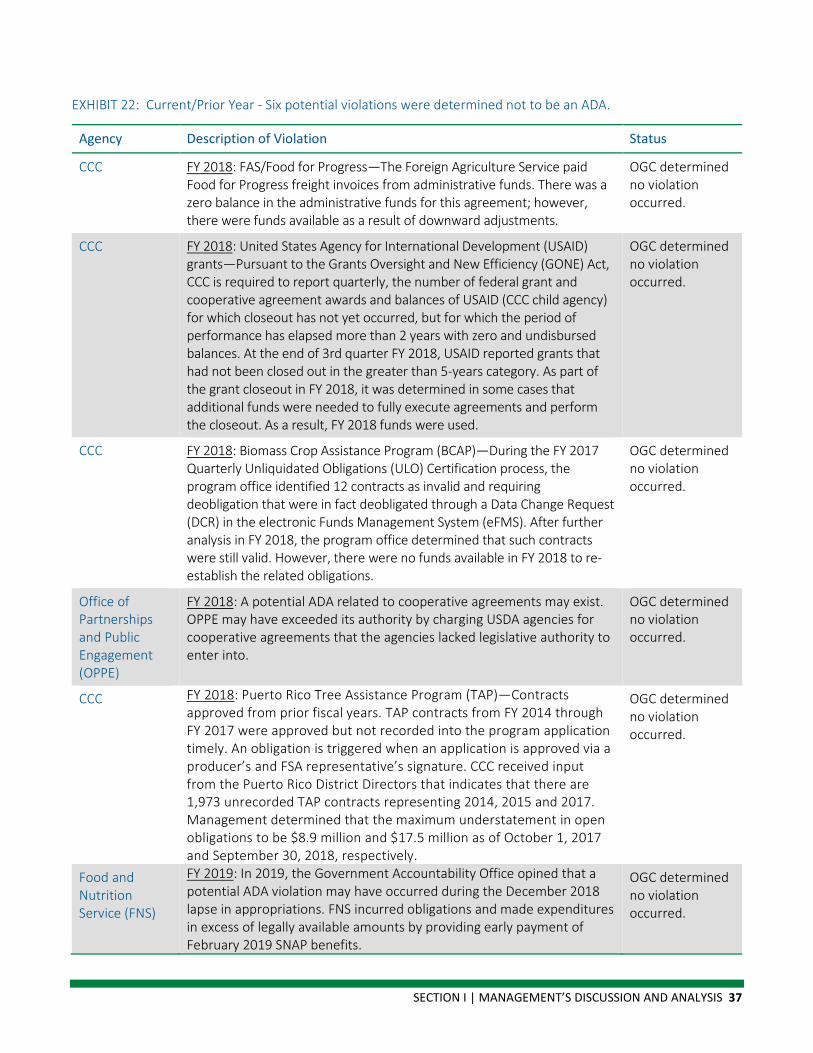
EXHIBIT 22: Current/Prior Year - Six potential violations were determined not to be an ADA.
Agency Description of Violation Status
CCC FY 2018: FAS/Food for Progress—The Foreign Agriculture Service paid Food for Progress freight invoices from administrative funds. There was a zero balance in the administrative funds for this agreement; however, there were funds available as a result of downward adjustments.
OGC determined no violation occurred.
CCC FY 2018: United States Agency for International Development (USAID) grants—Pursuant to the Grants Oversight and New Efficiency (GONE) Act, CCC is required to report quarterly, the number of federal grant and cooperative agreement awards and balances of USAID (CCC child agency) for which closeout has not yet occurred, but for which the period of performance has elapsed more than 2 years with zero and undisbursed balances. At the end of 3rd quarter FY 2018, USAID reported grants that had not been closed out in the greater than 5-years category. As part of the grant closeout in FY 2018, it was determined in some cases that additional funds were needed to fully execute agreements and perform the closeout. As a result, FY 2018 funds were used.
OGC determined no violation occurred.
CCC FY 2018: Biomass Crop Assistance Program (BCAP)—During the FY 2017 Quarterly Unliquidated Obligations (ULO) Certification process, the program office identified 12 contracts as invalid and requiring deobligation that were in fact deobligated through a Data Change Request (DCR) in the electronic Funds Management System (eFMS). After further analysis in FY 2018, the program office determined that such contracts were still valid. However, there were no funds available in FY 2018 to re-establish the related obligations.
OGC determined no violation occurred.
Office of Partnerships and Public Engagement (OPPE)
FY 2018: A potential ADA related to cooperative agreements may exist. OPPE may have exceeded its authority by charging USDA agencies for cooperative agreements that the agencies lacked legislative authority to enter into.
OGC determined no violation occurred.
CCC FY 2018: Puerto Rico Tree Assistance Program (TAP)—Contracts approved from prior fiscal years. TAP contracts from FY 2014 through FY 2017 were approved but not recorded into the program application timely. An obligation is triggered when an application is approved via a producer’s and FSA representative’s signature. CCC received input from the Puerto Rico District Directors that indicates that there are 1,973 unrecorded TAP contracts representing 2014, 2015 and 2017. Management determined that the maximum understatement in open obligations to be $8.9 million and $17.5 million as of October 1, 2017 and September 30, 2018, respectively.
OGC determined no violation occurred.
Food and Nutrition Service (FNS)
FY 2019: In 2019, the Government Accountability Office opined that a potential ADA violation may have occurred during the December 2018 lapse in appropriations. FNS incurred obligations and made expenditures in excess of legally available amounts by providing early payment of February 2019 SNAP benefits.
OGC determined no violation occurred.

38 USDA AGENCY FINANCIAL REPORT | 2019
Potential ADA Violations—three prior year and two new potential violations were identified. These occurrences are pending results from research and investigation for a determination as to whether or not a violation actually occurred. This table provides a description and status.
EXHIBIT 23: Potential ADA Violations Identified Since FY 2017
Agency Description of Violation Status
CCC FY 2017: The prior year accounting treatment for obligations related to the Conservation Reserve Program—Annual Rental contracts was determined to be in error with an ADA amount total of $9,921,859,680. Only the annual portion of the contract values was recorded as an obligation.
The Office of the General Counsel (OGC) determined that the error was not an ADA violation; however, the incident has been referred to GAO for additional investigation and determination.
CCC FY 2018: Emergency Forestry Conservation Reserve Program—CCC failed to record the obligation for the full value of the long-term contract when the contact was signed. The ADA violation amount was $2,200,000.
The Office of the General Counsel (OGC) determined that the error was not an ADA violation; however, the incident has been referred to GAO for additional investigation and determination.
National Institute of Food and Agriculture (NIFA)
FY 2018: USDA’s OIG office issued an audit in August 2019 on NIFA Formula Grant Program Controls Over Fund Allocations to States. A final disposition will be determined. An OIG report indicated that a potential reportable ADA violation may have occurred in the amount of $36 million.
The Office of the General Counsel (OGC) determined that the error was not an ADA violation; however, the incident is under further investigation and determination by OIG.
CCC FY 2019 (NEW): Pima Cotton 2—On May 1, 2019, funding in the amount of $123,655 was recorded for Pima Cotton Trust Fund FY 2018 Carryover without being apportioned. This apportionment only requested the new funding of $16,000,000 for FY 2019, it did not request carryover funding to make it available for obligation in FY 2019. Obligating funds that were carried over and not apportioned may have resulted in a potential ADA violation.
Pending a Determination.
CCC FY 2019 (NEW): Agriculture Wool Apparel Manufacturers Trust Fund—On May 1, 2019, funding in the amount of $123,655 was recorded for Ag Wool Trust Fund FY 2018 Carryover without being apportioned. This apportionment only requested the new funding of $30,000,000 for FY 2019, it did not request carryover funding to make it available for obligation in FY 2019. Obligating funds that were carried over and not apportioned may have resulted in a potential ADA violation.
Pending a Determination
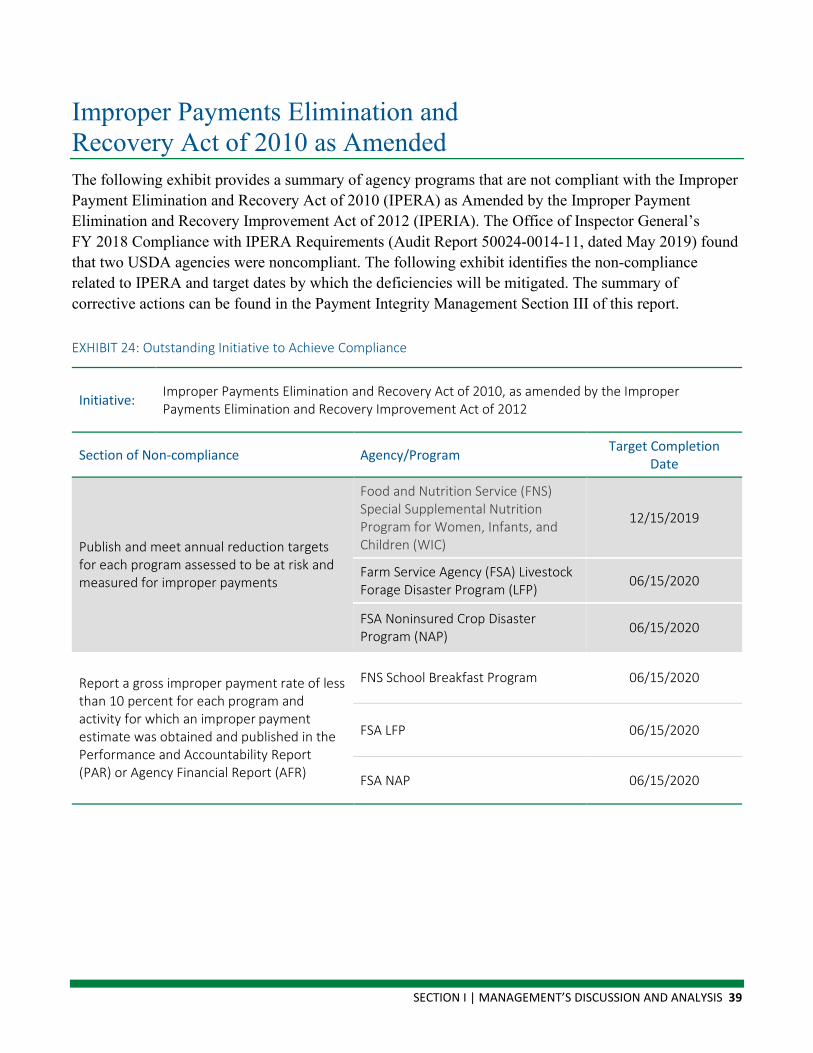
SECTION I | MANAGEMENT’S DISCUSSION AND ANALYSIS 39
Improper Payments Elimination and Recovery Act of 2010 as Amended The following exhibit provides a summary of agency programs that are not compliant with the Improper Payment Elimination and Recovery Act of 2010 (IPERA) as Amended by the Improper Payment Elimination and Recovery Improvement Act of 2012 (IPERIA). The Office of Inspector General’s FY 2018 Compliance with IPERA Requirements (Audit Report 50024-0014-11, dated May 2019) found that two USDA agencies were noncompliant. The following exhibit identifies the non-compliance related to IPERA and target dates by which the deficiencies will be mitigated. The summary of corrective actions can be found in the Payment Integrity Management Section III of this report.
EXHIBIT 24: Outstanding Initiative to Achieve Compliance
Initiative: Improper Payments Elimination and Recovery Act of 2010, as amended by the Improper Payments Elimination and Recovery Improvement Act of 2012
Section of Non-compliance Agency/Program Target Completion Date
Publish and meet annual reduction targets for each program assessed to be at risk and measured for improper payments
Food and Nutrition Service (FNS) Special Supplemental Nutrition Program for Women, Infants, and Children (WIC)
12/15/2019
Farm Service Agency (FSA) Livestock Forage Disaster Program (LFP) 06/15/2020
FSA Noninsured Crop Disaster Program (NAP) 06/15/2020
Report a gross improper payment rate of less than 10 percent for each program and activity for which an improper payment estimate was obtained and published in the Performance and Accountability Report (PAR) or Agency Financial Report (AFR)
FNS School Breakfast Program 06/15/2020
FSA LFP 06/15/2020
FSA NAP 06/15/2020

40 USDA AGENCY FINANCIAL REPORT | 2019
Federal Financial Management Improvement Act Report on Financial Management Systems Background The Federal Financial Management Improvement Act (FFMIA) is designed to improve financial and program managers’ accountability, provide better information for decision making, and improve the efficiency and effectiveness of federal programs. FFMIA requires that financial management systems provide reliable, consistent disclosure of financial data in accordance with generally accepted accounting principles and standards. These systems must also comply with (1) Federal Financial Management System (FFMS) requirements; (2) applicable federal accounting standards; and (3) the U.S. Standard General Ledger (USSGL) at the transaction level.
Additionally, the Federal Information Security Management Act (FISMA) requires that there be no significant weaknesses in information security policies, procedures, or practices to be substantially compliant with FFMIA. The information technology (IT) non-compliance is also reported as a material weakness and is included in the Federal Managers’ Financial Integrity Act Report on Management Control. Failure to resolve prior-year recommendations identified by USDA’s Office of Inspector General (OIG) has prevented the Department from mitigating repeated deficiencies and from receiving a quality rating on the five Cybersecurity Framework security functions. More detailed information on the status of corrective actions planned and to be completed to comply with FISMA is also provided in the Response to Management Challenges section of this report.
The following exhibit contains the outstanding initiatives to achieve compliance.
EXHIBIT 25: Initiatives to be Completed Outstanding Initiatives to Achieve FFMIA Compliance
Initiative Section of Non-compliance Agency Target Completion Date
Information Technology FFMS requirements and information security policies, procedures, and/or practices.
Multiple 12/31/2020
Financial Management
Federal accounting standards and USSGL at the transaction level.
Natural Resources Conservation Service
9/30/2020
Federal accounting standards and USSGL at the transaction level.
Commodity Credit Corporation
9/30/2021

SECTION I | MANAGEMENT’S DISCUSSION AND ANALYSIS 41
FISCAL YEAR 2019 RESULTS During fiscal year (FY) 2019, the U.S. Department of Agriculture (USDA) evaluated its financial management systems to assess compliance with FFMIA. In assessing FFMIA compliance, USDA considered auditors’ opinions on component agencies’ financial statements, and progress made in addressing the material weaknesses identified in the FY 2018 Agency Financial Report. USDA is not compliant with federal accounting standards and the USSGL at the transaction level due to deficiencies identified for the CCC and NRCS. Additionally, as reported in the FFMIA section of this report, USDA continues to have weaknesses in IT controls and FFMS requirements that result in non-compliance with the FISMA requirement. As part of its financial systems strategy, USDA agencies continue working to meet FFMIA and FISMA objectives.
Commodity Credit Corporation (CCC) Commodity Credit Corporation (CCC) Noncompliance with federal accounting standards and USSGL at the transaction level was noted for weaknesses in the accounting for budgetary transactions and accounting estimates. The financial management systems did not record certain accounting events at the transaction level in accordance with the USSGL. CCC continues to make significant progress in performing compensating controls over the accounting for obligation activity. CCC continues implementing their program obligation activity into FMMI in a phased approach.
Natural Resources Conservation Service (NRCS) Deficiencies in applicable federal accounting standards, including the USSGL at the transaction level, were noted for incorrect posting logic being used for recoveries of prior year unpaid obligations and the Financial Management Modernization Initiative does not allow for updates to the period of performance data related to these types of transactions.
NRCS continues working to mitigate auditor-identified deficiencies and substantially comply with FFMIA.
42 USDA AGENCY FINANCIAL REPORT | 2019
Financial Management Systems Strategy The Financial Management Systems (FMS) component of the Office of the Chief Financial Officer (OCFO) is responsible for providing timely, accurate, and complete financial information to U.S. Department of Agriculture (USDA) agencies to enable them to execute the mission of USDA. Specifically, FMS provides cloud-based, Commercial Off-the-Shelf (COTS) Enterprise Resource Planning (ERP) software that provides USDA Agencies with the functionality they need to distribute, obligate, expend, and report on the funds entrusted to them by Congress.
FMS operates as an internal Shared Services Provider to USDA agencies, pooling resources to offer cost-effective systems and support through the consolidation of functions, standard processing, and repeatable processes.
FINANCIAL MANAGEMENT LINES OF BUSINESS FMS’ mission as an Internal Shared Service Provider is to provide reliable, cost-effective, employee-centric systems and services to USDA organizations, thus enabling customers to focus on serving this great Nation through their mission delivery. FMS’ goal is to provide the necessary activities for executing the Financial Management Lines of Business vision. The three key components of this vision are communication, governance, and operations. By executing these components, USDA will deliver a successful, shared service offering.
FMS’ activities are focused on financial management services. The list of financial management services includes:
▪ Budget execution; ▪ General ledger accounting; ▪ Financial reporting; ▪ Audit support; ▪ Payroll accounting; ▪ Investment accounting; ▪ Commercial vendor payments; ▪ Temporary duty travel payments; ▪ Permanent change of station employee relocation payments; ▪ Grant payments; ▪ Purchase card payments; ▪ Lease accounting; ▪ Intragovernmental payments; ▪ Intragovernmental collections;
SECTION I | MANAGEMENT’S DISCUSSION AND ANALYSIS 43
▪ Receivable management; ▪ Property accounting; and ▪ Grants management.
By offering a solution that is proven and operating, and which meets all compliance requirements, a customer is jump-started when coming online with a state-of-the-art, fully configured ERP solution built for financials. FMS’ primary objectives for this shared services effort are to provide the following:
▪ An enterprise financial management service that enables customers to reap the benefits of faster, less expensive, and less risky services as compared with starting with a new ERP or financial management implementation;
▪ Integration with the National Finance Center (NFC) payroll processing services;
▪ Budget status forecasting;
▪ An enterprise grants management service that enables customers to utilize a full life cycle management tool for grants administration that provides visibility to both the government and the grant recipient;
▪ A complete audit-compliant financial solution with full documentation meeting financial requirements;
▪ Continuous process, operational, and organizational improvements for those shared services retained in the future state portfolio;
▪ More powerful and flexible financial management and reporting;
▪ Administrative payments, collections, and certifications;
▪ Editing/auditing capabilities that are 100 percent computerized; and
▪ The best possible customer-focused service and support.
SUCCESSES DURING FISCAL YEAR (FY) 2019
Robotics Process Automation The Robotics and Automation Services Management Office (SMO) provides enterprise-wide collaboration, supports automation for enterprise-wide processes, encourages process improvement/ efficiencies, and acts as a mechanism for USDA to realize the benefits of intelligent automation.
Process automation through Robotics aligns to the Secretary’s top priority, which is to ensure USDA programs are delivered efficiently, effectively, with integrity, and with a focus on customer service. The Robotics and Automation SMO will help achieve the four goals, most notably to “Create a workforce for the 21st century that is highly-skilled, results-oriented, customer-focused, and nimble.”
44 USDA AGENCY FINANCIAL REPORT | 2019
The project team will work with key stakeholders across OCFO and other partner organizations to promote the procedures required to facilitate key decision making and establish and maintain organizational control. To achieve this objective, the team will create multiple deliverables required for the SMO to operate efficiently and effectively both now and in the future. In FY 2019, the following was accomplished:
▪ Developed and deployed three Robotics financial automations into production;
o The automation of the funds distribution process reallocates 2 to 3 hours of manual work per day, automating more than 2,000 documents posted in the Financial Management Modernization Initiative (FMMI);
▪ Supported the President’s Management Agenda (PMA) mandate to reduce the “burden through tools like integrated IT [information technology] and automation software” by implementing Robotic Process Automation (RPA);
▪ Improved the accuracy of budget data entry, reducing keystroke errors;
▪ Produced initial savings of $75,000 in the first year, and will save $2.2 million after Enterprise Expansion;
▪ Operationalized the USDA/RPA SMO governing body for RPA. As the governing body, the SMO owns and is responsible to grow and centralize the RPA program across all business areas of USDA. The SMO is also responsible to review, evaluate, (intake) and develop unique processes from groups inside and outside of OCFO and the Office of the Chief Information Officer (OCIO); and
▪ Established a Robotics reskilling program for RPA Developers and Analysts.
FSA/CCC Financial Improvement Program (FFIP) The Farm Service Agency’s (FSA) financial accounting, including Commodity Credit Corporation’s (CCC) (which is operated by the FSA), is not integrated with the rest of USDA in the FMMI system, creating reconciliation and other issues, which include additional costs to maintain a separate set of systems. Subsequently, the Office of the Secretary directed OCFO to develop a plan to migrate FSA’s accounting into the standard FMMI system.
This project will be a multi-phased, multi-year project that will ultimately move all financial management processes from FSA accounting and feeder systems to FMMI. Simultaneously, FSA will need to fix their feeder systems to create auditable financial data to integrate with FMMI. In FY 2019, the FFIP project:
▪ Successfully established end-to-end outbound connectivity between FMMI and Web-Based Supply Chain Management (WBSCM) for Budget Allotment;
▪ Successfully established end-to-end outbound connectivity between FMMI and WBSCM for Funds Commitment;
SECTION I | MANAGEMENT’S DISCUSSION AND ANALYSIS 45
▪ Initiated Phase 2 of the Farm Production and Conservation (FPAC) Financial Improvement Program (FFIP) for the Unified Export Strategy (UES)/ezFedGrants (eFG) project. The UES system and eFG will interface via web service to transfer claims data and make payments via the FMMI accounting system;
▪ Converted 78 unique programs consisting of 86 open contracts totaling approximately $78 million into FMMI; and
▪ Streamlined the FSA business process by eliminating the need for manual, paper-based payment processing and solved a long outstanding issue related to temporary sequestrations by working with the Office of Management and Budget (OMB). This process also resolved a longstanding issue for the FSA to close many lingering account balances and move to FMMI with clean accounts thereby eliminating a $6 billion abnormal balance condition.
Grants Management Beginning in 2013, the USDA OCFO expanded FMMI to include the eFG grants management solution. The eFG System is an online system used for managing the grant’s entire lifecycle. Members of grant-seeking organizations use the eFG External Portal to view and apply for grant award opportunities, view grant award package documents, and submit claims and reports among other actions. The eFG program is designed for servicing grants to organizations such as educational institutions and research organizations.
On behalf of the OCFO’s FMS, Grant Management Service (GMS) acts as the eFG system owner. The mission of GMS is to provide guidance and leadership in the areas of program management, governance, grants and agreements policy, and IT related to the eFG community. The enterprise grants and agreements management solution encompasses seven USDA agencies and includes more than 50 Financial Assistance Listings, while transforming USDA’s grants and agreements capabilities. GMS supports myriad federal initiatives, such as school lunch programs, home ownership opportunities to low- and moderate-income rural Americans, organic agriculture, and numerous other grant and agreement related programs to better serve the American public. In FY 2019, GMS’ ongoing initiatives include:
▪ Continued the support of implemented formula grants and other functionality for the FFIP Release 2.0 (R2) Foreign Agriculture Service (FAS) UES grants project;
▪ Continued the support of implemented formula grants and other functionality for the National Institute of Food and Agriculture (NIFA);
▪ Deployed 3,350 new FY 2019 agreements and 6,913 (to date) active and draft agreements using eFG, the Department’s grants management solution;
▪ Trained over 1,500 internal and external users on eFG and resolved 2,275 Tier 0-1 tickets;
▪ Implemented a robust user education site, WikiGrants, as an internal repository of eFG related materials, such as user guides, training modules, and frequently asked questions (FAQs) that received 641 unique visitors in FY 2019;
▪ Designed and developed the internal Interagency Agreement (INTR);

46 USDA AGENCY FINANCIAL REPORT | 2019
▪ Continued to support the Pega project, which includes upgrade and enhancements, user experience (UX) and user interface (UI) improvements, and system architecture;
▪ Continued the support of eFG enhancements for the Animal and Plant Health Inspection Service (APHIS);
▪ Engaged Customers through:
o National Extension and Research Administrative Officers Conference (NERAOC),
o USDA’s Financial Management Training (FMT),
o Agricultural Management Services Specialty Crops Program Conference,
o Federal Demonstration Partnership Quarterly Conferences, and
o PegaWorld (eFG external portal).
Other Initiatives OCFO is also working to implement USDA Agencies into Treasury’s G-Invoicing initiative by June 30, 2021. This system will address current Buy/Sell activity by implementing a federal intra-governmental transaction (IGT) Buy/Sell Data Standard and provide transparent access to a common data repository for brokered transactions in accordance with 31 U.S.C. 3512(b) and 3515.
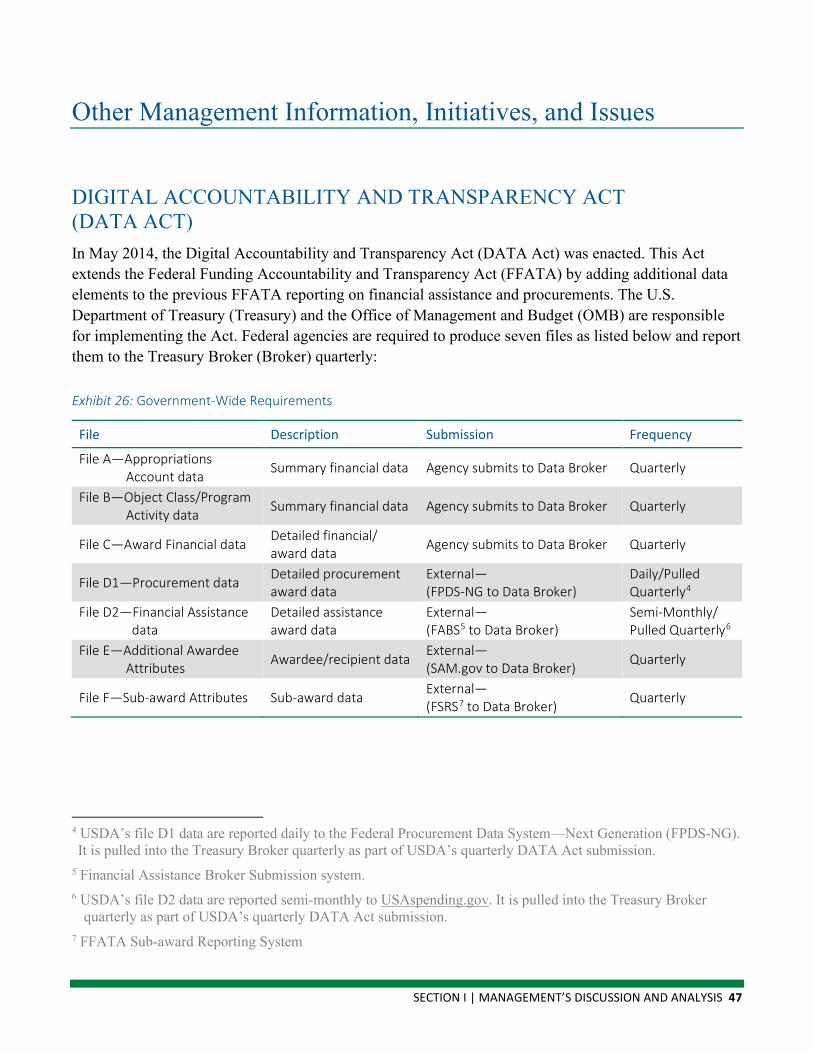
SECTION I | MANAGEMENT’S DISCUSSION AND ANALYSIS 47
Other Management Information, Initiatives, and Issues
DIGITAL ACCOUNTABILITY AND TRANSPARENCY ACT (DATA ACT) In May 2014, the Digital Accountability and Transparency Act (DATA Act) was enacted. This Act extends the Federal Funding Accountability and Transparency Act (FFATA) by adding additional data elements to the previous FFATA reporting on financial assistance and procurements. The U.S. Department of Treasury (Treasury) and the Office of Management and Budget (OMB) are responsible for implementing the Act. Federal agencies are required to produce seven files as listed below and report them to the Treasury Broker (Broker) quarterly:
Exhibit 26: Government-Wide Requirements
File Description Submission Frequency
File A—Appropriations Account data Summary financial data Agency submits to Data Broker Quarterly
File B—Object Class/Program Activity data Summary financial data Agency submits to Data Broker Quarterly
File C—Award Financial data Detailed financial/ award data Agency submits to Data Broker Quarterly
File D1—Procurement data Detailed procurement award data
External— (FPDS-NG to Data Broker)
Daily/Pulled Quarterly4
File D2—Financial Assistance data
Detailed assistance award data
External— (FABS5 to Data Broker)
Semi-Monthly/ Pulled Quarterly6
File E—Additional Awardee Attributes Awardee/recipient data External—
(SAM.gov to Data Broker) Quarterly
File F—Sub-award Attributes Sub-award data External— (FSRS7 to Data Broker) Quarterly
4 USDA’s file D1 data are reported daily to the Federal Procurement Data System—Next Generation (FPDS-NG). It is pulled into the Treasury Broker quarterly as part of USDA’s quarterly DATA Act submission.
5 Financial Assistance Broker Submission system. 6 USDA’s file D2 data are reported semi-monthly to USAspending.gov. It is pulled into the Treasury Broker
quarterly as part of USDA’s quarterly DATA Act submission. 7 FFATA Sub-award Reporting System
48 USDA AGENCY FINANCIAL REPORT | 2019
Government-Wide Implementation OMB and Treasury issue guidance for implementation of the DATA Act. The latest OMB guidance is OMB Memorandum 18-16. This guidance instructs Federal Agencies to develop a DATA Act Data Quality Plan for implementation in fiscal year (FY) 2019. USDA published its DATA Act Data Quality Plan in September 2019.
Treasury maintains data elements and guidelines for reporting in the DATA Act Information Model Schema (DAIMS). DAIMS 1.3.1 was implemented in FY 2019. USDA became compliant with the latest version when it was released in February 2019.
USDA Implementation The Office of the Chief Financial Officer (OCFO) oversees the DATA Act implementation for USDA. OCFO’s Financial Management Services (FMS) manages a data repository for the Department to collect and report all DATA Act elements to the Treasury Broker for publication on the USAspending.gov website. This data repository contains the data necessary to create Files A-C.
USDA reports the following information in compliance with the DATA Act:
▪ Files A-C: The data for Files A-C come from three sources:
o Data are pulled from the Financial Management Modernization Initiative (FMMI) General Ledger (GL).
o The Rural Development (RD) and Farm Service Agencies (FSA) use separate GLs (RD and FSA also have FMMI activity) and submit file A-C data to the repository.
o USDA is also a Financial Shared Service Provider, servicing 23 small government agency clients. All USDA and customer data are held in the FMMI repository.
USDA submitted third-quarter 2019 data to the USAspending.gov website in August 2019. USDA reported all Treasury symbols in File A as being error-free. 99.8 percent of reporting on Budget Object Classification Codes and Program Activity codes in File B passed validation checks. 92.5 percent of the awards financial attributes in File C passed validation checks, a significant improvement over the prior quarters.
▪ File D1: Data are submitted as frequently as daily to the Federal Procurement Data System—Next Generation (FPDS-NG). The Treasury Broker pulls in all data submitted to FPDS-NG at quarter-end for comparison purposes.
o As of June 30, 2019, USDA reported 39,700 procurement award transactions with a value of $3.8 billion.

SECTION I | MANAGEMENT’S DISCUSSION AND ANALYSIS 49
▪ File D2: Data are submitted from USDA Agencies and staff offices to USAspending.gov for posting. Error records are sent back to the Agencies for correction and resubmission.
o As of June 30, 2019, USDA reported 3,783,164 federal financial assistance award transactions with a value of $86.9 billion. The increase in financial assistance awards reported is due, in large part, to the FSA reporting direct payments to farmer and producers for the first time in FY 2019.
▪ Files E and F: Data are pulled by the Treasury broker quarterly; this data are not maintained in Agency systems.
Fourth-quarter data will be reported in November 2019. USDA is focused on improving data quality. USDA began quarterly analysis of transactions that might have been mislabeled and gone unreported. In the third quarter of FY 2019, USDA implemented Parent/Child reporting. This implementation allows USDA to correctly report parent/child relationships with the Departments of Transportation, Labor, Interior, the U.S. Agency for International Development, and the Army Corps of Engineers.
Seven USDA agencies are using the Department’s grants system, which will improve reporting capabilities and will provide standardization for many grants programs. More agencies are exploring migration to the Department’s grants solution, which may potentially yield even more efficiencies and standardization.
OCFO also works with the Office of Contracting and Procurement (OCP) and the Office of Property and Fleet Management (OPFM) to ensure that procurement reporting will adhere to DATA Act requirements. Together, OCFO, OCP, and OPFM are reviewing procurement reporting policies and procedures to ensure that data are reported and certified by the agencies to be both timely and accurate in the Department’s Integrated Acquisition System (IAS), as well as other procurement systems used by USDA. In FY 2019, USDA is also addressing the reporting of SMARTPAY purchases and fleet card transactions. OCFO, OCP, and OPFM issued joint guidance to ensure that SMARTPAY purchases and fleet card transactions are recorded correctly with a Procurement Instrument Identifier in the C and D1 files.
LIMITATIONS OF FINANCIAL STATEMENT The principal financial statements are prepared to report the financial position and results of operations of the reporting entity, pursuant to the requirements of 31 United States Code (U.S.C.) 3515(b). The statements are prepared from the books and records of the entity in accordance with Federal Generally Accepted Accounting Principles (GAAP) and the formats prescribed by the Office of Management and Budget (OMB). Reports used to monitor and control budgetary resources are prepared from the same books and records. The financial statements should be read with the realization that they are for a component of the U.S. Government.
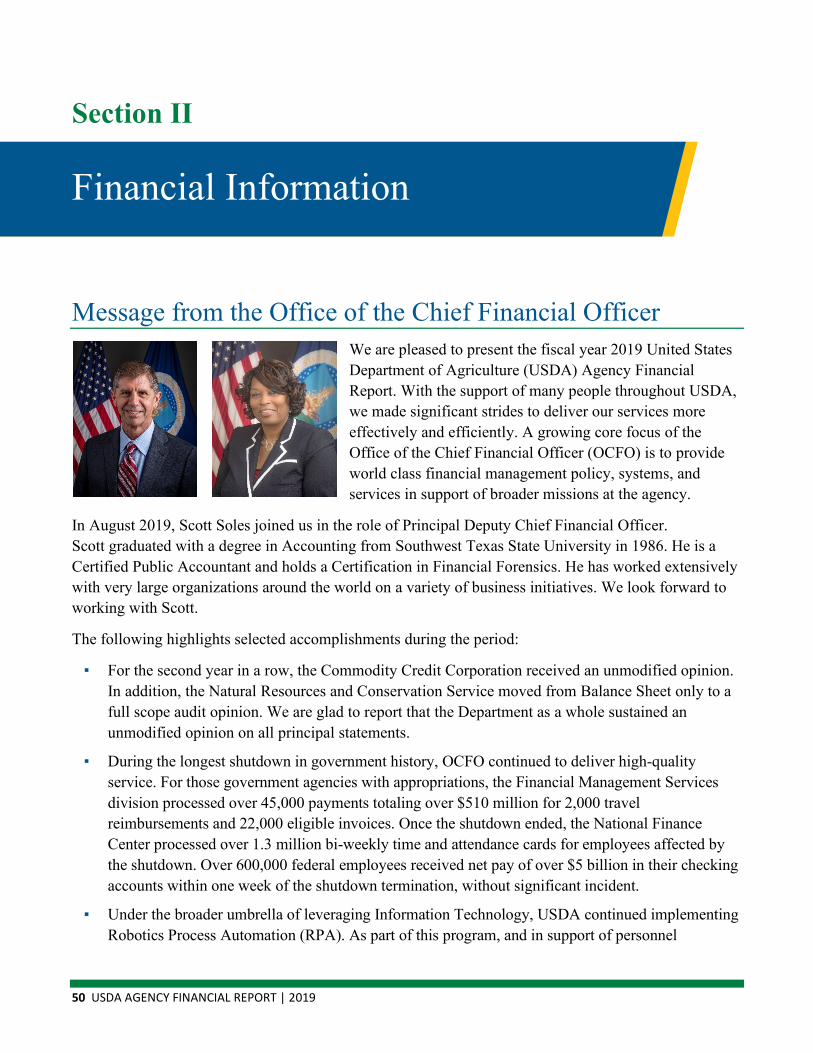
50 USDA AGENCY FINANCIAL REPORT | 2019
Section II
Financial Information
Message from the Office of the Chief Financial Officer We are pleased to present the fiscal year 2019 United States Department of Agriculture (USDA) Agency Financial Report. With the support of many people throughout USDA, we made significant strides to deliver our services more effectively and efficiently. A growing core focus of the Office of the Chief Financial Officer (OCFO) is to provide world class financial management policy, systems, and services in support of broader missions at the agency.
In August 2019, Scott Soles joined us in the role of Principal Deputy Chief Financial Officer. Scott graduated with a degree in Accounting from Southwest Texas State University in 1986. He is a Certified Public Accountant and holds a Certification in Financial Forensics. He has worked extensively with very large organizations around the world on a variety of business initiatives. We look forward to working with Scott.
The following highlights selected accomplishments during the period:
▪ For the second year in a row, the Commodity Credit Corporation received an unmodified opinion. In addition, the Natural Resources and Conservation Service moved from Balance Sheet only to a full scope audit opinion. We are glad to report that the Department as a whole sustained an unmodified opinion on all principal statements.
▪ During the longest shutdown in government history, OCFO continued to deliver high-quality service. For those government agencies with appropriations, the Financial Management Services division processed over 45,000 payments totaling over $510 million for 2,000 travel reimbursements and 22,000 eligible invoices. Once the shutdown ended, the National Finance Center processed over 1.3 million bi-weekly time and attendance cards for employees affected by the shutdown. Over 600,000 federal employees received net pay of over $5 billion in their checking accounts within one week of the shutdown termination, without significant incident.
▪ Under the broader umbrella of leveraging Information Technology, USDA continued implementing Robotics Process Automation (RPA). As part of this program, and in support of personnel
SECTION II | FINANCIAL INFORMATION 51
development programs, we are re-skilling 27 OCFO staff to be RPA Analysts and Developers. OCFO has seven RPA processes in production and over 25 more in development. We designed both a centralized and federated model to provide flexibility to USDA agencies while still ensuring compliance with OCFO and Office of Chief Information Officer documentation and approval standards. In addition, OCFO is partnering with mission areas on RPA initiatives. We are working with the Forest Service to develop processes to improve logistics and tactical procurement efficiency during fire season, and with the Farm Production and Conservation to automate position builds which will enable them to hire staff faster at the county offices to assist farmers and ranchers.
▪ USDA made significant improvements in audit closures during FY 2019.
o The Department’s inventory of open audits decreased from 100 in FY 2018 to 75 in FY 2019, which constitutes a 25 percent decrease in our beginning inventory.
o Component agencies and staff offices closed 50 audits, including 230 recommendations. These audit closures represent a 14 percent increase over the 44 audits closed during FY 2018. Of the 50 audits closed, 47 were more than one year past the management decision date. There was an overall increase of 44 percent in closures of late audits over the FY 2018 level.
o USDA implemented all overdue (FY 2009–FY 2017) information technology security recommendations, which included 18 overdue recommendations. Implementing these recommendations alone closed 11 audits.
o Additionally, many of the oldest audits relate to the disposition of disallowed costs and/or implementation of funds to be put to better use. Increased focus on these types of audits also contributed to the higher closure rate of older audits and significantly improved controls over cybersecurity.
o The number of audits open one or more years without final action at the end of FY 2019 was 53. This number represents an 18 percent decrease from the previous year.
We are proud of our hard-working employees’ accomplishments at USDA. We remain steadfast and committed to making greater financial management improvements. At every level, we are committed to be a proactive, cost-effective organization that is transparent and accountable for the programs we deliver. Ultimately, our efforts will result in setting the highest achievable standard of excellence in managing taxpayers’ dollars.
Lynn M. Moaney Deputy Chief Financial Officer
November 19, 2019
Scott Soles Principal Deputy Chief Financial Officer
November 19, 2019
52 USDA AGENCY FINANCIAL REPORT | 2019
AUDIT REPORT 50401-0018-11 1
Independent Auditor’s Report
Independent Auditors Report
G. Scott SolesPrincipal Deputy Chief Financial OfficerOffice of the Chief Financial Officer
The Department of Agriculture’s Office of Inspector General audited the consolidated financial statements of the Department for fiscal years 2019 and 2018. We also considered USDA’s internal control over financial reporting and tested USDA’s compliance with certain provisions of applicable laws, regulations, contracts, and grant agreements that could have a direct effect on the determination of material financial statement amounts and disclosures on these consolidated financial statements.
The “Findings” section presents the material weaknesses and significant deficiencies in internal control and instances of noncompliance with laws and regulations, as of and for the year ended September 30, 2019. USDA’s response is presented in its entirety in Exhibit A.
Report on the Financial Statements
We have audited the accompanying consolidated financial statements of USDA, which comprise the consolidated balance sheets as of September 30, 2019 and 2018, and the related consolidated statements of net cost, and changes in net position; and the combined statements of budgetary resources for the fiscal years then ended and the related notes to the consolidated financial statements (hereinafter referred to as the “consolidated financial statements”). The objective of our audits was to express an opinion on the fair presentation of these consolidated financial statements.
Management’s Responsibility for the Financial Statements
Management is responsible for the preparation and fair presentation of these consolidated financial statements in accordance with accounting principles generally accepted in the United States of America (U.S.); and the design, implementation, and maintenance of internal controlrelevant to the preparation and fair presentation of financial statements that are free from material misstatement, whether due to fraud or error.
Auditor’s Responsibility
Our responsibility is to express an opinion on these consolidated financial statements based on our audits. We conducted our audits in accordance with auditing standards generally accepted in the U.S.; the standards applicable to financial audits contained in government auditing standards,issued by the Comptroller General of the U.S.; and the Office of Management and Budget (OMB) Bulletin 19-03, Audit Requirements for Federal Financial Statements. Those standards and OMB Bulletin 19-03 require that we plan and perform audits to obtain reasonable assurance about whether the consolidated financial statements are free from material misstatement.
SECTION II | FINANCIAL INFORMATION 53
2 AUDIT REPORT 50401-0018-11
An audit involves performing procedures to obtain audit evidence about the amounts and disclosures in the consolidated financial statements. The procedures selected depend on the auditor’s judgment, including the assessment of the risks of material misstatement of the consolidated financial statements, whether due to fraud or error. In making those risk assessments, the auditor considers internal control relevant to the entity’s preparation and fair presentation of the consolidated financial statements in order to design audit procedures that are appropriate in the circumstances, but not for the purpose of expressing an opinion on the effectiveness of the entity’s internal control. Accordingly, we express no such opinion. An audit also includes evaluating the appropriateness of accounting policies used and the reasonableness of significant accounting estimates made by management, as well as evaluating the overall presentation of the consolidated financial statements. Our audits also included performing such other procedures as we considered necessary in the circumstances.
We believe that the audit evidence we have obtained is sufficient and appropriate to provide a basis for our audit opinion.
Opinion on the Consolidated Financial Statements
In our opinion, the consolidated financial statements referred to above present fairly, in all material respects, the financial position of USDA, as of September 30, 2019 and 2018, and its net costs, changes in net position, and budgetary resources for the years then ended, in accordancewith accounting principles generally accepted in the U.S.
Other Matters
Interactive Data
Management has elected to reference information on websites or other forms of interactive data outside the financial statements to provide additional information for the users of its financial statements. Such information is not a required part of the basic financial statements or supplementary information required by the Federal Accounting Standards Advisory Board (FASAB). The information on these websites has not been subjected to any of our auditing procedures and, accordingly, we do not express an opinion or provide any assurance on it.
Required Supplementary Information
Accounting principles generally accepted in the U.S. issued by the FASAB require that the Management’s Discussion and Analysis (MD&A), Required Supplementary Information (RSI)1,and Required Supplementary Stewardship Information (RSSI) be presented to supplement the consolidated financial statements. Although not a part of the consolidated financial statements, FASAB considers this information to be an essential part of financial reporting for placing the consolidated financial statements in appropriate operational, economic, or historical context. We have applied certain limited procedures to the MD&A, RSI, and RSSI in accordance with auditing standards generally accepted in the U.S., which consisted of inquiries of management
1 The RSI consists of the Deferred Maintenance and Repairs and the Combined Statements of Budgetary Resources (by component), which are included with the financial statements.

54 USDA AGENCY FINANCIAL REPORT | 2019
AUDIT REPORT 50401-0018-11 3
about the methods of preparing and comparing the information for consistency with management’s responses to our inquiries, the consolidated financial statements, and other knowledge we obtained during our audits of the consolidated financial statements. We do not express an opinion or provide any assurance on the information because the limited procedures do not provide us with sufficient evidence to express an opinion or provide any assurance.
Other Information
Our audits were conducted for the purpose of forming an opinion on the consolidated financial statements as a whole. The “Message from the Secretary” and “Other Information” sections are presented for purposes of additional analysis, and are not a required part of the consolidated financial statements or the required supplementary information. This information has not been subjected to the auditing procedures applied in our audits of the consolidated financial statements and, accordingly, we express no opinion and provide no assurance on it.
Other Reporting Required by Government Auditing Standards
Report on Internal Control Over Financial Reporting
In planning and performing our audit of the consolidated financial statements, we consideredUDSA’s internal control over financial reporting to determine the audit procedures that are appropriate in the circumstances for the purpose of expressing our opinion on the consolidated financial statements, but not for the purpose of expressing an opinion on the effectiveness ofUSDA’s internal control. Accordingly, we do not express an opinion on the effectiveness of USDA’s internal control. We did not test all internal controls relevant to operating objectives as broadly defined by the Federal Managers’ Financial Integrity Act of 1982 (FMFIA).
Our consideration of internal control was for the limited purpose described in the preceding paragraph and was not designed to identify all deficiencies in internal control over financial reporting that might be significant deficiencies or material weaknesses, and, therefore, material weaknesses or significant deficiencies may exist that were not identified.
A deficiency in internal control exists when the design or operation of a control does not allow management or employees, in the normal course of performing their assigned functions, to prevent, or detect and correct, misstatements on a timely basis. A material weakness is a deficiency or a combination of deficiencies, in internal control, such that there is a reasonable possibility that a material misstatement of USDA’s consolidated financial statements will not be prevented, or detected and corrected on a timely basis. We consider the deficiencies in overall financial management and information technology (IT) security program, described in “Findings,” Section 1, to be material weaknesses.
A significant deficiency is a deficiency, or combination of deficiencies, in internal control that is less severe than a material weakness, yet important enough to merit attention by those charged with governance. We consider the deficiency in internal control over unliquidated obligations (ULO), described in “Findings,” Section 2, to be a significant deficiency.
SECTION II | FINANCIAL INFORMATION 55
4 AUDIT REPORT 50401-0018-11
Report on Compliance with Laws, Regulations, Contracts, and Grant Agreements
As part of obtaining reasonable assurance about whether USDA’s consolidated financial statements are free of material misstatement, we performed tests of its compliance with certain provisions of laws, regulations, contracts, grant agreements, and Governmentwide policy requirements, noncompliance with which could have a direct effect on the determination of material financial statement amounts and disclosure in the consolidated financial statements. However, providing an opinion on compliance with those provisions was not an objective of our audit and, accordingly, we do not express such an opinion.
Federal Financial Management Improvement Act of 1996 (FFMIA)
We also performed tests of USDA’s compliance with certain provisions referred to in Section 803(a) of FFMIA. Providing an opinion on compliance with FFMIA was not an objective of our engagement and, accordingly, we do not express such an opinion. The results of our tests of FFMIA disclosed instances, described in more detail in Finding 4 in the “Findings,” Section 3, of this report, where USDA was not substantially compliant with Federal Financial Management System Requirements (FFMSR), applicable Federal Accounting Standards, and the U.S. Standard General Ledger (USSGL) at the transaction level.
Antideficiency Act (ADA)
Title 31 U.S. Code (U.S.C.) Section 1517 states that an officer or an employee of the United States Government may not make or authorize an expenditure or obligation exceeding an apportionment or an amount permitted by regulations as prescribed by Title 31 U.S.C. Section 1514. In fiscal year 2019, the Department reported 12 confirmed and 4 potential ADA violations in its agency financial report. Additionally, a potential ADA was reported in the Food and Nutrition Service’s Financial Statements for fiscal years 2019 and 2018 audit report for providing early payment of February 2019 benefits for its Supplemental Nutrition Assistance Program during the lapse in appropriations.
Improper Payments Elimination and Recovery Act of 2010 (IPERA)
During fiscal year 2019, we identified instances of noncompliance with the requirements of IPERA, regarding the design of program internal controls related to reporting improper payments. A separate report will be issued with further details on the Department’s compliance with improper payment requirements.2
Management’s Responsibility for Internal Control and Compliance
USDA’s management is responsible for (1) evaluating the effectiveness of internal control over financial reporting based on criteria established under FMFIA, (2) providing a statement of assurance on the overall effectiveness of internal control over financial reporting, (3) ensuring USDA’s financial management systems are in substantial compliance with FFMIA requirements, and (4) ensuring compliance with other applicable laws, regulations, contracts, and grant agreements.
2 IPERA amended the Improper Payments Information Act of 2002, Public Law 107-300. These two laws address improper payment requirements.
56 USDA AGENCY FINANCIAL REPORT | 2019
AUDIT REPORT 50401-0018-11 5
Auditor’s Responsibilities
We are responsible for (1) obtaining a sufficient understanding of internal control over financial reporting and compliance to plan the audit, (2) testing whether USDA’s financial management systems substantially comply with FFMIA requirements referred to above, and (3) testing compliance with certain provisions of laws, regulations, contracts, and grant agreements that have a direct effect on the determination of material amounts and disclosure in the consolidated financial statements.
We did not evaluate all internal controls relevant to operating objectives as broadly established by FMFIA, such as those controls relevant to preparing statistical reports and ensuring efficient operations. We limited our internal control testing to controls over financial reporting and compliance. Because of inherent limitations, internal control over financial reporting may not prevent, or detect and correct, misstatements due to fraud or error.
We did not test compliance with all laws, regulations, contracts, and grant agreements applicable to USDA. We limited our tests of compliance to certain provisions of laws, regulations, contracts, and grant agreements that have a direct effect on the determination of material amounts and disclosure in the consolidated financial statements that we deemed applicable to USDA’s consolidated financial statements for the fiscal year ended September 30, 2019. We caution that noncompliance may occur and not be detected by these tests.
Management’s Response
Management’s response to the report is presented in Exhibit A. We did not audit USDA’s response and, accordingly, we express no opinion on it.
Purpose of the Report on Internal Control Over Financial Reporting and the Report on Compliance with Laws, Regulations, Contracts, and Grant AgreementsThe purpose of the “Report on Internal Control Over Financial Reporting” and the “Report on Compliance with Laws, Regulations, Contracts, and Grant Agreements” sections of this report is solely to describe the scope of our testing of internal control and compliance and the results of that testing, and not to provide an opinion on the effectiveness of USDA’s internal control or on compliance.
These reports are an integral part of an audit performed in accordance with government auditing standards in considering USDA’s internal control and compliance. Accordingly, these reports are not suitable for any other purpose.
Gil H. HardenAssistant Inspector General for AuditWashington, D.C.November 22, 2019
SECTION II | FINANCIAL INFORMATION 57
6 AUDIT REPORT 50401-0018-11
Findings
Section 1: Material Weaknesses in Internal Control Over Financial Reporting
Finding 1: Improvements are Needed in Overall Financial Management
The material weakness for financial management is due to improvements needed in accounting and internal controls related to the Commodity Credit Corporation (CCC) and Natural Resources Conservation Service (NRCS). In conducting our review, we noted the following areas where improvements are needed in overall financial management. Specifically:
• CCC disclosed material weaknesses related to accounting for budgetary transactions and accounting estimates.
• NRCS disclosed material weaknesses related to controls over obligations and undelivered orders; accounting and controls over expenses; and entity level controls.
In its FMFIA Report on Management Control for fiscal year 2019, the Department reported thefollowing corrective action plans to address the outstanding weaknesses from fiscal year 2018that remain material weaknesses for fiscal year 2019:
• CCC, in fiscal year 2020, plans to continue to implement effective undelivered orders monitoring controls at the program level at all levels of the organization. In addition, CCC plans to create a review and approval process for apportionments that include Budget, Financial Management, Economics and Policy Analysis, and Agency Program leadership to ensure estimates are fully vetted and amounts requested are sufficient.
• NRCS, in fiscal year 2020, plans to enhance Financial Management Modernization Initiative and feeder systems processes to produce aged ULO reports with period of performance data for obligations. In addition, NRCS plans to design, implement and document policies and procedures that include documented internal controls which provide support that NRCS has reviewed the transactional data and assumptions used in its entity-wide expenses accrual process.
Since USDA has actions planned and in progress, we are making no further recommendations herein.
58 USDA AGENCY FINANCIAL REPORT | 2019
AUDIT REPORT 50401-0018-11 7
Finding 2: Improvements are Needed in Overall Information Technology Security Program
As required by the Federal Information Security Modernization Act of 2014 (FISMA), the Office of Inspector General (OIG) reviewed USDA’s ongoing efforts to improve its IT security program and practices during fiscal year 2019.3
USDA continues to take positive steps to improve its IT security posture, but many longstanding weaknesses remain. In fiscal years 2009-2018, OIG made 75 recommendations for improving the overall security of USDA’s systems—71 recommendations are completed and 4 recommendations are scheduled for closure after the date of our report. OIG also issued threenew recommendations based on security weaknesses identified in fiscal year 2019. One recommendation reopens a previously closed recommendation because the implemented remediation was ineffective.
OMB establishes standards for an effective level of security and considers “Managed and Measurable” as a sufficient level. However, OIG found the Department’s maturity level to be at the “Defined” level. Based on OMB’s criteria, the Department’s overall score indicates an ineffective level. In detailed testing of the 67 FISMA Reporting Metrics, OIG found the Department increased its maturity level for 22 metrics. One metric’s maturity level was downgraded because of a new requirement related to supply chain risk management, and the maturity level did not change for 44 metrics. The Department and its agencies must also develop and implement an effective plan to mitigate security weaknesses identified in the prior fiscal yearaudit.
In the report, OIG recommended that the Department review and identify the full population and last review date of all IT policies and procedures, revise them as needed, and disseminate them to employees; create a monitoring plan to ensure that all policies and procedures are reviewed and updated; and remove unauthorized software from USDA systems. The Office of the Chief Information Officer generally agreed with the findings and recommendations in the report.
3 Audit Report 50503-0002-12, U.S. Department of Agriculture, Office of the Chief Information Officer, Fiscal Year2019 Federal Information Security Modernization Act, issued October 2019.
SECTION II | FINANCIAL INFORMATION 59
8 AUDIT REPORT 50401-0018-11
Section 2: Significant Deficiency in Internal Control Over Financial Reporting
Finding 3: Controls Over Unliquidated Obligations Can Be Strengthened
For several years, our report identified deficiencies with controls over inactive ULO.4 This year, our review disclosed that improvements are still needed.
We reviewed the completeness of 10 obligation certifications submitted to the Department for the third quarter of fiscal year 2019; and for those agencies, further reviewed a nonstatistical selection of 143 obligation balances for validity. We found that 28 ULOs were invalid and should have been deobligated prior to the sample date because no future expenditures were expected. In addition, we found that eight intra-departmental ULOs were valid but should have been liquidated in a prior fiscal year. These ULOs inappropriately remained open in part because USDA agencies failed to bill, or submit final payments, to other USDA agencies.
We also found that the ULO certification cutoff dates, cutoff amounts, and transaction types were inconsistent among the agencies tested because each agency developed its own criteria query to obtain the certification population. In addition, not all agencies were using the newreporting tool for the third quarter ULO certifications, at the time of our inactive obligations testing. The Financial Management Modernization Initiative ULO Aging Report reconciles to the general ledger and was developed in response to our fiscal year 2018 recommendation. This report was initially scheduled for use beginning in the second quarter of fiscal year 2019 but was delayed due to implementation problems.
The U.S. Department of the Treasury’s annual closing guidance (Treasury Bulletin 2019-15,Yearend Closing, dated August 23, 2019), requires an annual review of ULOs. Departmental Regulation 2230-1, Reviews of Unliquidated Obligations, dated October 15, 2014, further requires quarterly reviews and certification as to the validity of inactive ULO balances from agency Chief Financial Officers.
Ineffective monitoring and reviewing, as well as inappropriate certifying to the validity of obligation balances, resulted in invalid obligations remaining open. Invalid obligations improperly restrict the availability of funding authority. This increases the risk of misstating obligations as of yearend.
Management generally agreed with our findings and will continue to implement controls over ULOs. In fiscal year 2017, we recommended the Department revise Departmental Regulation 2230, Reviews of Unliquidated Obligations, to assist agencies and staff offices in properly identifying and categorizing the current status of ULOs. The Department is currently in the process of revising the Departmental Regulation; therefore, we are making no further recommendations.
4 An obligation is a binding agreement that will result in outlays, immediately or in the future. Budgetary resources must be available before obligations can be incurred legally.
60 USDA AGENCY FINANCIAL REPORT | 2019
AUDIT REPORT 50401-0018-11 9
Section 3: Noncompliance with Laws and Regulations
Finding 4: Lack of Substantial Compliance with FFMIA Requirements
FFMIA requires agencies to annually assess whether their financial management systems comply substantially with (1) FFMSR, (2) applicable Federal accounting standards, and (3) the USSGL at the transaction level. FFMIA also requires auditors to report in their CFO Act financial statement audit reports whether financial management systems substantially comply with FFMIA’s system requirements. In addition, FISMA requires each agency to report significant information security deficiencies, relating to financial management systems, as a lack of substantial compliance under FFMIA.
During fiscal year 2019, USDA evaluated its financial management systems to assess compliance with FFMIA. The Department reported that it was not compliant with FFMSR, applicable accounting standards, USSGL at the transaction level, and FISMA requirements. As noted in its MD&A, USDA continues its work to meet FFMIA and FISMA objectives.
Specifically, in its FFMIA and FMFIA reports, the Department reported an ineffective information security program due to many longstanding weaknesses with outstanding recommendations. See Finding 2 of this report for more details.
Additionally, in its FFMIA report, the Department noted noncompliance by two of its component agencies relating to financial management, described below.
1. CCC noncompliance with Federal accounting standards and USSGL at the transaction level was noted for weaknesses in budgetary transactions and accounting estimates. The financial management systems did not record certain accounting events at the transactionlevel in accordance with USSGL. CCC continues to make significant progress in performing compensating controls over the accounting for obligation activity. CCCcontinues implementing its program obligation activity into FMMI in a phased approach.
2. NRCS’ deficiencies in applicable Federal accounting standards, including the USSGL at the transaction level, were noted for obligations incurred, including accrued expenses and undelivered orders; recoveries of unpaid obligations; and unexpended appropriations as it relates to accrued expenses. NRCS continues working to mitigate auditor-identified deficiencies and substantially comply with FFMIA.
See Finding 1 of this report for more details on NRCS and CCC issues.
Due to planned actions, we are making no further recommendations in this report.
SECTION II | FINANCIAL INFORMATION 61
Agency Response to Auditors Report
United StatesDepartment ofAgriculture
Office of the ChiefFinancial Officer
1400 IndependenceAvenue, SW
Washington, DC20250
November 22, 2019
TO: Phyllis K. Fong Inspector GeneralOffice of Inspector General
FROM: G. Scott Soles /S/Principal Deputy Chief Financial Officer
Lynn Moaney /S/Deputy Chief Financial Officer
SUBJECT: U.S. Department of Agriculture’s Financial Statements for Fiscal Years2019 and 2018
The Department is pleased to respond to your audit report on the financial statements for fiscal years 2019 and 2018.
We concur with the findings in the report. We will continue with actions planned and in progress to address the findings.
I would like to express my appreciation for the cooperation and professionalism displayed by your staff and your contract auditors during the audit.
AN EQUAL OPPORTUNITY EMPLOYER

62 USDA AGENCY FINANCIAL REPORT | 2019
Financial Statements
CONSOLIDATED BALANCE SHEETS As of September 30, 2019, and 2018 ($ in millions)
Item 2019 2018
Assets (Note 2): Intragovernmental:
Fund Balance with Treasury (Note 3) $ 153,468 $ 132,350 Investments (Note 5) 233 228 Accounts Receivable (Note 6) 79 78 Other (Note 11) 12 9
Total Intragovernmental 153,792 132,665
Cash and Other Monetary Assets (Note 4) 550 236 Investments (Note 5) 3 3 Accounts Receivable, Net (Note 6) 3,835 1,114 Direct Loan and Loan Guarantees, Net (Note 7) 104,255 101,947 Inventory and Related Property, Net (Note 8) 23 46 General Property, Plant, and Equipment, Net (Note 9) 2,249 2,224 Other (Note 11) 388 539
Total Assets 265,095 238,774
Stewardship PP&E (Note 10) Liabilities (Note 12):
Intragovernmental Accounts Payable 1 3 Debt (Note 13) 139,678 119,423 Other (Note 15) 9,901 9,910
Total Intragovernmental 149,580 129,336
Accounts Payable 2,234 1,854 Loan Guarantee Liability (Note 7) 434 502 Actuarial Federal Employees’ Compensation Act (FECA) Liability 782 892 Environmental and Disposal Liabilities (Note 14) 218 200 Benefits Due and Payable 5,147 5,074 Other (Notes 15 & 16) 20,586 23,258 Total Liabilities 178,981 161,116
Commitments and Contingencies (Note 17)
Net Position: Unexpended Appropriations - Funds From Dedicated Collections (Combined) (Note 18) 180 168 Unexpended Appropriations - All Other Funds (Combined) 71,271 65,238 Cumulative Results of Operations - Funds From Dedicated Collections (Combined) (Note 18) 3,331 2,243 Cumulative Results of Operations - All Other Funds (Combined) 11,332 10,009
Total Net Position - Funds From Dedicated Collections (Combined Totals) (Note 18) 3,511 2,411 Total Net Position - All Other Funds (Combined Totals) 82,603 75,247
Total Net Position 86,114 77,658 Total Liabilities and Net Position $ 265,095 $ 238,774
The accompanying notes are an integral part of these statements.
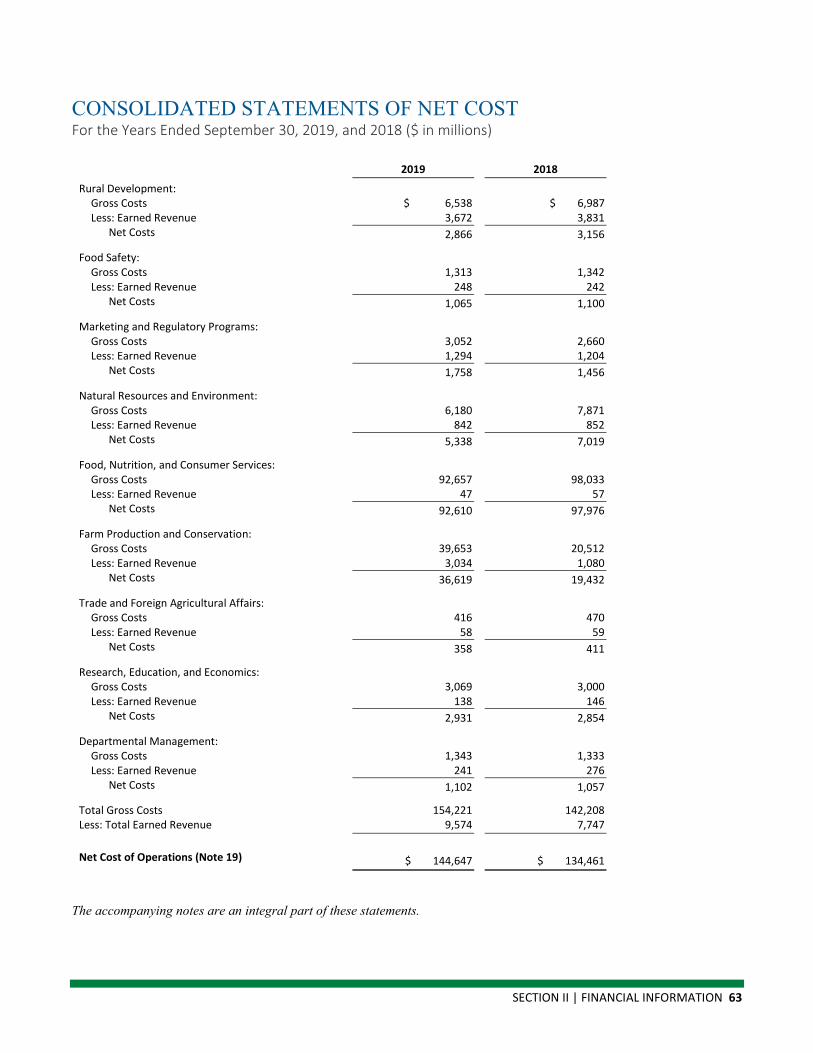
SECTION II | FINANCIAL INFORMATION 63
CONSOLIDATED STATEMENTS OF NET COST For the Years Ended September 30, 2019, and 2018 ($ in millions)
Item 2019 2018
Rural Development: Gross Costs $ 6,538 $ 6,987 Less: Earned Revenue 3,672 3,831
Net Costs 2,866 3,156
Food Safety: Gross Costs 1,313 1,342 Less: Earned Revenue 248 242
Net Costs 1,065 1,100
Marketing and Regulatory Programs: Gross Costs 3,052 2,660 Less: Earned Revenue 1,294 1,204
Net Costs 1,758 1,456
Natural Resources and Environment: Gross Costs 6,180 7,871 Less: Earned Revenue 842 852
Net Costs 5,338 7,019
Food, Nutrition, and Consumer Services: Gross Costs 92,657 98,033 Less: Earned Revenue 47 57
Net Costs 92,610 97,976
Farm Production and Conservation: Gross Costs 39,653 20,512 Less: Earned Revenue 3,034 1,080
Net Costs 36,619 19,432
Trade and Foreign Agricultural Affairs: Gross Costs 416 470 Less: Earned Revenue 58 59
Net Costs 358 411
Research, Education, and Economics: Gross Costs 3,069 3,000 Less: Earned Revenue 138 146
Net Costs 2,931 2,854
Departmental Management: Gross Costs 1,343 1,333 Less: Earned Revenue 241 276
Net Costs 1,102 1,057
Total Gross Costs 154,221 142,208 Less: Total Earned Revenue 9,574 7,747
Net Cost of Operations (Note 19) $ 144,647 $ 134,461
The accompanying notes are an integral part of these statements.
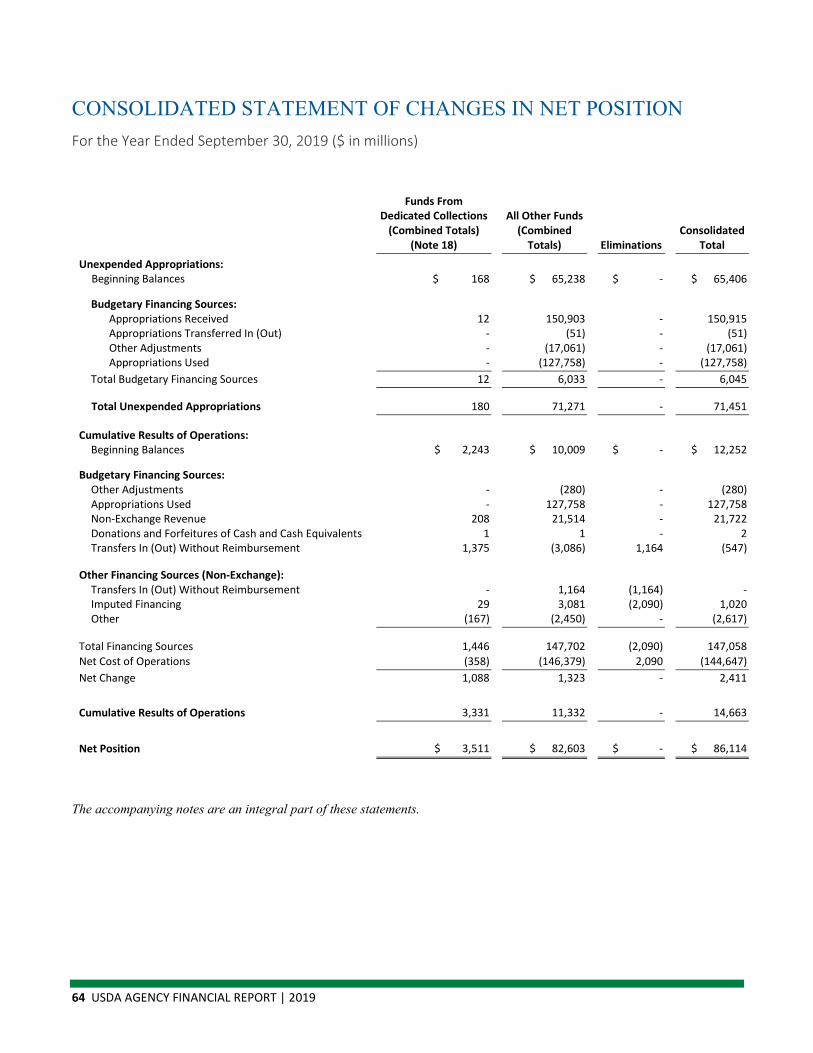
64 USDA AGENCY FINANCIAL REPORT | 2019
CONSOLIDATED STATEMENT OF CHANGES IN NET POSITION For the Year Ended September 30, 2019 ($ in millions)
Item
Funds From Dedicated Collections
(Combined Totals) (Note 18)
All Other Funds (Combined
Totals) Eliminations Consolidated
Total
Unexpended Appropriations: Beginning Balances $ 168 $ 65,238 $ - $ 65,406
Budgetary Financing Sources: Appropriations Received 12 150,903 - 150,915 Appropriations Transferred In (Out) - (51) - (51) Other Adjustments - (17,061) - (17,061) Appropriations Used - (127,758) - (127,758)
Total Budgetary Financing Sources 12 6,033 - 6,045
Total Unexpended Appropriations 180 71,271 - 71,451
Cumulative Results of Operations: Beginning Balances $ 2,243 $ 10,009 $ - $ 12,252
Budgetary Financing Sources: Other Adjustments - (280) - (280) Appropriations Used - 127,758 - 127,758 Non-Exchange Revenue 208 21,514 - 21,722 Donations and Forfeitures of Cash and Cash Equivalents 1 1 - 2 Transfers In (Out) Without Reimbursement 1,375 (3,086) 1,164 (547)
Other Financing Sources (Non-Exchange): Transfers In (Out) Without Reimbursement - 1,164 (1,164) - Imputed Financing 29 3,081 (2,090) 1,020 Other (167) (2,450) - (2,617)
Total Financing Sources 1,446 147,702 (2,090) 147,058 Net Cost of Operations (358) (146,379) 2,090 (144,647) Net Change 1,088 1,323 - 2,411
Cumulative Results of Operations 3,331 11,332 - 14,663
Net Position $ 3,511 $ 82,603 $ - $ 86,114
The accompanying notes are an integral part of these statements.

SECTION II | FINANCIAL INFORMATION 65
CONSOLIDATED STATEMENT OF CHANGES IN NET POSITION For the Year Ended September 30, 2018 ($ in millions)
Item Funds From Dedicated Collections
(Combined Totals) (Note 18)
All Other Funds (Combined
Totals) Eliminations Consolidated
Total
Unexpended Appropriations: Beginning Balances $ 156 $ 55,947 $ - $ 56,103
Budgetary Financing Sources: Appropriations Received 12 148,936 - 148,948 Appropriations Transferred In (Out) - 1 - 1 Other Adjustments - (8,764) - (8,764) Appropriations Used - (130,882) - (130,882)
Total Budgetary Financing Sources 12 9,291 - 9,303
Total Unexpended Appropriations 168 65,238 - 65,406
Cumulative Results of Operations: Beginning Balances 2,270 2,989 - 5,259
Budgetary Financing Sources: Other Adjustments - (285) - (285) Appropriations Used - 130,882 - 130,882 Non-Exchange Revenue - 8 - 8 Donations and Forfeitures of Cash and Cash Equivalents 1 1 - 2 Transfers In (Out) Without Reimbursement 513 10,345 1,220 12,078
Other Financing Sources (Non-Exchange): Transfers In (Out) without Reimbursement - 1,219 (1,220) (1) Imputed Financing 54 3,288 (2,355) 987 Other 33 (2,250) - (2,217)
Total Financing Sources 601 143,208 (2,355) 141,454 Net Cost of Operations (628) (136,188) 2,355 (134,461) Net Change (27) 7,020 - 6,993
Cumulative Results of Operations 2,243 10,009 - 12,252
Net Position $ 2,411 $ 75,247 $ - $ 77,658
The accompanying notes are an integral part of these statements.
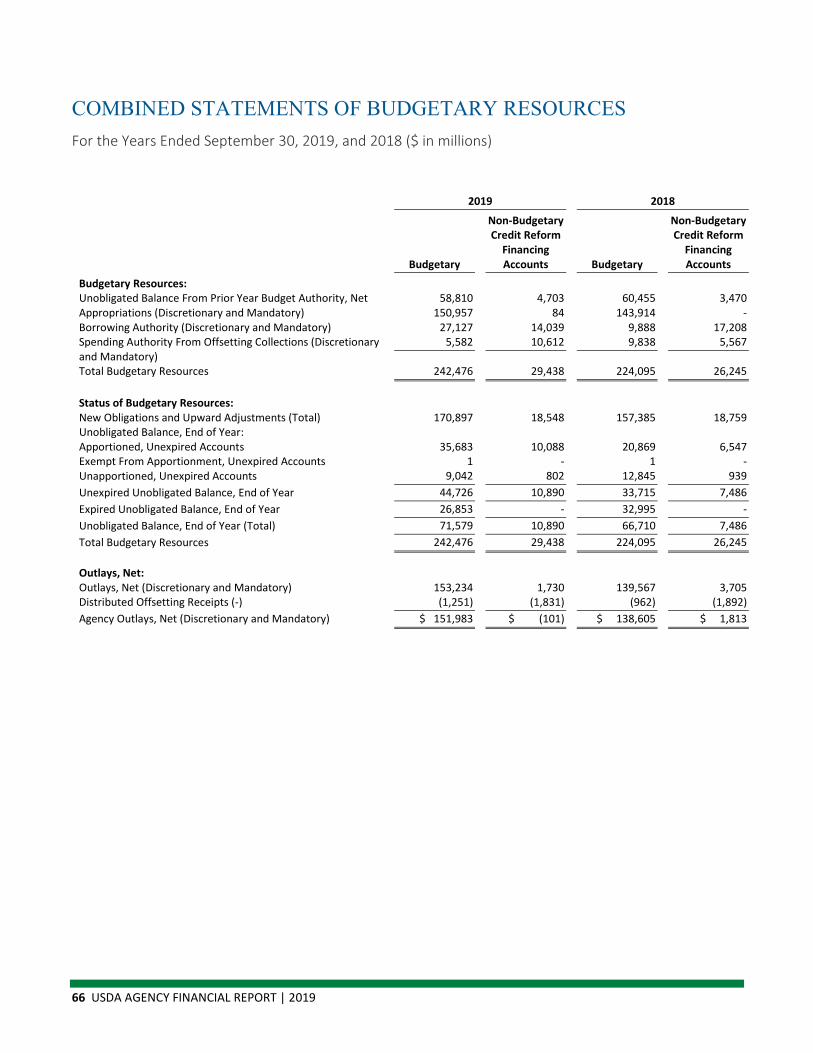
66 USDA AGENCY FINANCIAL REPORT | 2019
COMBINED STATEMENTS OF BUDGETARY RESOURCES For the Years Ended September 30, 2019, and 2018 ($ in millions)
2019 2018
Item
Budgetary
Non-Budgetary Credit Reform
Financing Accounts Budgetary
Non-Budgetary Credit Reform
Financing Accounts
Budgetary Resources: Unobligated Balance From Prior Year Budget Authority, Net 58,810 4,703 60,455 3,470 Appropriations (Discretionary and Mandatory) 150,957 84 143,914 - Borrowing Authority (Discretionary and Mandatory) 27,127 14,039 9,888 17,208 Spending Authority From Offsetting Collections (Discretionary and Mandatory)
5,582 10,612 9,838 5,567
Total Budgetary Resources 242,476 29,438 224,095 26,245
Status of Budgetary Resources: New Obligations and Upward Adjustments (Total) 170,897 18,548 157,385 18,759 Unobligated Balance, End of Year: Apportioned, Unexpired Accounts 35,683 10,088 20,869 6,547 Exempt From Apportionment, Unexpired Accounts 1 - 1 - Unapportioned, Unexpired Accounts 9,042 802 12,845 939 Unexpired Unobligated Balance, End of Year 44,726 10,890 33,715 7,486 Expired Unobligated Balance, End of Year 26,853 - 32,995 - Unobligated Balance, End of Year (Total) 71,579 10,890 66,710 7,486 Total Budgetary Resources 242,476 29,438 224,095 26,245
Outlays, Net: Outlays, Net (Discretionary and Mandatory) 153,234 1,730 139,567 3,705 Distributed Offsetting Receipts (-) (1,251) (1,831) (962) (1,892) Agency Outlays, Net (Discretionary and Mandatory) $ 151,983 $ (101) $ 138,605 $ 1,813

SECTION II | FINANCIAL INFORMATION 67
Notes to the Financial Statements As of September 30, 2019, and 2018 ($ in millions)
NOTE 1: Significant Accounting Policies
Organization USDA provides a wide variety of services in the United States and around the world. USDA is organized into eight distinct mission areas and their agencies that execute these missions. See MD&A for listing of the missions and the agencies within each mission.
Consolidation The financial statements consolidate all of the agencies’ results. The effects of intradepartmental activity and balances are eliminated, except for the Statement of Budgetary Resources (SBR) which is presented on a combined basis. The financial statements are prepared in accordance with generally accepted accounting principles for the Federal Government.
Use of Estimates The preparation of financial statements requires management to make estimates and assumptions that affect the amounts reported in the financial statements and accompanying notes. Actual results could differ from those estimates.
Revenue and Other Financing Sources Revenue from exchange transactions is recognized when persuasive evidence of an arrangement exists, delivery has occurred or services have been rendered, sales price is fixed or determinable, and collection is reasonably assured. In certain cases, the prices charged by the Department are set by law or regulation, which for program and other reasons may not represent full cost. Prices set for products and services offered through the Department’s working capital funds are intended to recover the full costs incurred by these activities. Revenue from non-exchange transactions is recognized when a specifically identifiable, legally enforceable claim to resources arises, to the extent that collection is probable and the amount is reasonably estimable. Appropriations are recognized as a financing source when used. An imputed financing source is recognized for costs subsidized by other Government entities.
Investments The Department is authorized to invest certain funds in excess of its immediate needs in Treasury securities. Investments in non-marketable par value Treasury securities are classified as held to maturity and are carried at cost. Investments in market-based Treasury securities are classified as held to maturity
68 USDA AGENCY FINANCIAL REPORT | 2019
and are carried at amortized cost. The amortized cost of securities is based on the purchase price adjusted for amortization of premiums and accretion of discounts using the straight-line method over the term of the securities.
Accounts Receivable Accounts receivable are reduced to net realizable value by an allowance for uncollectible accounts. The adequacy of the allowance is determined based on past experience and age of outstanding balances.
Direct Loans and Loan Guarantees Direct loans obligated and loan guarantees committed after FY 1991 are reported based on the present value of the net cash-flows estimated over the life of the loan or guarantee. The difference between the outstanding principal of the loans and the present value of their net cash inflows is recognized as a subsidy cost allowance; the present value of estimated net cash outflows of the loan guarantees is recognized as a liability for loan guarantees. The subsidy expense for direct or guaranteed loans disbursed during the year is the present value of estimated net cash outflows for those loans or guarantees. A subsidy expense also is recognized for modifications made during the year to loans and guarantees outstanding and for reestimates made as of the end of the year to the subsidy allowances or loan guarantee liability for loans and guarantees outstanding.
Direct loans obligated and loan guarantees committed before FY 1992 are valued using either the present-value or net realizable methods. Under the present-value method, the outstanding principal of direct loans is reduced by an allowance equal to the difference between the outstanding principal and the present value of the expected net cash flows. The liability for loan guarantees is the present value of expected net cash outflows due to the loan guarantees. Under the net realizable value method, the average rate of the last five years of write-offs is used.
Inventories and Related Property Inventories to be consumed in the production of goods for sale or in the provision of services for a fee are valued on the basis of historical cost using a first-in, first-out method. Commodities are valued at the lower of cost or net realizable value using a weighted average method.
Property, Plant and Equipment Property, Plant and Equipment (PP&E) are stated at cost less accumulated depreciation. Depreciation is determined using the straight-line method over the estimated useful lives of the assets. Useful lives for PP&E are disclosed in Note 9. Capitalization thresholds for personal property and real property are $25,000; and $100,000 for internal use software. There are no restrictions on the use or convertibility of PP&E.
SECTION II | FINANCIAL INFORMATION 69
Pension and Other Retirement Benefits Pension and other retirement benefits (primarily retirement health care benefits) expense is recognized at the time the employees’ services are rendered. The expense is equal to the actuarial present value of benefits attributed by the pension plan’s benefit formula, less the amount contributed by the employees. An imputed cost is recognized for the difference between the expense and contributions made by and for employees.
Other Post-Employment Benefits Other post-employment benefits expense for former or inactive (but not retired) employees is recognized when a future outflow or other sacrifice of resources is probable and measurable on the basis of events occurring on or before the reporting date. The liability for long-term other post-employment benefits is the present value of future payments.
Workers’ Compensation Benefits The Federal Employees’ Compensation Act (FECA) provides wage replacement and medical cost protection to covered Federal civilian employees injured on the job, employees who have incurred a work-related occupational disease, and beneficiaries of employees whose death is attributable to a job-related injury or occupational disease. The FECA program is administered by the U.S. Department of Labor (DOL), which initially pays valid claims and subsequently seeks reimbursement from the Federal agencies employing the claimants. DOL provides the actuarial liability for claims outstanding at the end of each fiscal year. This liability includes the estimated future costs of death benefits, workers’ wage replacement, medical, and miscellaneous costs for approved compensation cases.
Funds from Dedicated Collections In accordance with Statement of Federal Financial Accounting Standards (SFFAS) 43, Funds from Dedicated Collections, USDA has reported the funds from dedicated collections for which it has program management responsibility when the following three criteria are met: 1) a statute committing the Federal Government to use specifically identified revenues and/or other financing sources that are originally provided to the Federal Government by a non-Federal source only for designated activities, benefits or purposes; 2) explicit authority for the fund to retain revenues and/or other financing sources not used in the current period for future use to finance the designated activities, benefits, or purposes; and 3) a requirement to account for and report on the receipt, use, and retention of the revenues and/or other financing sources that distinguishes the fund from the Federal Government’s general revenues.
Contingencies Contingent liabilities are recognized when a past event or exchange transaction has occurred, a future outflow or other sacrifice of resources is probable, and the future outflow or sacrifice of resources is measurable.
70 USDA AGENCY FINANCIAL REPORT | 2019
Allocation Transfers USDA is a party to allocation transfers with other Federal agencies as both a transferring (parent) entity and/or a receiving (child) entity. Allocation transfers are legal delegations by one department of its authority to obligate budget authority and outlay funds to another department. A separate fund account (allocation account) is created in the U.S. Treasury as a subset of the parent fund account for tracking and reporting purposes. All allocation transfers of balances are credited to this account, and subsequent obligations and outlays incurred by the child entity are charged to this allocation account as they execute the delegated activity on behalf of the parent entity.
USDA allocates funds, as the parent, to a number of U.S. Government agencies, including: Department of the Interior, Department of Defense, Department of Housing and Urban Development, Agency for International Development and the Small Business Administration. USDA receives allocation transfers, as the child, from the Department of Labor, Department of Transportation, Department of the Interior, Agency for International Development, Economic Development Administration, Appalachian Regional Commission and the Delta Regional Authority.
Inter-Entity Costs Goods and services are received from other federal entities at no cost or at a cost less than the full cost to the providing federal entity. Consistent with accounting standards, certain costs of the providing entity that are not fully reimbursed by the Department are recognized as imputed cost [in the Statement of Net Cost] and are offset by imputed revenue [in the Statement of Changes in Net Position]. Such imputed costs and revenues relate to business-type activities (if applicable), employee benefits, and claims to be settled by the Treasury Judgment Fund. However, unreimbursed costs of goods and services other than those identified above are not included in our financial statements.
Fiduciary Activities Fiduciary activities are the collection or receipt, and the management, protection, accounting, investment, and disposition by the Federal Government of cash or other assets in which non Federal individuals or entities have an ownership interest that the Federal Government must uphold. Fiduciary assets are not assets of the Federal Government and are not recognized on the balance sheet.
Asbestos-Related Cleanup Costs Effective October 1, 2012, Technical Bulletin (TB) 2006-1, Recognition and Measurement of Asbestos-Related Cleanup Costs, as amended, requires an estimate of both friable and non friable asbestos-related cleanup costs; recognition of a liability and related expense for those costs that are both probable and reasonably estimable; and disclosure of information related to friable and non-friable asbestos-related cleanup costs that are probable but not reasonably estimable in a note to the financial statements.
SECTION II | FINANCIAL INFORMATION 71
Deferred Maintenance and Repairs Deferred maintenance and repairs are such that were not performed when they should have been or were scheduled to be and which are put off or delayed for a future period. Maintenance and repairs are activities directed toward keeping fixed assets in an acceptable condition. Activities include preventive maintenance; replacement of parts, systems, or components; and other activities needed to preserve or maintain the asset. Maintenance and repairs, as distinguished from capital improvements, exclude activities directed towards expanding the capacity of an asset or otherwise upgrading it to serve needs different from, or significantly greater than, its current use. SFFAS 42, Deferred Maintenance and Repairs: Amending Statements of Federal Financial Accounting Standards 6, 14, 29 and 32, became effective October 1, 2014. Estimates for deferred maintenance and repairs are disclosed in required supplementary information.
Reconciliation of Net Cost to Net Outlays SFFAS 53, Budget and Accrual Reconciliation (BAR) amends requirements for a reconciliation between budgetary and financial accounting information established by SFFAS 7, Accounting for Revenue and Other Financing Sources and Concepts for Reconciling Budgetary and Financial Accounting. The BAR explains the relationship between the entity’s net outlays on a budgetary basis and the net cost of operations during the reporting period.
Insurance Programs SFFAS 51, Insurance Programs, effective for the period beginning after September 30, 2018, establishes accounting and financial reporting standards for insurance programs. It provides standards to ensure that insurance programs are adequately defined and report consistent information about the liabilities for losses incurred and claimed as well as expected losses during remaining coverage. These standards replace the insurance and guarantee program standards provided in paragraphs 97-121 of SFFAS 5, Accounting for Liabilities of the Federal Government.
Classified Activities Accounting standards require all reporting entities to disclose that accounting standards allow certain presentations and disclosures to be modified, if needed, to prevent the disclosure of classified information.
Reclassifications Note 29, Reconciliation of Net Cost to Net Outlays was reclassified to conform to the current year presentation for loans receivable, other liabilities, and other components of the budget outlays that are not part of net operating cost.
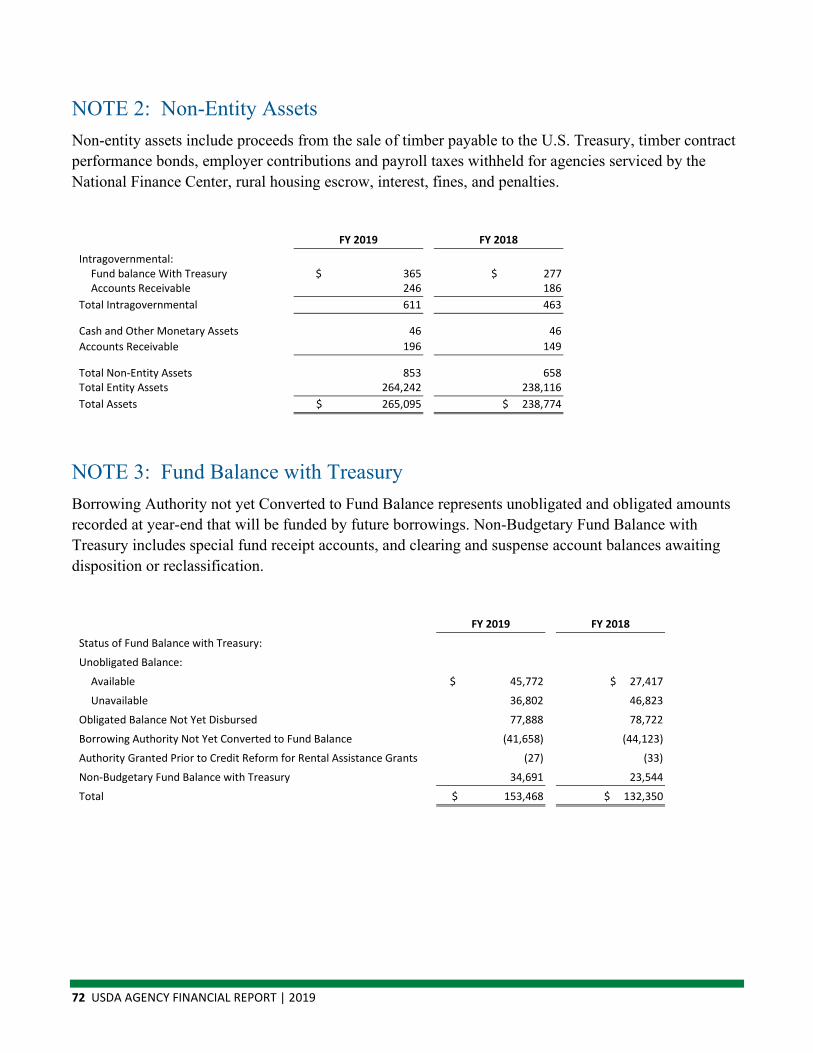
72 USDA AGENCY FINANCIAL REPORT | 2019
NOTE 2: Non-Entity Assets Non-entity assets include proceeds from the sale of timber payable to the U.S. Treasury, timber contract performance bonds, employer contributions and payroll taxes withheld for agencies serviced by the National Finance Center, rural housing escrow, interest, fines, and penalties.
Item FY 2019 FY 2018
Intragovernmental: Fund balance With Treasury $ 365 $ 277 Accounts Receivable 246 186
Total Intragovernmental 611 463
Cash and Other Monetary Assets 46 46 Accounts Receivable 196 149
Total Non-Entity Assets 853 658 Total Entity Assets 264,242 238,116 Total Assets $ 265,095 $ 238,774
NOTE 3: Fund Balance with Treasury Borrowing Authority not yet Converted to Fund Balance represents unobligated and obligated amounts recorded at year-end that will be funded by future borrowings. Non-Budgetary Fund Balance with Treasury includes special fund receipt accounts, and clearing and suspense account balances awaiting disposition or reclassification.
Item FY 2019 FY 2018
Status of Fund Balance with Treasury:
Unobligated Balance:
Available $ 45,772 $ 27,417
Unavailable 36,802 46,823
Obligated Balance Not Yet Disbursed 77,888 78,722
Borrowing Authority Not Yet Converted to Fund Balance (41,658) (44,123)
Authority Granted Prior to Credit Reform for Rental Assistance Grants (27) (33)
Non-Budgetary Fund Balance with Treasury 34,691 23,544
Total $ 153,468 $ 132,350

SECTION II | FINANCIAL INFORMATION 73
NOTE 4: Cash and Other Monetary Assets For FY 2019 and FY 2018, cash and other monetary assets consists of Federal crop insurance escrow of $390 million and $119 million, deposits in transit of $114 million and $71 million, and single-family housing escrow of $46 million and $46 million, respectively.
Item FY 2019 FY 2018
Cash $ 550 $ 236
NOTE 5: Investments
FY 2019 Amortization
Method Cost
Amortized (Premium) Discount
Interest Receivable
Investments, Net
Market Value
Disclosure
Intragovernmental: Non-Marketable
Par Value
$ - $ - $ - $ - $ - Market-Based Straight Line 232 - 1 233 233
Total
$ 232 $ - $ 1 $ 233 $ 233
With the Public: Alternative Agricultural Research and Commercialization Corporation
$ 3 $ - $ - $ 3 $ 3 Total
$ 3 $ - $ - $ 3 $ 3
FY 2018 Amortization
Method Cost
Amortized (Premium) Discount
Interest Receivable
Investments, Net
Market Value
Disclosure
Intragovernmental: Non-Marketable
Par Value
$ - $ - $ - $ - $ - Market-Based Straight Line 227 - 1 228 228
Total
$ 227 $ - $ 1 $ 228 $ 228
With the Public: Alternative Agricultural Research and Commercialization Corporation
$ 3 $ - $ - $ 3 $ 3 Total
$ 3 $ - $ - $ 3 $ 3
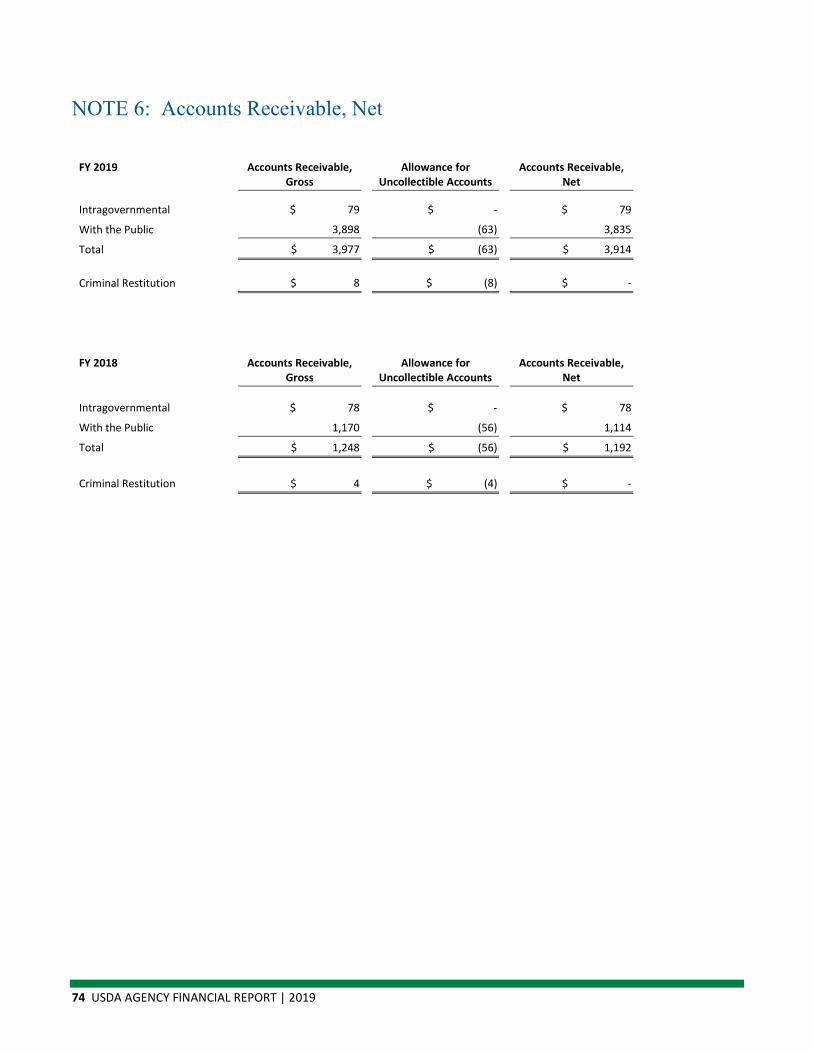
74 USDA AGENCY FINANCIAL REPORT | 2019
NOTE 6: Accounts Receivable, Net
FY 2019 Accounts Receivable, Gross
Allowance for Uncollectible Accounts
Accounts Receivable, Net
Intragovernmental $ 79 $ - $ 79
With the Public 3,898 (63) 3,835
Total $ 3,977 $ (63) $ 3,914
Criminal Restitution $ 8 $ (8) $ -
FY 2018 Accounts Receivable, Gross
Allowance for Uncollectible Accounts
Accounts Receivable, Net
Intragovernmental $ 78 $ - $ 78
With the Public 1,170 (56) 1,114
Total $ 1,248 $ (56) $ 1,192
Criminal Restitution $ 4 $ (4) $ -

SECTION II | FINANCIAL INFORMATION 75
NOTE 7: Direct Loans and Loan Guarantees, Net
Direct Loans Direct loan obligations or loan guarantee commitments made pre-1992 and the resulting direct loans or loan guarantees are reported at either net present-value or net realizable value.
Direct loan obligations or loan guarantee commitments made post-1991 and the Federal Credit Reform Act of 1990 as amended, govern the resulting direct loan or loan guarantees. The Act requires agencies to estimate the cost of direct loans and loan guarantees at present value for the budget. Additionally, the present value of the subsidy costs (i.e., interest rate differentials, interest subsidies, delinquencies and defaults, fee offsets, and other cash flows) associated with direct loans and loan guarantees are recognized as a cost in the year the loan or loan guarantee is disbursed. The net present value of loans or defaulted guaranteed loans receivable at any point in time is the amount of the gross loan or defaulted guaranteed loans receivable less the present value of the subsidy at that time.
The net present value of Direct Loan and Loan Guarantees, Net is not necessarily representative of the proceeds that might be expected if these loans were sold on the open market.
Direct Loan and Loan Guarantees, Net at the end of FY 2019 was $104,255 million compared to $101,947 million at the end of FY 2018. Loans exempt from the Federal Credit Reform Act of 1990 represent $569 million of the total compared to $475 million in FY 2018. Table 1 illustrates the overall composition of the Department’s credit program balance sheet portfolio by mission area and credit program for FY 2019 and FY 2018.
Beginning in FY 2012, advance payments surpassed the loans receivable balance in the Rural Utilities Liquidating Fund. This was due to an increased volume in advance payments and a normal reduction to the Liquidating Portfolio. The Omnibus Budget Act of 1987, section 313, authorized the accumulation of Cushion of Credit (CoC) in the Revolving Fund. Borrowers may make advance payments up to their liquidating and financing total Rural Utilities Service debt. To accurately represent the value of Electric and Telecommunication assets, RD reports the CoC amounts as a separate line item in Table 1.
During the fiscal year, the gross outstanding balance of the direct loans obligated post-1991 is adjusted by the value of the subsidy cost allowance held against those loans. Current year subsidy expense, modifications and reestimates all contribute to the change of the subsidy cost allowance throughout the year. The subsidy cost allowance moved from $4,102 million to $4,611 million during FY 2019, an increase of $509 million. Table 2 shows the subsidy cost allowance balances for FY 2019.
Total direct loan subsidy expense is a combination of subsidy expense for new direct loans disbursed in the current year, modifications to existing loans, and interest rate and technical reestimates to existing loans. Total direct loan subsidy expense in FY 2019 was $341 million compared to $112 million in FY 2018. Table 3 illustrates the breakdown of total subsidy expense for FY 2019 and FY 2018 by program.

76 USDA AGENCY FINANCIAL REPORT | 2019
Direct loan volume increased from $9,221 million in FY 2018 to $10,453 million in FY 2019. Volume distribution between mission area and program is shown in Table 4.
Guaranteed Loans Guaranteed loans are administered in coordination with conventional agricultural lenders for up to 95 percent of the principal loan amount. Under the guaranteed loan programs, the lender is responsible for servicing the borrower’s account for the life of the loan. The Department, however, is responsible for ensuring borrowers meet certain qualifying criteria to be eligible and monitoring the lender’s servicing activities. Borrowers interested in guaranteed loans must apply to a conventional lender, which then arranges for the guarantee with a Department agency. Estimated losses on loan and foreign credit guarantees are reported at net present value as Loan Guarantee Liability. Defaulted guaranteed loans are reported at net present value as Loans Receivable and Related Foreclosed Property, Net.
Guaranteed loans outstanding at the end of FY 2019 were $153,076 million in outstanding principal and $136,647 million in outstanding principal guaranteed, compared to $150,891 million and $134,691 million, respectively, at the end of FY 2018. Table 5 shows the outstanding balances by credit program.
During the fiscal year, the value of the guaranteed loans is adjusted by the value of the loan guarantee liability held against those loans. Current year subsidy expense, modification, and reestimates all contribute to the change of the loan guarantee liability through the year. The loan guarantee liability is a combination of the liability for losses on pre-1992 guarantees and post 1991 guarantees. Table 6 shows that total liability moved from $502 million to $434 million during FY 2019, a decrease of $68 million. Table 7 shows the total loan guarantee liability.
Total guaranteed loan subsidy expense is a combination of subsidy expense for new guaranteed loans disbursed in the current year, modifications to existing loans, and interest rate and technical reestimates to existing loans. Total guaranteed loan subsidy expense in FY 2019 was negative $76 million compared to negative $160 million in FY 2018. Table 8 illustrates the breakdown of total subsidy expense for FY 2019 and FY 2018 by program.
Guaranteed loan volume decreased from $24,758 million in FY 2018 to $21,036 million in FY 2019. Volume distribution between mission area and program is shown in Table 9.
SECTION II | FINANCIAL INFORMATION 77
Administrative Expenses Consistent with the Federal Credit Reform Act of 1990, as amended, subsidy cash flows exclude direct Federal administrative expenses. Administrative expenses for FY 2019 and FY 2018 are shown in Table 10.
Subsidy Rates Subsidy rates are used to compute each year’s subsidy expenses. The subsidy rates disclosed in Table 11 and Table 12 pertain only to the FY 2019 cohorts. These rates cannot be applied to the direct and guaranteed loans disbursed during the current reporting year to yield the subsidy expense. The subsidy expense for new loans reported in the current year could result from disbursements of loans from both current year cohorts and prior-year cohorts. The subsidy expense reported in the current year also includes reestimates.
Credit Program Discussion and Descriptions The Department offers direct and guaranteed loans through credit programs in the FPAC mission area through the FSA and the CCC, and in the RD mission area.
Farm Production and Conservation (FPAC) Mission Area The FPAC mission area helps keep America’s farmers and ranchers in business as they face the uncertainties of weather and markets. FPAC delivers commodity, credit, conservation, disaster, and emergency assistance programs that help strengthen and stabilize the agricultural economy. FPAC contributes to the vitality of the farm sector with programs that encourage the expansion of export markets for U.S. agriculture.
FSA offers direct and guaranteed loans to farmers who are temporarily unable to obtain private, commercial credit, and nonprofit entities that are engaged in the improvement of the nation’s agricultural community. Often, FSA borrowers are beginning farmers who cannot qualify for conventional loans due to insufficient financial resources. Additionally, the agency helps established farmers who have suffered financial setbacks from natural disasters or have limited resources to maintain profitable farming operations. FSA officials also provide borrowers with supervision and credit counseling.
FSA’s mission is to provide supervised credit. FSA works with each borrower to identify specific strengths and weaknesses in farm production and management, and provides alternatives to address weaknesses. FSA is able to provide certain loan servicing options to assist borrowers whose accounts are distressed or delinquent. These options include reamortization, restructuring, loan deferral, lowering interest rates, acceptance of easements, and debt write-downs. The eventual goal of FSA’s farm credit programs is to graduate its borrowers to commercial credit.
CCC’s foreign programs provide economic stimulus to both the U.S. and foreign markets, while giving humanitarian assistance to the most disadvantaged people throughout the world. CCC offers both credit

78 USDA AGENCY FINANCIAL REPORT | 2019
guarantee and direct credit programs for buyers of U.S. exports, suppliers, and sovereign countries in need of food assistance.
CCC permits debtor nations to reschedule debt under the aegis of the Paris Club. The Paris Club is an informal group of official creditors whose role is to facilitate debt treatments based on an internationally recognized set of rules and principles, facilitated by the senior officials of the French Treasury. Its sole purpose is to assess, on a case-by-case basis, liquidity problems faced by economically disadvantaged countries. The general premise of Paris Club is to provide disadvantaged nations short-term liquidity relief to enable them to reestablish their credit worthiness. The U.S. Departments of State and Treasury lead the U.S. Delegation and negotiations for all U.S. Agencies.
CCC also provides loans for Farm and Sugar Storage Facilities (FSFL). FSFL provides low interest financing for producers to build or upgrade farm storage and handling facilities. FSFL program regulations were amended during FY 2017 to add eligibility for portable storage structures, portable equipment, and storage and handling trucks, and to reduce the down payment and documentation requirements for a new “microloan” category of FSFLs up to $50,000.
Exhibit 27: Farm Production and Conservation List of Programs
Farm Service Agency Commodity Credit Corporation
Direct Farm Ownership Direct Farm Operating Direct Emergency Loans Direct Indian Land Acquisition Direct Boll Weevil Eradication Direct Seed Loans to Producers Direct Conservation Guaranteed Farm Operating Subsidized/Unsubsidized Guaranteed Farm Ownership Unsubsidized Guaranteed Conservation American Recovery and Reinvestment Fund
General Sales Manager Export Credit Guarantee Program Facility Program Guarantee P.L. 480 Title 1 Program Direct Farm Storage Facility Direct Sugar Storage Facilities
Rural Development (RD) Mission Area RD offers both direct and guaranteed loans administered through three agencies with unique missions to bring prosperity and opportunity to rural areas. Each year, RD programs create or preserve tens of thousands of rural jobs and provide or improve the quality of rural housing, business, and utilities. To leverage the impact of its programs, RD is working with state, local, and Indian tribal governments, as well as private and nonprofit organizations and user-owned cooperatives. RD is able to provide certain
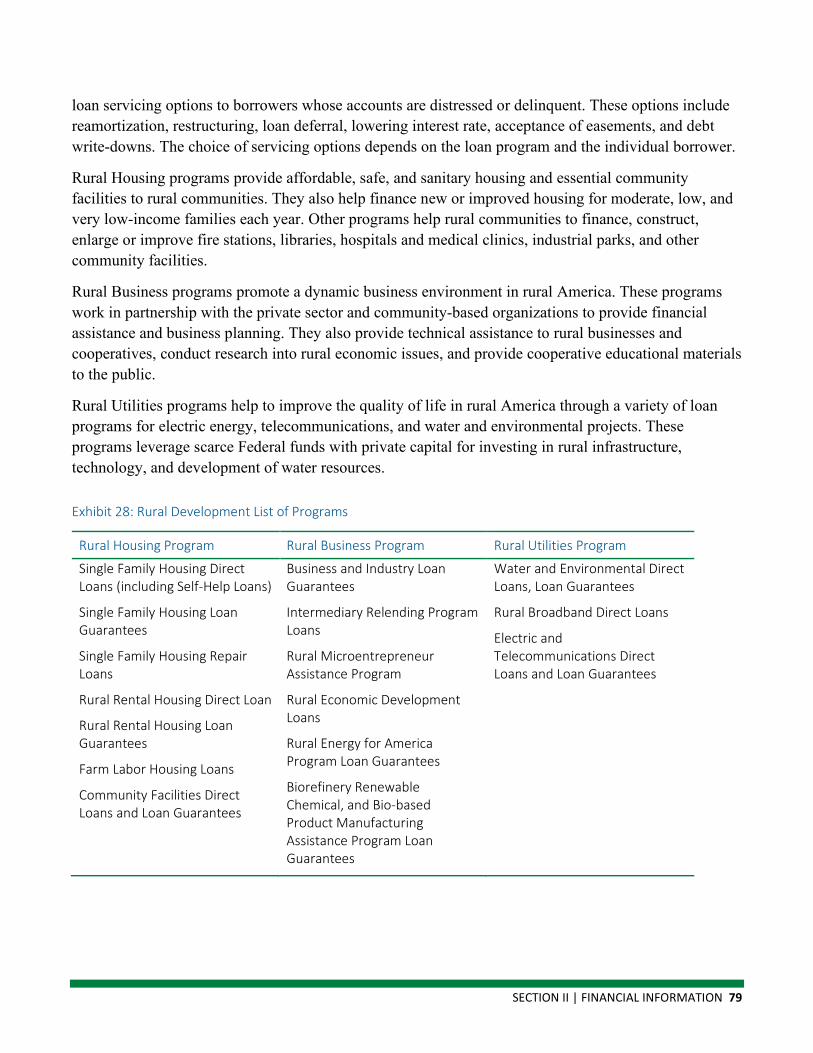
SECTION II | FINANCIAL INFORMATION 79
loan servicing options to borrowers whose accounts are distressed or delinquent. These options include reamortization, restructuring, loan deferral, lowering interest rate, acceptance of easements, and debt write-downs. The choice of servicing options depends on the loan program and the individual borrower.
Rural Housing programs provide affordable, safe, and sanitary housing and essential community facilities to rural communities. They also help finance new or improved housing for moderate, low, and very low-income families each year. Other programs help rural communities to finance, construct, enlarge or improve fire stations, libraries, hospitals and medical clinics, industrial parks, and other community facilities.
Rural Business programs promote a dynamic business environment in rural America. These programs work in partnership with the private sector and community-based organizations to provide financial assistance and business planning. They also provide technical assistance to rural businesses and cooperatives, conduct research into rural economic issues, and provide cooperative educational materials to the public.
Rural Utilities programs help to improve the quality of life in rural America through a variety of loan programs for electric energy, telecommunications, and water and environmental projects. These programs leverage scarce Federal funds with private capital for investing in rural infrastructure, technology, and development of water resources.
Exhibit 28: Rural Development List of Programs
Rural Housing Program Rural Business Program Rural Utilities Program
Single Family Housing Direct Loans (including Self-Help Loans)
Single Family Housing Loan Guarantees
Single Family Housing Repair Loans
Rural Rental Housing Direct Loan
Rural Rental Housing Loan Guarantees
Farm Labor Housing Loans
Community Facilities Direct Loans and Loan Guarantees
Business and Industry Loan Guarantees
Intermediary Relending Program Loans
Rural Microentrepreneur Assistance Program
Rural Economic Development Loans
Rural Energy for America Program Loan Guarantees
Biorefinery Renewable Chemical, and Bio-based Product Manufacturing Assistance Program Loan Guarantees
Water and Environmental Direct Loans, Loan Guarantees
Rural Broadband Direct Loans
Electric and Telecommunications Direct Loans and Loan Guarantees
80 USDA AGENCY FINANCIAL REPORT | 2019
Events and Changes Having a Significant and Measurable Effect on Subsidy Rates, Subsidy Expense, and Subsidy Reestimates The Federal Credit Reform Act of 1990, as amended, governs the proprietary and budgetary accounting treatment of direct and guaranteed loans. The long-term cost to the Government for direct loans or loan guarantees is referred to as “subsidy cost.” Under the Act, subsidy costs for loans obligated beginning in FY 1992 are recognized at the net present value of projected lifetime costs in the year the loan is disbursed. Subsidy costs are revalued annually. Components of subsidy include interest subsidies, defaults, fee offsets, and other cash flows.
The annual reestimate process updates the budget assumptions with actual portfolio performance, interest rates, and updated estimates for future loan performance. The FY 2019 reestimate process resulted in a $440 million decrease in the post-1991 estimated cost of the direct loan portfolio and a $27 million decrease in the post-1991 estimated cost of the guaranteed loan portfolio, primarily comprised of the following programs.
Direct Loans
The Direct Single-Family Housing program had an overall upward reestimate of $211 million. The majority of the upward reestimate is attributable to the Section 502 program cohorts 2000 through 2010 which had an upward reestimate of $205 million. The upward reestimates reflect the impact of continuing elevated residual defaults of loans for properties acquired prior to the 2008 recession. Additionally, the agency is borrowing at a lower rate than it is lending and the decrease in projected interest income contributes to the upward impact to the reestimate.
The Direct Community Facility program had an overall upward reestimate of $217 million. Cohorts 2016 through 2018 had an upward reestimate of $124 million due primarily to borrowing rates from Treasury rising higher than initially budgeted. Treasury rates on older cohorts do not change as Treasury sets fixed borrowing rates on each cohort after 90% of the loans have been disbursed. Additionally, the increase in the principal write-off curve further increased the total reestimate due to the increase in projected write-offs.
The Electric program had an overall downward reestimates of ($972) million. The Direct Federal Financing Bank (FFB) Electric Program had an overall downward reestimate of ($899) million which is comprised primarily of a ($936) million downward reestimate in the FFB program and a $37 million upward reestimate in the FFB Underwriter program. The main factor of the downward reestimate increase in the Direct FFB program was the modification realized in FY 2019 due to the implementation of the Agriculture Improvement Act of 2018. The language in the bill allowed the borrowers to prepay outstanding debt using Cushion of Credit balances. The positive modification cash flows increased cash balances resulting in a downward impact as the agency had to borrow less from Treasury to cover the cost of the subsidy.
SECTION II | FINANCIAL INFORMATION 81
Guaranteed Loans
The Guaranteed Single-Family Housing Program had an overall upward reestimate of $51 million. The most significant change was attributed to an upward reestimate of $68 million in the Section 502 Direct Loan program, which assists low income applicants obtain decent, safe and sanitary housing in eligible rural areas. The Section 502 Direct Loan program increase in reestimates is the result of an upward reestimate of $198 million and a downward reestimate of ($130) million. The change in the upward reestimate for the 502 Section Direct Loan program is attributed to cohorts 2011 through 2018, along with an offsetting downward reestimate for cohort 2019. The increase in the upward reestimate for cohorts 2011 through 2018 is attributed to an increase in forecasted loss settlements, a decrease in forecasted recoveries, and a decrease in forecasted annual fee inflows. These changes in the loss settlements, recoveries, and annual fee cash flows are due to decreases in the forecasted 30-year mortgage rates and forecasted Housing Price index (HPI). The downward reestimate for the 2019 cohort is due to an increase in projected annual fees as compared to original subsidy estimate, resulting in higher future cash flows and the reduction of the subsidy cost.
Loan Modifications
A modification is any Government action different from the baseline assumptions that affect the subsidy cost, such as a change in the terms of the loan contract. The cost of a modification is the difference between the present value of the cash flows before and after the modification.
Multi-Family Housing direct loan modifications related to the revitalization program, which began in FY 2006, continued through FY 2019. In this program, Rural Development provides restructured loans and grants to development owners to revitalize multi-family housing development projects in order to extend the affordable use without displacing tenants due to the increased rent.
During FY 2019, the Rural Utilities Program loans experienced a significant increase in loan modifications. The modifications amount for FY 2019 was $898 million while in FY 2018 there was none. The Cushion of Credit (CoC) modifications were a direct result of the enactment of the FY 2018 Agriculture Improvement Act. The language in the act provided the borrowers the opportunity to prepay outstanding loans, without a penalty, using the CoC balances. Additionally, the Federal Financing Bank Direct Electric Loan Program modifications continued with the refinancing options that were enacted in the FY 2018 Consolidated Appropriations Act as part of a two-year pilot program.
The Debt Reduction Fund is used to account for CCC’s “modified debt.” Debt is considered to be modified if the original debt has been reduced or the interest rate of the agreement changed. In contrast, when debt is “rescheduled,” only the date of payment is changed. Rescheduled debt is carried in the original fund until paid. With one exception, all outstanding CCC modified debt is carried in the Debt Reduction Fund and is governed by the Federal Credit Reform Act of 1990, as amended.
82 USDA AGENCY FINANCIAL REPORT | 2019
Foreclosed Property
Property is acquired largely through foreclosure and voluntary conveyance. Acquired properties associated with loans are reported at their market value at the time of acquisition. The projected future cash flows associated with acquired properties are used in determining the related allowance (at present value).
As of September 30, 2019 and 2018, foreclosed property consisted of 2,398 and 1,238 rural single family housing dwellings, with an average holding period of 15 months and 16 months, respectively. As of September 30, 2019 and 2018, FSA-Farm Loan Program properties consist primarily of 110 and 107 farms, respectively. The average holding period for these properties in inventory for FY 2019 and FY 2018 was 67 months. Certain properties can be leased to eligible individuals.
Other Information
Non-performing loans are defined as receivables that are in arrears by 90 or more days or are on rescheduling agreements until such time two consecutive payments have been made following the rescheduling. When RD, FSA and CCC calculate loan interest income, however, the recognition of revenue is deferred. Late interest is accrued on arrears.
Approximately $14,458 million and $14,954 million of Rural Housing Service unpaid loan principal as of September 30, 2019, and 2018 were receiving interest credit. If those loans receiving interest credit had accrued interest at the full-unreduced rate, interest income would have been approximately $682 million and $709 million higher for FY 2019 and FY 2018 respectively.
At the end of FY 2019 and FY 2018, the RD portfolio contained approximately 51,684 and 55,938 restructured loans with an outstanding unpaid principal balance of $2,711 million and $2,869 million, respectively. At the end of FY 2019 and FY 2018, the farm loan portfolio contained approximately 17,761 and 17,739 restructured loans with an outstanding unpaid principal balance of $1,343 million and $1,315 million, respectively. Direct credit and credit guarantee principal receivables in the food aid and export programs under rescheduling agreements as of September 30, 2019 and 2018, were $825 million and $1,005 million, respectively.
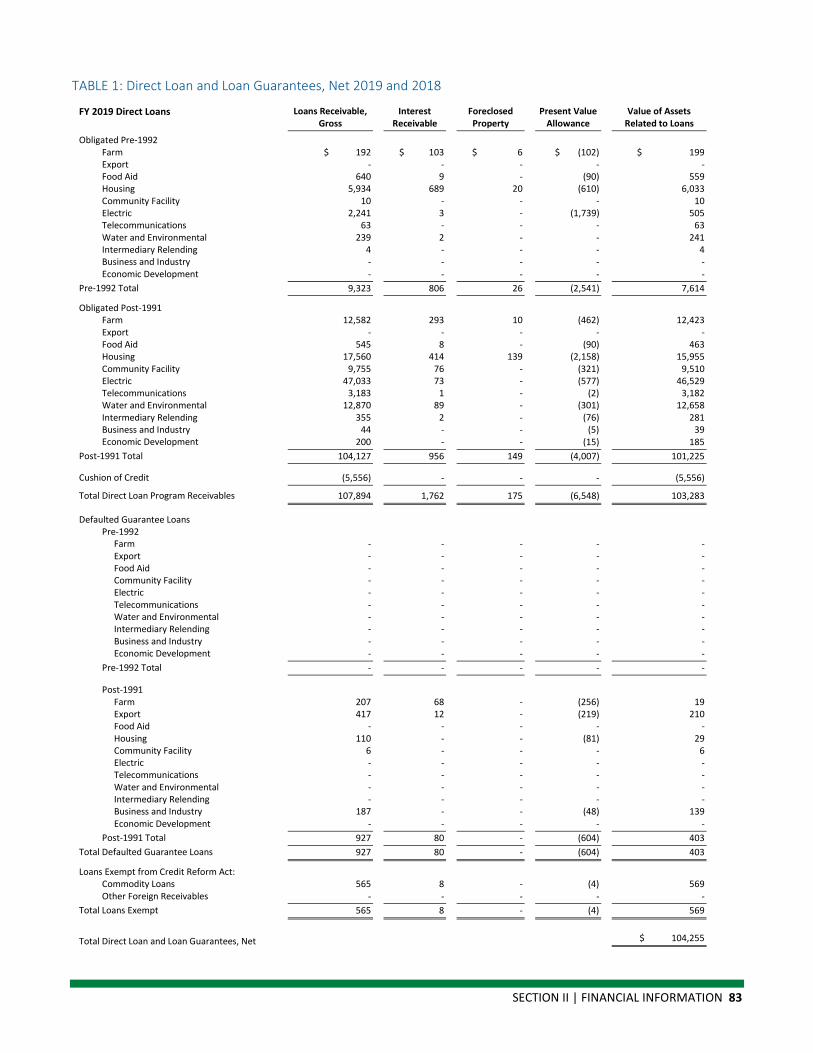
SECTION II | FINANCIAL INFORMATION 83
TABLE 1: Direct Loan and Loan Guarantees, Net 2019 and 2018
FY 2019 Direct Loans Loans Receivable, Gross
Interest Receivable
Foreclosed Property
Present Value Allowance
Value of Assets Related to Loans
Obligated Pre-1992 Farm $ 192 $ 103 $ 6 $ (102) $ 199 Export - - - - - Food Aid 640 9 - (90) 559 Housing 5,934 689 20 (610) 6,033 Community Facility 10 - - - 10 Electric 2,241 3 - (1,739) 505 Telecommunications 63 - - - 63 Water and Environmental 239 2 - - 241 Intermediary Relending 4 - - - 4 Business and Industry - - - - - Economic Development - - - - -
Pre-1992 Total 9,323 806 26 (2,541) 7,614
Obligated Post-1991 Farm 12,582 293 10 (462) 12,423 Export - - - - - Food Aid 545 8 - (90) 463 Housing 17,560 414 139 (2,158) 15,955 Community Facility 9,755 76 - (321) 9,510 Electric 47,033 73 - (577) 46,529 Telecommunications 3,183 1 - (2) 3,182 Water and Environmental 12,870 89 - (301) 12,658 Intermediary Relending 355 2 - (76) 281 Business and Industry 44 - - (5) 39 Economic Development 200 - - (15) 185
Post-1991 Total 104,127 956 149 (4,007) 101,225
Cushion of Credit (5,556) - - - (5,556)
Total Direct Loan Program Receivables 107,894 1,762 175 (6,548) 103,283
Defaulted Guarantee Loans Pre-1992
Farm - - - - - Export - - - - - Food Aid - - - - - Community Facility - - - - - Electric - - - - - Telecommunications - - - - - Water and Environmental - - - - - Intermediary Relending - - - - - Business and Industry - - - - - Economic Development - - - - -
Pre-1992 Total - - - - -
Post-1991 Farm 207 68 - (256) 19 Export 417 12 - (219) 210 Food Aid - - - - - Housing 110 - - (81) 29 Community Facility 6 - - - 6 Electric - - - - - Telecommunications - - - - - Water and Environmental - - - - - Intermediary Relending - - - - - Business and Industry 187 - - (48) 139 Economic Development - - - - -
Post-1991 Total 927 80 - (604) 403 Total Defaulted Guarantee Loans 927 80 - (604) 403
Loans Exempt from Credit Reform Act: Commodity Loans 565 8 - (4) 569 Other Foreign Receivables - - - - -
Total Loans Exempt 565 8 - (4) 569
Total Direct Loan and Loan Guarantees, Net
$ 104,255
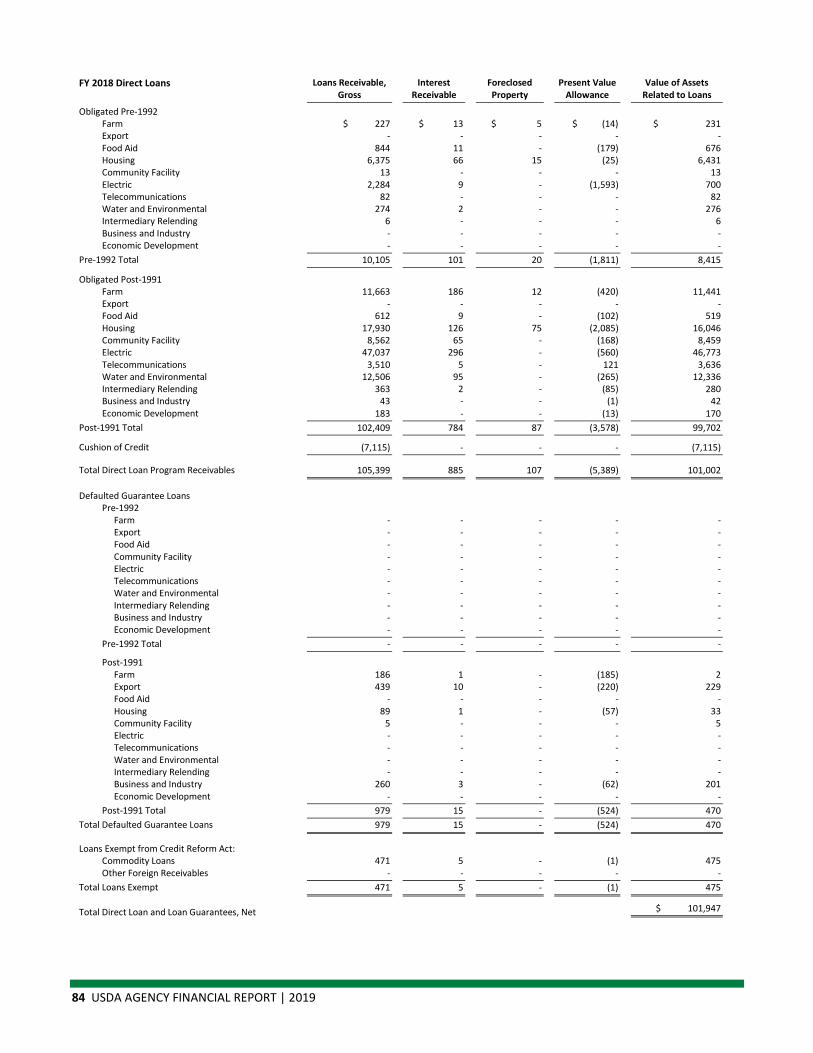
84 USDA AGENCY FINANCIAL REPORT | 2019
FY 2018 Direct Loans Loans Receivable, Gross
Interest Receivable
Foreclosed Property
Present Value Allowance
Value of Assets Related to Loans
Obligated Pre-1992 Farm $ 227 $ 13 $ 5 $ (14) $ 231 Export - - - - - Food Aid 844 11 - (179) 676 Housing 6,375 66 15 (25) 6,431 Community Facility 13 - - - 13 Electric 2,284 9 - (1,593) 700 Telecommunications 82 - - - 82 Water and Environmental 274 2 - - 276 Intermediary Relending 6 - - - 6 Business and Industry - - - - - Economic Development - - - - -
Pre-1992 Total 10,105 101 20 (1,811) 8,415
Obligated Post-1991 Farm 11,663 186 12 (420) 11,441 Export - - - - - Food Aid 612 9 - (102) 519 Housing 17,930 126 75 (2,085) 16,046 Community Facility 8,562 65 - (168) 8,459 Electric 47,037 296 - (560) 46,773 Telecommunications 3,510 5 - 121 3,636 Water and Environmental 12,506 95 - (265) 12,336 Intermediary Relending 363 2 - (85) 280 Business and Industry 43 - - (1) 42 Economic Development 183 - - (13) 170
Post-1991 Total 102,409 784 87 (3,578) 99,702
Cushion of Credit (7,115) - - - (7,115)
Total Direct Loan Program Receivables 105,399 885 107 (5,389) 101,002
Defaulted Guarantee Loans Pre-1992
Farm - - - - - Export - - - - - Food Aid - - - - - Community Facility - - - - - Electric - - - - - Telecommunications - - - - - Water and Environmental - - - - - Intermediary Relending - - - - - Business and Industry - - - - - Economic Development - - - - -
Pre-1992 Total - - - - -
Post-1991 Farm 186 1 - (185) 2 Export 439 10 - (220) 229 Food Aid - - - - - Housing 89 1 - (57) 33 Community Facility 5 - - - 5 Electric - - - - - Telecommunications - - - - - Water and Environmental - - - - - Intermediary Relending - - - - - Business and Industry 260 3 - (62) 201 Economic Development - - - - -
Post-1991 Total 979 15 - (524) 470 Total Defaulted Guarantee Loans 979 15 - (524) 470
Loans Exempt from Credit Reform Act: Commodity Loans 471 5 - (1) 475 Other Foreign Receivables - - - - -
Total Loans Exempt 471 5 - (1) 475
Total Direct Loan and Loan Guarantees, Net
$ 101,947
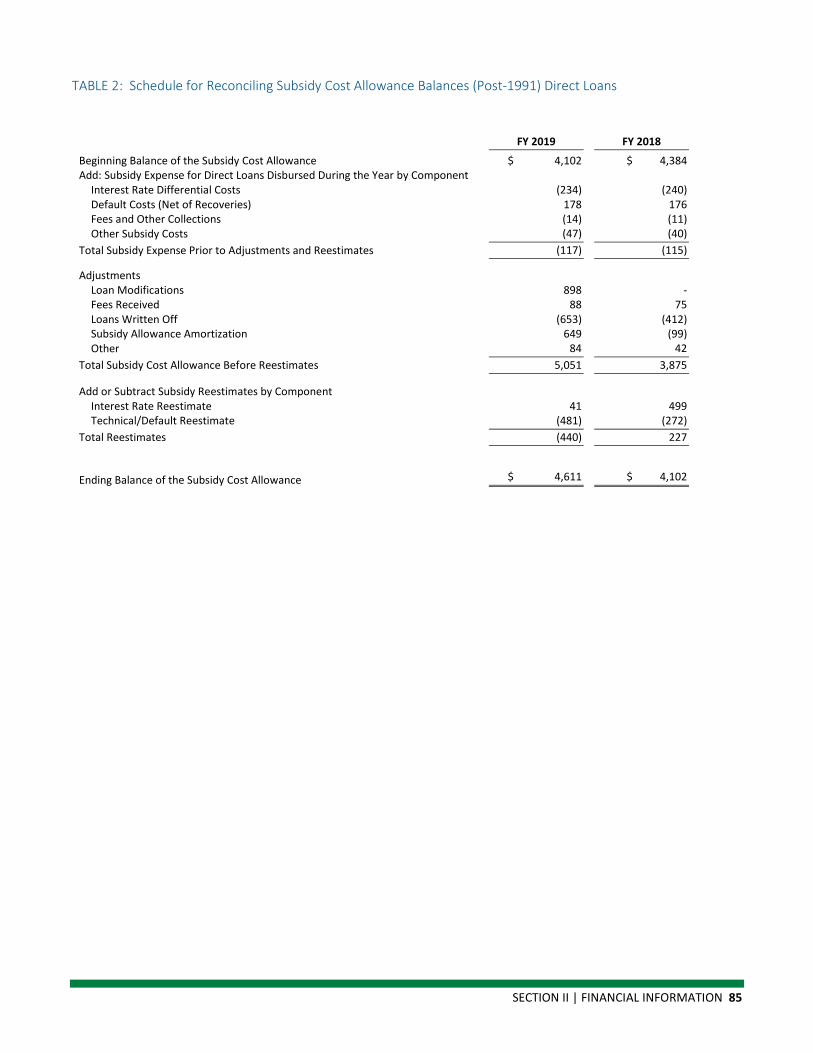
SECTION II | FINANCIAL INFORMATION 85
TABLE 2: Schedule for Reconciling Subsidy Cost Allowance Balances (Post-1991) Direct Loans
Item FY 2019 FY 2018
Beginning Balance of the Subsidy Cost Allowance $ 4,102 $ 4,384 Add: Subsidy Expense for Direct Loans Disbursed During the Year by Component
Interest Rate Differential Costs (234) (240) Default Costs (Net of Recoveries) 178 176 Fees and Other Collections (14) (11) Other Subsidy Costs (47) (40)
Total Subsidy Expense Prior to Adjustments and Reestimates (117) (115)
Adjustments Loan Modifications 898 - Fees Received 88 75 Loans Written Off (653) (412) Subsidy Allowance Amortization 649 (99) Other 84 42
Total Subsidy Cost Allowance Before Reestimates 5,051 3,875
Add or Subtract Subsidy Reestimates by Component
Interest Rate Reestimate 41 499 Technical/Default Reestimate (481) (272)
Total Reestimates (440) 227
Ending Balance of the Subsidy Cost Allowance $ 4,611 $ 4,102
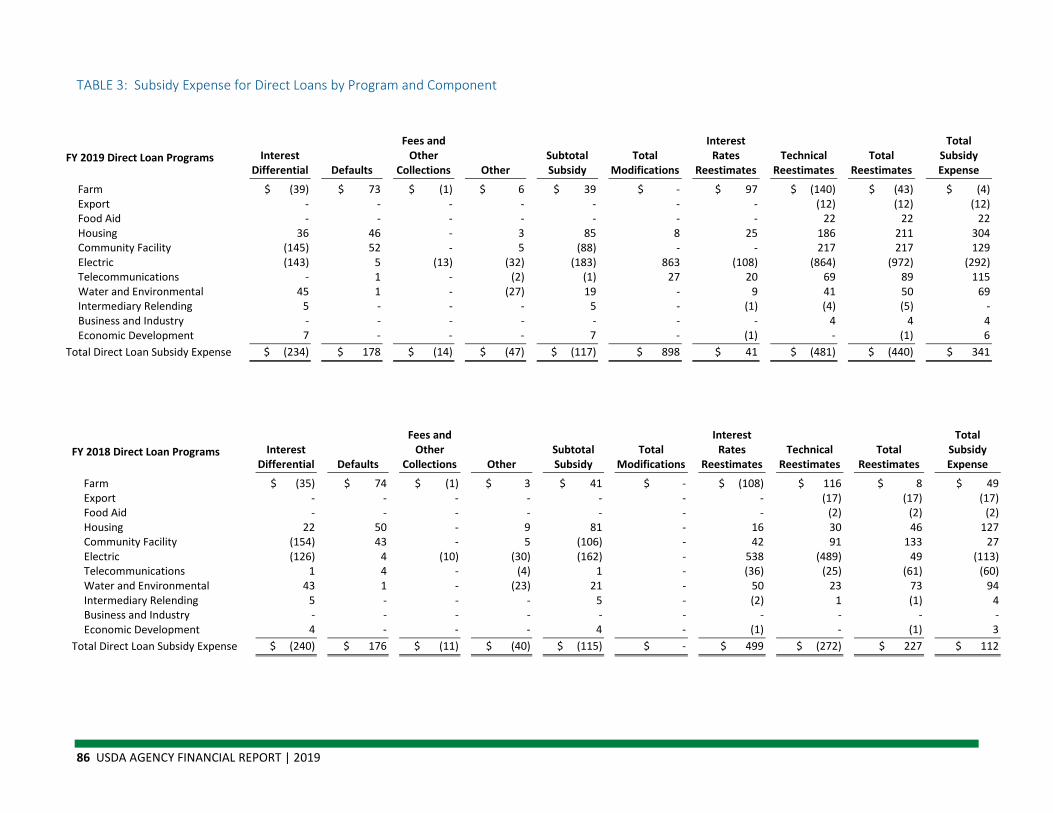
86 USDA AGENCY FINANCIAL REPORT | 2019
TABLE 3: Subsidy Expense for Direct Loans by Program and Component
FY 2019 Direct Loan Programs Interest Differential Defaults
Fees and Other
Collections Other Subtotal Subsidy
Total Modifications
Interest Rates
Reestimates Technical
Reestimates Total
Reestimates
Total Subsidy Expense
Farm $ (39) $ 73 $ (1) $ 6 $ 39 $ - $ 97 $ (140) $ (43) $ (4) Export - - - - - - - (12) (12) (12) Food Aid - - - - - - - 22 22 22 Housing 36 46 - 3 85 8 25 186 211 304 Community Facility (145) 52 - 5 (88) - - 217 217 129 Electric (143) 5 (13) (32) (183) 863 (108) (864) (972) (292) Telecommunications - 1 - (2) (1) 27 20 69 89 115 Water and Environmental 45 1 - (27) 19 - 9 41 50 69 Intermediary Relending 5 - - - 5 - (1) (4) (5) - Business and Industry - - - - - - - 4 4 4 Economic Development 7 - - - 7 - (1) - (1) 6
Total Direct Loan Subsidy Expense $ (234) $ 178 $ (14) $ (47) $ (117) $ 898 $ 41 $ (481) $ (440) $ 341
FY 2018 Direct Loan Programs Interest Differential Defaults
Fees and Other
Collections Other Subtotal Subsidy
Total Modifications
Interest Rates
Reestimates Technical
Reestimates Total
Reestimates
Total Subsidy Expense
Farm $ (35) $ 74 $ (1) $ 3 $ 41 $ - $ (108) $ 116 $ 8 $ 49 Export - - - - - - - (17) (17) (17) Food Aid - - - - - - - (2) (2) (2) Housing 22 50 - 9 81 - 16 30 46 127 Community Facility (154) 43 - 5 (106) - 42 91 133 27 Electric (126) 4 (10) (30) (162) - 538 (489) 49 (113) Telecommunications 1 4 - (4) 1 - (36) (25) (61) (60) Water and Environmental 43 1 - (23) 21 - 50 23 73 94 Intermediary Relending 5 - - - 5 - (2) 1 (1) 4 Business and Industry - - - - - - - - - - Economic Development 4 - - - 4 - (1) - (1) 3
Total Direct Loan Subsidy Expense $ (240) $ 176 $ (11) $ (40) $ (115) $ - $ 499 $ (272) $ 227 $ 112

SECTION II | FINANCIAL INFORMATION 87
TABLE 4: Total Amount of Direct Loans Disbursed (Post-1991)
Direct Loan Programs FY 2019 FY 2018
Farm $ 2,584 $ 2,390 Export - - Food Aid - - Housing 1,151 1,185 Community Facility 1,530 1,354 Electric 4,218 3,236 Telecommunications 114 232 Water and Environmental 780 766 Intermediary Relending 18 19 Business and Industry 5 7 Economic Development 53 32
Total Direct Loans Disbursed $ 10,453 $ 9,221

88 USDA AGENCY FINANCIAL REPORT | 2019
TABLE 5: Guaranteed Loans Outstanding
FY 2019 Pre-1992
Outstanding Principal, Face Value
Post-1991 Outstanding
Principal, Face Value Total Outstanding
Principal, Face Value
Pre-1992 Outstanding
Principal, Guaranteed
Post-1991 Outstanding
Principal, Guaranteed Total Outstanding
Principal, Guaranteed Loan Guarantee Programs
Farm $ 1 $ 17,883 $ 17,884 $ 1 $ 16,130 $ 16,131 Export - 1,901 1,901 - 1,863 1,863 Food Aid - - - - - - Housing 1 124,066 124,067 1 111,622 111,623 Community Facility - 1,168 1,168 - 1,040 1,040 Electric - 154 154 - 154 154 Telecommunications - - - - - - Water and Environmental - 77 77 - 68 68 Intermediary Relending - - - - - - Business and Industry 6 7,819 7,825 5 5,763 5,768 Economic Development - - - - - -
Total Guarantees Outstanding $ 8 $ 153,068 $ 153,076 $ 7 $ 136,640 $ 136,647
FY 2018 Pre-1992
Outstanding Principal, Face Value
Post-1991 Outstanding
Principal, Face Value Total Outstanding
Principal, Face Value
Pre-1992 Outstanding
Principal, Guaranteed
Post-1991 Outstanding
Principal, Guaranteed Total Outstanding
Principal, Guaranteed Loan Guarantee Programs
Farm $ 1 $ 17,168 $ 17,169 $ 1 $ 15,473 $ 15,474 Export - 1,877 1,877 - 1,840 1,840 Food Aid - - - - - - Housing 1 122,965 122,966 1 110,632 110,633 Community Facility - 1,142 1,142 - 1,017 1,017 Electric - 161 161 - 161 161 Telecommunications - - - - - - Water and Environmental - 91 91 - 80 80 Intermediary Relending - - - - - - Business and Industry 3 7,482 7,485 3 5,483 5,486 Economic Development - - - - - -
Total Guarantees Outstanding $ 5 $ 150,886 $ 150,891 $ 5 $ 134,686 $ 134,691

SECTION II | FINANCIAL INFORMATION 89
TABLE 6: Liability for Loan Guarantees (Present Value Method For Pre-1992 Guarantees)
FY 2019 Liabilities for Losses on Pre- 1992
Guarantees Present Value Liabilities for Loan Guarantees on
Post- 1991 Guarantees Present Value Total Liabilities for Loan Guarantees
Loan Guarantee Programs Farm $ - $ 222 $ 222 Export - 3 3 Food Aid - - - Housing - (232) (232) Community Facility - 52 52 Electric - - - Telecommunications - - - Water and Environmental - 1 1 Intermediary Relending - - - Business and Industry - 388 388 Economic Development - - -
Total Liability for Loan Guarantees $ - $ 434 $ 434
FY 2018 Liabilities for Losses on Pre- 1992
Guarantees Present Value Liabilities for Loan Guarantees on
Post- 1991 Guarantees Present Value Total Liabilities for Loan Guarantees
Loan Guarantee Programs Farm $ - $ 215 $ 215 Export - 4 4 Food Aid - - - Housing - (212) (212) Community Facility - 52 52 Electric - - - Telecommunications - - - Water and Environmental - 1 1 Intermediary Relending - - - Business and Industry - 442 442 Economic Development - - -
Total Liability for Loan Guarantees $ - $ 502 $ 502

90 USDA AGENCY FINANCIAL REPORT | 2019
TABLE 7: Schedule for Reconciling Loan Guarantee Liability
Item FY 2019 FY 2018
Beginning Balance of the Loan Guarantee Liability $ 502 $ 794 Add: Subsidy Expense for Guaranteed Loans Disbursed During the Year by Component
Interest Supplement Costs - - Default Costs (Net of Recoveries) 620 845 Fees and Other Collections (664) (824) Other Subsidy Costs (5) (1)
Total of the Above Subsidy Expense Components (49) 20
Adjustments
Loan Guarantee Modifications - - Fees Received 632 643 Interest Supplements Paid (8) (8) Foreclosed Property and Loans Acquired 109 63 Claim Payments to Lenders (541) (680) Interest Accumulation on the Liability Balance (8) 10 Other (176) (160)
Ending Balance of the Loan Guarantee Liability Before Reestimates 461 682
Add or Subtract Subsidy Reestimates by Component:
Interest Rate Reestimate (46) (82) Technical/Default Reestimate 19 (98)
Total of the Above Reestimate Components (27) (180) Ending Balance of the Loan Guarantee Liability $ 434 $ 502
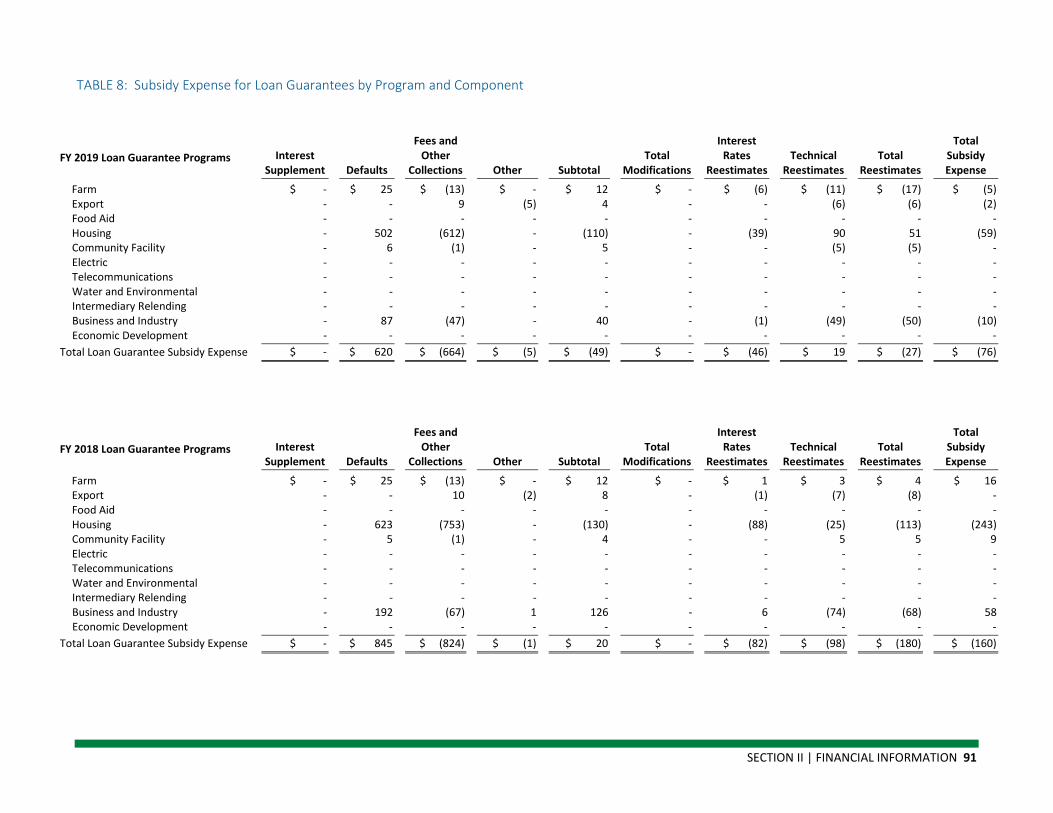
SECTION II | FINANCIAL INFORMATION 91
TABLE 8: Subsidy Expense for Loan Guarantees by Program and Component
FY 2019 Loan Guarantee Programs Interest Supplement Defaults
Fees and Other
Collections Other Subtotal Total
Modifications
Interest Rates
Reestimates Technical
Reestimates Total
Reestimates
Total Subsidy Expense
Farm $ - $ 25 $ (13) $ - $ 12 $ - $ (6) $ (11) $ (17) $ (5) Export - - 9 (5) 4 - - (6) (6) (2) Food Aid - - - - - - - - - - Housing - 502 (612) - (110) - (39) 90 51 (59) Community Facility - 6 (1) - 5 - - (5) (5) - Electric - - - - - - - - - - Telecommunications - - - - - - - - - - Water and Environmental - - - - - - - - - - Intermediary Relending - - - - - - - - - - Business and Industry - 87 (47) - 40 - (1) (49) (50) (10) Economic Development - - - - - - - - - -
Total Loan Guarantee Subsidy Expense $ - $ 620 $ (664) $ (5) $ (49) $ - $ (46) $ 19 $ (27) $ (76)
FY 2018 Loan Guarantee Programs Interest Supplement Defaults
Fees and Other
Collections Other Subtotal Total
Modifications
Interest Rates
Reestimates Technical
Reestimates Total
Reestimates
Total Subsidy Expense
Farm $ - $ 25 $ (13) $ - $ 12 $ - $ 1 $ 3 $ 4 $ 16 Export - - 10 (2) 8 - (1) (7) (8) - Food Aid - - - - - - - - - - Housing - 623 (753) - (130) - (88) (25) (113) (243) Community Facility - 5 (1) - 4 - - 5 5 9 Electric - - - - - - - - - - Telecommunications - - - - - - - - - - Water and Environmental - - - - - - - - - - Intermediary Relending - - - - - - - - - - Business and Industry - 192 (67) 1 126 - 6 (74) (68) 58 Economic Development - - - - - - - - - -
Total Loan Guarantee Subsidy Expense $ - $ 845 $ (824) $ (1) $ 20 $ - $ (82) $ (98) $ (180) $ (160)
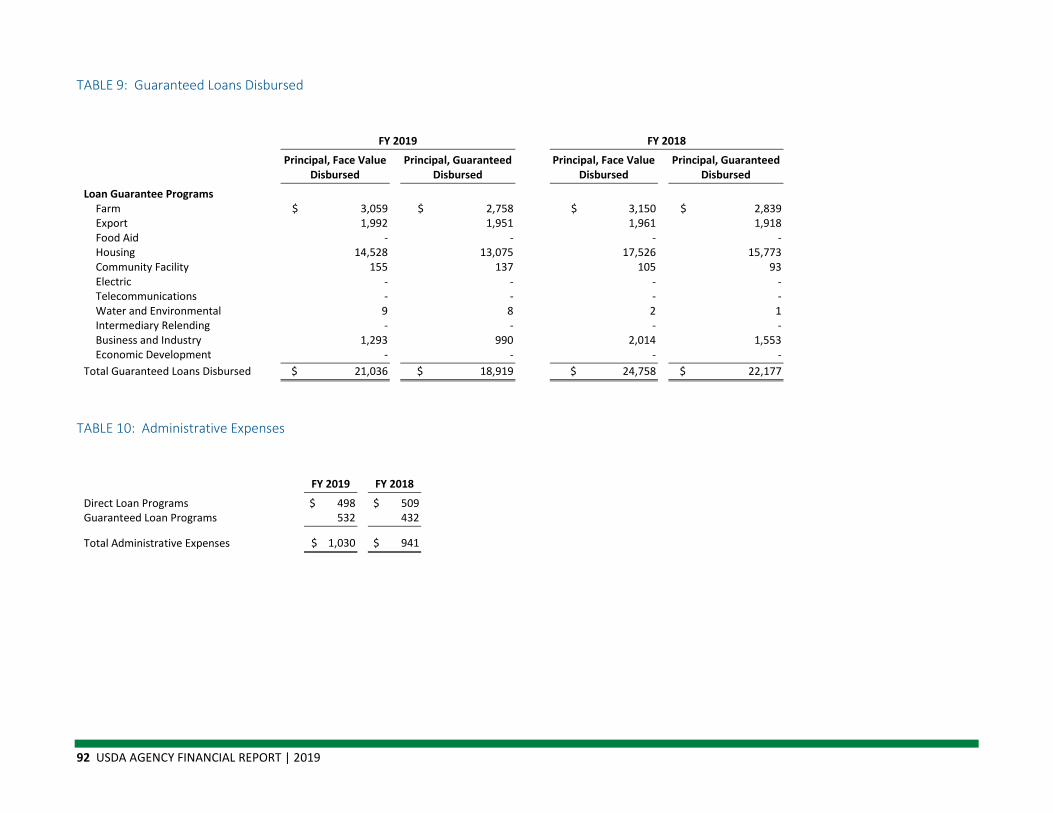
92 USDA AGENCY FINANCIAL REPORT | 2019
TABLE 9: Guaranteed Loans Disbursed
FY 2019 FY 2018
Principal, Face Value Disbursed
Principal, Guaranteed Disbursed
Principal, Face Value Disbursed
Principal, Guaranteed Disbursed
Loan Guarantee Programs Farm $ 3,059 $ 2,758 $ 3,150 $ 2,839 Export 1,992 1,951 1,961 1,918 Food Aid - - - - Housing 14,528 13,075 17,526 15,773 Community Facility 155 137 105 93 Electric - - - - Telecommunications - - - - Water and Environmental 9 8 2 1 Intermediary Relending - - - - Business and Industry 1,293 990 2,014 1,553 Economic Development - - - -
Total Guaranteed Loans Disbursed $ 21,036 $ 18,919 $ 24,758 $ 22,177
TABLE 10: Administrative Expenses
Item FY 2019 FY 2018
Direct Loan Programs $ 498 $ 509 Guaranteed Loan Programs 532 432
Total Administrative Expenses $ 1,030 $ 941
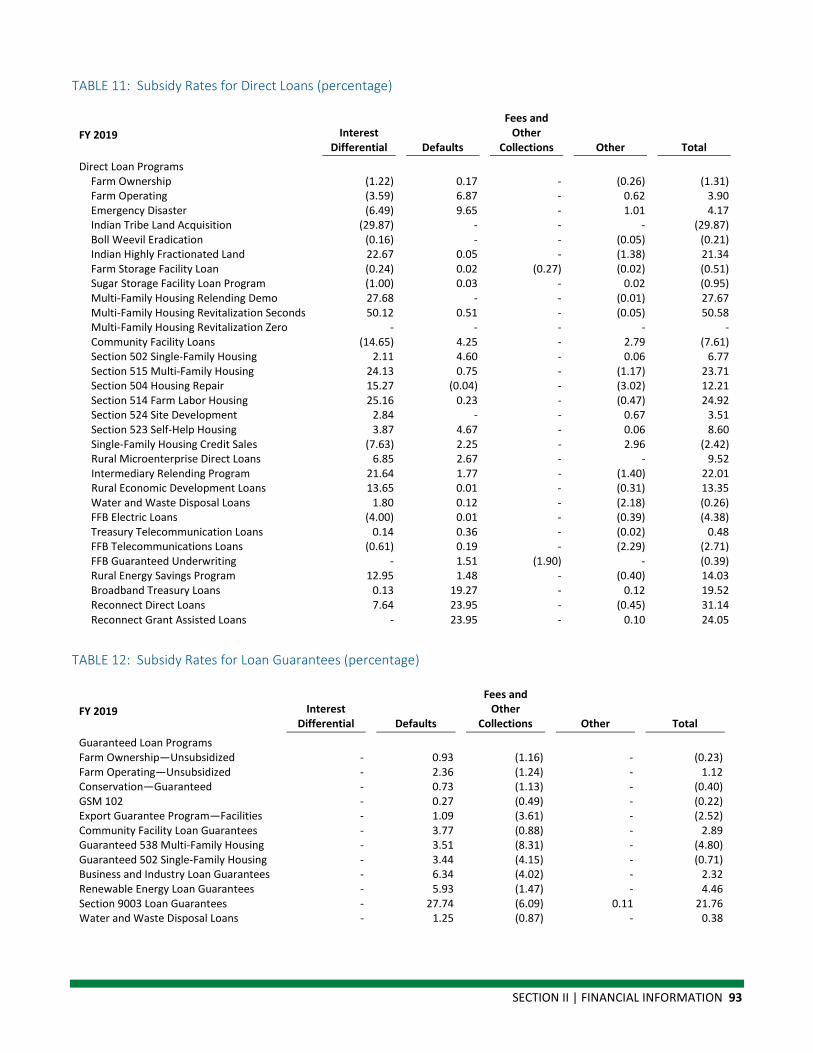
SECTION II | FINANCIAL INFORMATION 93
TABLE 11: Subsidy Rates for Direct Loans (percentage)
FY 2019 Interest Differential Defaults
Fees and Other
Collections Other Total
Direct Loan Programs Farm Ownership (1.22) 0.17 - (0.26) (1.31) Farm Operating (3.59) 6.87 - 0.62 3.90 Emergency Disaster (6.49) 9.65 - 1.01 4.17 Indian Tribe Land Acquisition (29.87) - - - (29.87) Boll Weevil Eradication (0.16) - - (0.05) (0.21) Indian Highly Fractionated Land 22.67 0.05 - (1.38) 21.34 Farm Storage Facility Loan (0.24) 0.02 (0.27) (0.02) (0.51) Sugar Storage Facility Loan Program (1.00) 0.03 - 0.02 (0.95) Multi-Family Housing Relending Demo 27.68 - - (0.01) 27.67 Multi-Family Housing Revitalization Seconds 50.12 0.51 - (0.05) 50.58 Multi-Family Housing Revitalization Zero - - - - - Community Facility Loans (14.65) 4.25 - 2.79 (7.61) Section 502 Single-Family Housing 2.11 4.60 - 0.06 6.77 Section 515 Multi-Family Housing 24.13 0.75 - (1.17) 23.71 Section 504 Housing Repair 15.27 (0.04) - (3.02) 12.21 Section 514 Farm Labor Housing 25.16 0.23 - (0.47) 24.92 Section 524 Site Development 2.84 - - 0.67 3.51 Section 523 Self-Help Housing 3.87 4.67 - 0.06 8.60 Single-Family Housing Credit Sales (7.63) 2.25 - 2.96 (2.42) Rural Microenterprise Direct Loans 6.85 2.67 - - 9.52 Intermediary Relending Program 21.64 1.77 - (1.40) 22.01 Rural Economic Development Loans 13.65 0.01 - (0.31) 13.35 Water and Waste Disposal Loans 1.80 0.12 - (2.18) (0.26) FFB Electric Loans (4.00) 0.01 - (0.39) (4.38) Treasury Telecommunication Loans 0.14 0.36 - (0.02) 0.48 FFB Telecommunications Loans (0.61) 0.19 - (2.29) (2.71) FFB Guaranteed Underwriting - 1.51 (1.90) - (0.39) Rural Energy Savings Program 12.95 1.48 - (0.40) 14.03 Broadband Treasury Loans 0.13 19.27 - 0.12 19.52 Reconnect Direct Loans 7.64 23.95 - (0.45) 31.14 Reconnect Grant Assisted Loans - 23.95 - 0.10 24.05
TABLE 12: Subsidy Rates for Loan Guarantees (percentage)
FY 2019 Interest Differential Defaults
Fees and Other
Collections Other Total
Guaranteed Loan Programs Farm Ownership—Unsubsidized - 0.93 (1.16) - (0.23) Farm Operating—Unsubsidized - 2.36 (1.24) - 1.12 Conservation—Guaranteed - 0.73 (1.13) - (0.40) GSM 102 - 0.27 (0.49) - (0.22) Export Guarantee Program—Facilities - 1.09 (3.61) - (2.52) Community Facility Loan Guarantees - 3.77 (0.88) - 2.89 Guaranteed 538 Multi-Family Housing - 3.51 (8.31) - (4.80) Guaranteed 502 Single-Family Housing - 3.44 (4.15) - (0.71) Business and Industry Loan Guarantees - 6.34 (4.02) - 2.32 Renewable Energy Loan Guarantees - 5.93 (1.47) - 4.46 Section 9003 Loan Guarantees - 27.74 (6.09) 0.11 21.76 Water and Waste Disposal Loans - 1.25 (0.87) - 0.38
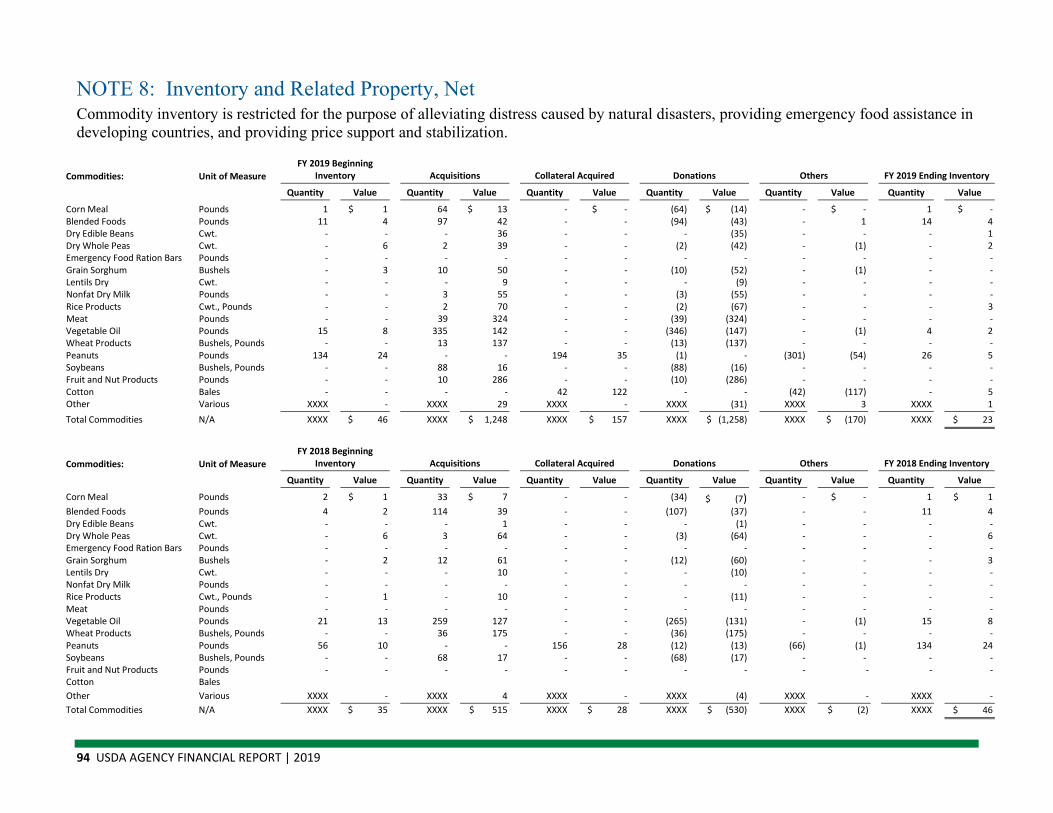
94 USDA AGENCY FINANCIAL REPORT | 2019
NOTE 8: Inventory and Related Property, Net Commodity inventory is restricted for the purpose of alleviating distress caused by natural disasters, providing emergency food assistance in developing countries, and providing price support and stabilization.
Commodities: Unit of Measure FY 2019 Beginning
Inventory Acquisitions Collateral Acquired Donations Others FY 2019 Ending Inventory
Quantity Value Quantity Value Quantity Value Quantity Value Quantity Value Quantity Value
Corn Meal Pounds 1 $ 1 64 $ 13 - $ - (64) $ (14) - $ - 1 $ - Blended Foods Pounds 11 4 97 42 - - (94) (43) - 1 14 4 Dry Edible Beans Cwt. - - - 36 - - - (35) - - - 1 Dry Whole Peas Cwt. - 6 2 39 - - (2) (42) - (1) - 2 Emergency Food Ration Bars Pounds - - - - - - - - - - - - Grain Sorghum Bushels - 3 10 50 - - (10) (52) - (1) - - Lentils Dry Cwt. - - - 9 - - - (9) - - - - Nonfat Dry Milk Pounds - - 3 55 - - (3) (55) - - - - Rice Products Cwt., Pounds - - 2 70 - - (2) (67) - - - 3 Meat Pounds - - 39 324 - - (39) (324) - - - - Vegetable Oil Pounds 15 8 335 142 - - (346) (147) - (1) 4 2 Wheat Products Bushels, Pounds - - 13 137 - - (13) (137) - - - - Peanuts Pounds 134 24 - - 194 35 (1) - (301) (54) 26 5 Soybeans Bushels, Pounds - - 88 16 - - (88) (16) - - - - Fruit and Nut Products Pounds - - 10 286 - - (10) (286) - - - - Cotton Bales - - - - 42 122 - - (42) (117) - 5 Other Various XXXX - XXXX 29 XXXX - XXXX (31) XXXX 3 XXXX 1 Total Commodities N/A XXXX $ 46 XXXX $ 1,248 XXXX $ 157 XXXX $ (1,258) XXXX $ (170) XXXX $ 23
Commodities: Unit of Measure FY 2018 Beginning
Inventory Acquisitions Collateral Acquired Donations Others FY 2018 Ending Inventory
Quantity Value Quantity Value Quantity Value Quantity Value Quantity Value Quantity Value
Corn Meal Pounds 2 $ 1 33 $ 7 - - (34) $ (7) - $ - 1 $ 1 Blended Foods Pounds 4 2 114 39 - - (107) (37) - - 11 4 Dry Edible Beans Cwt. - - - 1 - - - (1) - - - - Dry Whole Peas Cwt. - 6 3 64 - - (3) (64) - - - 6 Emergency Food Ration Bars Pounds - - - - - - - - - - - - Grain Sorghum Bushels - 2 12 61 - - (12) (60) - - - 3 Lentils Dry Cwt. - - - 10 - - - (10) - - - - Nonfat Dry Milk Pounds - - - - - - - - - - - - Rice Products Cwt., Pounds - 1 - 10 - - - (11) - - - - Meat Pounds - - - - - - - - - - - - Vegetable Oil Pounds 21 13 259 127 - - (265) (131) - (1) 15 8 Wheat Products Bushels, Pounds - - 36 175 - - (36) (175) - - - - Peanuts Pounds 56 10 - - 156 28 (12) (13) (66) (1) 134 24 Soybeans Bushels, Pounds - - 68 17 - - (68) (17) - - - - Fruit and Nut Products Pounds - - - - - - - - - - - - Cotton Bales Other Various XXXX - XXXX 4 XXXX - XXXX (4) XXXX - XXXX - Total Commodities N/A XXXX $ 35 XXXX $ 515 XXXX $ 28 XXXX $ (530) XXXX $ (2) XXXX $ 46
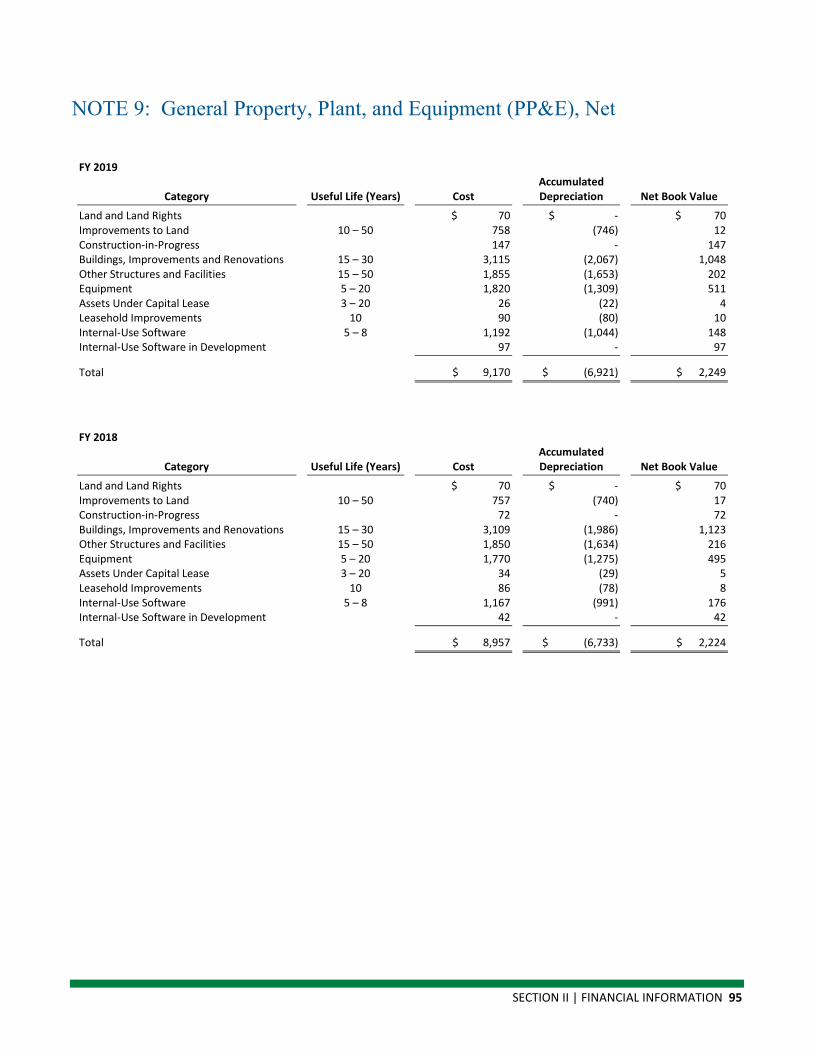
SECTION II | FINANCIAL INFORMATION 95
NOTE 9: General Property, Plant, and Equipment (PP&E), Net
FY 2019
Category Useful Life (Years) Cost Accumulated Depreciation Net Book Value
Land and Land Rights
$ 70 $ - $ 70 Improvements to Land 10 – 50 758 (746) 12 Construction-in-Progress
147 - 147
Buildings, Improvements and Renovations 15 – 30 3,115 (2,067) 1,048 Other Structures and Facilities 15 – 50 1,855 (1,653) 202 Equipment 5 – 20 1,820 (1,309) 511 Assets Under Capital Lease 3 – 20 26 (22) 4 Leasehold Improvements 10 90 (80) 10 Internal-Use Software 5 – 8 1,192 (1,044) 148 Internal-Use Software in Development
97 - 97
Total
$ 9,170 $ (6,921) $ 2,249
FY 2018
Category Useful Life (Years) Cost Accumulated Depreciation Net Book Value
Land and Land Rights
$ 70 $ - $ 70 Improvements to Land 10 – 50 757 (740) 17 Construction-in-Progress
72 - 72
Buildings, Improvements and Renovations 15 – 30 3,109 (1,986) 1,123 Other Structures and Facilities 15 – 50 1,850 (1,634) 216 Equipment 5 – 20 1,770 (1,275) 495 Assets Under Capital Lease 3 – 20 34 (29) 5 Leasehold Improvements 10 86 (78) 8 Internal-Use Software 5 – 8 1,167 (991) 176 Internal-Use Software in Development
42 - 42
Total
$ 8,957 $ (6,733) $ 2,224

96 USDA AGENCY FINANCIAL REPORT | 2019
NOTE 10: Stewardship PP&E Stewardship PP&E consist of assets whose physical properties resemble those of general PP&E that are traditionally capitalized in the financial statements. Due to the nature of these assets, valuation would be difficult and matching costs with specific periods would not be meaningful. Stewardship PP&E include heritage assets and stewardship land.
Heritage Assets Heritage assets are unique and are generally expected to be preserved indefinitely. Heritage assets may be unique because they have historical or natural significance, are of cultural, educational or artistic importance, or have significant architectural characteristics. The assets are reported in terms of physical units rather than cost, fair value, or other monetary values. No amounts are shown on the Balance Sheet for heritage assets, except for multi-use heritage assets in which the predominant use of the asset is in general government operations. The costs of acquisition, betterment, or reconstruction of multi-use heritage assets is capitalized as general PP&E and depreciated. The costs of acquiring, constructing, improving, reconstructing, or renovating heritage assets, other than multi-use, is considered an expense in the period incurred when determining the net cost of operations. Heritage assets consist of collection type, such as objects gathered and maintained for exhibition, such as library collections, and non-collection type, such as memorials, monuments and buildings.
National Forests, National Grasslands and Other Sites
FS manages its heritage assets by site. Sites include national forests, national grasslands, other FS-managed sites, and non-FS-managed sites such as museums and university laboratories. The mission of the FS is to sustain the health, diversity, and productivity of the Nation’s forests and grasslands to meet the needs of present and future generations. The FS strives to achieve quality land management under the sustainable multiple-use management concept, to deliver the necessary products and services that are essential for enhancing natural resource stewardship, and to meet the diverse needs of people.
Heritage Asset categories can include the following:
Priority Heritage Assets (PHA): Heritage assets of distinct public value that are, or should be, actively maintained, and meet one or more of the following criteria:
▪ The property is recognized through an official designation, such as a listing on the National Register of Historic Places, State register, etc.
▪ The property is recognized through prior investment in preservation, interpretation, and use. Any improvement to a PHA that meets real property designation criteria is considered real property.
▪ The property is recognized in an Agency-approved management plan.
▪ The property exhibits critical deferred maintenance needs, and those needs have been documented.
SECTION II | FINANCIAL INFORMATION 97
Other Heritage Assets: Assets that may have potential important historical or cultural significance but lack formal listing and the demonstrated need for active maintenance.
Assemblage Assets: Any grouping of artifacts or archival materials aggregated through donation, agency events, site-specific or other field collection, other acquisition method, or combination therein.
Research Centers
The Agricultural Research Service (ARS) was established on November 2, 1953. Congress first authorized federally supported agricultural research in the Organic Act of 1862. The statute directed the Commissioner of Agriculture “to acquire and preserve in his department all information he can obtain by means of books and correspondence, and by practical and scientific experiments.” The scope of USDA’s agricultural research has been expanded and extended more than 60 times since the Department was created.
NRCS owns one heritage asset, the Tucson Plant Materials Center (TPMC), which is included in general PP&E as a multi-use asset. It was listed in the National Register of Historic Places (NRHP) on July 2, 1997. The TPMC develops and evaluates native plants and addresses an array of resource issues in the areas of rangeland, mined land, urban lands, cropland riparian areas, and desert lands. The TPMC provides technical assistance to NRCS field offices; Resource Conservation and Development (RC&D) groups; conservation districts; Federal, State, and Tribal agencies; and private landowners through the Southwest. Research centers are considered heritage assets because one or more buildings or structures at these centers is on (or eligible for inclusion on) the NRHP.
Library Collections
The National Agricultural Library (NAL) supports agricultural research through the acquisition, curation, and dissemination of information needed to solve today’s agricultural challenges. NAL’s content ranges from special collections materials dating from the early 16th century to near-real time observational research data. The Library holds more than 3.5 million items. NAL was created as the departmental library for USDA in 1862 and became a national library in 1990. One of five national libraries of the U.S., it is also a key member of the Agriculture Network Information Collaborative (AgNIC) partnership. In its international role, NAL participates, as appropriate, in international agricultural information initiatives.
Acquisition and Withdrawal of Heritage Assets
The FS generally does not construct heritage assets, although in some circumstances important site-structural components may be rehabilitated or reconstructed into viable historic properties to provide forest visitors with use and interpretation. Heritage assets may be acquired through the procurement process, but this rarely occurs. Normally, heritage assets are part of the land acquisition and inventory process. Withdrawal occurs through land exchange or natural disasters. Most additions occur through inventory activities where previously undocumented sites are discovered and added to the total.
98 USDA AGENCY FINANCIAL REPORT | 2019
Stewardship Land Stewardship land is land and land rights not acquired for or in connection with items of general PP&E. Land is defined as the solid surface of the earth, excluding natural resources. Stewardship land is valued for its environmental resources, recreational and scenic value, cultural and paleontological resources, vast open spaces, and resource commodities and revenue provided to the Federal Government, States, and counties. These assets are reported in terms of physical units rather than cost, fair value, or other monetary values. No asset amount is shown on the balance sheet for stewardship land. The acquisition cost of stewardship land is considered an expense in the period acquired when determining the net cost of operations. Stewardship land consists primarily of the national forests and grasslands owned by the FS and conservation easements purchased by NRCS.
National Forests
National forests are formally established and permanently set aside and reserved for national forest purposes, including National Wilderness, National Primitive, National Wild and Scenic River, National Recreation, National Scenic Research, National Game Refuges and Wildlife Preserve, and National Monument areas.
National Grasslands
National grasslands are designated by the Secretary of Agriculture and permanently held by the USDA under Title III of the Bankhead-Jones Farm Tenant Act.
Research and Experimental Areas
Research and experimental areas are reserved and dedicated by the Secretary of Agriculture for forest and range research experimentation. Areas reported are located outside the exterior boundaries of a national forest or national grassland.
National Preserves and Other Areas
National preserves are established to protect and preserve scientific, scenic, geologic, watershed, fish, wildlife, historic, cultural and recreational values; and provide for multiple use and sustained yield of renewable resources. Other areas include areas administered by the FS that are not included in one of the above groups.
Conservation Easements
NRCS’ mission objectives in administering the conservation easement programs are to provide landowners with financial and technical assistance in return for maintaining and improving high quality productive soils, clean and abundant water, healthy plant and animal communities, clean air, an adequate energy supply, and working farm and ranch land.
SECTION II | FINANCIAL INFORMATION 99
NRCS’ objectives in managing, monitoring and enforcing the terms and conditions of easement deeds are to ensure that: 1) taxpayer investments are properly used in accordance with the intent of the program; 2) the agency is a good steward of the land; and 3) the land is properly maintained.
Stewardship resources involve substantial investment in order to gain long-term benefits for the American public and help the agency satisfy its mission. The purpose of purchasing easements is to restore or enhance wetlands, farmland, grasslands, forest ecosystems, and restore, protect, maintain, and enhance the functions of floodplains.
NRCS, on behalf of USDA, administers and owns conservation easements on private lands through a variety of programs. The specific uses for the land are identified under each program. Landowners are not allowed to withdraw from the program. However, termination or expiration may occur. For the purpose of reporting, all easements where NRCS is listed as a grantee of the easement are included in the agency’s stewardship land count. Also included are easements that are administered by NRCS on behalf of other USDA agencies.
Acquisition and Withdrawal of Stewardship Lands
The Land and Water Conservation Fund (L&WCF) Land Acquisition Program acquires land for the FS National Forest System (NFS). The program coordinates with a variety of partners, including State, local, and Tribal governments, and private landowners through statewide planning for development of a land-adjustment strategy.
The Land Acquisition Program preserves, develops, and maintains access to NFS lands and waters for the public and provides permanent access to public lands for recreation, commodity production, resource management, public safety, and community economic viability.
The L&WCF statutory authority specifically defines the purpose to also include protecting the quality of scientific, scenic, historical, ecological, environmental, air and atmospheric, water resource, archeological values, as well as food and habitat for fish and wildlife, and managing the public lands for minerals, food, timber, and fiber.
From these several allowable uses of program funding, the program concentrates on protecting habitat for priority species identified in the national forest and grassland’s Land Management Plans and enhancing recreational opportunities for areas with high demand for recreation. The program focuses acquisitions on inholdings and areas adjacent to existing NFS lands.
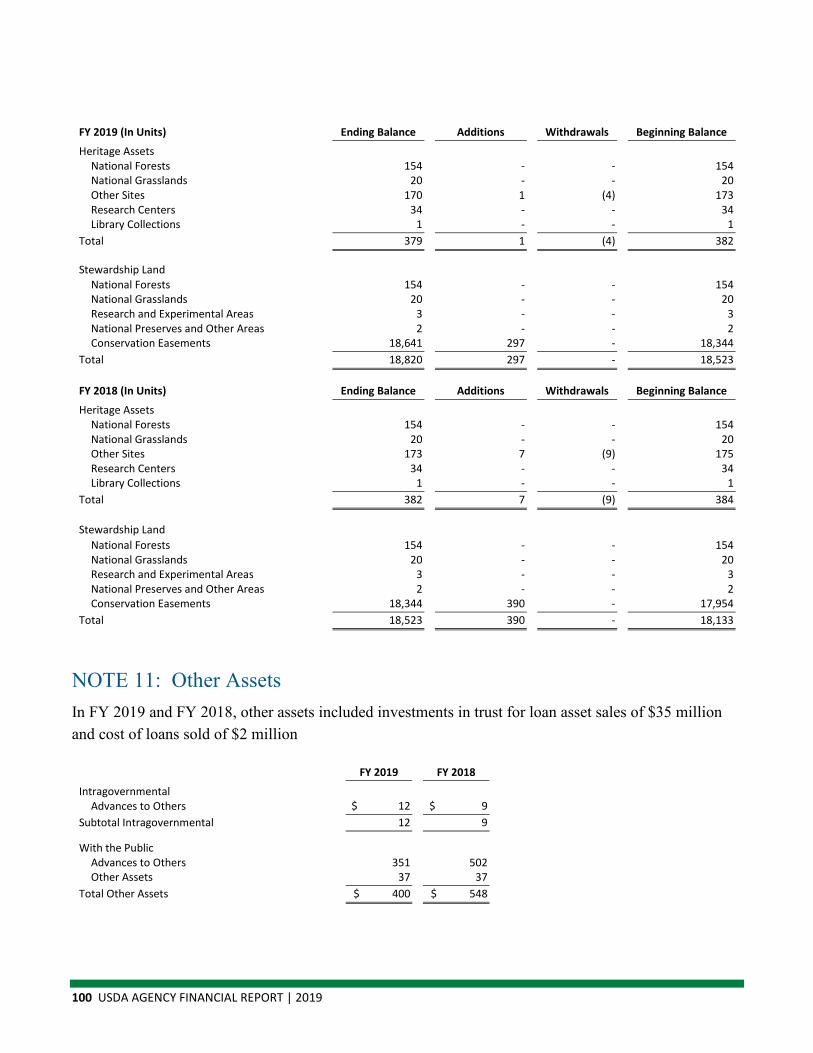
100 USDA AGENCY FINANCIAL REPORT | 2019
FY 2019 (In Units) Ending Balance Additions Withdrawals Beginning Balance
Heritage Assets National Forests 154 - - 154 National Grasslands 20 - - 20 Other Sites 170 1 (4) 173 Research Centers 34 - - 34 Library Collections 1 - - 1
Total 379 1 (4) 382
Stewardship Land National Forests 154 - - 154 National Grasslands 20 - - 20 Research and Experimental Areas 3 - - 3 National Preserves and Other Areas 2 - - 2 Conservation Easements 18,641 297 - 18,344
Total 18,820 297 - 18,523
FY 2018 (In Units) Ending Balance Additions Withdrawals Beginning Balance
Heritage Assets National Forests 154 - - 154 National Grasslands 20 - - 20 Other Sites 173 7 (9) 175 Research Centers 34 - - 34 Library Collections 1 - - 1
Total 382 7 (9) 384
Stewardship Land National Forests 154 - - 154 National Grasslands 20 - - 20 Research and Experimental Areas 3 - - 3 National Preserves and Other Areas 2 - - 2 Conservation Easements 18,344 390 - 17,954
Total 18,523 390 - 18,133
NOTE 11: Other Assets In FY 2019 and FY 2018, other assets included investments in trust for loan asset sales of $35 million and cost of loans sold of $2 million
Item FY 2019 FY 2018
Intragovernmental Advances to Others $ 12 $ 9
Subtotal Intragovernmental 12 9
With the Public
Advances to Others 351 502 Other Assets 37 37
Total Other Assets $ 400 $ 548

SECTION II | FINANCIAL INFORMATION 101
NOTE 12: Liabilities Not Covered by Budgetary Resources In FY 2019 and FY 2018, other intragovernmental liabilities not covered by budgetary resources included accruals for Federal Employee Compensation Act (FECA) of $137 million and $143 million, contract disputes claims payable to Treasury’s Judgment Fund of $26 million and $26 million, and unemployment compensation of $15 million and $15 million, respectively. In FY 2019, Technology Modernization Fund of $5 million.
In FY 2019 and FY 2018, other liabilities with the public not covered by budgetary resources included estimated losses on insurance claims of $4,483 million and $5,972 million, underwriting gain of $1,143 million and $1,638 million, contingent liabilities of $621 million and $923 million, unfunded leave of $645 million and $602 million, Payments to States of $107 million and $272 million, single family housing escrow of $46 million and $46 million, loans paid in advance for multi family housing of $25 million and $24 million, and stewardship contracting product sales of $4 million and $21 million, respectively.
Item FY 2019 FY 2018
Intragovernmental Other $ 183 $ 184
Subtotal Intragovernmental 183 184
With the Public Actuarial Federal Employees’ Compensation Act (FECA) Liability 782 892 Environmental and Disposal Liabilities 216 200 Other 7,074 9,498
Subtotal With the Public 8,072 10,590
Total Liabilities Not Covered by Budgetary Resources 8,255 10,774 Total Liabilities Covered by Budgetary Resources 169,152 149,101 Total Liabilities Not Requiring Budgetary Resources 1,574 1,241
Total Liabilities $ 178,981 $ 161,116
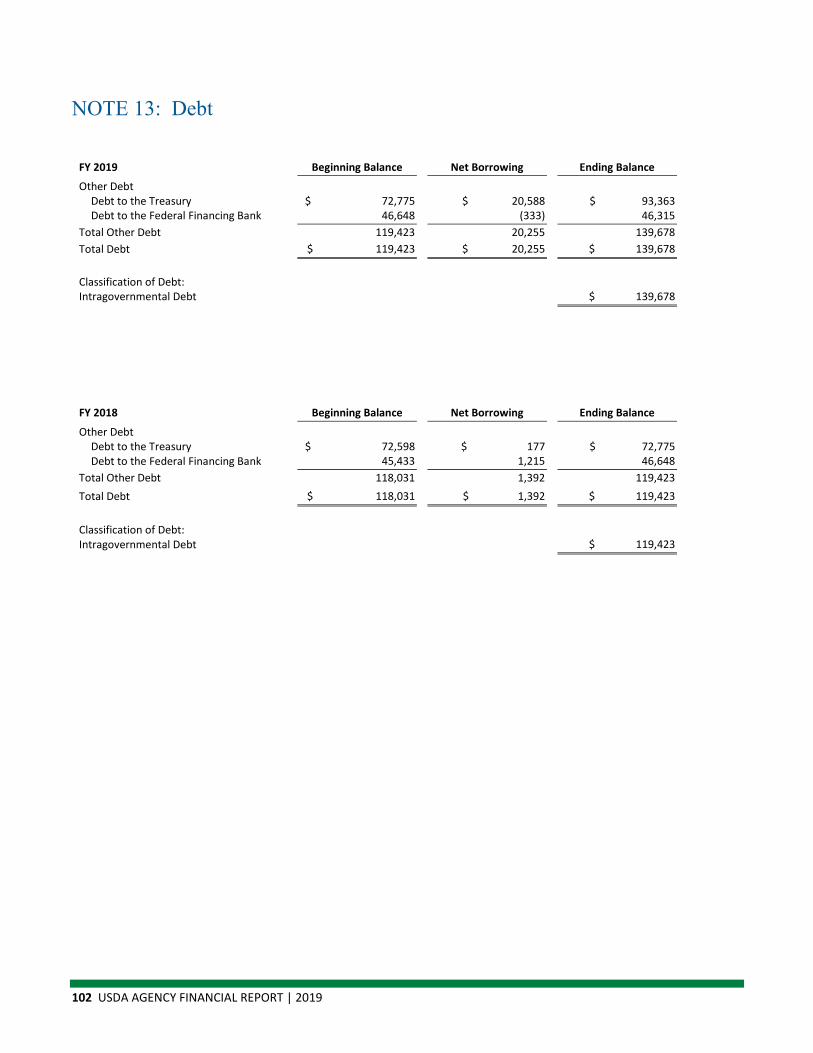
102 USDA AGENCY FINANCIAL REPORT | 2019
NOTE 13: Debt
FY 2019 Beginning Balance Net Borrowing Ending Balance
Other Debt Debt to the Treasury $ 72,775 $ 20,588 $ 93,363 Debt to the Federal Financing Bank 46,648 (333) 46,315
Total Other Debt 119,423 20,255 139,678 Total Debt $ 119,423 $ 20,255 $ 139,678
Classification of Debt: Intragovernmental Debt
$ 139,678
FY 2018 Beginning Balance Net Borrowing Ending Balance
Other Debt Debt to the Treasury $ 72,598 $ 177 $ 72,775 Debt to the Federal Financing Bank 45,433 1,215 46,648
Total Other Debt 118,031 1,392 119,423 Total Debt $ 118,031 $ 1,392 $ 119,423
Classification of Debt: Intragovernmental Debt
$ 119,423
SECTION II | FINANCIAL INFORMATION 103
NOTE 14: Environmental and Disposal Liabilities USDA is subject to the Comprehensive Environmental Response, Compensation, and Liability Act, the Clean Water Act, and the Resource Conservation and Recovery Act for cleanup of hazardous waste. In FY 2019 and FY 2018, FS estimates the liability for total cleanup costs for sites known to contain hazardous waste to be $2 million and $2 million, respectively, based on actual cleanup costs at similar sites. In FY 2019 and FY 2018, CCC estimates the liability for total cleanup costs for sites known to contain hazardous waste to be $31 million and $21 million, respectively, based on actual cleanup costs at similar sites. CCC estimates the range of potential future losses due to remedial actions to be between $31 million and $272 million. These estimates will change as new sites are discovered, remedy standards change, and new technology is introduced.
In FY 2019 and FY 2018, ARS estimated the liability for cleanup of the Beltsville Agricultural Research Center (BARC) to be $28 million and $21 million, respectively. ARS is evaluating and remediating areas of concern on BARC that are contaminated or threaten to contaminate ground and surface water with pesticides, solvents, metals, and other hazardous substances.
USDA is also subject to Asbestos National Emissions Standards for Hazardous Air Pollutants. In FY 2019 and FY 2018, the Department estimated its liability for asbestos-related cleanup of real property to be $157 million and $156 million, respectively. The liability is calculated using total square footage of real property expected to contain asbestos times a cost factor based on historical actual cleanup costs, adjusted for inflation, including any other identifiable costs, e.g., survey cost. As additional information becomes available, key assumptions will be reevaluated, cost estimates will be revised, and necessary adjustments will be made to the liability recognition.
104 USDA AGENCY FINANCIAL REPORT | 2019
NOTE 15: Other Liabilities In FY 2019, other liabilities with related budgetary obligations with the public included Agricultural Risk Coverage of $677 million; Price Loss Coverage of $1,868 million; Grants, Subsidies, and Contributions of $3,457 million; Conservation Reserve Program of $1,821 million; Insurance Claims and Indemnities of $501 million; Trade Mitigation Program of $257 million; and other accrued liabilities of $561 million.
In FY 2019, other liabilities without related budgetary obligations with the public included Payments to States of $107 million, single family housing escrow of $46 million, loans paid in advance for multi-family housing of $25 million, and other accrued liabilities of $4 million.
In FY 2018, other liabilities with related budgetary obligations with the public included Agricultural Risk Coverage of $1,063 million; Price Loss Coverage of $1,893 million; Grants, Subsidies, and Contributions of $3,770 million; Conservation Reserve Program of $1,845 million; and other accrued liabilities of $866 million.
In FY 2018, other liabilities without related budgetary obligations with the public included Payments to States of $272 million, single family housing escrow of $46 million, loans paid in advance for multi-family housing of $24 million, and other accrued liabilities of $21 million.
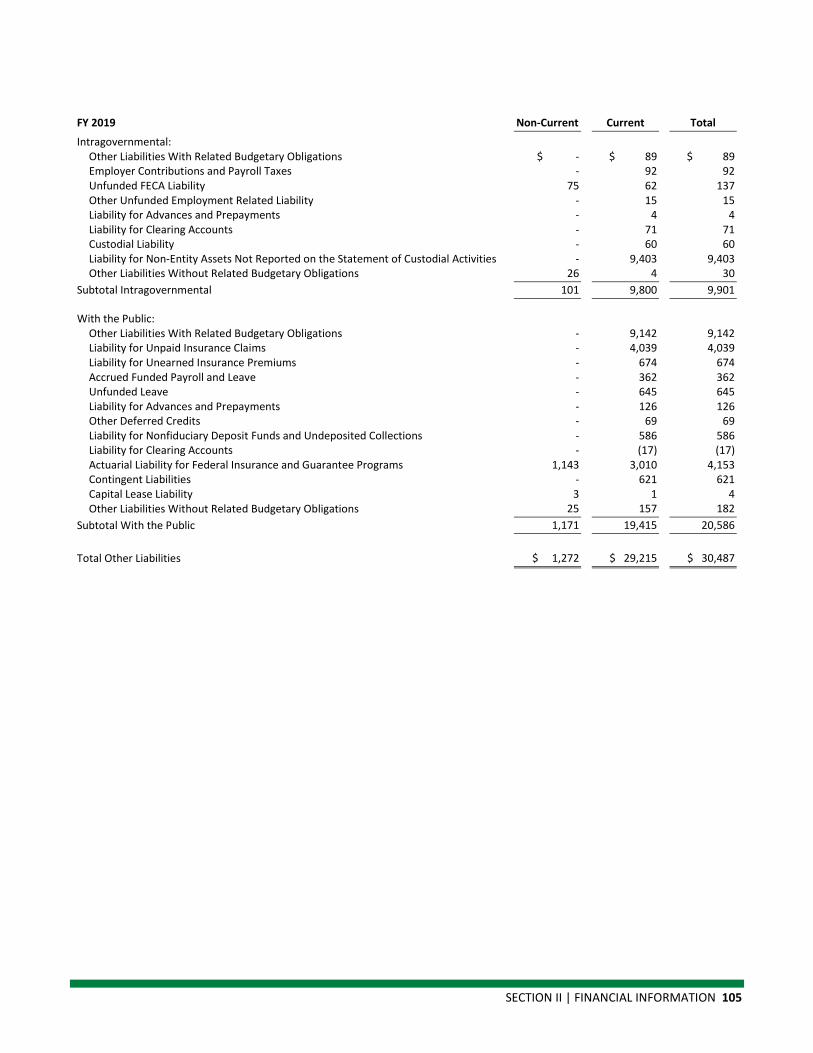
SECTION II | FINANCIAL INFORMATION 105
FY 2019 Non-Current Current Total
Intragovernmental: Other Liabilities With Related Budgetary Obligations $ - $ 89 $ 89 Employer Contributions and Payroll Taxes - 92 92 Unfunded FECA Liability 75 62 137 Other Unfunded Employment Related Liability - 15 15 Liability for Advances and Prepayments - 4 4 Liability for Clearing Accounts - 71 71 Custodial Liability - 60 60 Liability for Non-Entity Assets Not Reported on the Statement of Custodial Activities - 9,403 9,403 Other Liabilities Without Related Budgetary Obligations 26 4 30
Subtotal Intragovernmental 101 9,800 9,901
With the Public: Other Liabilities With Related Budgetary Obligations - 9,142 9,142 Liability for Unpaid Insurance Claims - 4,039 4,039 Liability for Unearned Insurance Premiums - 674 674 Accrued Funded Payroll and Leave - 362 362 Unfunded Leave - 645 645 Liability for Advances and Prepayments - 126 126 Other Deferred Credits - 69 69 Liability for Nonfiduciary Deposit Funds and Undeposited Collections - 586 586 Liability for Clearing Accounts - (17) (17) Actuarial Liability for Federal Insurance and Guarantee Programs 1,143 3,010 4,153 Contingent Liabilities - 621 621 Capital Lease Liability 3 1 4 Other Liabilities Without Related Budgetary Obligations 25 157 182
Subtotal With the Public 1,171 19,415 20,586
Total Other Liabilities $ 1,272 $ 29,215 $ 30,487
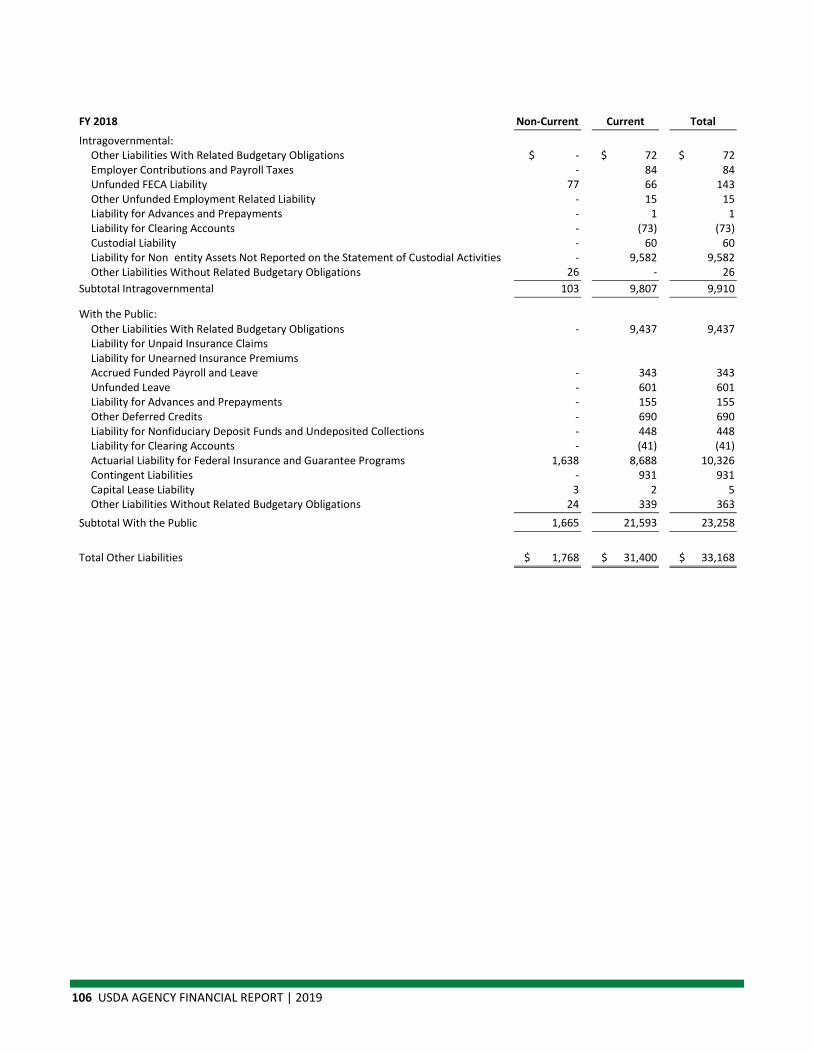
106 USDA AGENCY FINANCIAL REPORT | 2019
FY 2018 Non-Current Current Total
Intragovernmental: Other Liabilities With Related Budgetary Obligations $ - $ 72 $ 72 Employer Contributions and Payroll Taxes - 84 84 Unfunded FECA Liability 77 66 143 Other Unfunded Employment Related Liability - 15 15 Liability for Advances and Prepayments - 1 1 Liability for Clearing Accounts - (73) (73) Custodial Liability - 60 60 Liability for Non entity Assets Not Reported on the Statement of Custodial Activities - 9,582 9,582 Other Liabilities Without Related Budgetary Obligations 26 - 26
Subtotal Intragovernmental 103 9,807 9,910
With the Public: Other Liabilities With Related Budgetary Obligations - 9,437 9,437 Liability for Unpaid Insurance Claims
Liability for Unearned Insurance Premiums
Accrued Funded Payroll and Leave - 343 343 Unfunded Leave - 601 601 Liability for Advances and Prepayments - 155 155 Other Deferred Credits - 690 690 Liability for Nonfiduciary Deposit Funds and Undeposited Collections - 448 448 Liability for Clearing Accounts - (41) (41) Actuarial Liability for Federal Insurance and Guarantee Programs 1,638 8,688 10,326 Contingent Liabilities - 931 931 Capital Lease Liability 3 2 5 Other Liabilities Without Related Budgetary Obligations 24 339 363
Subtotal With the Public 1,665 21,593 23,258
Total Other Liabilities $ 1,768 $ 31,400 $ 33,168
SECTION II | FINANCIAL INFORMATION 107
NOTE 16: Leases
Capital Leases USDA enters into leasing agreements through leasing authority delegated by the General Services Administration (GSA). USDA acquires use of various general facilities (buildings and plant material centers), equipment, and land with renewal options that range from 0 to 10 years and which are located mainly in urban areas. The portfolio includes leases with escalation clauses based on the Consumer Price Index (CPI), and amortization periods with a range of 8 to 25 years.
Operating Leases USDA enters into leasing agreements through leasing authority delegated by GSA. USDA leases various land, buildings and equipment.
Major non-cancelable operating leases consists primarily of office space, most with renewal options that range from 1 to 25 years with escalation clauses based on the CPI, and lease periods with a range of 1 to 30 years.
The USDA Headquarters complex (Whitten Building and South Building) is a government owned facility, which is part of the GSA Federal Buildings Inventory. As the result of a 1998 agreement between GSA and USDA, a moratorium was placed on the rental billings for the Headquarters complex beginning in FY 1999. At current market rate, the estimated yearly rental payment for the above mentioned space would be $64 million. This agreement is still in effect and as a result, USDA activities located in the Headquarters complex are not billed for rental costs.

108 USDA AGENCY FINANCIAL REPORT | 2019
FY 2019
Capital Leases
Summary of Assets Under Capital Leases Federal Non-Federal Total
Land and Building $ - $ 27 $ 27 Machinery and Equipment - - - Accumulated Amortization - (23) (23) Total - 4 4
Future Payments Due Land & Buildings Machinery & Equipment Totals
Federal Non-Federal Federal Non-Federal Federal Non-Federal
Fiscal Year 2020 - 3 - - - 3 Fiscal Year 2021 - 3 - - - 3 Fiscal Year 2022 - 2 - - - 2 Fiscal Year 2023 - 2 - - - 2 Fiscal Year 2024 - 1 - - - 1 After 5 Years - 1 - - - 1
Total Future Lease Payments - 12 - - - 12 Less: Imputed Interest - 6 - - - 6 Less: Executory Costs - 2 - - - 2 Net Capital Lease Liability - 4 - - - 4
Capital Lease Liabilities Covered by Budgetary Resources - 4 - - - 4
Operating Leases
Future Payments Due for Non-Cancellable Operating Leases Land & Buildings Machinery & Equipment Totals
Federal Non-Federal Federal Non-Federal Federal Non-Federal
Fiscal Year 2020 30 77 - 1 30 78 Fiscal Year 2021 25 67 - 1 25 68 Fiscal Year 2022 23 52 - - 23 52 Fiscal Year 2023 20 39 - - 20 39 Fiscal Year 2024 14 31 - - 14 31 After 5 Years 36 125 - - 36 125 Total Future Lease Payments $ 148 $ 391 $ - $ 2 $ 148 $ 393
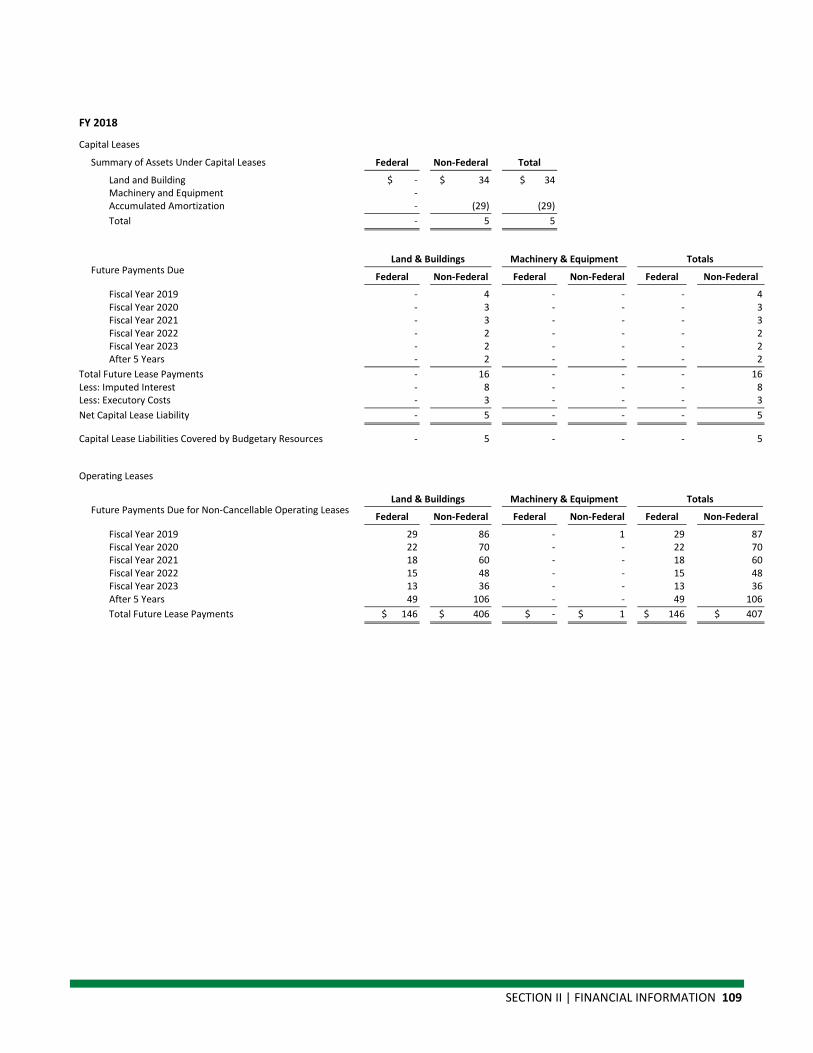
SECTION II | FINANCIAL INFORMATION 109
FY 2018
Capital Leases
Summary of Assets Under Capital Leases Federal Non-Federal Total
Land and Building $ - $ 34 $ 34 Machinery and Equipment -
Accumulated Amortization - (29) (29) Total - 5 5
Future Payments Due Land & Buildings Machinery & Equipment Totals
Federal Non-Federal Federal Non-Federal Federal Non-Federal
Fiscal Year 2019 - 4 - - - 4 Fiscal Year 2020 - 3 - - - 3 Fiscal Year 2021 - 3 - - - 3 Fiscal Year 2022 - 2 - - - 2 Fiscal Year 2023 - 2 - - - 2 After 5 Years - 2 - - - 2
Total Future Lease Payments - 16 - - - 16 Less: Imputed Interest - 8 - - - 8 Less: Executory Costs - 3 - - - 3 Net Capital Lease Liability - 5 - - - 5
Capital Lease Liabilities Covered by Budgetary Resources - 5 - - - 5
Operating Leases
Future Payments Due for Non-Cancellable Operating Leases Land & Buildings Machinery & Equipment Totals
Federal Non-Federal Federal Non-Federal Federal Non-Federal
Fiscal Year 2019 29 86 - 1 29 87 Fiscal Year 2020 22 70 - - 22 70 Fiscal Year 2021 18 60 - - 18 60 Fiscal Year 2022 15 48 - - 15 48 Fiscal Year 2023 13 36 - - 13 36 After 5 Years 49 106 - - 49 106 Total Future Lease Payments $ 146 $ 406 $ - $ 1 $ 146 $ 407
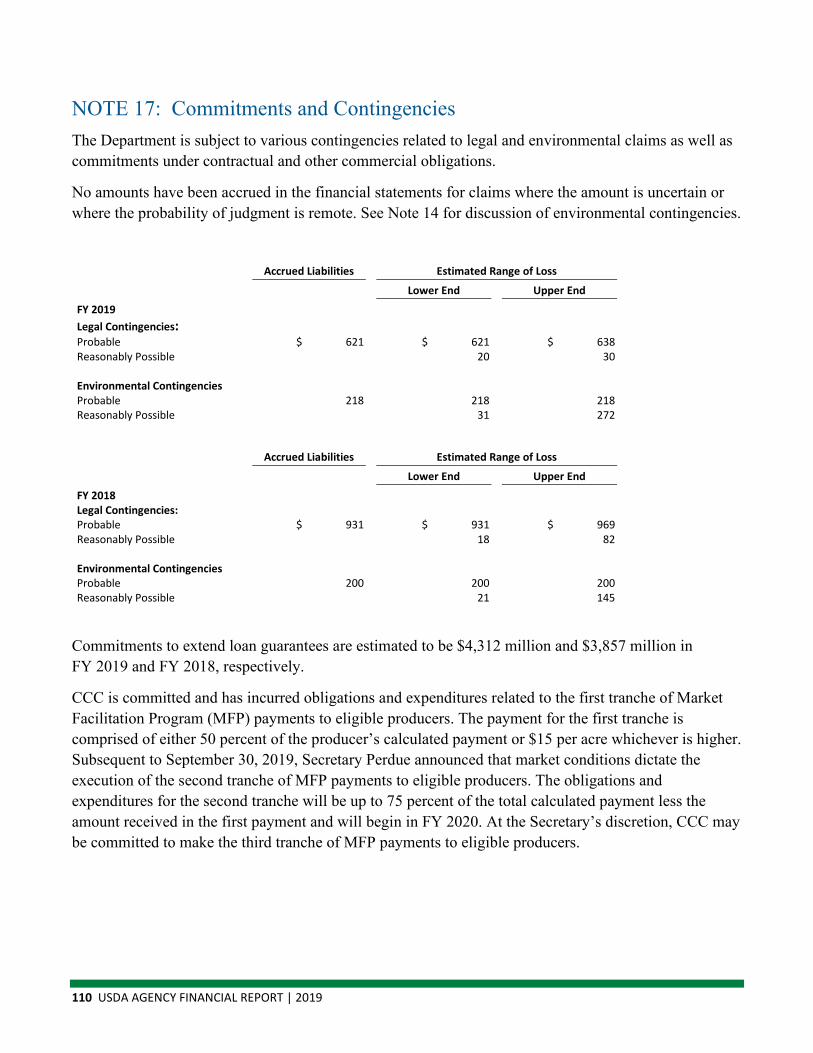
110 USDA AGENCY FINANCIAL REPORT | 2019
NOTE 17: Commitments and Contingencies The Department is subject to various contingencies related to legal and environmental claims as well as commitments under contractual and other commercial obligations.
No amounts have been accrued in the financial statements for claims where the amount is uncertain or where the probability of judgment is remote. See Note 14 for discussion of environmental contingencies.
Item Accrued Liabilities Estimated Range of Loss
Lower End Upper End
FY 2019 Legal Contingencies: Probable $ 621 $ 621 $ 638 Reasonably Possible 20 30
Environmental Contingencies Probable 218 218 218 Reasonably Possible 31 272
item Accrued Liabilities Estimated Range of Loss
Lower End Upper End
FY 2018 Legal Contingencies: Probable $ 931 $ 931 $ 969 Reasonably Possible 18 82
Environmental Contingencies Probable 200 200 200 Reasonably Possible 21 145
Commitments to extend loan guarantees are estimated to be $4,312 million and $3,857 million in FY 2019 and FY 2018, respectively.
CCC is committed and has incurred obligations and expenditures related to the first tranche of Market Facilitation Program (MFP) payments to eligible producers. The payment for the first tranche is comprised of either 50 percent of the producer’s calculated payment or $15 per acre whichever is higher. Subsequent to September 30, 2019, Secretary Perdue announced that market conditions dictate the execution of the second tranche of MFP payments to eligible producers. The obligations and expenditures for the second tranche will be up to 75 percent of the total calculated payment less the amount received in the first payment and will begin in FY 2020. At the Secretary’s discretion, CCC may be committed to make the third tranche of MFP payments to eligible producers.

SECTION II | FINANCIAL INFORMATION 111
NOTE 18: Funds from Dedicated Collections Funds from dedicated collections are financed by specifically identified revenues, often supplemented by other financing sources, which remain available over time. These specifically identified revenues and other financing sources are required by statute to be used for designated activities or purposes and must be accounted for separately from the Government’s general revenues.
Financial information for all significant funds from dedicated collections follows the descriptions of each fund’s purpose shown below.
Agricultural Marketing Service (AMS)
Funds for Strengthening Markets, Income, and Supply
The funds for strengthening markets, income, and supply are used to purchase commodities for schools and elderly feeding programs, to provide goods and other necessities in emergencies and disasters, and to purchase agricultural commodities to stabilize markets. The fund is permanently financed by statutory transfer of an amount equal to 30 percent of customs receipts collected during each calendar year and is automatically appropriated for expanding outlets for perishable, non-price supported commodities. An amount equal to 30 percent of receipts collected on fishery products is transferred to the Food and Nutrition Service and is used to purchase commodities under section 6 of the National School Lunch Act and other authorities specified in the child nutrition appropriation. Funds are available under section 32 of the Act of August 24, 1935, as amended (7 U.S.C. 612c).
Expenses and Refunds, Inspection and Grading of Farm Products
The commodity grading programs provide grading, examination, and certification services for a wide variety of fresh and processed food commodities using federally approved grade standards and purchase specifications. This fund is financed by the collection of fees charged to producers of various food commodities who request, on a voluntary basis, inspection and grading of agricultural food commodities. This program is authorized by the Agricultural Marketing Act of 1946 (7 U.S.C. 1621–1627).
Animal Plant Health Inspection Service (APHIS)
Agricultural Quarantine Inspection User Fee Account
This fund is used to record and report expenditures and revenue associated with operating Agricultural Quarantine Inspection (AQI) activities at ports of entry. The Farm Bill of 1990, as amended by the Federal Agriculture Improvement and Reform Act of 1996, gave the Animal and Plant Health Inspection Service (APHIS) the authority to charge user fees for AQI services and to use the revenue to fund AQI activities. In March of 2003, a portion of the AQI program was transferred to the Department of Homeland Security (DHS); however, APHIS retained the authority to collect AQI revenue. APHIS transfers a portion of the revenue to DHS periodically throughout the year to fund its expenditures. The revenue in the fund is collected from airlines, air passengers, vessels, trucks, and railroad cars that
112 USDA AGENCY FINANCIAL REPORT | 2019
are subject to AQI inspection at ports of entry. These user fees are an inflow of revenue from the public that is used to fund AQI inspections that are required by APHIS and DHS. The authority is codified in 21 U.S.C. 136(a).
Forest Service (FS)
Cooperative Work
Cooperative contributions are deposited for disbursement in compliance with the terms and provisions of the agreement between the cooperator and the FS. Cooperators include timber purchasers, not-for-profit organizations, and local hunting and fishing clubs. The governing authorities are the Cooperative Funds Act of July 31, 1914 (16 U.S.C. 498) and the Knutson Vandenberg Act.
Land Acquisition
Funds are appropriated annually from Interior’s Land and Water Conservation Fund, but are no-year appropriations to the Forest Service for acquisition of land pursuant to the Land and Water Conservation Act, as amended and other land acquisition authorities of the Forest Service (section 40.12).
Payments to States, National Forest Fund
The Act of May 23, 1908, as amended (16 U.S.C. 500), commonly known as Payments to States, requires with a few exceptions, that 25 percent of all monies received from the national forests and deposited into the National Forest Fund during a fiscal year from timber, grazing, special-use permits, power and mineral leases, and admission and user fees be paid to the States in which the national forests are located, for public schools and public roads in the county or counties in which the national forests are situated.
Timber Salvage Sales
The Salvage Sale Fund was established to facilitate the timely removal of timber damaged by fire, wind, insects, diseases, or other events. Amounts collected from the sale of salvaged timber are used on other qualifying salvage sales to cover the cost of preparing and administering the sales. The Timber Salvage Sales program is authorized by 16 USC 472(a).
State and Private Forestry
The FY 2004 Department of the Interior and Related Agencies Appropriation Act (Public Law 108-108) authorizes the Forest Service to receive a transfer of receipts from the Department of the Interior’s Land and Water Conservation Fund to finance the existing Forest Legacy Program. Treasury established a new special fund, “State and Private Forestry” to accommodate for this program, and the funding is available until expended. The program expenditures include grants and an occasional land purchase, but no real property will be procured or constructed.
SECTION II | FINANCIAL INFORMATION 113
Recreation Fee Demonstration Program The Recreation Fee Demonstration Program fund receives deposits of recreation fees collected from projects that are part of the Recreation Fee Demonstration Program. These monies are retained and used for backlog repair and maintenance of recreation areas, sites or projects. These funds are also used for interpretation, signage, habitat or facility enhancement, resource preservation, annual operation, maintenance, and law enforcement related to public use of recreation areas and sites. The Recreation Fee Demonstration Program is authorized by 16 U.S.C. 4601-6(a).
National Forest Fund Receipts The Act of May 23, 1908, as amended (16 U.S.C. 500), requires (with a few exceptions) that all receipts from national forest activities be aggregated each fiscal year in order to calculate the portion which is paid to the States in which the national forests are located. The payments must be used for public schools and roads in the county or counties in which the national forests are situated. Originally, the States’ portion of receipts was 25 percent, but past statutory amendments have changed the calculation factors from time to time. Receipts include revenues from the sale of timber and other forest products; fees for grazing, special-use permits, power and mineral leases; and recreation user fees.
Restoration of Forest Lands and Improvements
The Restoration of Forest Lands and Improvements Acts (16 U.S.C. 579(c)) states any monies received by the United States with respect to lands under the administration of the Forest Service (a) as a result of the forfeiture of a bond or deposit by a permittee or timber purchaser for failure to complete performance of improvement, protection, or rehabilitation work required under the permit or timber sale contract or (b) as a result of a judgment, compromise, or settlement of any claim, involving present or potential damage to lands or improvements, shall be deposited into the Restoration of Forest Lands and Improvements Account. The monies are then made available until expended to cover the cost to the United States of any improvement, protection, or rehabilitation work on lands under the administration of the Forest Service rendered necessary by the action which led to the forfeiture, judgment, compromise, or settlement, provided that any portion of the monies received in excess of the amount expended in performing the work necessitated by the action which led to their receipt shall be transferred to miscellaneous receipts.
National Grasslands Receipts
Title III, Bankhead-Jones Farm Tenant Act (Act) of July 22, 1937, as amended (7 U.S.C. 1012) authorizes annual payments on a calendar year basis to counties, equal to 25 percent of revenues received during the year from sales activities and fees on lands designated as national grasslands or land utilization projects. Counties use these payments for public schools and roads.
The administrative process of aggregating the receipts on a calendar year basis (involving two fiscal years) and disbursing the payments requires an unavailable receipt account (National Grasslands Receipts, Forest Service) and an available receipt account (Payments to Counties, National Grasslands, Forest Service).
114 USDA AGENCY FINANCIAL REPORT | 2019
Acquisition of Lands to Complete Land Exchanges Land Exchange Acquisitions is authorized by the Act of December 4, 1967, as amended (16 U.S.C. 484a), commonly known as The Sisk Act. All deposits received during the previous fiscal year are made available by the annual appropriation act. The authorizing legislation provides for cash deposits of a portion or all of the value of the selected lands in exchange cases with States, local governments, and public school districts or other public school authority, to be used to purchase similar lands, or in cases of special legislation, for authorized expenditures from funds deposited by non-federal parties.
Stewardship Contracting Product Sales Stewardship End Result Contracting Projects (16 U.S.C. 6591c), amends the Healthy Forests Restoration Act of 2003, and states the Forest Service, via agreement or contract as appropriate, may enter into stewardship contracting projects with private persons or other public or private entities to perform services to achieve land management goals for the national forests and the public lands that meet local and rural community needs. The value of timber or other forest products removed may be applied as an offset against the cost of services received under the agreements or contracts. Monies earned from such agreements or contracts may be retained by the Forest Service and shall be available for expenditure without further appropriation at the project site from which the monies are collected or at another project site. In addition, if the offset value of the forest products exceeds the value of the resource improvement treatments, the Forest Service may collect any residual receipts under the Act of June 9, 1930 (commonly known as the Knutson-Vandenberg Act, 16 U.S.C. 576); and apply the excess to other authorized stewardship projects. Finally, the Forest Service is required to annually report to the Committee of Agriculture, Nutrition, and Forestry of the Senate and the Committee on Agriculture of the House of Representatives on the status and accomplishments of these agreements and contracts.
National Institute of Food and Agriculture (NIFA)
Native American Institutions Endowment Fund The Native American Institutions Endowment Fund was authorized by Public Law 103-382 and provided an initial installment to establish an endowment to benefit the 1994 land-grant institutions. The public law states that “This program will enhance educational opportunities for Native Americans by building educational capacity at these institutions in the areas of student recruitment and retention, curricula development, faculty preparation, instruction delivery systems, and scientific instrumentation for teaching.” While the principal (corpus) of the fund cannot be used, the interest that is earned on the endowment fund investments in Treasury instruments can be used for the purposes described above. After the close of a fiscal year, the income is distributed after making adjustments for the cost of administering the fund.
SECTION II | FINANCIAL INFORMATION 115
Other Financial information is summarized for all other funds from dedicated collections with total assets less than $50 million listed below.
Agricultural Marketing Service
▪ Perishable Agricultural Commodities Act
▪ Wool Research, Development and Promotion Trust Fund
▪ Inspection and Weighing Services
Animal Plant Health Inspection Service
▪ Miscellaneous Contributed Funds
▪ Gifts and Bequests
Forest Service
▪ Roads and Trails for States, National Forest Fund
▪ Reforestation Trust Fund
▪ Timber Sales Pipeline Restoration Fund
▪ Operation and Maintenance of Forest Service Quarters
▪ Timber Roads, Purchaser Elections
▪ Range Betterment Fund
▪ Acquisition of Lands for National Forests, Special Acts
▪ Receipts for Construction of Administrative Improvements- Arizona and Taos, New Mexico Land Conveyance
▪ Payment to Minnesota (Cook, Lake and Saint Louis Counties)
▪ Licensee Program
▪ Resource Management Timber Receipts
▪ Quinault Special Management Area
▪ MNP Rental Fee Account
▪ Land Between the Lakes Management Fund
▪ Administration of Rights-of-Way and Other Land Uses Fund
▪ Hardwood Technology Transfer and Applied Research Fund
▪ Gifts, Donations and Bequests for Forest and Rangeland Research
116 USDA AGENCY FINANCIAL REPORT | 2019
▪ Land Between the Lakes Trust Fund
▪ Expenses, Brush Disposal
▪ Midewin National Tallgrass Prairie Restoration Fund
▪ Gifts and Bequests
Natural Resources Conservation Service
▪ Damage Assessment and Restoration Revolving Fund
▪ Miscellaneous Contributed Funds
Agricultural Research Service
▪ Concessions Fees and Volunteer Services
▪ Gifts and Bequests
▪ Miscellaneous Contributed Funds
Rural Development
▪ Alternative Agricultural Research and Commercialization Revolving Fund
Foreign Agricultural Service
▪ Miscellaneous Contributed Funds
▪ Gifts and Bequests
▪ Foreign Service National Separation Liability Trust Fund
Food Safety and Inspection Service
▪ Expenses and Refunds, Inspection of Farm Products
National Agricultural Statistics Service
▪ Miscellaneous Contributed Funds
Economic Research Service
▪ Miscellaneous Contributed Funds
Office of the Secretary
▪ Gifts and Bequests
SECTION II | FINANCIAL INFORMATION 117
Office of Partnership and Public Engagement
▪ Gifts and Bequests
Office of Communications
▪ Gifts and Bequests
Office of General Counsel
▪ Gifts and Bequests
Office of the Inspector General
▪ Inspector General Assets Forfeiture, Department of Justice
▪ Inspector General Assets Forfeiture, Department of Treasury
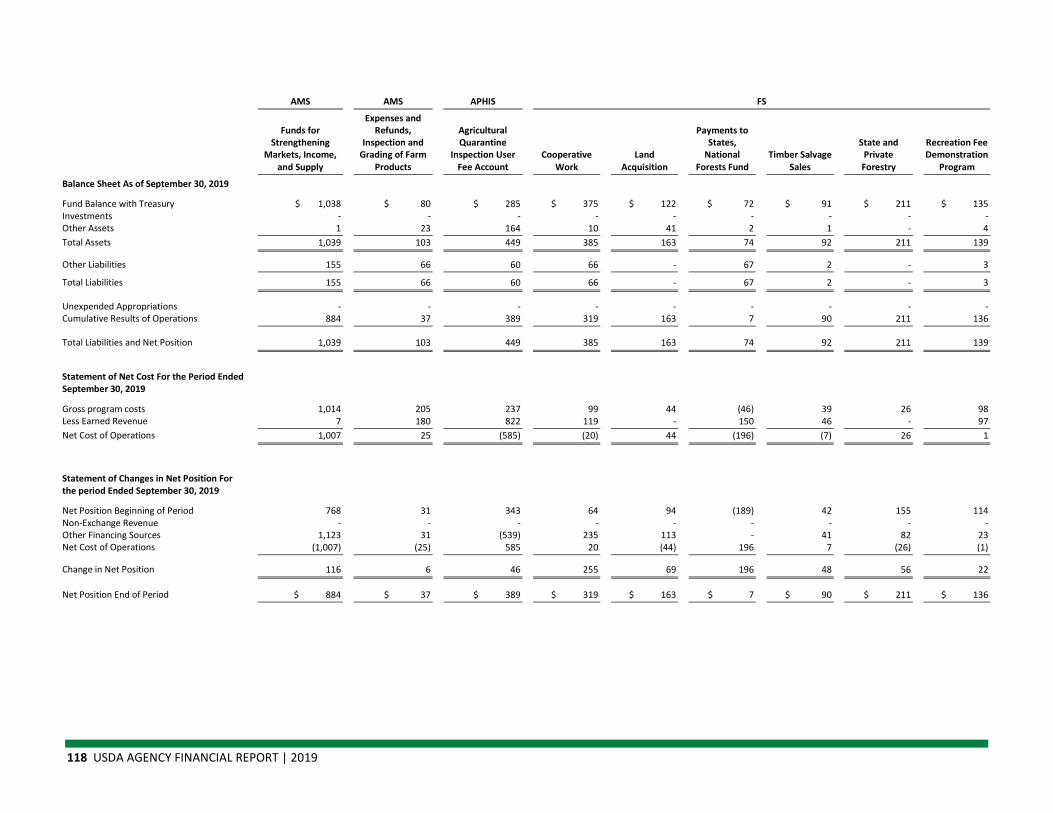
118 USDA AGENCY FINANCIAL REPORT | 2019
AMS AMS APHIS FS
Item Funds for
Strengthening Markets, Income,
and Supply
Expenses and Refunds,
Inspection and Grading of Farm
Products
Agricultural Quarantine
Inspection User Fee Account
Cooperative Work
Land Acquisition
Payments to States,
National Forests Fund
Timber Salvage Sales
State and Private Forestry
Recreation Fee Demonstration
Program
Balance Sheet As of September 30, 2019
Fund Balance with Treasury $ 1,038 $ 80 $ 285 $ 375 $ 122 $ 72 $ 91 $ 211 $ 135 Investments - - - - - - - - - Other Assets 1 23 164 10 41 2 1 - 4 Total Assets 1,039 103 449 385 163 74 92 211 139
Other Liabilities 155 66 60 66 - 67 2 - 3
Total Liabilities 155 66 60 66 - 67 2 - 3
Unexpended Appropriations - - - - - - - - - Cumulative Results of Operations 884 37 389 319 163 7 90 211 136
Total Liabilities and Net Position 1,039 103 449 385 163 74 92 211 139
Statement of Net Cost For the Period Ended September 30, 2019
Gross program costs 1,014 205 237 99 44 (46) 39 26 98 Less Earned Revenue 7 180 822 119 - 150 46 - 97 Net Cost of Operations 1,007 25 (585) (20) 44 (196) (7) 26 1
Statement of Changes in Net Position For the period Ended September 30, 2019
Net Position Beginning of Period 768 31 343 64 94 (189) 42 155 114 Non-Exchange Revenue - - - - - - - - - Other Financing Sources 1,123 31 (539) 235 113 - 41 82 23 Net Cost of Operations (1,007) (25) 585 20 (44) 196 7 (26) (1)
Change in Net Position 116 6 46 255 69 196 48 56 22
Net Position End of Period $ 884 $ 37 $ 389 $ 319 $ 163 $ 7 $ 90 $ 211 $ 136

SECTION II | FINANCIAL INFORMATION 119
FS NIFA Other Total
Item National Forest Fund Receipts
Restoration of Forest Lands and
Improvements National Grasslands
Receipts
Acquisition of Lands to Complete
Land Exchanges
Stewardship Contracting
Product Sales
Native American Institutions
Endowment Fund
Balance Sheet As of September 30, 2019
Fund Balance with Treasury $ 147 $ 307 $ 145 $ 36 $ 59 $ 15 $ 329 $ 3,447 Investments - - - - - 227 8 235 Other Assets 4 2 - 50 20 - 12 334 Total Assets 151 309 145 86 79 242 349 4,016
Other Liabilities - - 36 - 6 - 44 505
Total Liabilities - - 36 - 6 - 44 505
Unexpended Appropriations - - - - - 179 1 180 Cumulative Results of Operations 151 309 109 86 73 63 304 3,331
Total Liabilities and Net Position 151 309 145 86 79 242 349 4,016
Statement of Net Cost For the Period Ended September 30, 2019
Gross program costs - 29 52 6 22 12 167 2,004 Less Earned Revenue (26) 6 37 14 30 5 159 1,646 Net Cost of Operations 26 23 15 (8) (8) 7 8 358
Statement of Changes in Net Position For the period Ended September 30, 2019
Net Position Beginning of Period 181 128 110 78 55 237 200 2,411 Non-Exchange Revenue - - - - - - - - Other Financing Sources (4) 204 14 - 10 12 113 1,458 Net Cost of Operations (26) (23) (15) 8 8 (7) (8) (358)
Change in Net Position (30) 181 (1) 8 18 5 105 1,100
Net Position End of Period $ 151 $ 309 $ 109 $ 86 $ 73 $ 242 $ 305 $ 3,511

120 USDA AGENCY FINANCIAL REPORT | 2019
AMS AMS APHIS FS
Item Funds for Strengthening Markets,
Income, and Supply
Expenses and Refunds, Inspection and Grading
of Farm Products
Agricultural Quarantine Inspection
User Fee Account Cooperative
Work Land
Acquisition
Payments to States, National
Forests Fund State and
Private Forestry
Recreation Fee Demonstration
Program
Balance Sheet As of September 30, 2018
Fund Balance with Treasury $ 804 $ 71 $ 257 $ 132 $ 53 $ 59 $ 144 $ 113 Investments - - - - - - - - Other Assets 1 20 152 11 41 1 11 4 Total Assets 805 91 409 143 94 60 155 117
Other Liabilities 37 60 66 79 - 249 - 3
Total Liabilities 37 60 66 79 - 249 - 3
Unexpended Appropriations - - - - - - - - Cumulative Results of Operations 768 31 343 64 94 (189) 155 114
Total Liabilities and Net Position 805 91 409 143 94 60 155 117
Statement of Net Cost For the Period Ended September 30, 2018
Gross program costs 724 223 228 115 47 327 46 91 Less Earned Revenue 5 169 717 105 - 82 - 100 Net Cost of Operations 719 54 (489) 10 47 245 46 (9)
Statement of Changes in Net Position For the period Ended September 30, 2018
Net Position Beginning of Period 519 44 296 169 92 57 143 94 Non-Exchange Revenue - - - - - - - - Other Financing Sources 968 41 (442) (95) 49 - 58 11 Net Cost of Operations (719) (54) 489 (10) (47) (246) (46) 9
Change in Net Position 249 (13) 47 (105) 2 (246) 12 20
Net Position End of Period $ 768 $ 31 $ 343 $ 64 $ 94 $ (189) $ 155 $ 114
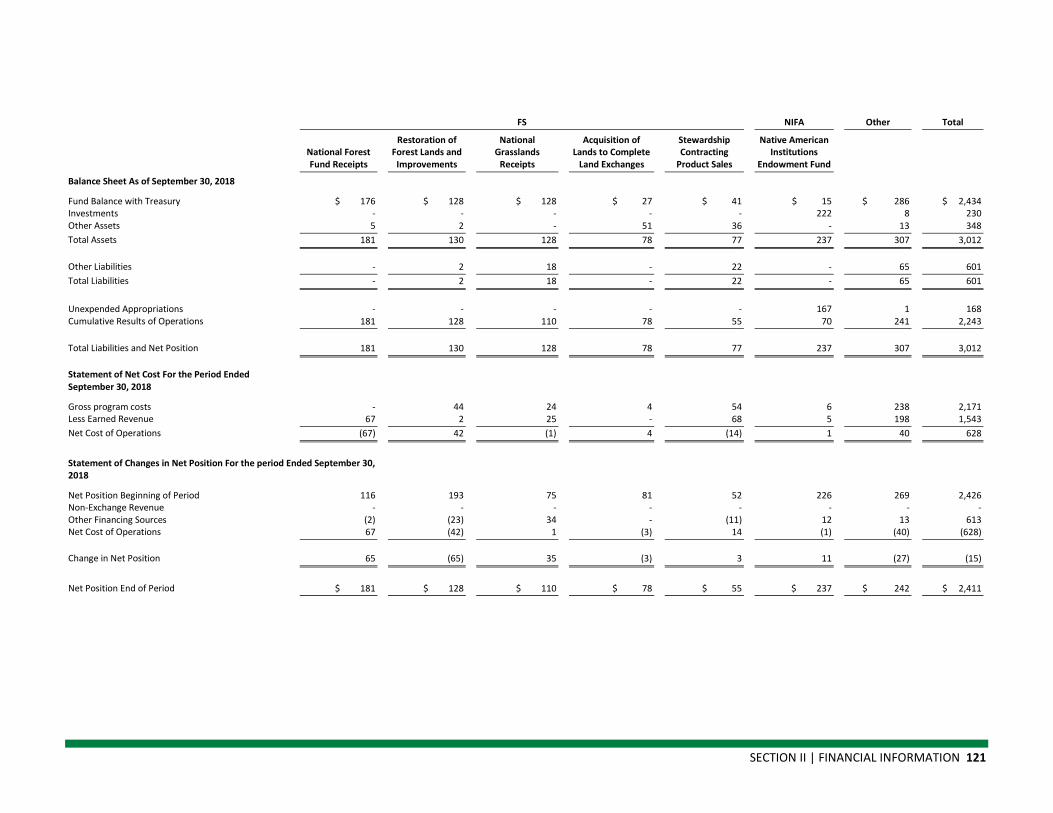
SECTION II | FINANCIAL INFORMATION 121
FS NIFA Other Total
Item National Forest Fund Receipts
Restoration of Forest Lands and
Improvements
National Grasslands
Receipts
Acquisition of Lands to Complete
Land Exchanges
Stewardship Contracting
Product Sales
Native American Institutions
Endowment Fund
Balance Sheet As of September 30, 2018
Fund Balance with Treasury $ 176 $ 128 $ 128 $ 27 $ 41 $ 15 $ 286 $ 2,434 Investments - - - - - 222 8 230 Other Assets 5 2 - 51 36 - 13 348 Total Assets 181 130 128 78 77 237 307 3,012
Other Liabilities - 2 18 - 22 - 65 601 Total Liabilities - 2 18 - 22 - 65 601
Unexpended Appropriations - - - - - 167 1 168 Cumulative Results of Operations 181 128 110 78 55 70 241 2,243
Total Liabilities and Net Position 181 130 128 78 77 237 307 3,012
Statement of Net Cost For the Period Ended September 30, 2018
Gross program costs - 44 24 4 54 6 238 2,171 Less Earned Revenue 67 2 25 - 68 5 198 1,543 Net Cost of Operations (67) 42 (1) 4 (14) 1 40 628
Statement of Changes in Net Position For the period Ended September 30, 2018
Net Position Beginning of Period 116 193 75 81 52 226 269 2,426 Non-Exchange Revenue - - - - - - - - Other Financing Sources (2) (23) 34 - (11) 12 13 613 Net Cost of Operations 67 (42) 1 (3) 14 (1) (40) (628)
Change in Net Position 65 (65) 35 (3) 3 11 (27) (15)
Net Position End of Period $ 181 $ 128 $ 110 $ 78 $ 55 $ 237 $ 242 $ 2,411
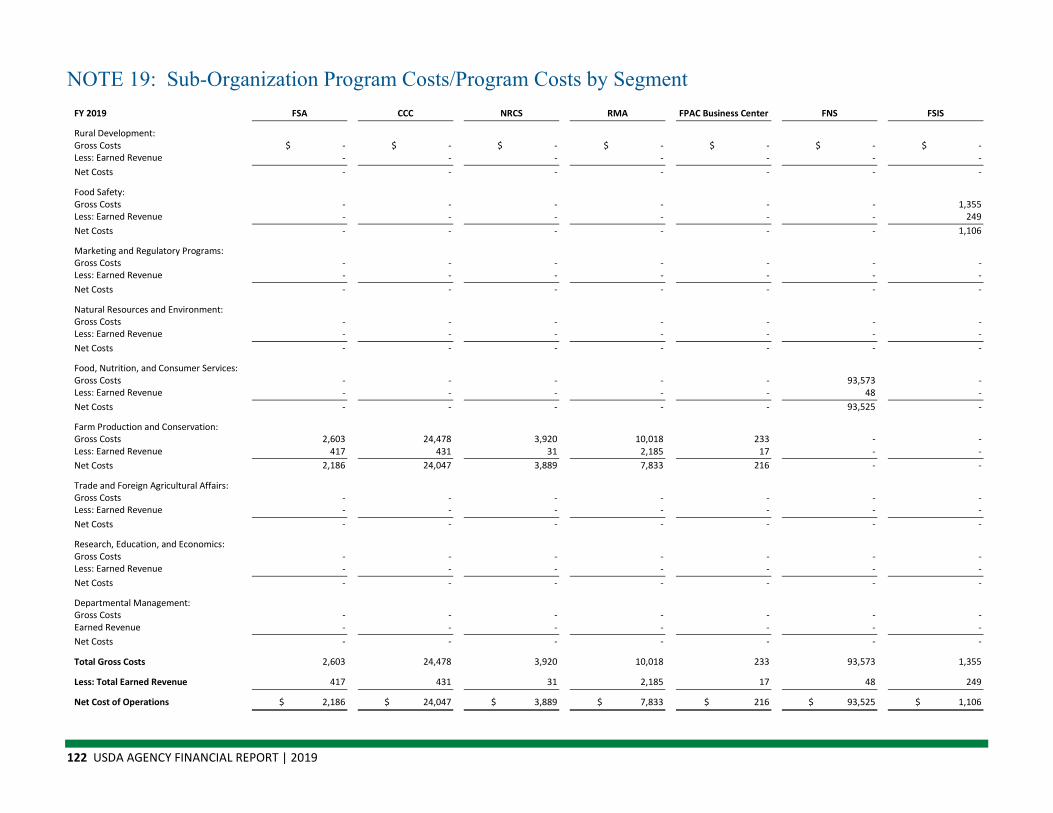
122 USDA AGENCY FINANCIAL REPORT | 2019
NOTE 19: Sub-Organization Program Costs/Program Costs by Segment FY 2019 FSA CCC NRCS RMA FPAC Business Center FNS FSIS
Rural Development: Gross Costs $ - $ - $ - $ - $ - $ - $ - Less: Earned Revenue - - - - - - - Net Costs - - - - - - -
Food Safety: Gross Costs - - - - - - 1,355 Less: Earned Revenue - - - - - - 249 Net Costs - - - - - - 1,106
Marketing and Regulatory Programs: Gross Costs - - - - - - - Less: Earned Revenue - - - - - - - Net Costs - - - - - - -
Natural Resources and Environment: Gross Costs - - - - - - - Less: Earned Revenue - - - - - - - Net Costs - - - - - - -
Food, Nutrition, and Consumer Services: Gross Costs - - - - - 93,573 - Less: Earned Revenue - - - - - 48 - Net Costs - - - - - 93,525 -
Farm Production and Conservation: Gross Costs 2,603 24,478 3,920 10,018 233 - - Less: Earned Revenue 417 431 31 2,185 17 - - Net Costs 2,186 24,047 3,889 7,833 216 - -
Trade and Foreign Agricultural Affairs: Gross Costs - - - - - - - Less: Earned Revenue - - - - - - - Net Costs - - - - - - -
Research, Education, and Economics: Gross Costs - - - - - - - Less: Earned Revenue - - - - - - - Net Costs - - - - - - -
Departmental Management: Gross Costs - - - - - - - Earned Revenue - - - - - - - Net Costs - - - - - - -
Total Gross Costs 2,603 24,478 3,920 10,018 233 93,573 1,355
Less: Total Earned Revenue 417 431 31 2,185 17 48 249
Net Cost of Operations $ 2,186 $ 24,047 $ 3,889 $ 7,833 $ 216 $ 93,525 $ 1,106

SECTION II | FINANCIAL INFORMATION 123
FY 2019 AMS APHIS FS FAS ARS NIFA ERS
Rural Development: Gross Costs $ - $ - $ - $ - $ - $ - $ - Less: Earned Revenue - - - - - - - Net Costs - - - - - - -
Food Safety: Gross Costs - - - - - - - Less: Earned Revenue - - - - - - - Net Costs - - - - - - -
Marketing and Regulatory Programs: Gross Costs 1,563 1,605 - - - - - Less: Earned Revenue 306 1,048 - - - - - Net Costs 1,257 557 - - - - -
Natural Resources and Environment: Gross Costs - - 6,336 - - - - Less: Earned Revenue - - 858 - - - - Net Costs - - 5,478 - - - -
Food, Nutrition, and Consumer Services: Gross Costs - - - - - - - Less: Earned Revenue - - - - - - - Net Costs - - - - - - -
Farm Production and Conservation: Gross Costs - - - - - - - Less: Earned Revenue - - - - - - - Net Costs - - - - - - -
Trade and Foreign Agricultural Affairs: Gross Costs - - - 434 - - - Less: Earned Revenue - - - 98 - - - Net Costs - - - 336 - - -
Research, Education, and Economics: Gross Costs - - - - 1,444 1,444 88 Less: Earned Revenue - - - - 181 35 3 Net Costs - - - - 1,263 1,409 85
Departmental Management: Gross Costs - - - - - - - Earned Revenue - - - - - - - Net Costs - - - - - - -
Total Gross Costs 1,563 1,605 6,336 434 1,444 1,444 88
Less: Total Earned Revenue 306 1,048 858 98 181 35 3
Net Cost of Operations $ 1,257 $ 557 $ 5,478 $ 336 $ 1,263 $ 1,409 $ 85
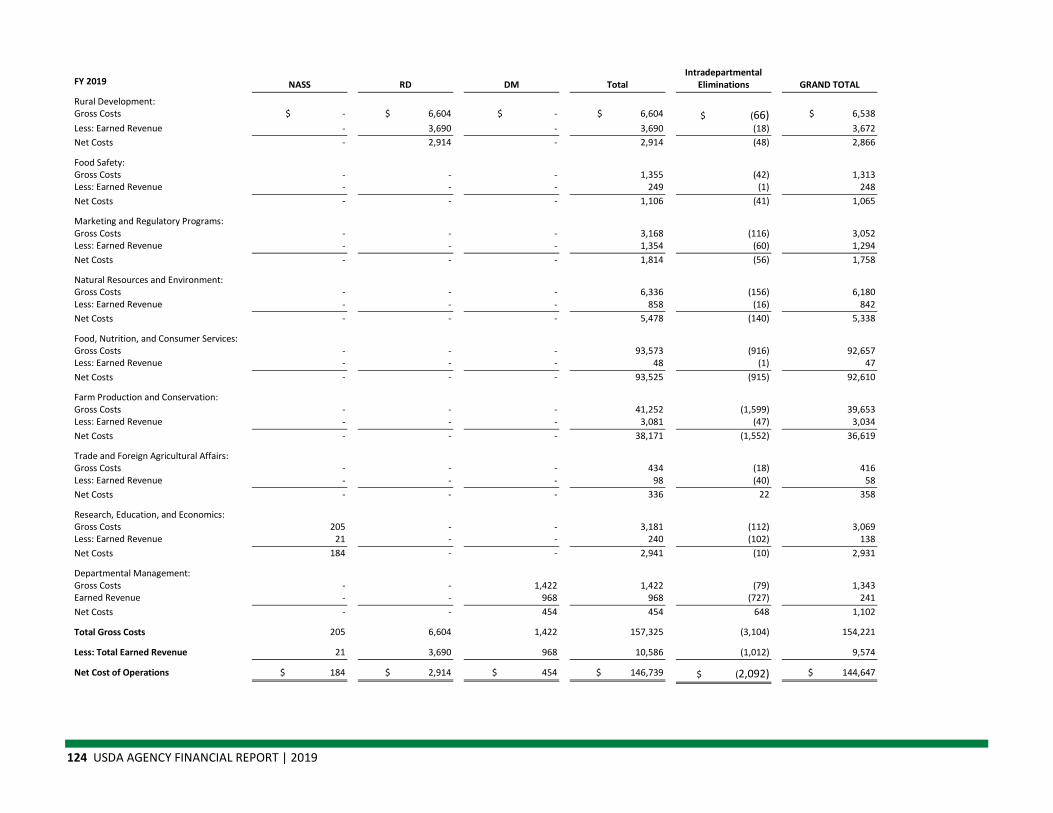
124 USDA AGENCY FINANCIAL REPORT | 2019
FY 2019 NASS RD DM Total Intradepartmental
Eliminations GRAND TOTAL
Rural Development: Gross Costs $ - $ 6,604 $ - $ 6,604 $ (66) $ 6,538 Less: Earned Revenue - 3,690 - 3,690 (18) 3,672 Net Costs - 2,914 - 2,914 (48) 2,866
Food Safety: Gross Costs - - - 1,355 (42) 1,313 Less: Earned Revenue - - - 249 (1) 248 Net Costs - - - 1,106 (41) 1,065
Marketing and Regulatory Programs: Gross Costs - - - 3,168 (116) 3,052 Less: Earned Revenue - - - 1,354 (60) 1,294 Net Costs - - - 1,814 (56) 1,758
Natural Resources and Environment: Gross Costs - - - 6,336 (156) 6,180 Less: Earned Revenue - - - 858 (16) 842 Net Costs - - - 5,478 (140) 5,338
Food, Nutrition, and Consumer Services: Gross Costs - - - 93,573 (916) 92,657 Less: Earned Revenue - - - 48 (1) 47 Net Costs - - - 93,525 (915) 92,610
Farm Production and Conservation: Gross Costs - - - 41,252 (1,599) 39,653 Less: Earned Revenue - - - 3,081 (47) 3,034 Net Costs - - - 38,171 (1,552) 36,619
Trade and Foreign Agricultural Affairs: Gross Costs - - - 434 (18) 416 Less: Earned Revenue - - - 98 (40) 58 Net Costs - - - 336 22 358
Research, Education, and Economics: Gross Costs 205 - - 3,181 (112) 3,069 Less: Earned Revenue 21 - - 240 (102) 138 Net Costs 184 - - 2,941 (10) 2,931
Departmental Management: Gross Costs - - 1,422 1,422 (79) 1,343 Earned Revenue - - 968 968 (727) 241 Net Costs - - 454 454 648 1,102
Total Gross Costs 205 6,604 1,422 157,325 (3,104) 154,221
Less: Total Earned Revenue 21 3,690 968 10,586 (1,012) 9,574
Net Cost of Operations $ 184 $ 2,914 $ 454 $ 146,739 $ (2,092) $ 144,647
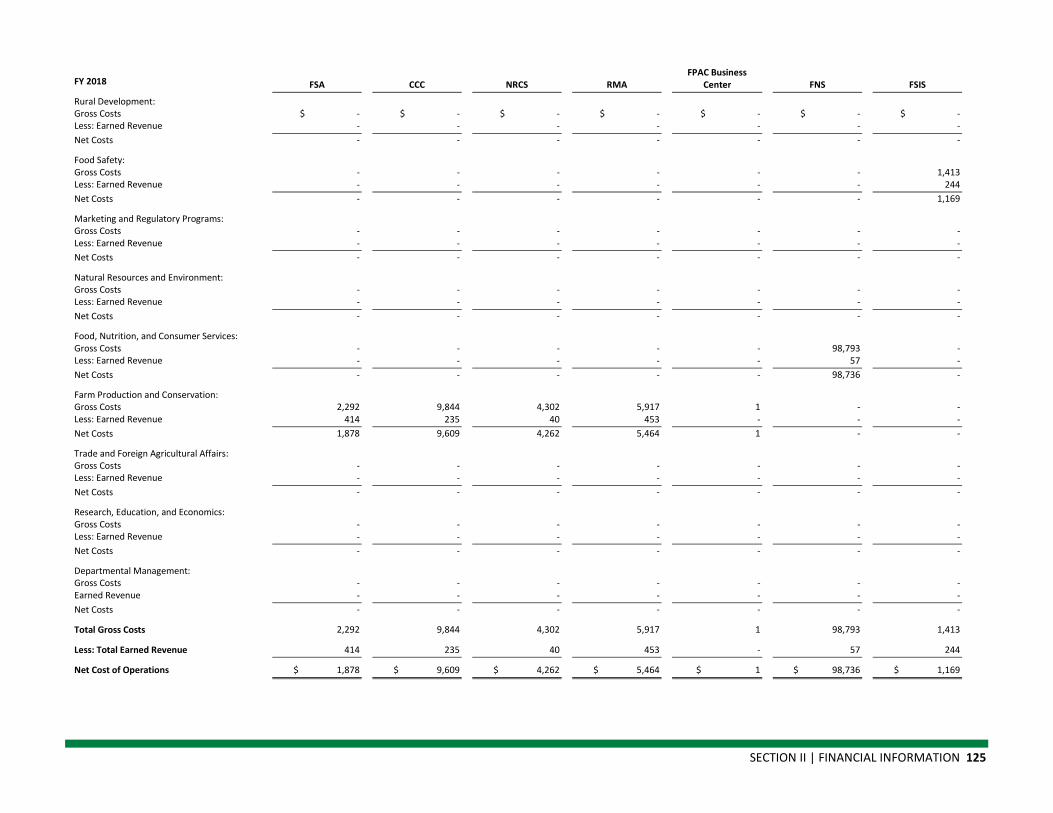
SECTION II | FINANCIAL INFORMATION 125
FY 2018 FSA CCC NRCS RMA FPAC Business
Center FNS FSIS
Rural Development: Gross Costs $ - $ - $ - $ - $ - $ - $ - Less: Earned Revenue - - - - - - - Net Costs - - - - - - -
Food Safety: Gross Costs - - - - - - 1,413 Less: Earned Revenue - - - - - - 244 Net Costs - - - - - - 1,169
Marketing and Regulatory Programs: Gross Costs - - - - - - - Less: Earned Revenue - - - - - - - Net Costs - - - - - - -
Natural Resources and Environment: Gross Costs - - - - - - - Less: Earned Revenue - - - - - - - Net Costs - - - - - - -
Food, Nutrition, and Consumer Services: Gross Costs - - - - - 98,793 - Less: Earned Revenue - - - - - 57 - Net Costs - - - - - 98,736 -
Farm Production and Conservation: Gross Costs 2,292 9,844 4,302 5,917 1 - - Less: Earned Revenue 414 235 40 453 - - - Net Costs 1,878 9,609 4,262 5,464 1 - -
Trade and Foreign Agricultural Affairs: Gross Costs - - - - - - - Less: Earned Revenue - - - - - - - Net Costs - - - - - - -
Research, Education, and Economics: Gross Costs - - - - - - - Less: Earned Revenue - - - - - - - Net Costs - - - - - - -
Departmental Management: Gross Costs - - - - - - - Earned Revenue - - - - - - - Net Costs - - - - - - -
Total Gross Costs 2,292 9,844 4,302 5,917 1 98,793 1,413
Less: Total Earned Revenue 414 235 40 453 - 57 244
Net Cost of Operations $ 1,878 $ 9,609 $ 4,262 $ 5,464 $ 1 $ 98,736 $ 1,169
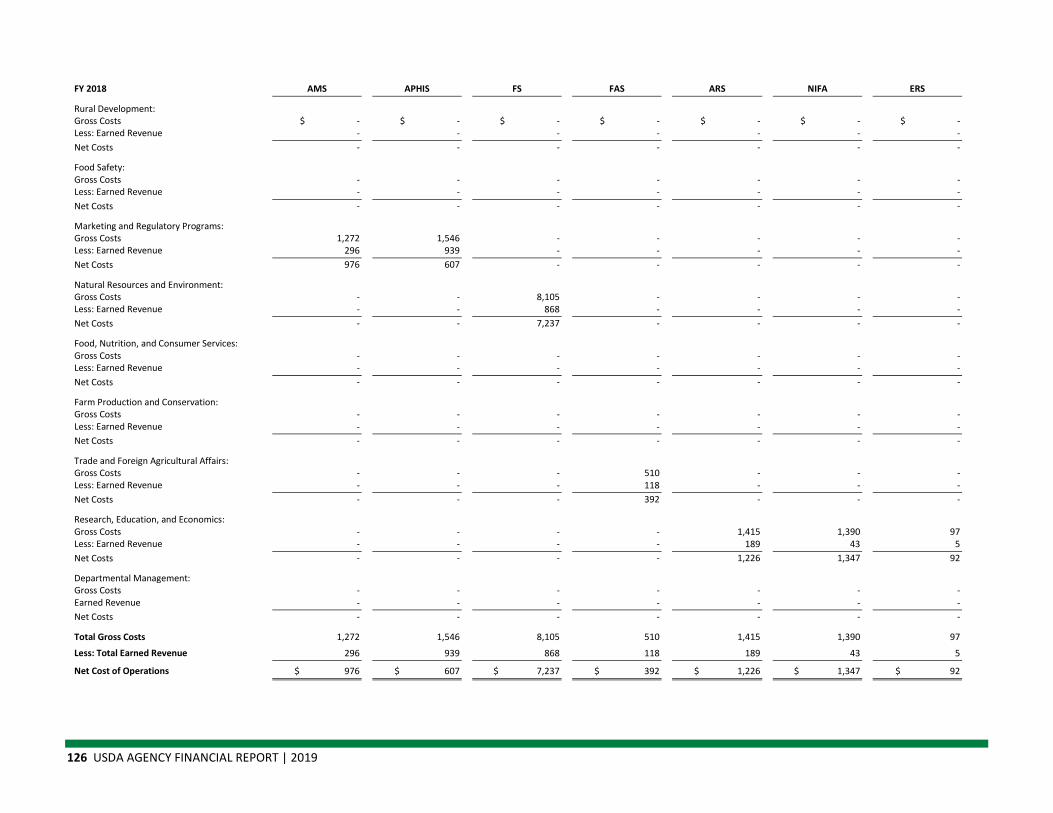
126 USDA AGENCY FINANCIAL REPORT | 2019
FY 2018 AMS APHIS FS FAS ARS NIFA ERS
Rural Development: Gross Costs $ - $ - $ - $ - $ - $ - $ - Less: Earned Revenue - - - - - - - Net Costs - - - - - - -
Food Safety: Gross Costs - - - - - - - Less: Earned Revenue - - - - - - - Net Costs - - - - - - -
Marketing and Regulatory Programs: Gross Costs 1,272 1,546 - - - - - Less: Earned Revenue 296 939 - - - - - Net Costs 976 607 - - - - -
Natural Resources and Environment: Gross Costs - - 8,105 - - - - Less: Earned Revenue - - 868 - - - - Net Costs - - 7,237 - - - -
Food, Nutrition, and Consumer Services: Gross Costs - - - - - - - Less: Earned Revenue - - - - - - - Net Costs - - - - - - -
Farm Production and Conservation: Gross Costs - - - - - - - Less: Earned Revenue - - - - - - - Net Costs - - - - - - -
Trade and Foreign Agricultural Affairs: Gross Costs - - - 510 - - - Less: Earned Revenue - - - 118 - - - Net Costs - - - 392 - - -
Research, Education, and Economics: Gross Costs - - - - 1,415 1,390 97 Less: Earned Revenue - - - - 189 43 5 Net Costs - - - - 1,226 1,347 92
Departmental Management: Gross Costs - - - - - - - Earned Revenue - - - - - - - Net Costs - - - - - - -
Total Gross Costs 1,272 1,546 8,105 510 1,415 1,390 97
Less: Total Earned Revenue 296 939 868 118 189 43 5
Net Cost of Operations $ 976 $ 607 $ 7,237 $ 392 $ 1,226 $ 1,347 $ 92
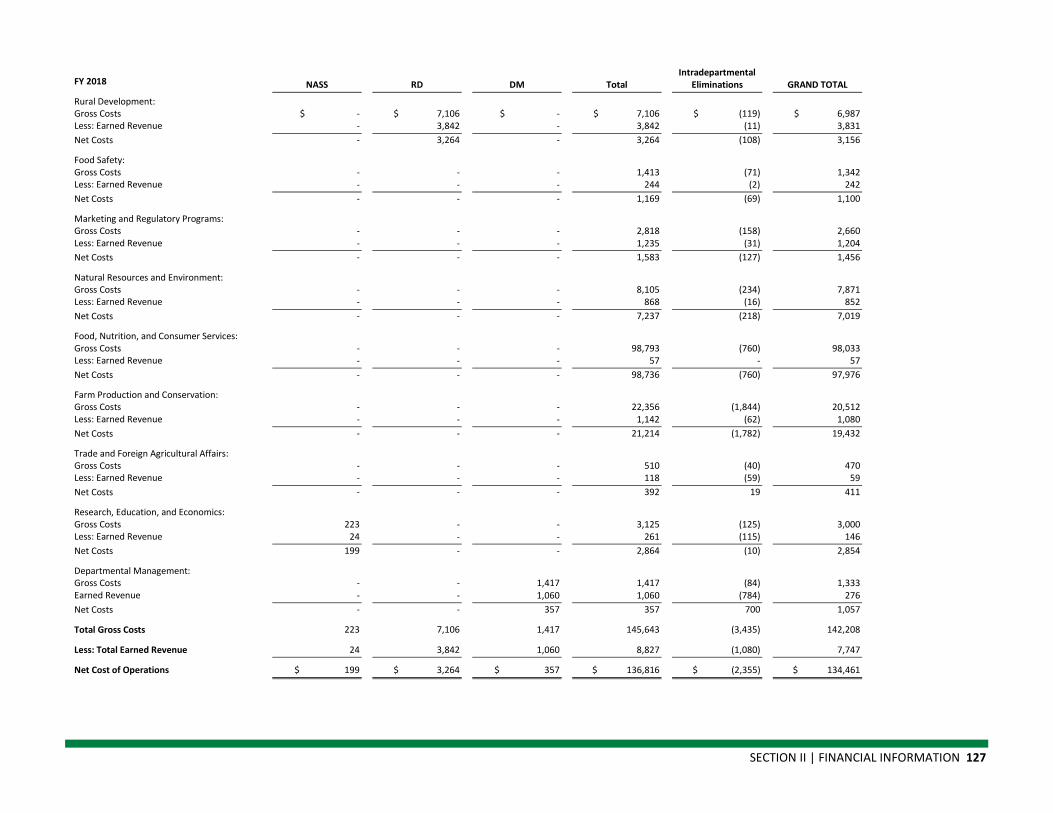
SECTION II | FINANCIAL INFORMATION 127
FY 2018 NASS RD DM Total Intradepartmental
Eliminations GRAND TOTAL
Rural Development: Gross Costs $ - $ 7,106 $ - $ 7,106 $ (119) $ 6,987 Less: Earned Revenue - 3,842 - 3,842 (11) 3,831 Net Costs - 3,264 - 3,264 (108) 3,156
Food Safety: Gross Costs - - - 1,413 (71) 1,342 Less: Earned Revenue - - - 244 (2) 242 Net Costs - - - 1,169 (69) 1,100
Marketing and Regulatory Programs: Gross Costs - - - 2,818 (158) 2,660 Less: Earned Revenue - - - 1,235 (31) 1,204 Net Costs - - - 1,583 (127) 1,456
Natural Resources and Environment: Gross Costs - - - 8,105 (234) 7,871 Less: Earned Revenue - - - 868 (16) 852 Net Costs - - - 7,237 (218) 7,019
Food, Nutrition, and Consumer Services: Gross Costs - - - 98,793 (760) 98,033 Less: Earned Revenue - - - 57 - 57 Net Costs - - - 98,736 (760) 97,976
Farm Production and Conservation: Gross Costs - - - 22,356 (1,844) 20,512 Less: Earned Revenue - - - 1,142 (62) 1,080 Net Costs - - - 21,214 (1,782) 19,432
Trade and Foreign Agricultural Affairs: Gross Costs - - - 510 (40) 470 Less: Earned Revenue - - - 118 (59) 59 Net Costs - - - 392 19 411
Research, Education, and Economics: Gross Costs 223 - - 3,125 (125) 3,000 Less: Earned Revenue 24 - - 261 (115) 146 Net Costs 199 - - 2,864 (10) 2,854
Departmental Management: Gross Costs - - 1,417 1,417 (84) 1,333 Earned Revenue - - 1,060 1,060 (784) 276 Net Costs - - 357 357 700 1,057
Total Gross Costs 223 7,106 1,417 145,643 (3,435) 142,208
Less: Total Earned Revenue 24 3,842 1,060 8,827 (1,080) 7,747
Net Cost of Operations $ 199 $ 3,264 $ 357 $ 136,816 $ (2,355) $ 134,461
128 USDA AGENCY FINANCIAL REPORT | 2019
NOTE 20: Cost of Stewardship PP&E The acquisition cost of stewardship land, including restoration in FY 2019 and FY 2018 was $220 million and $266 million, respectively.
NOTE 21: Terms of Borrowing Authority Used The Secretary of Agriculture has the authority to make and issue notes to the Secretary of the Treasury for the purpose of discharging obligations for RD’s insurance funds and CCC’s nonreimbursed realized losses and debt related to foreign assistance programs. The permanent indefinite borrowing authority includes both interest bearing and non-interest bearing notes. These notes are drawn upon daily when disbursements exceed deposits. Notes payable under the permanent indefinite borrowing authority have a term of one year. On January 1 of each year, USDA refinances its outstanding borrowings, including accrued interest, at the January borrowing rate.
In addition, USDA has permanent indefinite borrowing authority for the foreign assistance and export credit programs to finance disbursements on post-credit reform, direct credit obligations, and credit guarantees. In accordance with the Federal Credit Reform Act of 1990, as amended, USDA borrows from Treasury on October 1, for the entire fiscal year, based on annual estimates of the difference between the amount appropriated (subsidy) and the amount to be disbursed to the borrower. Repayment under this agreement may be, in whole or in part, prior to maturity by paying the principal amount of the borrowings plus accrued interest to the date of repayment. Interest is paid on these borrowings based on weighted average interest rates for the cohort, to which the borrowings are associated. Interest is earned on the daily balance of uninvested funds in the credit reform financing funds maintained at Treasury. The interest income is used to reduce interest expense on the underlying borrowings.
USDA has authority to borrow from the Federal Financing Bank (FFB) in the form of Certificates of Beneficial Ownership (CBOs) or loans executed directly between the borrower and FFB with an unconditional USDA repayment guarantee. CBOs outstanding with FFB are generally secured by unpaid loan principal balances. CBOs outstanding are related to pre-credit reform loans and no longer used for program financing.
FFB CBOs are repaid as they mature and are not related to any particular group of loans. Borrowings made to finance loans directly between the borrower and FFB mature and are repaid as the related group of loans become due. Interest rates on the related group of loans are equal to interest rates on FFB borrowings, except in those situations where an FFB funded loan is restructured and the terms of the loan are modified. Prepayments can be made on Treasury borrowings without a penalty; however, they cannot be made on FFB CBOs, without a penalty.
Funds may also be borrowed from private lending agencies and others. USDA reserves a sufficient amount of its borrowing authority to purchase, at any time, all notes and other obligations evidencing loans made by agencies and others. All bonds, notes, debentures, and similar obligations issued by the Department are subject to approval by the Secretary of the Treasury. Reservation of borrowing authority for these purposes has not been required for many years.

SECTION II | FINANCIAL INFORMATION 129
NOTE 22: Available Borrowing Authority, End of Period Available borrowing authority at September 30, 2019 and 2018 was $41,658 million and $44,123 million, respectively.
NOTE 23: Undelivered Orders at the End of the Period
FY 2019 Federal Non-Federal
Paid $ 13 $ 356 Unpaid 2,772 58,083 Total $ 2,785 $ 58,439
FY 2018 Federal Non-Federal
Paid $2 $513 Unpaid 2 ,722 58,258 Total $2,724 $58,771
NOTE 24: Permanent Indefinite Appropriations USDA has permanent indefinite appropriations available to fund (1) subsidy costs incurred under credit reform programs, (2) certain costs of the crop insurance program, (3) certain commodity program costs, and (4) certain costs associated with FS programs.
The permanent indefinite appropriations for credit reform are mainly available to finance any disbursements incurred under the liquidating accounts. These appropriations become available pursuant to standing provisions of law without further action by Congress after transmittal of the budget for the year involved. They are treated as permanent the first year they become available, as well as in succeeding years. However, they are not stated as specific amounts but are determined by specified variable factors, such as cash needs for liquidating accounts, and information about the actual performance of a cohort or estimated changes in future cash flows of the cohort in the program accounts.
The permanent indefinite appropriation for the crop insurance program is used to cover premium subsidy, delivery expenses, losses in excess of premiums, and research and delivery costs.
The permanent indefinite appropriation for commodity program costs is used to encourage the exportation of agricultural commodities and products, to encourage domestic consumption of agricultural products by diverting them, and to reestablish farmers’ purchasing power by making payments in connection with the normal production of any agricultural commodity for domestic consumption.
The permanent indefinite appropriation for FS programs is used to fund Recreation Fee Collection Costs, Brush Disposal, License programs, Smokey Bear and Woodsy Owl, Restoration of Forest Lands and Improvements, Roads and Trails for States, National Forest Fund, Timber Roads, Purchaser Elections, Timber Salvage Sales and Operations, and Maintenance of Quarters. Each of these permanent indefinite appropriations is funded by receipts made available by law and is available until expended.

130 USDA AGENCY FINANCIAL REPORT | 2019
NOTE 25: Legal Arrangements Affecting Use of Unobligated Balances Unobligated budget authority is the difference between the obligated balance and the total unexpended balance. It represents that portion of the unexpended balance unencumbered by recorded obligations. Appropriations are provided on an annual, multi-year, and no-year basis. An appropriation expires on the last day of its period of availability and is no longer available for new obligations. Unobligated balances retain their fiscal-year identity in an expired account for an additional five fiscal years. The unobligated balance remains available to make legitimate obligation adjustments, i.e., to record previously unrecorded obligations and to make upward adjustments in previously underestimated obligations for five years. At the end of the fifth year, the authority is canceled. Thereafter, the authority is not available for any purpose.
Any information about legal arrangements affecting the use of the unobligated balance of budget authority is specifically stated by program and fiscal year in the appropriation language or in the alternative provisions section at the end of the appropriations act.
NOTE 26: Explanation of Differences Between the SBR and the Budget of the U.S. Government The differences between the FY 2018 Statement of Budgetary Resources and the FY 2018 actual numbers presented in the FY 2020 Budget of the United States Government (Budget) are summarized below.
FY 2018 Item
Budgetary Resources
Obligations Incurred
Distributed Offsetting Receipts Net Outlays
Combined Statement of Budgetary Resources $ 250,340 $ 176,144 $ (2,854) $143,272 Reconciling Items:
Expired Accounts (33,147) (153) - - Commodity Credit Corporation (CCC), Beginning Balance Adjustment
(51) (51) - -
Milk Market Orders Fund 54 54 - - Rounding (4) 1 - 1
Budget of the United States Government $ 217,192 $ 175,995 $ (2,854) $ 143,273
A comparison between the FY 2019 SBR and the FY 2019 actual numbers presented in the FY 2021 Budget cannot be performed as the FY 2021 Budget is not yet available. The FY 2021 Budget is expected to be published in February 2020 and will be available from the U.S. Government Publishing Office.
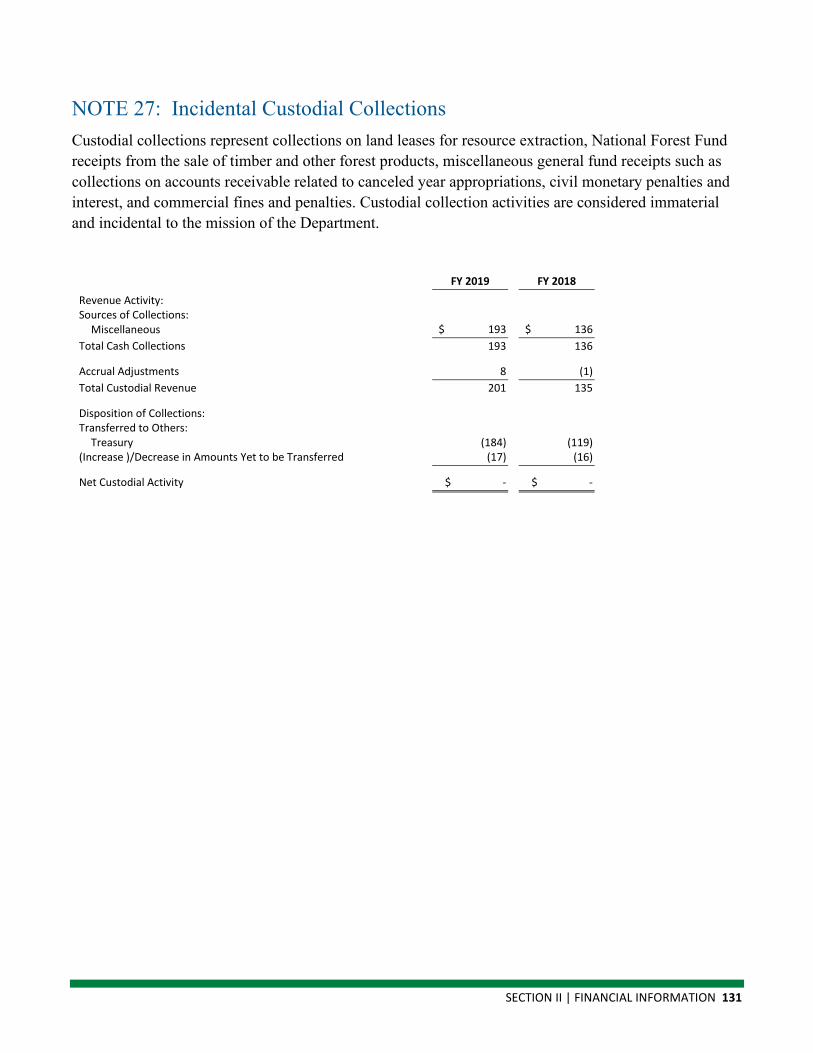
SECTION II | FINANCIAL INFORMATION 131
NOTE 27: Incidental Custodial Collections Custodial collections represent collections on land leases for resource extraction, National Forest Fund receipts from the sale of timber and other forest products, miscellaneous general fund receipts such as collections on accounts receivable related to canceled year appropriations, civil monetary penalties and interest, and commercial fines and penalties. Custodial collection activities are considered immaterial and incidental to the mission of the Department.
Item FY 2019 FY 2018
Revenue Activity: Sources of Collections:
Miscellaneous $ 193 $ 136 Total Cash Collections 193 136
Accrual Adjustments 8 (1) Total Custodial Revenue 201 135
Disposition of Collections: Transferred to Others:
Treasury (184) (119) (Increase )/Decrease in Amounts Yet to be Transferred (17) (16)
Net Custodial Activity $ - $ -
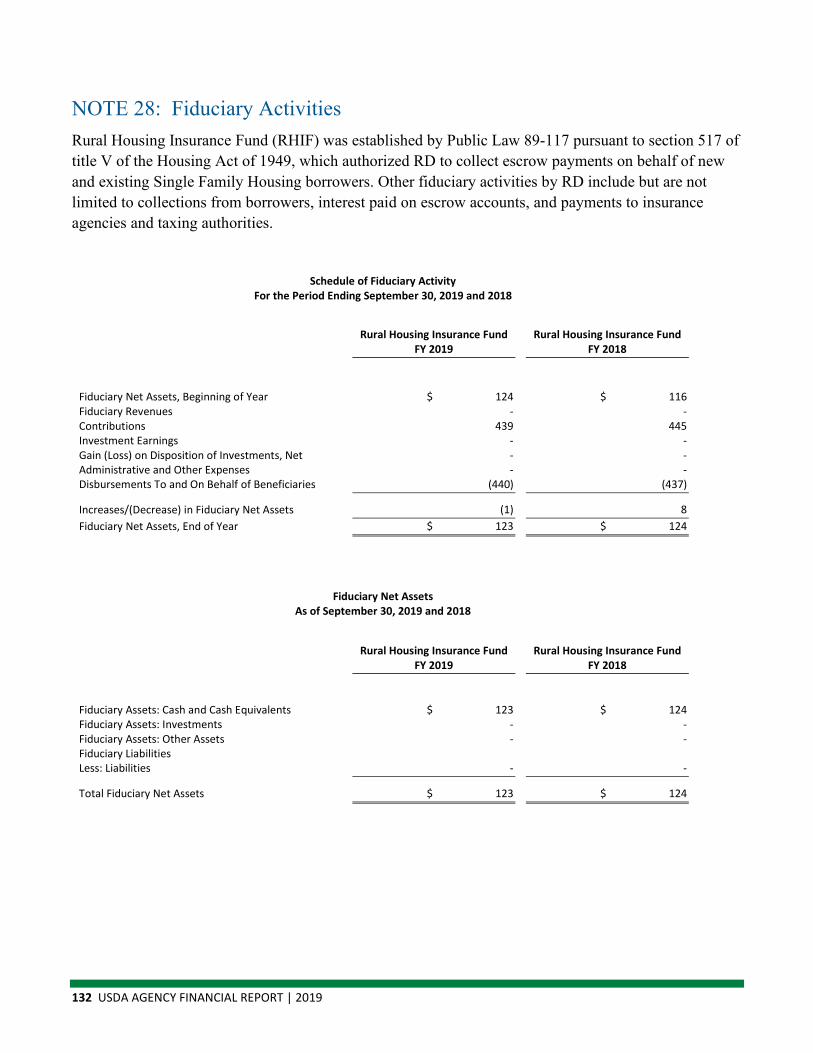
132 USDA AGENCY FINANCIAL REPORT | 2019
NOTE 28: Fiduciary Activities Rural Housing Insurance Fund (RHIF) was established by Public Law 89-117 pursuant to section 517 of title V of the Housing Act of 1949, which authorized RD to collect escrow payments on behalf of new and existing Single Family Housing borrowers. Other fiduciary activities by RD include but are not limited to collections from borrowers, interest paid on escrow accounts, and payments to insurance agencies and taxing authorities.
Schedule of Fiduciary Activity For the Period Ending September 30, 2019 and 2018
Item Rural Housing Insurance Fund FY 2019
Rural Housing Insurance Fund FY 2018
Fiduciary Net Assets, Beginning of Year $ 124 $ 116 Fiduciary Revenues - - Contributions 439 445 Investment Earnings - - Gain (Loss) on Disposition of Investments, Net - - Administrative and Other Expenses - - Disbursements To and On Behalf of Beneficiaries (440) (437)
Increases/(Decrease) in Fiduciary Net Assets (1) 8 Fiduciary Net Assets, End of Year $ 123 $ 124
Fiduciary Net Assets As of September 30, 2019 and 2018
Item Rural Housing Insurance Fund FY 2019
Rural Housing Insurance Fund FY 2018
Fiduciary Assets: Cash and Cash Equivalents $ 123 $ 124 Fiduciary Assets: Investments - - Fiduciary Assets: Other Assets - - Fiduciary Liabilities
Less: Liabilities - -
Total Fiduciary Net Assets $ 123 $ 124
SECTION II | FINANCIAL INFORMATION 133
NOTE 29: Reconciliation of Net Cost to Net Outlays Budgetary and financial accounting information differ. Budgetary accounting is used for planning and control purposes and relates to both the receipt and use of cash, as well as reporting the federal deficit. Financial accounting is intended to provide a picture of the government’s financial operations and financial position so it presents information on an accrual basis. The accrual basis includes information about costs arising from the consumption of assets and the incurrence of liabilities. The reconciliation of net outlays, presented on a budgetary basis, and the net cost, presented on an accrual basis, provides an explanation of the relationship between budgetary and financial accounting information. The reconciliation serves not only to identify costs paid for in the past and those that will be paid in the future, but also to assure integrity between budgetary and financial accounting.
The reconciliation explains the relationship between the net cost of operations and net outlays by presenting (1) components of net cost that are not part of net outlays (e.g. depreciation and amortization expenses of assets previously capitalized, change in asset/liabilities); (2) components of net outlays that are not part of net cost (e.g. acquisition of capital assets); and (3) other temporary timing difference (e.g. prior period adjustments due to correction of errors). The analysis below illustrates this reconciliation by listing the key differences between net cost and net outlays.
Other components of net operating cost not part of the budgetary outlays include primarily cost capitalization offset, cost of goods sold, advances and prepayments, other deferred revenue, liability for clearing accounts, actuarial FECA liability, contingent liabilities, other liabilities with/without related budgetary obligations, and subsidy payable to the financing account.
Other components of the budget outlays that are not part of net operating cost includes primarily other revenue, collections for others, and financing sources transferred in from custodial statement collections.
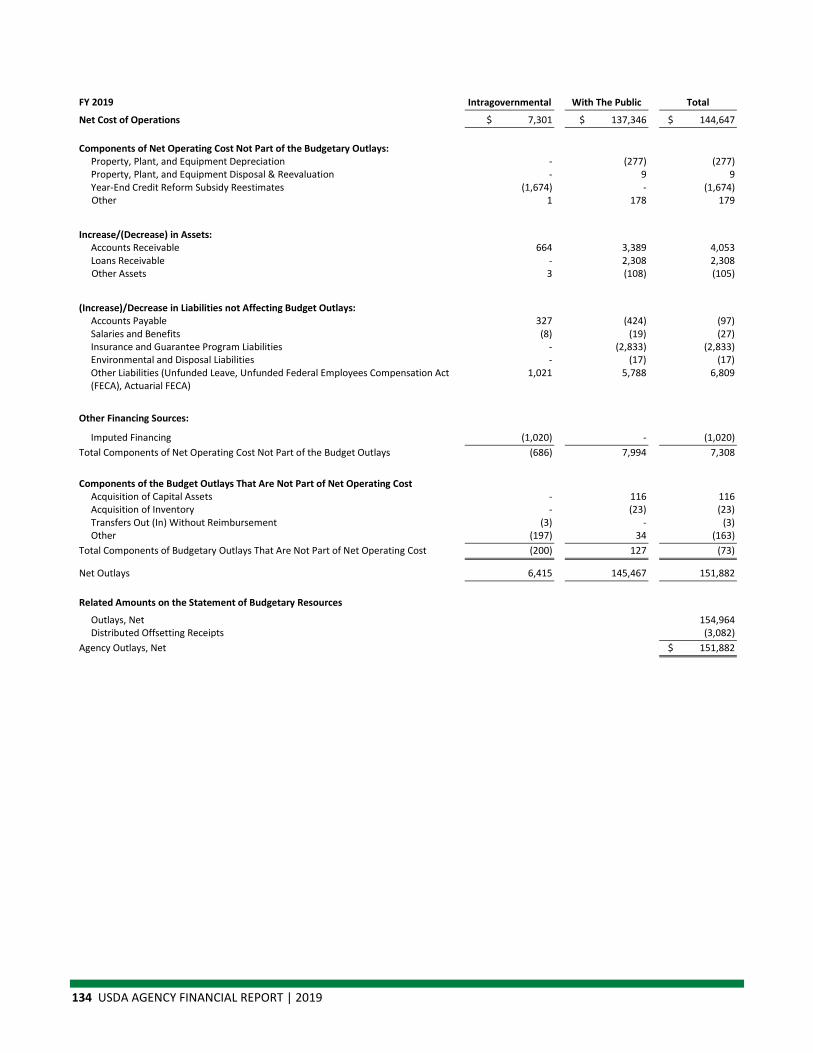
134 USDA AGENCY FINANCIAL REPORT | 2019
FY 2019 Intragovernmental With The Public Total
Net Cost of Operations $ 7,301 $ 137,346 $ 144,647
Components of Net Operating Cost Not Part of the Budgetary Outlays: Property, Plant, and Equipment Depreciation - (277) (277) Property, Plant, and Equipment Disposal & Reevaluation - 9 9 Year-End Credit Reform Subsidy Reestimates (1,674) - (1,674) Other 1 178 179
Increase/(Decrease) in Assets: Accounts Receivable 664 3,389 4,053 Loans Receivable - 2,308 2,308 Other Assets 3 (108) (105)
(Increase)/Decrease in Liabilities not Affecting Budget Outlays: Accounts Payable 327 (424) (97) Salaries and Benefits (8) (19) (27) Insurance and Guarantee Program Liabilities - (2,833) (2,833) Environmental and Disposal Liabilities - (17) (17) Other Liabilities (Unfunded Leave, Unfunded Federal Employees Compensation Act (FECA), Actuarial FECA)
1,021 5,788 6,809
Other Financing Sources:
Imputed Financing (1,020) - (1,020) Total Components of Net Operating Cost Not Part of the Budget Outlays (686) 7,994 7,308
Components of the Budget Outlays That Are Not Part of Net Operating Cost Acquisition of Capital Assets - 116 116 Acquisition of Inventory - (23) (23) Transfers Out (In) Without Reimbursement (3) - (3) Other (197) 34 (163)
Total Components of Budgetary Outlays That Are Not Part of Net Operating Cost (200) 127 (73)
Net Outlays 6,415 145,467 151,882
Related Amounts on the Statement of Budgetary Resources
Outlays, Net
154,964 Distributed Offsetting Receipts
(3,082)
Agency Outlays, Net
$ 151,882

SECTION II | FINANCIAL INFORMATION 135
FY 2018 Intragovernmental With The Public Total
Net Cost of Operations $ 7,497 $ 126,964 $ 134,461
Components of Net Operating Cost Not Part of the Budgetary Outlays: Property, Plant, and Equipment Depreciation - (344) (344) Property, Plant, and Equipment Disposal & Reevaluation - 15 15 Year-End Credit Reform Subsidy Reestimates (1,307) - (1,307) Other 1 95 96
Increase/(Decrease) in Assets: Accounts Receivable 57 671 728 Loans Receivable - 2,115 2,115 Other Assets 6 360 366
(Increase)/Decrease in Liabilities not Affecting Budget Outlays: Accounts Payable 29 (608) (579) Salaries and Benefits (1) 5 4 Insurance and Guarantee Program Liabilities - (2,285) (2,285) Environmental and Disposal Liabilities - - - Other Liabilities (Unfunded Leave, Unfunded Federal Employees Compensation Act (FECA), Actuarial FECA)
(62) 6,823 6,761
Other Financing Sources:
Imputed Financing (987) - (987) Total Components of Net Operating Cost Not Part of the Budget Outlays (2,263) 6,847 4,584
Components of the Budget Outlays That Are Not Part of Net Operating Cost Acquisition of Capital Assets - 108 108 Acquisition of Inventory - 29 29 Transfers Out (In) Without Reimbursement 6 - 6 Other (9) 1,239 1,230
Total Components of Budgetary Outlays That Are Not Part of Net Operating Cost (3) 1,376 1,373
Net Outlays 5,231 135,187 140,418
Related Amounts on the Statement of Budgetary Resources Outlays, Net
143,272
Distributed Offsetting Receipts
(2,854) Agency Outlays, Net
$ 140,418
136 USDA AGENCY FINANCIAL REPORT | 2019
NOTE 30: Disclosure Entities and Related Parties
The Department exercises significant influence over the policy decisions of the Milk Market Orders Assessment Fund, Research and Promotion Boards and the Foundation for Food and Agricultural Research.
Milk Market Orders Assessment Fund The Secretary of Agriculture is authorized by the Agricultural Marketing Agreement Act of 1937, as amended under certain conditions to issue Federal milk marketing orders establishing minimum prices which handlers are required to pay for milk purchased from producers. There are currently 11 Federally-sanctioned milk market orders in operation. Market administrators are appointed by the Secretary and are responsible for carrying out the terms of specific marketing orders. Their operating expenses are financed by assessments on regulated handlers and partly by deductions from producers, which are reported to the Agricultural Marketing Service (AMS). Most of these funds are collected and deposited in checking and savings accounts in local banks and disbursed directly for direct disbursement by the market administrator. A portion of the funds collected may be invested in securities such as certificates of deposit. Expenses of local offices are met from an administrative fund and a marketing service fund, which are prescribed in each order. The administrative fund is derived from prorated handler assessments. The marketing service fund of the individual order disseminates market information to producers who are not members of a qualified cooperative. It also provides for the verification of the weights, sampling, and testing of milk from these producers. The cost of these services is borne by such producers. The maximum rates for administrative assessment and for marketing services are set forth in each order and adjustments below these rates are made from time to time upon recommendations by the market administrator and upon approval of the AMS to provide reserves at about a six-month operating level. Upon termination of any order, the statute provides for distributing the proceeds from net assets pro rata to contributing handlers or producers.
The AMS reports this account in the President’s Budget because milk marketing administration staff are excepted service. Salaries, health insurance, TSP contributions and all other federal benefits are paid by the marketing order funds and as a result there are no costs to the Federal government. As a result, corresponding dollars are reported for presentation purposes only. In FY 2019, the non-Federal costs of administrating Federal milk marketing orders, including salaries and expenses, travel, and rent for office space were estimated to be $74 million. The AMS Funds for Strengthening Markets, Income and Supply (Section 32) account is used to fund the Secretary’s oversight responsibilities of Marketing Orders.
Research and Promotion Boards Research and Promotion (“checkoff”) programs are authorized by the Commodity Promotion, Research, and Information Act of 1996 and various Acts for specific commodities. Research and Promotion Board members are appointed by the Secretary. AMS is responsible for administrative oversight of Research and Promotion Programs to ensure fiscal accountability and program integrity.
SECTION II | FINANCIAL INFORMATION 137
AMS also conducts rulemaking and oversees the activities of Fruit, Vegetable, and Specialty Crop Marketing Order Commodity Boards, Councils, or Committees to ensure compliance with all legal and regulatory requirements. Marketing orders and agreements are authorized by the Agricultural Marketing Agreement Act of 1937.
These programs are not Federally funded. In FY 2019, the non-Federal costs of oversight for the Research and Promotion activities, including salaries and expenses, travel, and rent for office space were estimated to be $5.7 million. Industry boards collect and manage assessments from industry members to conduct program activities.
Foundation for Food and Agricultural Research (FFAR) The Secretary of Agriculture (Secretary) was authorized by the Agricultural Act of 2014 (Act), to establish a nonprofit corporation known as the Foundation for Food and Agriculture Research. FFAR was established by the Secretary on July 23, 2014. On the date of the enactment of this Act, the Secretary transferred $200 million of the Commodity Credit Corporation funds, to the FFAR, to remain available until expended under the conditions stipulated. On the date on which the strategic plan was submitted, the Secretary transferred $185 million of the Commodity Credit Corporation Funds, to the FFAR, to remain available until expended. The FFAR may use the funds made available to carry out the purposes of the FFAR only to the extent that the FFAR secures an equal amount of non-federal matching funds for each expenditure. None of the funds made available may be used for construction.
FFAR is governed by a Board of Directors (Board) which consists of appointed and ex-officio, nonvoting members. The ex-officio members of the Board consist of the following:
(i) The Secretary
(ii) The Under Secretary of Agriculture for Research, Education, and Economics
(iii) The Administrator of the Agricultural Research Service
(iv) The Director of the National Institute of Food and Agriculture
(v) The Director of the National Science Foundation
The ex-officio members by majority-vote appoint 15 individuals to the Board. The Board elects from among the members of the Board, an individual to serve as Chair of the Board. The Board hires an Executive Director who shall carry out such duties and responsibilities as the Board may prescribe. The Executive Director shall ensure that any funds received are held in separate accounts from funds received from nongovernmental entities.
The purposes of FFAR shall be (1) to advance the research mission of the USDA by supporting agricultural research activities focused on addressing key problems of national and international significance; and (2) to foster collaboration with agricultural researchers from the Federal Government, State (as defined in section 1404 of the National Agricultural Research, Extension, and Teaching Policy Act of 1977 (7 U.S.C. 3103)) governments, institutions of higher education (as defined in section 101 of
138 USDA AGENCY FINANCIAL REPORT | 2019
the Higher Education Act of 1965 (20 U.S.C. 1001)), industry, and nonprofit organizations. The activities of the FFAR shall be supplemental to any other activities at USDA and shall not preempt any authority or responsibility of USDA under another provision of law.
To ensure integrity in the operations of the FFAR, the Board developed and enforced procedures relating to standards of conduct, financial disclosure statements, conflicts of interest (including recusal and waiver rules), audits, and any other matters determined appropriate by the Board.
Any individual who is an officer, employee, or member of the Board is prohibited from any participation in deliberations by the FFAR of a matter that would directly or predictably affect any financial interest of—
(i) the individual;
(ii) a relative (as defined in section 109 of the Ethics in Government Act of 1978 (5 U.S.C. App.)) of that individual; or
(iii) a business organization or other entity in which the individual has an interest, including an organization or other entity with which the individual is negotiating employment.
Members of the Board may not receive compensation for service on the Board but may be reimbursed for travel, subsistence, and other necessary expenses incurred in carrying out the duties of the Board.
The FFAR provides annual audits of its financial condition to the Secretary of Agriculture and the Comptroller General of the United States for examination or audit.

SECTION II | FINANCIAL INFORMATION 139
NOTE 31: Insurance Programs The Federal Crop Insurance Program is considered a short-duration exchange transaction insurance program. The crop insurance policies insure against unexpected declines in yield and/or price due to natural causes. In crop year 2019, there were approximately 1.1 million crop insurance policies totaling approximately $109 billion insurance protection in force.
The insurance policies are structured as a contract between Approved Insurance Providers (AIP) and producers, with the FCIC providing reinsurance to AIPs. Crop insurance policies automatically renew each year, unless producers cancel them by a published annual deadline.
Under the reinsurance agreements, AIPs agree to deliver insurance products to eligible entities under certain terms and conditions. The administrative and operating subsidy (A&O) compensates the AIPs for selling and servicing crop insurance policies, including the direct settling of claims. Producers pay a portion of premium and fees to participate in the insurance program benefit payments.
FCIC and AIPs share in underwriting gains or losses. The underwriting risk for the crop insurance program is shared by FCIC and the AIPs. The AIPs generally retain approximately 80 to 85 percent of the premium, and the risk associated with the premium. FCIC provides AIPs stop-loss reinsurance for the risk associated with their retained premium.
The AIPs for Fiscal Year 2019 are as follows:
▪ Ace American Insurance Company
▪ American Agri-Business Insurance Company
▪ American Agricultural Insurance Company
▪ CGB Insurance Company
▪ Church Mutual Insurance Company
▪ Country Mutual Insurance Company
▪ Farmers Mutual Hail Insurance Company of Iowa
▪ Great American Insurance Company
▪ Guide One Insurance Company
▪ Hudson Insurance Company
▪ NAU Country Insurance Company
▪ Producers Agriculture Insurance Company
▪ Rural Community Insurance Company
▪ Stratford Insurance Company
▪ Technology Insurance Company
▪ XL Reinsurance America Inc.

140 USDA AGENCY FINANCIAL REPORT | 2019
The funds within the Federal Crop Insurance Program can be used to pay any authorized expense of the program. The following table lists the type of funds received and the resources used of the program for 2019.
Federal Crop Insurance Program Resource and Resources Used
Resource Fiscal Year 2019
(millions) Uses Fiscal Year 2019
(millions)
Producer Premiums Collected $1,246 Obligations for Delivery Costs $1,567 Producer Fees Collected $43 Obligations for Indemnities $9,315 Underwriting Loss Collected from AIPs $2 Obligations for Underwriting Gain $2,143 Appropriations $11,787 Obligations for Initiatives & Other Costs $34 Appropriations Transfers ($13) Unobligated Balance Beginning of Year $578 Unobligated Balance End of Year $584 Total $13,643 Total $13,643
In addition to the mandatory FCIC fund, RMA received $67.2 million in S&E funds to administer the Federal Crop Insurance Program in 2019. The Federal Crop Insurance Act requires the total premium, including producer paid premium and premium subsidy, to be established to achieve an overall projected loss ratio of not greater than 1.0 over an extended period of time. The FCIC Act dictates the percentage of subsidized premium. The estimation of expected indemnities is generally based on the observed historical rate of loss often referred to as the ‘loss cost’ method.
In Fiscal Year 2019 there were widespread severe flooding and excess moisture conditions in many parts of the nation, causing catastrophic damage to crops. In order to provide relief, RMA deferred collection of any unpaid producer premium without interest, by two months. The total amount of deferred collections was approximately $2.5 billion.
FCIC collects administrative fees from producers in return for catastrophic risk protection coverage and additional levels coverage. The rates are set by statute. For reinsurance year 2019, the catastrophic risk protection fees were $300 per crop per county and $30 for additional levels coverage per crop per county.
FCIC may request the Secretary of Agriculture to provide borrowing authority funds of the Commodity Credit Corporation (CCC) if at any time the amounts in the insurance fund are insufficient to allow FCIC to carry out its duties. Even though the authority exists, FCIC did not request CCC funds in the reporting period. Instead, FCIC uses such sums as are necessary from the U.S. Treasury to cover program costs that are in excess of collections.
FCIC does not have investments.

SECTION II | FINANCIAL INFORMATION 141
Use of Estimates The preparation of financial statements requires management to make estimates and assumptions that affect reported amounts of assets and liabilities and disclosure of contingent assets and liabilities at the date of the financial statements and reported amount of revenues and expenses during the reporting period. Actual results could differ from those estimates.
FCIC financial statements show estimates on the Balance Sheet and Statement of Net Cost on the following line items:
Balance Sheet
▪ Liability for Unpaid Insurance Claims,
▪ Liability for Losses on Remaining Coverage,
▪ Contingencies,
▪ Unearned Revenue, and
▪ Underwriting Gain;
Statement of Net Cost
▪ Indemnities,
▪ Program Delivery Costs,
▪ Premium Revenue,
▪ Net (Gain)/Loss on Business Ceded from AIPs, and
▪ Other Revenue.
Loss Recognition The end of the government’s fiscal year, on September 30, occurs while many crops are still in the field and subject to ongoing natural risks. This misalignment between the government’s fiscal year and the inherent business cycle of the crop insurance program results in significant uncertainty for the end-of-fiscal-year estimates of claims. Estimates can often vary by 20% or more from final results.
Estimates of claims are based on current crop conditions and historical trends for a given crop condition. Therefore, it is assumed the expected claims will be similar to levels observed historically.
The estimate model assumes that there is a relationship between crop yields, harvest prices, and the resulting loss ratios. The indemnity for an individual producer is based on the difference between the producer’s actual yield and his/her average yield. Similarly, for revenue plans, the indemnity is based on the difference between the actual harvest price and the “base” price which is the estimated harvest price at the time the crop is planted.
142 USDA AGENCY FINANCIAL REPORT | 2019
Regression analyses are calculated based on the historic relationships between the crop yields and harvest prices (when necessary) for each crop in each state and the resulting loss ratios in each of those years. The resulting regression coefficients are used in conjunction with the most recent National Agricultural Statistics Service (NASS) forecasts and commodity futures prices to calculate a projected loss ratio for each crop/state combination.
There are uncertainties associated with these assumptions including:
▪ Actual yields which may be different than those provided by the NASS estimates;
▪ Changes in weather patterns close to harvesting dates, which could affect yields but not be reflected in the NASS estimates;
▪ Commodity prices which may change from those in the market because of many factors (such as weather, yields, and economic conditions); and
▪ Significant catastrophic weather events (i.e. hurricanes and freezes) occurring near the balance sheet date which could affect estimated crop yields and crop prices.
There are uncertainties associated with assumptions used to estimate losses on insurance claims. As a result, the ultimate liability may differ significantly from the recorded estimate. Indemnity costs are paid from premium proceeds, including producer paid premium and premium subsidies. If indemnity costs exceed funds available, additional funds will be requested and apportioned to FCIC.
Revenue and Liabilities Recorded SFFAS 51 promulgates the recognition and measurement of:
1. Revenue and Liability for Unearned Premiums;
2. Liability for Unpaid Insurance Claims; and
3. Liability for Losses on Remaining Coverage
Revenue and Liability for Unearned Premiums Premium revenue is comprised of producer paid premium. Producer paid premium is recognized as earned proportionately over each crop’s growing season. The portion of producer paid premium not recognized at the conclusion of the fiscal year is classified as Unearned Revenue in the balance sheet.
Liability for Unpaid Insurance Claims Liability for Unpaid Insurance Claims are claims for adverse events that occurred before the end of the reporting period. Per SFFAS 51, for the claim to be considered incurred, a single event or a series of events must be completed by the end of the reporting period to be considered an adverse event of the period.

SECTION II | FINANCIAL INFORMATION 143
The Liability for Unpaid Insurance Claims is comprised of the following:
▪ Funds in the Escrow accounts to cover payments to producers who have not cashed their indemnity payments
▪ Claims reported but not paid as of the end of the reporting period
▪ Incurred but Not Reported (IBNR) is estimated claims from events that have occurred as of the end of the reporting period but have not yet been reported for settlement.
FCIC uses a historical trend analysis based upon the data from the prior years to determine the value of claims incurred for the current reinsurance year as of the financial statement reporting date.
Liability for Losses on Remaining Coverage The liability for losses on remaining coverage as of the end of the reporting period represents the estimated amounts to be paid to settle claims for the remaining open arrangement period in excess of losses associated with the related unearned premiums as of the end of the reporting period.
The liability for losses on remaining coverage is the total projected losses less actual losses reported, IBNR, and losses associated with unearned premium.
Underwriting Gain/Loss Underwriting gain/loss is the AIPs portion of earnings or losses on the insurance book of business due from or to FCIC. A periodic settlement, as stipulated in the SRA, is calculated where results of business written by AIPs are determined and an experience-rated gain or loss on business ceded from AIPs is computed. Payments due to AIPs for a net gain are paid in the second fiscal year following the reinsurance year. Underwriting losses are paid to FCIC periodically.
Contingencies Various lawsuits, claims, and proceedings are pending against FCIC. In accordance with SFFAS No. 5, FCIC records accruals for such contingencies when it is probable that a liability will be incurred, and the amount of the loss can be reasonably estimated.
If there is a reasonable possibility that a loss will occur, FCIC discloses the nature of the contingency and an estimate of the possible liability, an estimate of the range of the possible liability, or a statement that such an estimate cannot be made.
144 USDA AGENCY FINANCIAL REPORT | 2019
NOTE 32: Reclassification of Balance Sheet, Statement of Net Cost, and Statement of Changes in Net Position For FR Compilation Process To prepare the Financial Report of the U.S. Government (FR), the Department of the Treasury requires agencies to submit an adjusted trial balance, which is a listing of amounts by U.S. Standard General Ledger account that appear in the financial statements. Treasury uses the trial balance information reported in the Governmentwide Treasury Account Symbol Adjusted Trial Balance System (GTAS) to develop a Reclassified Balance Sheet, Reclassified Statement of Net Cost, and a Reclassified Statement of Changes in Net Position for each agency, which are accessed using GTAS.
Treasury eliminates all intragovernmental balances from the reclassified statements and aggregates lines with the same title to develop the FR statements. This note shows the USDA’s financial statements and the USDA’s reclassified statements prior to elimination of intragovernmental balances and prior to aggregation of repeated FR line items.
A copy of the 2018 FR can be found here: https://www.fiscal.treasury.gov/reports-statements/ and a copy of the 2019 FR will be posted to this site as soon as it is released.
The term “non-Federal” is used in this note to refer to Federal Government amounts that result from transactions with non-Federal entities. These include transactions with individuals, businesses, non-profit entities, and State, local, and foreign governments.
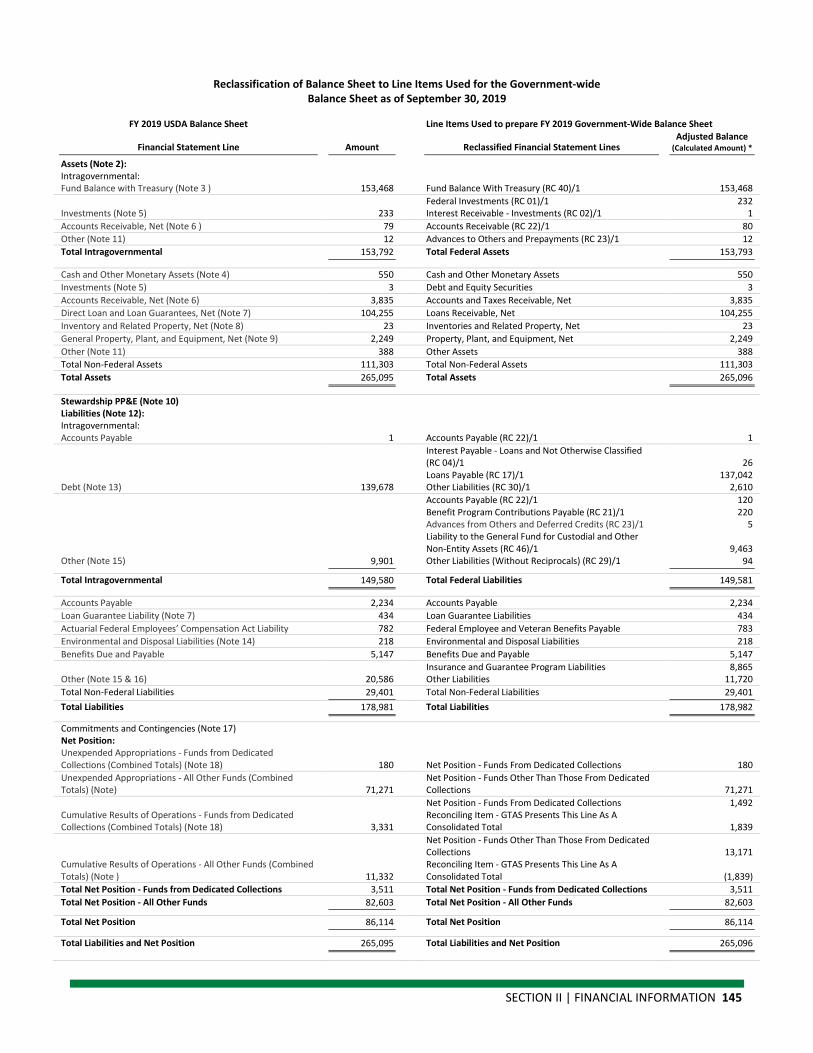
SECTION II | FINANCIAL INFORMATION 145
Reclassification of Balance Sheet to Line Items Used for the Government-wide Balance Sheet as of September 30, 2019
FY 2019 USDA Balance Sheet Line Items Used to prepare FY 2019 Government-Wide Balance Sheet
Financial Statement Line Amount Reclassified Financial Statement Lines Adjusted Balance
(Calculated Amount) *
Assets (Note 2): Intragovernmental: Fund Balance with Treasury (Note 3 ) 153,468 Fund Balance With Treasury (RC 40)/1 153,468 Federal Investments (RC 01)/1 232 Investments (Note 5) 233 Interest Receivable - Investments (RC 02)/1 1 Accounts Receivable, Net (Note 6 ) 79 Accounts Receivable (RC 22)/1 80 Other (Note 11) 12 Advances to Others and Prepayments (RC 23)/1 12 Total Intragovernmental 153,792 Total Federal Assets 153,793
Cash and Other Monetary Assets (Note 4) 550 Cash and Other Monetary Assets 550 Investments (Note 5) 3 Debt and Equity Securities 3 Accounts Receivable, Net (Note 6) 3,835 Accounts and Taxes Receivable, Net 3,835 Direct Loan and Loan Guarantees, Net (Note 7) 104,255 Loans Receivable, Net 104,255 Inventory and Related Property, Net (Note 8) 23 Inventories and Related Property, Net 23 General Property, Plant, and Equipment, Net (Note 9) 2,249 Property, Plant, and Equipment, Net 2,249 Other (Note 11) 388 Other Assets 388 Total Non-Federal Assets 111,303 Total Non-Federal Assets 111,303 Total Assets 265,095 Total Assets 265,096
Stewardship PP&E (Note 10) Liabilities (Note 12): Intragovernmental: Accounts Payable 1 Accounts Payable (RC 22)/1 1 Interest Payable - Loans and Not Otherwise Classified
(RC 04)/1 26 Loans Payable (RC 17)/1 137,042 Debt (Note 13) 139,678 Other Liabilities (RC 30)/1 2,610 Accounts Payable (RC 22)/1 120 Benefit Program Contributions Payable (RC 21)/1 220 Advances from Others and Deferred Credits (RC 23)/1 5 Liability to the General Fund for Custodial and Other
Non-Entity Assets (RC 46)/1 9,463 Other (Note 15) 9,901 Other Liabilities (Without Reciprocals) (RC 29)/1 94
Total Intragovernmental 149,580 Total Federal Liabilities 149,581
Accounts Payable 2,234 Accounts Payable 2,234 Loan Guarantee Liability (Note 7) 434 Loan Guarantee Liabilities 434 Actuarial Federal Employees’ Compensation Act Liability 782 Federal Employee and Veteran Benefits Payable 783 Environmental and Disposal Liabilities (Note 14) 218 Environmental and Disposal Liabilities 218 Benefits Due and Payable 5,147 Benefits Due and Payable 5,147 Insurance and Guarantee Program Liabilities 8,865 Other (Note 15 & 16) 20,586 Other Liabilities 11,720 Total Non-Federal Liabilities 29,401 Total Non-Federal Liabilities 29,401 Total Liabilities 178,981 Total Liabilities 178,982
Commitments and Contingencies (Note 17) Net Position: Unexpended Appropriations - Funds from Dedicated Collections (Combined Totals) (Note 18) 180 Net Position - Funds From Dedicated Collections 180 Unexpended Appropriations - All Other Funds (Combined Totals) (Note) 71,271
Net Position - Funds Other Than Those From Dedicated Collections 71,271
Net Position - Funds From Dedicated Collections 1,492 Cumulative Results of Operations - Funds from Dedicated Collections (Combined Totals) (Note 18) 3,331
Reconciling Item - GTAS Presents This Line As A Consolidated Total 1,839
Net Position - Funds Other Than Those From Dedicated Collections 13,171
Cumulative Results of Operations - All Other Funds (Combined Totals) (Note ) 11,332
Reconciling Item - GTAS Presents This Line As A Consolidated Total (1,839)
Total Net Position - Funds from Dedicated Collections 3,511 Total Net Position - Funds from Dedicated Collections 3,511 Total Net Position - All Other Funds 82,603 Total Net Position - All Other Funds 82,603
Total Net Position 86,114 Total Net Position 86,114
Total Liabilities and Net Position 265,095 Total Liabilities and Net Position 265,096

146 USDA AGENCY FINANCIAL REPORT | 2019
Reclassification of Statement of Net Cost to Line Items Used for the Government-wide Statement of Net Cost for the Year Ending September 30, 2019
FY 2019 USDA SNC Line Items Used to prepare FY 2019 Government-Wide SNC
Financial Statement Line Amount Reclassified Financial Statement Lines Adjusted Balance
(Calculated Amount) *
Gross Cost Non-Federal Gross Cost 145,672 Federal Gross Cost Benefit program costs (RC 26)/2 1,727 Imputed Costs (RC25)/2 1,020 Buy/Sell Cost (RC24)/2 1,201 Borrowing and other interest expense (RC05)/2 4,118 Other expenses (without reciprocals) (RC 29) 483 Total Federal Gross Cost 8,549 Total Gross Cost 154,221 Department Total Gross Cost 154,221
Earned Revenue Non-federal earned revenue 8,326 Buy/Sell Revenue (exchange) (RC24)/2 575 Federal securities interest revenue including associated gains
and losses (exchange) (RC 03)/2 7 Borrowing and other interest revenue (exchange) (RC 05)/2 583 Accrual of Custodial Collections Yet to be Transferred to a TAS
Other Than the General Fund of the U.S. Government - Exchange (RC 14) (20)
Collections Transferred in to a TAS Other Than the General Fund of the U.S. Government - Exchange (RC 13) 102
Total Federal Earned Revenue 1,247 Less: Total Earned Revenue 9,574 Department Total Earned Revenue 9,573
Net Cost of Operations (Note 19) 144,647 Net Cost of Operations 144,648
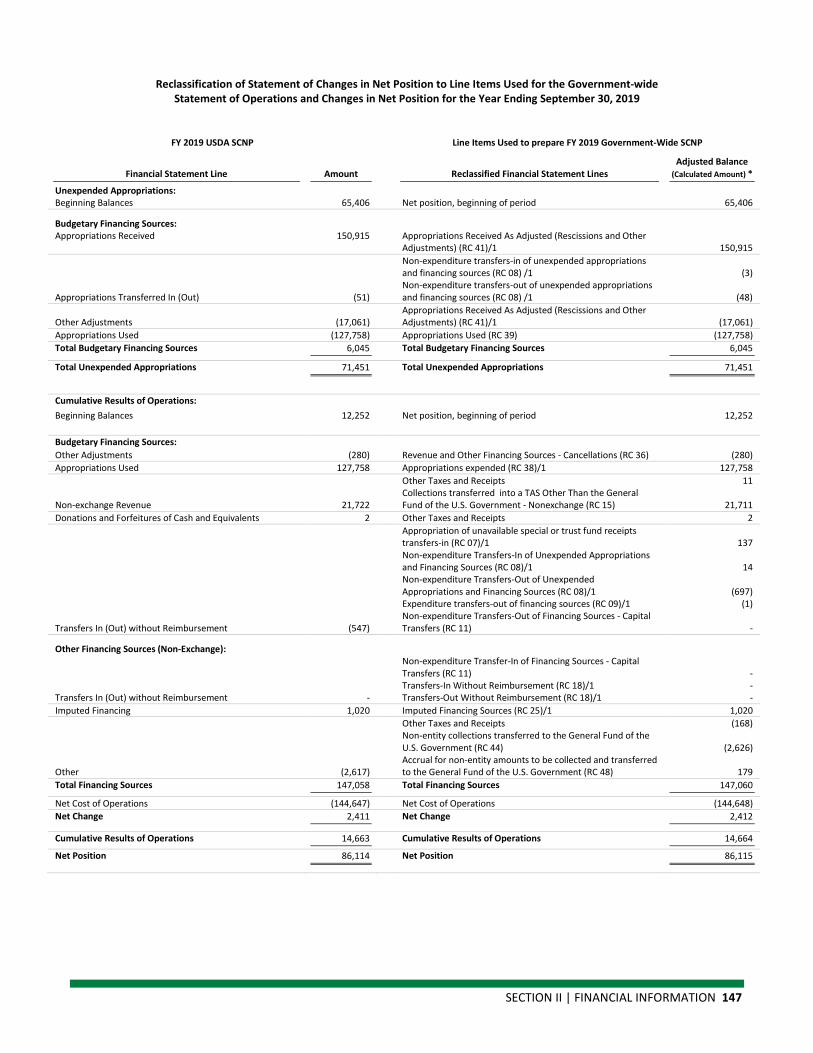
SECTION II | FINANCIAL INFORMATION 147
Reclassification of Statement of Changes in Net Position to Line Items Used for the Government-wide Statement of Operations and Changes in Net Position for the Year Ending September 30, 2019
FY 2019 USDA SCNP Line Items Used to prepare FY 2019 Government-Wide SCNP
Financial Statement Line Amount Reclassified Financial Statement Lines Adjusted Balance
(Calculated Amount) * Unexpended Appropriations: Beginning Balances 65,406 Net position, beginning of period 65,406
Budgetary Financing Sources: Appropriations Received 150,915 Appropriations Received As Adjusted (Rescissions and Other
Adjustments) (RC 41)/1 150,915 Non-expenditure transfers-in of unexpended appropriations
and financing sources (RC 08) /1 (3)
Appropriations Transferred In (Out) (51) Non-expenditure transfers-out of unexpended appropriations and financing sources (RC 08) /1 (48)
Other Adjustments (17,061) Appropriations Received As Adjusted (Rescissions and Other Adjustments) (RC 41)/1 (17,061)
Appropriations Used (127,758) Appropriations Used (RC 39) (127,758) Total Budgetary Financing Sources 6,045 Total Budgetary Financing Sources 6,045
Total Unexpended Appropriations 71,451 Total Unexpended Appropriations 71,451
Cumulative Results of Operations: Beginning Balances 12,252 Net position, beginning of period 12,252
Budgetary Financing Sources: Other Adjustments (280) Revenue and Other Financing Sources - Cancellations (RC 36) (280) Appropriations Used 127,758 Appropriations expended (RC 38)/1 127,758 Other Taxes and Receipts 11
Non-exchange Revenue 21,722 Collections transferred into a TAS Other Than the General Fund of the U.S. Government - Nonexchange (RC 15) 21,711
Donations and Forfeitures of Cash and Equivalents 2 Other Taxes and Receipts 2 Appropriation of unavailable special or trust fund receipts
transfers-in (RC 07)/1 137 Non-expenditure Transfers-In of Unexpended Appropriations
and Financing Sources (RC 08)/1 14 Non-expenditure Transfers-Out of Unexpended
Appropriations and Financing Sources (RC 08)/1 (697) Expenditure transfers-out of financing sources (RC 09)/1 (1)
Transfers In (Out) without Reimbursement (547) Non-expenditure Transfers-Out of Financing Sources - Capital Transfers (RC 11) -
Other Financing Sources (Non-Exchange):
Non-expenditure Transfer-In of Financing Sources - Capital Transfers (RC 11) -
Transfers-In Without Reimbursement (RC 18)/1 - Transfers In (Out) without Reimbursement - Transfers-Out Without Reimbursement (RC 18)/1 - Imputed Financing 1,020 Imputed Financing Sources (RC 25)/1 1,020 Other Taxes and Receipts (168) Non-entity collections transferred to the General Fund of the
U.S. Government (RC 44) (2,626)
Other (2,617) Accrual for non-entity amounts to be collected and transferred to the General Fund of the U.S. Government (RC 48) 179
Total Financing Sources 147,058 Total Financing Sources 147,060
Net Cost of Operations (144,647) Net Cost of Operations (144,648) Net Change 2,411 Net Change 2,412
Cumulative Results of Operations 14,663 Cumulative Results of Operations 14,664
Net Position 86,114 Net Position 86,115
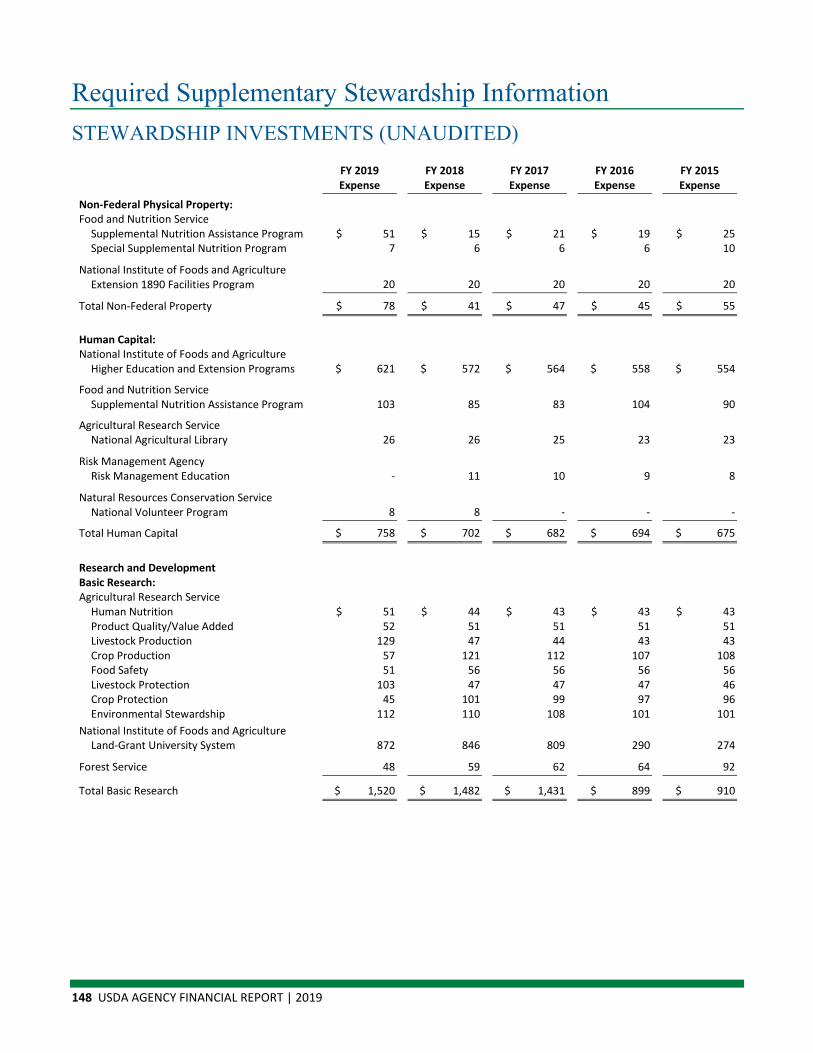
148 USDA AGENCY FINANCIAL REPORT | 2019
Required Supplementary Stewardship Information STEWARDSHIP INVESTMENTS (UNAUDITED)
Item FY 2019 Expense
FY 2018 Expense
FY 2017 Expense
FY 2016 Expense
FY 2015 Expense
Non-Federal Physical Property: Food and Nutrition Service
Supplemental Nutrition Assistance Program $ 51 $ 15 $ 21 $ 19 $ 25 Special Supplemental Nutrition Program 7 6 6 6 10
National Institute of Foods and Agriculture Extension 1890 Facilities Program 20 20 20 20 20
Total Non-Federal Property $ 78 $ 41 $ 47 $ 45 $ 55
Human Capital: National Institute of Foods and Agriculture
Higher Education and Extension Programs $ 621 $ 572 $ 564 $ 558 $ 554
Food and Nutrition Service Supplemental Nutrition Assistance Program 103 85 83 104 90
Agricultural Research Service National Agricultural Library 26 26 25 23 23
Risk Management Agency Risk Management Education - 11 10 9 8
Natural Resources Conservation Service National Volunteer Program 8 8 - - -
Total Human Capital $ 758 $ 702 $ 682 $ 694 $ 675
Research and Development Basic Research: Agricultural Research Service
Human Nutrition $ 51 $ 44 $ 43 $ 43 $ 43 Product Quality/Value Added 52 51 51 51 51 Livestock Production 129 47 44 43 43 Crop Production 57 121 112 107 108 Food Safety 51 56 56 56 56 Livestock Protection 103 47 47 47 46 Crop Protection 45 101 99 97 96 Environmental Stewardship 112 110 108 101 101
National Institute of Foods and Agriculture Land-Grant University System 872 846 809 290 274
Forest Service 48 59 62 64 92
Total Basic Research $ 1,520 $ 1,482 $ 1,431 $ 899 $ 910
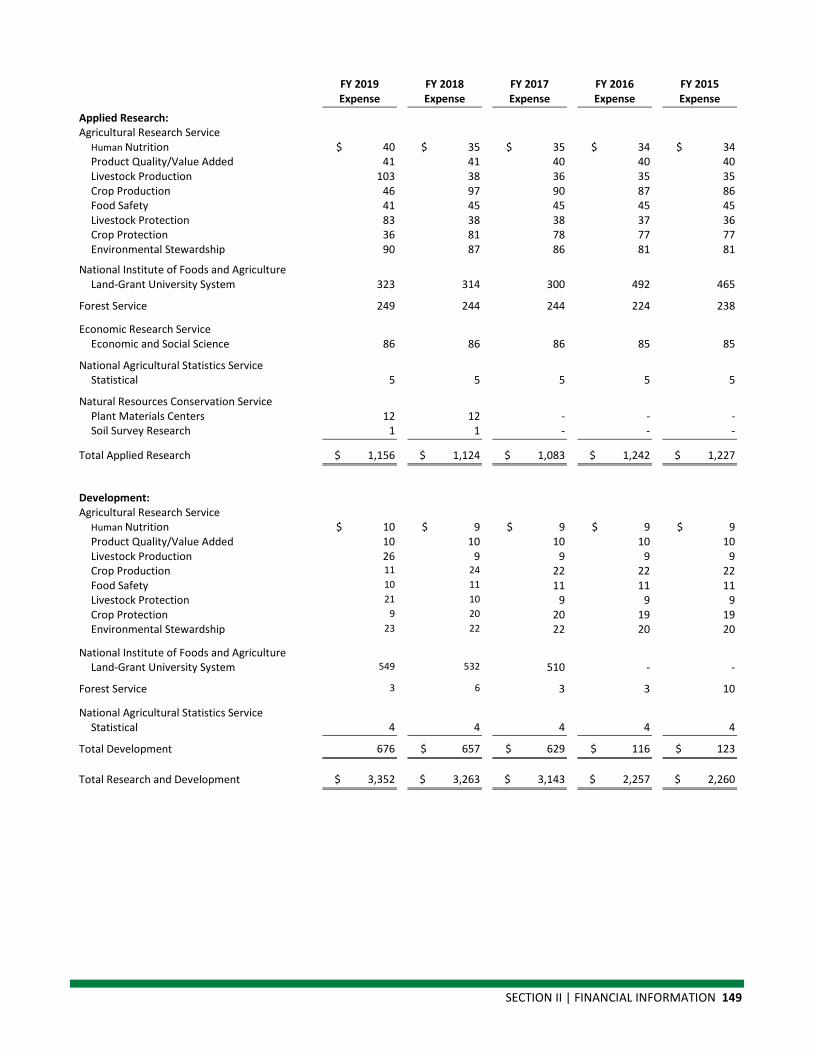
SECTION II | FINANCIAL INFORMATION 149
Item FY 2019 Expense
FY 2018 Expense
FY 2017 Expense
FY 2016 Expense
FY 2015 Expense
Applied Research: Agricultural Research Service
Human Nutrition $ 40 $ 35 $ 35 $ 34 $ 34 Product Quality/Value Added 41 41 40 40 40 Livestock Production 103 38 36 35 35 Crop Production 46 97 90 87 86 Food Safety 41 45 45 45 45 Livestock Protection 83 38 38 37 36 Crop Protection 36 81 78 77 77 Environmental Stewardship 90 87 86 81 81
National Institute of Foods and Agriculture Land-Grant University System 323 314 300 492 465
Forest Service 249 244 244 224 238
Economic Research Service Economic and Social Science 86 86 86 85 85
National Agricultural Statistics Service Statistical 5 5 5 5 5
Natural Resources Conservation Service Plant Materials Centers 12 12 - - - Soil Survey Research 1 1 - - -
Total Applied Research $ 1,156 $ 1,124 $ 1,083 $ 1,242 $ 1,227
Development: Agricultural Research Service
Human Nutrition $ 10 $ 9 $ 9 $ 9 $ 9 Product Quality/Value Added 10 10 10 10 10 Livestock Production 26 9 9 9 9 Crop Production 11 24 22 22 22 Food Safety 10 11 11 11 11 Livestock Protection 21 10 9 9 9 Crop Protection 9 20 20 19 19 Environmental Stewardship 23 22 22 20 20
National Institute of Foods and Agriculture Land-Grant University System 549 532 510 - -
Forest Service 3 6 3 3 10
National Agricultural Statistics Service Statistical 4 4 4 4 4
Total Development 676 $ 657 $ 629 $ 116 $ 123
Total Research and Development $ 3,352 $ 3,263 $ 3,143 $ 2,257 $ 2,260

150 USDA AGENCY FINANCIAL REPORT | 2019
NON-FEDERAL PHYSICAL PROPERTY
Food and Nutrition Service (FNS) FNS’ non-Federal physical property consists of computer systems and other equipment obtained by State and local governments for the purpose of administering the SNAP. The total SNAP expense for ADP Equipment & Systems has been reported as of the third quarter of FNS’ financial statements. FNS’ non-Federal physical property also consists of computer systems and other equipment obtained by the State and local governments for the purpose of administering the Special Supplemental Nutrition Program for Women, Infants, and Children.
National Institute of Food and Agriculture (NIFA) The Extension 1890 facilities program supports the renovation of existing buildings and the construction of new facilities as well as computers and equipment purchases that permit faculty, students, and communities to benefit fully from the partnership between USDA and the 1890 Land-Grant Universities.
HUMAN CAPITAL
National Institute of Food and Agriculture The higher education programs include graduate fellowship grants, competitive challenge grants, secondary/2-year postsecondary grants, Hispanic serving institutions education grants, a multicultural scholars program, a Native American institutions program, a Native American institutions endowment fund, an Alaska Native serving and a Native Hawaiian serving institutions program, grants for insular areas, and a capacity building program at the 1890 institutions. These programs enable universities to broaden their curricula, increase faculty development and student research projects, and increase the number of new scholars recruited in the food and agriculture sciences. NIFA also supports extension-related work at 1862, 1994 and 1890 land-grant institutions throughout the country through formula-based or competitive programs.
Food and Nutrition Service FNS’ human capital consists of employment and training (E&T) for SNAP. The E&T program requires recipients of SNAP benefits to participate in an employment and training program as a condition to SNAP eligibility.
Outcome data for the E&T program is only available through the third quarter. As of this period, FNS’ E&T program has placed 130,714 work registrants subject to the 3 month SNAP participant limit and 789,709 work registrants not subject to the limit in either job-search, job training, job-workfare, education, or work experience.
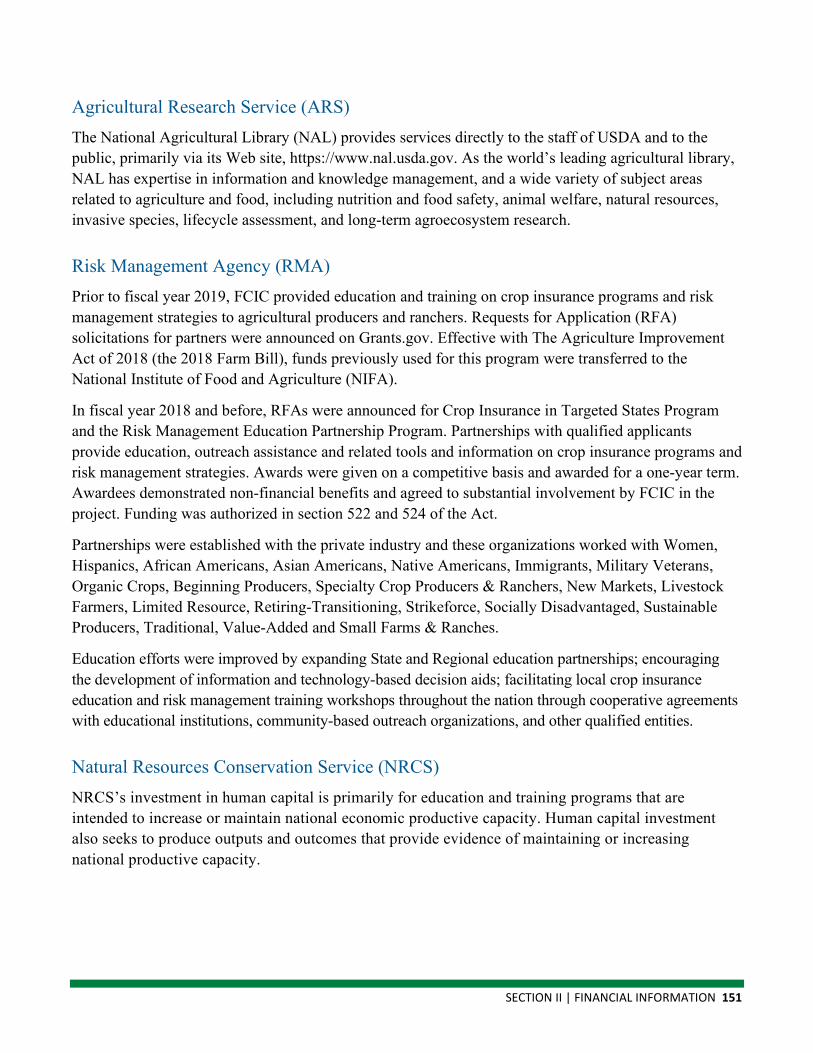
SECTION II | FINANCIAL INFORMATION 151
Agricultural Research Service (ARS) The National Agricultural Library (NAL) provides services directly to the staff of USDA and to the public, primarily via its Web site, https://www.nal.usda.gov. As the world’s leading agricultural library, NAL has expertise in information and knowledge management, and a wide variety of subject areas related to agriculture and food, including nutrition and food safety, animal welfare, natural resources, invasive species, lifecycle assessment, and long-term agroecosystem research.
Risk Management Agency (RMA) Prior to fiscal year 2019, FCIC provided education and training on crop insurance programs and risk management strategies to agricultural producers and ranchers. Requests for Application (RFA) solicitations for partners were announced on Grants.gov. Effective with The Agriculture Improvement Act of 2018 (the 2018 Farm Bill), funds previously used for this program were transferred to the National Institute of Food and Agriculture (NIFA).
In fiscal year 2018 and before, RFAs were announced for Crop Insurance in Targeted States Program and the Risk Management Education Partnership Program. Partnerships with qualified applicants provide education, outreach assistance and related tools and information on crop insurance programs and risk management strategies. Awards were given on a competitive basis and awarded for a one-year term. Awardees demonstrated non-financial benefits and agreed to substantial involvement by FCIC in the project. Funding was authorized in section 522 and 524 of the Act.
Partnerships were established with the private industry and these organizations worked with Women, Hispanics, African Americans, Asian Americans, Native Americans, Immigrants, Military Veterans, Organic Crops, Beginning Producers, Specialty Crop Producers & Ranchers, New Markets, Livestock Farmers, Limited Resource, Retiring-Transitioning, Strikeforce, Socially Disadvantaged, Sustainable Producers, Traditional, Value-Added and Small Farms & Ranches.
Education efforts were improved by expanding State and Regional education partnerships; encouraging the development of information and technology-based decision aids; facilitating local crop insurance education and risk management training workshops throughout the nation through cooperative agreements with educational institutions, community-based outreach organizations, and other qualified entities.
Natural Resources Conservation Service (NRCS) NRCS’s investment in human capital is primarily for education and training programs that are intended to increase or maintain national economic productive capacity. Human capital investment also seeks to produce outputs and outcomes that provide evidence of maintaining or increasing national productive capacity.
152 USDA AGENCY FINANCIAL REPORT | 2019
RESEARCH AND DEVELOPMENT
Agricultural Research Service (ARS) ARS’ mission is to conduct research to develop and transfer solutions to agricultural problems of high national priority and provide information access and dissemination to: ensure high quality, safe food, and other agricultural products; assess the nutritional needs of Americans; sustain a competitive agricultural economy; enhance the natural resource base and the environment; and provide economic opportunities for rural citizens, communities, and society as a whole.
New Products/Product Quality/Value Added
ARS has active research programs directed toward: improving the efficiency and reducing the cost for the conversion of agricultural products into biobased products and biofuels; developing new and improved products for domestic and foreign markets; and providing higher quality, healthy foods that satisfy consumer needs in the United States and abroad.
Livestock Production
ARS’ research program is directed toward fostering an abundant, safe, nutritionally wholesome, and competitively priced supply of animal products produced in a viable, competitive, and sustainable animal agriculture sector of the U.S. economy by: safeguarding and utilizing animal genetic resources, associated genetic and genomic databases, and bioinformatic tools; developing a basic understanding of food animal physiology to address priority issues related to animal production, animal well-being, and product quality and healthfulness; and developing information, best management practices, novel and innovative tools, and technologies that improve animal production systems, enhance human health, and ensure domestic food security. The research is heavily focused on the development and application of genomics technologies to increase the efficiency and product quality of beef, dairy, swine, poultry, aquaculture, and sheep systems. Areas of emphasis include increasing the efficiency of nutrient utilization, increasing animal well-being and reducing stress in production systems, increasing reproductive rates and breeding animal longevity, developing and evaluating non-traditional production systems (e.g., organic and natural), and evaluating and conserving animal genetic resources.
Crop Production
ARS’ program focuses on developing and improving ways to reduce crop losses while protecting and ensuring a safe and affordable food supply. The program concentrates on production strategies that are environmentally friendly, safe to consumers, and compatible with sustainable and profitable crop production systems. Research activities are directed at safeguarding and utilizing plant genetic resources and their associated genetic, genomic, and bioinformatic databases that facilitate selection of varieties and/or germplasm with significantly improved traits. Research activities attempt to minimize the impacts of crop pests while maintaining healthy crops and safe commodities that can be sold in markets throughout the world. The agency is conducting research to discover and exploit naturally occurring and engineered
SECTION II | FINANCIAL INFORMATION 153
genetic mechanisms for plant pest control, develop agronomic germplasm with durable defensive traits, and transfer genetic resources for commercial use. ARS is also providing taxonomic information on invasive species that strengthens prevention techniques, aids in detection/identification of invasive pests, and increases control through management tactics that restore habitats and biological diversity.
Food Safety
ARS’ research program is designed to yield science-based knowledge on the safe production, storage, processing, and handling of plant and animal products, and on the detection and control of pathogenic bacteria and fungi, parasites, chemical contaminants, and plant toxins. All of ARS’ research activities involve a high degree of cooperation and collaboration with USDA’s Research, Education, and Economics agencies, as well as with the Food Safety and Inspection Service (FSIS), Animal and Plant Health Inspection Service (APHIS), the Food and Drug Administration (FDA), the Centers for Disease Control and Prevention (CDC), the Department of Homeland Security (DHS), and the Environmental Protection Agency (EPA). The agency also collaborates in international research programs to address and resolve global food safety issues. Specific research efforts are directed toward developing new technologies that assist ARS stakeholders and customers, including regulatory agencies, industry, and commodity and consumer organizations in detecting, identifying, and controlling foodborne diseases that affect human health.
Livestock Protection
ARS’ program is directed at protecting and ensuring the safety of the Nation’s agriculture and food supply through improved disease detection, prevention, control, and treatment. Basic and applied research approaches are used to solve animal health problems of high national priority. Emphasis is given to methods and procedures to control animal diseases through the discovery and development of diagnostics, vaccines, biotherapeutics, animal genomics applications, disease management systems, animal disease models, and farm biosecurity measures. The research program has the following strategic objectives: establish ARS laboratories into a fluid, highly effective research network to maximize use of core competencies and resources; use specialized high containment facilities to study zoonotic and emerging diseases; develop an integrated animal and microbial genomics research program; establish core competencies in bovine, swine, ovine, and avian immunology; launch a biotherapeutic discovery program providing alternatives to animal drugs; build a technology driven vaccine and diagnostic discovery research program; develop core competencies in field epidemiology and predictive biology; establish a best-in-class training center for our Nation’s veterinarians and scientists; and develop a model technology transfer program to achieve the full impact of ARS research discoveries. The ARS animal research program includes the following core components: biodefense research, animal genomics and immunology, zoonotic diseases, respiratory diseases, reproductive and neonatal diseases, enteric diseases, parasitic diseases, and transmissible spongiform encephalopathies.
154 USDA AGENCY FINANCIAL REPORT | 2019
Crop Protection
ARS’ Crop Protection research program is directed to protect crops from insect and disease loss through research to understand pest and disease transmission mechanisms, and to identify and apply new technologies that increase our understanding of virulence factors and host defense mechanisms. The program’s research priorities include: identification of genes that convey virulence traits in pathogens and pests; factors that modulate infectivity, gene functions, and mechanisms; genetic profiles that provide specified levels of disease and insect resistance under field conditions; and mechanisms that reduce the spread of pests and infectious diseases. ARS is developing new knowledge and integrated pest management approaches to control pest and disease outbreaks as they occur. Its research will improve the knowledge and understanding of the ecology, physiology, epidemiology, and molecular biology of emerging diseases and pests. This knowledge will be incorporated into pest risk assessments and management strategies to minimize chemical inputs and increase production. Strategies and approaches will be available to producers to control emerging crop diseases and pest outbreaks and to address quarantine issues.
Human Nutrition
Maintenance of health throughout the lifespan along with prevention of obesity and chronic diseases via food-based recommendations are the major emphases of ARS’ Human Nutrition Research Program. These health-related goals are based on the knowledge that deficiency diseases are no longer the primary public health concerns in the United States; excessive consumption has become the primary nutrition problem in the American population. This is reflected by increased emphasis on prevention of obesity, from basic science through intervention studies to assessments of large populations. The agency’s research program also studies essential nutrients and nonessential, health promoting components in foods. To better define the role of nutrition in pregnancy and growth of children, and for healthier aging, four specific areas of research are emphasized: nutrition monitoring; the scientific basis for dietary recommendations; prevention of obesity and related diseases; and life stage nutrition and metabolism.
Environmental Stewardship
ARS’ research program emphasis is in developing technologies and systems that support sustainable production and enhance the Nation’s vast renewable natural resource base. The agency is currently developing the scientific knowledge and technologies needed to meet the challenges and opportunities facing U.S. agriculture in managing water resource quality and quantity under different climatic regimes, production systems, and environmental conditions.
ARS’ research also focuses on developing measurement, prediction, and control technologies for emissions of greenhouse gases, particulate matter, ammonia, hydrogen sulfide, and volatile organic compounds affecting air quality and land-surface climate interactions. The agency is a leader in developing measurement and modeling techniques for characterizing gaseous and particulate matter emissions from agriculture. In addition, ARS is evaluating strategies for enhancing the health and productivity of soils, including developing predictive tools to assess the sustainability of alternative land

SECTION II | FINANCIAL INFORMATION 155
management practices. Finding mechanisms to aid agriculture in adapting to changes in atmospheric composition and climatic variations is also an important component of this program.
ARS’ range and grazing land research objectives include the conservation and restoration of the Nation’s range land and pasture ecosystems and agroecosystems through improved management of fire, invasive weeds, grazing, global change, and other agents of ecological change. The agency is currently developing improved grass and forage legume germplasm for livestock, conservation, bioenergy, and bioproduct systems as well as grazing-based livestock systems that reduce risk and increase profitability. In addition, ARS is developing whole system management strategies to reduce production costs and risks.
National Agricultural Library
The library provides services directly to the staff of USDA and to the public, primarily via the NAL Web site. NAL is the premier library for collecting, managing, and disseminating agriculture information. It delivered about 43.7 million page views to 6.9 million customers in FY 2019.
Buildings and Facilities
As the principal intramural scientific research agency of the Department of Agriculture, ARS operates an extensive network of more than 100 federally owned research facilities. These facilities are strategically located throughout the U.S., reflective of the wide geographic diversity and site specificity of agricultural production; distinct climatic and agroecosystem zones; and the numerous research partners, cooperators, and customers/users with which ARS works. These specialized laboratories and facilities are essential for ARS’ scientists and support personnel to carry out the agency’s mission.
National Institute of Food and Agriculture (NIFA) NIFA participates in a nationwide land-grant university system of agriculture related research and program planning and coordination between State institutions and USDA. It assists in maintaining cooperation among the State institutions, and between the State institutions and their Federal research partners. NIFA administers competitive grants and capacity/formula payments to State institutions to leverage State and local funding for agriculture research.
Forest Service (FS) Forest Service Research & Development (R&D) has an integrated science portfolio that supports achievement of the agency’s strategic goals. The contributions of FS R&D enhance the rigor and impact of the work done throughout the agency. The FS R&D structure has two components: Priority Research Areas and Strategic Program Areas (SPAs).
The Priority Research Areas address urgent needs in seven areas: Forest Disturbances, Forest Inventory and Analysis, Watershed Management and Restoration, Bioenergy and Biobased Products, Urban Natural Resources Stewardship, Nanotechnology, and Localized Needs Research.
156 USDA AGENCY FINANCIAL REPORT | 2019
The SPAs are the long-term programs from which Priority Research Areas are funded. Each of the seven SPAs are described below.
Wildland Fire and Fuels
Wildland Fire and Fuels R&D provides managers with the knowledge and tools to reduce negative impacts and to enhance the beneficial effects of wildland fire, as a natural process. This knowledge and these tools are critical to understanding the human process of fire and fuels management on society and the environment.
Research focuses on understanding and modeling fundamental fire processes; interactions of fire with ecosystems; and the environmental, social, and economic aspects of fire, as well as evaluating the integrated management strategies and disturbance interactions at multiple scales and the application of fire research to address management problems.
Invasive Species
Invasive Species R&D provides the scientific information, methods, and technology to reduce or eliminate the introduction, spread, and impact of invasive species and to restore or improve the functionality of ecosystems affected by invasive species.
Research focuses on non-native plants, pathogens, animals, fish, insects, diseases, invertebrates, and other species whose introduction is likely to cause economic or environmental harm to an ecosystem.
Water, Air, and Soil
Water, Air, and Soil R&D enables the sustainable management of these essential resources by providing science to inform management efforts to provide clear air and safe drinking water, to protect lives and property from wildland fire and smoke, and to adapt to climate variability and change.
The program addresses ecosystem services with a high level of integration between water, air, and soil research, such as the effects of climate variability and change on water budgets or carbon sequestration metrics from an ecosystem perspective.
Wildlife and Fish
Wildlife and Fish R&D relies upon interdisciplinary research to inform policy initiatives affecting wildlife and fish habitat on private and public lands, and the recovery of threatened or endangered species.
Scientists investigate the complex interactions among species, ecosystem dynamics and processes, land use and management, and any emerging broad scale threats to fish and wildlife viability, including global climate change, loss of open space, invasive species, and disease.
SECTION II | FINANCIAL INFORMATION 157
Resource Management and Use
Resource Management and Use R&D provides the science and technology base to sustainably manage and use forest resources and forest fiber-based products.
Research focuses on the plant sciences, soil sciences, social sciences, silviculture, productivity, forest and range ecology management, harvesting and operations, forest and biomass products and utilization, economics, urban forestry, and climate change.
Outdoor Recreation
Outdoor Recreation R&D promotes human and ecological sustainability by researching environmental management, activities, and experiences that connect people with the natural world.
Research in outdoor recreation is interdisciplinary, focusing on nature-based recreation and the changing trends in American society; connections between recreation visitors, communities, and the environment; human benefits and consequences of recreation and nature contact; the effectiveness of recreation management and decision-making; and sustaining ecosystems affected by recreational use.
Inventory and Monitoring
Inventory and Monitoring R&D provides the resource data, analysis, and tools that monitor vulnerable forest ecosystems for rapid change resulting from threats, including fire, insects, disease, natural processes, or management actions. From their research, scientists determine the status and trend of the health of the Nation’s forests and grasslands, and the potential impact from ongoing and anticipated environmental stressors.
Their research integrates the development and use of science, technology, and remotely sensed data to better understand the incidences of forest fragmentation over time from changes in land use or from insects, disease, fire, and extreme weather events.
A representative summary of FY 2019 accomplishments include the following:
▪ 48 new interagency agreements and contracts
▪ 20 interagency agreements and contracts continued
▪ 1,184 articles published in journals
▪ 735 articles published in all other publications
▪ 3 patents granted
▪ 2 patent licenses executed
Economic Research Service (ERS) ERS provides economic and other social science research and analysis for public and private decisions on agriculture, food, natural resources, and rural America. Research results and economic indicators on

158 USDA AGENCY FINANCIAL REPORT | 2019
these important issues are fully disseminated through published and electronic reports and articles, special staff analyses, briefings, presentations and papers, databases, and individual contacts. ERS’ objective information and analysis helps public and private decision makers attain the goals that promote agricultural competitiveness, food safety and security, a well-nourished population, environmental quality, and a sustainable rural economy.
National Agricultural Statistics Service (NASS) NASS conducts research to improve the statistical methods and related technologies used to produce U.S. agriculture statistics. The research agenda has two primary areas of emphasis: the National Agriculture Statistics Service estimation program and the Census of Agriculture program. For each, the goal is the development of improved estimates at lower cost, with reduced respondent burden, and with valid measures of uncertainty. All facets of the estimation process are considered, from increasing efficiencies in sampling and data collection to enhancing the statistical methodology used to analyze the data. Two high priority items within the research effort are exploring approaches to reducing respondent burden and model-based estimates. The use of previously reported, remotely sensed, and administrative data have the potential to substantially reduce respondent burden, but can also introduce bias. Assessing the best ways to use these data and continue to produce precise statistics is a major effort. Models are used to combine data from disparate sources, from sample surveys to remote sensing, resulting in improved estimates with valid measures of uncertainty. Going forward, users of NASS services and products will be increasingly dependent upon methodological and technological efficiencies.
Natural Resources Conservation Service (NRCS) NRCS Plant Materials Centers (PMC) are research farms engaging in applied research and development as defined in SFFAS No. 8. Overall efforts of PMCs include the selection of plants and the development of plant technology used by NRCS and conservation partners for the application of vegetation to solve natural resource issues on private and public lands.
The NRCS Soil Science Division (SSD) conducts soil survey research and provides leadership for the National Cooperative Soil Survey (NCSS), which is responsible for the soils inventory of the United States and interpreting this information to “help people help the land” through natural resource conservation.
SECTION II | FINANCIAL INFORMATION 159
Required Supplementary Information
DEFERRED MAINTENANCE AND REPAIRS (UNAUDITED) The Forest Service is steward to nearly 193 million acres of national forests and grasslands within the NFS. On these NFS lands, the agency manages major assets that are categorized as general PP&E, including nearly 40,000 administrative, recreation, and research buildings and approximately 27,000 recreational sites, such as campgrounds, picnic areas, trailheads, and interpretive sites.
Across the NFS, the agency also manages over 370,000 miles of roads, of which 65,000 miles are for passenger vehicles; over 159,000 miles of trails for motorized and non-motorized use; nearly 13,400 road and trail bridges; and over 1,700 Forest Service-owned and Special Use Permitted dam structures.
ARS owns/manages approximately 15 million gross square feet of facility space in 3,000 buildings on 379,000 acres of land. APHIS operates approximately 28 facilities, which includes 378 buildings, in the United States and 14 facilities/buildings internationally. The NRCS portfolio of owned assets encompasses 29 sites, including 13 parcels of owned land, 224 buildings, and about 221 other structures.
Deferred Maintenance & Repairs (DM&R) estimates include capitalized PP&E, non capitalized heritage assets, and non capitalized or fully depreciated PP&E.
No DM&R is reported for stewardship land because land is considered to be in acceptable condition unless an environmental contamination or liability is identified and the land cannot be used for its intended purpose. Stewardship land easements are excluded from DM&R since ownership is retained by the landowner.
Defining and Implementing Maintenance and Repairs Policies in Practice Policies for ranking and prioritizing DM&R activities for most assets, except bridges, are based on condition surveys performed on a 5-year revolving schedule. Bridge class assessments occur on a 2-year revolving schedule. To-date, surveys of all administrative buildings, dams, bridges, roads open to passenger cars, and recreation sites have been accomplished. The agency’s DM&R for NFS passenger car roads is determined every other year from random sample surveys providing a moderate level of confidence in the accuracy of the data reported. DM&R is not reported for roads that are not part of the passenger-car system.
ARS, APHIS, and NRCS use similar condition surveys to estimate DM&R on all major classes of its PP&E and heritage assets.
Ranking and Prioritizing Maintenance and Repairs Activities Maintenance and repair activities are prioritized based on condition surveys and ranked based on PP&E and heritage assets that pose serious threats to public health or safety, a natural resource, or the ability of the agency to implement its mission.
160 USDA AGENCY FINANCIAL REPORT | 2019
Factors Considered in Setting Acceptable Condition The standards for acceptable operating condition for various classes of PP&E and heritage assets are as follows:
Conditions of roads and bridges within the NFS road system are measured by various standards:
▪ Federal Highway Administration regulations for the Federal Highway Safety Act.
▪ Best management practices for the nonpoint source provisions of the Clean Water Act from U.S. Environmental Protection Agency and States.
▪ Road management objectives developed through the National Forest Management Act forest planning process.
▪ Forest Service directives—Forest Service Manual (FSM) 7730, Operation and Maintenance; Forest Service Handbook (FSH) 7709.56a, Road Preconstruction, and FSH 7709.56b, Transportation Structures Handbook.
Dams in the NFS are managed according to FSM 7500, Water Storage and Transmission, and FSH 7509.11, Dams Management Handbook. The condition of a dam is acceptable when the dam meets current design standards and does not have any deficiencies that threaten the safety of the structure or public. For dams to be rated in acceptable condition, the agency needs to restore the dams to the original functional purpose, correct unsightly conditions, or prevent more costly repairs.
Buildings in the NFS shall comply with the International Family of Building and Related Codes, the National Fire Protection Association Life Safety Code, the Forest Service Health and Safety Handbook, and the Occupational Safety Health Administration as determined by condition surveys and safety inspections. These requirements are found in FSM 7310, Buildings and Related Facilities, revised November 19, 2004.
Recreation facilities in the NFS are located within recreation sites that range from highly developed sites to general forest areas such as campgrounds, trailheads, trails, water and wastewater systems, interpretive facilities, and visitor centers. Recreation sites are managed in accordance with Federal laws and regulations (Code of Federal Regulations [CFR] 36).
Detailed management guidelines are contained in FSM 2330, Publicly Managed Recreation Opportunities, and forest- and regional-level user guides. Quality standards for developed recreation sites in the NFS were established as Meaningful Measures for health and cleanliness, settings, safety and security, responsiveness, and the condition of the facility.
Trails and trail bridges in the NFS are managed according to Federal law and regulations (CFR 36). More specific direction is contained in FSM 2350, Trail, River, and Similar Recreation Opportunities, and the FSH 2309.18, Trails Management Handbook.
ARS, APHIS, and NRCS define acceptable condition in accordance with standards comparable to those used in private industry for buildings and other structures.

SECTION II | FINANCIAL INFORMATION 161
Deferred Maintenance and Repair Costs
Asset Category FY 2019 Ending Balance
FY 2019 Beginning Balance
FY 2018 Ending Balance
FY 2018 Beginning Balance
General PP&E $ 5,663 $ 5,648 $ 5,648 $ 5,342
Heritage Assets 210 180 180 149
Total $ 5,873 $ 5,828 $ 5,828 $ 5,491
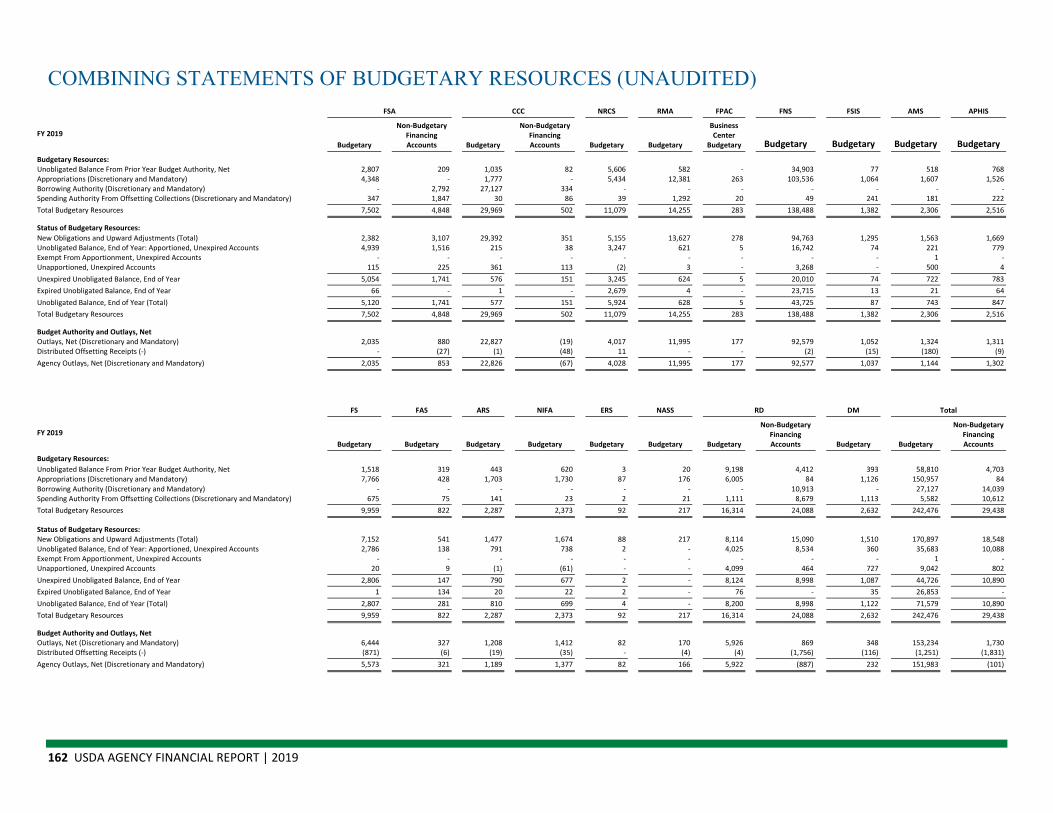
162 USDA AGENCY FINANCIAL REPORT | 2019
COMBINING STATEMENTS OF BUDGETARY RESOURCES (UNAUDITED) FSA CCC NRCS RMA FPAC FNS FSIS AMS APHIS
FY 2019 Budgetary
Non-Budgetary Financing Accounts Budgetary
Non-Budgetary Financing Accounts Budgetary Budgetary
Business Center
Budgetary Budgetary Budgetary Budgetary Budgetary Budgetary Resources: Unobligated Balance From Prior Year Budget Authority, Net 2,807 209 1,035 82 5,606 582 - 34,903 77 518 768 Appropriations (Discretionary and Mandatory) 4,348 - 1,777 - 5,434 12,381 263 103,536 1,064 1,607 1,526 Borrowing Authority (Discretionary and Mandatory) - 2,792 27,127 334 - - - - - - - Spending Authority From Offsetting Collections (Discretionary and Mandatory) 347 1,847 30 86 39 1,292 20 49 241 181 222 Total Budgetary Resources 7,502 4,848 29,969 502 11,079 14,255 283 138,488 1,382 2,306 2,516
Status of Budgetary Resources: New Obligations and Upward Adjustments (Total) 2,382 3,107 29,392 351 5,155 13,627 278 94,763 1,295 1,563 1,669 Unobligated Balance, End of Year: Apportioned, Unexpired Accounts 4,939 1,516 215 38 3,247 621 5 16,742 74 221 779 Exempt From Apportionment, Unexpired Accounts - - - - - - - - - 1 - Unapportioned, Unexpired Accounts 115 225 361 113 (2) 3 - 3,268 - 500 4 Unexpired Unobligated Balance, End of Year 5,054 1,741 576 151 3,245 624 5 20,010 74 722 783 Expired Unobligated Balance, End of Year 66 - 1 - 2,679 4 - 23,715 13 21 64 Unobligated Balance, End of Year (Total) 5,120 1,741 577 151 5,924 628 5 43,725 87 743 847 Total Budgetary Resources 7,502 4,848 29,969 502 11,079 14,255 283 138,488 1,382 2,306 2,516
Budget Authority and Outlays, Net Outlays, Net (Discretionary and Mandatory) 2,035 880 22,827 (19) 4,017 11,995 177 92,579 1,052 1,324 1,311 Distributed Offsetting Receipts (-) - (27) (1) (48) 11 - - (2) (15) (180) (9) Agency Outlays, Net (Discretionary and Mandatory) 2,035 853 22,826 (67) 4,028 11,995 177 92,577 1,037 1,144 1,302
FS FAS ARS NIFA ERS NASS RD DM Total
FY 2019 Budgetary Budgetary Budgetary Budgetary Budgetary Budgetary Budgetary
Non-Budgetary Financing Accounts Budgetary Budgetary
Non-Budgetary Financing Accounts
Budgetary Resources: Unobligated Balance From Prior Year Budget Authority, Net 1,518 319 443 620 3 20 9,198 4,412 393 58,810 4,703 Appropriations (Discretionary and Mandatory) 7,766 428 1,703 1,730 87 176 6,005 84 1,126 150,957 84 Borrowing Authority (Discretionary and Mandatory) - - - - - - - 10,913 - 27,127 14,039 Spending Authority From Offsetting Collections (Discretionary and Mandatory) 675 75 141 23 2 21 1,111 8,679 1,113 5,582 10,612 Total Budgetary Resources 9,959 822 2,287 2,373 92 217 16,314 24,088 2,632 242,476 29,438
Status of Budgetary Resources: New Obligations and Upward Adjustments (Total) 7,152 541 1,477 1,674 88 217 8,114 15,090 1,510 170,897 18,548 Unobligated Balance, End of Year: Apportioned, Unexpired Accounts 2,786 138 791 738 2 - 4,025 8,534 360 35,683 10,088 Exempt From Apportionment, Unexpired Accounts - - - - - - - - - 1 - Unapportioned, Unexpired Accounts 20 9 (1) (61) - - 4,099 464 727 9,042 802 Unexpired Unobligated Balance, End of Year 2,806 147 790 677 2 - 8,124 8,998 1,087 44,726 10,890 Expired Unobligated Balance, End of Year 1 134 20 22 2 - 76 - 35 26,853 - Unobligated Balance, End of Year (Total) 2,807 281 810 699 4 - 8,200 8,998 1,122 71,579 10,890 Total Budgetary Resources 9,959 822 2,287 2,373 92 217 16,314 24,088 2,632 242,476 29,438
Budget Authority and Outlays, Net Outlays, Net (Discretionary and Mandatory) 6,444 327 1,208 1,412 82 170 5,926 869 348 153,234 1,730 Distributed Offsetting Receipts (-) (871) (6) (19) (35) - (4) (4) (1,756) (116) (1,251) (1,831) Agency Outlays, Net (Discretionary and Mandatory) 5,573 321 1,189 1,377 82 166 5,922 (887) 232 151,983 (101)
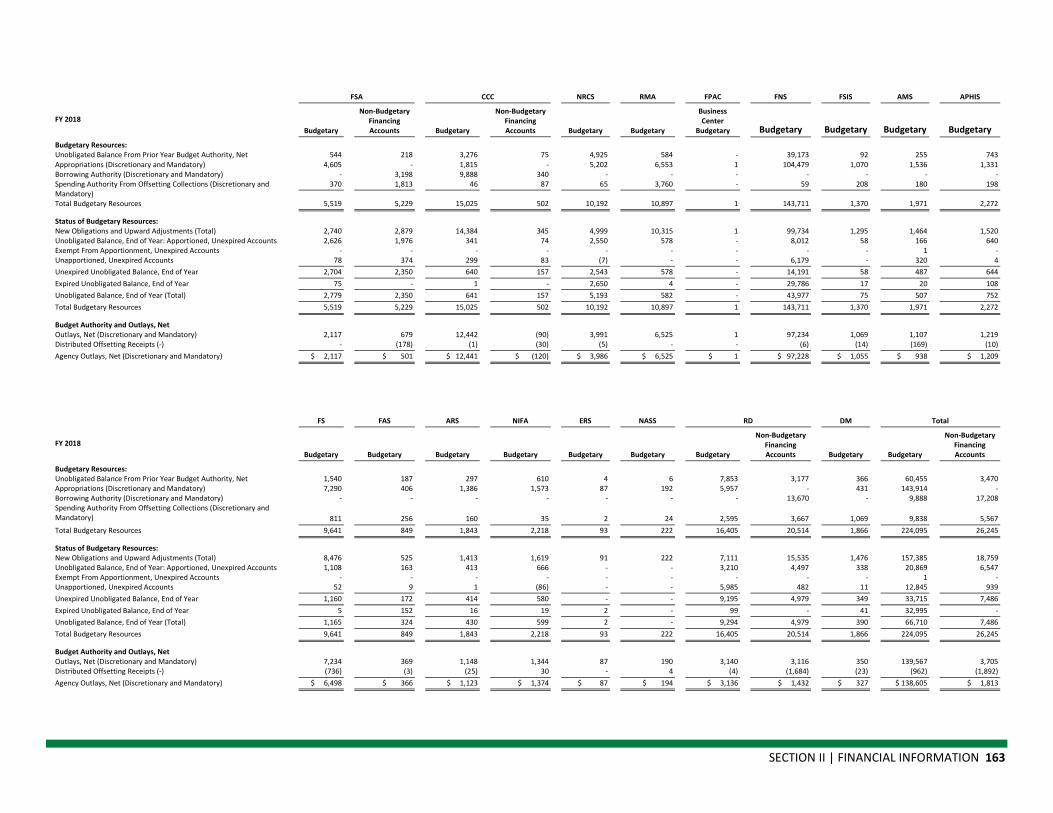
SECTION II | FINANCIAL INFORMATION 163
FSA CCC NRCS RMA FPAC FNS FSIS AMS APHIS
FY 2018 Budgetary
Non-Budgetary Financing Accounts Budgetary
Non-Budgetary Financing Accounts Budgetary Budgetary
Business Center
Budgetary Budgetary Budgetary Budgetary Budgetary Budgetary Resources: Unobligated Balance From Prior Year Budget Authority, Net 544 218 3,276 75 4,925 584 - 39,173 92 255 743 Appropriations (Discretionary and Mandatory) 4,605 - 1,815 - 5,202 6,553 1 104,479 1,070 1,536 1,331 Borrowing Authority (Discretionary and Mandatory) - 3,198 9,888 340 - - - - - - - Spending Authority From Offsetting Collections (Discretionary and Mandatory)
370 1,813 46 87 65 3,760 - 59 208 180 198
Total Budgetary Resources 5,519 5,229 15,025 502 10,192 10,897 1 143,711 1,370 1,971 2,272
Status of Budgetary Resources: New Obligations and Upward Adjustments (Total) 2,740 2,879 14,384 345 4,999 10,315 1 99,734 1,295 1,464 1,520 Unobligated Balance, End of Year: Apportioned, Unexpired Accounts 2,626 1,976 341 74 2,550 578 - 8,012 58 166 640 Exempt From Apportionment, Unexpired Accounts - - - - - - - - - 1 - Unapportioned, Unexpired Accounts 78 374 299 83 (7) - - 6,179 - 320 4 Unexpired Unobligated Balance, End of Year 2,704 2,350 640 157 2,543 578 - 14,191 58 487 644 Expired Unobligated Balance, End of Year 75 - 1 - 2,650 4 - 29,786 17 20 108 Unobligated Balance, End of Year (Total) 2,779 2,350 641 157 5,193 582 - 43,977 75 507 752 Total Budgetary Resources 5,519 5,229 15,025 502 10,192 10,897 1 143,711 1,370 1,971 2,272
Budget Authority and Outlays, Net Outlays, Net (Discretionary and Mandatory) 2,117 679 12,442 (90) 3,991 6,525 1 97,234 1,069 1,107 1,219 Distributed Offsetting Receipts (-) - (178) (1) (30) (5) - - (6) (14) (169) (10) Agency Outlays, Net (Discretionary and Mandatory) $ 2,117 $ 501 $ 12,441 $ (120) $ 3,986 $ 6,525 $ 1 $ 97,228 $ 1,055 $ 938 $ 1,209
FS FAS ARS NIFA ERS NASS RD DM Total
FY 2018 Budgetary Budgetary Budgetary Budgetary Budgetary Budgetary Budgetary
Non-Budgetary Financing Accounts Budgetary Budgetary
Non-Budgetary Financing Accounts
Budgetary Resources: Unobligated Balance From Prior Year Budget Authority, Net 1,540 187 297 610 4 6 7,853 3,177 366 60,455 3,470 Appropriations (Discretionary and Mandatory) 7,290 406 1,386 1,573 87 192 5,957 - 431 143,914 - Borrowing Authority (Discretionary and Mandatory) - - - - - - - 13,670 - 9,888 17,208 Spending Authority From Offsetting Collections (Discretionary and Mandatory) 811 256 160 35 2 24 2,595 3,667 1,069 9,838 5,567 Total Budgetary Resources 9,641 849 1,843 2,218 93 222 16,405 20,514 1,866 224,095 26,245
Status of Budgetary Resources: New Obligations and Upward Adjustments (Total) 8,476 525 1,413 1,619 91 222 7,111 15,535 1,476 157,385 18,759 Unobligated Balance, End of Year: Apportioned, Unexpired Accounts 1,108 163 413 666 - - 3,210 4,497 338 20,869 6,547 Exempt From Apportionment, Unexpired Accounts - - - - - - - - - 1 - Unapportioned, Unexpired Accounts 52 9 1 (86) - - 5,985 482 11 12,845 939 Unexpired Unobligated Balance, End of Year 1,160 172 414 580 - - 9,195 4,979 349 33,715 7,486 Expired Unobligated Balance, End of Year 5 152 16 19 2 - 99 - 41 32,995 - Unobligated Balance, End of Year (Total) 1,165 324 430 599 2 - 9,294 4,979 390 66,710 7,486 Total Budgetary Resources 9,641 849 1,843 2,218 93 222 16,405 20,514 1,866 224,095 26,245
Budget Authority and Outlays, Net Outlays, Net (Discretionary and Mandatory) 7,234 369 1,148 1,344 87 190 3,140 3,116 350 139,567 3,705 Distributed Offsetting Receipts (-) (736) (3) (25) 30 - 4 (4) (1,684) (23) (962) (1,892) Agency Outlays, Net (Discretionary and Mandatory) $ 6,498 $ 366 $ 1,123 $ 1,374 $ 87 $ 194 $ 3,136 $ 1,432 $ 327 $ 138,605 $ 1,813

164 USDA AGENCY FINANCIAL REPORT | 2019
Section III
Other Information
Response to Management Challenges The Reports Consolidation Act of 2000 requires the U.S. Department of Agriculture’s (USDA) Office of Inspector General (OIG) to report annually on the most serious management challenges USDA and its agencies face. To identify these Departmental challenges, OIG provides an annual assessment of the previous year’s challenges to determine if they are still critical challenges; examines recently issued audit reports to identify critical issues that remain topical and where corrective action has not been satisfactorily implemented; identifies repeated inquiries or hotline trends in risk areas; assesses ongoing audit and investigative work to identify new issues; and analyzes new programs and activities that pose significant challenges due to size and complexity.
OIG’s review of prior year and current year audit findings, as well as, the statuses of open recommendations has concluded that the Department remains vulnerable in these challenge areas. No challenges have been removed or added to this year’s report. Each challenge includes a discussion of the Department’s progress in addressing it, as well as what remains to be done, if applicable.
The following narratives summarize:
▪ OIG identified management challenges;
▪ USDA’s FY 2019 agency accomplishments; and
▪ FY 2020 planned actions to address these management challenges.
CHALLENGE 1: Management Needs to Improve Oversight and Accountability for its Programs USDA faces the challenge of managing a wide range of programs, each with their own requirements and vulnerabilities. In FY 2019, USDA’s 29 agencies and offices and nearly 100,000 employees were responsible for delivering approximately $144 billion in public services. Providing the appropriate level of oversight, while administering these programs so that every dollar spent accomplishes the intended results, poses significant challenges to USDA program managers.
USDA managers are responsible for establishing an effective internal control system, ensuring a culture of compliance with those controls, and holding employees accountable for implementing those controls.
SECTION III | OTHER INFORMATION 165
Managers use internal controls to ensure programs achieve intended results efficiently and effectively, and they provide for program integrity and proper stewardship of USDA’s resources. Since systemic control flaws can yield systemic program weaknesses—e.g., unrealized goals—managers must continuously assess and improve their internal control systems. If management does not emphasize those controls, federal programs will not function as intended.
OIG Determined the Following: ▪ The Office of Homeland Security and Emergency had not adequately overseen and coordinated
USDA’s efforts to prevent, detect, and respond to agroterrorism.
Corrective Actions Completed and Planned:
Office of Homeland Security and Emergency Coordination
The Office of Homeland Security has submitted an update to Departmental Regulation (DR)-1800-001 “Incident Preparedness, Response, and Recovery” that addresses how OSEC will oversee and coordinate USDA’s agroterrorism prevention, detection, and response activities.
166 USDA AGENCY FINANCIAL REPORT | 2019
CHALLENGE 2: Information Technology Security Needs Continuous Improvement Like other Departments, USDA faces threats to its IT security from adversarial nations, hostile non-state actors, and criminals seeking to exploit vulnerabilities. As Federal agencies rely more on data stored using information technology, the risk of a security breach increases. In recent years, USDA has taken action to improve its IT security. However, the Department still faces vulnerabilities across a broad front of IT security-related fields. Overall, USDA has not fully complied with the standards for safeguarding IT systems, as required by the Federal Information Security Modernization Act of 2014 (FISMA). The Department’s challenge is further complicated because, for USDA to attain a sustainable and secure IT posture, all of its component agencies must consistently implement Departmental policy.
In order to provide benefits and services to the American public, USDA must efficiently manage vast amounts of data. Some of this information is sensitive and its inappropriate release could cause significant problems. Members of the public apply for and access many USDA programs, benefits, and other services through online or mobile portals, which can require the transfer of personal information. USDA employees must be able to access, use, and communicate this information reliably and timely. The Department thus faces a significant challenge in safeguarding this information by protecting the security, confidentiality, and integrity of its IT infrastructure, even as it allows authorized users to access and use this information.
While Department leadership has emphasized overcoming these challenges and eventually reaching full compliance, the Department faces great challenges in complying with FISMA.
OIG Determined the Following: ▪ USDA continues to take positive steps to improve its IT security posture. The Office of the Chief
Information Officer has closed 47 out of OIG’s 67 recommendations to improve the overall security of USDA systems made in prior fiscal years.
▪ The Department needs to improve its policies and procedures for preserving the privacy of users’ information.
▪ The Department’s maturity level for an effective security was determined to be “defined” level, which indicates an ineffective level based on the Office of Management and Budget’s standard of “managed and measurable.” The Department needs to improve its score to an effective level.
▪ The Department did not fully implement Federally-mandated controls for security over USDA networks and systems.

SECTION III | OTHER INFORMATION 167
Corrective Actions Completed or Planned:
Office of the Chief Information Officer
In FY 2019 USDA implemented all overdue (FY 2009–FY 2017) recommendations including the 18 overdue recommendations noted in the report. Implementing these recommendations closed 11 audits. OCIO also implemented 4 recommendations from FY 2018 OIG audits. The Department will continue to promptly and effectively address open recommendations related to information technology security during FY 2020.
A memorandum was issued to USDA’s agencies and staff offices which prescribed minimum safeguards to protect Personally Identifiable Information (PII). The Department also developed privacy policies and procedures to protect users’ personal information in accordance with statutory and regulatory requirements.
During FY 2020 OCIO will:
▪ Strengthen management controls related to the protection of PII on USDA information technology systems;
▪ Reevaluate its policy for encryption and require positive confirmation that appropriate federal encryption standards are in place for PII data in transit and data at rest; and
▪ Flag Plans of Action and Milestones (POAMs) associated with PII encryption and escalate noncompliance to the Mission Area leadership for immediate action.
In FY 2019, USDA raised the capability maturity model (CMM) level of 19 FISMA questions; a 32 percent increase for USDA in FY 2019. This improvement reflects the Departments achievement in publishing seven new cybersecurity Departmental directives (6 policies, 1 procedure) and implementing cybersecurity tools to improve vulnerability management automation.
During FY 2019, USDA partnered with the security community to implement best practices to address federally-mandated controls. In FY 2020, improvements to processes, additional implementation of continuous diagnostics and mitigation tool capabilities, coupled with an increase in human capital will expedite the full implementation of federally-mandated controls.

168 USDA AGENCY FINANCIAL REPORT | 2019
CHALLENGE 3: USDA Needs to Strengthen Program Performance and Performance Measures Designing, developing, and implementing programs that reliably achieve their intended results has been a recurring challenge for the Department. OIG found that agencies do not have adequate reviews or controls in place to supply the metrics necessary to evaluate program performance. As a result, some agencies are using inaccurate or unreliable data in program performance reports.
USDA manages approximately 300 programs that provide a variety of services and financial assistance to the American public. This diverse portfolio of programs means that, for the Department to serve as a diligent steward of Federal funds, USDA must have well-designed programs with clear goals and performance measures.
The Government Performance and Results Modernization Act of 2010 set requirements for regular and recurring program performance assessment. In keeping with the law, an agency should have controls in place that allow it to regularly review a program’s performance, and then compile reports that allow it to measure and report on that performance. These reports allow the Department to fairly evaluate its programs’ successes and failures. The Department needs stronger program performance and performance measures.
OIG Determined the Following: ▪ The Foreign Agricultural Service (FAS) had not updated its Country Strategy Statements to align
with the goals and objectives contained in its strategic plan.
Corrective Actions Completed or Planned:
Foreign Agricultural Service
FAS’s 2019-2022 Strategic Plan was released on March 26, 2019. In August 2019, FAS issued new guidance for reviewing the Country Strategy Statements (CSS) that organizes and aligns the CSS objectives with those in the FAS Strategic Plan. Updates to the Country Strategy Statements will be completed by September 30, 2020.
SECTION III | OTHER INFORMATION 169
CHALLENGE 4: USDA Needs to Strengthen Controls Over Improper Payments and Financial Management USDA continues to be noncompliant with Federal requirements for improper payments. Also, USDA needs to address internal control deficiencies to resolve ongoing problems with financial management and reporting.
The Department’s annual financial reports provide the public, Congress, and the President with information regarding the funds spent on public services every year. These reports account for USDA’s costs and revenues, assets and liabilities, and other information. OIG reviews the Department’s financial reports annually, as required by law, to verify accuracy and compliance with Federal rules regarding high-dollar overpayments and improper payments.
The Department has been making progress towards fully complying with improper payment requirements as set forth by the Improper Payments Information Act of 2002, as amended. In its eighth year of reporting, USDA identified nine programs as susceptible to significant improper payments (high-risk) in FY 2018, which is one fewer than the year before. Additionally, five of USDA’s nine high-risk programs were fully compliant in FY 2018, compared to three the year before. Finally, the Department substantially complied with four of the six improper payment requirements in FY 2018 compared to three the year before.
OIG Determined the Following: ▪ The Natural Resources Conservation Service and the Commodity Credit Corporation need to make
further improvements to their overall financial management.
▪ USDA needs to improve its controls over financial reporting related to obligations.
Corrective Actions Completed or Planned for Financial Reporting:
Commodity Credit Corporation
CCC will continue its efforts to:
▪ Implement effective Undelivered Orders (UDO) monitoring controls at the program level, to assess the accuracy and validity of open obligations;
▪ Provide training to personnel in the field and county offices on the requirements of Office of Management and Budget Circular A-11 for recording obligations, and ensure program handbooks are up-to-date regarding execution and related accounting;
▪ Implement effective automated and/or manual controls to evaluate the relationship between a Conservation Reserve Program (CRP) annual rental contract and CRP cost share contract, and

170 USDA AGENCY FINANCIAL REPORT | 2019
develop and implement data analytic routines and management review controls related to program UDO populations to identify and correct abnormalities in the data;
▪ Strengthen management controls related to the annual Agriculture Risk Coverage (ARC) and Price Loss Coverage (PLC) UDO calculation to ensure that it is performed at a level of precision to include relevant and accurate data elements;
▪ Implement processes, procedures, and controls to ensure accurate recognition of adjustments to delivered orders are input into the accounting systems, and perform periodic reviews of the accounting events to validate the results of recorded transactions;
▪ Implement effective automated budgetary funds control within its accounting systems to mitigate the occurrence of violations;
▪ Implement effective internal controls to review and reconcile general ledger account inter-relationships between borrowing authority and other budgetary accounts; and
▪ Record borrowing authority at the appropriate program level to prevent abnormal balance and to assist in meaningful account review and reconciliation.
Natural Resources Conservation Service
In FY 2019, NRCS incorporated period of performance in obligation reports from the feeder system and added fiscal year of performance to ProTracts reports. In FY 2020, NRCS will enhance the feeder system and Financial Management Modernization Initiative (FMMI) processes to provide capability to produce aged Unliquidated Obligations (ULO) information. In addition, NRCS will establish an ongoing process to maintain, monitor, and certify ULOs by period of performance. NRCS will document internal controls to ensure transactional data and assumptions are reviewed. Additional guidance and training will also be provided to employees over the recording of transactions with future economic benefit.
Office of the Chief Financial Officer
During FY 2019, a new ULO Aging Report was developed in the Department’s integrated financial management system, FMMI. The report is a tool that reconciles to the general ledger and helps to ensure that the ULO population is consistent, accurate, and complete. A ULO Directive was updated: (1) to require the review of obligations inactive for 12 months and more than $100, (2) to ensure internal ULO Aging Reports reconcile to the general ledger, and (3) ULOs are categorized based on the nature of the activity to be researched. During FY 2020, the Department will issue and implement ULO Directive 2230-001.
Monthly ULO Departmental meetings were held in FY 2019 to discuss emerging issues identified by audits, and OMB Circular A-123 concerns. The monthly meetings will continue as needed for FY 2020.
SECTION III | OTHER INFORMATION 171
CHALLENGE 5: USDA Needs to Improve Outreach Efforts The Secretary of Agriculture has stressed the importance of civil rights and equitable treatment in the Department’s outreach efforts. Now more than ever, in a time of heightened sensitivity and cultural awareness of discrimination and sexual misconduct, USDA needs to make efforts to reach out to—and ensure equal treatment of—minorities, women, and veterans, as well as new and beginning farmers and ranchers.
Due to a history of public attention concerning how USDA has treated members of socially-disadvantaged groups—including both USDA employees and program recipients—the Department faces challenges in earning those groups’ trust.
USDA needs to make efforts to ensure its programs are equally accessible to all and its agencies and offices treat employees fairly and ethically. First, the Food, Conservation, and Energy Act of 2008 directed that all pending claims and class actions brought against USDA by socially-disadvantaged farmers or ranchers, including Hispanics and women, based on racial, ethnic, or gender discrimination in farm program participation, be resolved in an expeditious and just manner. Second, in light of allegations of sexual harassment and misconduct within the Forest Service (FS), and in response to Congressional requests, OIG began a series of reviews in 2014 concerning the FS work environment and its handling of sexual harassment complaints, which has resulted in two audit reports and a survey in FS Region 5 regarding sexual harassment.
OIG Determined the Following: ▪ The Forest Service (FS) needs to ensure its actions hold individuals accountable, deter future
sexual misconduct and harassment, and establish internal guidelines for documenting the justification when deviating from a recommended penalty.
▪ The Food and Nutrition Service (FNS) needs to address findings from audits of State agencies administering the Summer Food Service Program.
Corrective Actions Completed or Planned for Financial Reporting:
Forest Service
FS recognizes the importance of all employees functioning at a high level of performance and behavior. FS has continued to make progress and implement solutions that will address OIG’s audit report. For FY 2020, the agency will research and investigate the best approach to complete the open recommendations.
Food and Nutrition Service
Per OIG’s audit finding, the identified sponsor’s site review forms have been reviewed and confirmed by both the New York State agency and FNS to ensure that the sponsor is now correctly collecting the required ethnic and racial data.
172 USDA AGENCY FINANCIAL REPORT | 2019
CHALLENGE 6: Food Safety Inspections Need Improved Controls The Food Safety and Inspection Service (FSIS) is responsible for protecting the public health by ensuring the safety of the Nation’s commercial supply of meat, poultry, and processed egg products. FSIS is tasked with reducing contamination and limiting illnesses through the regulation of agricultural food products. FSIS continues to face challenges, including gathering reliable data to help ensure safety verification tasks are completed, effective, and consistent.
OIG Determined the Following: ▪ FSIS lacked adequate management oversight to ensure inspectors’ compliance with verification
requirements and that inspectors’ results were recorded in the Public Health Information System.
Corrective Actions Completed and Planned:
Food Safety and Inspection Service
FSIS will revise and reissue Directive 5000.8, “Verifying Compliance with Requirements for Written Recall Procedures.” This directive will provide the instructions for inspection program personnel to follow and ensure establishments have prepared and maintained written recall procedures. The directive will be issued during FY 2020.
SECTION III | OTHER INFORMATION 173
CHALLENGE 7: FNS Needs to Strengthen SNAP Management Controls Although FNS has endeavored to improve management controls for SNAP, weaknesses continue to exist in controls over benefit distribution and quality control (QC) processes. The potential exists for billions of dollars of taxpayer-funded assistance not to be delivered or used as intended.
As the largest benefit program within USDA, and one of the largest in the Federal Government, SNAP presents a unique challenge for the program’s managers. According to FNS, in May 2019, more than 35.9 million people received $4.3 billion in SNAP benefits.
Given SNAP’s size and significance, fraud, waste, and abuse are critical concerns. USDA loses hundreds of millions of dollars every year to fraud and crime associated with SNAP and other FNS food assistance programs.
OIG Determined the Following: ▪ FNS needs to evaluate the cost-benefit of changing the QC process from a two-tier process that
relies on the States to make error determinations, to a one-tier process where only FNS or an unaffiliated third-party contractor reviews cases for errors.
Corrective Actions Completed and Planned:
Food and Nutrition Service
FNS is near the completion of the study on the feasibility of revising the SNAP Quality Control review process. After completion, the results will be analyzed. The feasibility study is what informs the cost-benefit analysis and what a realistic timeline would be for implementing a one-tier QC system.
The OIG USDA Management Challenges Report, issued September 2019, may be viewed in its entirety at the following website: www.usda.gov/oig/index.htm.
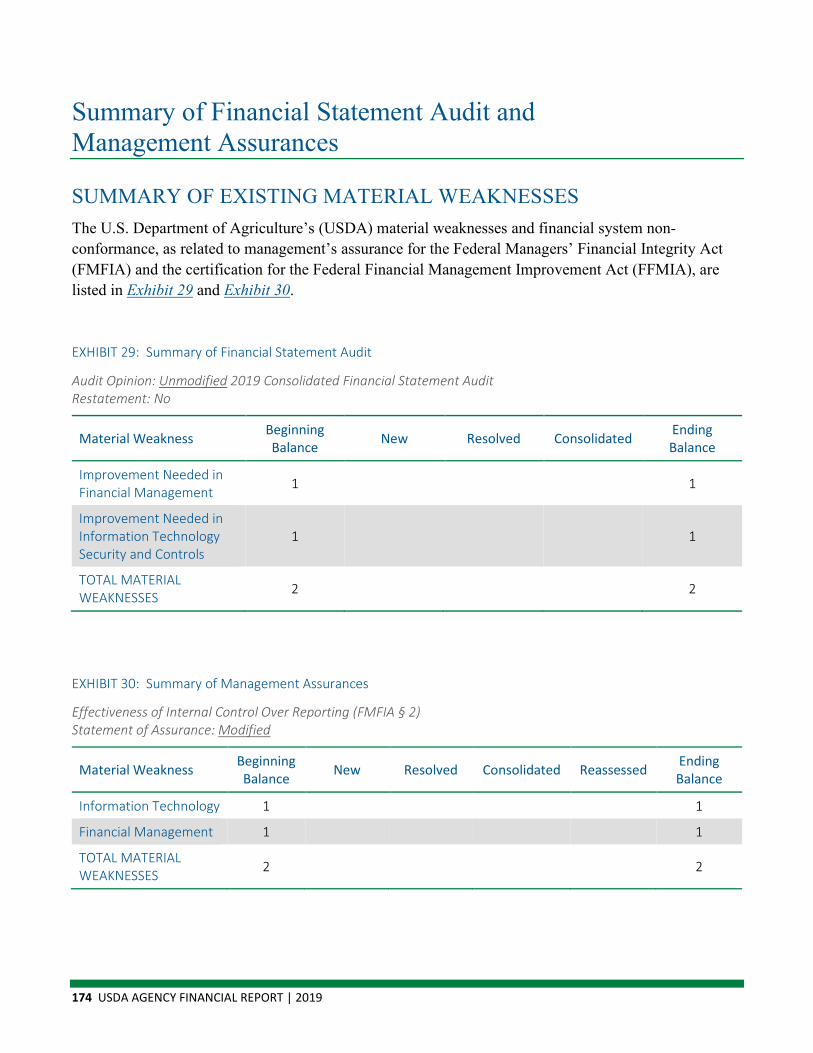
174 USDA AGENCY FINANCIAL REPORT | 2019
Summary of Financial Statement Audit and Management Assurances
SUMMARY OF EXISTING MATERIAL WEAKNESSES The U.S. Department of Agriculture’s (USDA) material weaknesses and financial system non-conformance, as related to management’s assurance for the Federal Managers’ Financial Integrity Act (FMFIA) and the certification for the Federal Financial Management Improvement Act (FFMIA), are listed in Exhibit 29 and Exhibit 30.
EXHIBIT 29: Summary of Financial Statement Audit
Audit Opinion: Unmodified 2019 Consolidated Financial Statement Audit Restatement: No
Material Weakness Beginning Balance New Resolved Consolidated Ending
Balance
Improvement Needed in Financial Management 1 1
Improvement Needed in Information Technology Security and Controls
1 1
TOTAL MATERIAL WEAKNESSES 2 2
EXHIBIT 30: Summary of Management Assurances
Effectiveness of Internal Control Over Reporting (FMFIA § 2) Statement of Assurance: Modified
Material Weakness Beginning Balance New Resolved Consolidated Reassessed Ending
Balance
Information Technology 1 1
Financial Management 1 1
TOTAL MATERIAL WEAKNESSES 2 2

SECTION III | OTHER INFORMATION 175
Effectiveness of Internal Control Over Operations (FMFIA § 2) Statement of Assurance: Unmodified
Material Weakness Beginning Balance New Resolved Consolidated Reassessed Ending
Balance
TOTAL MATERIAL WEAKNESSES 0 0
Conformance with Federal Financial Management System Requirements (FMFIA § 4) Statement of Assurance: Systems do not conform to financial management system requirements
Material Weakness Beginning Balance New Resolved Consolidated Reassessed Ending
Balance
Funds Control Management 1 1
TOTAL NON-CONFORMANCES 1 1
Compliance with Section 803 (A) of the Federal Financial Management Improvement Act (FFMIA)
Item Agency Auditor
1. Federal Financial Management System Requirements Lack of compliance noted Lack of compliance noted
2. Applicable Federal Accounting Standards Lack of compliance noted Lack of compliance noted
3. U.S. Standard General Ledger at Transaction Level Lack of compliance noted Lack of compliance noted
176 USDA AGENCY FINANCIAL REPORT | 2019
Payment Integrity Getting Payments Right is a Federal Government-wide Cross-Agency Priority (CAP) goal to demonstrate stewardship of taxpayer dollars by reducing monetary loss and making payments correctly the first time. Although improper payments may compromise citizens’ trust in government, they are not always indicative of fraud, nor do they necessarily represent payments that should not have been made. Having the right information and the capacity to address root causes are critical components.
The U.S. Department of Agriculture (USDA) continues to demonstrate a commitment to payment integrity through active participation in CAP Goal 9 Working Group, led by the Office of Management and Budget (OMB). USDA, along with other Federal agencies, analyzes strategic data use which includes identifying all available private and public data sets that could be used to perform payment eligibility checks. Agencies are working to increase program use of pre-checks and post-award analysis aimed at preventing monetary loss.
USDA efforts resulted in statistically validating the Natural Resources Conservation Service’s (NRCS) Farm Security and Rural Investment Act Program’s (FSRIP), which improved its payment integrity levels above the statutory reporting threshold for 2 consecutive years and has received concurrence from the Office of the Inspector General (OIG) to request relief from reporting requirements from OMB.
WHAT ARE IMPROPER PAYMENTS? OMB Memorandum M-18-20 defines an improper payment as:
▪ Any payment that should not have been made or that was made in an incorrect amount (including overpayments and underpayments) under statutory, contractual, administrative, or other legally applicable requirements;
▪ Any payment to an ineligible recipient, any payment for an ineligible good or service, any duplicate payment, any payment for a good or service not received (except for such payments where authorized by law), and any payment that does not account for credit for applicable discounts; and
▪ Any time an agency’s review is unable to discern whether a payment was proper as a result of insufficient or lack of documentation.
ARE IMPROPER PAYMENTS REQUIRED TO BE REPORTED? Yes, the Improper Payments Information Act of 2002 (IPIA), as amended by the Improper Payments Elimination and Recovery Act of 2010 (IPERA), the Improper Payments Elimination and Recovery Improvement Act of 2012 (IPERIA), and the Federal Improper Payments Coordination Act of 2015 (FIPCA), requires executive agencies to identify programs that may be susceptible to significant improper payments, estimate the annual amount of improper payments, and submit those estimates through the Agency Financial Report (AFR).
SECTION III | OTHER INFORMATION 177
A program that is determined to be susceptible to significant improper payments is referred to as a high-risk program within the USDA’s AFR. A high-risk program has both a 1.5 percent improper payment rate and at least $10 million in improper payments or exceeds $100 million dollars in improper payments (regardless of rate). Readers can obtain more detailed information on improper payments and information published in past AFRs at PaymentAccuracy.gov.
RISK ASSESSMENTS SECTION USDA has approximately 300 programs. Similar programs were grouped together to help identify and report improper payments. This method resulted in a USDA program inventory list of 156 programs for IPIA reporting purposes. Twelve of these programs are considered significant risk of improper payments and 144 programs are considered low-risk of improper payments. Risk assessments for low-risk programs are completed on a 3-year rotation cycle to monitor their susceptibility to improper payments. During FY 2019, 49 programs completed risk assessments.
In FY 2019, USDA’s Office of the Chief Financial Officer (OCFO) updated its risk assessment guidance in response to the revised OMB Circular A-123, Appendix C. These updates include OCFO assigning a risk score to each completed risk assessment. Within each risk assessment, the program is required to document its mitigating factors that address the following risk factors:
1. Whether the program or activity reviewed is new to the agency;
2. The complexity of the program or activity reviewed, particularly with respect to determining correct payment amounts;
3. The volume of payments made annually;
4. Whether payments or payment eligibility decisions are made outside of the agency, for example, by a State or local government, or a regional federal office;
5. Recent major changes in program funding, authorities, practices, or procedures;
6. The level, experience, and quality of training for personnel responsible for making program eligibility determinations or certifying that payments are accurate; and
7. Significant deficiencies in the audit reports of the agency including, but not limited to, the agency’s Inspector General or the Government Accountability Office (GAO) audit report findings, or other relevant management findings that might hinder accurate payment certification.
In FY 2019, the Food and Nutrition Service conducted a risk assessment of the Summer Food Service Program to address a recommendation from an OIG audit. Based on the results of the risk assessment and the findings in the OIG audit, OCFO considers this program to be at high-risk for improper payments and will require this program to complete all the requirements of a program susceptible to significant improper payments in the FY 2020 AFR reporting year.
178 USDA AGENCY FINANCIAL REPORT | 2019
In FY 2017, OCFO began a three year “Risk Assessment Methodology” pilot to leverage existing OMB Circular A-123, Appendix A, assessment methods to meet the OMB Circular A-123, Appendix C, risk assessment deliverable. In FY 2019, the following five programs continued to participate in the pilot:
1. Animal and Plant Health Inspection Service (APHIS) Salaries and Expenses
2. APHIS Indemnity Program
3. APHIS Buildings and Facilities
4. APHIS Trust Funds
5. APHIS Cooperative Agreements
USDA is currently analyzing the results and lessons learned from the pilot to determine if this strategy is potentially feasible for other USDA low-risk programs and activities. If successfully implemented, this initiative would reduce USDA employees’ burden of utilizing two different risk assessment methods to evaluate USDA’s programs and activities and increase objectivity of the risk assessment method.
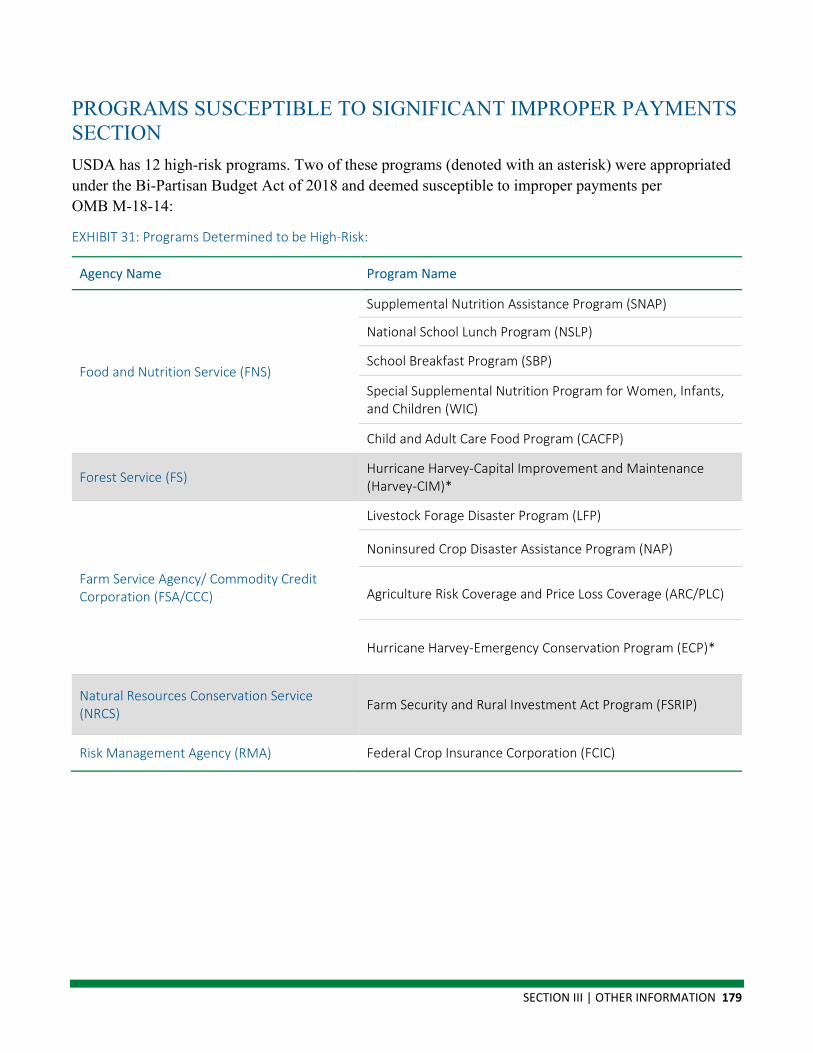
SECTION III | OTHER INFORMATION 179
PROGRAMS SUSCEPTIBLE TO SIGNIFICANT IMPROPER PAYMENTS SECTION USDA has 12 high-risk programs. Two of these programs (denoted with an asterisk) were appropriated under the Bi-Partisan Budget Act of 2018 and deemed susceptible to improper payments per OMB M-18-14:
EXHIBIT 31: Programs Determined to be High-Risk:
Agency Name Program Name
Food and Nutrition Service (FNS)
Supplemental Nutrition Assistance Program (SNAP)
National School Lunch Program (NSLP)
School Breakfast Program (SBP)
Special Supplemental Nutrition Program for Women, Infants, and Children (WIC)
Child and Adult Care Food Program (CACFP)
Forest Service (FS) Hurricane Harvey-Capital Improvement and Maintenance (Harvey-CIM)*
Farm Service Agency/ Commodity Credit Corporation (FSA/CCC)
Livestock Forage Disaster Program (LFP)
Noninsured Crop Disaster Assistance Program (NAP)
Agriculture Risk Coverage and Price Loss Coverage (ARC/PLC)
Hurricane Harvey-Emergency Conservation Program (ECP)*
Natural Resources Conservation Service (NRCS) Farm Security and Rural Investment Act Program (FSRIP)
Risk Management Agency (RMA) Federal Crop Insurance Corporation (FCIC)

180 USDA AGENCY FINANCIAL REPORT | 2019
SAMPLING AND ESTIMATION Programs deemed high-risk are required to conduct an annual sample that complies with OMB Circular A-123, Appendix C. OMB categorizes sampling plans into three groups which are summarized below:
1. Statistically Valid and Rigorous:
a. Based on unbiased randomized sampling and produce valid point estimates and confidence intervals around those estimates.
b. Obtain a plus or minus 3 percent or better margin of error at the 95-percent confidence level for the improper payment percentage.
2. Statistically Valid:
a. Based on unbiased randomized sampling and produce valid point estimates and confidence intervals around those estimates.
b. Obtain a wider than plus or minus 3 percent or better margin of error at the 95-percent confidence level for the improper payment percentage.
3. Non-Statistically Valid:
a. Uses an approach other than what was described previously.
b. Requires approval by the Director of OMB.
The following are USDA’s high-risk programs and a brief description of the sampling processes used to conduct a statistically valid and/or rigorous sample or a justification for utilizing an OMB approved non-statistically valid sampling methodology:
1. FNS Supplemental Nutrition Assistance Program (SNAP) a. Utilizes a statistically valid and rigorous sampling process. Cases, not payments, are the source
of the sample. FNS requires states to pull a monthly random sample from the population of households receiving SNAP benefits for that given month. Most states draw the samples systematically (that is, using a constant sampling interval); however, some states employ simple random or stratified sampling techniques. The sample universe represents cases made in the prior fiscal year. FNS sample utilizes a 95-percent confidence interval resulting in a margin of error of plus or minus 0.24 percent.
b. Change in sampling process: None.
2. FNS National School Lunch Program (NSLP) a. Utilizes a non-statistically valid sampling process for NSLP and the School Breakfast Program
(SBP). The Access, Participation, Eligibility, and Certification Study-II (APEC-II) established estimates of erroneous payments for school year (SY) 2012–2013. FNS generates an annual
SECTION III | OTHER INFORMATION 181
update for the improper payment measurements using statistical techniques based on the findings of this study. The payment estimates generated by the model represents SY 2017–2018.
b. Change in sampling process: None.
c. Justification: FNS must rely on periodic nationally representative studies to produce estimates of erroneous payments. Estimates of improper payments for SY 2012–2013 were produced in the NSLP/SBP’s APEC-II. Because of the scope and cost of such a study, it is more prudent to repeat it on a multi-year cycle. Contingent on available funding, FNS will produce an erroneous payment measurement through this type of study every 5 years. The next APEC Study is collecting data in SY 2017–18 and will be released in 2020. Also, as part of this same project, FNS will continue to refine estimation models that use administrative data from other sources in conjunction with the study data to “age” the data to annual estimates.
3. FNS School Breakfast Program (SBP) See NSLP narrative previously described.
4. FNS Special Supplemental Nutrition Program for Women, Infants, and Children (WIC)
a. Utilizes a non-statistically valid sampling process. Estimates of improper payments in WIC focus on two components: certification error and vendor error. FNS makes use of periodic studies to assess the level of error in program payments and then “ages” the data to produce updated estimates for each reporting year. The National Survey of WIC Participants-II Study, published in April 2012, established estimates of erroneous payments due to certification error. The 2013 WIC Vendor Management Study established the most recent national estimates of erroneous payments due to vendor error. FNS generates an annual update for the improper payment measurements of both components using statistical techniques based on the findings of these bookend studies. The sampling universe for:
• certification error is made up of estimates for FY 2018 obtained from an econometric model that uses FY 2009 survey data augmented with FY 2018 food dollars and WIC Participant and Program Characteristics (PC) 2016 certification data;
• vendor error is made up of estimates for FYs after FY 2012 use vendor error rates from the most recent statistically valid bookend study.
b. Change in sampling process: In previous years, FNS reported improper payments associated with vendor errors, which included a component that does not meet OMB’s definition of improper payments. The previous reporting methodology erroneously categorized savings that resulted from WIC State agency cost-containment policies as vendor underpayments. These vendor underpayments are not improper payments; they are actually consistent with statutory and regulatory objectives and result in desired program savings.

182 USDA AGENCY FINANCIAL REPORT | 2019
Effective for the 2019 fiscal year reporting, FNS dropped the erroneously categorized vendor underpayments described previously from its improper payment total. Furthermore, FNS determined that the aging process for the vendor payment errors was producing erroneously high aged estimates of vendor error because the aging methodology estimated annual error based on the linear trend in error between two previous studies conducted in a predominantly paper voucher environment. Regardless of interventions to reduce vendor error or the move to electronic benefit transfer (EBT), the previous aging methodology would have always resulted in an increased vendor error rate over time. Therefore, FNS eliminated the aging component of the vendor error estimates and instead will use the error rates reported in the most recent statistically valid bookend study until a new bookend study is completed. FNS will retain the aging component of the certification error estimates. Additionally, while examining the WIC improper payment (IP) methodology in preparation for FY 2019 reporting, FNS identified an error in the aging program code for certification error that resulted in an inflated certification error rate. FNS has corrected the program code error and recalculated the series for certification error.
c. Justification: Because erroneous payment estimates need to be produced annually, and given that surveys to estimate vendor error are expensive to carry out, FNS requires a methodology to estimate vendor error annually based on estimates produced in the most recent studies of vendor error. Initial calculations to generate an annual estimate based on the linear trend between the two most recent bookend studies produced erroneously high aged estimates and were not sensitive to interventions to reduce error. Therefore, FNS now applies the error rate from the most recent statistically valid bookend study as the annual estimate of vendor error.
5. FNS Child and Adult Care Food Program (CACFP) a. Utilizes a non-statistically valid sampling process. In lieu of producing a program-wide improper
payment measure, FNS has identified the Family Day Care Home (FDCH) component of this program as potentially high-risk. USDA estimates the error rate in CACFP FDCH reimbursement status through periodic sample-based studies. In years between studies, USDA updates the most recent study’s sample-based estimate with administrative data. FNS is working to develop an econometric model to improve its error estimates in non-study years. For the current year, however, USDA will apply the most recent study’s error rate to the current year’s reimbursement total. The latest CACFP study used sample payments made in October 2014 through August 2015. The improper payment measures presented do not include improper payments associated with the Adult Day Care component or Child Care Centers, nor do they include meal claiming error at this time.
b. Change in sampling process: None.
c. Justification: A plan was initially explored to develop a program-wide study which would examine reimbursements for meals served and develop program error measurements that complied with the requirements of the IPIA. Because of the complexities of the program, FNS estimated that it would cost $20 million to measure improper payments at the precision required by IPIA. This amount has not been provided.
SECTION III | OTHER INFORMATION 183
6. FS Harvey-Capital Improvement and Maintenance (CIM) a. Utilizes a statistically valid sampling process. A sample was determined from payments made
during FY 2018 using a 95-percent confidence level with a margin of error of plus or minus 10 percent.
b. Change in sampling process: N/A. This is the first year this program is reporting.
7. Farm Service Agency/Commodity Credit Corporation (FSA/CCC) Livestock Forage Disaster Program (LFP)
a. Utilizes a statistically valid and rigorous sampling process. A sample was determined from the payments made in the prior fiscal year using a 95-percent confidence interval of plus or minus 3 percent. A stratified simple random sampling is used to select payments for the sample.
b. Change in sampling process: No changes from what was reported in the FY 2018 AFR.
8. FSA/CCC Noninsured Crop Disaster Assistance Program (NAP) a. Utilizes a statistically valid and rigorous sampling process. A sample was determined from the
payments made in the prior fiscal year using a 95-percent confidence interval of plus or minus 3 percent. A stratified simple random sampling is used to select payments for the sample.
b. Change in sampling process: No changes from what was reported in the FY 2018 AFR.
9. FSA Agriculture Risk Coverage and Price Loss Coverage (ARC/PLC) a. Utilizes a statistically valid and rigorous sampling process. A sample was determined from the
payments made in the prior fiscal year using a 95-percent confidence interval of plus or minus 3 percent. A stratified simple random sampling is used to select payments for the sample.
b. Change in sampling process: N/A. This is the first year this program is reporting.
10. FSA Harvey-Emergency Conservation Program (ECP) a. Utilizes a statistically valid and rigorous sampling process. A sample was determined from the
payments made in the prior fiscal year using a 95-percent confidence interval of plus or minus 3 percent. A stratified simple random sampling is used to select payments for the sample.
b. Change in sampling process: N/A. This is the first year this program is reporting.
11. NRCS Farm Security and Rural Investment Act Program (FSRIP) a. Utilizes a statistically valid and rigorous sampling process. A sample was determined from
payments made during FY 2018 using a 95-percent confidence level with a margin of error of plus or minus 3 percent. Stratified random sampling is used to select payments for the sample.
184 USDA AGENCY FINANCIAL REPORT | 2019
b. Change in sampling process: No changes from what was reported in the FY 2018 AFR.
12. RMA Federal Crop Insurance Corporation (FCIC) a. Utilizes a statistically valid and rigorous sampling process. A sample determined from payments
made during reinsurance year 2017 (July 2016 to June 2017) using a 95-percent confidence level with a margin of error of plus or minus 2.5 percent. Stratified random sampling is used to select payments for the sample.
b. Change in sampling process: No changes from what was reported in the FY 2018 AFR.

SECTION III | OTHER INFORMATION 185
PAYMENT INTEGRITY OUTLOOK SECTION The following table outlines USDA’s high-risk programs sampling and estimation results. See the annotated notes for programs that are flatlining their future year improper payment reduction target. Please refer to the Sampling and Estimation Section for additional information on the sampling timeframe of each high-risk program.
EXHIBIT 32: Payment Integrity Outlook Table ($ in millions)
Program Current
Year (CY) Outlays $
CY Properly Paid CY Improperly Paid (IP) CY +1 Estimated
Total % Total $ Total % Total $ Over
Payment $ Under
Payment $ Outlays $ IP % IP $
FNS Supplemental Nutrition Assistance Program (SNAP) [Note #1]
59,104.37 93.20 55,082.66 6.80 4,021.71 3,306.08 715.63 59,104.37 6.80 4,021.75
FNS National School Lunch Program (NSLP) 12,576.56 90.92 11,434.15 9.08 1,142.41 811.07 331.34 12,790.36 8.80 1,125.34
FNS School Breakfast Program (SBP) 4,395.23 89.50 3,933.81 10.50 461.42 296.82 164.60 4,534.12 10.18 461.66
FNS Special Supplemental Nutrition Program for Women, Infants, and Children (WIC) [Note #2]
3,376.56 97.97 3,308.16 2.03 68.40 68.40 0.00 3,393.44 2.03 68.89
FNS Child and Adult Care Food Program (CACFP) [Note #3]
682.18 99.46 678.50 0.54 3.68 2.77 0.91 656.26 0.54 3.54
Forest Service (FS) Capital Improvement and Maintenance (Harvey-CIM) [Note #4]
16.45 99.96 16.44 0.04 0.006 0.006 0.000 75.15 0.04 0.03
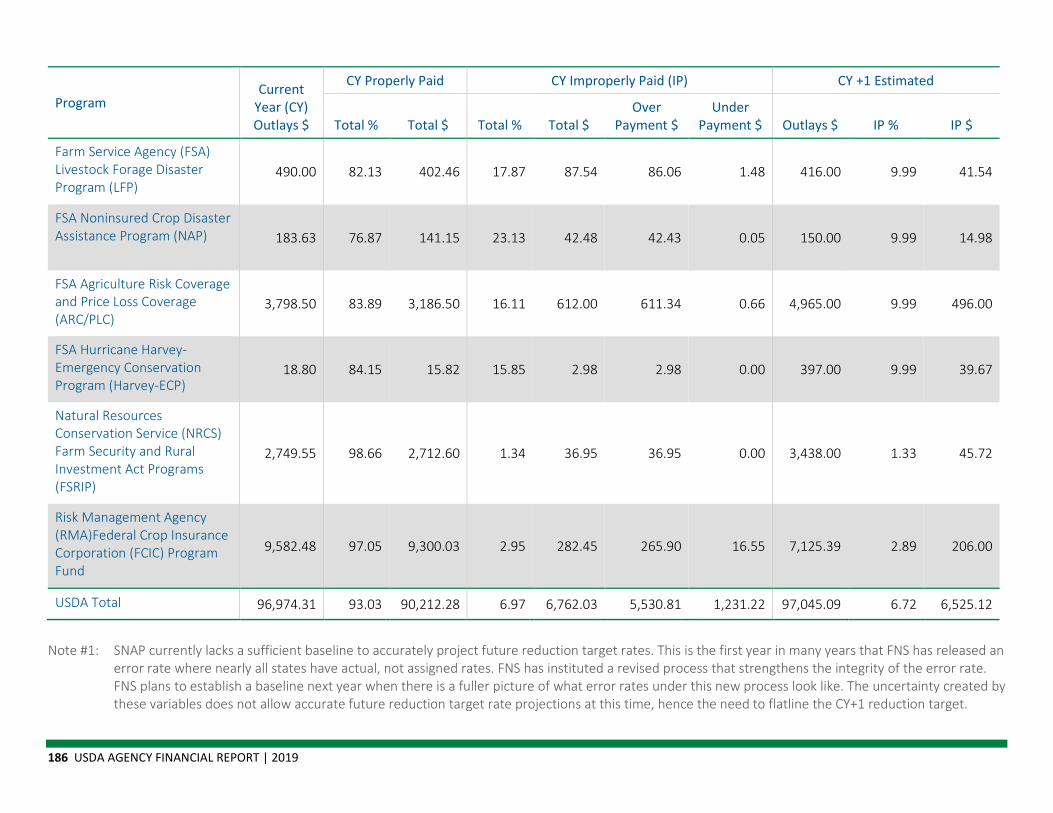
186 USDA AGENCY FINANCIAL REPORT | 2019
Program Current
Year (CY) Outlays $
CY Properly Paid CY Improperly Paid (IP) CY +1 Estimated
Total % Total $ Total % Total $ Over
Payment $ Under
Payment $ Outlays $ IP % IP $
Farm Service Agency (FSA) Livestock Forage Disaster Program (LFP)
490.00 82.13 402.46 17.87 87.54 86.06 1.48 416.00 9.99 41.54
FSA Noninsured Crop Disaster Assistance Program (NAP) 183.63 76.87 141.15 23.13 42.48 42.43 0.05 150.00 9.99 14.98
FSA Agriculture Risk Coverage and Price Loss Coverage (ARC/PLC)
3,798.50 83.89 3,186.50 16.11 612.00 611.34 0.66 4,965.00 9.99 496.00
FSA Hurricane Harvey-Emergency Conservation Program (Harvey-ECP)
18.80 84.15 15.82 15.85 2.98 2.98 0.00 397.00 9.99 39.67
Natural Resources Conservation Service (NRCS) Farm Security and Rural Investment Act Programs (FSRIP)
2,749.55 98.66 2,712.60 1.34 36.95 36.95 0.00 3,438.00 1.33 45.72
Risk Management Agency (RMA)Federal Crop Insurance Corporation (FCIC) Program Fund
9,582.48 97.05 9,300.03 2.95 282.45 265.90 16.55 7,125.39 2.89 206.00
USDA Total 96,974.31 93.03 90,212.28 6.97 6,762.03 5,530.81 1,231.22 97,045.09 6.72 6,525.12
Note #1: SNAP currently lacks a sufficient baseline to accurately project future reduction target rates. This is the first year in many years that FNS has released an
error rate where nearly all states have actual, not assigned rates. FNS has instituted a revised process that strengthens the integrity of the error rate. FNS plans to establish a baseline next year when there is a fuller picture of what error rates under this new process look like. The uncertainty created by these variables does not allow accurate future reduction target rate projections at this time, hence the need to flatline the CY+1 reduction target.
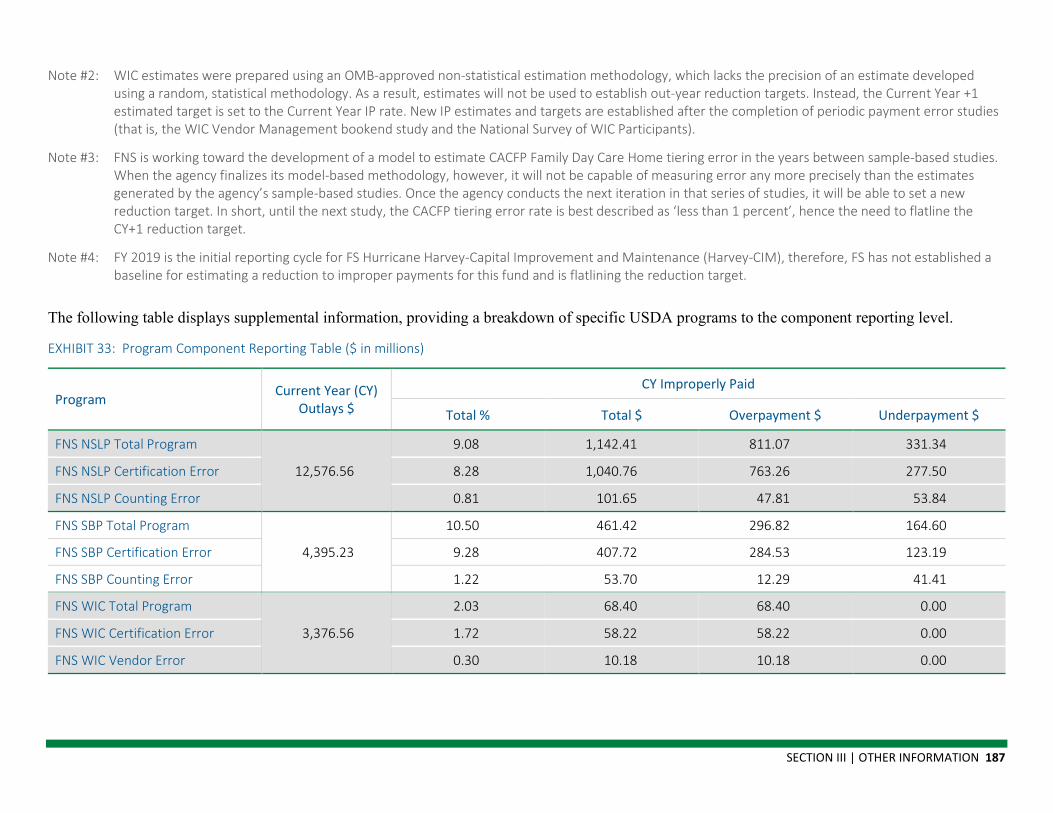
SECTION III | OTHER INFORMATION 187
Note #2: WIC estimates were prepared using an OMB-approved non-statistical estimation methodology, which lacks the precision of an estimate developed using a random, statistical methodology. As a result, estimates will not be used to establish out-year reduction targets. Instead, the Current Year +1 estimated target is set to the Current Year IP rate. New IP estimates and targets are established after the completion of periodic payment error studies (that is, the WIC Vendor Management bookend study and the National Survey of WIC Participants).
Note #3: FNS is working toward the development of a model to estimate CACFP Family Day Care Home tiering error in the years between sample-based studies. When the agency finalizes its model-based methodology, however, it will not be capable of measuring error any more precisely than the estimates generated by the agency’s sample-based studies. Once the agency conducts the next iteration in that series of studies, it will be able to set a new reduction target. In short, until the next study, the CACFP tiering error rate is best described as ‘less than 1 percent’, hence the need to flatline the CY+1 reduction target.
Note #4: FY 2019 is the initial reporting cycle for FS Hurricane Harvey-Capital Improvement and Maintenance (Harvey-CIM), therefore, FS has not established a baseline for estimating a reduction to improper payments for this fund and is flatlining the reduction target.
The following table displays supplemental information, providing a breakdown of specific USDA programs to the component reporting level.
EXHIBIT 33: Program Component Reporting Table ($ in millions)
Program Current Year (CY) Outlays $
CY Improperly Paid
Total % Total $ Overpayment $ Underpayment $
FNS NSLP Total Program
12,576.56
9.08 1,142.41 811.07 331.34
FNS NSLP Certification Error 8.28 1,040.76 763.26 277.50
FNS NSLP Counting Error 0.81 101.65 47.81 53.84
FNS SBP Total Program
4,395.23
10.50 461.42 296.82 164.60
FNS SBP Certification Error 9.28 407.72 284.53 123.19
FNS SBP Counting Error 1.22 53.70 12.29 41.41
FNS WIC Total Program
3,376.56
2.03 68.40 68.40 0.00
FNS WIC Certification Error 1.72 58.22 58.22 0.00
FNS WIC Vendor Error 0.30 10.18 10.18 0.00

188 USDA AGENCY FINANCIAL REPORT | 2019
The following table provides information on the estimated amount of improper payments made directly by the Government and the amount of improper payments made by recipients of federal money.
EXHIBIT 34: Improper Payment Additional Breakdown Table ($ in millions)
Program Federal Government Recipients of Federal Money
FNS SNAP 4,021.71
FNS NSLP 1,142.41
FNS SBP 461.42
FNS WIC 68.40
FNS CACFP 3.68
FS Harvey-CIM 0.006
FSA LFP 87.54
FSA NAP 42.48
FSA ARC/PLC 612.00
FSA Harvey-ECP 2.98
NRCS FSRIP 36.95
RMA FCIC 282.45
Total 781.96 5,980.07

SECTION III | OTHER INFORMATION 189
EXHIBIT 35: Monetary Loss Breakdown Table ($ in millions)
Monetary loss to the Federal Government is an amount that should have not been paid and, in theory, should/could be recovered. Non-Monetary loss to the Federal Government is either an underpayment or a payment to the right recipient for the correct amount where the payment process fails to follow applicable regulations and/or statutes. Unknown, also referred to as Insufficient Documentation to Determine, is the estimated amount within the improper payment estimate that could either be proper or improper, but the agency is unable to discern.
Program
Monetary Loss Non-Monetary Loss Unknown/Insufficient
Documentation to Determine
Total $ Total $ Total % Within Agency
Control $ Outside Agency
Control $ Total $ Total % Total $ Total %
FNS SNAP 3,306.08 82.21 3,306.08 715.63 17.79 4,021.71
FNS NSLP 811.07 71.00 811.07 331.34 29.00 1,142.41
FNS SBP 296.82 64.33 296.82 164.60 35.67 461.42
FNS WIC 68.40 100.00 68.40 0.00 0.00 68.40
FNS CACFP 2.77 75.27 2.77 0.91 24.73 3.68
FS Harvey-CIM 0.006 100.00 0.006 0.00 0.00 0.006
FSA LFP 33.20 37.93 33.20 1.48 1.69 52.86 60.38 87.54
FSA NAP 19.98 47.03 19.98 0.05 0.12 22.45 52.85 42.48
FSA ARC/PLC 257.16 42.02 257.16 0.66 0.11 354.18 57.87 612.00
FSA Harvey-ECP 2.19 73.49 2.19 0.00 0.00 0.79 26.51 2.98
NRCS FSRIP 21.07 57.02 21.07 15.88 42.98 36.95
RMA FCIC 265.90 94.14 265.90 16.55 5.86 282.45
190 USDA AGENCY FINANCIAL REPORT | 2019
High-Priority Programs Section The criteria for determining when a program is high-priority are found in Office of Management and Budget (OMB) Circular A-123, Appendix C. High-priority programs are programs that report more than the $2 billion threshold in improper payments. USDA currently has one program designated as high-priority and the following narrative addresses the additional reporting requirements that come with that designation.
FNS SNAP
▪ The following narrative describes how SNAP’s corrective actions were specifically tailored to better reflect the unique processes, procedures, and risks involved in the program. This program’s actual corrective actions to prevent future improper payments can be found in the “IMPROPER PAYMENT CORRECTIVE ACTIONS SECTION.”
o SNAP is a federally funded, State-administered program. FNS works with State agencies to improve program administration, including preventing improper payments. FNS offers State Exchange funds to promote communication and partnerships between high- and low-performing State agencies, providing low-performing State agencies access to best practices and support.
o States with high improper payment rates must submit corrective action plans that document how the State agency plans to improve payment accuracy and allow the corrective actions to be tailored to specific State needs and deficiencies.
▪ The following narrative describes the actions FNS has taken or plans to take to recover improper payments:
o States issue supplements or establish claims for any under/overpayments discovered during the QC review.
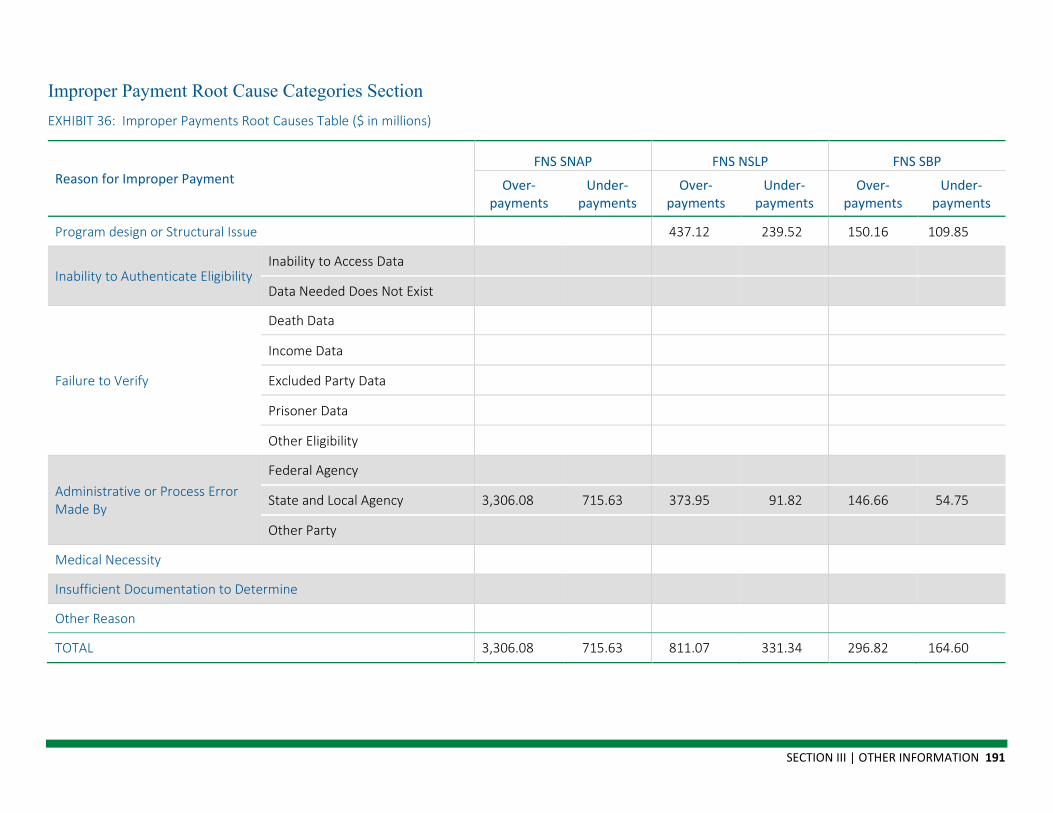
SECTION III | OTHER INFORMATION 191
Improper Payment Root Cause Categories Section EXHIBIT 36: Improper Payments Root Causes Table ($ in millions)
Reason for Improper Payment FNS SNAP FNS NSLP FNS SBP
Over-payments
Under-payments
Over-payments
Under-payments
Over-payments
Under-payments
Program design or Structural Issue 437.12 239.52 150.16 109.85
Inability to Authenticate Eligibility Inability to Access Data
Data Needed Does Not Exist
Failure to Verify
Death Data
Income Data
Excluded Party Data
Prisoner Data
Other Eligibility
Administrative or Process Error Made By
Federal Agency
State and Local Agency 3,306.08 715.63 373.95 91.82 146.66 54.75
Other Party
Medical Necessity
Insufficient Documentation to Determine
Other Reason
TOTAL 3,306.08 715.63 811.07 331.34 296.82 164.60

192 USDA AGENCY FINANCIAL REPORT | 2019
EXHIBIT 36: Improper Payments Root Causes Table ($ in millions) Continued
Reason for Improper Payment FNS WIC FNS CACFP FS Harvey-CIM
Over-payments
Under-payments
Over-payments
Under-payments
Over-payments
Under-payments
Program design or Structural Issue
Inability to Authenticate Eligibility Inability to Access Data
Data Needed Does Not Exist
Failure to Verify
Death Data
Income Data
Excluded Party Data
Prisoner Data
Other Eligibility
Administrative or Process Error Made By
Federal Agency 0.006
State and Local Agency 68.40 2.77 0.91
Other Party
Medical Necessity
Insufficient Documentation to Determine
Other Reason
TOTAL 68.40 2.77 0.91 0.006
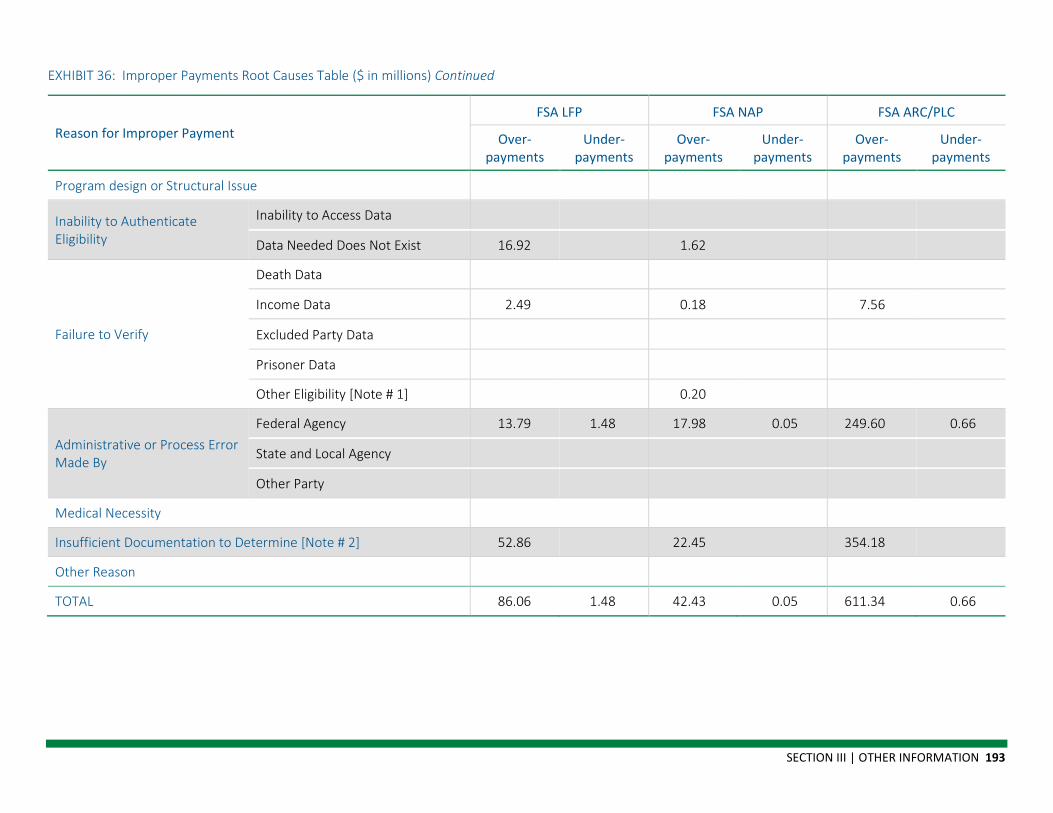
SECTION III | OTHER INFORMATION 193
EXHIBIT 36: Improper Payments Root Causes Table ($ in millions) Continued
Reason for Improper Payment FSA LFP FSA NAP FSA ARC/PLC
Over-payments
Under-payments
Over-payments
Under-payments
Over-payments
Under-payments
Program design or Structural Issue
Inability to Authenticate Eligibility
Inability to Access Data
Data Needed Does Not Exist 16.92 1.62
Failure to Verify
Death Data
Income Data 2.49 0.18 7.56
Excluded Party Data
Prisoner Data
Other Eligibility [Note # 1] 0.20
Administrative or Process Error Made By
Federal Agency 13.79 1.48 17.98 0.05 249.60 0.66
State and Local Agency
Other Party
Medical Necessity
Insufficient Documentation to Determine [Note # 2] 52.86 22.45 354.18
Other Reason
TOTAL 86.06 1.48 42.43 0.05 611.34 0.66
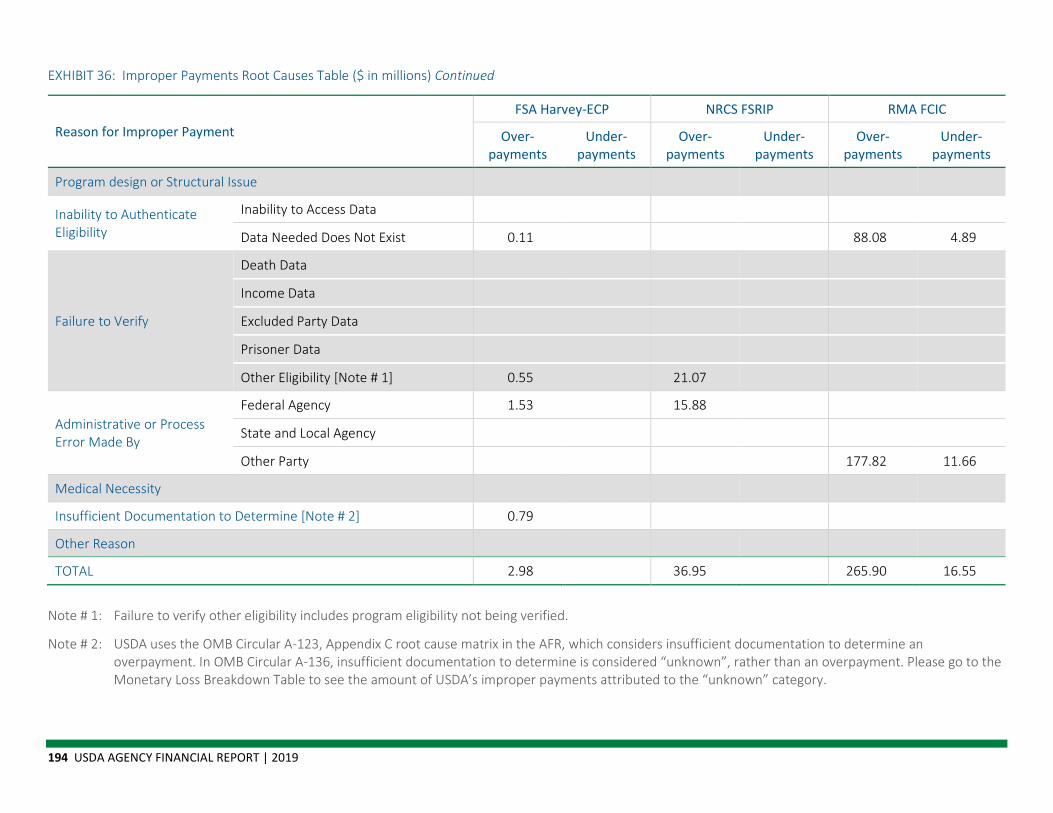
194 USDA AGENCY FINANCIAL REPORT | 2019
EXHIBIT 36: Improper Payments Root Causes Table ($ in millions) Continued
Reason for Improper Payment FSA Harvey-ECP NRCS FSRIP RMA FCIC
Over-payments
Under-payments
Over-payments
Under-payments
Over-payments
Under-payments
Program design or Structural Issue
Inability to Authenticate Eligibility
Inability to Access Data
Data Needed Does Not Exist 0.11 88.08 4.89
Failure to Verify
Death Data
Income Data
Excluded Party Data
Prisoner Data
Other Eligibility [Note # 1] 0.55 21.07
Administrative or Process Error Made By
Federal Agency 1.53 15.88
State and Local Agency
Other Party 177.82 11.66
Medical Necessity
Insufficient Documentation to Determine [Note # 2] 0.79
Other Reason
TOTAL 2.98 36.95 265.90 16.55
Note # 1: Failure to verify other eligibility includes program eligibility not being verified.
Note # 2: USDA uses the OMB Circular A-123, Appendix C root cause matrix in the AFR, which considers insufficient documentation to determine an overpayment. In OMB Circular A-136, insufficient documentation to determine is considered “unknown”, rather than an overpayment. Please go to the Monetary Loss Breakdown Table to see the amount of USDA’s improper payments attributed to the “unknown” category.
SECTION III | OTHER INFORMATION 195
Improper Payment Corrective Actions Section In the spring of 2019, USDA agencies analyzed transactions from previous years as described in the Agency Financial Report’s sampling section and the results are published in the FY 2019 AFR. Because USDA reports improper payments 1 year in arrears, corrective actions taken to reduce improper payments in FY 2019 have not been reflected in improper payment amounts of this report. USDA continues to enact specific corrective actions to resolve root causes of improper payments and strategically strengthen program integrity while ensuring access to program and activities.
Programs and activities determined to have improper payments exceeding the susceptible to significant improper payment threshold (as required by OMB Memorandum M-18-20) must put in place a corrective action plan to prevent and reduce the improper payment amount. The following tables describe the actions taken and planned for each high-risk program that is above the aforementioned reporting threshold. Beginning in FY 2019, USDA required high-risk programs reporting more than the statutory threshold to categorize improper payments into “sub root causes” which provide an additional breakdown of the OMB root causes of error. The goal of the sub root cause is to help USDA obtain a clearer understanding of what truly caused the improper payments to occur and assist with mitigating the error from reoccurring.
Current corrective action plans are outlined in this section of the AFR, except for the Farm Service Agency’s (FSA). The following corrective actions are current as of June 28, 2019, which is OCFO’s deadline to ensure timely reporting of the AFR. Corrective action plans for FSA’s high-risk programs reporting more than the statutory threshold can be found at www.fsa.usda.gov/corrective-action-plans.
OMB memorandum M-18-20, states: “Agencies should also describe the results of actions taken to address the root causes and the planned or actual completion date of the actions taken to address each root cause.” Some of the corrective actions offer an indication of the impact it will have on addressing a root cause; however, in most cases, a series of corrective actions have cumulative impacts in improving payment accuracy.

196 USDA AGENCY FINANCIAL REPORT | 2019
EXHIBIT 37: Program Corrective Actions Table ($ in millions)
PROGRAM: FNS SNAP
Root Cause (See Root Causes Table) Administrative or Process Error made by: State or Local Agency
USDA’s Sub Root Cause
Data needed to verify payment was missing from the case file and was not noticed by the employee. Employee did not check the invoice prior to issuing payment to ensure they matched.
Amount Associated with the Root Cause (See Root Causes Table) $4,021.71
Estimated Completion Date June 2020
Supplemental Nutrition Assistance Program (SNAP) Corrective Actions:
• FNS has a statutorily mandated liability system that sanctions States for poor performance and assesses financial liabilities for payment error rates in excess of the national average and that are above six percent. In July 2019, FNS issued over $26 million in sanctions to high-error states to ensure they are working diligently to improve accuracy. States must either pay the full amount immediately to the U.S. Treasury, or promptly reinvest half of these funds in FNS-approved actions to reduce errors, and pay the remainder if accuracy does not improve.
• FNS also has established a regulatory process for requiring States to implement robust corrective action plans to reduce payment errors. FNS requires States to submit corrective action plans for review and approval if any of the following conditions are met:
− The State’s payment error rate is six percent or greater, − The State’s negative error rate is above the national average, − Any deficiencies identified by a GAO, OIG, or FNS review or audit, − If five percent or more of the State’s QC caseload is marked as incomplete, − Any improper payments caused by State rules, practices, or procedures.
• FNS monitors State corrective action plans and provides technical assistance as necessary to help remedy deficiencies. FNS regulations require State corrective action plans to remain in effect until all deficiencies in program operations have been reduced substantially or eliminated.
• FNS operates a robust management evaluation process that regularly reviews State operations and compliance with Federal regulations. FNS issues reports that provide findings and outline management deficiencies which may lead to payment errors. States must enter into corrective actions to address deficiencies.
• FNS requires States to conduct a root cause analysis of what contributes to payment errors to aid in corrective action planning. FNS provides technical assistance to States that need help with their root cause analysis. SNAP’s quality control system codes errors to allow a root cause analysis in sufficient detail to identify whether the primary contributing factors are specific to policies or procedures; or whether they are statewide or limited in scope (such as concentrated in a single local office or county).
SECTION III | OTHER INFORMATION 197
PROGRAM: FNS SNAP (Continued)
• SNAP has an active payment accuracy workgroup that meets regularly to discuss the outcomes of on-going technical assistance and to share best practices among FNS Regional Offices to ensure a consistent approach with State partners.
• FNS has an internal process to categorize States to clearly identify those that pose the greatest risk for Federal dollar losses due to payment errors. This helps to ensure FNS technical assistance resources are targeted effectively. As part of this process, FNS uses an early warning system to monitor preliminary state reported data in order to identify deteriorating performance and to initiate actions to help States make improvements at the earliest opportunity.
• Nationally, 60 percent of SNAP’s payment errors are caused by State agencies. FNS works with States to strengthen the upfront eligibility determination process through system improvements, policy training, improved data matching and verification which are intended to reduce state caused errors.
− FNS providing $5 million in annual technology improvement grants to States to help update and strengthen systems. As an example, States are moving towards guided navigation to prompt accurate data entry or verification checks, as well as adding business rules based on policy, to reduce payment errors.
• Remaining 40 percent of payment errors are client caused. FNS works with States to improve client education efforts and the clarity of notices to ensure application and reporting instructions are clearly conveyed.
Client caused errors can often occur when requirements are not communicated clearly and clients do not easily understand what documentation they must submit in order to verify their application. In FY 2019, FNS conducted a pilot project with a few States in our Mountain Plains Regional Office to improve the readability and accuracy of notices issued to clients. Based on this pilot, FNS is expanding this project into ten additional States in FY 2020 in order to reduce client caused errors.
• In FY 2020, FNS expects to release proposed and interim-final regulations that seek to reform the SNAP QC system. The rule includes interim-final provisions from the 2018 Farm Bill that strengthen the integrity of the measurement system. The proposed provisions of the rule are intended to modernize the QC system to improve transparency, accuracy, and alignment with the expectations of IPIA and OMB circulars. FNS utilized comments received from the FY 2018 RFI to inform these changes.
• FNS continues to work with State partners to expand requirements for data matching and to ensure share best practices are disseminated as data matching is a proven strategy that can reduce payment errors. FNS currently requires States to conduct data matches prior to certification and recertification with Social Security Administration’s (SSA) Death Match, SSA’s Prisoner Verification System, the National Directory for New Hires, and FNS’s electronic Disqualified System. State partners also work with commercial data brokers to help verify identity, income, and assets; all of which can contribute to payment errors. Additionally, as part of the 2018 Farm Bill, FNS is currently working to expand the National Accuracy Clearinghouse (NAC) nationwide. The NAC was a successful pilot among five States that reduced instances of duplicate participation across State lines, where an individual applies to receive benefits in more than one State at the same time. The estimated completion date for this is FY 2021.
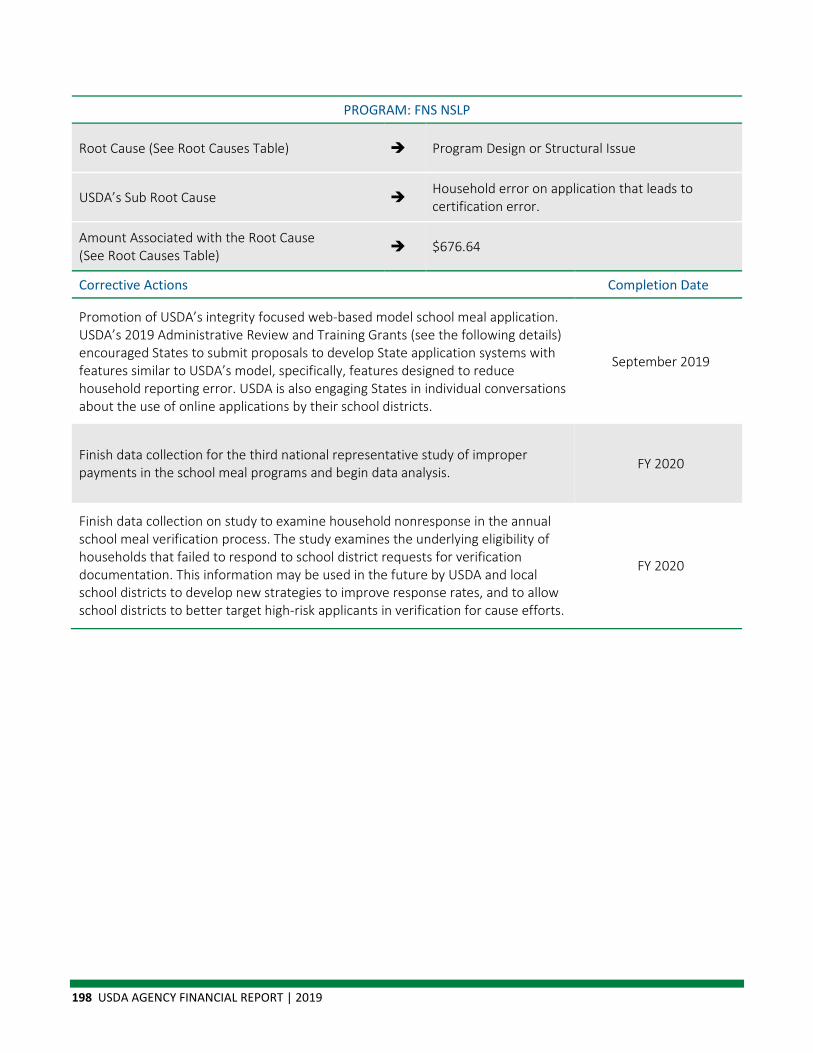
198 USDA AGENCY FINANCIAL REPORT | 2019
PROGRAM: FNS NSLP
Root Cause (See Root Causes Table) Program Design or Structural Issue
USDA’s Sub Root Cause Household error on application that leads to certification error.
Amount Associated with the Root Cause (See Root Causes Table) $676.64
Corrective Actions Completion Date
Promotion of USDA’s integrity focused web-based model school meal application. USDA’s 2019 Administrative Review and Training Grants (see the following details) encouraged States to submit proposals to develop State application systems with features similar to USDA’s model, specifically, features designed to reduce household reporting error. USDA is also engaging States in individual conversations about the use of online applications by their school districts.
September 2019
Finish data collection for the third national representative study of improper payments in the school meal programs and begin data analysis. FY 2020
Finish data collection on study to examine household nonresponse in the annual school meal verification process. The study examines the underlying eligibility of households that failed to respond to school district requests for verification documentation. This information may be used in the future by USDA and local school districts to develop new strategies to improve response rates, and to allow school districts to better target high-risk applicants in verification for cause efforts.
FY 2020

SECTION III | OTHER INFORMATION 199
PROGRAM: FNS NSLP
Root Cause (See Root Causes Table) Administrative or Process Errors Made by State or Local Agency
USDA’s Sub Root Cause Administrative certification error and error in aggregating meal counts for reimbursement.
Amount Associated with the Root Cause (See Root Causes Table) $465.77
Corrective Actions Completion Date
Updated Administrative Review (AR) guidance for SY 2019-2020. In Summer 2019, FNS will release a supplement to the AR guidance and provide information that primarily focuses on requirements that have changed as a result of recent regulations.
July 2019
Currently conducting a study, “The Assessment of the Administrative Review (AR) Process,” which examines the extent to which the AR process effectively identifies risk areas and non-compliance with program requirements by school food authorities operating the programs. USDA will use those results to consider updates to the process.
FY 2020
Conducted the sixth year of a demonstration project in selected school districts and States to test the potential for direct certification for free school meals using Medicaid data. USDA prepared reports of the first 2 years of the pilots in 2015 and 2016. The agency is in the process of finalizing an evaluation of the demonstration project since 2016.
FY 2021
Offer States Administrative Review and Training (ART) grants to implement training and technology solutions to reduce and prevent administrative errors in local educational agencies (LEAs) that are at high-risk for such errors. The latest round of ART grants was awarded in June 2019 to seven state agencies to study and/or develop web-based meal applications containing integrity features comparable with those in the USDA’s web-based prototype; technology-based training solutions; automating currently manual administrative review processes; and creating online menu and training portals.
September 2019
Continue to lead and coordinate meetings of the Child Nutrition State Systems Workgroup made up of USDA State, regional, and national office representatives. The purpose of this workgroup is to identify priorities for State and local automation to improve accountability, monitoring, training, and data quality. The workgroup is now planning the fifth in a series of State agency / USDA Child Nutrition Access and Accountability through Technology national training to be held in 2020. These trainings provide program stakeholders with an opportunity to identify innovative technology solutions to improve program integrity while expanding knowledge and skills in IT procurement and contract management, data analytics, and IT project management.
September 2019
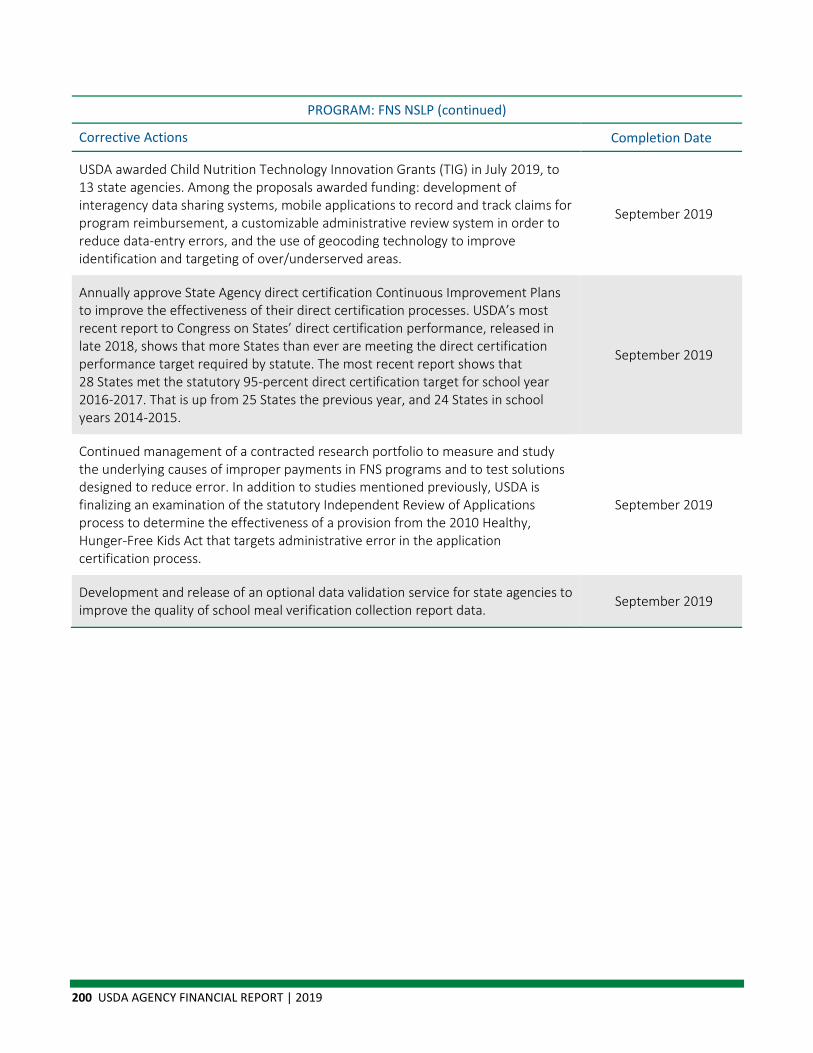
200 USDA AGENCY FINANCIAL REPORT | 2019
PROGRAM: FNS NSLP (continued)
Corrective Actions Completion Date
USDA awarded Child Nutrition Technology Innovation Grants (TIG) in July 2019, to 13 state agencies. Among the proposals awarded funding: development of interagency data sharing systems, mobile applications to record and track claims for program reimbursement, a customizable administrative review system in order to reduce data-entry errors, and the use of geocoding technology to improve identification and targeting of over/underserved areas.
September 2019
Annually approve State Agency direct certification Continuous Improvement Plans to improve the effectiveness of their direct certification processes. USDA’s most recent report to Congress on States’ direct certification performance, released in late 2018, shows that more States than ever are meeting the direct certification performance target required by statute. The most recent report shows that 28 States met the statutory 95-percent direct certification target for school year 2016-2017. That is up from 25 States the previous year, and 24 States in school years 2014-2015.
September 2019
Continued management of a contracted research portfolio to measure and study the underlying causes of improper payments in FNS programs and to test solutions designed to reduce error. In addition to studies mentioned previously, USDA is finalizing an examination of the statutory Independent Review of Applications process to determine the effectiveness of a provision from the 2010 Healthy, Hunger-Free Kids Act that targets administrative error in the application certification process.
September 2019
Development and release of an optional data validation service for state agencies to improve the quality of school meal verification collection report data. September 2019
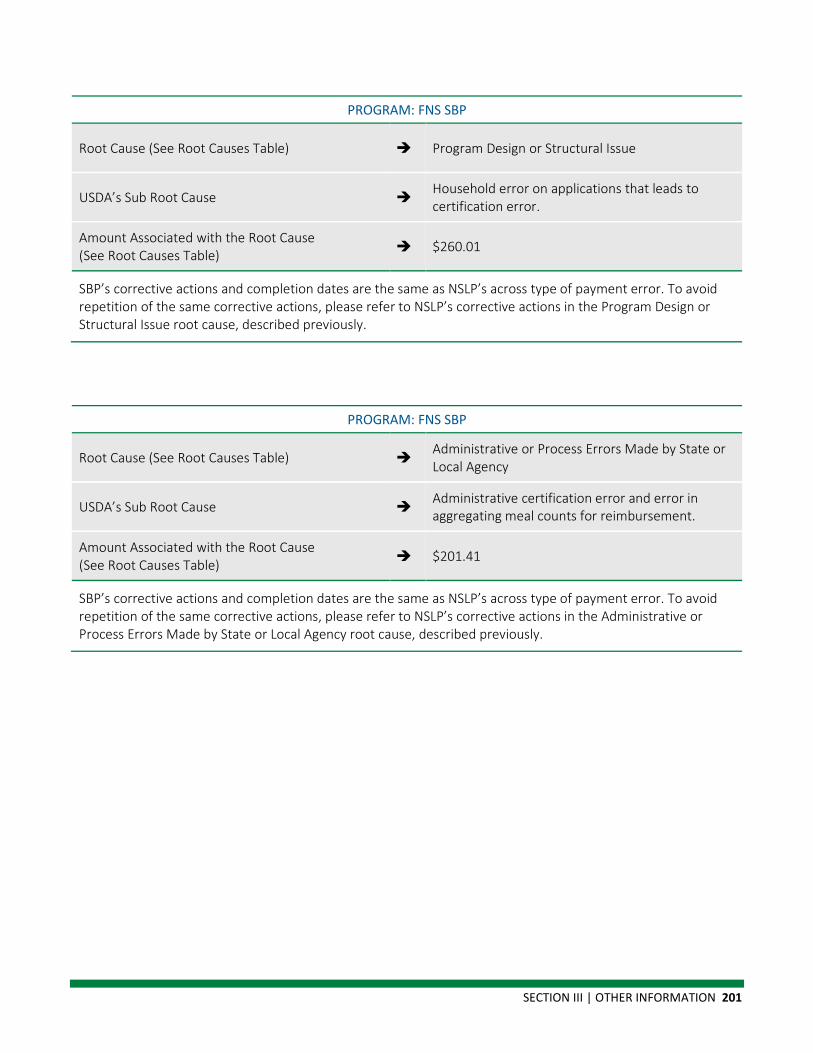
SECTION III | OTHER INFORMATION 201
PROGRAM: FNS SBP
Root Cause (See Root Causes Table) Program Design or Structural Issue
USDA’s Sub Root Cause Household error on applications that leads to certification error.
Amount Associated with the Root Cause (See Root Causes Table) $260.01
SBP’s corrective actions and completion dates are the same as NSLP’s across type of payment error. To avoid repetition of the same corrective actions, please refer to NSLP’s corrective actions in the Program Design or Structural Issue root cause, described previously.
PROGRAM: FNS SBP
Root Cause (See Root Causes Table) Administrative or Process Errors Made by State or Local Agency
USDA’s Sub Root Cause Administrative certification error and error in aggregating meal counts for reimbursement.
Amount Associated with the Root Cause (See Root Causes Table) $201.41
SBP’s corrective actions and completion dates are the same as NSLP’s across type of payment error. To avoid repetition of the same corrective actions, please refer to NSLP’s corrective actions in the Administrative or Process Errors Made by State or Local Agency root cause, described previously.
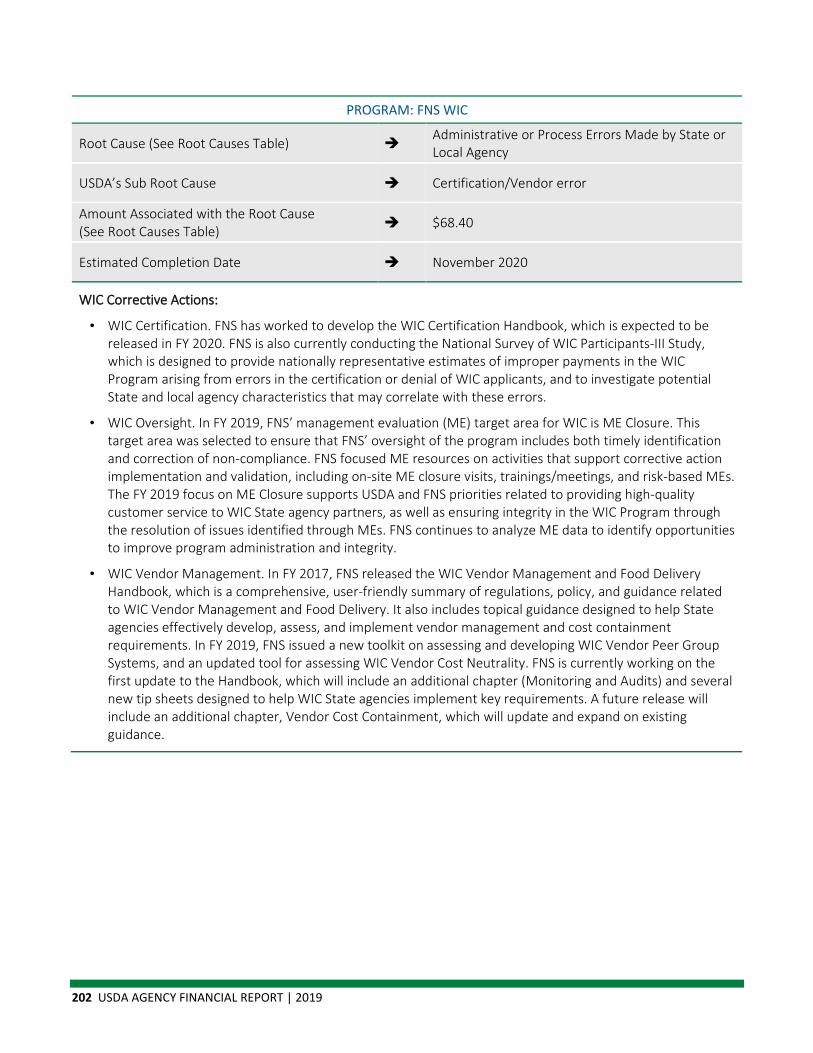
202 USDA AGENCY FINANCIAL REPORT | 2019
PROGRAM: FNS WIC
Root Cause (See Root Causes Table) Administrative or Process Errors Made by State or Local Agency
USDA’s Sub Root Cause Certification/Vendor error
Amount Associated with the Root Cause (See Root Causes Table) $68.40
Estimated Completion Date November 2020
WIC Corrective Actions:
• WIC Certification. FNS has worked to develop the WIC Certification Handbook, which is expected to be released in FY 2020. FNS is also currently conducting the National Survey of WIC Participants-III Study, which is designed to provide nationally representative estimates of improper payments in the WIC Program arising from errors in the certification or denial of WIC applicants, and to investigate potential State and local agency characteristics that may correlate with these errors.
• WIC Oversight. In FY 2019, FNS’ management evaluation (ME) target area for WIC is ME Closure. This target area was selected to ensure that FNS’ oversight of the program includes both timely identification and correction of non-compliance. FNS focused ME resources on activities that support corrective action implementation and validation, including on-site ME closure visits, trainings/meetings, and risk-based MEs. The FY 2019 focus on ME Closure supports USDA and FNS priorities related to providing high-quality customer service to WIC State agency partners, as well as ensuring integrity in the WIC Program through the resolution of issues identified through MEs. FNS continues to analyze ME data to identify opportunities to improve program administration and integrity.
• WIC Vendor Management. In FY 2017, FNS released the WIC Vendor Management and Food Delivery Handbook, which is a comprehensive, user-friendly summary of regulations, policy, and guidance related to WIC Vendor Management and Food Delivery. It also includes topical guidance designed to help State agencies effectively develop, assess, and implement vendor management and cost containment requirements. In FY 2019, FNS issued a new toolkit on assessing and developing WIC Vendor Peer Group Systems, and an updated tool for assessing WIC Vendor Cost Neutrality. FNS is currently working on the first update to the Handbook, which will include an additional chapter (Monitoring and Audits) and several new tip sheets designed to help WIC State agencies implement key requirements. A future release will include an additional chapter, Vendor Cost Containment, which will update and expand on existing guidance.
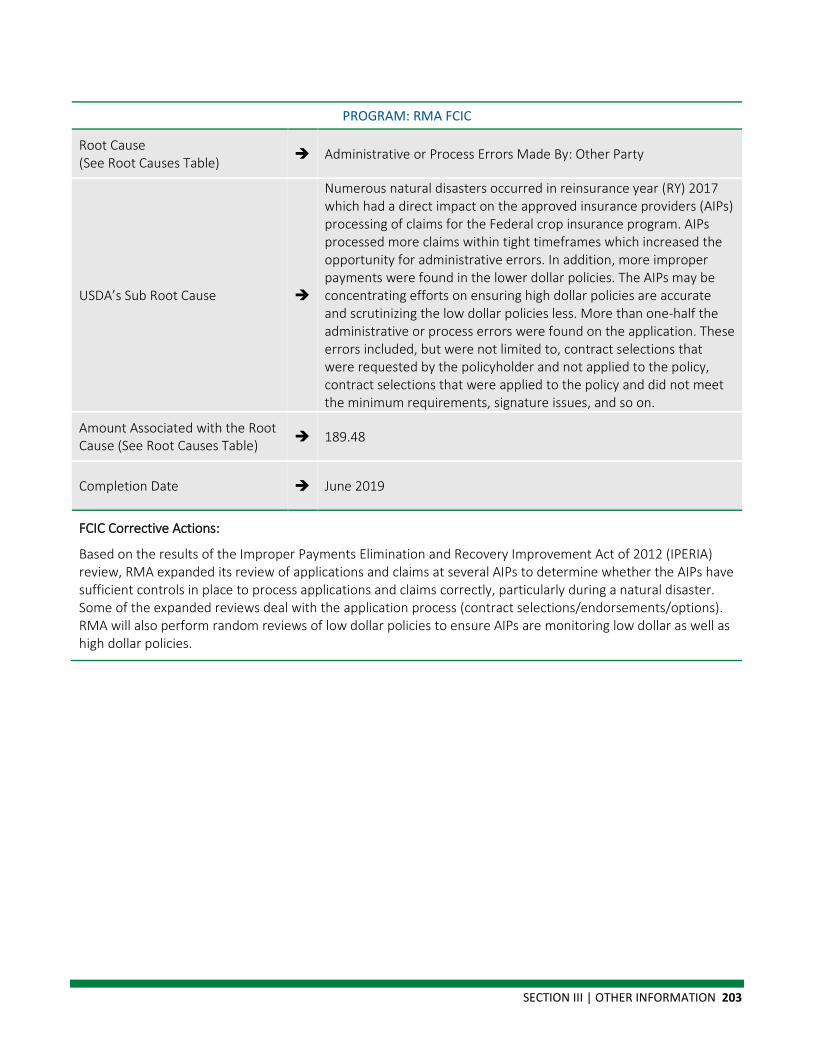
SECTION III | OTHER INFORMATION 203
PROGRAM: RMA FCIC
Root Cause (See Root Causes Table) Administrative or Process Errors Made By: Other Party
USDA’s Sub Root Cause
Numerous natural disasters occurred in reinsurance year (RY) 2017 which had a direct impact on the approved insurance providers (AIPs) processing of claims for the Federal crop insurance program. AIPs processed more claims within tight timeframes which increased the opportunity for administrative errors. In addition, more improper payments were found in the lower dollar policies. The AIPs may be concentrating efforts on ensuring high dollar policies are accurate and scrutinizing the low dollar policies less. More than one-half the administrative or process errors were found on the application. These errors included, but were not limited to, contract selections that were requested by the policyholder and not applied to the policy, contract selections that were applied to the policy and did not meet the minimum requirements, signature issues, and so on.
Amount Associated with the Root Cause (See Root Causes Table) 189.48
Completion Date June 2019
FCIC Corrective Actions:
Based on the results of the Improper Payments Elimination and Recovery Improvement Act of 2012 (IPERIA) review, RMA expanded its review of applications and claims at several AIPs to determine whether the AIPs have sufficient controls in place to process applications and claims correctly, particularly during a natural disaster. Some of the expanded reviews deal with the application process (contract selections/endorsements/options). RMA will also perform random reviews of low dollar policies to ensure AIPs are monitoring low dollar as well as high dollar policies.
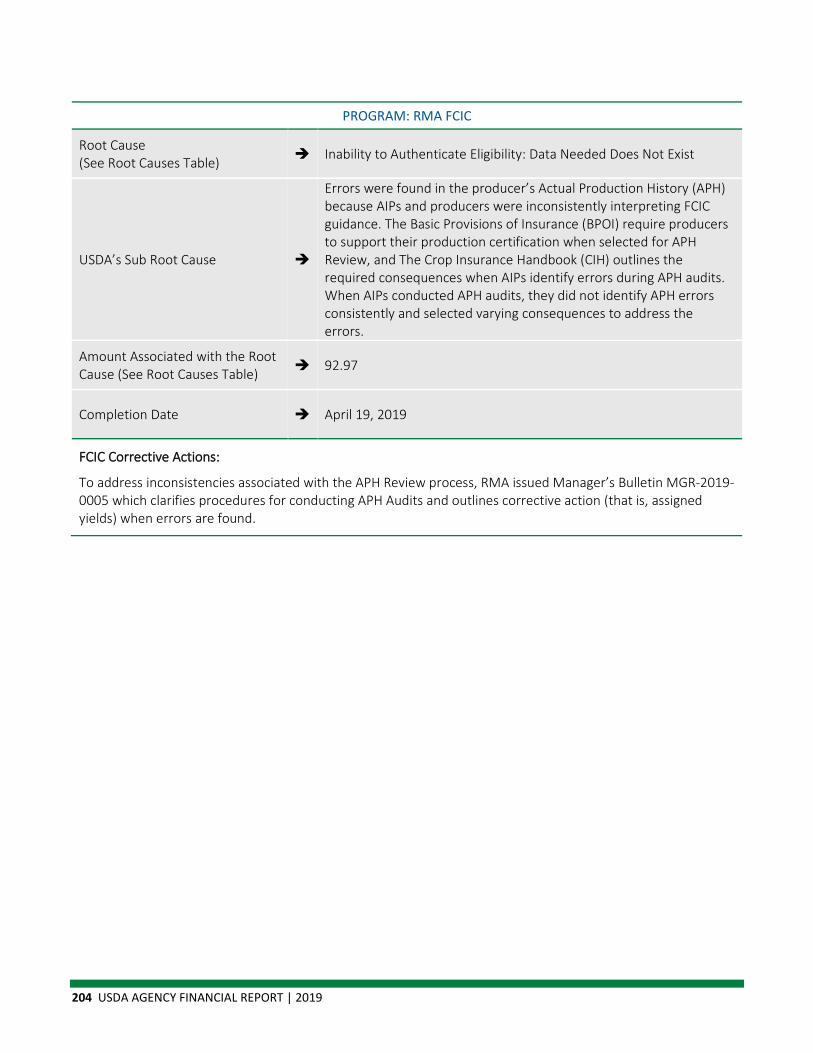
204 USDA AGENCY FINANCIAL REPORT | 2019
PROGRAM: RMA FCIC
Root Cause (See Root Causes Table) Inability to Authenticate Eligibility: Data Needed Does Not Exist
USDA’s Sub Root Cause
Errors were found in the producer’s Actual Production History (APH) because AIPs and producers were inconsistently interpreting FCIC guidance. The Basic Provisions of Insurance (BPOI) require producers to support their production certification when selected for APH Review, and The Crop Insurance Handbook (CIH) outlines the required consequences when AIPs identify errors during APH audits. When AIPs conducted APH audits, they did not identify APH errors consistently and selected varying consequences to address the errors.
Amount Associated with the Root Cause (See Root Causes Table) 92.97
Completion Date April 19, 2019
FCIC Corrective Actions:
To address inconsistencies associated with the APH Review process, RMA issued Manager’s Bulletin MGR-2019-0005 which clarifies procedures for conducting APH Audits and outlines corrective action (that is, assigned yields) when errors are found.
SECTION III | OTHER INFORMATION 205
Internal Control Over Payment Integrity Section USDA programs have implemented internal controls to prevent improper payments. USDA programs are:
▪ Enhancing communication of updated policies and guidance to the field offices;
▪ Encouraging managers to build an atmosphere in which reducing improper payments is a top priority;
▪ Establishing accountability through performance standards;
▪ Examining root causes of error;
▪ Developing appropriate corrective actions; and
▪ Engaging critical stakeholders through communication and educational efforts.
Accountability Section Programs reporting more than the statutory improper payment threshold (per OMB Memorandum M-18-20) must complete the Accountability, Agency Information Systems and Other Infrastructures, and Barriers sections of the AFR. The following steps were taken to ensure that agency managers are held accountable for reducing and recovering improper payments:
Food and Nutrition Service (FNS)
These accountability mechanisms are applicable to the following programs: (1) Supplemental Nutrition Assistance Program (SNAP), (2) National School Lunch Program (NSLP), (3) School Breakfast Program (SBP), and (4) Special Supplemental Nutrition Program for Women, Infants, and Children (WIC):
FNS’ goals and priorities include standards for meeting reduction targets, establishing and maintaining internal controls, improving stewardship of federal funds, and using data-driven strategies to improve program integrity. Within these priorities are specific goals that (1) apply to programs at high-risk for erroneous payments with a focus on continuing management improvements, and (2) strengthening controls over improper payments and financial management within FNS programs. Standards for meeting these targets are incorporated into each FNS manager’s performance plan.
FNS strives to improve nutrition assistance program management, including measures to improve the accuracy of administrative processes, while meeting its goal of providing food to vulnerable populations in the United States. Actions to advance this goal include setting annual priority goals and initiatives, especially for those programs that are at high-risk for erroneous payments. The WIC Program also works to strengthen controls over improper payments and financial management as part of FNS’ Agency Priority Plan.
206 USDA AGENCY FINANCIAL REPORT | 2019
Farm Service Agency (FSA)
These accountability mechanisms are applicable to the following programs: (1) Hurricane Harvey-Emergency Conservation Program, (2) Livestock Forage Disaster Program, (3) Noninsured Crop Disaster Assistance Program, and (4) Agriculture Risk Coverage and Price Loss Coverage.
The following steps were taken to ensure that agency managers are held accountable for reducing and recovering improper payments:
FSA is creating a performance Oversight Review process will be used to improve individual and organizational effectiveness in accomplishing the Agency’s mission and goals. Although lacking in the past, improvement is possible with documentation of individual and organizational performance which enables management to hold poor performing employees accountable and award and recognize good performing employees. FSA is initiating a new Oversight Review Process that requires the scoring of states and counties as a result of national and State program reviews. Training of pilot States is scheduled for December 10 – 11 and the remaining States will be trained in March of 2020. This new process is scheduled to be fully functioning and documenting performance on July 1, 2020.
The COSO Model of Three Lines of Defense model defines three lines of defense in doing integrity oversight. In the current policy FSA will be completing the first two line of defense, the second line of defense being our new oversight review process. The FPAC Business Center Performance, Accountability and Risk Division will be completing the third line of defense on behalf of FSA.
The following steps were completed by September 2019 and are ongoing:
1. The requirement to improve improper payments is included in the State Executive Director’s Performance Plan, Element 5, titled “Program Management.”
2. Within the time constraints required by the Department, National Office and State Office (STO) managers are held accountable for ensuring that program policies and procedures are provided to the STO and County Office (COF) employees accurately and on a timely basis. National Office managers are also held accountable, as reflected in the performance-based rating measures, for overall program administration at the National level.
3. COF employees, including the County Executive Director, are responsible for making payments to producers and following all administrative steps in doing so. Employees will be evaluated on program delivery and their compliance with regulations, policies, and procedures through their performance plans.
4. Deputy Administrator of Field Operations will facilitate meetings with the program areas to discuss any additional action necessary for senior management to address accountability as accountability issues arise. Such is the case with an ongoing OIG investigation resulting in fraudulent claims and employee involvement where fraud has been discovered.
SECTION III | OTHER INFORMATION 207
Agency Information Systems and Other Infrastructure
FSA has operated with the understanding that the internal controls, human capital, information systems, and other infrastructure needed to reduce improper payments is in place and active. With the most recent results from the IPIA reviews and with the Agricultural Adjustment Act of 2018 paragraph 1705 language FSA is implementing a new Oversight Review process that will document the reviews of employees work nationwide. With this performance documentation in place, organizational performance will improve.
In addition, FSA is requesting funding to address NAP’s most frequent improper payment errors. The plan is to provide training to Alabama, Florida, and Georgia. Within these States is an area with NAP’s highest improper payment percentage. The region has good NAP participation and a wide variety of crops, including hand-harvested crops which can deteriorate quickly and may have multiple planting periods. Included in the request is training for Texas, which has a large NAP influence and their error rate has recently become a concern.
In accordance with Office of the Chief Financial Officer’s (OCFO) guidance, FSA will follow the normal budgetary processes within USDA and work with the Office of Budget and Program Analysis along with Budget personnel to seek departmental approval for funds to assist in resolving the non-compliance issues related to Noninsured Crop Disaster Assistance Program.
Risk Management Agency (RMA)
These accountability mechanisms are applicable to the following program: Federal Crop Insurance Corporation (FCIC):
1. RMA senior accountable officials’ annual performance plans are tied to USDA’s Strategic Goal 2.1: Provide an effective financial safety net for farmers and ranchers to sustain economically viable agricultural production and support rural jobs and economic growth.
2. RMA incorporated standards in the FY 2019 annual performance plans to ensure compliance personnel conduct IPERIA reviews to measure the Federal Crop Insurance Program (FCIP) improper payment error rate and perform data mining reviews to identify, reduce, and collect improper payments. RMA Regional Compliance Offices (RCOs) conducted IPERIA reviews between April 2018–March 2019 using statistical sampling and data mining reports.
208 USDA AGENCY FINANCIAL REPORT | 2019
Agency Information Systems and Other Infrastructure The following narratives describe whether an agency has internal controls, human capital, information systems, and other infrastructure it needs to reduce improper payments:
FNS
The following agency information systems and other infrastructure mechanisms are applicable to the following program: Supplemental Nutrition Assistance Program:
Each fiscal year, the Food and Nutrition Service (FNS) determines the Supplemental Nutrition Assistance Program’s (SNAP) State and national error rates and any potential liabilities based on error rate performance. States that have a 95-percent statistical probability that their error rates exceed 105 percent of the national performance measure for two (2) consecutive fiscal years, and the State’s error rate is above 6 percent are subject to financial liabilities for poor performance.
The following agency information systems and other infrastructure mechanisms are applicable to the following programs: (1) National School Lunch Program (NSLP), and (2) School Breakfast Program (SBP):
NSLP and SBP do not have an administrative infrastructure for producing yearly estimates of improper payment rates and dollar values. Therefore, FNS uses its Access, Participation, Eligibility, and Certification (APEC) studies to provide baseline error rate estimates for NSLP and SBP. In non-study years, FNS provides annual estimates that use the baseline data from APEC, program administrative data, and macroeconomic indicators. Periodic updates to the APEC study series ensure that FNS has the necessary data to estimate and measure changes in erroneous payments over time.
The FNS FY 2019 Budget requested an increase in funding for the following program integrity line items to establish and maintain effective internal controls to reduce improper payments.
Child Nutrition (CN) Training and Technical Assistance—an increase of $233,000 was requested ($13,702,000 available for FY 2018). Effective and continual training and technical assistance are necessary to help States properly administer the CN program to ensure that States are equipped to identify and prevent fraud and abuse. This request reflects an increase in federal activity associated with this project, including implementation of the new requirements.
CN Payment Accuracy—an increase of $187,000 was requested ($11,016,000 available for FY 2018). Federal oversight, monitoring, and technical assistance are essential to the identification, prevention, and resolution of erroneous payments. This request supports FNS’s efforts to reduce erroneous payments through training, technical assistance, and oversight.
CN Studies—an increase of $362,000 was requested ($21,277,000 was estimated to be available for FY 2018). CN studies are essential to providing Congress, the States, and advocacy partners with critical information for the development of additional guidance, training, and policy options.
SECTION III | OTHER INFORMATION 209
CN Administrative Reviews—$10 million was provided for training and technical assistance for State agencies responsible for reviewing local school food authorities that participate in the school meal programs. Local administrative reviews help ensure that school children are offered meals that meet regulatory standards and that the financial claims associated with those meals are appropriate.
The following agency information systems and other infrastructure mechanisms are applicable to the following programs: Child and Adult Care Food Program:
CACFP does not have an infrastructure or methods for producing yearly estimates of improper payment rates and dollar values. FNS has developed a measurement methodology for one component of the program and is in the process of determining the feasibility of measuring errors in the remaining components. Because requirements vary significantly for each different type of program sponsor and site, a full and rigorous assessment of the rate of improper payments is extremely complex.
FNS continues to explore alternative methodologies for developing a reliable measurement for the Family Day Care Home meal claims component and has recently completed data collection on the latest study in this effort. FNS has also completed data collection on a study to measure program error in childcare centers. Publication of these two studies is expected in 2020.
The following agency information systems and other infrastructure mechanisms are applicable to the following programs: Special Supplemental Nutrition Program for Women, Infants, and Children (WIC):
WIC program integrity is a priority for FNS. FNS has the administrative infrastructure for meeting reduction targets, establishing and maintaining sufficient internal controls, and producing yearly estimates of WIC improper payment rates and dollar values. Management evaluations (MEs) are FNS’ primary oversight mechanism. MEs include onsite reviews of State and local agency operations, and reviews of program-specific documentation. FNS focuses WIC MEs on key areas related to program integrity and analyzes the resulting ME data to identify opportunities to improve program administration and integrity. FNS has also recently released several resources for WIC State agencies that target improvement in the areas of vendor management and certification. These resources include the WIC Vendor Management and Food Delivery Handbook, a new toolkit on assessing and developing WIC Vendor Peer Group Systems, and an updated tool for assessing WIC Vendor Cost Neutrality. FNS has also issued policy memoranda related to key certification topics and has worked to develop the WIC Certification and Eligibility Guide, which is expected to be released in FY 2020. Additional resources are developed as needed.
The most cost-effective way for FNS to produce yearly estimates of WIC improper payments is by using periodic studies to estimate WIC certification and vendor payment errors. FNS uses the National Survey of WIC Participants and the WIC Vendor Management Study to estimate and report on payment errors. The results of these studies are also used to inform FNS’ program integrity work—including the development of additional guidance, training, and resources for WIC State agencies—and to provide information to Congress and other stakeholders.
210 USDA AGENCY FINANCIAL REPORT | 2019
Additionally, FNS continues to look for innovative ways to leverage technology to improve WIC program integrity. FNS is working with WIC State agencies to implement WIC Electronic Benefit Transfer (EBT) nationwide by October 1, 2020. EBT provides WIC State agencies with more accurate and timely data that they can use to better monitor food costs and identify suspect transactions, in turn, reducing the risk of payment errors.
FSA
The following agency information systems and other infrastructure mechanisms are applicable to the following programs: (1) Hurricane Harvey-Emergency Conservation Program, (2) Livestock Forage Disaster Program, (3) Noninsured Crop Disaster Assistance Program, and (4) Agriculture Risk Coverage and Price Loss Coverage:
FSA has operated with the understanding that the internal controls, human capital, information systems, and other infrastructure needed to reduce improper payments is in place and active. With the most recent results from the IPIA reviews and with the Agricultural Adjustment Act of 2018 paragraph 1705 language FSA is implementing a new Oversight Review process that will document the reviews of employees work nationwide. With this performance documentation in place, organizational performance will improve.
In addition, FSA is requesting funding to address NAP’s most frequent improper payment errors. The plan is to provide training to Alabama, Florida, and Georgia. Within these States is an area with NAP’s highest improper payment percentage. The region has good NAP participation and a wide variety of crops, including hand-harvested crops which can deteriorate quickly and may have multiple planting periods. Included in the request is training for Texas, which has a large NAP influence and their error rate has recently become a concern.
In accordance with Office of the Chief Financial Officer’s (OCFO) guidance, FSA will follow the normal budgetary processes within USDA and work with the Office of Budget and Program Analysis along with Budget personnel to seek departmental approval for funds to assist in resolving the non-compliance issues related to Noninsured Crop Disaster Assistance Program.
RMA
The following agency information systems and other infrastructure mechanisms are applicable to the following program: Federal Crop Insurance Corporation (FCIC):
One of RMA’s primary tools for assessing approved insurance providers’ (AIPs) compliance with all crop insurance program requirements is the AIP Performance Review (APR). During Fiscal Year 2019, RMA completed APRs of five AIPs to evaluate their internal controls to identify and address program vulnerabilities.
Discretionary Funding including Salaries and Expenses (S&E): Discretionary funds for the Federal crop insurance program cover most of the federal salaries and related expenses to manage the program. The 2019 Budget includes about $58.36 million in discretionary appropriations for these

SECTION III | OTHER INFORMATION 211
costs in which $1,000 of those funds shall be available for official reception and representation expenses. In addition, the Federal Crop Insurance Act authorizes the transfer of up to $7 million each fiscal year from mandatory funding to the RMA S&E account for program compliance and integrity reviews.
Barriers Section The following narratives describe any statutory or regulatory barriers that may limit the agency’s corrective actions in reducing improper payments and actions taken by the agency to mitigate the barriers’ effects:
FNS8
The following barriers are applicable to the following program: Supplemental Nutrition Assistance Program (SNAP):
SNAP benefits are processed and administered by State agencies, with FNS oversight. The Food and Nutrition Act of 2008, as amended, provides disincentives in the form of financial penalties to encourage States to accurately issue SNAP benefits and maintain low improper payment rates. FNS provides oversight and technical assistance to States in measuring and reporting improper payments. Because FNS does not provide benefits directly to recipients, the Program must work through its State administering agencies to measure, monitor, and address improper payments. In recent years, FNS has made efforts to strengthen program integrity regarding improper payment measurement. It has instituted new procedures to strengthen monitoring and has conducted reviews of all State agency error rate measurements to identify areas for improvement and require corrective action for States where data collection issues were identified.
The following barriers are applicable to the following programs: (1) National School Lunch Program (NSLP) and (2) School Breakfast Program (SBP):
FNS is committed to ensuring that eligible individuals and families have access to the nutrition assistance they need while it works to reduce the risk of improper payments. That said, program administration in CN programs in general, and in NSLP and SBP in particular, is highly decentralized. In the school meal programs alone there are nearly 98,000 schools and institutions that serve meals to 30 million children and each one of those meals must follow meal pattern requirements.
The entire cost of program benefits and a significant portion of administrative expenses incurred by State agencies are funded by federal appropriations. While federal funding strengthens the nutrition safety net with national eligibility standards and rules to ensure program access, it also means that
8 FNS’ Special Supplemental Nutrition Program for Women, Infants, and Children currently has no statutory or
regulatory barriers that limit the agency’s corrective actions in reducing improper payments.
212 USDA AGENCY FINANCIAL REPORT | 2019
USDA relies on States and localities to ensure the proper management of billions of dollars in federal funds.
Approaches to reducing school meals improper payments must:
1. Improve accuracy without compromising access for low-income families. A process that keeps eligible children from participating undermines the program;
2. Not unduly increase the burden on schools and other partner institutions. Many schools consider the program, especially the reporting requirements, burdensome now. Adding burden could discourage schools from participating, decreasing access for some low-income children; and
3. Be cost-effective. Improving accuracy is potentially resource-intensive, and policymakers must not create processes that increase net program costs.
The following barriers are applicable to the following programs: Child and Adult Care Food Program (CACFP):
FNS is committed to ensuring that eligible individuals and families have access to the nutrition assistance they need in their child and adult care food programs while still working to reduce the risk of improper payments. The decentralized nature of CACFP is similar to the school meal programs in that there are more than 66,000 child care centers, 670 Family Day Care Home (FDCH) sponsoring organizations, and approximately 97,000 FDCH providers that provide CACFP benefits to children. The vast majority of these organizations simply do not have the capacity to develop robust accountability processes, which puts a special burden on Federal and State oversight and technical assistance systems.
The approach to reducing CACFP improper payments is similar to that identified for school meals:
1. Improve accuracy without compromising access for low-income families; and
2. Not unduly increase the burden on sponsors, daycare centers, family daycare homes, and other partner institutions.
Adopt integrity-focused measures that are cost-effective. This approach is especially important in child and adult care settings that have particularly limited resources.
FSA
The following barriers are applicable to the following programs: (1) Hurricane Harvey-Emergency Conservation Program, (2), Livestock Forage Disaster Program, (3) Noninsured Crop Disaster Assistance Program, and (4) Agriculture Risk Coverage and Price Loss Coverage:
The FSA is charged with managing more programmatic work resulting in more complex program oversight than in prior years. With the reductions in staffing our capacity to do integrity reviews has diminished.
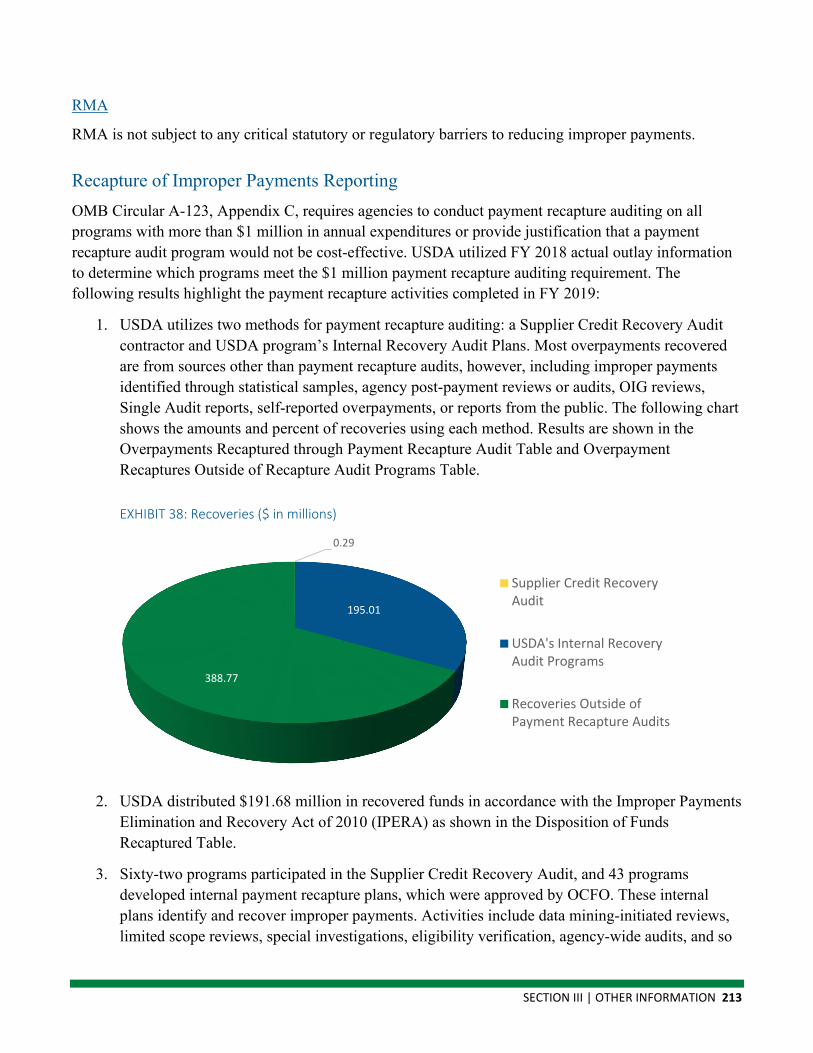
SECTION III | OTHER INFORMATION 213
RMA
RMA is not subject to any critical statutory or regulatory barriers to reducing improper payments.
Recapture of Improper Payments Reporting OMB Circular A-123, Appendix C, requires agencies to conduct payment recapture auditing on all programs with more than $1 million in annual expenditures or provide justification that a payment recapture audit program would not be cost-effective. USDA utilized FY 2018 actual outlay information to determine which programs meet the $1 million payment recapture auditing requirement. The following results highlight the payment recapture activities completed in FY 2019:
1. USDA utilizes two methods for payment recapture auditing: a Supplier Credit Recovery Audit contractor and USDA program’s Internal Recovery Audit Plans. Most overpayments recovered are from sources other than payment recapture audits, however, including improper payments identified through statistical samples, agency post-payment reviews or audits, OIG reviews, Single Audit reports, self-reported overpayments, or reports from the public. The following chart shows the amounts and percent of recoveries using each method. Results are shown in the Overpayments Recaptured through Payment Recapture Audit Table and Overpayment Recaptures Outside of Recapture Audit Programs Table.
EXHIBIT 38: Recoveries ($ in millions)
0.29
195.01
388.77
Supplier Credit RecoveryAudit
USDA's Internal RecoveryAudit Programs
Recoveries Outside ofPayment Recapture Audits
2. USDA distributed $191.68 million in recovered funds in accordance with the Improper Payments Elimination and Recovery Act of 2010 (IPERA) as shown in the Disposition of Funds Recaptured Table.
3. Sixty-two programs participated in the Supplier Credit Recovery Audit, and 43 programs developed internal payment recapture plans, which were approved by OCFO. These internal plans identify and recover improper payments. Activities include data mining-initiated reviews, limited scope reviews, special investigations, eligibility verification, agency-wide audits, and so
214 USDA AGENCY FINANCIAL REPORT | 2019
on. As outlined in OMB Circular A-123 Appendix C Part III Section C. 5 and 6, 44 programs submitted a cost-effective waiver to OMB. Note that a few programs utilize more than one of the previously described methods to meet payment recapture requirements. A list of programs categorized by recovery auditing activity is provided in the following table:
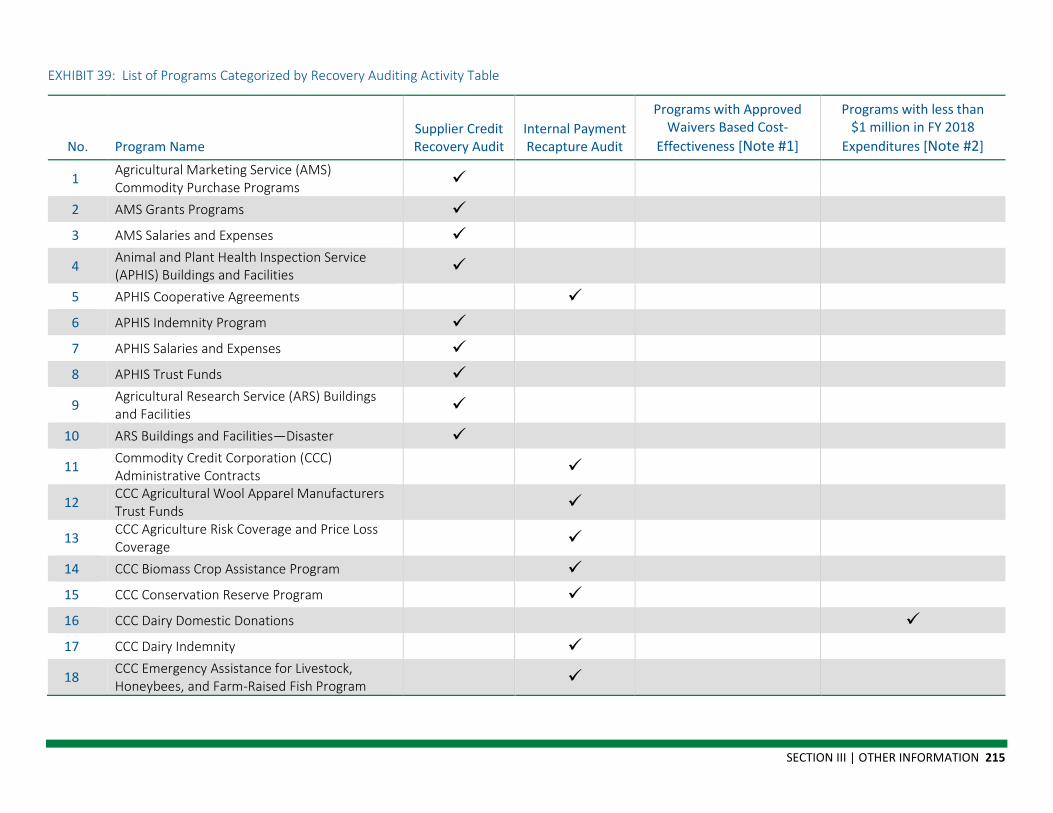
SECTION III | OTHER INFORMATION 215
EXHIBIT 39: List of Programs Categorized by Recovery Auditing Activity Table
No. Program Name Supplier Credit Recovery Audit
Internal Payment Recapture Audit
Programs with Approved Waivers Based Cost-
Effectiveness [Note #1]
Programs with less than $1 million in FY 2018
Expenditures [Note #2]
1 Agricultural Marketing Service (AMS) Commodity Purchase Programs
2 AMS Grants Programs 3 AMS Salaries and Expenses
4 Animal and Plant Health Inspection Service (APHIS) Buildings and Facilities
5 APHIS Cooperative Agreements 6 APHIS Indemnity Program 7 APHIS Salaries and Expenses 8 APHIS Trust Funds
9 Agricultural Research Service (ARS) Buildings and Facilities
10 ARS Buildings and Facilities—Disaster
11 Commodity Credit Corporation (CCC) Administrative Contracts
12 CCC Agricultural Wool Apparel Manufacturers Trust Funds
13 CCC Agriculture Risk Coverage and Price Loss Coverage
14 CCC Biomass Crop Assistance Program 15 CCC Conservation Reserve Program 16 CCC Dairy Domestic Donations 17 CCC Dairy Indemnity
18 CCC Emergency Assistance for Livestock, Honeybees, and Farm-Raised Fish Program
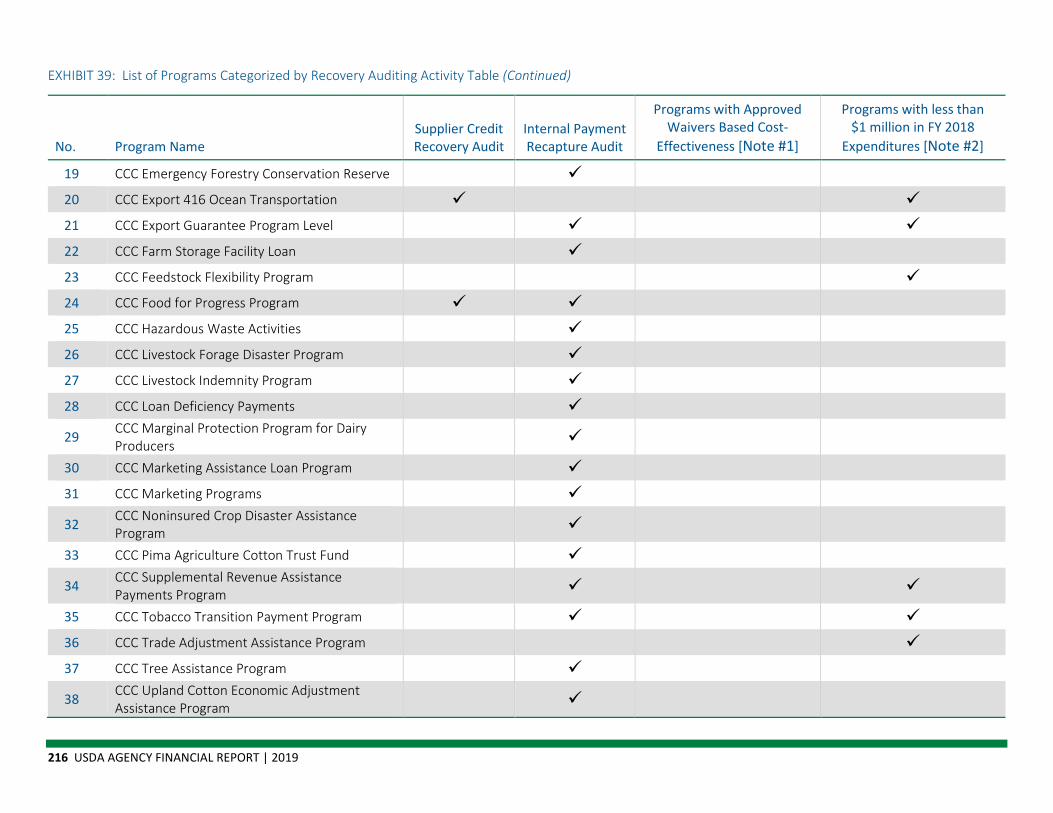
216 USDA AGENCY FINANCIAL REPORT | 2019
EXHIBIT 39: List of Programs Categorized by Recovery Auditing Activity Table (Continued)
No. Program Name Supplier Credit Recovery Audit
Internal Payment Recapture Audit
Programs with Approved Waivers Based Cost-
Effectiveness [Note #1]
Programs with less than $1 million in FY 2018
Expenditures [Note #2]
19 CCC Emergency Forestry Conservation Reserve 20 CCC Export 416 Ocean Transportation 21 CCC Export Guarantee Program Level 22 CCC Farm Storage Facility Loan 23 CCC Feedstock Flexibility Program 24 CCC Food for Progress Program 25 CCC Hazardous Waste Activities 26 CCC Livestock Forage Disaster Program 27 CCC Livestock Indemnity Program 28 CCC Loan Deficiency Payments
29 CCC Marginal Protection Program for Dairy Producers
30 CCC Marketing Assistance Loan Program 31 CCC Marketing Programs
32 CCC Noninsured Crop Disaster Assistance Program
33 CCC Pima Agriculture Cotton Trust Fund
34 CCC Supplemental Revenue Assistance Payments Program
35 CCC Tobacco Transition Payment Program 36 CCC Trade Adjustment Assistance Program 37 CCC Tree Assistance Program
38 CCC Upland Cotton Economic Adjustment Assistance Program

SECTION III | OTHER INFORMATION 217
EXHIBIT 39: List of Programs Categorized by Recovery Auditing Activity Table (Continued)
No. Program Name Supplier Credit Recovery Audit
Internal Payment Recapture Audit
Programs with Approved Waivers Based Cost-
Effectiveness [Note #1]
Programs with less than $1 million in FY 2018
Expenditures [Note #2]
39 Departmental Management (DM) Agriculture Buildings and Facilities
40 DM Biobased Markets Program 41 DM Hazardous Materials Management
42 Foreign Agricultural Service (FAS) McGovern-Dole Food for Education Grants
43 FAS Salaries and Expenses
44 Food and Nutrition Service (FNS) American Samoa
45 FNS Child and Adult Care Food Program
46 FNS Commonwealth of the Northern Mariana Islands
47 FNS Commodity Assistance Program—Disaster 48 FNS Commodity Supplemental Food Program 49 FNS The Emergency Food Assistance Program 50 FNS Farmers Market Nutrition Program
51 FNS Food Distribution Program on Indian Reservations
52 FNS National School Lunch Program 53 FNS Nutrition Assistance—Puerto Rico 54 FNS Salaries and Benefits 55 FNS School Breakfast Program 56 FNS Senior Farmers Market Nutrition Program 57 FNS Special Milk Program
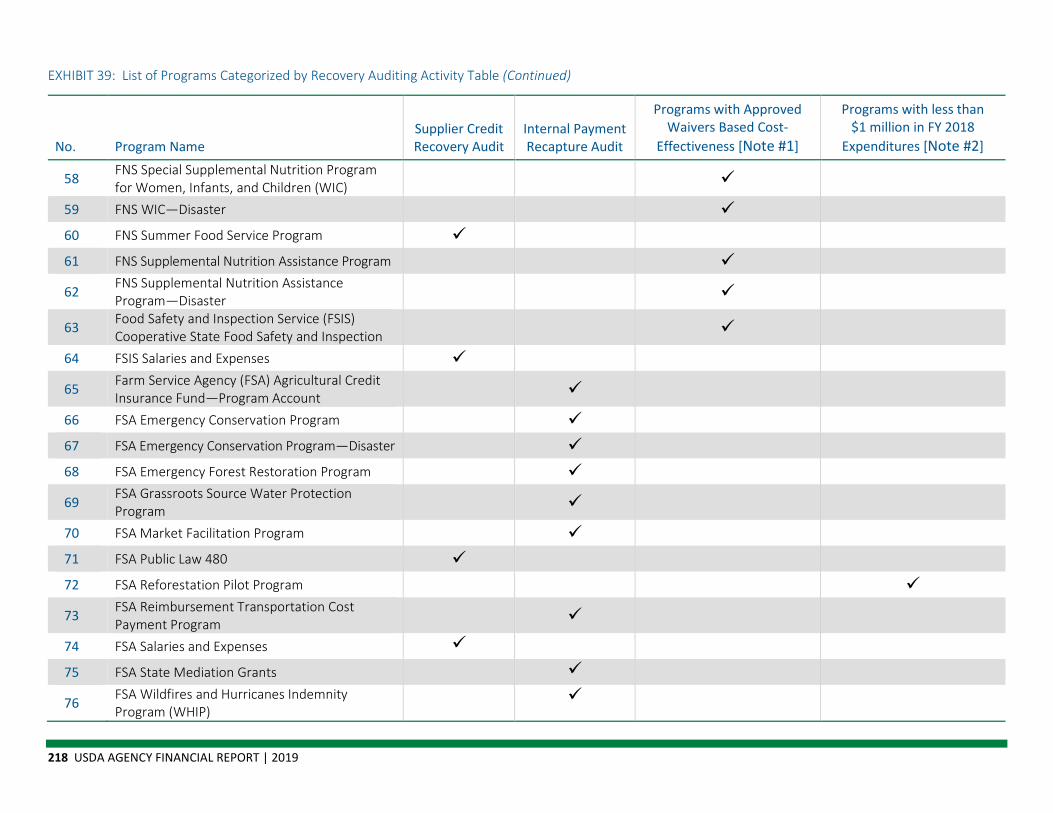
218 USDA AGENCY FINANCIAL REPORT | 2019
EXHIBIT 39: List of Programs Categorized by Recovery Auditing Activity Table (Continued)
No. Program Name Supplier Credit Recovery Audit
Internal Payment Recapture Audit
Programs with Approved Waivers Based Cost-
Effectiveness [Note #1]
Programs with less than $1 million in FY 2018
Expenditures [Note #2]
58 FNS Special Supplemental Nutrition Program for Women, Infants, and Children (WIC)
59 FNS WIC—Disaster 60 FNS Summer Food Service Program 61 FNS Supplemental Nutrition Assistance Program
62 FNS Supplemental Nutrition Assistance Program—Disaster
63 Food Safety and Inspection Service (FSIS) Cooperative State Food Safety and Inspection
64 FSIS Salaries and Expenses
65 Farm Service Agency (FSA) Agricultural Credit Insurance Fund—Program Account
66 FSA Emergency Conservation Program 67 FSA Emergency Conservation Program—Disaster 68 FSA Emergency Forest Restoration Program
69 FSA Grassroots Source Water Protection Program
70 FSA Market Facilitation Program 71 FSA Public Law 480 72 FSA Reforestation Pilot Program
73 FSA Reimbursement Transportation Cost Payment Program
74 FSA Salaries and Expenses 75 FSA State Mediation Grants
76 FSA Wildfires and Hurricanes Indemnity Program (WHIP)
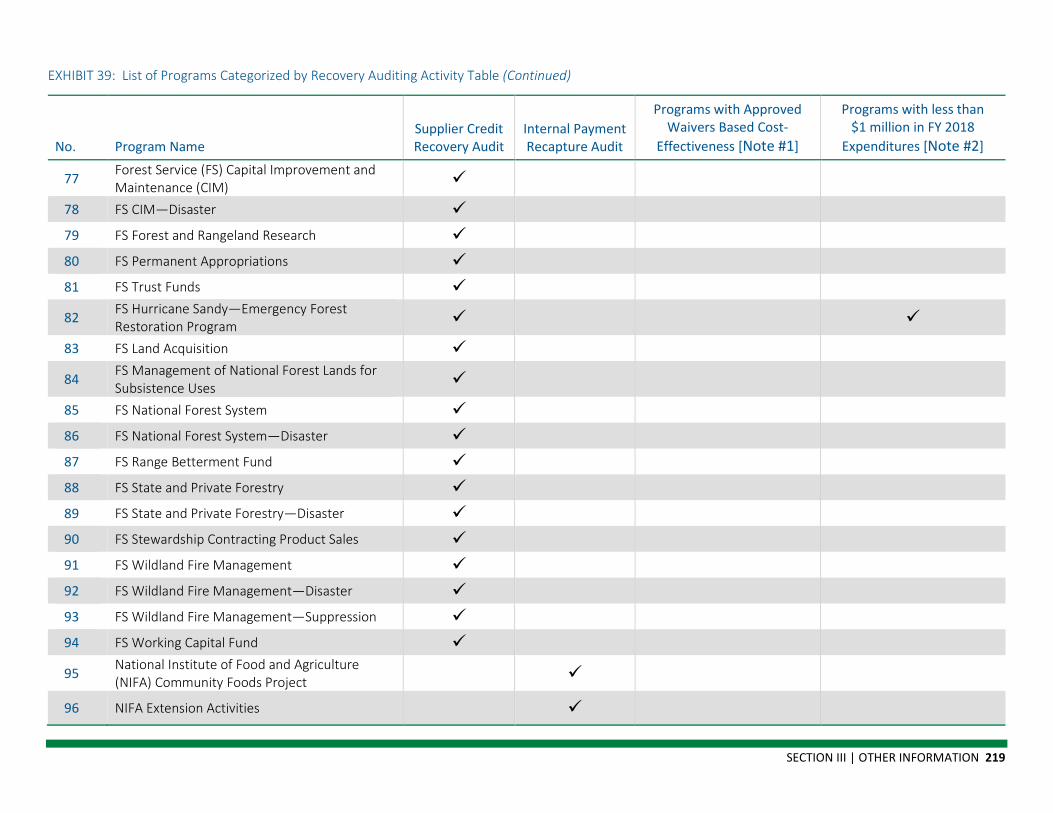
SECTION III | OTHER INFORMATION 219
EXHIBIT 39: List of Programs Categorized by Recovery Auditing Activity Table (Continued)
No. Program Name Supplier Credit Recovery Audit
Internal Payment Recapture Audit
Programs with Approved Waivers Based Cost-
Effectiveness [Note #1]
Programs with less than $1 million in FY 2018
Expenditures [Note #2]
77 Forest Service (FS) Capital Improvement and Maintenance (CIM)
78 FS CIM—Disaster 79 FS Forest and Rangeland Research 80 FS Permanent Appropriations 81 FS Trust Funds
82 FS Hurricane Sandy—Emergency Forest Restoration Program
83 FS Land Acquisition
84 FS Management of National Forest Lands for Subsistence Uses
85 FS National Forest System 86 FS National Forest System—Disaster 87 FS Range Betterment Fund 88 FS State and Private Forestry 89 FS State and Private Forestry—Disaster 90 FS Stewardship Contracting Product Sales 91 FS Wildland Fire Management 92 FS Wildland Fire Management—Disaster 93 FS Wildland Fire Management—Suppression 94 FS Working Capital Fund
95 National Institute of Food and Agriculture (NIFA) Community Foods Project
96 NIFA Extension Activities
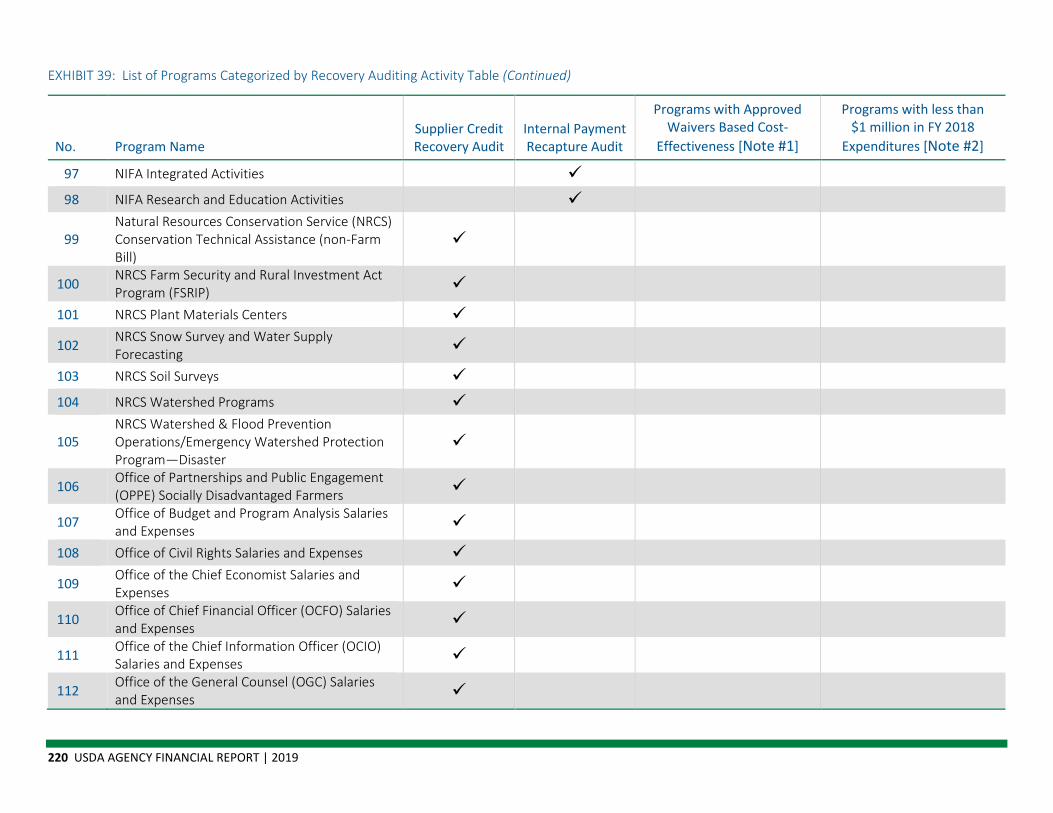
220 USDA AGENCY FINANCIAL REPORT | 2019
EXHIBIT 39: List of Programs Categorized by Recovery Auditing Activity Table (Continued)
No. Program Name Supplier Credit Recovery Audit
Internal Payment Recapture Audit
Programs with Approved Waivers Based Cost-
Effectiveness [Note #1]
Programs with less than $1 million in FY 2018
Expenditures [Note #2]
97 NIFA Integrated Activities 98 NIFA Research and Education Activities
99 Natural Resources Conservation Service (NRCS) Conservation Technical Assistance (non-Farm Bill)
100 NRCS Farm Security and Rural Investment Act Program (FSRIP)
101 NRCS Plant Materials Centers
102 NRCS Snow Survey and Water Supply Forecasting
103 NRCS Soil Surveys 104 NRCS Watershed Programs
105 NRCS Watershed & Flood Prevention Operations/Emergency Watershed Protection Program—Disaster
106 Office of Partnerships and Public Engagement (OPPE) Socially Disadvantaged Farmers
107 Office of Budget and Program Analysis Salaries and Expenses
108 Office of Civil Rights Salaries and Expenses
109 Office of the Chief Economist Salaries and Expenses
110 Office of Chief Financial Officer (OCFO) Salaries and Expenses
111 Office of the Chief Information Officer (OCIO) Salaries and Expenses
112 Office of the General Counsel (OGC) Salaries and Expenses

SECTION III | OTHER INFORMATION 221
EXHIBIT 39: List of Programs Categorized by Recovery Auditing Activity Table (Continued)
No. Program Name Supplier Credit Recovery Audit
Internal Payment Recapture Audit
Programs with Approved Waivers Based Cost-
Effectiveness [Note #1]
Programs with less than $1 million in FY 2018
Expenditures [Note #2]
113 Office of Hearings and Appeals Salaries and Expenses
114 Office of Inspector General (OIG) Salaries and Expenses
115 OIG Disaster-Related Funds 116 Office of the Secretary Salaries and Expenses
117 Rural Business-Cooperative Service (RBS) Grant Programs and Cooperative Agreement
118 RBS Guaranteed Loan Programs 119 RBS Payment Programs 120 RBS Relending Programs 121 Rural Development (RD) Salaries and Expenses
122 Rural Housing Service (RHS) Community Program Grants
123 RHS Direct Community Facility Loans 124 RHS Direct Single Family Housing 125 RHS Farm Labor Housing Loans (Section 514) 126 RHS Guaranteed Community Facility Loans 127 RHS Guaranteed Single-Family Housing Loans
128 RHS Guaranteed Multi-Family Housing (MFH) Loans (Section 538 Loans)
129 RHS Housing Loans and Grants—Other
130 RHS MFH Preservation & Revitalization Demo Program: 514/516 Loans/Grants & 515 Loans
131 RHS Rental Assistance Program (Section 521 Rental Assistance)
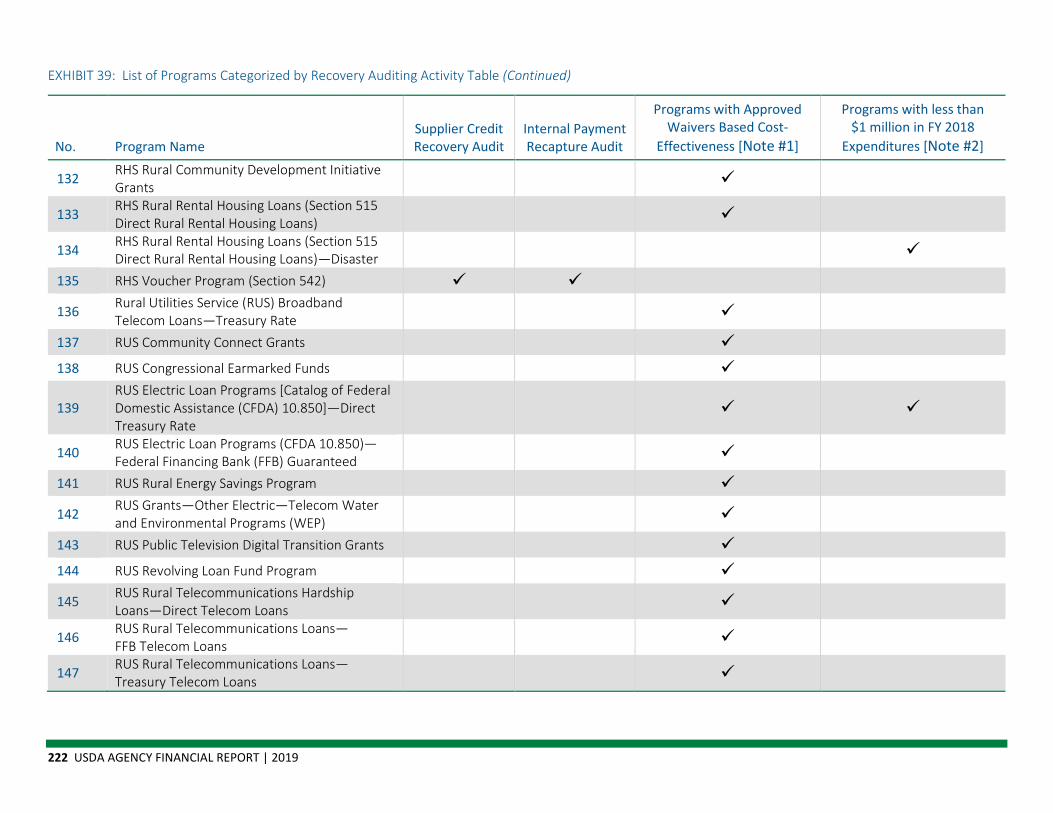
222 USDA AGENCY FINANCIAL REPORT | 2019
EXHIBIT 39: List of Programs Categorized by Recovery Auditing Activity Table (Continued)
No. Program Name Supplier Credit Recovery Audit
Internal Payment Recapture Audit
Programs with Approved Waivers Based Cost-
Effectiveness [Note #1]
Programs with less than $1 million in FY 2018
Expenditures [Note #2]
132 RHS Rural Community Development Initiative Grants
133 RHS Rural Rental Housing Loans (Section 515 Direct Rural Rental Housing Loans)
134 RHS Rural Rental Housing Loans (Section 515 Direct Rural Rental Housing Loans)—Disaster
135 RHS Voucher Program (Section 542)
136 Rural Utilities Service (RUS) Broadband Telecom Loans—Treasury Rate
137 RUS Community Connect Grants 138 RUS Congressional Earmarked Funds
139 RUS Electric Loan Programs [Catalog of Federal Domestic Assistance (CFDA) 10.850]—Direct Treasury Rate
140 RUS Electric Loan Programs (CFDA 10.850)—Federal Financing Bank (FFB) Guaranteed
141 RUS Rural Energy Savings Program
142 RUS Grants—Other Electric—Telecom Water and Environmental Programs (WEP)
143 RUS Public Television Digital Transition Grants
144 RUS Revolving Loan Fund Program
145 RUS Rural Telecommunications Hardship Loans—Direct Telecom Loans
146 RUS Rural Telecommunications Loans—FFB Telecom Loans
147 RUS Rural Telecommunications Loans—Treasury Telecom Loans
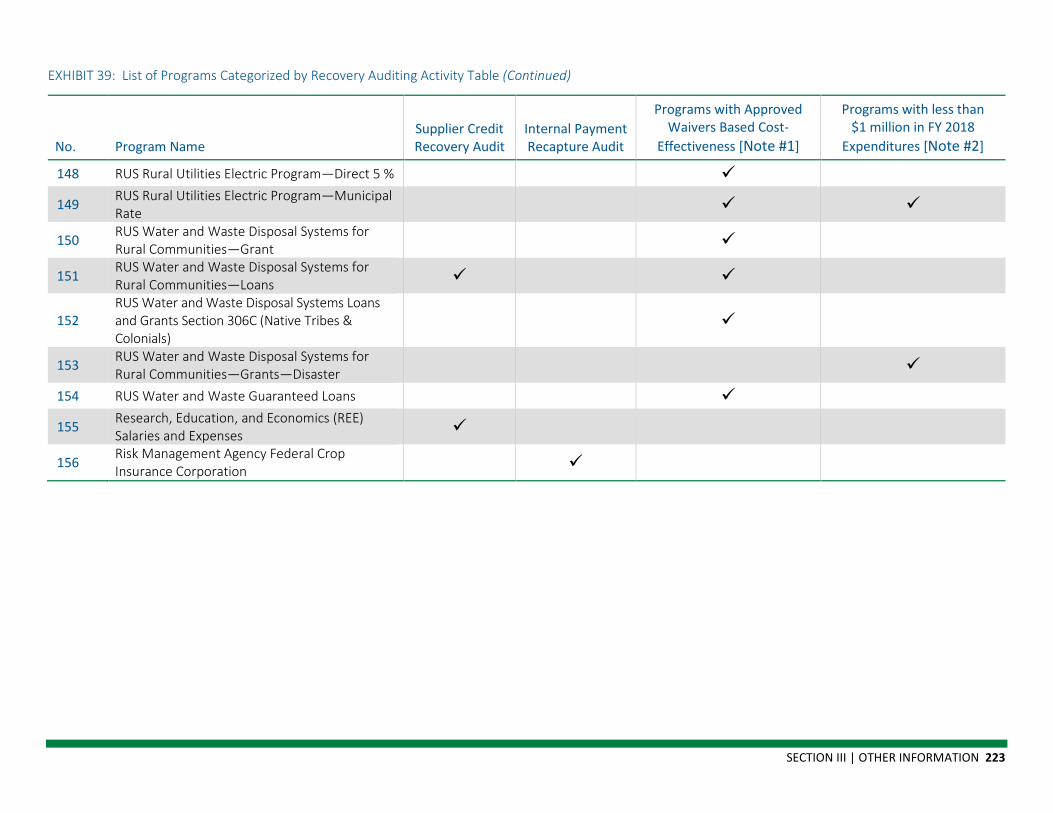
SECTION III | OTHER INFORMATION 223
EXHIBIT 39: List of Programs Categorized by Recovery Auditing Activity Table (Continued)
No. Program Name Supplier Credit Recovery Audit
Internal Payment Recapture Audit
Programs with Approved Waivers Based Cost-
Effectiveness [Note #1]
Programs with less than $1 million in FY 2018
Expenditures [Note #2]
148 RUS Rural Utilities Electric Program—Direct 5 %
149 RUS Rural Utilities Electric Program—Municipal Rate
150 RUS Water and Waste Disposal Systems for Rural Communities—Grant
151 RUS Water and Waste Disposal Systems for Rural Communities—Loans
152 RUS Water and Waste Disposal Systems Loans and Grants Section 306C (Native Tribes & Colonials)
153 RUS Water and Waste Disposal Systems for Rural Communities—Grants—Disaster
154 RUS Water and Waste Guaranteed Loans
155 Research, Education, and Economics (REE) Salaries and Expenses
156 Risk Management Agency Federal Crop Insurance Corporation
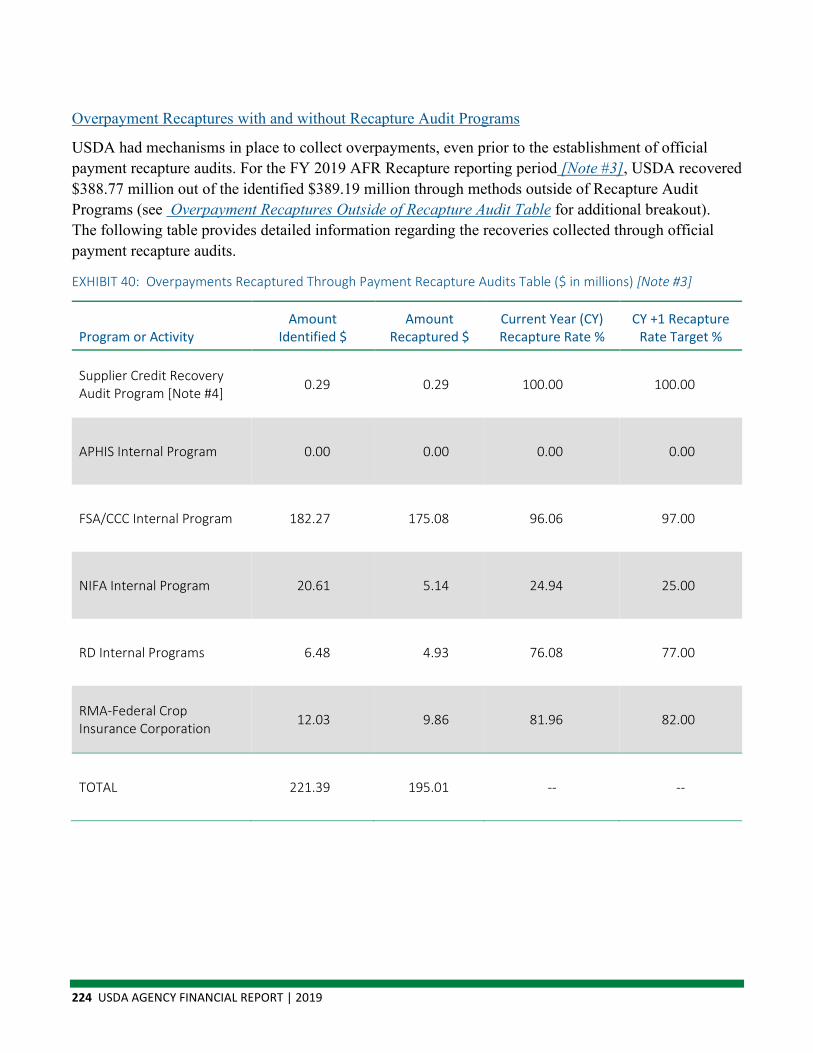
224 USDA AGENCY FINANCIAL REPORT | 2019
Overpayment Recaptures with and without Recapture Audit Programs
USDA had mechanisms in place to collect overpayments, even prior to the establishment of official payment recapture audits. For the FY 2019 AFR Recapture reporting period [Note #3], USDA recovered $388.77 million out of the identified $389.19 million through methods outside of Recapture Audit Programs (see Overpayment Recaptures Outside of Recapture Audit Table for additional breakout). The following table provides detailed information regarding the recoveries collected through official payment recapture audits.
EXHIBIT 40: Overpayments Recaptured Through Payment Recapture Audits Table ($ in millions) [Note #3]
Program or Activity Amount
Identified $ Amount
Recaptured $ Current Year (CY) Recapture Rate %
CY +1 Recapture Rate Target %
Supplier Credit Recovery Audit Program [Note #4] 0.29 0.29 100.00 100.00
APHIS Internal Program 0.00 0.00 0.00 0.00
FSA/CCC Internal Program 182.27 175.08 96.06 97.00
NIFA Internal Program 20.61 5.14 24.94 25.00
RD Internal Programs 6.48 4.93 76.08 77.00
RMA-Federal Crop Insurance Corporation 12.03 9.86 81.96 82.00
TOTAL 221.39 195.01 -- --
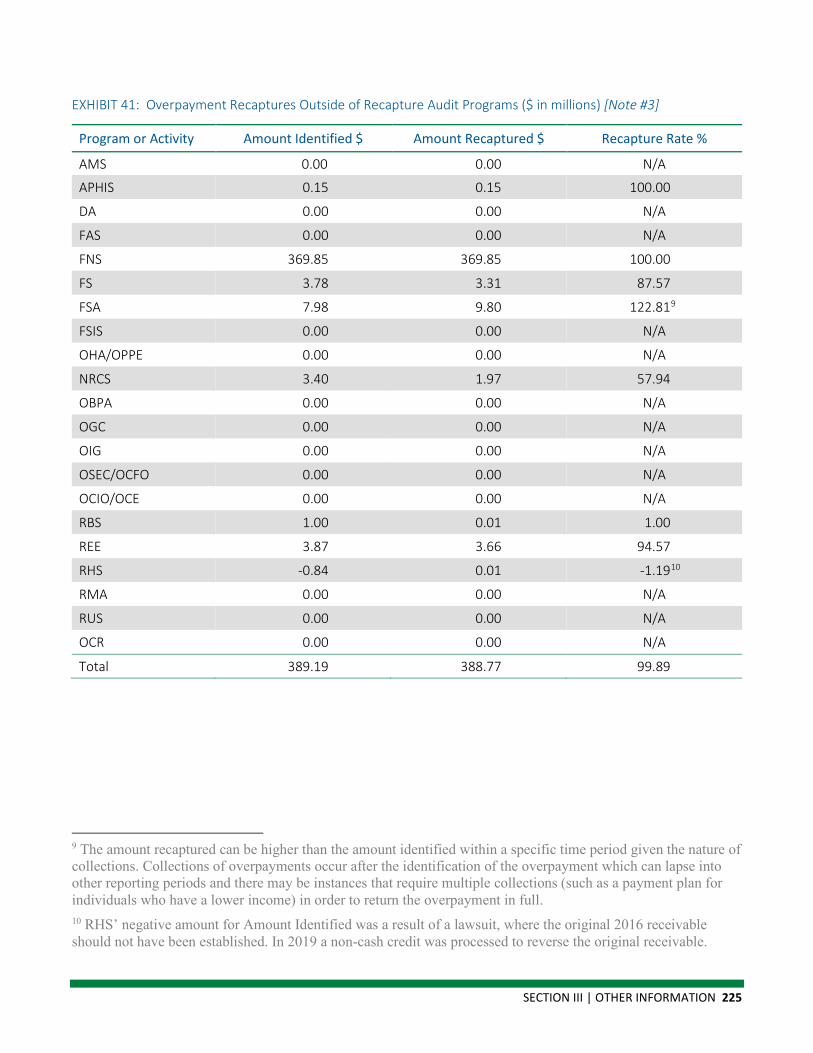
SECTION III | OTHER INFORMATION 225
EXHIBIT 41: Overpayment Recaptures Outside of Recapture Audit Programs ($ in millions) [Note #3]
Program or Activity Amount Identified $ Amount Recaptured $ Recapture Rate %
AMS 0.00 0.00 N/A
APHIS 0.15 0.15 100.00
DA 0.00 0.00 N/A
FAS 0.00 0.00 N/A
FNS 369.85 369.85 100.00
FS 3.78 3.31 87.57
FSA 7.98 9.80 122.819
FSIS 0.00 0.00 N/A
OHA/OPPE 0.00 0.00 N/A
NRCS 3.40 1.97 57.94
OBPA 0.00 0.00 N/A
OGC 0.00 0.00 N/A
OIG 0.00 0.00 N/A
OSEC/OCFO 0.00 0.00 N/A
OCIO/OCE 0.00 0.00 N/A
RBS 1.00 0.01 1.00
REE 3.87 3.66 94.57
RHS -0.84 0.01 -1.1910
RMA 0.00 0.00 N/A
RUS 0.00 0.00 N/A
OCR 0.00 0.00 N/A
Total 389.19 388.77 99.89
9 The amount recaptured can be higher than the amount identified within a specific time period given the nature of collections. Collections of overpayments occur after the identification of the overpayment which can lapse into other reporting periods and there may be instances that require multiple collections (such as a payment plan for individuals who have a lower income) in order to return the overpayment in full. 10 RHS’ negative amount for Amount Identified was a result of a lawsuit, where the original 2016 receivable should not have been established. In 2019 a non-cash credit was processed to reverse the original receivable.

226 USDA AGENCY FINANCIAL REPORT | 2019
EXHIBIT 42: Disposition of Funds Recaptured Through Payment Recapture Audit Programs Table ($ in millions)
Program or Activity Amount
Recovered $
Agency Expenses to Administer the Program $
Payment Recapture
Auditor Fees $
Financial Management Improvement
Activities $ Original
Purpose $ To OIG $ Returned to Treasury $ Other $
Justification for “Other”
Amounts
Supplier Credit Recovery Audit Program [Note #4]
0.29 0.00 0.07 0.00 0.00 0.00 0.00 0.29 Funds have not been distributed
APHIS Internal Program 0.00 0.00 0.00 0.00 0.00 0.00 0.00 0.00 N/A
FSA/CCC Internal Program 175.08 0.00 0.00 0.00 1.81 0.00 173.27 0.00 N/A
NIFA Internal Program 5.14 0.00 0.00 0.00 5.14 0.00 0.00 0.00 N/A
RD Internal Program 4.93 0.00 0.00 0.00 0.00 0.00 1.60 3.33 Funds have not been distributed
RMA-Federal Crop Insurance Corporation 9.86 0.00 0.00 0.00 9.86 0.00 0.00 0.00 N/A
Total 195.30 0.00 0.07 0.00 16.81 0.00 174.87 3.62 Funds have not been distributed.
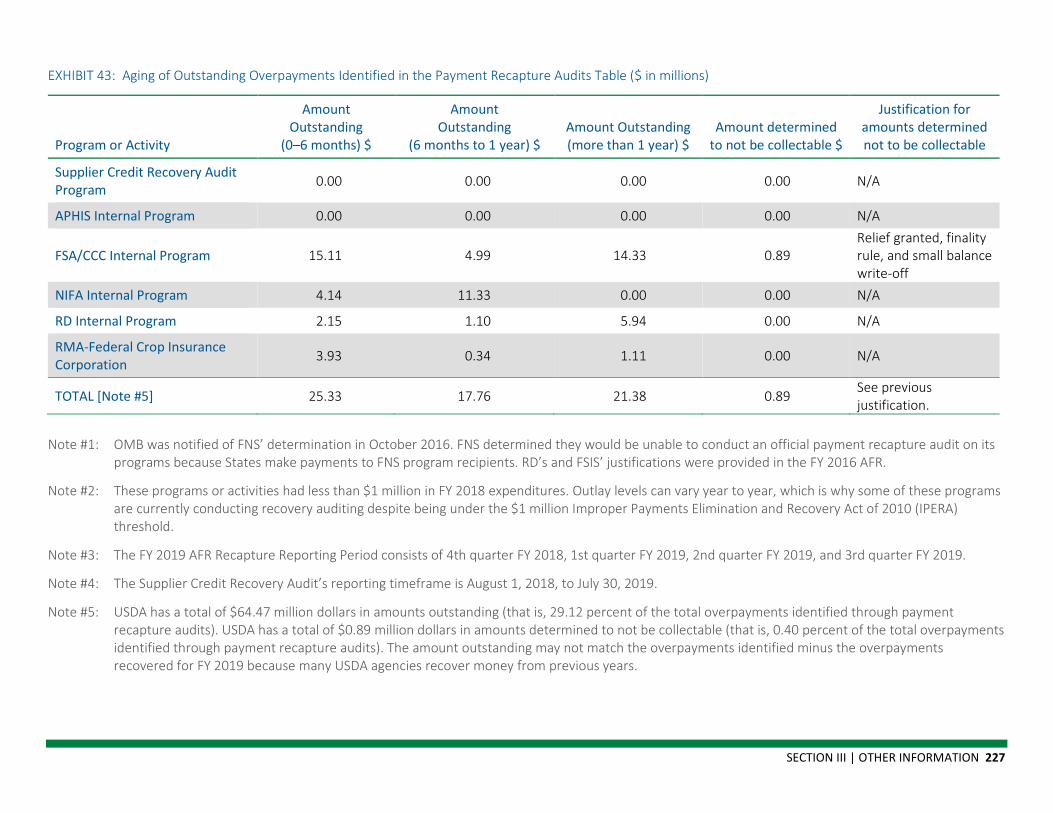
SECTION III | OTHER INFORMATION 227
EXHIBIT 43: Aging of Outstanding Overpayments Identified in the Payment Recapture Audits Table ($ in millions)
Program or Activity
Amount Outstanding
(0–6 months) $
Amount Outstanding
(6 months to 1 year) $ Amount Outstanding (more than 1 year) $
Amount determined to not be collectable $
Justification for amounts determined not to be collectable
Supplier Credit Recovery Audit Program 0.00 0.00 0.00 0.00 N/A
APHIS Internal Program 0.00 0.00 0.00 0.00 N/A
FSA/CCC Internal Program 15.11 4.99 14.33 0.89 Relief granted, finality rule, and small balance write-off
NIFA Internal Program 4.14 11.33 0.00 0.00 N/A
RD Internal Program 2.15 1.10 5.94 0.00 N/A
RMA-Federal Crop Insurance Corporation 3.93 0.34 1.11 0.00 N/A
TOTAL [Note #5] 25.33 17.76 21.38 0.89 See previous justification.
Note #1: OMB was notified of FNS’ determination in October 2016. FNS determined they would be unable to conduct an official payment recapture audit on its programs because States make payments to FNS program recipients. RD’s and FSIS’ justifications were provided in the FY 2016 AFR.
Note #2: These programs or activities had less than $1 million in FY 2018 expenditures. Outlay levels can vary year to year, which is why some of these programs are currently conducting recovery auditing despite being under the $1 million Improper Payments Elimination and Recovery Act of 2010 (IPERA) threshold.
Note #3: The FY 2019 AFR Recapture Reporting Period consists of 4th quarter FY 2018, 1st quarter FY 2019, 2nd quarter FY 2019, and 3rd quarter FY 2019.
Note #4: The Supplier Credit Recovery Audit’s reporting timeframe is August 1, 2018, to July 30, 2019.
Note #5: USDA has a total of $64.47 million dollars in amounts outstanding (that is, 29.12 percent of the total overpayments identified through payment recapture audits). USDA has a total of $0.89 million dollars in amounts determined to not be collectable (that is, 0.40 percent of the total overpayments identified through payment recapture audits). The amount outstanding may not match the overpayments identified minus the overpayments recovered for FY 2019 because many USDA agencies recover money from previous years.
228 USDA AGENCY FINANCIAL REPORT | 2019
Agency Reduction of Improper Payments with the Do Not Pay Initiative Section USDA continues to expand its use of the Department of Treasury’s (Treasury) Do Not Pay (DNP) portal in FY 2019 by utilizing continuous and batch monitoring tools.
USDA OCFO started a roll-out plan to onboard the remaining USDA agencies who are not using DNP for pre-payment, pre-approval, and post-payment verifications.
USDA and DNP
USDA has completed two System of Records Notices (SORN) for USDA FSA. In addition, FSA is currently reviewing the requirements to transmit the Credit Alert Interactive Voice Response System (CAIVRS) data to the Treasury DNP Portal. The first transmittal of CAIVRS data took place between USDA and Treasury in September 2019. USDA is in the process of completing the Computer Matching Agreement (CMA) and the Memorandum of Understanding (MOU) for these two SORN’s.
Also, the USDA National Finance Center is completing a process to utilize continuous monitoring in order to allow the Financial Management Modernization Initiative (FMMI) to verify payments directly with DNP.
USDA has participated in a few DNP focus groups this fiscal year at the Treasury DNP Business Center. These focus groups were coordinated through OCFO in collaboration with select USDA agencies.
1. Aggregated Death Data and Advanced Matching
Description: Treasury, through OCFO, requested one-on-one sessions with USDA users to walk through screen mock-ups of how the aggregate death data match could potentially be displayed, as well as potential matches using advanced matching.
2. Payment Integration and Online Search
Description: Treasury engaged USDA participants to provide feedback in reference to a potential single death match in the portal and the impact on agency processes.
3. Opportunity to Improve the DNP Portal
Description: USDA participants reviewed the DNP new user interface mock-ups and provided feedback to Treasury staff on value/usability to help identify areas for improvement.
USDA has incorporated the DNP databases in the following ways:
1. The death records maintained by the Commissioner of Social Security: USDA utilizes these records to check extensively for Farm Service Agency FY 2019 new enrollees, Guaranteed Loans, and Direct Loans Divisions on a post-payment basis. Several additional programs use this database in pre-award activities in the DNP portal. All USDA payments made through Treasury are checked against this database on a post-payment basis.
SECTION III | OTHER INFORMATION 229
2. System for Award Management (SAM) database managed by the General Services Administration: USDA utilizes this system to check pre-award for most contracts, grants, cooperative agreements, and insurance programs. All USDA payments made through Treasury are checked against this database on a post-payment basis.
3. CAIVRS managed by the Department of Housing and Urban Development: USDA utilizes this system to award loans. Rural Development (RD) signed an MOU with Treasury and updated its system of records notice. RD began transmitting its CAIVRS data to Treasury in June 2017.
4. Debt Check Database managed by Treasury: RD utilizes this database for many pre-award verifications.
5. List of Excluded Individuals/Entities (LEIE) managed by the Office of Inspector General of the U.S. Department of Health and Human Services: USDA utilizes this list to check for pre-award for loans, grants, and contracts.
6. Prisoner Update Processing System (PUPS) managed by the Social Security Administration: USDA is not currently using this system but is evaluating programs that have the legal authority to use and benefit from this database.
USDA has submitted a request to have these data sources available as part of the single batch and continuous monitoring done by USDA agencies. Once these data sources become available, USDA will be requesting Treasury to approve usage for three agencies. USDA will work with Treasury to develop the business rules by agency level on usage of these new data sources.
USDA and DNP Adjudication & Payment Activity
USDA is currently utilizing the DNP payment activity reports and is working toward combining the adjudication reports and the USDA Local Security Administrator’s (LSA) monthly reports to create metrics of the dollar value on pre-approval and pre-payment checks using the DNP system. USDA is currently seeking to use quantitative analyses to provide management ways to decrease the improper payment rates by agency.
230 USDA AGENCY FINANCIAL REPORT | 2019
Fraud Reduction Report
OVERVIEW As required by the Office of Management and Budget (OMB) Circular No. A-123, Management’s Responsibility for Enterprise Risk Management and Internal Control (OMB Circular No. A-123), the U.S. Department of Agriculture (USDA) is in the process of implementing a Departmentwide Enterprise Risk Management (ERM) program that effectively identifies risks; assesses, analyzes, and prioritizes those risks; and documents and monitors these risks.
The implementation of ERM will help the Department and component agencies better identify our most significant fraud risk and take appropriate actions to reduce and prevent fraud. As the Department continues to implement the requirements of OMB Circular A-123, the Department will use agency best practices to identify and minimize risks and vulnerabilities to prevent fraud. Outlined below are specific actions the Department is taking to integrate fraud risk prevention and monitoring into the management of internal controls.
RISK ASSESSMENT: The Department’s annual risk assessment process, performed in conjunction with Appendix A to OMB Circular No. A-123, Management of Reporting and Data Integrity Risk (A-123 Appendix A), incorporates specific internal and external fraud risk. These questions allow the respondent to rate the susceptibility of the agency’s significant business processes to fraud.
Additionally, as a requirement of the Statement on Auditing Standards (SAS) No. 122, Clarification and Recodification, specifically Audit (AU) Section 240, Consideration of Fraud in a Financial Statement Audit, the Office of the Chief Financial Officer (OCFO) disseminates and consolidates responses to a fraud questionnaire among USDA’s financial community.
TECHNOLOGY: USDA continuously monitors 15 automated financial system controls. These controls are configured in the USDA financial system to identify exceptions for further analysis of potential fraud/misuse. Configuration changes are immediately reported as exceptions to responsible control owners and first line supervisors. An oversight workflow is established for approving the actions proposed by the control owner to correct any exception issues, assigning remediation tasks when needed, and closing the exception after the control owner completes the proposed actions. Reports are available to monitor exception activity by responsible personnel.
SECTION III | OTHER INFORMATION 231
ENTITY LEVEL CONTROLS: USDA agencies and staff offices are required to complete an annual Entity Level Control (ELC) assessment. The ELC assessment tool complies with the Government Accountability Office (GAO)—Standards for Internal Control in the Federal Government (“Green Book”). As such, the assessment tool includes GAO Principle 8, which assesses fraud risk. Attributes include: (1) types of fraud, (2) fraud risk factors, and (3) responses to fraud risks. Key objectives for this assessment include: (1) identifying fraud risks based on fraud risk factors, (2) assessing identified fraud risks for significance, and (3) properly responding to identified fraud risks.
ACCESS CONTROLS: The USDA consolidated financial systems’ access controls are managed through the Governance Risk and Compliance (GRC) Access Control module. Access controls are configured to prevent conflicting accounting roles unless there is an immediate need that is fully documented, mitigated, and supported by compensating controls. There is a standard process for the review and approval of mitigating controls to ensure that control strategies are properly documented and carried out by the requesting agency.
SEGREGATION OF DUTY: USDA’s consolidated financial system is configured in such a way that conflicting roles are prohibited, which ensures proper segregation of duty (SOD). Those who initiate a transaction in the financial system are not allowed to also approve that same transaction. There are also financially significant, agency-specific SOD controls that are documented and tested annually during the A-123, Appendix A assessment. The strict prohibition of conflicting roles reduces the risk of fraud.
ADDITIONAL FRAUD RISK INTEGRATION EFFORTS: On October 15, 2018, the Office of Management and Budget, Chief Financial Officers (CFO) Council, in conjunction with the Department of Treasury-Office of the Fiscal Service, issued Program Integrity: The Anti-Fraud Playbook (Playbook), as a tool for Federal agencies implementing the Fraud Reduction and Data Analytics Act of 2015 to develop strategies to combat fraud. The Playbook was shared and discussed internally with USDA executives. USDA personnel also participated in the CFO Council Fraud Working Group and the Fiscal Service’s Roundtable discussions to collaborate and share ideas/resources to collectively apply Playbook concepts, and to develop informal support networks.
To support OMB Circular No. A-123 compliance efforts, fraud assertions are included in each components FY 2019 Certification Statements that support the Secretary’s Management Assurance Statement. USDA component agencies’ and staff offices’ progress in establishing strategies, procedures, and other steps to curb fraud were reported and consolidated in the Agency Financial Report. All component agencies and staff offices reported that financial and administrative controls were established to identify and assess fraud risks, and control activities were designed and implemented to prevent, detect, and respond to fraud, including improper payments.
232 USDA AGENCY FINANCIAL REPORT | 2019
Component agencies and staff offices also assessed the fraud risk principle in the Standards for Internal Control for Federal Government and OMB Circular A-123, with respect to leading practices for managing fraud risk; assessed risks and vulnerabilities to fraud, including payroll, beneficiary payments, grants, large contracts, and purchase and travel cards, as applicable; and established strategies, procedures, and other steps to curb fraud as part of internal control activities operating during the normal course of business.
Transactional control objectives to monitor adherence to control procedures that prevent or detect fraud are assessed annually through control effectiveness testing and the results are communicated to risk owners.
In prior year’s reports, USDA component agencies and staff offices reported specific fraud risk management activities to curb fraud. These efforts continue in USDA’s payroll, beneficiary payment, grant, large contract, and purchase and travel card programs and operations. The following provides new developments related to the management of fraud risk for travel cards:
Travel Cards—The primary fraud risk management method USDA uses to mitigate travel charge card misuse is the blocking of 922 Merchant Category Codes (MCCs). This procedure prevents cardholders from successfully completing transactions with unauthorized vendors.
Additionally, USDA uses MasterCard (Oversight)-Insights on Demand (IOD) compliance management tool, to identify and detect possible travel charge card misuse. IOD is a cloud-based system, powered by Oversight Systems, that is used to analyze 100 percent of cardholder transaction data from multiple sources to assist travel managers in improving their operations. This tool applies complex predictive analytics, combined with transaction analysis, to uncover possible misuse and compliance violations, that could lead to fraud.
Highlights of Oversights IOD:
▪ Oversight brings together the clues needed to identify travel charge card risks in real-time and help prevent wasteful spending, misuse, and fraud because it:
o Automatically analyzes 100 percent of card transactions; o Compares transactions and runs multiple analytics in parallel; o Analyzes spending patterns and habits over time; and o Reduces non-compliant spending by 70 percent.
▪ Oversight automatically finds the problems for you, so you can focus on changing employee behavior, because it:
o Identifies employees who frequently violate expense policy; o Determines root cause of behavior that needs to be corrected; o Alerts you to training opportunities, policy issues, and business process inefficiencies; and o Potential to save travel budget by decreasing abuse.

SECTION III | OTHER INFORMATION 233
▪ Reduce audit effort by 50 percent:
o Oversight increases your audit scope from a typical sample analysis to 100 percent; o Automates data acquisition with your existing travel charge card vendor (and travel system
if implemented); o Centralized system inspects transactions in a consistent manner; o Automatically tracks remediation activity with built-in workflow for email and audit trail; and o Dashboard views flag highest priority risks for further investigation.
USDA elected to use Oversight’s existing configuration for the first year of the program, with minor adjustments. Using travel charge card transaction data provided by the card vendor, Insights are delivered in easy to understand dashboards and reports, with detailed findings and recommendations that can be used to make decisions and take action. An Insight is made up of a collection of analytics (Indicators) designed to address a specific business objective. The results of IOD’s analysis are delivered to customers via two key browser-based components, the Dashboard and the Workbench. IOD automatically tracks and logs the actions for each finding, including input from emails related to reviews, investigations, and corrective activities.
Oversight provides Insights for travel related expenses in the following areas:
▪ Fraud Risk and Misuse—Detect high-risk transactions based on MCC and other criteria. Helps in understanding misclassifications, out of bounds transactions, and inappropriate venues, thereby, assisting an organization in enforcing travel policy. Outliers and patterns uncovered by this Insight can be used to find and stop abuse and misuse. Risk levels for more than 300 MCCs, pre-set to Oversight best practice values, are:
o High risk—Create an exception for every transaction with this MC Code. o Medium risk—Create an exception if there are more than three transactions or the cumulative
dollar value is greater than $500 for this MC Code in a 30-day window for this card. o Low risk—Create an exception if there are more than 10 transactions or the cumulative dollar
value is greater than $700 for this MC Code in a 30-day window for this card. o Zero—Turn off monitoring of this MC Code and create no exceptions for any transaction
with this MC Code.
▪ Travel Misuse—Detect patterns of misuse and excess in lower-risk MCC
▪ Suspicious Keywords—Flags purchases with suspicious keywords or phrases; current list has more than 700 keywords. The keywords are also assigned a risk level based on the amount of the transaction. The current defaults, which can be adjusted, are:
o High risk keywords (no dollar threshold); o Medium risk keywords (minimum $500 threshold); and o Low risk keywords (minimum of $700 threshold).
234 USDA AGENCY FINANCIAL REPORT | 2019
Inspector General Act Amendments of 1988: Management’s Report on Audit Follow Up
BACKGROUND The Inspector General Act Amendments of 1988 (Public Law [P.L.] 100–504) require that each agency head submit semi-annual reports to Congress on the actions taken in response to the Office of Inspector General (OIG) audit, evaluation, and inspection reports. Consistent with the Reports Consolidation Act of 2000 (P.L. 106–531), the U.S. Department of Agriculture’s (USDA) Office of the Chief Financial Officer (OCFO) consolidates and annualizes the required semi-annual Inspector General Act Amendments’ reporting elements for inclusion in the annual Agency Financial Report (AFR).
OIG audits USDA’s programs, systems, and operations. It then recommends improvements to management based on its findings. USDA management may agree or disagree with the audit’s findings or recommendations. An agreement is reached during the management-decision process. If management agrees with a recommendation, a written plan for corrective action with a target completion date is developed. The plan is then submitted to OIG for concurrence. If both OIG and management agree that the proposed corrective action will correct the weakness, a management decision is concluded for that recommendation.
Audit follow-up ensures that prompt and responsive action is taken. USDA’s OCFO oversees audit follow-up for the Department. An audit remains open until all corrective actions for each recommendation are completed. As agencies complete planned corrective actions and submit closure documentation, OCFO reviews the submitted documentation for sufficiency and determines if final action can be completed.
FISCAL YEAR RESULTS USDA agencies closed 50 audits during fiscal year (FY) 2019. As of September 22, 2019, OIG and USDA agencies reached management decisions on 25 audits. As shown in the following exhibit, the Department’s inventory of open audits decreased in FY 2019 by 25 percent from 100 to 75.
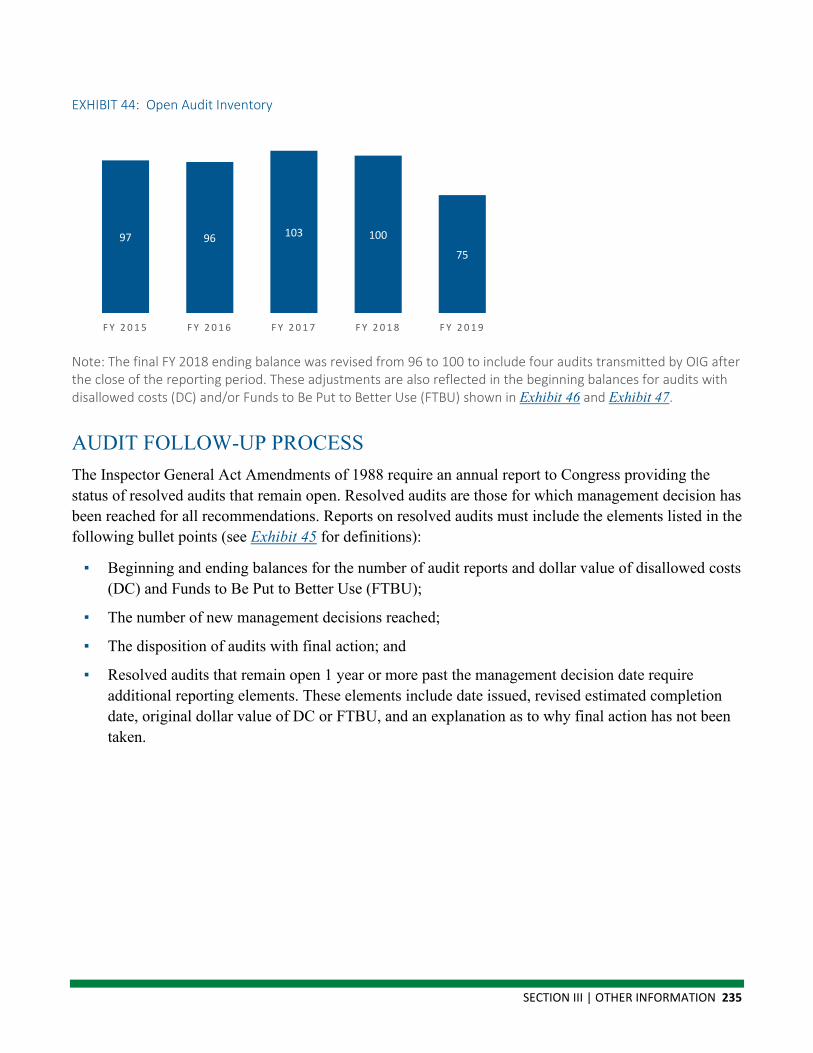
SECTION III | OTHER INFORMATION 235
EXHIBIT 44: Open Audit Inventory
97 96 103 100
75
F Y 2 0 1 5 F Y 2 0 1 6 F Y 2 0 1 7 F Y 2 0 1 8 F Y 2 0 1 9
Note: The final FY 2018 ending balance was revised from 96 to 100 to include four audits transmitted by OIG after the close of the reporting period. These adjustments are also reflected in the beginning balances for audits with disallowed costs (DC) and/or Funds to Be Put to Better Use (FTBU) shown in Exhibit 46 and Exhibit 47.
AUDIT FOLLOW-UP PROCESS The Inspector General Act Amendments of 1988 require an annual report to Congress providing the status of resolved audits that remain open. Resolved audits are those for which management decision has been reached for all recommendations. Reports on resolved audits must include the elements listed in the following bullet points (see Exhibit 45 for definitions):
▪ Beginning and ending balances for the number of audit reports and dollar value of disallowed costs (DC) and Funds to Be Put to Better Use (FTBU);
▪ The number of new management decisions reached;
▪ The disposition of audits with final action; and
▪ Resolved audits that remain open 1 year or more past the management decision date require additional reporting elements. These elements include date issued, revised estimated completion date, original dollar value of DC or FTBU, and an explanation as to why final action has not been taken.

236 USDA AGENCY FINANCIAL REPORT | 2019
EXHIBIT 45: Audit Follow-Up Definitions
Term Definition
Disallowed Cost (DC)
An incurred cost questioned by the Office of Inspector General (OIG) that management has agreed should not be chargeable to the Government.
Final Action Actions that management has taken to address the audit findings and recommendations.
Funds to Be Put to Better Use (FTBU)
An OIG recommendation that funds could be used more efficiently if management completes the recommendation, including:
• Reductions in outlays or other savings; • Deobligation of funds from programs or operations, or the withdrawal of subsidy
costs on loans, guarantees, or bonds; and • Implementation of recommended improvements for grants or contracts, or
unnecessary expenditures noted in pre-award reviews of contracts or grant agreements.
Management Decision
Agreement between management and OIG on corrective action needed to address audit findings and recommendations.
BEGINNING AND ENDING INVENTORY FOR AUDITS WITH DISALLOWED COSTS AND FUNDS TO BE PUT TO BETTER USE Of the 50 audits that achieved final action during the fiscal year, eight contained DC. The number of DC audits remaining in the inventory at the end of the fiscal year is 29, with a monetary value of $69,863,665 (see Exhibit 46).
EXHIBIT 46: Inventory of Audits with Disallowed Costs (DC)
Audits with DC # of Audits Amount ($)
Beginning of the Period (October 1, 2018)* 30 $ 33,762,327
Plus: New Management Decisions 7 $ 60,790,615
Total Audits Pending Collection of DC 37 $ 94,552,942
Less: Adjustments ($ 12,588,243)
Revised Subtotal $ 81,964,699
Less: Final Actions (Recoveries) 8 $ 12,101,034
Audits with DC Requiring Final Action at the End of the Period (September 22, 2019) 29 $ 69,863,665
Exhibit 46 and Exhibit 47: include only those open audits with DC and FTBU, respectively. Additionally, some audits contain both DC and FTBU amounts. For this reason, the number of audits shown as the ending balances in Exhibit 46 and Exhibit 47 does not equal the total resolved audit inventory balance in Exhibit 44. *The beginning balance in Exhibit 46 was adjusted to include one audit with DC that was transmitted by OIG after the closing of the reporting period.

SECTION III | OTHER INFORMATION 237
For DC audits that achieved final action in FY 2019, OIG and management agreed to collect $24,689,277 ($12,588,243 + $12,101,034). Based on further discovery and research to resolve the issues identified, adjustments were made totaling $12,588,243. Management recovered the remaining $12,101,034 as payment and $735,825 interest.
Final action occurred on three audits that involved FTBU amounts. There are nine FTBU audits remaining in the inventory as of September 22, 2019, with a monetary value of $81,617,411 (see Exhibit 47).
EXHIBIT 47: Inventory of Audits with Funds To Be Put To Better Use (FTBU)
Audits with FTBU # of Audits Amount ($)
Beginning of the Period (October 1, 2018)** 10 $189,486,587
Plus: New Management Decisions 2 $3,549,880
Total Audits Pending 12 $193,036,467
Less: Final Actions 3 $111,419,056
Audits with FTBU Requiring Final Action at the End of the Period (September 22, 2019) 9 $81,617,411
Disposition of FTBU:
FTBU Implemented 3 $111,419,056
FTBU Not Implemented $0
Total FTBU Amounts for Final Action Audits $111,419,056
** The beginning balance in Exhibit 47 was adjusted to include one audit with FTBU that was transmitted by OIG after the closing of the reporting period.
The number of audits open 1 or more years without final action in FY 2019 decreased from the previous fiscal year from 65 to 53. The ending inventory includes 35 audits that reached 1 year past the management decision date during FY 2019. USDA agencies continue to pursue remediation and/or compensating controls to address many of the underlying issues identified in these older audits.
EXHIBIT 48: The Number of Audits Open 1 or More Years Past the Management Decision Date (MDD) Remains the Same as the Previous Fiscal Year.
Audits 1 Year or More Past MDD # of Audits
Beginning of the period 65
Plus: Audits that reached 1 year past MDD during FY 2019 35
Subtotal FY 2019 audits 1 year or more past MDD 100
Less: Audits closed 47
Ending balance as of September 30, 2019 53

238 USDA AGENCY FINANCIAL REPORT | 2019
Agencies have completed planned corrective actions with the exception of eight audits under collection for DC (see Exhibit 49).
EXHIBIT 49: Distribution of Audits Open 1 Year or More Past the Management Decision Date (MDD)
Audits Behind Schedule Audits Under Collection
No. DC ($) FTBU ($) No. DC ($) FTBU ($)
45 $2,590,612 $12,674,961 8 $6,386,679 $70,324,242
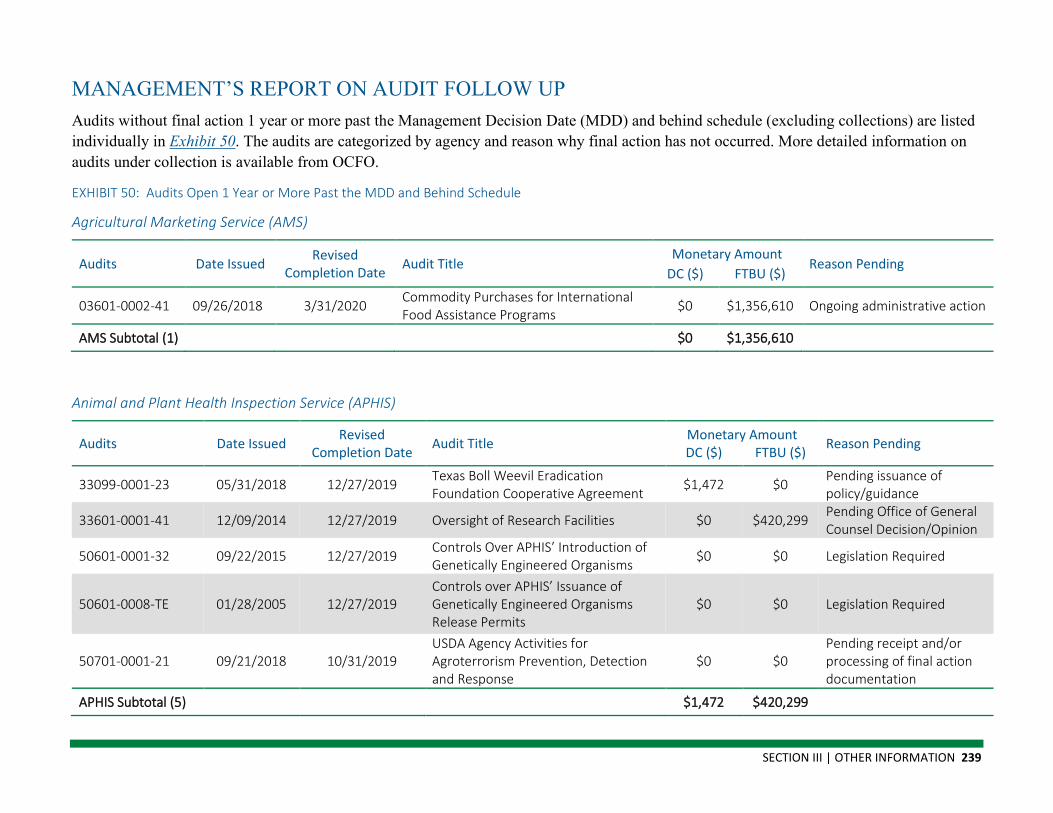
SECTION III | OTHER INFORMATION 239
MANAGEMENT’S REPORT ON AUDIT FOLLOW UP Audits without final action 1 year or more past the Management Decision Date (MDD) and behind schedule (excluding collections) are listed individually in Exhibit 50. The audits are categorized by agency and reason why final action has not occurred. More detailed information on audits under collection is available from OCFO.
EXHIBIT 50: Audits Open 1 Year or More Past the MDD and Behind Schedule
Agricultural Marketing Service (AMS)
Audits Date Issued Revised Completion Date Audit Title
Monetary Amount Reason Pending
DC ($) FTBU ($)
03601-0002-41 09/26/2018 3/31/2020 Commodity Purchases for International Food Assistance Programs $0 $1,356,610 Ongoing administrative action
AMS Subtotal (1) $0 $1,356,610
Animal and Plant Health Inspection Service (APHIS)
Audits Date Issued Revised Completion Date Audit Title Monetary Amount Reason Pending DC ($) FTBU ($)
33099-0001-23 05/31/2018 12/27/2019 Texas Boll Weevil Eradication Foundation Cooperative Agreement $1,472 $0 Pending issuance of
policy/guidance
33601-0001-41 12/09/2014 12/27/2019 Oversight of Research Facilities $0 $420,299 Pending Office of General Counsel Decision/Opinion
50601-0001-32 09/22/2015 12/27/2019 Controls Over APHIS’ Introduction of Genetically Engineered Organisms $0 $0 Legislation Required
50601-0008-TE 01/28/2005 12/27/2019 Controls over APHIS’ Issuance of Genetically Engineered Organisms Release Permits
$0 $0 Legislation Required
50701-0001-21 09/21/2018 10/31/2019 USDA Agency Activities for Agroterrorism Prevention, Detection and Response
$0 $0 Pending receipt and/or processing of final action documentation
APHIS Subtotal (5) $1,472 $420,299

240 USDA AGENCY FINANCIAL REPORT | 2019
Agricultural Research Service (ARS)
Audits Date Issued Revised Completion Date Audit Title
Monetary Amount Reason Pending
DC ($) FTBU ($)
50601-0006-TE 03/04/2004 12/30/2019 ARS’ Controls Over Plant Variety Protection and Germplasm Storage $0 $0 Ongoing Administrative
Action
50601-0010-AT 03/8/2004 12/30/2019
ARS’ Follow Up Report on the Security of Biological Agents at U.S. Department of Agriculture Laboratories
$0 $0 Pending issuance of policy/guidance
ARS Subtotal (2) $0 $0
Commodity Credit Corporation (CCC)
Audits Date Issued Revised Completion Date Audit Title
Monetary Amount Reason Pending
DC ($) FTBU ($)
06401-0005-11 02/12/2016 09/30/2020 CCC’s Financial Statements for FY 2015 and 2014 $0 $0 Pending issuance of
policy/guidance
CCC Subtotal (1) $0 $0
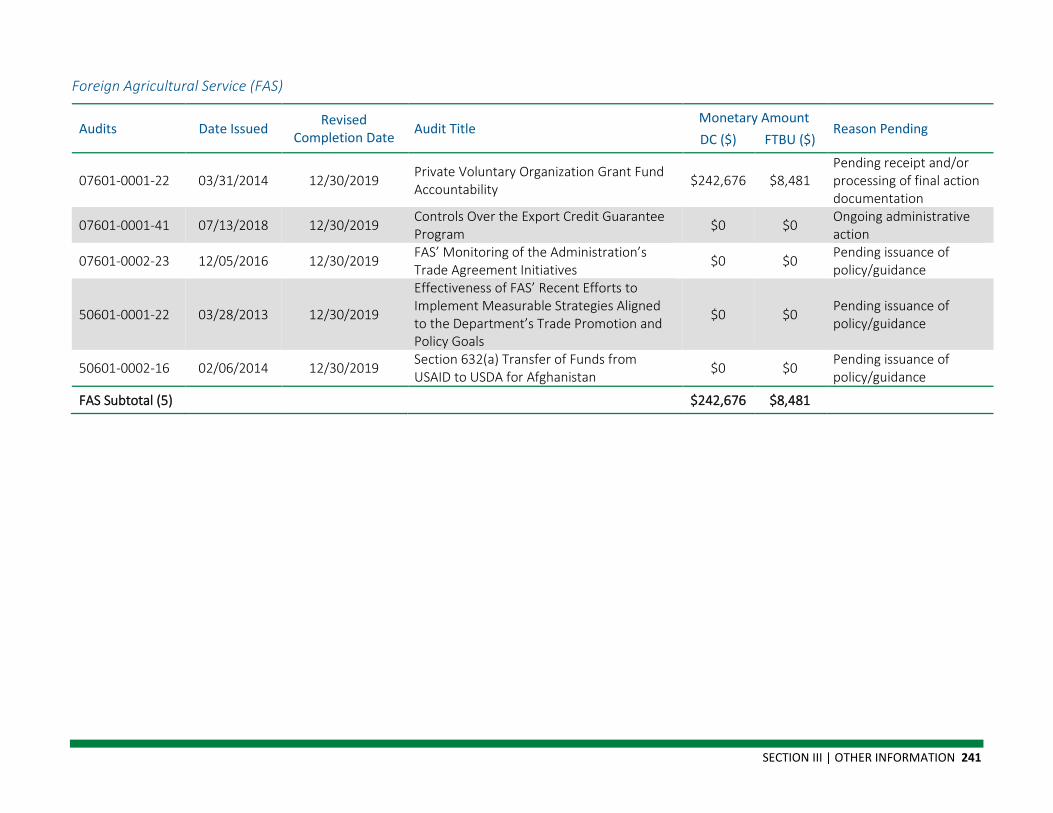
SECTION III | OTHER INFORMATION 241
Foreign Agricultural Service (FAS)
Audits Date Issued Revised Completion Date Audit Title
Monetary Amount Reason Pending
DC ($) FTBU ($)
07601-0001-22 03/31/2014 12/30/2019 Private Voluntary Organization Grant Fund Accountability $242,676 $8,481
Pending receipt and/or processing of final action documentation
07601-0001-41 07/13/2018 12/30/2019 Controls Over the Export Credit Guarantee Program $0 $0 Ongoing administrative
action
07601-0002-23 12/05/2016 12/30/2019 FAS’ Monitoring of the Administration’s Trade Agreement Initiatives $0 $0 Pending issuance of
policy/guidance
50601-0001-22 03/28/2013 12/30/2019
Effectiveness of FAS’ Recent Efforts to Implement Measurable Strategies Aligned to the Department’s Trade Promotion and Policy Goals
$0 $0 Pending issuance of policy/guidance
50601-0002-16 02/06/2014 12/30/2019 Section 632(a) Transfer of Funds from USAID to USDA for Afghanistan $0 $0 Pending issuance of
policy/guidance
FAS Subtotal (5) $242,676 $8,481
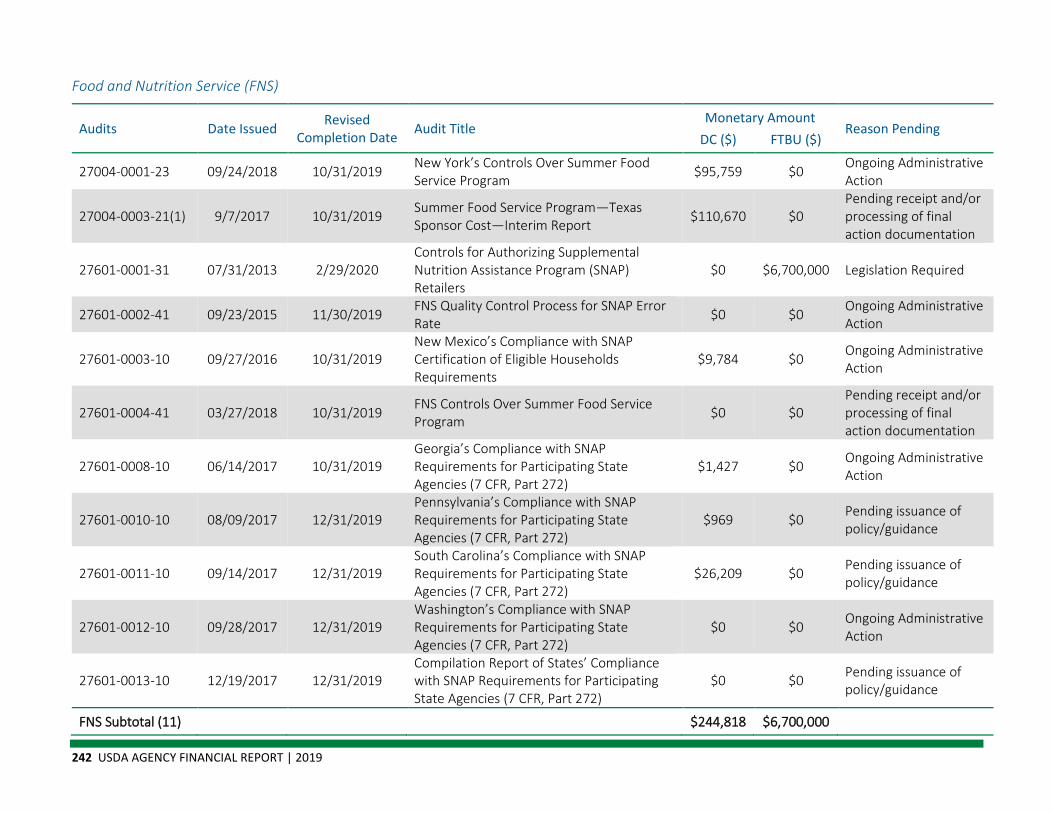
242 USDA AGENCY FINANCIAL REPORT | 2019
Food and Nutrition Service (FNS)
Audits Date Issued Revised Completion Date Audit Title
Monetary Amount Reason Pending
DC ($) FTBU ($)
27004-0001-23 09/24/2018 10/31/2019 New York’s Controls Over Summer Food Service Program $95,759 $0 Ongoing Administrative
Action
27004-0003-21(1) 9/7/2017 10/31/2019 Summer Food Service Program—Texas Sponsor Cost—Interim Report $110,670 $0
Pending receipt and/or processing of final action documentation
27601-0001-31 07/31/2013 2/29/2020 Controls for Authorizing Supplemental Nutrition Assistance Program (SNAP) Retailers
$0 $6,700,000 Legislation Required
27601-0002-41 09/23/2015 11/30/2019 FNS Quality Control Process for SNAP Error Rate $0 $0 Ongoing Administrative
Action
27601-0003-10 09/27/2016 10/31/2019 New Mexico’s Compliance with SNAP Certification of Eligible Households Requirements
$9,784 $0 Ongoing Administrative Action
27601-0004-41 03/27/2018 10/31/2019 FNS Controls Over Summer Food Service Program $0 $0
Pending receipt and/or processing of final action documentation
27601-0008-10 06/14/2017 10/31/2019 Georgia’s Compliance with SNAP Requirements for Participating State Agencies (7 CFR, Part 272)
$1,427 $0 Ongoing Administrative Action
27601-0010-10 08/09/2017 12/31/2019 Pennsylvania’s Compliance with SNAP Requirements for Participating State Agencies (7 CFR, Part 272)
$969 $0 Pending issuance of policy/guidance
27601-0011-10 09/14/2017 12/31/2019 South Carolina’s Compliance with SNAP Requirements for Participating State Agencies (7 CFR, Part 272)
$26,209 $0 Pending issuance of policy/guidance
27601-0012-10 09/28/2017 12/31/2019 Washington’s Compliance with SNAP Requirements for Participating State Agencies (7 CFR, Part 272)
$0 $0 Ongoing Administrative Action
27601-0013-10 12/19/2017 12/31/2019 Compilation Report of States’ Compliance with SNAP Requirements for Participating State Agencies (7 CFR, Part 272)
$0 $0 Pending issuance of policy/guidance
FNS Subtotal (11) $244,818 $6,700,000
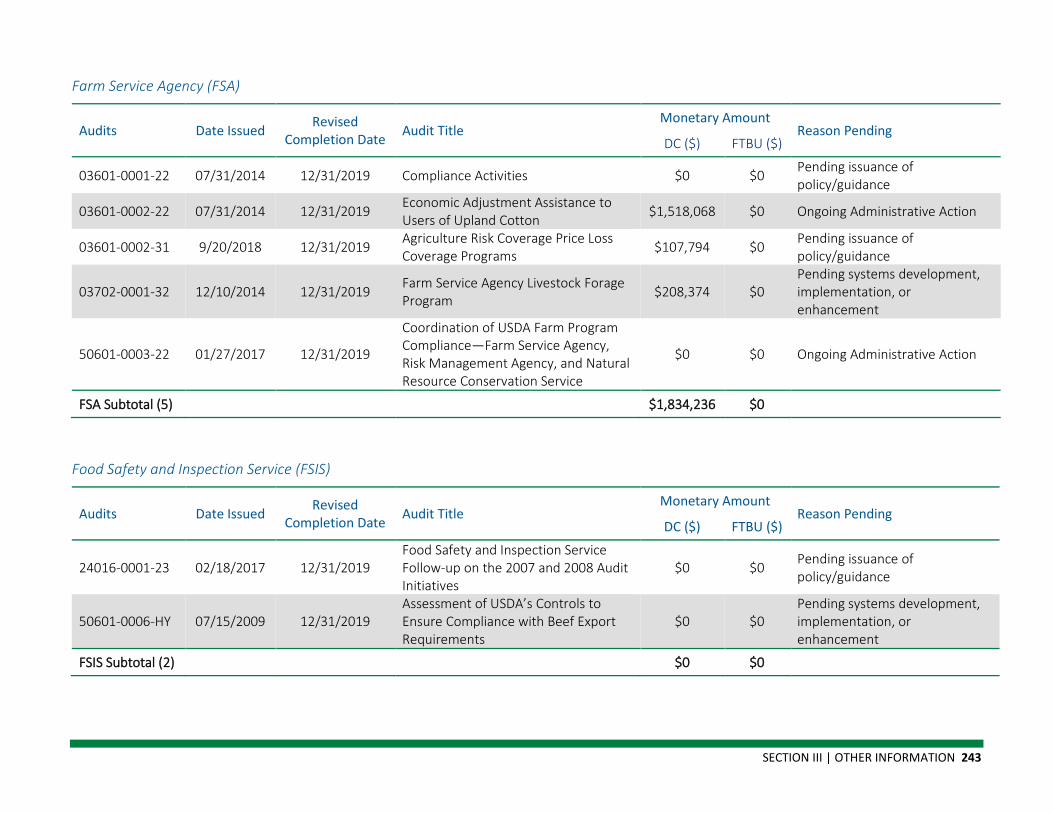
SECTION III | OTHER INFORMATION 243
Farm Service Agency (FSA)
Audits Date Issued Revised Completion Date Audit Title
Monetary Amount Reason Pending
DC ($) FTBU ($)
03601-0001-22 07/31/2014 12/31/2019 Compliance Activities $0 $0 Pending issuance of policy/guidance
03601-0002-22 07/31/2014 12/31/2019 Economic Adjustment Assistance to Users of Upland Cotton $1,518,068 $0 Ongoing Administrative Action
03601-0002-31 9/20/2018 12/31/2019 Agriculture Risk Coverage Price Loss Coverage Programs $107,794 $0 Pending issuance of
policy/guidance
03702-0001-32 12/10/2014 12/31/2019 Farm Service Agency Livestock Forage Program $208,374 $0
Pending systems development, implementation, or enhancement
50601-0003-22 01/27/2017 12/31/2019
Coordination of USDA Farm Program Compliance—Farm Service Agency, Risk Management Agency, and Natural Resource Conservation Service
$0 $0 Ongoing Administrative Action
FSA Subtotal (5) $1,834,236 $0
Food Safety and Inspection Service (FSIS)
Audits Date Issued Revised Completion Date Audit Title
Monetary Amount Reason Pending
DC ($) FTBU ($)
24016-0001-23 02/18/2017 12/31/2019 Food Safety and Inspection Service Follow-up on the 2007 and 2008 Audit Initiatives
$0 $0 Pending issuance of policy/guidance
50601-0006-HY 07/15/2009 12/31/2019 Assessment of USDA’s Controls to Ensure Compliance with Beef Export Requirements
$0 $0 Pending systems development, implementation, or enhancement
FSIS Subtotal (2) $0 $0
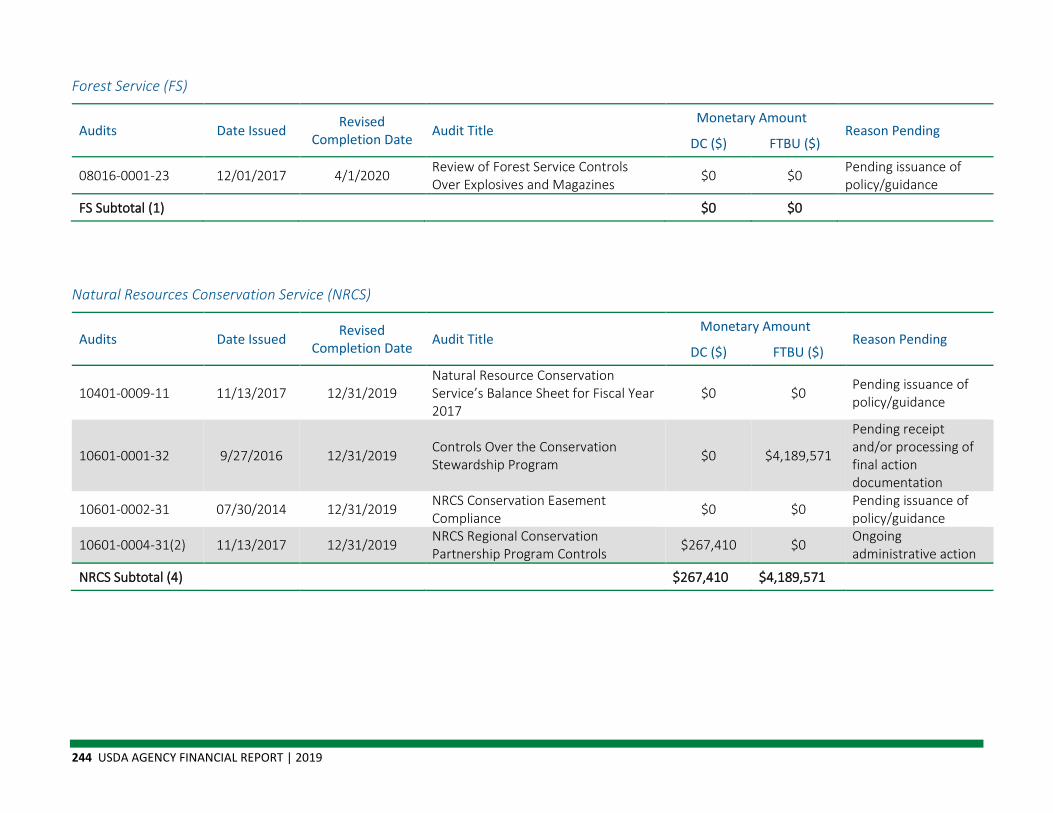
244 USDA AGENCY FINANCIAL REPORT | 2019
Forest Service (FS)
Audits Date Issued Revised Completion Date Audit Title
Monetary Amount Reason Pending
DC ($) FTBU ($)
08016-0001-23 12/01/2017 4/1/2020 Review of Forest Service Controls Over Explosives and Magazines $0 $0 Pending issuance of
policy/guidance
FS Subtotal (1) $0 $0
Natural Resources Conservation Service (NRCS)
Audits Date Issued Revised Completion Date Audit Title
Monetary Amount Reason Pending
DC ($) FTBU ($)
10401-0009-11 11/13/2017 12/31/2019 Natural Resource Conservation Service’s Balance Sheet for Fiscal Year 2017
$0 $0 Pending issuance of policy/guidance
10601-0001-32 9/27/2016 12/31/2019 Controls Over the Conservation Stewardship Program $0 $4,189,571
Pending receipt and/or processing of final action documentation
10601-0002-31 07/30/2014 12/31/2019 NRCS Conservation Easement Compliance $0 $0 Pending issuance of
policy/guidance
10601-0004-31(2) 11/13/2017 12/31/2019 NRCS Regional Conservation Partnership Program Controls $267,410 $0 Ongoing
administrative action
NRCS Subtotal (4) $267,410 $4,189,571
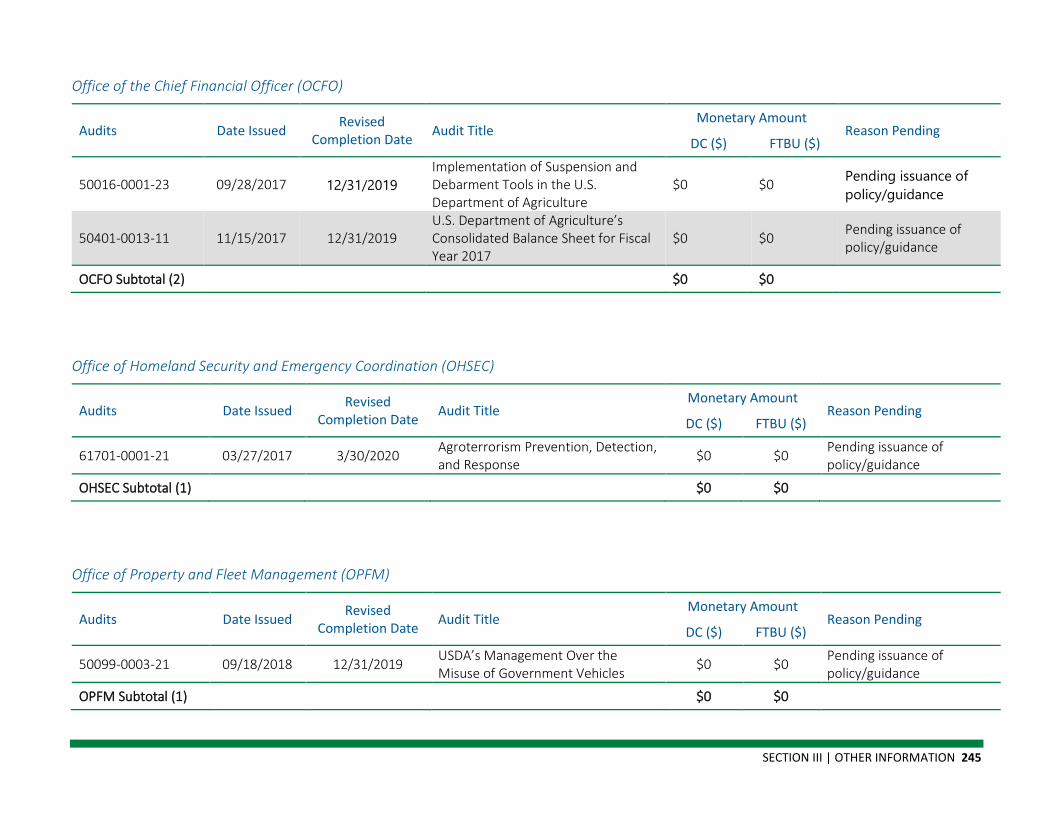
SECTION III | OTHER INFORMATION 245
Office of the Chief Financial Officer (OCFO)
Audits Date Issued Revised Completion Date Audit Title
Monetary Amount Reason Pending
DC ($) FTBU ($)
50016-0001-23 09/28/2017 12/31/2019 Implementation of Suspension and Debarment Tools in the U.S. Department of Agriculture
$0 $0 Pending issuance of policy/guidance
50401-0013-11 11/15/2017 12/31/2019 U.S. Department of Agriculture’s Consolidated Balance Sheet for Fiscal Year 2017
$0 $0 Pending issuance of policy/guidance
OCFO Subtotal (2) $0 $0
Office of Homeland Security and Emergency Coordination (OHSEC)
Audits Date Issued Revised Completion Date Audit Title
Monetary Amount Reason Pending
DC ($) FTBU ($)
61701-0001-21 03/27/2017 3/30/2020 Agroterrorism Prevention, Detection, and Response $0 $0 Pending issuance of
policy/guidance
OHSEC Subtotal (1) $0 $0
Office of Property and Fleet Management (OPFM)
Audits Date Issued Revised Completion Date Audit Title
Monetary Amount Reason Pending
DC ($) FTBU ($)
50099-0003-21 09/18/2018 12/31/2019 USDA’s Management Over the Misuse of Government Vehicles $0 $0 Pending issuance of
policy/guidance
OPFM Subtotal (1) $0 $0
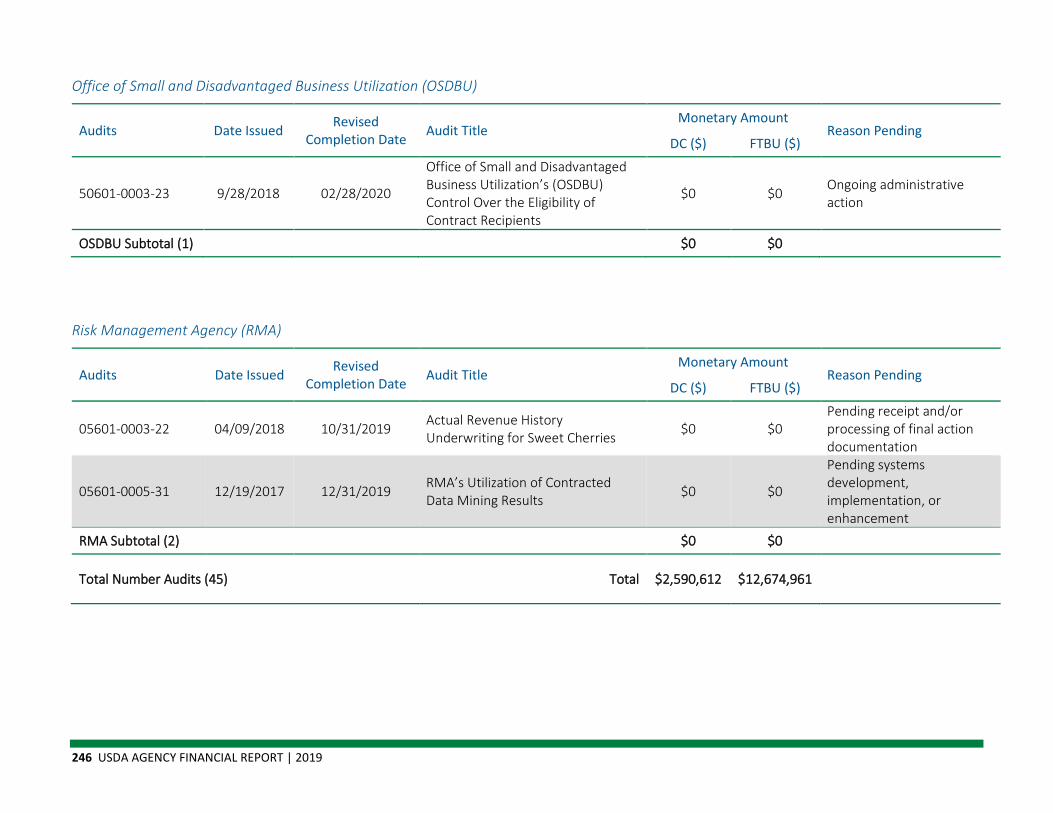
246 USDA AGENCY FINANCIAL REPORT | 2019
Office of Small and Disadvantaged Business Utilization (OSDBU)
Audits Date Issued Revised Completion Date Audit Title
Monetary Amount Reason Pending
DC ($) FTBU ($)
50601-0003-23 9/28/2018 02/28/2020
Office of Small and Disadvantaged Business Utilization’s (OSDBU) Control Over the Eligibility of Contract Recipients
$0 $0 Ongoing administrative action
OSDBU Subtotal (1) $0 $0
Risk Management Agency (RMA)
Audits Date Issued Revised Completion Date Audit Title
Monetary Amount Reason Pending
DC ($) FTBU ($)
05601-0003-22 04/09/2018 10/31/2019 Actual Revenue History Underwriting for Sweet Cherries $0 $0
Pending receipt and/or processing of final action documentation
05601-0005-31 12/19/2017 12/31/2019 RMA’s Utilization of Contracted Data Mining Results $0 $0
Pending systems development, implementation, or enhancement
RMA Subtotal (2) $0 $0
Total Number Audits (45) Total $2,590,612 $12,674,961
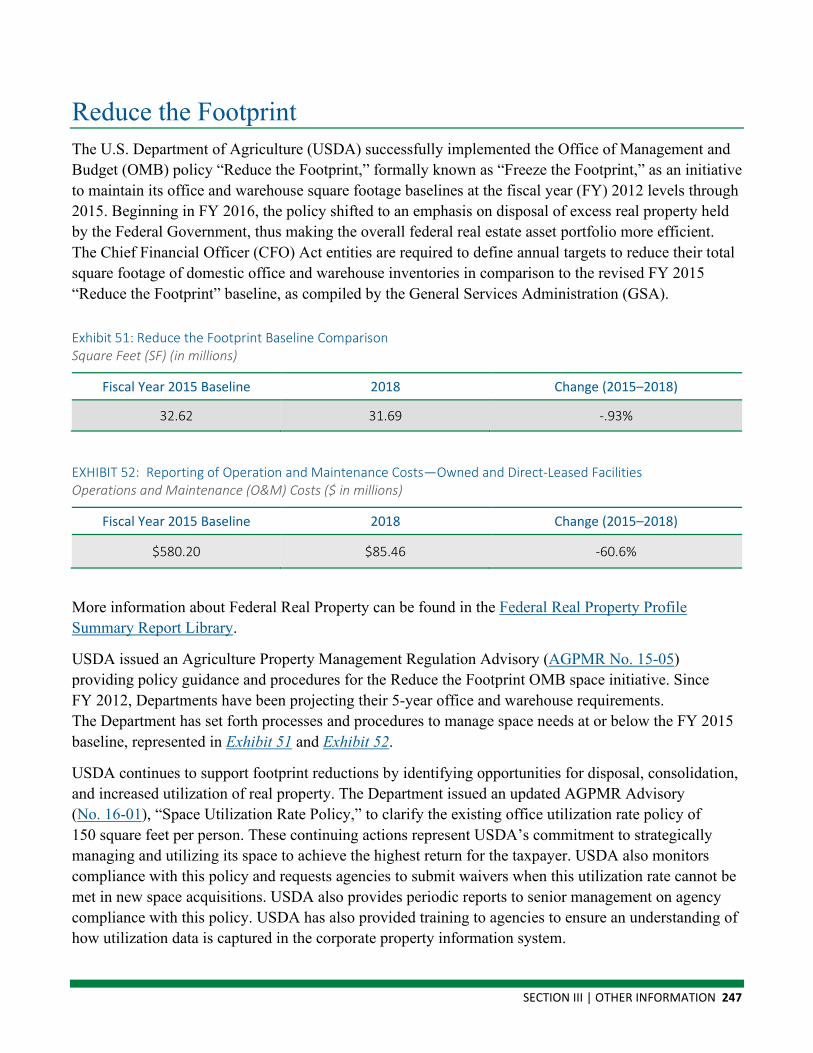
SECTION III | OTHER INFORMATION 247
Reduce the Footprint The U.S. Department of Agriculture (USDA) successfully implemented the Office of Management and Budget (OMB) policy “Reduce the Footprint,” formally known as “Freeze the Footprint,” as an initiative to maintain its office and warehouse square footage baselines at the fiscal year (FY) 2012 levels through 2015. Beginning in FY 2016, the policy shifted to an emphasis on disposal of excess real property held by the Federal Government, thus making the overall federal real estate asset portfolio more efficient. The Chief Financial Officer (CFO) Act entities are required to define annual targets to reduce their total square footage of domestic office and warehouse inventories in comparison to the revised FY 2015 “Reduce the Footprint” baseline, as compiled by the General Services Administration (GSA).
Exhibit 51: Reduce the Footprint Baseline Comparison Square Feet (SF) (in millions)
Fiscal Year 2015 Baseline 2018 Change (2015–2018)
32.62 31.69 -.93%
EXHIBIT 52: Reporting of Operation and Maintenance Costs—Owned and Direct-Leased Facilities Operations and Maintenance (O&M) Costs ($ in millions)
Fiscal Year 2015 Baseline 2018 Change (2015–2018)
$580.20 $85.46 -60.6%
More information about Federal Real Property can be found in the Federal Real Property Profile Summary Report Library.
USDA issued an Agriculture Property Management Regulation Advisory (AGPMR No. 15-05) providing policy guidance and procedures for the Reduce the Footprint OMB space initiative. Since FY 2012, Departments have been projecting their 5-year office and warehouse requirements. The Department has set forth processes and procedures to manage space needs at or below the FY 2015 baseline, represented in Exhibit 51 and Exhibit 52.
USDA continues to support footprint reductions by identifying opportunities for disposal, consolidation, and increased utilization of real property. The Department issued an updated AGPMR Advisory (No. 16-01), “Space Utilization Rate Policy,” to clarify the existing office utilization rate policy of 150 square feet per person. These continuing actions represent USDA’s commitment to strategically managing and utilizing its space to achieve the highest return for the taxpayer. USDA also monitors compliance with this policy and requests agencies to submit waivers when this utilization rate cannot be met in new space acquisitions. USDA also provides periodic reports to senior management on agency compliance with this policy. USDA has also provided training to agencies to ensure an understanding of how utilization data is captured in the corporate property information system.
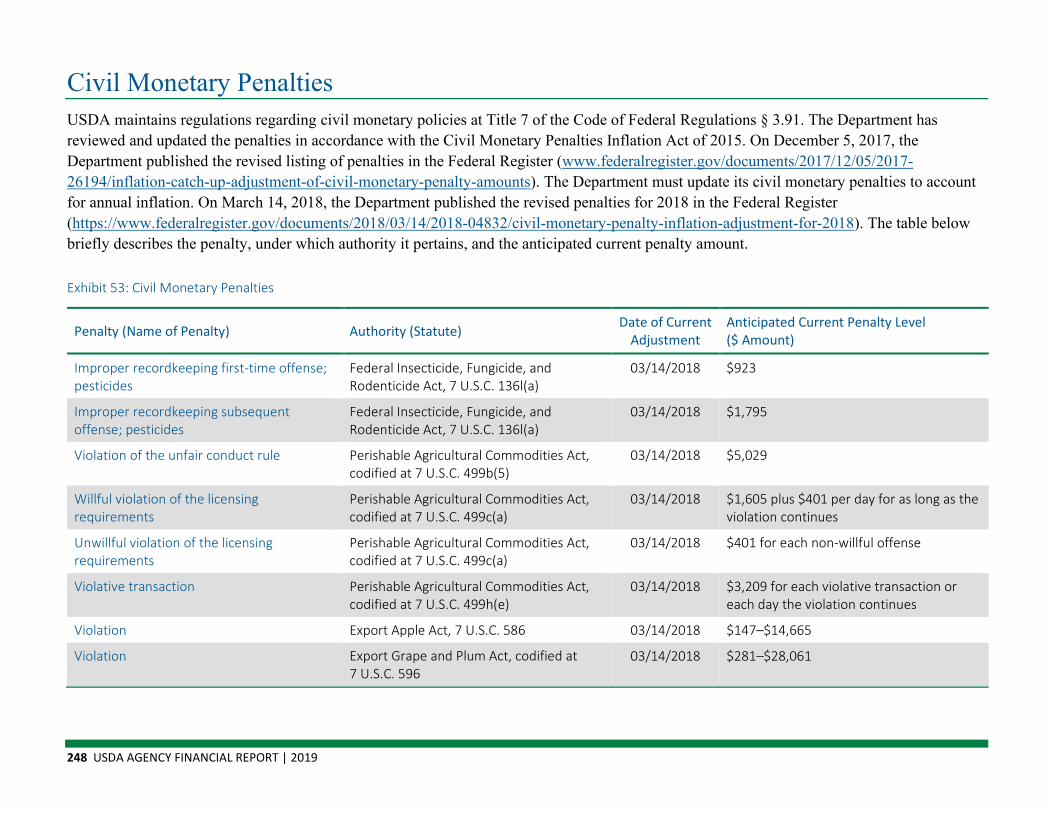
248 USDA AGENCY FINANCIAL REPORT | 2019
Civil Monetary Penalties USDA maintains regulations regarding civil monetary policies at Title 7 of the Code of Federal Regulations § 3.91. The Department has reviewed and updated the penalties in accordance with the Civil Monetary Penalties Inflation Act of 2015. On December 5, 2017, the Department published the revised listing of penalties in the Federal Register (www.federalregister.gov/documents/2017/12/05/2017-26194/inflation-catch-up-adjustment-of-civil-monetary-penalty-amounts). The Department must update its civil monetary penalties to account for annual inflation. On March 14, 2018, the Department published the revised penalties for 2018 in the Federal Register (https://www.federalregister.gov/documents/2018/03/14/2018-04832/civil-monetary-penalty-inflation-adjustment-for-2018). The table below briefly describes the penalty, under which authority it pertains, and the anticipated current penalty amount.
Exhibit 53: Civil Monetary Penalties
Penalty (Name of Penalty) Authority (Statute) Date of Current Adjustment
Anticipated Current Penalty Level ($ Amount)
Improper recordkeeping first-time offense; pesticides
Federal Insecticide, Fungicide, and Rodenticide Act, 7 U.S.C. 136l(a)
03/14/2018 $923
Improper recordkeeping subsequent offense; pesticides
Federal Insecticide, Fungicide, and Rodenticide Act, 7 U.S.C. 136l(a)
03/14/2018 $1,795
Violation of the unfair conduct rule Perishable Agricultural Commodities Act, codified at 7 U.S.C. 499b(5)
03/14/2018 $5,029
Willful violation of the licensing requirements
Perishable Agricultural Commodities Act, codified at 7 U.S.C. 499c(a)
03/14/2018 $1,605 plus $401 per day for as long as the violation continues
Unwillful violation of the licensing requirements
Perishable Agricultural Commodities Act, codified at 7 U.S.C. 499c(a)
03/14/2018 $401 for each non-willful offense
Violative transaction Perishable Agricultural Commodities Act, codified at 7 U.S.C. 499h(e)
03/14/2018 $3,209 for each violative transaction or each day the violation continues
Violation Export Apple Act, 7 U.S.C. 586 03/14/2018 $147–$14,665
Violation Export Grape and Plum Act, codified at 7 U.S.C. 596
03/14/2018 $281–$28,061
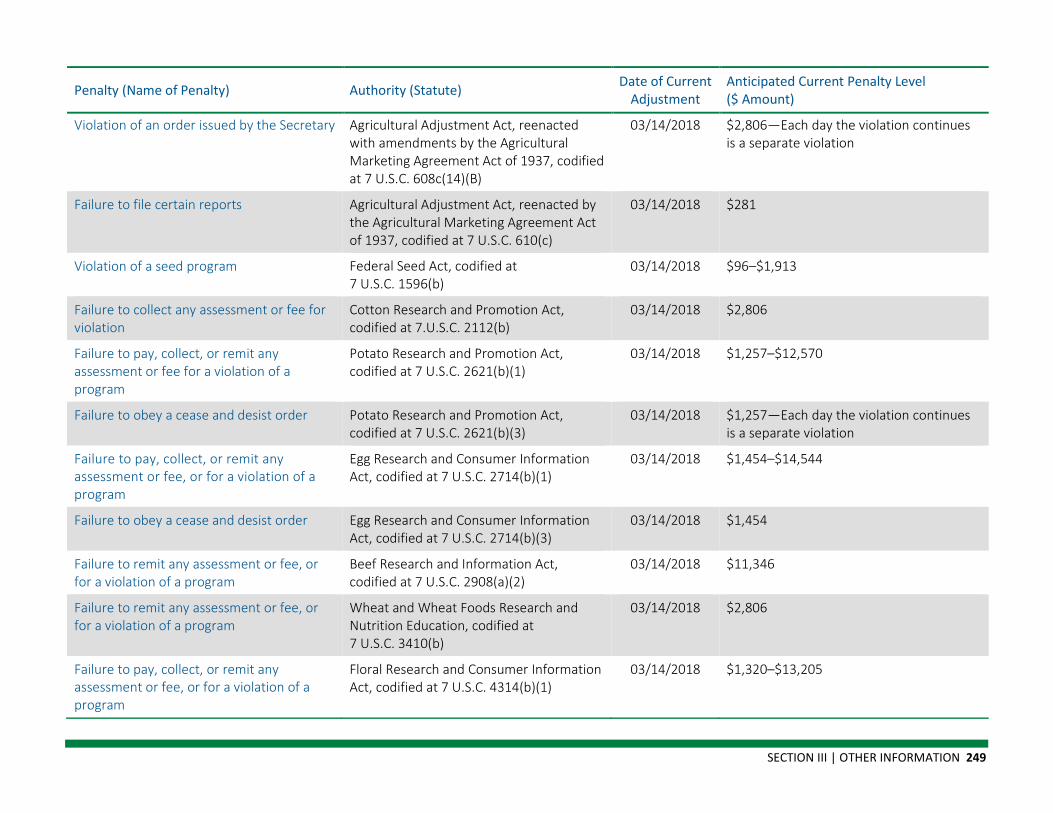
SECTION III | OTHER INFORMATION 249
Penalty (Name of Penalty) Authority (Statute) Date of Current Adjustment
Anticipated Current Penalty Level ($ Amount)
Violation of an order issued by the Secretary Agricultural Adjustment Act, reenacted with amendments by the Agricultural Marketing Agreement Act of 1937, codified at 7 U.S.C. 608c(14)(B)
03/14/2018 $2,806—Each day the violation continues is a separate violation
Failure to file certain reports Agricultural Adjustment Act, reenacted by the Agricultural Marketing Agreement Act of 1937, codified at 7 U.S.C. 610(c)
03/14/2018 $281
Violation of a seed program Federal Seed Act, codified at 7 U.S.C. 1596(b)
03/14/2018 $96–$1,913
Failure to collect any assessment or fee for violation
Cotton Research and Promotion Act, codified at 7.U.S.C. 2112(b)
03/14/2018 $2,806
Failure to pay, collect, or remit any assessment or fee for a violation of a program
Potato Research and Promotion Act, codified at 7 U.S.C. 2621(b)(1)
03/14/2018 $1,257–$12,570
Failure to obey a cease and desist order Potato Research and Promotion Act, codified at 7 U.S.C. 2621(b)(3)
03/14/2018 $1,257—Each day the violation continues is a separate violation
Failure to pay, collect, or remit any assessment or fee, or for a violation of a program
Egg Research and Consumer Information Act, codified at 7 U.S.C. 2714(b)(1)
03/14/2018 $1,454–$14,544
Failure to obey a cease and desist order Egg Research and Consumer Information Act, codified at 7 U.S.C. 2714(b)(3)
03/14/2018 $1,454
Failure to remit any assessment or fee, or for a violation of a program
Beef Research and Information Act, codified at 7 U.S.C. 2908(a)(2)
03/14/2018 $11,346
Failure to remit any assessment or fee, or for a violation of a program
Wheat and Wheat Foods Research and Nutrition Education, codified at 7 U.S.C. 3410(b)
03/14/2018 $2,806
Failure to pay, collect, or remit any assessment or fee, or for a violation of a program
Floral Research and Consumer Information Act, codified at 7 U.S.C. 4314(b)(1)
03/14/2018 $1,320–$13,205
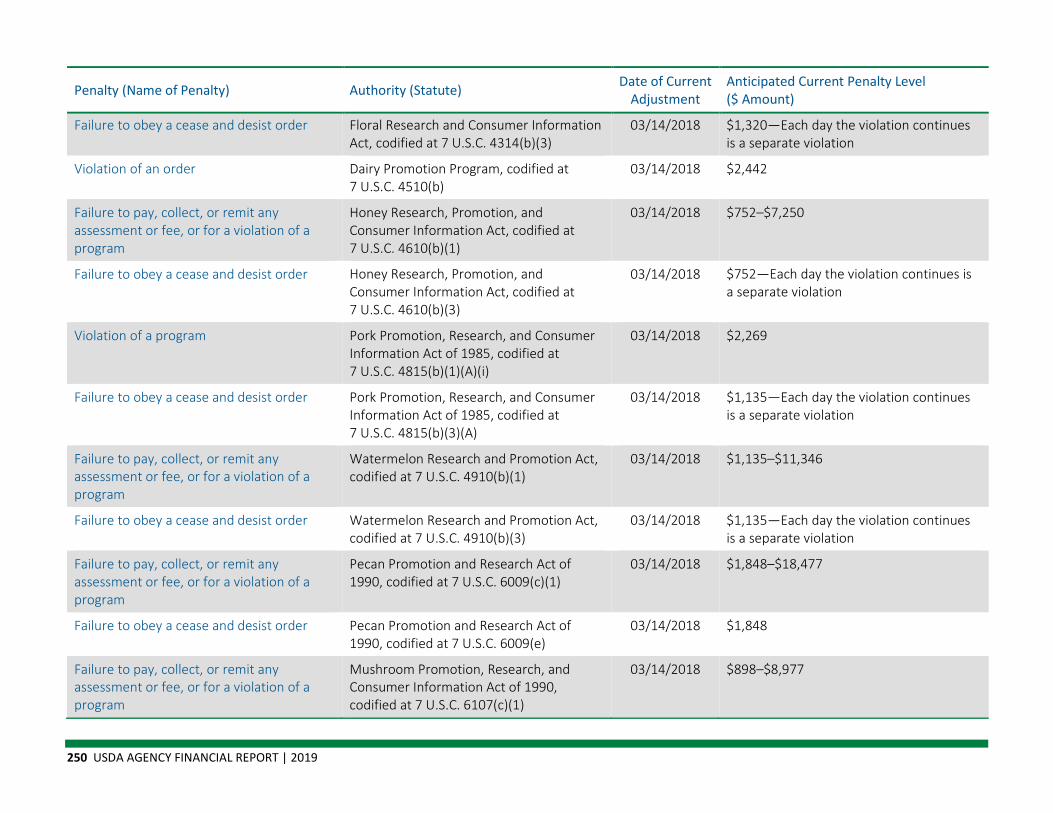
250 USDA AGENCY FINANCIAL REPORT | 2019
Penalty (Name of Penalty) Authority (Statute) Date of Current Adjustment
Anticipated Current Penalty Level ($ Amount)
Failure to obey a cease and desist order Floral Research and Consumer Information Act, codified at 7 U.S.C. 4314(b)(3)
03/14/2018 $1,320—Each day the violation continues is a separate violation
Violation of an order Dairy Promotion Program, codified at 7 U.S.C. 4510(b)
03/14/2018 $2,442
Failure to pay, collect, or remit any assessment or fee, or for a violation of a program
Honey Research, Promotion, and Consumer Information Act, codified at 7 U.S.C. 4610(b)(1)
03/14/2018 $752–$7,250
Failure to obey a cease and desist order Honey Research, Promotion, and Consumer Information Act, codified at 7 U.S.C. 4610(b)(3)
03/14/2018 $752—Each day the violation continues is a separate violation
Violation of a program Pork Promotion, Research, and Consumer Information Act of 1985, codified at 7 U.S.C. 4815(b)(1)(A)(i)
03/14/2018 $2,269
Failure to obey a cease and desist order Pork Promotion, Research, and Consumer Information Act of 1985, codified at 7 U.S.C. 4815(b)(3)(A)
03/14/2018 $1,135—Each day the violation continues is a separate violation
Failure to pay, collect, or remit any assessment or fee, or for a violation of a program
Watermelon Research and Promotion Act, codified at 7 U.S.C. 4910(b)(1)
03/14/2018 $1,135–$11,346
Failure to obey a cease and desist order Watermelon Research and Promotion Act, codified at 7 U.S.C. 4910(b)(3)
03/14/2018 $1,135—Each day the violation continues is a separate violation
Failure to pay, collect, or remit any assessment or fee, or for a violation of a program
Pecan Promotion and Research Act of 1990, codified at 7 U.S.C. 6009(c)(1)
03/14/2018 $1,848–$18,477
Failure to obey a cease and desist order Pecan Promotion and Research Act of 1990, codified at 7 U.S.C. 6009(e)
03/14/2018 $1,848
Failure to pay, collect, or remit any assessment or fee, or for a violation of a program
Mushroom Promotion, Research, and Consumer Information Act of 1990, codified at 7 U.S.C. 6107(c)(1)
03/14/2018 $898–$8,977

SECTION III | OTHER INFORMATION 251
Penalty (Name of Penalty) Authority (Statute) Date of Current Adjustment
Anticipated Current Penalty Level ($ Amount)
Failure to obey a cease and desist order Mushroom Promotion, Research, and Consumer Information Act of 1990, codified at 7 U.S.C. 6107(e)
03/14/2018 $898—Each day the violation continues is a separate violation
Failure to pay, collect, or remit any assessment or fee, or for a violation of a program
Lime Research, Promotion, and Consumer Information Act of 1990, codified at 7 U.S.C. 6207(c)(1)
03/14/2018 $898–$8977
Failure to obey a cease and desist order Lime Research, Promotion, and Consumer Information Act of 1990, codified at 7 U.S.C. 6207(e)
03/14/2018 $898—Each day the violation continues is a separate violation
Failure to pay, collect, or remit any assessment or fee, or for a violation of a program
Soybean Promotion, Research, and Consumer Information Act, codified at 7 U.S.C. 6307(c)(1)(A)
03/14/2018 $1,848
Failure to obey a cease and desist order Soybean Promotion, Research, and Consumer Information Act, codified at 7 U.S.C. 6307(e)
03/14/2018 $9,239—Each day the violation continues is a separate violation
Failure to pay, collect, or remit any assessment or fee, or for an unwillful violation of a program
Fluid Milk Promotion Act of 1990, codified at 7 U.S.C. 6411(c)(1)(A)
03/14/2018 $898–$8,977
Failure to pay, collect, or remit any assessment or fee, or for a willful violation of a program
Fluid Milk Promotion Act of 1990, codified at U.S.C. 6411(c)(1)(B)
03/14/2018 $17,952–$179,522
Failure to obey a cease and desist order Fluid Milk Promotion Act of 1990, codified at 7 U.S.C. 6411(e)
03/14/2018 $9,239
Knowingly labeling or selling a product as organic except in accordance with the Organic Foods Production Act of 1990
Organic Foods Production Act of 1990, codified at 7 U.S.C. 6519(c)
03/14/2018 $17,952
Failure to pay, collect, or remit any assessment or fee, or for a violation of a program
Fresh Cut Flowers and Fresh Cut Greens Promotion and Information Act of 1993, codified at 7 U.S.C. 6808(c)(1)(A)(i)
03/14/2018 $847–$8,464
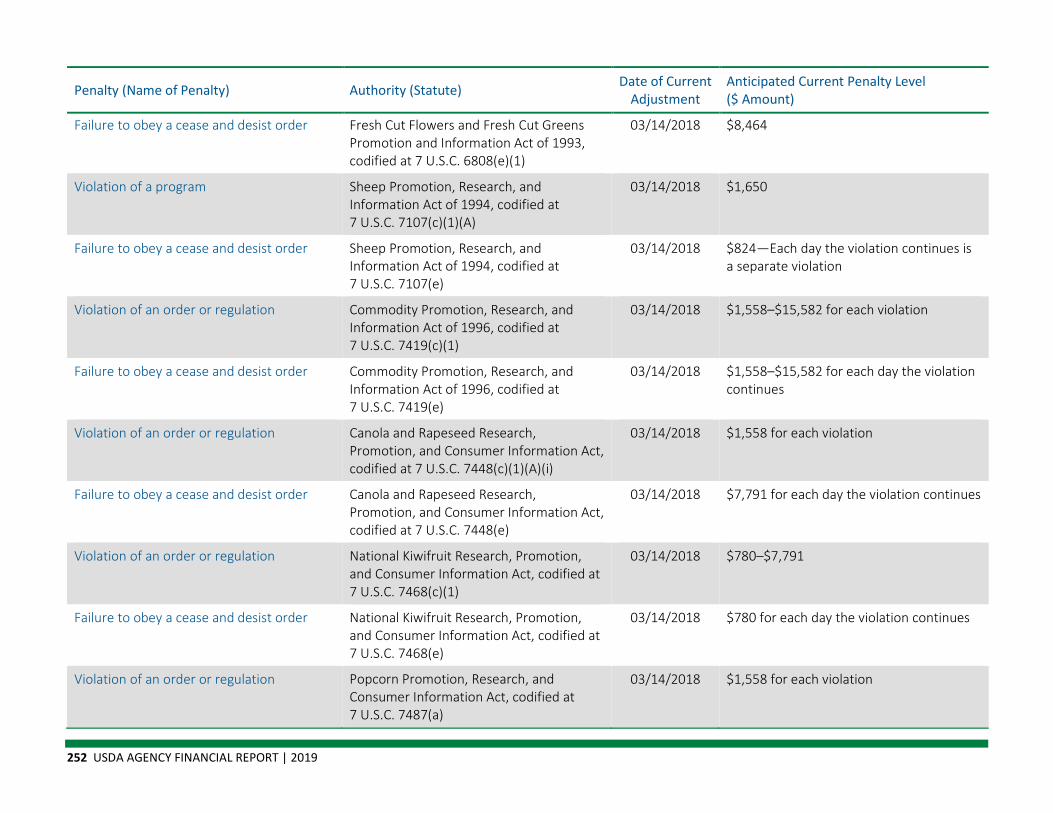
252 USDA AGENCY FINANCIAL REPORT | 2019
Penalty (Name of Penalty) Authority (Statute) Date of Current Adjustment
Anticipated Current Penalty Level ($ Amount)
Failure to obey a cease and desist order Fresh Cut Flowers and Fresh Cut Greens Promotion and Information Act of 1993, codified at 7 U.S.C. 6808(e)(1)
03/14/2018 $8,464
Violation of a program Sheep Promotion, Research, and Information Act of 1994, codified at 7 U.S.C. 7107(c)(1)(A)
03/14/2018 $1,650
Failure to obey a cease and desist order Sheep Promotion, Research, and Information Act of 1994, codified at 7 U.S.C. 7107(e)
03/14/2018 $824—Each day the violation continues is a separate violation
Violation of an order or regulation Commodity Promotion, Research, and Information Act of 1996, codified at 7 U.S.C. 7419(c)(1)
03/14/2018 $1,558–$15,582 for each violation
Failure to obey a cease and desist order Commodity Promotion, Research, and Information Act of 1996, codified at 7 U.S.C. 7419(e)
03/14/2018 $1,558–$15,582 for each day the violation continues
Violation of an order or regulation Canola and Rapeseed Research, Promotion, and Consumer Information Act, codified at 7 U.S.C. 7448(c)(1)(A)(i)
03/14/2018 $1,558 for each violation
Failure to obey a cease and desist order Canola and Rapeseed Research, Promotion, and Consumer Information Act, codified at 7 U.S.C. 7448(e)
03/14/2018 $7,791 for each day the violation continues
Violation of an order or regulation National Kiwifruit Research, Promotion, and Consumer Information Act, codified at 7 U.S.C. 7468(c)(1)
03/14/2018 $780–$7,791
Failure to obey a cease and desist order National Kiwifruit Research, Promotion, and Consumer Information Act, codified at 7 U.S.C. 7468(e)
03/14/2018 $780 for each day the violation continues
Violation of an order or regulation Popcorn Promotion, Research, and Consumer Information Act, codified at 7 U.S.C. 7487(a)
03/14/2018 $1,558 for each violation
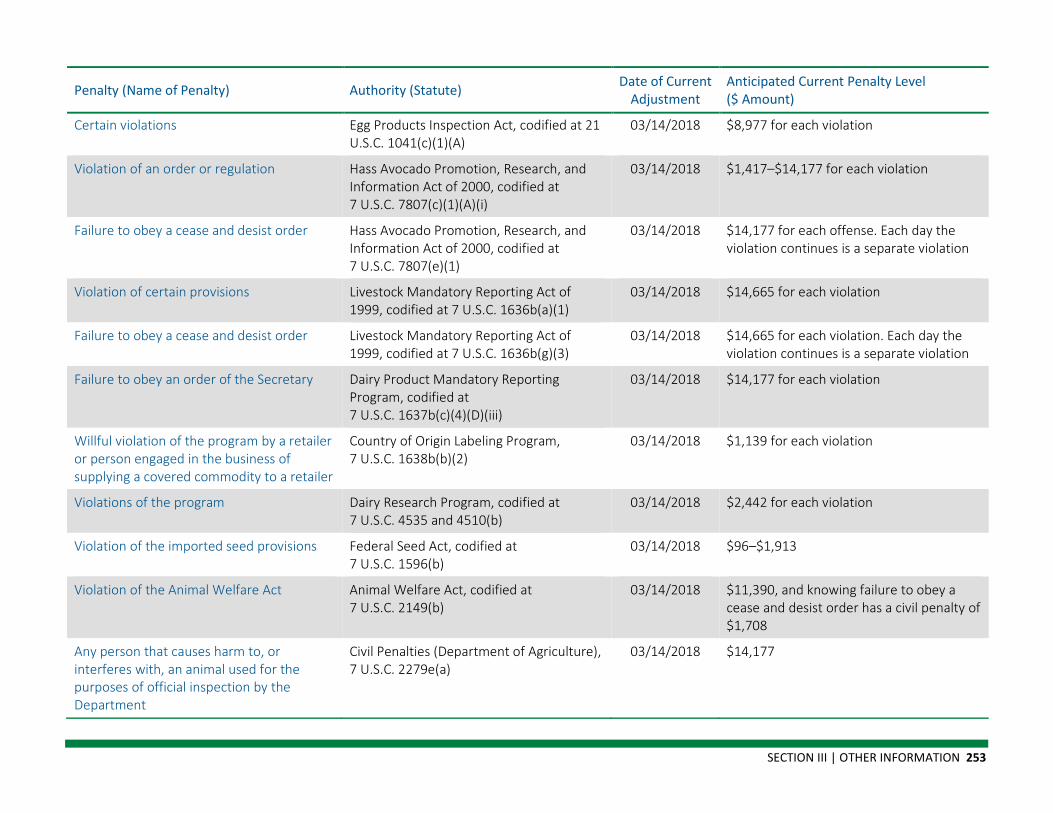
SECTION III | OTHER INFORMATION 253
Penalty (Name of Penalty) Authority (Statute) Date of Current Adjustment
Anticipated Current Penalty Level ($ Amount)
Certain violations Egg Products Inspection Act, codified at 21 U.S.C. 1041(c)(1)(A)
03/14/2018 $8,977 for each violation
Violation of an order or regulation Hass Avocado Promotion, Research, and Information Act of 2000, codified at 7 U.S.C. 7807(c)(1)(A)(i)
03/14/2018 $1,417–$14,177 for each violation
Failure to obey a cease and desist order Hass Avocado Promotion, Research, and Information Act of 2000, codified at 7 U.S.C. 7807(e)(1)
03/14/2018 $14,177 for each offense. Each day the violation continues is a separate violation
Violation of certain provisions Livestock Mandatory Reporting Act of 1999, codified at 7 U.S.C. 1636b(a)(1)
03/14/2018 $14,665 for each violation
Failure to obey a cease and desist order Livestock Mandatory Reporting Act of 1999, codified at 7 U.S.C. 1636b(g)(3)
03/14/2018 $14,665 for each violation. Each day the violation continues is a separate violation
Failure to obey an order of the Secretary Dairy Product Mandatory Reporting Program, codified at 7 U.S.C. 1637b(c)(4)(D)(iii)
03/14/2018 $14,177 for each violation
Willful violation of the program by a retailer or person engaged in the business of supplying a covered commodity to a retailer
Country of Origin Labeling Program, 7 U.S.C. 1638b(b)(2)
03/14/2018 $1,139 for each violation
Violations of the program Dairy Research Program, codified at 7 U.S.C. 4535 and 4510(b)
03/14/2018 $2,442 for each violation
Violation of the imported seed provisions Federal Seed Act, codified at 7 U.S.C. 1596(b)
03/14/2018 $96–$1,913
Violation of the Animal Welfare Act Animal Welfare Act, codified at 7 U.S.C. 2149(b)
03/14/2018 $11,390, and knowing failure to obey a cease and desist order has a civil penalty of $1,708
Any person that causes harm to, or interferes with, an animal used for the purposes of official inspection by the Department
Civil Penalties (Department of Agriculture), 7 U.S.C. 2279e(a)
03/14/2018 $14,177
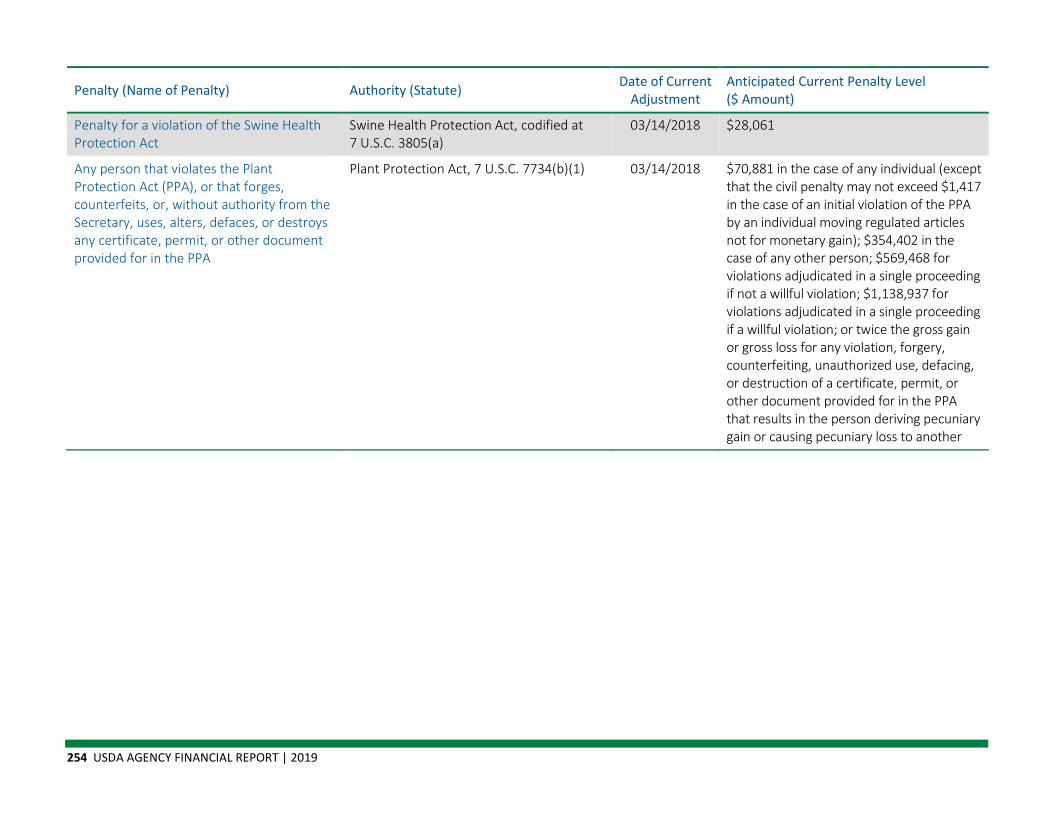
254 USDA AGENCY FINANCIAL REPORT | 2019
Penalty (Name of Penalty) Authority (Statute) Date of Current Adjustment
Anticipated Current Penalty Level ($ Amount)
Penalty for a violation of the Swine Health Protection Act
Swine Health Protection Act, codified at 7 U.S.C. 3805(a)
03/14/2018 $28,061
Any person that violates the Plant Protection Act (PPA), or that forges, counterfeits, or, without authority from the Secretary, uses, alters, defaces, or destroys any certificate, permit, or other document provided for in the PPA
Plant Protection Act, 7 U.S.C. 7734(b)(1) 03/14/2018 $70,881 in the case of any individual (except that the civil penalty may not exceed $1,417 in the case of an initial violation of the PPA by an individual moving regulated articles not for monetary gain); $354,402 in the case of any other person; $569,468 for violations adjudicated in a single proceeding if not a willful violation; $1,138,937 for violations adjudicated in a single proceeding if a willful violation; or twice the gross gain or gross loss for any violation, forgery, counterfeiting, unauthorized use, defacing, or destruction of a certificate, permit, or other document provided for in the PPA that results in the person deriving pecuniary gain or causing pecuniary loss to another
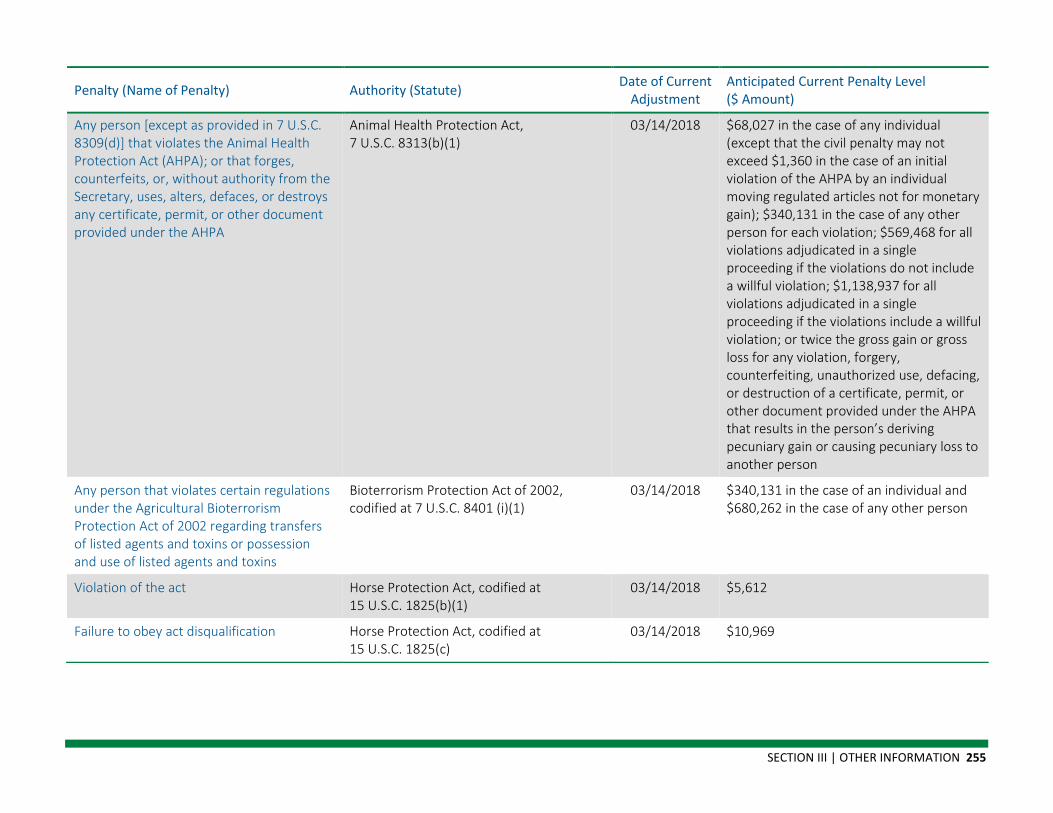
SECTION III | OTHER INFORMATION 255
Penalty (Name of Penalty) Authority (Statute) Date of Current Adjustment
Anticipated Current Penalty Level ($ Amount)
Any person [except as provided in 7 U.S.C. 8309(d)] that violates the Animal Health Protection Act (AHPA); or that forges, counterfeits, or, without authority from the Secretary, uses, alters, defaces, or destroys any certificate, permit, or other document provided under the AHPA
Animal Health Protection Act, 7 U.S.C. 8313(b)(1)
03/14/2018 $68,027 in the case of any individual (except that the civil penalty may not exceed $1,360 in the case of an initial violation of the AHPA by an individual moving regulated articles not for monetary gain); $340,131 in the case of any other person for each violation; $569,468 for all violations adjudicated in a single proceeding if the violations do not include a willful violation; $1,138,937 for all violations adjudicated in a single proceeding if the violations include a willful violation; or twice the gross gain or gross loss for any violation, forgery, counterfeiting, unauthorized use, defacing, or destruction of a certificate, permit, or other document provided under the AHPA that results in the person’s deriving pecuniary gain or causing pecuniary loss to another person
Any person that violates certain regulations under the Agricultural Bioterrorism Protection Act of 2002 regarding transfers of listed agents and toxins or possession and use of listed agents and toxins
Bioterrorism Protection Act of 2002, codified at 7 U.S.C. 8401 (i)(1)
03/14/2018 $340,131 in the case of an individual and $680,262 in the case of any other person
Violation of the act Horse Protection Act, codified at 15 U.S.C. 1825(b)(1)
03/14/2018 $5,612
Failure to obey act disqualification Horse Protection Act, codified at 15 U.S.C. 1825(c)
03/14/2018 $10,969

256 USDA AGENCY FINANCIAL REPORT | 2019
Penalty (Name of Penalty) Authority (Statute) Date of Current Adjustment
Anticipated Current Penalty Level ($ Amount)
Civil penalty for knowingly violating, or, if in the business as an importer or exporter, violating, with respect to terrestrial plants, any provision of the Endangered Species Act of 1973, any permit or certificate issued thereunder, or any regulation issued pursuant to section 9(a)(1)(A) through (F), (a)(2)(A) through (D), (c), (d) (other than regulations relating to record keeping or filing reports), (f), or (g), as set forth at 16 U.S.C. 1540(a)(1)
Endangered Species Act of 1973, (16 U.S.C. 1538(a)(1)(A) through (F), (a)(2)(A) through (D), (c), (d), (f), and (g)), as set forth at 16 U.S.C. 1540(a)(1)
03/14/2018 $51,302 for each violation
Knowingly violating or, if in the business as an importer or exporter, violating, with respect to terrestrial plants, any other regulation under the Endangered Species Act of 1973, as set forth at 16 U.S.C. 1540(a)(1)
Endangered Species Act of 1973, as set forth at 16 U.S.C. 1540(a)(1)
03/14/2018 $24,625
Violation, with respect to terrestrial plants, of the Endangered Species Act of 1973, or any regulation, permit, or certificate issued thereunder, as set forth at 16 U.S.C. 1540(a)(1)
Endangered Species Act of 1973, as set forth at 16 U.S.C. 1540(a)(1)
03/14/2018 $1,296
Knowingly and willfully violating 49 U.S.C. 80502 with respect to the transportation of animals by any rail carrier, express carrier, or common carrier (except by air or water); a receiver, trustee, or lessee of one of those carriers; or an owner or master of a vessel
28 Hour Law, 49 U.S.C. 80502(d) 03/14/2018 $165–$824
Violating a provision of or a regulation under the Act, by a retail food store or wholesale food concern
Food and Nutrition Act of 2008 (Act), or a regulation under the Act, codified at 7 U.S.C. 2021(a) and (c)
03/14/2018 $113,894
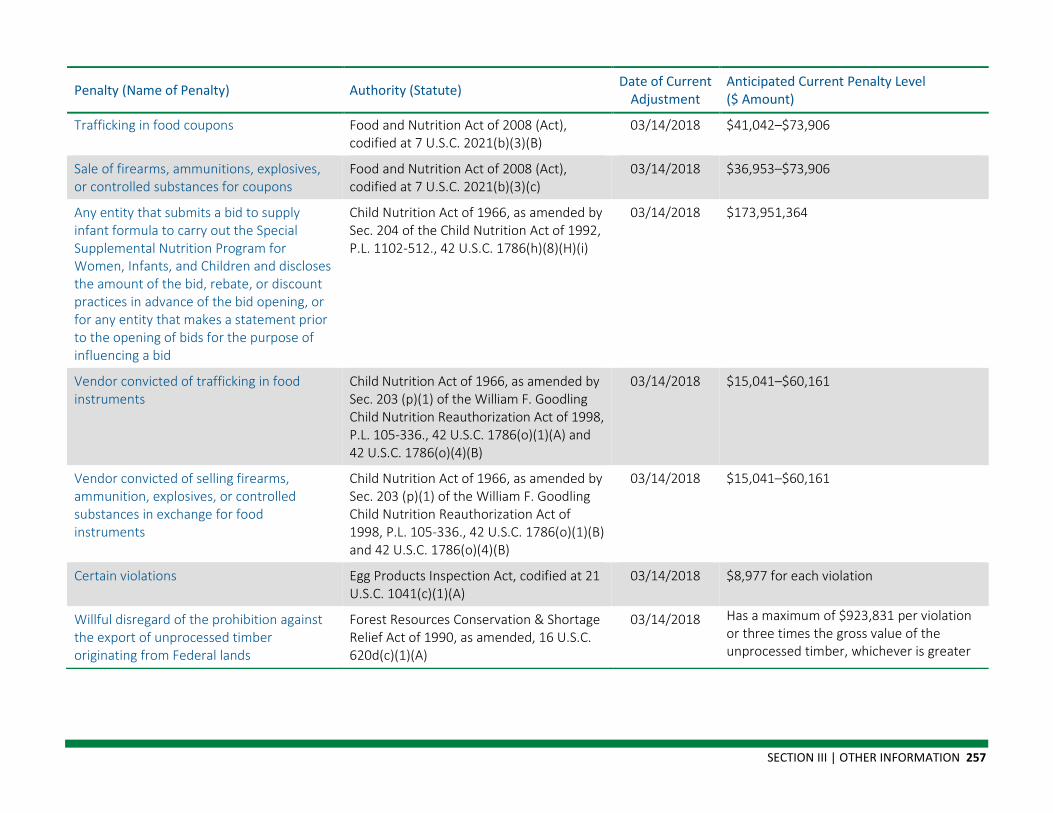
SECTION III | OTHER INFORMATION 257
Penalty (Name of Penalty) Authority (Statute) Date of Current Adjustment
Anticipated Current Penalty Level ($ Amount)
Trafficking in food coupons Food and Nutrition Act of 2008 (Act), codified at 7 U.S.C. 2021(b)(3)(B)
03/14/2018 $41,042–$73,906
Sale of firearms, ammunitions, explosives, or controlled substances for coupons
Food and Nutrition Act of 2008 (Act), codified at 7 U.S.C. 2021(b)(3)(c)
03/14/2018 $36,953–$73,906
Any entity that submits a bid to supply infant formula to carry out the Special Supplemental Nutrition Program for Women, Infants, and Children and discloses the amount of the bid, rebate, or discount practices in advance of the bid opening, or for any entity that makes a statement prior to the opening of bids for the purpose of influencing a bid
Child Nutrition Act of 1966, as amended by Sec. 204 of the Child Nutrition Act of 1992, P.L. 1102-512., 42 U.S.C. 1786(h)(8)(H)(i)
03/14/2018 $173,951,364
Vendor convicted of trafficking in food instruments
Child Nutrition Act of 1966, as amended by Sec. 203 (p)(1) of the William F. Goodling Child Nutrition Reauthorization Act of 1998, P.L. 105-336., 42 U.S.C. 1786(o)(1)(A) and 42 U.S.C. 1786(o)(4)(B)
03/14/2018 $15,041–$60,161
Vendor convicted of selling firearms, ammunition, explosives, or controlled substances in exchange for food instruments
Child Nutrition Act of 1966, as amended by Sec. 203 (p)(1) of the William F. Goodling Child Nutrition Reauthorization Act of 1998, P.L. 105-336., 42 U.S.C. 1786(o)(1)(B) and 42 U.S.C. 1786(o)(4)(B)
03/14/2018 $15,041–$60,161
Certain violations Egg Products Inspection Act, codified at 21 U.S.C. 1041(c)(1)(A)
03/14/2018 $8,977 for each violation
Willful disregard of the prohibition against the export of unprocessed timber originating from Federal lands
Forest Resources Conservation & Shortage Relief Act of 1990, as amended, 16 U.S.C. 620d(c)(1)(A)
03/14/2018 Has a maximum of $923,831 per violation or three times the gross value of the unprocessed timber, whichever is greater
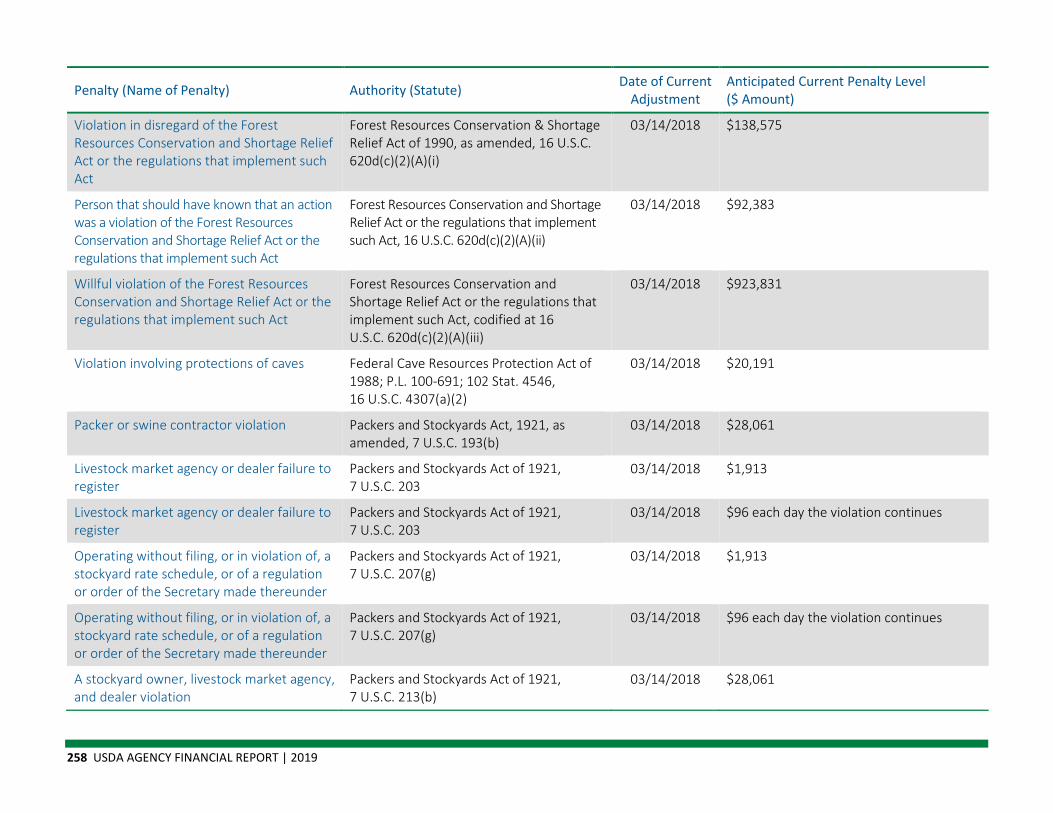
258 USDA AGENCY FINANCIAL REPORT | 2019
Penalty (Name of Penalty) Authority (Statute) Date of Current Adjustment
Anticipated Current Penalty Level ($ Amount)
Violation in disregard of the Forest Resources Conservation and Shortage Relief Act or the regulations that implement such Act
Forest Resources Conservation & Shortage Relief Act of 1990, as amended, 16 U.S.C. 620d(c)(2)(A)(i)
03/14/2018 $138,575
Person that should have known that an action was a violation of the Forest Resources Conservation and Shortage Relief Act or the regulations that implement such Act
Forest Resources Conservation and Shortage Relief Act or the regulations that implement such Act, 16 U.S.C. 620d(c)(2)(A)(ii)
03/14/2018 $92,383
Willful violation of the Forest Resources Conservation and Shortage Relief Act or the regulations that implement such Act
Forest Resources Conservation and Shortage Relief Act or the regulations that implement such Act, codified at 16 U.S.C. 620d(c)(2)(A)(iii)
03/14/2018 $923,831
Violation involving protections of caves Federal Cave Resources Protection Act of 1988; P.L. 100-691; 102 Stat. 4546, 16 U.S.C. 4307(a)(2)
03/14/2018 $20,191
Packer or swine contractor violation Packers and Stockyards Act, 1921, as amended, 7 U.S.C. 193(b)
03/14/2018 $28,061
Livestock market agency or dealer failure to register
Packers and Stockyards Act of 1921, 7 U.S.C. 203
03/14/2018 $1,913
Livestock market agency or dealer failure to register
Packers and Stockyards Act of 1921, 7 U.S.C. 203
03/14/2018 $96 each day the violation continues
Operating without filing, or in violation of, a stockyard rate schedule, or of a regulation or order of the Secretary made thereunder
Packers and Stockyards Act of 1921, 7 U.S.C. 207(g)
03/14/2018 $1,913
Operating without filing, or in violation of, a stockyard rate schedule, or of a regulation or order of the Secretary made thereunder
Packers and Stockyards Act of 1921, 7 U.S.C. 207(g)
03/14/2018 $96 each day the violation continues
A stockyard owner, livestock market agency, and dealer violation
Packers and Stockyards Act of 1921, 7 U.S.C. 213(b)
03/14/2018 $28,061
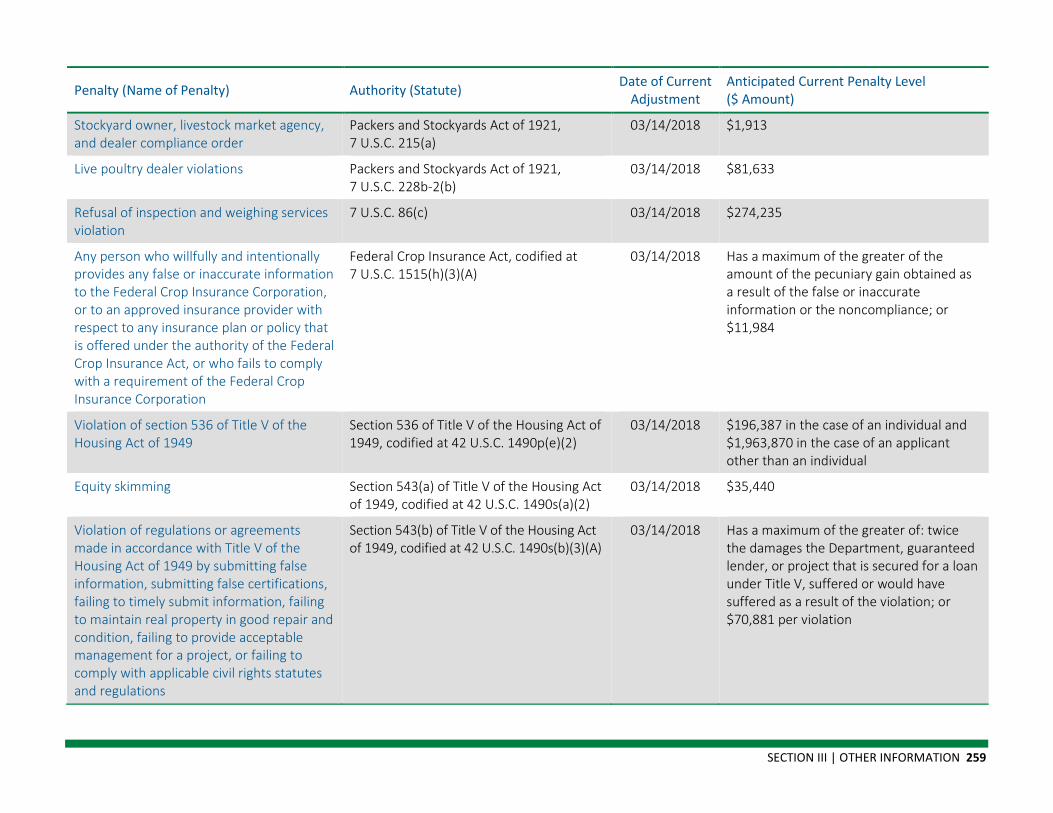
SECTION III | OTHER INFORMATION 259
Penalty (Name of Penalty) Authority (Statute) Date of Current Adjustment
Anticipated Current Penalty Level ($ Amount)
Stockyard owner, livestock market agency, and dealer compliance order
Packers and Stockyards Act of 1921, 7 U.S.C. 215(a)
03/14/2018 $1,913
Live poultry dealer violations Packers and Stockyards Act of 1921, 7 U.S.C. 228b-2(b)
03/14/2018 $81,633
Refusal of inspection and weighing services violation
7 U.S.C. 86(c) 03/14/2018 $274,235
Any person who willfully and intentionally provides any false or inaccurate information to the Federal Crop Insurance Corporation, or to an approved insurance provider with respect to any insurance plan or policy that is offered under the authority of the Federal Crop Insurance Act, or who fails to comply with a requirement of the Federal Crop Insurance Corporation
Federal Crop Insurance Act, codified at 7 U.S.C. 1515(h)(3)(A)
03/14/2018 Has a maximum of the greater of the amount of the pecuniary gain obtained as a result of the false or inaccurate information or the noncompliance; or $11,984
Violation of section 536 of Title V of the Housing Act of 1949
Section 536 of Title V of the Housing Act of 1949, codified at 42 U.S.C. 1490p(e)(2)
03/14/2018 $196,387 in the case of an individual and $1,963,870 in the case of an applicant other than an individual
Equity skimming Section 543(a) of Title V of the Housing Act of 1949, codified at 42 U.S.C. 1490s(a)(2)
03/14/2018 $35,440
Violation of regulations or agreements made in accordance with Title V of the Housing Act of 1949 by submitting false information, submitting false certifications, failing to timely submit information, failing to maintain real property in good repair and condition, failing to provide acceptable management for a project, or failing to comply with applicable civil rights statutes and regulations
Section 543(b) of Title V of the Housing Act of 1949, codified at 42 U.S.C. 1490s(b)(3)(A)
03/14/2018 Has a maximum of the greater of: twice the damages the Department, guaranteed lender, or project that is secured for a loan under Title V, suffered or would have suffered as a result of the violation; or $70,881 per violation

260 USDA AGENCY FINANCIAL REPORT | 2019
Penalty (Name of Penalty) Authority (Statute) Date of Current Adjustment
Anticipated Current Penalty Level ($ Amount)
Failure to comply with certain provisions U.S. Warehouse Act, codified at 7 U.S.C. 254
03/14/2018 $35,440
Willful failure or refusal to furnish information, or willful furnishing of false information
Section 156 of the Federal Agricultural Improvement and Reform Act of 1996, codified at 7 U.S.C. 7272(g)(5).
03/14/2018 $15,582 for each violation
Willful failure or refusal to furnish information, or willful furnishing of false data by a processor, refiner, or importer of sugar, syrup, and molasses
Section 156 of the Federal Agriculture Improvement and Reform Act of 1996, codified at 7 U.S.C. 7272(g)(5)
03/14/2018 $15,582 for each violation
Filing a false acreage report that exceeds tolerance
Federal Agriculture Improvement and Reform Act of 1996, Section 156, codified at 7 U.S.C. 7272(g)(5)
03/14/2018 $15,582 for each violation
Knowingly violating any regulation of the Secretary of the Commodity Credit Corporation pertaining to flexible marketing allotments for sugar
Section 359h(b) of the Agricultural Adjustment Act of 1938, codified at 7 U.S.C. 1359hh(b)
03/14/2018 $11,390 for each violation
Knowingly violating any regulations promulgated by the Secretary pertaining to cotton insect eradication
Section 104(d) of the Agricultural Act of 1949, codified at 7 U.S.C. 1444a(d)
03/14/2018 $14,031
Making, presenting, submitting, or causing to be made, presented, or submitted, a false, fictitious, or fraudulent claim
Program Fraud Civil Remedies Act of 1986, codified at 31 U.S.C. 3802(a)(1)
03/14/2018 $11,182
Making, presenting, submitting, or causing to be made, presented, or submitted, a false, fictitious, or fraudulent written statement
Program Fraud Civil Remedies Act of 1986, codified at 31 U.S.C. 3802(a)(2)
03/14/2018 $11,182
Violation of any of the slaughter horse transportation regulations in 9 CFR part 88
Commercial Transportation of Equine for Slaughter Act, 7 U.S.C. 1901 note and its implementing regulations in 9 CFR part 88, as set forth in 9 CFR 88.6
03/14/2018 $5,000—Each horse transported in violation of Part 88 is a separate violation

SECTION III | OTHER INFORMATION 261
Penalty (Name of Penalty) Authority (Statute) Date of Current Adjustment
Anticipated Current Penalty Level ($ Amount)
Knowingly violating section 3(d) or 3(f) of the Lacey Act Amendments of 1981, or for violating any other provision provided that, in the exercise of due care, the violator should have known that the plant was taken, possessed, transported, or sold in violation of any underlying law, treaty, or regulation
Lacey Act Amendments of 1981, 16 U.S.C. 3373(a)(1)
03/14/2018 $25,928 for each violation (but if the plant has a market value of less than $350, and involves only the transportation, acquisition, or receipt of a plant taken or possessed in violation of any law, treaty, or regulation of the United States, any Indian Tribal law, any foreign law, or any law or regulation of any State, the penalty shall not exceed the maximum provided for violation of said law, treaty, or regulation, or $25,928, whichever is less)
Violating section 3(f) of the Lacey Act Amendments of 1981
Lacey Act Amendments of 1981, 16 U.S.C. 3373(a)(2)
03/14/2018 $648

262 USDA AGENCY FINANCIAL REPORT | 2019
Abbreviations—Acronyms
A
AAR Acquisition Approval Request ADA Anti-deficiency Act AFR Agency Financial Report AGA Association of Government
Accountants AGPMR Agriculture Property Management
Regulation AHPA Animal Health Protection Act AIP Approved Insurance Providers AMS Agricultural Marketing Service APEC Access, Participation, Eligibility, and
Certification APEC-II Access, Participation, Eligibility, and
Certification Study-II APH Actual Production History
APHIS Animal and Plant Health Inspection Service
APR AIP Performance Review APR Annual Performance Report AQI Agricultural Quarantine Inspection AR Administrative Review ARC Agriculture Risk Coverage ARC/PLC Agriculture Risk Coverage and Price
Loss Coverage ARC-CO Agriculture Risk Coverage-County ARS Agricultural Research Service ART Administrative Review and Training ASCR Assistant Secretary for Civil Rights AU Audit
B
BAR Budget and Accrual Reconciliation BARC Beltsville Agricultural Research
Center
BCAP Biomass Crop Assistance Program BPOI Basic Provisions of Insurance
C
CACFP Child and Adult Care Food Program CAIVRS Credit Alert Interactive Voice
Response System CAP Cross-Agency Priority CCC BF CCC Budget Formulation CCC Commodity Credit Corporation CDC Centers for Disease Control and
Prevention CDM Continuous Diagnostics Mitigation
CFDA Catalog of Federal Domestic Assistance
CFO Chief Financial Officer CFR Code of Federal Regulations CIH Crop Insurance Handbook CIM Capital Improvement and
Maintenance CMA Computer Matching Agreement CMM Capability maturity model
ABBREVIATIONS—ACRONYMS 263
CN Child nutrition COF County Office COTS Commercial Off-the-Shelf CPI Consumer Price Index
CRP Conservation Reserve Program CSS Country Strategy Statements CTA Conservation Technical Assistance CY Current year
D
DAIMS DATA Act Information Model Schema
DATA Digital Accountability and Transparency Act
DC Disallowed costs DCR Data Change Request DHS Department of Homeland Security
DM Departmental Management DM&R Deferred Maintenance & Repairs DNP Do Not Pay DOL U.S. Department of Labor DR Departmental Regulation
E
E&T Employment and training EBT Electronic benefit transfer ECP Emergency Conservation Program eFG ezFedGrants eFMS electronic Funds Management
System ELC Entity Level Control
EPA Environmental Protection Agency EQIP Environmental Quality Incentive
Program ERM Enterprise Risk Management ERP Enterprise Resource Planning ERS Economic Research Service EWA Early Warning Alert
F
FABS Financial Assistance Broker Submission
FAS Foreign Agriculture Service FCIC Federal Crop Insurance Corporation FDA Food and Drug Administration FDCH Family Day Care Home FECA Federal Employees’ Compensation
Act FFAR Foundation for Food and Agriculture
Research FFATA Federal Funding Accountability and
Transparency Act FFB Federal Financing Bank
FFIP FPAC Financial Improvement Program
FFMIA Federal Financial Management Improvement Act
FFN Frost Freeze FISMA Federal Information Security
Management Act FMFIA Federal Managers’ Financial Integrity
Act FMIA Federal Meat Inspection Act FMMI Financial Management
Modernization Initiative FMS Financial Management Systems FMT Financial Management Training
264 USDA AGENCY FINANCIAL REPORT | 2019
FNS Food and Nutrition Service FPAC Farm Production and Conservation FPDS-NG Federal Procurement Data System—
Next Generation FR Financial Report of the U.S.
Government FS Forest Service FSA Farm Service Agency FSFL Farm and Sugar Storage Facilities
FSH Forest Service Handbook FSIS Food Safety and Inspection Service FSM Forest Service Manual FSRIP Farm Security and Rural Investment
Act Program FSRS FFATA Sub-award Reporting System FTBU Funds to Be Put to Better Use FY Fiscal year
G
GAAP Generally Accepted Accounting Principles
GAO Government Accountability Office GL General Ledger GMS Grant Management Service GONE Grants Oversight and New Efficiency
GPRA Government Performance and Results Act
GRC Governance Risk and Compliance GSA General Services Administration GTAS Governmentwide Treasury Account
Symbol
H
Harvey-CIM Hurricane Harvey-Capital Improvement and Maintenance
HVAs High Value Assets
I
IAA Inter/Intra-Agency Agreement IAS Integrated Acquisition System IBNR Incurred but Not Reported IGT Intra-governmental transaction INTR Interagency Agreement IOD Insights on Demand IP Improper payment
IPERA Improper Payment Elimination and Recovery Act
IPERIA Improper Payments Elimination and Recovery Improvement Act of 2012
IPIA Improper Payments Information Act of 2002
IT Information technology
L
L&WCF Land and Water Conservation Fund LEAs Local educational agencies LEIE List of Excluded Individuals/Entities
LFP Livestock Forage Disaster Program LSA Local Security Administrator
ABBREVIATIONS—ACRONYMS 265
M
MCCs Merchant Category Codes MD&A Management’s Discussion and
Analysis MDD Management Decision Date ME Management evaluation
MFH Multi-Family Housing MFP Market Facilitation Program MOU Memorandum of Understanding MRP Marketing and Regulatory Programs
N
NAL National Agricultural Library NAP Noninsured Crop Disaster Program NASS National Agricultural Statistics
Service NCSS National Cooperative Soil Survey NERAOC National Extension and Research
Administrative Officers Conference NFC National Finance Center
NFS National Forest System NIFA National Institute of Food and
Agriculture NM New Measure NRCS Natural Resources Conservation
Service NRHP National Register of Historic Places NSLP National School Lunch Program
O
OAO Office of Advocacy and Outreach OCFO Office of the Chief Financial Officer OCIO Office of the Chief Information
Officer OCP Office of Contracting and
Procurement OGC Office of the General Counsel OHSEC Office of Homeland Security and
Emergency Coordination
OIG Office of Inspector General OMB Office of Management and Budget OPFM Office of Property and Fleet
Management OPPE Office of Partnerships and Public
Engagement OSDBU Office of Small and Disadvantaged
Business Utilization
P
P.L. Public Law PAR Performance and Accountability
Report PC Participant and Program
Characteristics PHA Priority Heritage Assets PHR Public Health Regulation PII Personally Identifiable Information
PLC Price Loss Coverage PMA President’s Management Agenda PMC Plant Materials Centers POAMs Plans of Action and Milestones PP&E Property, Plant and Equipment PPA Plant Protection Act PUPS Prisoner Update Processing System
266 USDA AGENCY FINANCIAL REPORT | 2019
Q
QC Quality control
R
R&D Research & Development RBS Rural Business-Cooperative Service RC&D Resource Conservation and
Development RCOs Regional Compliance Offices RD Rural Development REE Research, Education, and Economics
RHIF Rural Housing Insurance Fund RHS Rural Housing Service RMA Risk Management Agency RPA Robotic Process Automation RUS Rural Utilities Service RVA Risk and Vulnerability Assessment RY Reinsurance year
S
S&E Salaries and Expenses SAM System for Award Management SAS Statement on Auditing Standards SBP School Breakfast Program SBR Statement of Budgetary Resources SCNP Statement of Changes in Net
Position SF Square feet SFFAS Statement of Federal Financial
Accounting Standards
SMO Services Management Office SNAP Supplemental Nutrition Assistance
Program SOD segregation of duty SORN System of Records Notice SPAs Strategic Program Areas SPS Secure Payment System SSD Soil Science Division STO State Office SY School year
T
TAP Tree Assistance Program TB Technical Bulletin TBT Technical Barriers to Trade TFAA Trade and Foreign Agricultural
Affairs
TIG Technology Innovation Grant Top Treasury Offset Program TPMC Tucson Plant Materials Center Treasury U.S. Department of the Treasury TSP Thrift Savings Plan
ABBREVIATIONS—ACRONYMS 267
U
U.S.C. United States Code UDO Undelivered order UES Unified Export Strategy UI User interface ULO Unliquidated Obligation
USAID United States Agency for International Development
USDA U.S. Department of Agriculture USSGL U.S. Standard General Ledger UX User experience
W
WBSCM Web-Based Supply Chain Management
WEP Water and Environmental Programs WHIP Wildfires and Hurricanes Indemnity
Program
WIC Special Supplemental Nutrition Program for Women, Infants, and Children