Embed Size (px)
Citation preview

Chicago, IllinoisOctober 16, 2006
Summary of the 2006 USDA
Data Users Meeting

2006 USDA Data Users Meeting Chicago O’Hare Airport – Rosemont
Doubletree Hotel October 16, 2006
AGENDA
12:00 pm Registration
12:30 Introduction and Overview
Carol House National Agricultural Statistics Service
12:45 Agency Reviews John Van Dyke
Agricultural Marketing Service Janet Perry
Economic Research Service Patrick Packnett
Foreign Agricultural Service Steve Wiyatt
National Agricultural Statistics Service Gerald Bange
World Agricultural Outlook Board Diane Oberg
U.S. Census Bureau 2:00 Open forum for questions and comments from participants 2:20 Break Open forum continues 4:20 Concluding comments 4:30 Special Presentation: Jon Seltzer
University of Minnesota Project with ERS on Conversion Factors
http://www.usda.gov/nass/

Agricultural Marketing Service 2006
The Agricultural Marketing Service (AMS) includes six commodity programs: Cotton, Dairy, Fruit and Vegetable, Livestock and Seed, Poultry, and Tobacco. The programs employ specialists who provide standardization, grading, and market news services for those commodities. They enforce such Federal Laws as the Perishable Agricultural Commodities Act and the Federal Seed Act. AMS commodity programs also oversee marketing agreements and orders, administer research and promotion programs, and purchase commodities for Federal food programs.
CURRENT ISSUES OF INTEREST
MANDATORY PRICE REPORTING: The Livestock Mandatory Reporting Act of 1999 (Act) was reauthorized by Congress on September 20, 2006, with an expiration date of 2010. Hog reporting provisions were amended to separate barrows and gilts from sows and boars to include additional sow packers, change the release time for the prior day slaughter report to late morning, and include a net price distribution report. AMS will amend the hog regulations to coincide with the provisions in the Act and review the sheep and lamb regulations to identify and amend regulations that have been requested by the industry. WEB PORTAL ENHANCEMENTS: The Market News Portal was officially released to the public October, 2005 with fruit and vegetable and livestock and grain information. It has proven to be extremely popular as it empowers users of Market News data like never before. For the first time, customers can access directly the Market News Information System (MNIS) or database. Additionally, they can customize the Portal to meet their individual information needs and can download the data in the format they find most useful. The Portal also offers currency and metric conversion as well as customized weather information. As market reporters and customers have used the Portal, they have identified several key areas for improvement. These areas of improvement include enhanced graphing capability, access to large blocks of data, and simpler tools for first time or inexperienced users. AMS will add the other commodities to the Portal as resources become available, such as poultry, dairy and cotton. MARKET INFORMATION ORGANIZATION OF THE AMERICAS: The Market Information Organization of the Americas (MIOA) continues to make progress on its goals of facilitating the timely and reliable exchange of market information on the agricultural

markets in the countries of the Americas, and to work towards developing guidelines to standardize methodology, terminology, and technology. MIOA has just had its regular annual meeting, held in Cartagena, Colombia, where the consultant hired by the organization delivered his assessment of the strengths and weaknesses of the market information systems in each of the 19 member countries. One of the first products of the study was the identification of “best practices” within the various countries. These best practices will form the basis for a Managers’ Workshop to be held in the spring of 2007. The main goal is to improve market information systems across the Americas, to the mutual benefit of all members of MIOA and their customers. MIOA currently has a website that links each of the institutions within the member countries, but it is a static site. The goal is to create a more functional, dynamic site allowing a single point of entry for market information in every country in the Americas. The site is hosted by the InterAmerican Institute for Cooperation in Agriculture (IICA), and is funded by AMS. IICA and the Executive Committee of MIOA will be creating a plan in the coming months as to how to further develop the site and work towards the goal of building a powerful and useful website. INTERNATIONAL TRADE DATA: In the interest of facilitating international trade, several Federal agencies are working together to develop the ACE/ITDS project, one of the largest IT projects ever undertaken by the Government. Simply put, ACE/ITDS is a single-window filing system for international trade. Currently, in order to import an item into the United States, the importer must fill out separate and often redundant declaration forms for several different agencies. With ACE/ITDS the trade will be able to input the data once into the system. From there, each respective agency will be able to extract the information they need to make a decision on the import: whether or not to allow it into the country, how much duty ought to be paid, if there is any hazardous materials to look out for, and so forth. This system will ensure that all imports will be acted upon by the responsible government agencies, while also eliminating unnecessary delays at the border and eliminating unnecessary paperwork. The Agricultural Marketing Service is one of the first agencies to become involved with this project. For Market News branches, the integration into ACE/ITDS will lead to great improvements in the completeness, accuracy, and timeliness of our reporting. Data that is currently compiled and released on a semi-weekly or monthly basis will become available in near-real time. The impacts of these enhancements cannot be understated. The near-instantaneous release of import and export information, as opposed to the current 30-45 day release, will give the agriculture industry more and better information with which to make marketing decisions. Market News will also have access to more information through ACE/ITDS. We should be able to get imports separated by such things as variety, size, color, and condition. To use a quick example, instead of having an import classified as "mango", it would be classified as "Tommy Atkins mango, 10 size, fresh” or "Keitts mango, sliced and frozen in plastic bags". This greater degree of specificity will allow Market News to better serve its customers in the future.

CHANGES TO AMS REPORTS AND NEW REPORTS Fruit and Vegetable: Organic Data AMS Market News has entered into an interagency agreement with the Risk Management Agency (RMA) of the Federal Crop Insurance Corporation. The agreement calls for Market News to enhance its database and the new Market News Portal to better accommodate organic data and to make it readily retrievable by users. The agreement includes a two year pilot project to enhance data collection for organic fruits and vegetables. While the modifications to the Market News Information System, or database, and the Market News Portal will take some months to complete, the enhanced data collection is expected to start this fall. The current plan for enhanced fruit and vegetable data collection, which is subject to modification, is to do weekly regional price surveys at the wholesale/distributors level and at the retail level. This data will add to the daily wholesale market reports issued from the 15 major wholesale fruit and vegetable markets, which includes organic product when it is available. New Reports
• Daily Movement Report • Shipping Point High/Low Highlights Report
New F.O.B. Reports
• Beets - Mexico Crossings through Calexico and San Luis, Arizona • Celery - Imperial and Coachella Valley, California • Cucumbers - New Jersey • Eggplant - Michigan, New Jersey • Nectarines (preconditioned) - California • Peaches (preconditioned) - California • Plums - (preconditioned) - California • Peppers - New Jersey • Quince - California • Squash - New Jersey • Sweet Potatoes - Mississippi • Strawberries (Organic) – California • Tangelos - Peru • Tomatoes - New Jersey • Tomatoes, Grape type - New Jersey

Report Changes Due to budget shortfalls, the following report changes have taken place:
• Composite reports for wholesale fruit and vegetable markets are no longer being issued. The reports that made up the composite reports are still available, but only in a text format.
• Reporting of wholesale flowers for Philadelphia, Chicago, Seattle and San Francisco has been discontinued, while the Boston wholesale cut flower report will be issued only once a week and is only available in a text format.
• Reporting of F.O.B. shipping point prices for California flowers has been discontinued. Livestock and Grain: Retail Pork Report: A new weekly pork report is available on the LGMN Internet site. This report compiles information from weekly pork ads of approximately 17,000 retail stores nationwide. It gives a feature rate which is the percentage of sampled stores advertising pork, a special rate which is the percentage of sampled stores with a no-price promotion, an activity index which is a measure of the absolute frequency of the feature activity equal to the total number of stores for each advertised pork item, and the total number of advertising outlets and their weighted average price. The report also includes graphs of the current and previous five weeks activity index. Additionally, the price range and weighted averages for the various items are broken down into six regions. The report is released Friday by 3:00 PM Central. The web address is: http://www.ams.usda.gov/lsmnpubs/mpork.htm. Distillers Dried Grains Report: A Distillers Dried Grain Report is available for Iowa on a regional basis that includes corn bids for ethanol in addition to dry, wet, and modified wet distillers dried grain prices. Expansion to additional states will be considered. New Livestock Auction Reports: Stratford WI. Dairy Auction Belen NM. Livestock Auction Portales NM. Dairy Sale Mansura LA. Livestock Auction Greencastle PA. Livestock Auction Centennial CO. Goat Auction Clay County AL. Livestock Auction Passaic MO. Livestock Auction Macon MO. Livestock Auction

Maryville Mo. Livestock Auction Discontinued Reports: South St. Paul Stockyards reports were discontinued on September 30, 2006. Poultry: New Reports: Retail Chicken Feature Activity Report – Specialty and USDA Certified Organic In 2005 in conjunction with industry members and trade groups, Poultry Market News developed a market news report covering supermarket feature activity for the most common consumer cuts of chicken. In September 2006, this report was expanded to include similar activity for specialty and USDA Certified Organic chicken products. Specialty products are produced from chickens raised on an all vegetable diet without antibiotics and are minimally processed. USDA Certified Organic are products grown and processed according to USDA's national organic standards and certified by USDA-accredited State and private certification organizations. Revisions
BROILER/FRYER: Weekly Young Chickens Slaughtered Under Federal Inspection (Thur) Live weights of young meat chickens continue to increase. In response to this situation and at the request of the broiler industry, USDA AMS Poultry Market News, working with the National Chicken Council and industry cooperators, developed the following updates to the reporting of young chicken slaughter information effective August 2006:
Expanded weight breakdowns to four: 4.25 lbs. and down: This size product is normally marketed bone-in into fast food and food service sectors and may include Cornish hens. 4.26-6.25 lbs.: This size product is normally marketed into the retail grocery sector in tray pack or bagged forms.
6.26-7.75 lbs.: This size product is normally marketed either into the retail grocery sector in tray pack and IQF form or is further processed and marketed into various sectors.
7.76 lbs and up: This size product is normally marketed deboned or as roasters or roasting chicken. The report timeframe was moved up one week to reflect the prior week’s data instead of data from two week’s prior. The slaughter information provided in the report now reflects 100% of the Federally Inspected slaughter instead of the 66% previously shown.

Dairy: The Milk Marketing Order Statistics Group has developed and implemented a web-based, public database of historical statistical information generated through the administration of the Federal milk order program. Monthly data, beginning in January 2000, includes the volume of milk marketed under the program, the Class prices of milk, prices paid to dairy farmers, the utilization of milk in various dairy products, and other related information. The database provides three options by which the information in the tables can be accessed; each provides its own level of convenience and flexibility. The URL for the database is: www.ams.usda.gov/USDAMIB/Main/Welcome.aspx. Cotton New Reports: Daily Cotton Quality Summary: In 2005 in response to industry request, Cotton Market News developed a daily report released each weekday during the active harvest season listing by Classing Office the number of bales, predominate color and leaf grades, average staple, mike, strength, uniformity, trash, and the percentage of bark and grass. It includes weekly and seasonal summary information pulled from the Quality of Cotton Classed reports.
Revisions
Daily Spot Cotton Quotations: Beginning with the 2006-2007 marketing year the Cotton Market News made changes to the American Pima Spot Quotations. The changes included combining the San Joaquin Valley and Desert Southwest markets into one American Pima Market, changing the quotation terms to UD free, FOB warehouse, and quoting discounts for strength 37.4 and lower.
Tobacco: All tobacco reports have been eliminated except for the Quarterly Stocks report due to the elimination of the mandatory grading program by Congress.

AMS Contacts: Agricultural Marketing Service: E-mail to: [email protected] ADMINISTRATOR Lloyd C. Day 202-720-5115 Associate Administrator Kenneth C. Clayton 202-720-4276 [email protected] Civil Rights Program Ruihong Guo 202-720-0583 [email protected] Public Affairs Staff Billy Cox 202-720-8998 [email protected] Legislative Staff Chris Sarcone 202-720-3203 [email protected] Cotton Programs Darryl Earnest 202-720-3193 [email protected] Poultry Programs Craig A. Morris 202-720-4476 [email protected] Dairy Programs Dana Coale 202-720-4392 [email protected] Science & Technology Programs Robert Epstein 202-720-5231 [email protected]
Fruit & Vegetable Programs Robert C. Keeney 202-720-4722 [email protected] Tobacco Programs Bill Coats 202-205-0567 [email protected] Livestock & Seed Programs Barry L. Carpenter 202-720-5705 [email protected] Transportation & Marketing Programs Barbara Robinson 202-690-1300 [email protected] Compliance & Analysis Programs Ellen King 202-720-6768 [email protected]

ERS aims to provide timely, high-quality agricultural market information. Through several new initiatives, we are enhancing the value-added nature and transparency of our work.
Improved Quality of Communication Outlook “Landing” Page—Updated weekly, http://www.ers.usda.gov/publications/outlook/ provides a critical link to our outlook publications, data, and “e-outlooks” on special topics. Also, see ERS’s data page (http://www.ers.usda.gov/Data/) for the latest data product releases. E-Outlooks—In 2006, we plan to issue 20 reports examining the forces shaping the future of commodity markets and trade. This year’s topics focused on emerging markets in China and India, Canada’s macroeconomic condition, the economic implications of bovine spongiform encephalopathy (BSE) in the U.S. and Canada, and other topics. Several special e-outlook reports provided background market information for commodities of interest. Newsletters—ERS continues to issue over 100 regularly scheduled outlook reports in 14 series. We are continuing to update processes for our clients to receive market news, and will be posting newsletters in HTML on the web for better access to text, tables, and charts. Print features and *.pdf reports will still be available. Look for the 2007 calendar posting in November—which also includes the posting schedule for exchange rates, macro, trade data, price spreads, and other data products. Amber Waves—ERS’s flagship magazine has received several awards for excellence in government publishing, and a significant portion of its content draws on our outlook program. Look for upcoming pieces on risk management strategies and crop insurance, Brazil’s agricultural sector, new food safety standards in China, and other topics.
Enhancing Timeliness and Value-Added in Data Delivery
On-line Database Development—Through an internal data collection initiative and use of web technology, we are improving access through queriable databases and standardized formats for our analysts and for the public. Public users can view and download data from queriable databases, retrieve data for charts, download pre-formatted spreadsheets and tables, and review documentation for the market data posted on-line. Agricultural Resource Management Study (ARMS)—ARMS, based on an ERS-NASS survey of farm households, is being made more user-friendly! We release our farm income forecast in November, and the ARMS data delivery instrument can provide insights into the distribution of income and wealth on various categories of farms. See http://www.ers.usda.gov/Briefing/ARMS/ for more information.

Analytical Transparency “Models on the Web”—As part of the government’s Data Quality Initiative, ERS is moving toward more models that are downloadable on our website. We’ve posted several Excel models, which are updated monthly, allowing users to use futures prices to forecast the upcoming counter-cyclical payments (CCP) rate for corn, soybeans, and wheat. Agricultural trade multipliers for 69 commodities provide estimates of employment and/or output effects of trade in farm and food products on the U.S. economy. See the documentation at http://www.ers.usda.gov/Data/TradeMultiplier/. Currently, 12 countries/regions and 35 commodities are included in our trade modeling framework. The model, called the Partial Equilibrium Agricultural Trade Simulator (PEATsim), is available for public use and comment at http://trade.aers.psu.edu/. “Behind-the-Scenes” Calculations—We also provide step-by-step detail on the derivation of some of our outlook projections. Last year we posted calculations for wheat food use and wheat exports; see http://www.ers.usda.gov/Briefing/Wheat/wheatfooduse.htm and http://www.ers.usda.gov/Briefing/Wheat/wheattrade.htm for details. This year we’ve posted the derivation of monthly and annual data for the past 1-2 years for imports and exports of live cattle and hogs, beef and veal, lamb and mutton, pork, broiler meat, turkey meat, and shell eggs. Based on Commerce trade data, the documentation is at http://www.ers.usda.gov/Data/MeatTrade/.
Leveraging Cooperators To Enhance Our Ability To Analyze Markets
Conversion Factor Initiative—ERS is working with the University of Minnesota and others to update conversion factors (refining our estimates of food use, trade, and other variables). We hope to develop a “consortium” of government, university, consultant, and industry experts who contribute to developing the most up-to-date factors possible. Cooperative Agreements—We have a number of cooperative agreements on the economic impacts of invasive species affecting agricultural production. See the invasive species page at http://www.ers.usda.gov/Briefing/InvasiveSpecies/. Another agreement with Livestock Marketing Information Center gives us additional support for data on the livestock and dairy industries. We have agreements with Penn State University to support our market analysis of the dairy industry and with New Mexico State University and the National Academy of Sciences on the sheep industry. We also have cooperative research agreements with other universities on such topics as demand for hard red spring and hard red winter wheat, the organic produce market, supply and demand elasticities, and market differentiation and segmentation in the grains markets. Stakeholder Meeting—ERS’s Market and Trade Economics Division will be brainstorming with stakeholders at a workshop on November 16th to chart analytical directions over the next few years. Is there an economic issue that we should be researching? If so, let me know.

Other New Directions Annual Commodity Data—ERS is continuing its efforts to reach its customers with the most accurate and timely data. Annual data contained in the yearbooks will be posted in databases and spreadsheet format. The annual summary will be posted as a separate *.pdf report. Land-Use Changes—A new report examines evidence on the relationship between agricultural land-use changes, soil productivity, and indicators of environmental sensitivity. If cropland that shifts in and out of production is less productive and more environmentally sensitive than other cropland, policy-induced changes in land use could have production effects that are smaller—and environmental impacts that are greater—than anticipated. See the report at http://www.ers.usda.gov/Publications/ERR25/. Understanding Farm Exits—The rate at which U.S. farms go out of business, or exit farming, is about 9 or 10 percent per year, comparable to exit rates for nonfarm small businesses in the United States. Numbers of U.S. farms remain stable because the rate of entry into farming is nearly as high as the exit rate. See http://www.ers.usda.gov/Publications/ERR21/.
Food Surveillance System—ERS is acquiring scanner data that will provide much more detailed and timely information on food prices, sales, and purchases by household type by specific product categories (for example, prices for low-carb vs. “regular” items). Diet, Knowledge, and Health Survey—ERS received $3 million in its appropriations to investigate consumer knowledge of food healthfulness and how consumers implement that knowledge in dietary choices. A survey module on the National Health and Nutrition Examination Survey (an HHS survey) is being developed that addresses, among other topics, the importance of labeling and how consumers acquire information on the links between food and health.
Questions or Comments? Please address them to Janet Perry, Deputy Director for Market Outlook, at [email protected]
or 202-694-5152

Accessing Global Commodity Information from USDA ’s
Foreign Agricultural Service
FAS Reorganizes: Since FAS was established in 1953, many events have changed the work of the agency, but there has been no comprehensive reorganization. Congress has authorized new programs such as the Market Access Program and the McGovern Dole Food for Education Program, to name just two. As the landmark Uruguay Round Agreement for Agriculture phased out traditional tariffs and quotas, countries turned increasingly to new technical barriers to trade in agriculture. Market maintenance activities now require scientific expertise on a regular basis and FAS must work closely with many agencies—within and outside USDA—on a wide variety of complex issues. Even 10 years ago, some of the toughest issues we are dealing with today—BSE, AI, biotechnology—were not even on the radar screen.
To address these changes and challenges and to comply with the goals of President Bush’s management agenda, in 2004, FAS began a top-to-bottom review of what the agency does, how effective we are, and what we could do better. Some of the concerns on the table included: effectively supporting the agriculture sector during trade agreement negotiations; developing strategies in response to the emergence of “giants” like China and Brazil; and managing the trade impact of international food safety scares like AI and BSE. The review process included input from employees, private sector trade groups, and program participants. This effort pointed out the need for a new strategic focus for FAS and a realignment of functions and personnel to increase the effectiveness of the agency.
Market intelligence lies at the root of the Foreign Agricultural Service (FAS) effort to promote exports. FAS acquires data from satellite imagery, foreign statistics, and through its global network of offices in over 130 countries. FAS overseas offices produce nearly 3,000 market intelligence reports on a wide variety of subjects each year. In Washington, D.C., FAS’ Commodity and Marketing Program (CMP) has the responsibility to analyze this information along with the World Agricultural Outlook Board, Economic Research Service and other USDA agencies, to publish short term world production, supply and demand (PS&D) estimates on a monthly basis. FAS commodity knowledge supports USDA on issues of market access, food aid, export credits, and technical assistance and provides a source of unbiased information for the market. The FAS Public Web Site and New Data Products: You can tap into the FAS information network of agricultural counselors, attachés, and trade officers stationed abroad, and analysts, marketing specialists, negotiators, and related specialist in Washington, D.C. through the Internet at: http://www.fas.usda.gov. Through this Web site, you
can quickly go to specific commodity Web pages with analysis, data, and timely news items, often related to market access or competitive issues faced by U.S. exporters. The FAS website also provides a portal to the web page s of all FAS overseas offices. A Google powered web search has recently been added to FAS On-Line. For addition information please contact [email protected]. U.S. Trade Internet System: USDA has a searchable, web-based U.S. export and import trade system with data for agricultural, fishery, and forestry products. This dynamic web-based system is designed to service frequent requests for trade data from farmers; industry associations; federal, congressional and state officials; university researchers; and journalists. The database is searchable at any level of the Harmonized Tariff Schedule of the United States. Since initial implementation, many user-requested features have been added to the application to provide increased flexibility and enhance system capability. Clicking on areas within the body of the report accesses some of these new features. Some features are activated from the toolbar across the bottom of the output. Find the US Trade Internet system at: http://www.fas.usda.gov/ustrade/. For additional information please contact [email protected]. Development of a new US Trade System: System requirements are being compiled to develop a new U.S. Trade System. The goal is to provide the means for system users to quickly and easily identify U.S. agricultural trade flows and trends through a simple and flexible web based interface using data visualization and better analytical tools. It will have all functionality of the current FAS Internet Trade system. Some of the envisioned enhancements include:
• AD-Hoc Reporting (match current system) • Data Visualization (Charts, Maps) • Data Analysis (Drilldown, Color Coding) • Enhanced Data Downloads • Enhanced Output formats • Addition of Census Units of Measures and real time modification • Improved methods to save selections • Inclusion of U.S. state trade data • Inclusion of custom district trade data • Inclusion of Pre-1989 data
USDA FAS PS&D Online: FAS released a new enhanced World Agricultural Production Supply and Distribution On-line (PS&D On-line) application on August 31, 2006. The new application retains all of the ease-of-use and functionality of the old version, while incorporating powerful and exciting new features. The new PS&D On-line system enhancements include:

Query
o The ability to create a personal PS&D user account and save queries for future use o The ability to include commodity, country, and attribute codes o The ability to seamlessly query across commodities and attributes o A top countries option o The ability to view previous month data for the current year o The ability to include month and year changes o A “file format” option that places information in every cell (Excel users should use
this function to replace downloadable datasets) Reports
o New online reports that provide additional detail of the global agricultural situation o Links to Current World Production, Market and Trade Reports (circulars)
Downloadable Data Sets o Revamped and consolidated downloadable data files o Addition of attribute and unit codes to allow easier linking across commodities o Archive of these monthly sets will be available soon o NOTE: These files are now too large to open in excel (Excel users should use this
function to replace downloadable datasets) Other
o A yearly release schedule allows users to pre-plan data availability. o New Attributes:
Yield for grains, oilseeds and cotton Food Seed and Industrial Consumption – Grains Soybean Meal Equivalent (SME) – Protein Meals Stocks-to-Use – Cotton
o Country regions that match U.S. Trade online definitions We invite you to explore the new PS&Donline at http://www.fas.usda.gov/psdonline. For additional information please e-mail FAS at [email protected]. USDA’s Crop Explorer: USDA’s Crop Explorer Web site (http://www.pecad.fas.usda.gov/cropexplorer) provides customers with timely and accurate crop condition information on a global scale unavailable from any other source. Every 10 days, more than 2,000 maps and 33,000 charts are updated on the Crop Explorer Web site. A partnership with NASA (the National Aeronautics and Space Administration) provides satellite imagery and lake and reservoir surface elevation estimates. Satellite imagery is posted to the Crop Explorer Web site twice a day. Crop Explorer is a primary source of agricultural market intelligence for decision makers. Farmers, agribusinesses, commodity traders and researchers, as well as federal, state, and local government agencies, find Crop Explorer invaluable in making reliable forecasts about production, supply, demand and food assistance needs. The Crop Explorer site can also be found from PECAD’s Web page where articles about in-country crop conditions and agricultural production briefs are now searchable by

country and commodity. Visit http://www.pecad.fas.usda.gov/ for more information or contact the Production Estimates and Crop Assessment Division at (202) 720-0888. World Production, Market and Trade Reports: The World Market and Trade Reports provide the latest analysis and data on a number of agricultural commodities, outlining the current supply, demand and trade estimates for the United States and many major foreign countries. FAS releases monthly updates for cotton, grain, oilseeds, fruits and vegetables, and world agricultural production and biannual updates on meat and dairy products. Field crop publications are released on the business day following release of the World Agricultural Supply and Demand Estimates (WASDE). Horticultural publications as well as coffee and sugar estimates are published at twice a year. Find FAS’ current commodity information at http://www.fas.usda.gov/psdonline/psdDataPublications.aspx. Global Agricultural Information Network (GAIN) (Attaché Reports): The GAIN system is a searchable online archive of all field reports submitted by FAS overseas offices. GAIN covers all major crop and livestock products and provides timely information to U.S. exporters and to commodity analysts who use field data to aid USDA in determining global production, supply, and demand estimates. In addition to traditional commodity reporting, GAIN also includes reports on high value foods, fishery and forestry products, trade policy monitoring, and sector reports on food processors and the hotel and restaurant industry abroad. In 2005, FAS added new annual reports on Biotechnology regulations by country, as well as annual reports on Export Certificate requirements by country. The foreign-based staff of FAS submits about 3,000 reports each year. The public can register to subscribe to daily or weekly summaries of new releases. Users can receive reports on specific countries and/or commodities on the FAS website at: http://www.fas.usda.gov/scriptsw/faspush/default.asp. Development of a new GAIN System: FAS has begun the process of redesigning the GAIN system. Our overall goals for the project are to improve the amount and quality of information captured from the field, perform a technology upgrade, and greatly improve usability. A key area of focus for public users will be improved searching capabilities. The new GAIN will also feature an improved subscription service that will allow users to customize the information pushed to them, and an RSS feed, or short descriptions of web content together with a link to the full version of the report. FAS is very interested in feedback from users on desired searching or subscription features for the new GAIN. If you have comments or suggestions on these features, please email them to [email protected] by October 31, 2006.

FAS Worldwide Magazine: FAS Worldwide, which debuted in March 2005, is an online magazine from USDA's Foreign Agricultural Service. It is designed to cover the full spectrum of the Agency’s responsibilities and activities. This electronic publication provides comprehensive information about the multiple goals and activities of FAS in a flexible, user-friendly format. This online publication supersedes AgExporter, the monthly print magazine published by FAS through December 2004. FAS Worldwide is located at http://www.fas.usda.gov/. Export Sales Report: Weekly export sales reports serve as a timely early warning system on the possible impact of agricultural obligations on U.S. supplies and prices. The data is the aggregate of the previous week’s sales and exports of U.S. exporters. The data can be used, for example, to assess the level of export demand, to determine where markets exist, and to assess the relative position of different commodities in those markets. This monitoring system provides a constant stream of up-to-date information on the quantity of U.S. agricultural commodities that are sold abroad. Although the report has been in existence for awhile, we are continually working to improve the information flow to the public. As always, the full U.S. Export Sales report is published on the FAS Web page every Thursday at 8:30 am eastern time. Find the Export Sales Report at: http://www.fas.usda.gov/export-sales/esrd1.html. For additional information please e-mail: [email protected]. Export Sales Report - New Developments: FAS is developing an on-line data query system for the U.S. Export Sales report. The data will be available the day of publication on the Export Sales home page. Weekly data will be available back to January 1, 1999. A key feature of the query will include a graphics package that will automatically track the current week exports and sales versus last year and the 5-year average--by commodity and country. Look for these new enhanced features on the Export Sales Internet Home Page very soon. If you have comments on the information above, please contact Patrick Packnett, Assistant Deputy Administrator for Analysis, CMP, FAS at (202) 720-1590 or [email protected],gov.

NATIONAL AGRICULTURAL STATISTICS SERVICE STATISTICS DIVISION (NASS)
What’s New and What’s Changing
NASS Mission Statement: To provide timely, accurate, and useful statistics in service to
U.S. Agriculture Livestock A special report, Cattle Death Loss, was issued in May 2006. This report presented U.S. and State level data on the inventory and value of losses for cattle, and calves from predators and non-predators. A special report, Non-Ambulatory Sheep and Goats, was issued in May 2006. This report is the result of a cooperative effort between NASS and the Animal Plant Health Inspection Service (APHIS), Veterinary Services, and included non-ambulatory sheep and lamb totals by region, weight category, and type of operation. A special report, U.S. Cattle Supplies, was issued in March 2006. This report covered cattle supplies in the United States. Historical data on the cattle cycle, cattle on feed, and the movement of cattle were presented in the report. U.S. level kid crop estimates for angora, milk, and meat and other goats were added to the Sheep and Goats report released in January 2006. Goats were added to 2006 Sheep report in July 2006. This was the first publication of July 1 estimates of total goat inventory and kid crop for the United States. The report name was modified to Sheep and Goats to reflect this change. Milk, angora, meat and all other goats, and U.S. totals were published. The monthly Dairy Products report released in October 2005, contained a new data series for whey protein concentrates and isolates (25.0-49.9 percent, 50.0-89.9 percent, and 90.0 percent or greater). Historical data from 2003 to present were also included. The series continued in subsequent Dairy Products releases. The annual Dairy Products 2005 Summary released in April 2006, contained a new data series called skim milk powders (SMP). SMP's are essentially nonfat dry milk, which does not conform to the applicable provisions of 21 CFR part 131 "Milk and Cream" as issued by the Food and Drug Administration, due to mixing with lactose\permeate to standardize the protein percent to a desired level for the world market. The series continued in subsequent monthly Dairy Products releases. In addition, a new state-level table for sour cream production by month, State, and United States was added to this release.
A special report, U.S. Hog Breeding Structures, was issued in September 2006. This report provides information on the changes in the composition of the breeding herd by size of operation and efficiency of the breeding herd. A new monthly release, Catfish Feed Deliveries, was started in January 2006. This report tracks the monthly feed deliveries made to catfish farms by feed mills in the United States. It is summarized by feed delivered for foodsize fish and feed delivered for fingerlings and broodfish. It is published for the U.S., Alabama, Arkansas, Louisiana, Mississippi, and other States east and west of the Mississippi River. A change was made to the monthly, Catfish Processing. Starting in September 2006, a new import and export table was added to the release to give growers and processors more information about international trade regarding farm raised catfish. The “Cold Storage Space Occupied” series was dropped from the monthly Cold Storage Report, beginning February 21, 2006. Crops The annual Mushroom report now includes statistics for Chester County, Pennsylvania. This addition was requested by the industry. The Prospective Plantings, Acreage, and Crop Production reports have incorporated changes to the estimating program for various commodities. Estimates for flue cured tobacco are no longer made at the “type” level. Statistics will be published at the "class" level only. West Virginia was dropped from the tobacco program. Wisconsin was added to the dry bean program. The Noncitrus Fruits and Nuts Preliminary Summary report in January 2007 will incorporate the following program changes: Mississippi has been added to the blueberry program. Montana will no longer forecast sweet cherry production in June, so the first estimate of production for Montana will be in the January Noncitrus Fruit and Nut Preliminary Summary report. Missouri has been added to the pecan program. The monthly Agricultural Prices report will no longer include potato prices for Pennsylvania and Ohio. (Statistics for these two States will no longer be published in the Potato Stocks report.) Also, the disposition and monthly price estimates for "Malheur County" Oregon and "Other" Oregon were discontinued. The Citrus and Crop Production reports will no longer include Temple orange estimates as a separate category in Florida. Temples will be included in the “Early, Midseason, and Navel” orange estimates. Beginning with the April 2006 Vegetable report, statistics are no longer published for bell peppers in Texas or processed tomatoes in Maryland and New Jersey.

The June Acreage report included individual state estimates for the percentage of corn acreage planted to biotechnology varieties in North Dakota and Texas. In addition, individual state estimates for Alabama, Missouri, and Tennessee were also included as part of the cotton biotechnology statistics. Previously, data for these states were combined as part of the Other States total. A new weekly report, Peanut Prices, was issued beginning on October 13, 2006. This report includes the weekly price received by farmers for each type of farmer stock peanut (Runners, Spanish, Valencia, and Virginia) along with the quantity marketed. Data for the prior four weeks are also included. Starting with the September 30, 2006 release of the Peanut Stocks and Processing report, data on stocks and utilization of Valencia type peanuts were broken out from Virginia type peanuts. Beginning with the January 12, 2006 release of the Rice Stocks report, stocks data for rough rice and milled rice stored off the farm were consolidated into a total Off-Farm stocks estimate. This standardizes the publication of rice stocks with other commodities and reduces the chance of data being withheld due to disclosing individual operations. Prior to this change, off-farm stocks were broken down into three categories based on where the stocks were stored (“In Mills and Attached Warehouses”, “In Warehouses not Attached to Mills,” and “In Ports or In Transit”). Program changes that were included in the Crop Production 2005 Summary report: Mississippi was added to the peanut estimation program. Oklahoma was added to the canola estimation program and was published as part of the combined Other States total. Environmental, Economics and Demographics Agricultural Chemical Usage, Field and Vegetable Crops, Chemical Distribution Rate, December 2005 provided rate distribution tables for “Percent of Acres Treated,” “Number of Applications,” “Rate per Application,” and “Rate per Crop Year” for field and vegetable crops. These tables include the 10th and 90th percentile, median, and average of the chemical usage data. Agricultural Chemical Usage 2005 Field Crops Summary, May 2006 was expanded to include rate distribution tables for the covered commodities. Inclusion of these tables eliminated the need for a separate publication and provided the data to the public earlier. In response to Asian Soybean Rust concerns, NASS included soybean chemical usage data in the publication. Soybean data were summarized from the Conservation Effects Assessment Project (CEAP) data set. Agricultural Chemical Usage 2005 Fruit Crops Summary, July 2006 was expanded to include rate distribution tables for the covered commodities. Inclusion of these tables eliminated the need for a separate publication and provided the data to the public earlier. Farm Production Expenditures 2005 Summary was released August 2006. This is the first product from the 2005 Agricultural Resource Management Survey (ARMS), USDA’s primary vehicle for collecting data about production practices, inputs, farm costs, and financial conditions, and helped document the effects of rising energy costs, hurricane Katrina, and other adverse conditions.

Census of Agriculture The 2005 Census of Aquaculture was released in October 2006. The 2005 Census of Aquaculture expanded the aquaculture data collected from the 2002 Census of Agriculture and provides a current and comprehensive picture of the aquaculture sector at the State and National level. The aquaculture census collected detailed information relating to production methods, surface water acres and sources, production, sales, point of first sale outlets, aquaculture distributed for restoration, conservation, or recreational purposes, and farm labor. Preparation for the 2007 Census of Agriculture is well under way. The content of the forms has been finalized and the printing contract goes out for bid this month. We are currently using data from our 2005 Content Test to test the numerous census processing systems. The initial mail out is scheduled for December 28, 2007. The results are expected to be released early February, 2009.

World Agricultural Outlook Board (WAOB) Office of the Chief Economist (OCE), USDA Comments about World Agricultural Outlook Board programs may be directed to Gerald A. Bange, Chairperson, WAOB, Mail Stop 3812, South Building, USDA, Washington, D.C. 20250-3182; (202) 720-6030; [email protected].
What’s New? New Grains ICEC Chairman Three weeks prior to the release of the May World Supply and Demand Estimates (WASDE) report we lost our grains analyst. We temporarily assigned an ICEC chair to cover grains, and hired Jerry Norton to fill the ICEC grain’s analyst position as swiftly as possible. Norton was in place in September. Web Sites New Look The Office of the Chief Economist (www.usda.gov/oce/ ) has a new USDA format as does the USDA-Cornell University Mann Library site (www.usda.mannlib.cornell.edu/MannUsda/) where the World Agricultural Supply and Demand (WASDE) report and Weekly Weather and Crop Bulletins (WWCB) are archived. As a result, data and information are easier to access. Commodity Market Information System (CMIS) Project WAOB worked with GSA/FEDSIM and OCIO to redirect the CMIS project to build a report writer for the WASDE report. We expect to have the new system in place later next year. With FEDSIM support, WAOB developed an incrementally-funded work plan that reduces overhead costs by eliminating the requirement to re-solicit bids annually. Preparing for Emergency Operations New Continuity of Operations Plan (COOP) Facility. WAOB economists conducted onsite tests of hardware, software, and communications capabilities at OCE’s new COOP facility which opened and is co-located with National Agricultural Statistics Service (NASS) in Fairfax, Virginia. Software was installed to mirror WASDE backup files to the Fairfax site. We implemented a monthly procedure to refresh all the COOP laptops with Microsoft, McAfee, and other applications updates. To ensure access to meteorological information at the Fairfax site, we installed FX-NET for accessing critical weather information in an emergency. These technologies enable production of the WASDE report and WWCB at the Fairfax site in the event USDA’s South Building is shutdown. We collaborated with NASS to provide for a Level 4 COOP site by collocating with NASS in Charlotte, North Carolina.

Disaster Recover. OCE also prepared a Human Pandemic Plan. International Exchanges Hosting Exchanges. WAOB hosted delegations from Argentina, Australia (Nuffield Scholars), Brazil, China, Kenya, Madagascar, and Ukraine this year. Foreign Groundwork. Jerry Bange and Keith Menzie were invited by CONAB (Brazil’s National Supply Company which is part of Brazil’s Ministry of Agriculture), to meet with Brazilian Government officials in Brasilia to discuss USDA supply and demand analytical procedures. Brazil is the world’s second largest producer and exporter of soybeans behind the United States. In a 2-day meeting, we described in detail the methodology used by USDA to estimate the size and disposition of Brazil’s soybean crop. As intended, this interchange established an excellent working relationship with CONAB President Jacinto Ferreira, other Brazilian government officials, and laid the groundwork for future exchanges. Improving Communication. WAOB hosted several international teleconferences which linked attaches, Foreign Service Nationals, ERS and FAS/Washington staff. Conferences focused on: the implications of foot and mouth disease (Moscow, Brasilia, and Brussels); resuming beef exports to Japan (Tokyo, Canberra, Ottawa, and Wellington); and, the impact of Avian Influenza in Europe (Brussels and Moscow). Ethanol USDA/WAOB’s monthly estimates of corn use for ethanol production led the industry throughout the year. We informed NASS of previously unidentified ethanol data sources and met with the Energy Information Agency (EIA) to underscore the importance of ethanol production data to agriculture and to promote data consistency between USDA and EIA. As a result, EIA has stepped-up efforts to gather ethanol production information.
What’s Changed? Report Usage Grows The WASDE report is among USDA’s most widely viewed reports. During FY 06, the WASDE report was accessed, on average, 20,000 times per week on USDA’s Web site and 9,000 times per week on USDA’s Cornell site, where the report is archived. Also, the WASDE report has 5,400 subscribers on USDA’s Cornell site. From Sep. 2005 to Aug. 2006: the Weekly Weather and Crop Bulletin was hit 395,000 times on USDA’s Cornell site; the WWCB archive (1971-2006) was hit 456,000 times; and, the Morning Weather Summary was hit 116,000 times. WAOB’s Climatic Profiles publication was accessed 1,266,972 times. ICEC Review Forum WAOB organized its sixth annual ICEC Review Forum that invites industry analysts to speak about program strengths and weaknesses and helps us improve and set future program priorities

for the following year. Based on Forum review, USDA incorporated stochastic estimates into the President’s Budget Baseline for the first time. Weather Monitoring WAOB’s Joint Agricultural Weather Facility (JAWF) prepared numerous early warnings and assessments of significant weather events that affected agriculture. Our meteorologists described projected storm tracks, wind speeds, and rainfall, and used GIS to delineate crop areas and project probable crop losses. WAOB also prepared briefing materials for the Chief Economist in support of USDA’s drought task force. WAOB decommissioned the NOAAPORT/ Advanced Weather Interactive Processing System (AWIPS) system in Kansas City and replaced it with a direct connection to the NWS NOAAPORT/AWIPS site in Camp Springs, Maryland. The FX-NET system provides access to a limited set of AWIPs products but uses the public internet instead of expensive dedicated circuits, resulting in a substantial cost savings. WAOB also installed FX-NET at its Fairfax, Virginia, COOP site eliminating for a significantly more costly NOAAPORT installation. USDA’s Annual Outlook Forum Record Attendance in 2006. Planned and coordinated USDA’s 2006 Agricultural Outlook Forum, “Prospering in Rural America.” Registration totaled a record 1,772. WAOB posted Forum speeches on the Web on the day of presentation and provided Forum attendees with a CD including all Forum presentations. The Forum Web site was hit over 3,000 times during and immediately following the event. Student Diversity Program. WAOB has initiated, with CSREES assistance, the “USDA Outlook Forum Diversity Program.” Students selected for this program will be reimbursed for Forum-related transportation and per diem expenses using private sector and government funds. The program targets 10 agriculture, agricultural economics, agricultural communications, agricultural business, or pre-veterinary junior or senior undergraduate students. Several corporations and USDA agencies have volunteered sponsorship for the 2007 Forum. 2007 Forum. Next year’s forum will be held March 1-2, 2007. Secretary Johanns will be the keynote speaker and Scott Kilman of the Wall Street Journal will moderate a distinguished panel of America’s leading CEOs focusing on the impact of bioenergy on agriculture. Other distinguished guest speakers are also being invited. Please take one of our postcards with you that cite the OCE Web site where you can get more information and review a preliminary program. More information is available at: www.usda.gov/oce/forum.

U.S. Census Bureau
Foreign Trade Division Each month the Foreign Trade Division of the United States Census Bureau (Census) releases the FT-900 U.S. International Trade in Goods and Services report, which is one of the principal economic indicators for the United States. This report along with other information can be found on our Web site at: www.census.gov/trade. Information available includes:
FT-900 U.S. International Trade in Goods & Services, current and historical issues
Information on the Automated Export System (AES)
Schedule B commodity classification search
Export and import statistics by country or commodity
U.S. foreign trade export regulations Current Issues of Interest Regulations The regulations mandating the electronic reporting of exports through the Automated Export System or AESDirect continue through the review process. We still anticipate issuing these regulations, however we do not have an estimated publication date. Data Products During 2006, we added a new port data product to USA Trade Online. Data users may obtain information by Harmonized System code (2-, 4-, or 6-digit) by country by port. The measures available include total value, vessel value, air value, and vessel and air shipping weight. We are currently investigating whether the quality of the overland shipping weight is sufficient for publication. Anyone interested in a 30-day trial of this product should e-mail Nick Orsini, Assistant Division Chief for Data Dissemination at [email protected] or 301-763-2311. We are also working to add a containerization breakout for vessel shipments to this data product. We expect to release this enhancement with December statistics, which will be released February 13, 2007. Revisions We have recently posted our revisions policy upon our web site (www.census.gov/trade). We continue to issue commodity-specific corrections in response to investigations initiated by questions from data users. We post updates at least twice a month. These corrections are available at www.census.gov/tradestats.

We ask your continued assisitance.in maintaining the accuracy of the trade statistics. If you become aware of potential problems in the trade statistics please contact Paul Herrick, of our Commodity Analysis Branch, as soon as possible to report the problem. Questions about this presentation? Please address them to Diane Oberg, Senior Foreign Trade Advisor, 301-763-2223 or [email protected].
Other Foreign Trade Division Contacts: Main Foreign Trade Page: http://www.census.gov/trade FTD Reference Page: http://www.census.gov/tradereference FTD Statistics Page: http://www.census.gov/tradestats Foreign Trade Data Products: (301) 763-2227 or Fax: (301) 457-2647 FTD Regulations Page: http://www.census.gov/traderegs/ FTD AES Page: http://www.census.gov/aes Correspondence can be written or faxed to: Foreign Trade Division U.S. Census Bureau Washington, D.C. 20233-0001 Fax: (301) 457-1159 Inquiries about our published statistics can be written, E-mailed, or faxed to: Mr. Paul E. Herrick U.S. Census Bureau 4700 Silver Hill Road, Rm 3142, FOB 3 Suitland, MD 20746 E-mail: [email protected] Fax: (301) 457-1158 Manufacturing and Construction Division Ethanol At present, the M311 J, Fats and Oils--Oilseed Crushings report, contains production and stocks data for crude oil produced from corn. Beginning with January 2007 statistics, to be released around February 25, the MCD will be adding additional product breakouts. The staff is still working with USDA and others to finalize the breakouts and to discuss ways of presenting the results.
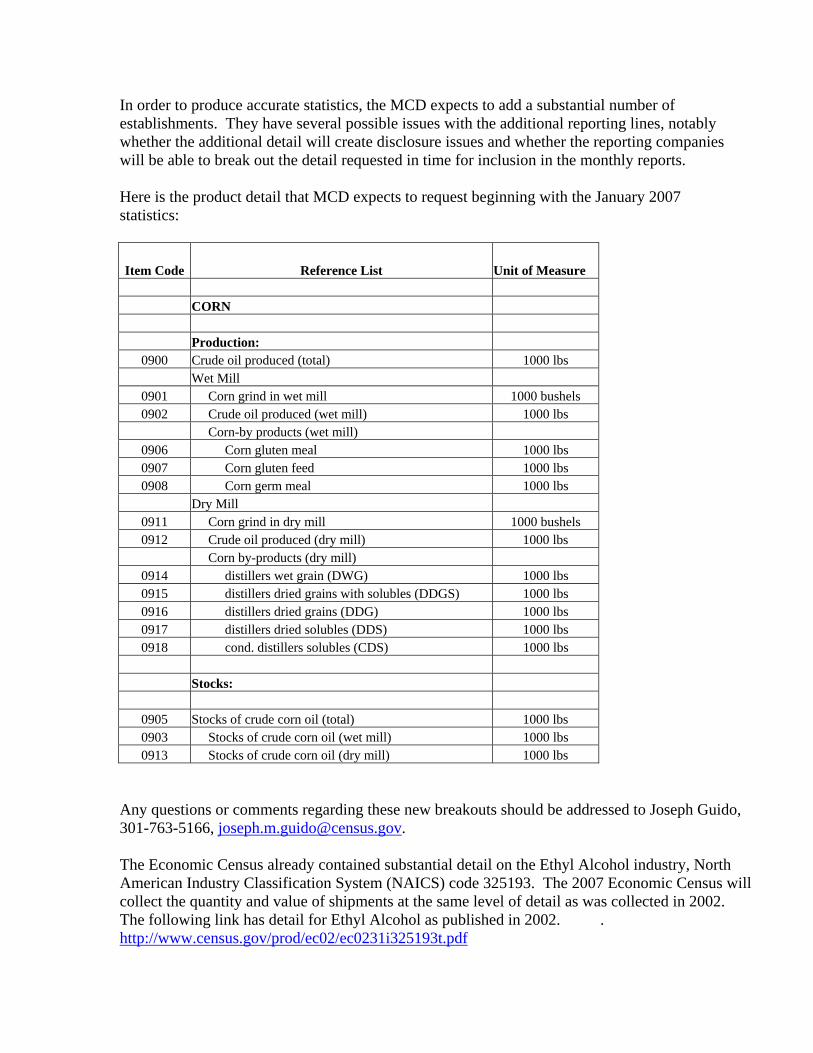
In order to produce accurate statistics, the MCD expects to add a substantial number of establishments. They have several possible issues with the additional reporting lines, notably whether the additional detail will create disclosure issues and whether the reporting companies will be able to break out the detail requested in time for inclusion in the monthly reports. Here is the product detail that MCD expects to request beginning with the January 2007 statistics:
Item Code Reference List Unit of Measure CORN Production:
0900 Crude oil produced (total) 1000 lbs Wet Mill
0901 Corn grind in wet mill 1000 bushels 0902 Crude oil produced (wet mill) 1000 lbs
Corn-by products (wet mill) 0906 Corn gluten meal 1000 lbs 0907 Corn gluten feed 1000 lbs 0908 Corn germ meal 1000 lbs
Dry Mill 0911 Corn grind in dry mill 1000 bushels 0912 Crude oil produced (dry mill) 1000 lbs
Corn by-products (dry mill) 0914 distillers wet grain (DWG) 1000 lbs 0915 distillers dried grains with solubles (DDGS) 1000 lbs 0916 distillers dried grains (DDG) 1000 lbs 0917 distillers dried solubles (DDS) 1000 lbs 0918 cond. distillers solubles (CDS) 1000 lbs
Stocks:
0905 Stocks of crude corn oil (total) 1000 lbs 0903 Stocks of crude corn oil (wet mill) 1000 lbs 0913 Stocks of crude corn oil (dry mill) 1000 lbs
Any questions or comments regarding these new breakouts should be addressed to Joseph Guido, 301-763-5166, [email protected]. The Economic Census already contained substantial detail on the Ethyl Alcohol industry, North American Industry Classification System (NAICS) code 325193. The 2007 Economic Census will collect the quantity and value of shipments at the same level of detail as was collected in 2002. The following link has detail for Ethyl Alcohol as published in 2002. . http://www.census.gov/prod/ec02/ec0231i325193t.pdf

The Annual Survey of Manufactures (ASM) also provides data on the Ethyl Alcohol industry. Data are published for value of shipments only. The following link has the latest 2004 ASM data for Ethyl Alcohol. http://www.census.gov/prod/2005pubs/am0431vs1.pdf Biodiesel In January 2006, MCD broke out the consumption of methyl esters from once-refined soybean oil in the M311 K report. In January 2007, they will break out the consumption of methyl esters for each of the oils in the report. This report will be released in late February/early March 2007. Questions about this report should be addressed to James Day, 301-763B3429, [email protected]. For the 2007 Economic Census, MCD is investigating the possibility of adding the following product categories:
From current 10-digit product code 325199E111, natural organic chemical derivatives of fatty substances, a separate 10-digit product code for “biodiesel fuel, pure, used as an additive for blended petroleum diesel fuel.”
From current 10-digit product code 3241992241, all other petroleum and coal products, a separate 10-digit product code for “biodiesel fuel made from purchased petroleum diesel and biodiesel additive.”
Questions about the Economic Census or ASM data should be addressed to Nat Shelton, Chief, Primary Goods Industries Branch, 301-763-7632, [email protected]. Actual release dates for both of these reports will be posted on the Current Industrial Reports website: http://www.census.gov/cir/www/index.html. Cooperation from the industry is essential to the Census Bureau’s ability to provide complete, accurate and timely statistics. Both of these mandatory reports are produced on a very tight timeframe. There are generally just 3 weeks between survey mail out and publication of the statistics. Prompt return of the survey forms will be critical to the success of the expanded statistics.

Data Users Meeting Summary of Questions and Comments
Chicago, Illinois October 16, 2006
Note: The following write-up presents a topical summary of issues discussed during the afternoon open forum. Material is presented in chronological order. However, all discussions on a specific topic have been consolidated if it came up more than once. Quick Stats: A comment was made to NASS regarding data on their on-line database (Quick Stats). It was mentioned that at one time there was a soybean price gap for some months and that soybean prices were being reported in dollars per bale. However, since then the errors had been corrected. Steve Wiyatt of NASS said they were aware of problems and that everything should now be corrected. Both Steve Wiyatt and John Van Dyke of AMS emphasized that if any errors are ever identified through their respective on-line databases, to contact them so they can be corrected. Energy Production: What kind of detailed data would be provided by the Census Bureau regarding ethanol? Diane Oberg of the Census Bureau said there are no specifics at this time, but they are still working with USDA on how the tables will look. Gerald Bange and Jerry Norton of WAOB mentioned they are working on this as well and that industry needs to let the Census Bureau know what works best for them. A comment was made that ethanol information from the EIA report comes out two months late and they need this information earlier. Gerald Bange responded by saying that government agencies can’t just go out and collect data, sometimes there needs to be legislation, OMB clearance, or funding to collect the data needed. However, he finished by saying they will try to push it along and get the information to the industry. A question was asked about how compensation is made to handle feed usage estimates given that ethanol production is known as well as the by-product from ethanol production. Gerald Bange of WAOB explained these numbers have always been difficult for USDA to estimate. He continued by saying this is usually a residual calculation and may not always correlate with animal numbers. Jerry Norton of WAOB stated that they do use some information from FSA regarding dry vs. wet mill and work back from ethanol production to get DDG’s. Is NASS ready to measure cellulostic fiber crops for the production of ethanol? Steve Wiyatt of NASS explained if data users need the data and there is funding for it, NASS would look into including it in their reports. Carol House of NASS asked a question about what new data products the panel could provide data users regarding ethanol. A data user responded there could be a lot but didn’t know exactly what at the time. However, he did mention that it would be helpful if import data were made available

in a more timely manner. John Van Dyke explained that AMS, along with other government agencies, is trying to make import data available in a real time fashion but doesn’t know when it will be available. Gerald Bange of WAOB finished by saying that when something is happening in the industry, it takes government a little time to react. Export sales report came out in the 1970’s as a result of the grain crisis. Is USDA doing anything to measure bio-diesel and ethanol production overseas? Patrick Packnett of FAS explained they are getting some information from their attaches overseas but have not established an annual report yet. He also explained some attaches reports are available on their website. A comment was made by a data user that gallons of bio-fuel per acre would be a useful statistic. A comment was made that private analysts put their own views of the energy market into their analysis. From this, a question was asked if USDA will also do this by either bringing in their own consultants or hiring someone or just use EIA’s data. Gerald Bange of WAOB answered they really don’t have any other option but to use EIA data as there is no energy analyst on staff at WAOB. He continued that possibly in May, WAOB will break out the amount of soybeans used for bio-diesel. Brazil: From meetings in Brazil, is there one agency there industry should look to for reliable information? Gerald Bange explained that getting good data from Brazil is difficult when different government agencies there are putting out different estimates for the same commodity. He continued by saying CONAB is working hard to be the agency of record for Brazil and is trying to adopt more of a USDA style of making estimates. Keith Menzie of WAOB stated CONAB publishes their results within two weeks of data collection and use a panel survey. However, Instituto Brasileiro de Geografia e Estatistica (IBGE) takes about six weeks to publish their data but uses more statistical sophistication than CONAB. Steve Wiyatt of NASS finished by saying NASS has worked with these two agencies to try and get them together in order to provide better data. October Crop Production Report: A question was directed to NASS asking what percentage of plots from the Objective Yield Survey were harvested for the October Crop Production report. Greg Thessen of NASS responded that 76% of the corn plots and 63% of the soybean plots were harvested. Someone asked how the corn acreage decreased in October by 800,000 acres. Steve Wiyatt of NASS explained that administrative data from FSA were used along with survey data to re-evaluate acres and stated the change was still within the sampling error. A question was asked regarding what changes NASS saw in ear weights from September to October. It was mentioned that normally big crops get bigger during the forecast season but that didn’t happen this year. Steve Wiyatt stated that ear weights were close for August and September but were down somewhat for October. He continued by saying NASS also gets data from the farmer reported survey and felt that the yield should be reduced.

Pork Cuts: Will reporting of the AMS blue sheet report of pork cuts get better? John Van Dyke of AMS responded they are also concerned and based on discussions with the industry, they don’t see any changes being made. A comment was made from a data user that maybe USDA should stop publishing a cut out value for a few days if more accurate and timely information isn’t reported to them. Since it’s not USDA’s fault they can’t get the information because the data are not being reported to them, it might force the issue within the pork industry if there were no data being published. John Van Dyke of AMS agreed with these comments and mentioned it is something they’ve looked into at AMS as well and it may come down to discontinuing publishing the data. Trend Yields: Why does WAOB use yields back to 1960 to determine trend yields instead of using a 10 year average knowing the recent advancements made in GMO seed technology? Gerald Bange of WAOB explained this decision is left up to the ICEC committee to determine what to use. They are not constrained to use a 30 year average, they can use 5, 10, 15 year averages if they choose to. He finished by stating that in May, WAOB doesn’t have anything to go on for row crops except trend since NASS doesn’t set their first yield forecasts until August. Mandatory Reporting: What is the status of mandatory price reporting for breakout of barrows and gilts and for retail prices? John Van Dyke of AMS stated the barrows and gilts reporting will not happen overnight and the various government agencies were meeting to determine what should be mandated. Janet Perry of ERS also mentioned that retail price reporting will not be mandated by ERS until Secretary Johanns says to. Are manufacturing reports from Census mandatory? Diane Oberg of the Census Bureau answered that both reports regarding manufacturing are mandatory. Outlook Conference: A comment was made to WAOB that hard copies of the remarks made by Chief Economist Collins and Secretary Johanns should be made available immediately after their presentations at the Agricultural Outlook Conference. Gerald Bange of WAOB said this shouldn’t be a problem and he would work to make sure this happens. Confidentiality: How can NASS and WAOB reports be confidential and is there any way the numbers can be leaked before they are released to the public? Gerald Bange of WAOB started by saying that they don’t even receive the data from NASS until 3:00 am and is within lockup conditions. Therefore, they don’t even know NASS estimates until then. Steve Wiyatt of NASS explained that speculative data are not decrypted until the Board convenes inside lockup conditions. Estimates are set in lockup so there is no way the data could be leaked before the report is released. Carol House of NASS stated that a complete security review was conducted about a year ago and everything was deemed good. There were a few minor tweaks that were made based on the review, but nothing that was done as a result of possible data leaks. Gerald Bange concluded by commenting that other government agencies release data to the White House prior to the report being released, but the USDA does not. Sampling Errors: A question was asked to NASS if there is a report that states the sampling error for NASS estimates. Carol House of NASS explained that sampling errors were only one source

of error that may cause estimates to change later in the season, but there was no reason NASS couldn’t provide sampling errors. She continued by saying that reliability tables are already available in most reports that show relative error for current estimate to final estimates historically. Government Dairy Products: A comment was made to NASS that government dairy products continue to be reported as a separate item in the monthly Cold Storage report. He mentioned that industry needs to know these data since dairy products have price supports. Dan Kerestes of NASS explained that it’s no problem to continue reporting government dairy products separately, but NASS wanted to know for sure considering that these data are sometimes thin. Stochastic Forecasting: How is WAOB using stochastic forecasting and for what? Gerald Bange of WAOB responded it was developed by ERS and is not really that sophisticated. It spins off yields with a range and probabilities for WAOB to use in 5 and 10 year baseline estimates. A data user recommended WAOB continue to use it and share it with industry if possible. Mr. Bange commented he didn’t know a reason why it couldn’t be shared with the industry. Janet Perry of ERS said she would talk with people at ERS to suggest making them available to the industry. Australian Wheat: A question was asked to WAOB about how they put together the Australian wheat estimates for October and how did the change occur. Gerald Bange of the WAOB answered by saying they knew there were drought problems in September but didn’t know the extent until October. They looked at drought indicators in each region during September. Rainfall was low, but they had not had the heat. He explained it’s hard to assume normal weather in September but after the September lockup, the rain did not materialize and it turned hot. They looked at satellite imagery closely and realized the crop was maturing 2-3 weeks early. Therefore, a change was made to their forecast for October. USDA Energy Council: A question was asked regarding a presentation made by USDA Undersecretary Thomas Dorr. The question was, “What is the USDA Energy Council and where can the presentation by Undersecretary Dorr be found”. Gerald Bange of WAOB responded by saying that Dorr is a huge proponent of bio-energy and he formed USDA groups to look at bio-energy. Baseline Projections: How will baseline projections be affected by politics, new administration, and new Farm Bill the next couple years? Gerald Bange of WAOB responded that most people have a fairly consistent outlook the next 1-2 years. However, the debate gets more heated 3-4 years out. There are no “crystal balls” that WAOB uses, so there is no way of knowing for sure considering the uncertainty of different issues such as ethanol, exports, feed, etc. The farther out projections are made, the less reliable and useful they are. FSA Base Acreage: A comment was made that FSA is re-doing farmer base acreages using satellite imagery which is reducing farmer acres 2-3%. A question was then asked to NASS of how this might affect acreage estimates made by NASS and how does it affect yield if production is the goal? Mark Harris of NASS explained no changes would be made to determine yield since they are not affected by changes in acreage. He continued by saying NASS uses surveys to determine acres and FSA data are used to true them up at the end of the year. Greg Thessen concluded that NASS doesn’t use FSA base yields for anything, just acreage.

Prospective Plantings Report: A comment was made there is a lot of interest in next Spring’s Prospective Plantings report considering how much corn needs to be produced in order to meet demand. Another comment was made to put all available resources into this report to get it right. Steve Wiyatt of NASS agreed and they will do the best job they can. Gerald Bange commented that looking at the prices between corn and soybeans, corn should take away acres from soybeans. He also mentioned preliminary forecasts will be released at the Outlook Forum. Protein Price Data: How does the panel feel about the Kansas City and Minnesota protein price data? How much data are behind the series? John Van Dyke of AMS answered they don’t have anyone on the Kansas City Board anymore. However, there is still one reporter on the Minneapolis floor and does a good job, but the value there is declining. Non-Fat Dry Milk: Regarding non-fat dry milk shipments, a question was asked if there are any other sources of data available. Shayle Shagam of WAOB answered there is nothing that he knows of. Cold Storage: NASS was asked about beef in cold storage. The data user stated that NASS started to publish more detail on poultry in the Cold Storage report. He continued that with more beef in cold storage, was there any thought to publishing more detail regarding beef. Dan Kerestes of NASS responded that NASS needs industry input on exactly what is needed and then NASS would see if the cold storage facilities could report this information or not. A comment was then made by another data user that it would be useful to know the beef imports versus exports. Also, it would be good to know if the beef is ground or trimmed. Dan Kerestes requested that the data user provide him with the specific requests that he wanted. Retail Scan Data: A comment was made by a data user that retail scan data are the single most important data available for beef. He mentioned he would like to see more of it and made mandatory if possible.