Embed Size (px)
Citation preview

Voluntary Report - public distribution
Date: 12/18/2006
GAIN Report Number: CS6015
CS6015
Costa Rica
HRI Food Service Sector
Expansion of the Tourism Sector is increasing demand for imported foods
2006 Approved by: Justina Torry U.S. Embassy San Jose
Prepared by: Luis Solera Report Highlights: The expansion of the tourism sector has also increased the demand for imported food and beverages over the last few years. The number of tourists visiting Costa Rica grew at an annual average rate of 14% during the period 2002-2005. This sector has been a driver in the growth of food service companies and is resulting in the development of new hotels and restaurants outside of the capital city, especially in the Northern and Central Pacific regions. Foreign tourists often eat local products, but also like to consume imported products, such as meats, pastas, vegetables and seafood, among others. Industry sources anticipate that this sector will continue to foster the expansion of imported food and beverages in the coming years, although probably at a slower rate than in the past (10% annual growth during the period 2006-2012).
Includes PSD Changes: No Includes Trade Matrix: No
Unscheduled Report San Jose [CS1]
[CS]
USDA Foreign Agricultural Service
GAIN ReportGlobal Agriculture Information Network
Template Version 2.09

GAIN Report - CS6015 Page 2 of 39
UNCLASSIFIED USDA Foreign Agricultural Service
Hotel, Restaurant, Institutional (HRI) Food Service Sector Report
Index I. Market Overview 3 I.1. Economic Situation 3 I.2. Market Characteristics and Trends 3 I.3. Market Structure 4 I.3.1 Hotels 5 I.3.2 Restaurants 5 I.3.3 Institutional Sector 6 I.4 Advantages and Challenges of U.S. Food and Beverages8 II. Market Access 9 II.1. Distribution Channels for the HRI Food Service Sector 9 II.2. Tariffs and Import Regulations 9 II.2.1 Tariffs 10 II.2.2 Import Regulations 12 II.2.3.Labeling Requirements 13 II.2.4.Approval of Beef and Poultry Plants 13 III. Competition 14 IV. Best Prospects 32 V. Entry Strategy and Recommendations 37 VI. Contact List 38

GAIN Report - CS6015 Page 3 of 39
UNCLASSIFIED USDA Foreign Agricultural Service
I. Market Overview
I.1. Economic Situation
Costa Rica has a relatively developed economy and is considered one of the most politically and economically stable nations in Central America. It has achieved a high level of economic development in part because the country has invested in health, education and infrastructure. Foreign investors remain attracted by the nation's political stability and high education levels (literacy rate is 96%). Some of the best-know foreign technology companies, pharmaceutical companies and medical device makers have already installed manufacturing facilities in Costa Rica. The country is also becoming a cost-effective location for call centers and for the outsourcing of financial and administrative services. Costa Rica has experienced continued economic growth during the last three years, which has resulted in higher expenditures of imported food products. Economic growth as measured by the Gross Domestic Product (GDP) reached 5.6 % in 2003 and 4.1% in 2004 and 2005. GDP is forecast to grow by 3.6% in 2006. Costa Rica's economy depends on tourism, agriculture, and electronics exports. The country has one of the highest incomes per capita in Latin America (per capita GDP of $4,580 in 2005) and a relatively high standard of living. Costa Rica’s economy also has internal structural problems, especially an increasing inflation rate, which reached 9.87% in 2003, 13.13% in 2004, and 14% in 2005 - the highest in ten years. The reduction of inflation remains a difficult problem because of rises in the price of imports, labor market rigidities, and fiscal deficits. Costa Rican unemployment rate is also relatively high, reaching 6.7% in 2003, 6.5% in 2004 and 6.6% in 2005. These two elements, high inflation and unemployment rates reduce the real income and the purchasing power of middle class and lower income groups. The devaluation of the Costa Rican currency also contributes to increase prices for imports in local currency (colon), although this factor has been declining in recent years. The devaluation rate reached 10.5% in 2003, 9.5% in 2004 and 8.4% in 2005. The Central Bank of Costa Rica (BCCR) forecasts that the devaluation rate will continue its downward trend and will not exceed 6.6% in 2006. With a lower devaluation and a restrictive monetary policy, the inflation rate is forecast to decrease to 11% in 2006. The United States-Central America-Dominican Republic Free Trade Agreement (CAFTA-DR) was introduced in the Costa Rican Legislative Assembly in November of 2005. Approval of CAFTA-DR may occur in 2006. CAFTA-DR implementation would result in economic reforms and an improved investment climate. The United States is already the main trading partner of this country, accounting for 47% of the $9.8 billion that Costa Rica imported in 2005. The United States is also the largest source of agricultural imports to Costa Rica. In 2004, U.S. products accounted for 44% of all agricultural imports and 25% of the food and beverage products imported by this country. U.S. food and beverage exports to this market increased by 16% in 2004.
I.2. Market Characteristics and Trends
In 2005, Costa Rica’s GDP totaled $19.8 billion. The population was estimated to be 4.325.838 and growing at an annual rate of 1.48 percent. Costa Rica’s population is

GAIN Report - CS6015 Page 4 of 39
UNCLASSIFIED USDA Foreign Agricultural Service
concentrated in the Central Valley, with 64% of its population living in this area. This region has considerably higher incomes and lower poverty rates than rural areas. Real household income of Costa Ricans grew during the last 16 years (1988-2004) by an annual average rate of 2.1%. This has allowed Costa Ricans to increase expenditures on food and beverages and on eating outside of the home. Less time for cooking as more women enter the labor market has also contributed to this pattern. During the period 1988-2004, eating out by Costa Rican households grew by 28%. As of 2004, among all food-related expenditures, Costa Ricans spent the most on eating outside of the home. In particular, middle to high income groups were eating out more frequently during this period. A high percentage of the population is classified as middle and high-income earners. Upper income household groups are the most likely customers of fine restaurants and most of them are able to afford vacations at four and five star hotels. High-end hotels and fine restaurants are the main HRI buyers of imported food in Costa Rica. The expansion of the tourism sector has also increased the demand for imported food and beverages over the last few years. The number of tourists visiting the country grew at an annual average rate of 14% during the period 2002-2005. More than 1.6 million tourists visited Costa Rica in 2005, spending $1.6 billion in this economy. This sector has been a driver in the growth of food service companies and is resulting in the development of new hotels and restaurants outside of the capital city, especially in the Northern and Central Pacific regions. Foreign tourists often eat local products, but also like to consume imported products, such as meats, pastas, vegetables and seafood, among others. Industry sources anticipate that this sector will continue to foster the expansion of imported food and beverages in the coming years, although probably at a slower rate than in the past (10% annual growth during the period 2006-2012). The size of the HRI market is not known, but industry sources estimate that the value of imported food products may total $60 million in 2006 and could grow at an annual rate of 15% in the next three years. The value of imported alcoholic beverages is approximately $12 million and is expected to grow at an annual rate of 10%.
I.3. Market Structure
I.3.1. Hotels
Costa Rica has developed a positive image as a tourist destination. Drawing foreign tourists to the country are the country’s environmental attributes, its accessibility to the United States and Europe, and its reputation as a peaceful country in the region. Top quality hotels in Costa Rica are few, but international hotel chains are showing a growing interest in the country. In 2005, a total of 390 hotels with 16,003 rooms were operating in Costa Rica. Large scale and high-end hotels are major users of imported food products. Some import directly, but due to the tedious and cumbersome importation process they generally relay more on food service companies. See Exhibit 1 for a list of the main hotels in Costa Rica. The majority of customers of middle to high-end hotels are foreign visitors, especially U.S. citizens, who expect high quality products. Consequently, the food service sector imports a large number of food products, although only a few are of high turnover.
GAIN Report - CS6015 Page 5 of 39
UNCLASSIFIED USDA Foreign Agricultural Service
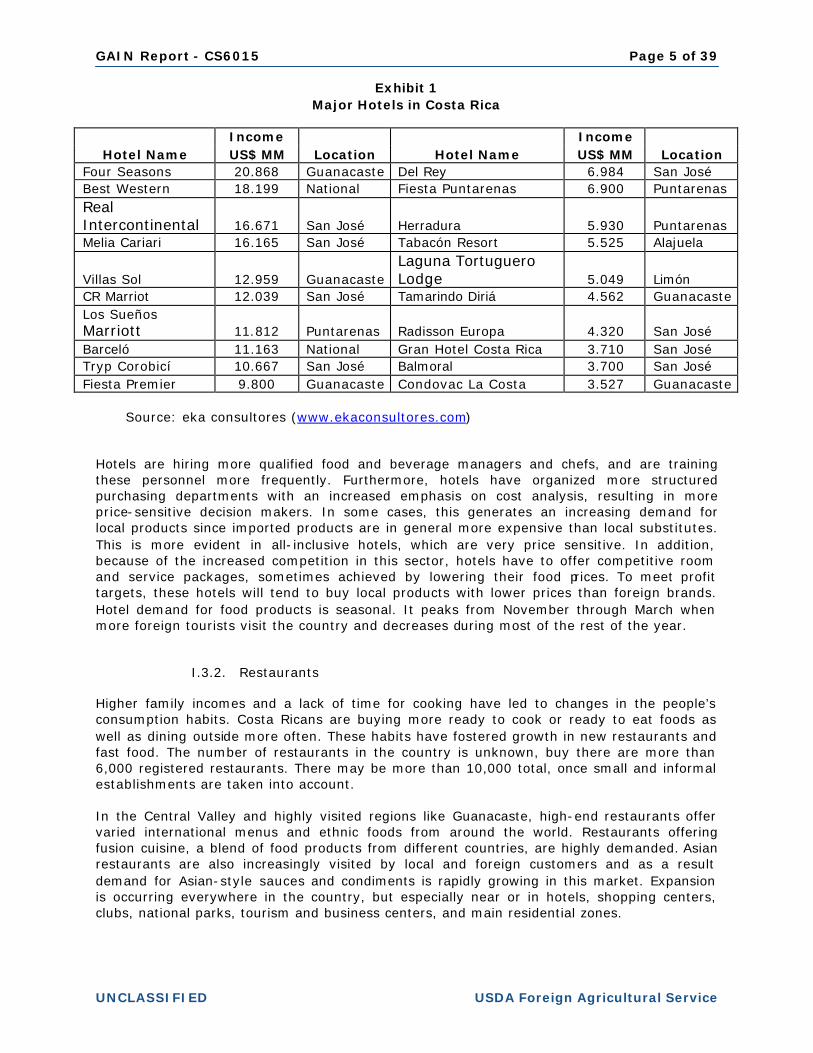
Exhibit 1 Major Hotels in Costa Rica
Income Income
Hotel Name US$ MM Location Hotel Name US$ MM Location Four Seasons 20.868 Guanacaste Del Rey 6.984 San José Best Western 18.199 National Fiesta Puntarenas 6.900 Puntarenas Real Intercontinental 16.671 San José Herradura 5.930 Puntarenas Melia Cariari 16.165 San José Tabacón Resort 5.525 Alajuela
Villas Sol 12.959 Guanacaste Laguna Tortuguero Lodge 5.049 Limón
CR Marriot 12.039 San José Tamarindo Diriá 4.562 Guanacaste Los Sueños Marriott 11.812 Puntarenas Radisson Europa 4.320 San José Barceló 11.163 National Gran Hotel Costa Rica 3.710 San José Tryp Corobicí 10.667 San José Balmoral 3.700 San José Fiesta Premier 9.800 Guanacaste Condovac La Costa 3.527 Guanacaste
Source: eka consultores (www.ekaconsultores.com) Hotels are hiring more qualified food and beverage managers and chefs, and are training these personnel more frequently. Furthermore, hotels have organized more structured purchasing departments with an increased emphasis on cost analysis, resulting in more price-sensitive decision makers. In some cases, this generates an increasing demand for local products since imported products are in general more expensive than local substitutes. This is more evident in all-inclusive hotels, which are very price sensitive. In addition, because of the increased competition in this sector, hotels have to offer competitive room and service packages, sometimes achieved by lowering their food prices. To meet profit targets, these hotels will tend to buy local products with lower prices than foreign brands. Hotel demand for food products is seasonal. It peaks from November through March when more foreign tourists visit the country and decreases during most of the rest of the year.
I.3.2. Restaurants
Higher family incomes and a lack of time for cooking have led to changes in the people’s consumption habits. Costa Ricans are buying more ready to cook or ready to eat foods as well as dining outside more often. These habits have fostered growth in new restaurants and fast food. The number of restaurants in the country is unknown, buy there are more than 6,000 registered restaurants. There may be more than 10,000 total, once small and informal establishments are taken into account.
In the Central Valley and highly visited regions like Guanacaste, high-end restaurants offer varied international menus and ethnic foods from around the world. Restaurants offering fusion cuisine, a blend of food products from different countries, are highly demanded. Asian restaurants are also increasingly visited by local and foreign customers and as a result demand for Asian-style sauces and condiments is rapidly growing in this market. Expansion is occurring everywhere in the country, but especially near or in hotels, shopping centers, clubs, national parks, tourism and business centers, and main residential zones.

GAIN Report - CS6015 Page 6 of 39
UNCLASSIFIED USDA Foreign Agricultural Service
Fast food and fast service restaurants offering mainly hamburgers, fried chicken, pizza and local food are common, accounting for an estimated one third of the Costa Rican market. Fast food chains import sauces, cheeses, frozen french fries, and condiments, among the most demanded import products. Some chains have more flexible purchasing policies and authorize Costa Rican franchisees to buy local. Others will buy mainly from U.S. manufacturing plants or from foreign suppliers selected by their respective head quarters. The main fast food chains in Costa Rica are listed in Exhibit 2. The majority of these chains buy imported food products from food service importers.
Exhibit 2 Major Fast Food Chains in Costa Rica
Sales Sales
Company name US$ MM Units Company name US$ MM Units Alimentos del Rey 22,539 60 Rostipollos 5.421 13 (BK, CC PPJ) Restaurantes Subs 4.782 23 Pizza Hut 22.000 43 Pollos Campero 4.652 6 Mc Donalds 18.900 27 Spoon 4.500 15 Kentuky Fried Chicken 10.500 18 Quiznos 4.200 9 Taco Bell 6.700 15 La Princesa Marina 3.277 4
Source: eka consultores (www.ekaconsultores.com) There is a trend in the hotel and restaurant sector towards healthy, fresh, natural products since their customers favor fresh flavors. Consequently, most hotels and restaurants prefer to buy local fresh products, such as seafood, beef, poultry, vegetables and fruits. Imported food products requested by this sector are normally items that are not locally produced, or of higher quality than those of local origin. Most of the hotels and restaurants are price sensitive and, in general, only the high-end segment of the sector is willing to pay more for imported products of higher quality. Local and foreign fast food outlets, fast service restaurants and high-end hotels often use more than one food service supplier. For fresh fruits and vegetables and other perishable goods restaurants use large suppliers mostly headquartered in San José or regional/local suppliers, some with limited production and/or distribution capacity. The food service sector is growing in different areas, including number of hotels, number of new restaurants and number of franchises. There is room to grow in this sector and U.S. exporters can identify opportunities by contacting the food service suppliers.
I.3.3. Institutional Sector
The local institutional market is made up of public institutions and private cafeterias servicing companies and industrial parks. A total of 80 company cafeterias or cafeterias in industrial parks are buying local and imported food products. Food sales to this segment total approximately $3.8 million, according to industry estimates, and grow at an annual rate of 3%. The main public sector buyers of food products are public schools, hospitals, public security institutions, the justice system and the energy sector. Industry sources estimate that food sales for the public institutions segment are approximately $59 million and growing at annual rate of 10%. Public sector institutions buy local products mainly and are price sensitive. There are 4.476 public and private schools in Costa Rica with more than one million students. The Costa Rican government sponsors a food support program administered by

GAIN Report - CS6015 Page 7 of 39
UNCLASSIFIED USDA Foreign Agricultural Service
the Ministry of Public Education for 600.000 children attending public schools. The 2006 budget for this program totalled $20 million and contributed with approximately $0.23 to prepare a meal for each student every school day. The health care segment of the institutional market is made up of 35 hospitals, both private and public, and about 128 public health clinics. This segment has more than 6.000 beds and services an estimated 500.000 patients each year. The public health sector allocated $10.5 million for food and beverages to buy local products mainly. However, when using imported products for diet or health reasons, buyers in this institutional segment prefer to buy them from local supermarket chains that have high quality European and American products at competitive prices. As a pilot project, the public health sector is buying pre-cut fruits and vegetables for one hospital in an effort to reduce personnel costs and residual waste, and improve the safety of these products. Depending on the results of this project, the use of pre-cut fruits and vegetables could be authorized for the rest of the public hospitals. This could become an opportunity for U.S. exporters of frozen vegetables that are price competitive. Private hospitals are treating foreign patients and Costa Rican patients of upper income levels. In particular, the largest private hospitals are receiving increasing amounts of foreign patients that come to Costa Rica seeking plastic surgery, or other kinds of surgery, at a lower cost than in their countries of origin. These hospitals purchase food products of high quality and are therefore willing to buy imported food and beverages, including egg substitutes, fresh or processed cheese, pastries and low calorie snacks, drinks, and desserts. In particular, hospitals are interested in buying imported foods that will provide a balanced and healthy diet for its patients. Although the market for lite products is still relatively small in this segment, private hospitals are expected to increase the demand for natural, low calorie and low carbohydrate products in the near future.
A total of 14.000 people, including guards and administrative personnel of the justice sector are fed daily in each of the 23 jails of the country. The budget for this program amounts to $2.1 million. The limited budget allows for buying local staples, vegetables and local meat. Cereals and fresh fruits are also bought for juvenile jails and elder prisoners. In 2006, the public security system had a police force of 9.795 individuals. The Ministry of Public Security allocated a budget of $2.1 million for food and beverages for this group, which financed the preparation of at least one meal to each individual. Because the daily budget is approximately $0.60 per person, the menu for this sector consists mainly of grains and local fresh vegetables. The National Institute for Electricity (ICE), the second largest company in Costa Rica, has 3.000 employees developing eight infrastructure projects nationwide. The budget for food and beverages for this group is approximately $3.2 million. Costa Rica also has 28 national parks and 42 public and private museums. National parks with restaurants or cafeterias offer basic menus using a limited variety of grains, vegetables, pasta and local meats. Only 15% of the museums have restaurants or cafeterias with typical food menus and snacks. However, national parks and museums have the potential to become significant clients of imported food products since foreign tourist are frequent visitors of these places. In 2005, 57% of foreign tourists visited national parks and 17% visited museums.
I.4. Advantages and Challenges of U.S. Food and Beverages

GAIN Report - CS6015 Page 8 of 39
UNCLASSIFIED USDA Foreign Agricultural Service
The expansion of tourism and the increase in household incomes create a larger demand for imported food and beverage products, including those of U.S. origin. U.S. food and beverage exports may also benefit from the following advantages: • Hotel and restaurant chefs, especially those that have worked in other countries at
premium hotels and restaurants, are familiarized with the quality of major U.S. brands. This gives U.S. food and beverage exporters the opportunities to introduce new products into Costa Rica since chefs of the HRI sector perceive U.S. products favorably.
• The main customers of middle to high-end hotels are U.S. tourists who expect the quality and taste of U.S. products. This creates a good opportunity to sell U.S. products to hotels and restaurants that service these customers.
• Fast food and fast service restaurants in the local market are growing, especially in those areas most visited by tourism. Most of those franchises have to comply with the quality standards set by U.S. headquarters. In many cases, this means importing ingredients from the U.S.
• Food service importers view U.S. exporters as reliable counterparts: U.S. exporters normally meet delivery dates, comply with volumes negotiated, follow-up on shipments and arrival of goods, and provide the documentation necessary to comply with Costa Rica’s import regulations. Consequently, food service importers prefer buying products from the U.S., when all other factors are equal.
• Food service importers acknowledge that U.S. exporters offer a wide variety of good quality products. With the wide range of products and prices it is highly probable that Costa Rican importers can identify a food or beverage of U.S. origin that can be quality and price competitive in this market.
• Consolidation of small orders is more readily available in the U.S. than in competing export countries such as Chile or European countries. Consolidation is an important factor because a number of food and beverage products are still imported in relatively small amounts and need to be consolidated.
• The proximity to the U.S. as compared to competitors such as Chile, Canada and Europe result in shorter periods of time in transporting products from the U.S. (one week vs. three to four weeks from other exporting countries). Furthermore, there are more ocean carriers from the U.S. than from other countries. These carriers sometimes charge lower prices since some containers come back empty.
• Ratification of CAFTA-DR would promote bilateral trade by making U.S. products more accessible to this market.
The challenges that U.S. food and beverage exports may face are the following: • According to industry sources, prices of some U.S. products are relatively high. This
condition limits the purchase of food and beverages of US origin since the majority of HRI customers are price sensitive.
• High tariffs applied to some imported food products such as french fries and cheese constrains the demand for these products.
• Lower duties enjoyed by the main competitors that already have FTAs with Costa Rica may convince food service importer to buy from these countries. If CAFTA-DR is not ratified, U.S. will continue to be at a disadvantage against these competitors.
• The local industry also manufactures a wide range of products for the HRI sector at lower prices than U.S. brands, which also reduces the demand for U.S. products.
• Customs procedures, sanitary requirements and product registration process are still slow, non-transparent and complex and U.S. exporters may spend considerable time fulfilling these regulatory requirements.
• Inspection and certification requirements for U.S. meat processing plants still limit the number of plants that can export meat products.

GAIN Report - CS6015 Page 9 of 39
UNCLASSIFIED USDA Foreign Agricultural Service
• New products or less familiar brands require a stronger marketing effort since they would not be recognized by importers, distributors and HRI customers.
• Registration costs may act as a barrier for entering this market. Direct registration costs amount to $100 but may total up to $200 when other indirect costs are added. Because costs add up rapidly when importing several products, food service importers will only test new import products that they strongly expect will be successfully introduced in the HRI sector.
• U.S. internal transportation costs are high and may constrain the competitiveness of U.S. food exports, including those for the HRI sector.
II. Market Access
II.1. Distribution Channels for the HRI Food Service Sector Most food products from the U.S. are exported by the manufacturer or broker to an importer/distributor or wholesaler in Costa Rica. It is very common for the importer to act as distributor. Costa Rican importers will normally ask for the consolidation of export shipments because of the small size of the market. A few companies account for most distribution to hotels and restaurants in the different tourist areas and to restaurant and franchises in the Central Valley. All import U.S. products. The largest importers/distributors own warehousing infrastructure and specialized transportation systems, making food products available to this sector practically throughout the entire country. Smaller importers/distributors tend to focus on importing well-known brands or specialize in supplying specific customers. Hotels and restaurants focusing on the middle to lower segments of the market may also buy from wholesalers or supermarkets. Wholesalers also have significant warehousing capacity and supply a large variety of products to this sector. Supermarket chains import quality products at competitive prices and have stores in the Central Valley and in the main tourist destinations. The majority of the supermarket chains import through U.S. brokers. It is important to note that high-end hotels and restaurants are the main clients of imported food products. In general terms, these buyers tend to value the quality of the product and the service provided by the importer/distributor more than the price of the imported product. This segment expects orders to be fully delivered on-time and in good conditions, especially in locations outside the Central Valley where food service suppliers will not visit clients on a daily basis. Once they select the importer/distributors, they will tend to buy most of the products that these suppliers carry. Therefore, it is important for the U.S. exporters to choose importers/distributors that best meet these requirements since they are better positioned to sell the products they distribute.
II.2. Tariff and Import Regulations Costa Rica is a fairly open economy, where foreigners can conduct business in most areas. Costa Rica is a member of the World Trade Organization (WTO) and generally adheres to its international trade commitments, including the use of science-based sanitary and phytosanitary measures. Costa Rica has followed a foreign trade policy geared at establishing free trade agreements with key partners, including the United States. Costa Rica has in effect several agreements with other food exporting countries, such as, Chile, Canada, Mexico and other Central American countries. This creates strong competition for the United States as these countries

GAIN Report - CS6015 Page 10 of 39
UNCLASSIFIED USDA Foreign Agricultural Service
now enjoy lower duties (in many cases zero duties) for products that compete directly with U.S. products. Zoo-sanitary restrictions affect imports of beef and poultry and may affect other sensitive food products such as dairy products. For instance, Costa Rica still requires individual inspection of meat export plants. This situation has been addressed by the U.S. government under CAFTA-DR and has resulted in Costa Rica agreeing to approve meat imports from USDA-certified export plants once the Agreement is in effect.
II.2.1. Tariffs
Costa Rica applies relatively low tariff rates on food imports, considering that most of imported food products pay a 15% import duty. Sensitive products, such as frozen french fries and cheese are exceptions with import tariff rates ranging from 41% to 66%. The high tariffs applied to these products present a limitation for exporting these products to Costa Rica. Under CAFTA-DR, U.S. food and beverage products such as french fries, cheese, canned fruits and wines would benefit from tariff rate quotas or will undergo gradual tariff elimination during a period of up to 15 years. Tariff elimination will allow U.S. food exporters to better compete with products from countries enjoying lower import tariffs under FTAs with Costa Rica. A description of import tariffs, tariff-rate quotas and tariff phase-out schedules negotiated under CAFTA-DR for U.S. food products most demanded by the Costa Rican HRI sector follows: 1. Frozen High Quality Beef Cuts HS code: 02023000 Base import tariff rate: 15%
Tariff phase-out: immediate for prime and choice meat; 15 years for others, with tariff remaining at base rate during first four years from the date the Agreement enters into force.
Tariff-rate quota: none 2. Frozen French Fries
HS code: 20041000 Base import tariff rate: 41% Tariff phase-out: 5 years Tariff-rate quota: from 2,631 metric tons in Year 1 to 3,046 in Year 4. In-quota tariff rate: 0% 3. Frozen Seafood
HS code: fish fillets: 030420; crustaceans: 0306; mollusks: 0307 Base import tariff rate: 15% for fish fillets; 10% for crustaceans and mollusks
Tariff phase-out: immediate for fish fillets and crustaceans; immediate for calamari, 5 years for octopus
Tariff-rate quota: none 4. Canned Fruits
HS code: 2008 Base import tariff rate: 15%
Tariff phase-out: immediate for pears, peaches and fruit mixes; 5 to 15 years for others Tariff-rate quota: none 5. Canned Vegetables

GAIN Report - CS6015 Page 11 of 39
UNCLASSIFIED USDA Foreign Agricultural Service
HS code: 2005 Base import tariff rate: 15%
Tariff phase-out: immediate for corn; asparagus and vegetable mixes 5 years; 10 to 15 years for others
Tariff-rate quota: none 6. Pastas
HS code: 2005 Base import tariff rate: 15%
Tariff phase-out: 10 to 12 years Tariff-rate quota: none 7. Sauces
HS code: 2103 Base import tariff rate: 15%
Tariff phase-out: 10 to 15 years Tariff-rate quota: none 8. Canned Mushrooms
HS code: 2003 Base import tariff rate: 10% to 15%
Tariff phase-out: 10 to 15 years Tariff-rate quota: none 9. Spices
HS code: 0904, 0910 Base import tariff rate: 6% to 10%
Tariff phase-out: 10 years Tariff-rate quota: none 10. Olive Oil
HS code: 1509 Base import tariff rate: 10%
Tariff phase-out: immediate for virgin olive oil, 15 years for others Tariff-rate quota: none 11. Cheese
HS code: 0406 Base import tariff rate: 15% to 66% Tariff phase-out: immediate for melted or powdered dehydrated cheddar-type cheese; 5 years for blue cheese; 20 years for all other cheeses Tariff-rate quota: from 410 metric tons in Year 1 to 987 metric tons in Year 19 for all cheeses except blue cheese and melted or powdered dehydrated cheddar-type cheese
In-quota tariff rate: 0% 12. Breakfast Cereals
HS code: 19041090 Base import tariff rate: 15%
Tariff phase-out: 12 years Tariff-rate quota: none 13. Alcoholic Beverages
HS code: beer: 2203; wine: 2204, 2205, 2206; whiskey: 220830; rum: 220840; gin: 220850; vodka: 220860; liquors: 220870

GAIN Report - CS6015 Page 12 of 39
UNCLASSIFIED USDA Foreign Agricultural Service
Base import tariff rate: whiskey and vodka: 10% to 15%; all others: 15% Tariff phase-out: immediate for wine with alcohol content of up to 15% and bottled in containers of up to two liters; immediate for gin and whiskey; 5 years for sparkling wine and liquors; 5 to 10 years for vodka; 12 years for rum; 15 years for beer and other wines
Tariff-rate quota: none
II.2.2. Import Regulations
Costa Rica’s customs procedures are complex and bureaucratic, but have improved somewhat since the passage of the 1995 General Customs Law and with the approval of a new electronic customs system known as TICA (Information Technology for the Customs System). Much of the necessary processing is now accomplished electronically, and "one stop" import and export windows have significantly reduced the time required for customs processing. Imported food products must be registered prior to importation at the Ministry of Health’s Registration and Control Department (Ministerio de Salud, Dirección de Registros y Controles.) Registration is valid for five years and products are usually registered by importers. However, once a product is registered it may be imported by a company other than the one that originally registered it. For this reason, importers sometimes ask suppliers to share in the costs for the registration process. If a company wants to import a product that has already been registered, the company must still pay the full registration fee, which is currently set at $100 per product. The Ministry of Health has five working days after all the required documentation is submitted to process the registration request. To register a product, the following documents must be submitted:
- Registration request form signed by the legal representative of the company. - Free sale certificate issued by the health or other appropriate authority of the country
of origin, indicating that the products being exported to Costa Rica are allowed for free sale and consumption in the country of origin. This document must be authenticated by the Costa Rican consul and countersigned by the Costa Rican Ministry of Foreign Relations. The document may include one or several products and must be less than two years old. If the document is written in a language other than Spanish, it must be accompanied by an official translation.
- Original label of the product. If the label is in a language other than Spanish, an official translation of the label must also be attached. If the label is printed directly on the container, an original container and a copy of the label must be submitted.
- Paid receipt of the registration fee, which according to current regulations is $100 per product.
The certificates must be submitted in Spanish; in case they are submitted in another language, an official translation from the Ministry of Foreign Relations must accompany the certificate. Violations of documentation laws lead to heavy fines. Consequently, great care must be taken to avoid errors and violations. According to the General Health Law, if a product claims to have health related benefits, the product will be classified as a medicine or drug and the registration process may be different from that described above.
II.2.3. Labeling Requirements

GAIN Report - CS6015 Page 13 of 39
UNCLASSIFIED USDA Foreign Agricultural Service
All imported products must meet the food labeling law, which requires labels in Spanish showing the following information:
-Product name. -Net content and drained weight in international system units. -Artificial colors and flavors (if any). -Ingredients listed in decreasing order, by weight. -Importer’s name and address. -Lot number and expiration date. -Country of origin. -Preservation and use instructions.
Despite the language requirement, other languages may be used as well, as long as the required information is included in Spanish. Stick-on labels are allowed. Labeling requirements are enforced by the Costa Rican Ministry of Economy’s Labeling Department. The Ministry of Economy is no longer approving or disapproving labels. Instead, producers and importers must comply with current labeling regulations. Significant fines await those whose products are found in the marketplace without a label that complies with the current legislation. Costa Rica generally requires only invoices, bills of lading and airway bills to import goods. Imports of bulk agricultural and horticultural products require plant health certificates. Most processed food products (canned, boxed, and pre-cooked goods) do not require plant health or animal health certificates, but exporters should check with their importers, who are ultimately responsible for knowing local regulations. Food Safety and Inspection Service (USDA/FSIS) certificates are required to import fresh and frozen meats.
II.2.4. Approval of Beef and Poultry Plants
Foreign beef and poultry plants must be approved by the Costa Rican Ministry of Agriculture before exporting to Costa Rica. The procedure for getting a plant inspected is lengthy. The first step in this process is to make a formal request for inspection to the Director of Animal Health of the Ministry of Agriculture, indicating the plant(s) to be inspected and the location. Requests for plant inspections by MAG should be addressed to the following e-mail address: asandi@ protecnet.go.cr. Either the importer or the exporter must bear the cost of the inspection visit. Under CAFTA-DR, Costa Rica agreed to apply the science-based disciplines of the WTO agreement on Sanitary and Phystosanitary Measures. Costa Rica also agreed specifically to undertake an equivalency determination for all establishments inspected by USDA’s Food Safety Inspection Service, but has not yet made significant progress toward this objective. U.S. plants approved by MAG are listed in the following website: www.protecnet.go.cr/salud/websaludanimal/zoointernacional.htm. The Foreign Agricultural Service, Food and Agricultural Import Regulations and Standards (FAIRS) Annual Report includes information on Costa Rican laws, regulations, requirements, and other specific standards. The report also includes import procedures and the major regulatory agencies involved in exporting products to Costa Rica Interested parties are recommended to review the Costa Rica GAIN report CS 5015 online at http://www.fas.usda.gov/GainFiles/200510/146131202.pdf.

GAIN Report - CS6015 Page 14 of 39
UNCLASSIFIED USDA Foreign Agricultural Service
III. Competition According to industry sources, food service importers distribute more than 2,000 products to the HRI sector. A competitive analysis was undertaken for the products or product categories most requested by HRI companies, according to information collected from interviews and trade statistics. Thirteen product categories were the most frequently mentioned during these interviews. The following is a summary of the competitive analysis for these categories. The United States is a major exporter of canned vegetables, canned fruits, spices, frozen seafood, sauces and high quality beef cuts. U.S. exporters have been minor suppliers of pastas, olive oil, canned mushrooms, frozen french fries and cereals. Local products as well as products imported from the European Union, Chile, Canada, Mexico and other Central American countries compete with the U.S. food products reviewed.
• Chile competes with the U.S. in the following products: wine, canned fruits, frozen seafood and frozen beef.
• Guatemala competes for pastas, sauces, canned vegetables and breakfast cereals. • The European Union is a strong competitor for pastas, olive oil, and wines. • Nicaragua and Mexico are among the main exporters of beef. • Canada is the main exporter of frozen french fries to Costa Rica.
The food sector industry in Costa Rica is competitive and a major supplier of food and beverages for the HRI sector. However, the high-end segment of the food service sector views local products as being of lesser quality and have a preference for known foreign brands. Several local industries are ISO 9001 certified. Some food processing companies are subsidiaries of international firms and supply the local as well as the export market. The main products manufactured by the local industry are meat (including beef and poultry), dairy products, tobacco and drinks, milled products, coffee preparations, processed fruits and vegetables, seafood preparations, sugar, chocolates and candies. U.S. food exports are on average more expensive than local products or from other origins, especially from countries that already have a FTA with Costa Rica. However, CAFTA-DR, when ratified, will provide a good opportunity to improve the competitiveness of U.S. food exports. Frozen Beef: Beef is one of the most imported products into this market. The driver for growth is primarily the expansion of the tourism sector and to a lesser extent, higher income households. Out of total beef imports, high quality beef cuts are the products with the highest growth. However, it is not possible to completely separate these individual cuts from the available trade data. Frozen beef imports identifiable as product for final consumption was used to measure the potential market size for this category. Frozen beef is being distributed to hotels and restaurants in increasing amounts. This market segment is relatively big and showing strong growth. Hotels and restaurants servicing foreign tourists and high-income groups familiarized with premium and choice meats are increasing the purchase of this product. High quality beef cuts are being requested by high-end hotels and restaurants located near residential areas of high-income families and in or near tourist resorts. The quality of U.S. beef is well known by this market segment and consumers are willing to pay a higher price for cuts imported from the U.S. Local beef products are also available but the best cuts are exported. Furthermore, some cuts are scarce or of lesser quality. Beef is also purchased from Chile and Nicaragua, but not all cuts

GAIN Report - CS6015 Page 15 of 39
UNCLASSIFIED USDA Foreign Agricultural Service
from these countries are as quality competitive as those from the U.S. Most Chilean and Nicaraguan beef prices are similar to those of local origin.
Graph 2Market Share for Frozen Beef
2005
48%
26%
17%
9% 0%0%
Mexico Chile Nicaragua United States Guatemala Panama
Source: Prepared from Import Tables of the National Institute for Statistics and Census (INEC) The country imported 1,138 metric tons of frozen beef in 2001 and 1,225 tons in 2005. Graphs 1 and 2 present the market share for this product in 2001 and 2005, respectively. Mexico, Chile, Nicaragua and the United States are the main exporters of beef to Costa Rica. Mexico exports un-seasoned beef patties to one of the largest fast-food chains in this country. The participation of U.S. frozen beef grew in this market until 2004 when Costa Rica temporarily prohibited the consumption of U.S. beef as a result of a case of BSE. At present, imported beef products have a 15% import tariff. Nevertheless, Mexican, Central American and Chilean products enjoy a duty advantage against the U.S. product. Starting in 2005, Mexican beef enters this market duty free as agreed in the FTA between the two countries. Frozen beef from Central America is also duty free. In the FTA signed with Costa Rica, Chile was granted a tariff-rate quota for frozen beef exports to this country totaling 2,500 metric tons in 2006. The in-quota tariff rate is 3.0%. The out-of-quota tariff rate decreases from 4.9% in 2006 to 3.0% in 2008 and will reach zero by the year 2011. Lower
Graph 1 Market Share for Frozen
Beef 2001 0% 6%
12%
16%
62%
4%
Mexico
Chile
Nicaragu United States
Guatemala
Panama

GAIN Report - CS6015 Page 16 of 39
UNCLASSIFIED USDA Foreign Agricultural Service
duties for imported beef from these countries explain in part the larger market share they have. The CAFTA-DR is expected to take this advantage away. Frozen French Fries: Demand for pre-cut french fries is also increasing in the hotel and restaurant sector. Industry sources forecast that demand for this product will grow by 20% in 2006. This sector is the biggest buyer of frozen french fries, representing approximately 75% of total sales. Retailers, especially supermarkets chains, sell the remaining 25%. Demand for this product, as with most products in the food service sector, is related to the growth of tourism. U.S. frozen french fries are price and quality competitive, according to industry sources and U.S. exports to this country should increase once CAFTA-DR is ratified by Costa Rica.
Source: Prepared from Import Tables of the National Institute for St atistics and Census (INEC) Costa Rican producers do not grow the specific type of variety required by this industry. Therefore, the product is mostly imported. The volume of frozen french fries exported to this market increased from 6,470 metric tons in 2001 to 7,833 metric tons in 2005. Graphs 3 and
Graph 3 Market Share for Frozen
French Fries 20
28%
34%7%
31%
0%
Canada
United States
Belgium
Netherlands
Others Graph
4 Market Share for Frozen French Fries 20
87%
11%2%
0%0%
Canada
United States
Belgium
Netherlands
Other

GAIN Report - CS6015 Page 17 of 39
UNCLASSIFIED USDA Foreign Agricultural Service
4 show the market share of the main exporting countries of this product in 2001 and 2005, respectively. Canada is the largest exporter frozen french fries followed by the U.S. and the Netherlands. Canadian brands are well established in Costa Rica and appeal to all segments of the market with a variety of product presentations and prices. Furthermore, the main Canadian brand has a strong presence in Central America with an active regional marketing office located in Costa Rica. Canada negotiated a duty free tariff-rate-quota (TRQ) for this product as part of the FTA with Costa Rica. The TRQ became in effect in 2003. The out-of-quota tariff rate is 15% as of 2006. The base tariff rate for frozen french fries is 41%, which substantially increases the local price of this product when imported from the U.S. or other countries that do not have a FTA in effect with Costa Rica. Consequently, imports from the U.S. and the Netherlands fell sharply after the FTA with Canada was approved. In 2005, U.S. exports of this product to Costa Rica reached 866 metric tons, more than double the amount sold in 2004, but significantly less than the pre-2003 levels. Frozen Seafood: Frozen seafood is also a category that is being increasingly demanded by hotels and restaurants. During 2004 and 2005, sales to this sector have grown by approximately 25% each year, according to industry sources. Tourism is again the main driver of this category. Hotels and restaurants are becoming increasingly aware of the advantages of buying frozen seafood such as the availability of the product throughout the year, the quality, and the relatively stable prices. High-end hotels and restaurants buy imported frozen seafood that is not available locally, such as mussels, salmon and scallops. U.S. products compete with Chilean and some local products. U.S. frozen seafood is well positioned in this market and is acknowledged for its quality. Nevertheless, prices of U.S. products are higher than local equivalents or those from Chile. Imports from Chile are quality competitive. Although the local industry has lower prices, it uses less attractive packaging.

GAIN Report - CS6015 Page 18 of 39
UNCLASSIFIED USDA Foreign Agricultural Service
Source: Prepared from Import Tables of the National Institute for Statistics and Census (INEC) Graphs 5 and 6 compare the amount of U.S. exports of frozen seafood to Costa Rica with the amount exported by its main competitors in 2001 and 2005, respectively. The total amount of frozen seafood imported by this market increased from 234 metric tons to 320 metric tons during the five-year period. Chile and the U.S. are the largest exporters of frozen seafood to Costa Rica, both with an equal market share in 2005. Chilean exports have been increasing each year. In 2005, Ecuador and Nicaragua followed in a distant third and fourth place, respectively after a strong decline in Peru’s exports to this market. Salmon and tilapia fillets, octopus, calamari, shrimp, seafood mix, and to a lesser extent, crabmeat are the most imported frozen seafood products. Chile is the main exporter of salmon fillets while Ecuador is the largest exporter of tilapia fillets to this market. Chilean salmon is price competitive and has a lower price when compared to products of similar quality from other export countries. The U.S. and Chile are the main suppliers of crabmeat
Graph 5
Market Share for Frozen Seafood 20
12%
30%
0%
55%
0%2%1%
Chile
United States
Ecuado
Nicaragu Peru
Panam
Other
Graph 6 Market Share for Frozen
Seafood 2005
31%
31%
9%
7%7%
10% 5%
Chile
United States
Ecuado
Nicaragu Peru
Panam
Other

GAIN Report - CS6015 Page 19 of 39
UNCLASSIFIED USDA Foreign Agricultural Service
while Nicaragua is the leading exporter of shrimp. The U.S. and New Zealand are the main providers of calamari and the U.S. the largest exporter of octopus, followed by Panama in a distant second place. New Zealand products are competitive in price and quality. Frozen fish fillets have an import tariff rate of 15%, but enter duty free if purchased from Central American countries. Salmon fillets from Chile also enter the Costa Rican market free of duty. Shrimp and crabmeat have an import tariff rate of 10%, but if bought from Central America and Chile do not pay import tariffs. The import tariff rate for calamari is 1% and for octopus 10%. The main competitors of the U.S. in these categories (calamari and octopus) have to pay the same duties as the U.S. In the case of calamari, New Zealand does not have a FTA with Costa Rica. Panama, the second exporter of octopus to this market is not exempted from the payment of import tariffs. Canned Fruits: Costa Rica is an export market for canned fruits, both tropical and other fruits, especially those not locally grown or manufactured on a commercial scale, such as peaches, apricot and pears. Hotels and restaurants purchase these products for preparing cocktails and desserts, among other uses, while fresh fruits are demanded by this sector mainly for breakfast menus. Many brands compete in this market at similar price levels.

GAIN Report - CS6015 Page 20 of 39
UNCLASSIFIED USDA Foreign Agricultural Service
Graph 7Market Share for Canned Fruits
2001
54%
9%6%
31%
0%
United States Chile Mexico
Greece Others
Graph 8Market Share for Canned Fruits
2005
53%27%
4%
12%4%
United States Chile Mexico
Greece Others
Source: Prepared from Import Tables of the National Institute for Statistics and Census (INEC) Graphs 7 and 8 show the market share of the main exporting countries of canned fruits to Costa Rica in 2001 and 2005, respectively. A total of 3,420 metric tons of canned fruit was exported to this country in 2001, both for the retail and the HRI sector. The export volume to this market increased to 3,881 metric tons by the year 2005. In 2005, the United States was the main exporter of canned fruits to Costa Rica with a 53% share of this market followed by Chile with a 27% market share. Mexico and Greece were positioned in a distant third and fourth place. Chilean products are price competitive and are gaining participation in this market after tariffs were reduced or eliminated in the FTA with Costa Rica. As a result, Chilean products have tripled their market share since the year 2001. U.S. products are quality competitive but are sold at higher prices. Imported canned fruits pay a 15% import tariff, but enter free of duties if exported by other Central American countries. Mexican and Chilean products also enter duty free (except for Chilean tropical fruits that are levied a 6.3% import duty in 2006 as part of a tariff phase-out schedule that will be completed by the year 2011). Canned Vegetables:

GAIN Report - CS6015 Page 21 of 39
UNCLASSIFIED USDA Foreign Agricultural Service
Canned vegetables are purchased by hotels and restaurants especially when hosting large events. Yellow corn, green peas, asparagus and vegetable mixes are among the most requested products by this sector. Demand for this product category is relatively low in high-end hotels and restaurants because their customers prefer fresh products. U.S. products compete with other exporting countries and with international brands manufactured locally. Products manufactured in Costa Rica are sold at lower prices. U.S. products are quality competitive but more expensive and therefore purchased mainly by high-end hotels and restaurants. Graphs 9 and 10 compare the amount of U.S. exports of canned vegetables to this market with the amount exported by its main competitors. Total exports of this product category increased from 6,279 metric tons to 6,514 metric tons during the period 2001-2005. United States is the largest exporter of canned vegetables to this market, followed by Guatemala and Thailand. The U.S. market share decreased from 49% to 41% during this period while Thailand exports increased significantly. Canned vegetables from Thailand are very price competitive, especially in yellow corn, its main export product to this market.
Source: Prepared from Import Tables of the National Institute for Statistics and Census (INEC)
Graph 9 Market Share for Canned Vegetables 20
49%
35%
0%1% 11%4%
United States
Guatema
Thailan
Spai Peru
Other
Graph 10 Market Share for Canned
Vegetables 20
41%
34%
15%
4%2% 4%
United States
Guatemala
Thailand
Spain
Peru
Others

GAIN Report - CS6015 Page 22 of 39
UNCLASSIFIED USDA Foreign Agricultural Service
The United States is the main exporter of canned potatoes, green peas, asparagus (followed by Peru) and of vegetable mixes (followed by Spain in a distant second place). Guatemala is the largest exporter of canned beans. The import tariff rate for canned vegetables is 15%, except for canned potatoes that pay a 41% import duty. Products exported by Guatemala enter duty free, and therefore, enjoy a duty advantage over the U.S. in this category. However, Guatemala mostly exports canned beans. Thailand, the main U.S. competitor for exports of canned yellow corn, does not have a FTA with Costa Rica and therefore pays the same import duties applied to the U.S. product. Pastas: Pastas are purchased by HRI customers because pasta-based plates are included in the majority of local and international food menus. High-end participants in this sector favor Italian pastas because of the quality ingredients used in Italy. Pastas from other nations, including the U.S., are not perceived as quality competitive and therefore demand from such export countries is much lower in this segment. Hotels and restaurants in lower segments normally buy local pastas, which are less expensive than the imported product. However, the ingredients used by local manufacturers are less quality competitive, according to industry sources.
Source: Prepared from Import Tables of the National Institute for Statistics and Census (INEC)
Graph 11 Market Share for
Pastas 2001
58%
9%
9%
8% 7%
9%
Italy
Guatema
United States
Chile Mexico
Other
Graph 12 Market Share for
Pastas 2005
31%
41%
5%
5%4%
14%
Italy
Guatema
United States
Chile Mexico
Other

GAIN Report - CS6015 Page 23 of 39
UNCLASSIFIED USDA Foreign Agricultural Service
Graphs 11 and 12 show the market share of the main exporting countries of pasta to Costa Rica in 2001 and 2005, respectively. The total amount of pasta imported increased from 1,359 metric tons in 2001 to 2,678 metric tons in 2005. Guatemala and Italy are the largest exporters of this product category. The U.S. is a minor player in this market with 5% of total exports in 2001, almost half the participation reached in 2001. Pastas have an import tariff rate of 15%, but enter duty free if purchased from Guatemala or other Central American countries. The duty advantage enjoyed by Guatemala has contributed to increase Guatemala’s market share from 9% in 2001 to 41% in 2005. Italy, the second largest exporter of pasta to this market does not have a FTA with Costa Rica and consequently pays the 15% import duty. Chilean pastas pay a 6.3% import duty in 2006 as part of a tariff phase-out schedule that will be completed by the year 2011, as specified in the FTA with Costa Rica. Sauces: The Costa Rican market for sauces is highly competitive with an ample stock of local and foreign brands, most of them well positioned in this market. U.S. sauces are quality competitive but more expensive than the competition. Many local brands are available but of lesser quality and with higher sugar content, according to industry sources. Tomato-based sauces, mayonnaise, steak sauces and mustard, are among the most frequently used sauces by the food service sector.

GAIN Report - CS6015 Page 24 of 39
UNCLASSIFIED USDA Foreign Agricultural Service
Source: Prepared from Import Tables of the National Institute for Statistics and Census (INEC) Graphs 13 and 14 compare the amount of U.S. exports of sauces to Costa Rica with the amount exported by its main competitors in 2001 and 2005, respectively. Imports by this market decreased from 7,668 metric tons in 2001 to 7,141 metric tons in 2005. This contraction in volume is explained by a significant drop in exports from Panama and from countries included in the “others” category. However, the export value of this product category increased during the period 2001-2005, suggesting that the market is purchasing more expensive and higher quality sauces. Guatema la, the U.S. and Panama are the main exporters of sauce products to Costa Rica. U.S. exports to this market have increased modestly during the period. In contrast, Guatemalan exports have quadrupled its market share in 2005. Because U.S. sauces are quality competitive but more expensive, they are mainly purchased by high-end hotels and restaurants. Sauces exported by Central American countries, Panama and Mexico enter duty free to the Costa Rican market. Most products from other origins, including the U.S. are applied a 15% import tariff. Canned Mushrooms: Most of the mushrooms bought by the Costa Rican food service have to be imported since the country is not a large scale grower or processor of this product. China is the main exporter of canned mushroom to this market, supplying 66% of total imports in 2001 and
Graph 13 Market Share for
Sauces 2001 8%
25%
36%
0%
28%
2%
1%
Guatema
United States
Panam
Venezuel El Salvador
Mexico
Other
Graph 14 Market Share for
Sauces 2005
35%
29%
16%
9%
7%
2%2%
Guatema
United States
Panam
Venezuel El Salvador
Mexico
Other

GAIN Report - CS6015 Page 25 of 39
UNCLASSIFIED USDA Foreign Agricultural Service
92% in 2005, as shown in Graphs 15 and 16. The U.S. is a minor second player and loosing ground in this market with a 5% participation in 2005, a substantial fall from the 26% participation reached in 2001. According to industry sources, canned mushrooms from China are preferred because they are quality competitive and can be purchased at low prices. The country imported 1,587 metric tons of canned mushrooms in 2001 and 1,852 metric tons in 2005. Canned mushrooms pay import duties of 10% to 15%.
Source: Prepared from Import Tables of the National Institute for Statistics and Census (INEC) Spices: The food service sector is price sensitive in regards to spices and buys mostly local products. Imported spices are mainly requested by high-end hotels and restaurants seeking the higher quality and longer shelf life of these products. U.S. spices in particular, are preferred by this segment because the packing technology used better protects the product against humidity, an important factor in a tropical climate. Pepper, ginger, laurel leaf, curry cardamom, thyme and spice mixes are among the most imported products. The amount of imported spices by Costa Rica increased from 470 metric tons in 2001 to 767 metric tons in 2005.
Graph 15 Market Share for
Canned Mushrooms 20
66% 8%
26%
China
United States
Others
Graph 16 Market Share for
Canned Mushrooms 20
92%
5% 3%
China
United States
Others

GAIN Report - CS6015 Page 26 of 39
UNCLASSIFIED USDA Foreign Agricultural Service
Source: Prepared from Import Tables of the National Institute for Statistics and Census (INEC) Graphs 17 and 18 show the market share of the main exporting countries of pasta to Costa Rica in 2001 and 2005, respectively. The U.S. is the largest exporter of spices to this country, followed by Honduras, the Netherlands and Spain in descending order. Spices have an import tariff rate that varies from 6% to 10%. These tariff rates apply to the U.S. and its main competitors in this market, except for Honduras and other Central American countries, whose products are imported duty free. Olive Oil: Costa Rica is not a producer of olive oil and consumption of this product is met mainly by importing from Italy and Spain. High-end hotels and restaurants are the main buyers of this product in the HRI sector. Other HRI customers prefer soybean oil and palm oil, produced by local monopolies that control the market. The total amount of olive oil imported by Costa Rica increased from 614 metric tons in 2001 to 1,075 metric tons in 2005. Graphs 19 and 20 show the market share of the main countries exporting olive oil to Costa Rica in 2001 and 2005, respectively.
Graph 17 Market Share for
Spices 2001
75%
8%
12%0%5%
United States
Spain
Netherlands
Honduras
Other
Graph 18 Market Share for
Spices 200
48%
8% 9%
22%
13%
United States
Spain
Netherlands
Honduras
Other

GAIN Report - CS6015 Page 27 of 39
UNCLASSIFIED USDA Foreign Agricultural Service
Graph 20Market Share for Olive Oil
2005
44%
48%
4% 2% 2%
Spain Italy United States
Greece Others
Source: Prepared from Import Tables of the National Institute for Statistics and Census (INEC) Italy is the largest exporter of olive oil to Costa Rica, followed by Spain. Italy’s participation has increased from 16% in 2001 to 48% in 2005 because its products are more price competitive than those from Spain. The combined market share of the two countries increased form 84% in 2001 to 92% in 2005. The U.S. is located in a distant third place and is a minor player in this market. Olive oil products are applied a 10% import tariff rate. Cheese: The cheese market is controlled by one local cooperative, Dos Pinos. According to industry estimates this cooperative sells about 80% of the total dairy products purchased in Costa Rica. Nevertheless, since the year 2001, export countries are increasing the amounts of cheese sold to this market. In the food service sector, high-end restaurants and hotels are the main buyers of imported cheese. The most demanded product category is processed cheese, since local processed cheeses are of lesser quality and manufactured with a shorter maturation period, according to industry sources. A total of 1,187 metric tons of cheese was exported to Costa Rica in 2001. This amount increased to 1,550 metric tons in 2005.
Graph 19 Market Share for Olive
Oil 2001
68%
16%
14% 2% 0%
Spain
Italy
United States
Greece
Other

GAIN Report - CS6015 Page 28 of 39
UNCLASSIFIED USDA Foreign Agricultural Service
Graph 21Market Share for Cheese
2001
63%18%
13%
2%0%1%3%
Panama United States New Zeland
France Netherlands Denmark
Others
Graph 22Market Share for Cheese
2005
65%14%
8%
5%2%
2%4%
Panama United States New Zeland
France Netherlands Denmark
Others
Source: Prepared from Import Tables of the National Institute for Statistics and Census (INEC) Graphs 21 and 22 compare the amount of U.S. cheese exports to Costa Rica with the amount exported by its main competitors in 2001 and 2005, respectively. Panama is the main exporter of cheese to this market, followed by the United States, New Zealand, France and the Netherlands, in that order. The volume of U.S. cheese exports to Costa Rica increased during the period 2001-2005, but the export value decreased during this period. The main competitors of U.S. cheeses in the high-end segment of the food service sector are France, the Netherlands and Denmark, according to industry representatives. European countries have a reputation for high quality products and high prices. There are few importers/distributors of imported cheese in the market. This limited competition contributes to set prices at higher levels. Consequently, hotels and restaurants would like to see
GAIN Report - CS6015 Page 29 of 39
UNCLASSIFIED USDA Foreign Agricultural Service
additional foreign brands being offered in this market to increase competition and lower prices. Within the WTO, Costa Rica negotiated a tariff-rate-quota of 342 metric tons for imports of fresh and melted cheese. The in-quota-rate tariff for these products is 35%, while the out-of-quota rate tariff is 66%. Imported blue cheeses pay duties of 15%. Mozzarella-type or cheddar-type cheeses and cheeses other than the mentioned above have a tariff rate of 51%. Cheeses from Panama and from other Central American countries are free of import duties. Breakfast Cereals: High-end hotels are the main buyers of breakfast cereals in the food service industry. Although hotels normally use local food ingredients for breakfast, those with a more ample menu may also serve cereals. Local brands are marketed at the retail level only. Therefore, hotels basically buy imported cereals. The total amount of breakfast cereals exported to Costa Rica increased from 1,815 metric tons in 2001 to 1,954 metric tons in 2005. As shown in Graphs 23 and 24, Guatemala is the largest exporter of breakfast cereal to Costa Rica, both for the retail and the food service sector. The cereal exported by Guatemala is a U.S. brand manufactured in this country. Mexico and Argentina follow Guatemala in a distant second and third place. The U.S. market share has been decreasing from 15% in 2001 to 3% in 2005 as the amount of U.S. exports to this market fell from 270 metric tons to 52 metric tons.

GAIN Report - CS6015 Page 30 of 39
UNCLASSIFIED USDA Foreign Agricultural Service
Graph 23Market Share for Breakfast Cereals
2002
65%8%0%
15%
12%
Guatemala Mexico Argentina
United States Others
Graph 24Market Share for Breakfast Cereals
2005
79%
10%7% 3% 1%
Guatemala Mexico Argentina
United States Others
Source: Prepared from Import Tables of the National Institute for Statistics and Census (INEC) The import duty rate for breakfast cereals is 15%. Exports from other Central American countries and Panama enter duty free. Alcoholic beverages: The Costa Rican market for alcoholic beverages is relatively large and highly competitive. Most of the world leading brands in every category (whisky, wine, gin, vodka, rum, beer and others) are already participating in this market. High-end hotels, and to a lesser extent high-end restaurants, have a wide variety of brands from many countries. Lower segment hotels and restaurants are more price-sensitive and will normally purchase brands carrying lower prices. Exports of alcoholic beverages to Costa Rica increased from 14,414 metric tons in 2001 to 16,091 metric tons in 2005. Graphs 25 and 26 show the market share of the largest export countries of alcoholic beverages to this market. Mexico is the largest exporter volume-wise, followed by Chile, the United Kingdom, Mexico, Italy, Panama, Spain and the United States, in descending order. Mexico is the largest exporter of tequila, beer, and of rum and coke. Chile is the main

GAIN Report - CS6015 Page 31 of 39
UNCLASSIFIED USDA Foreign Agricultural Service
exporter of wine and the United Kingdom the largest exporter of whiskey to Costa Rica. The U.S. exports wine, whiskey, liquors, and to a lesser extent, beer and vodka, among other product categories. Wine is the main U.S. export to Costa Rica. Consequently, the main competitors of the U.S. in the alcohol and beverage market are the countries exporting this product, the largest being Chile, Italy, Spain Argentina and France.
Graph 25Market Share for Alcoholic
Beverages2001
11%10%
33%6%6%
4%8%
9%2%1% 10%
United Kingdom Chile
Mexico España
Panama Francia
Italy United States
Nicaragua Argentina
Others
Graph 26Market Share for Alcoholic
Beverages2005
13%
18%
29%5%
6%
6%4%
2%13%
2%
2%
United Kingdom Chile
Mexico España
Panama Francia
Italy United States
Nicaragua Argentina
Others
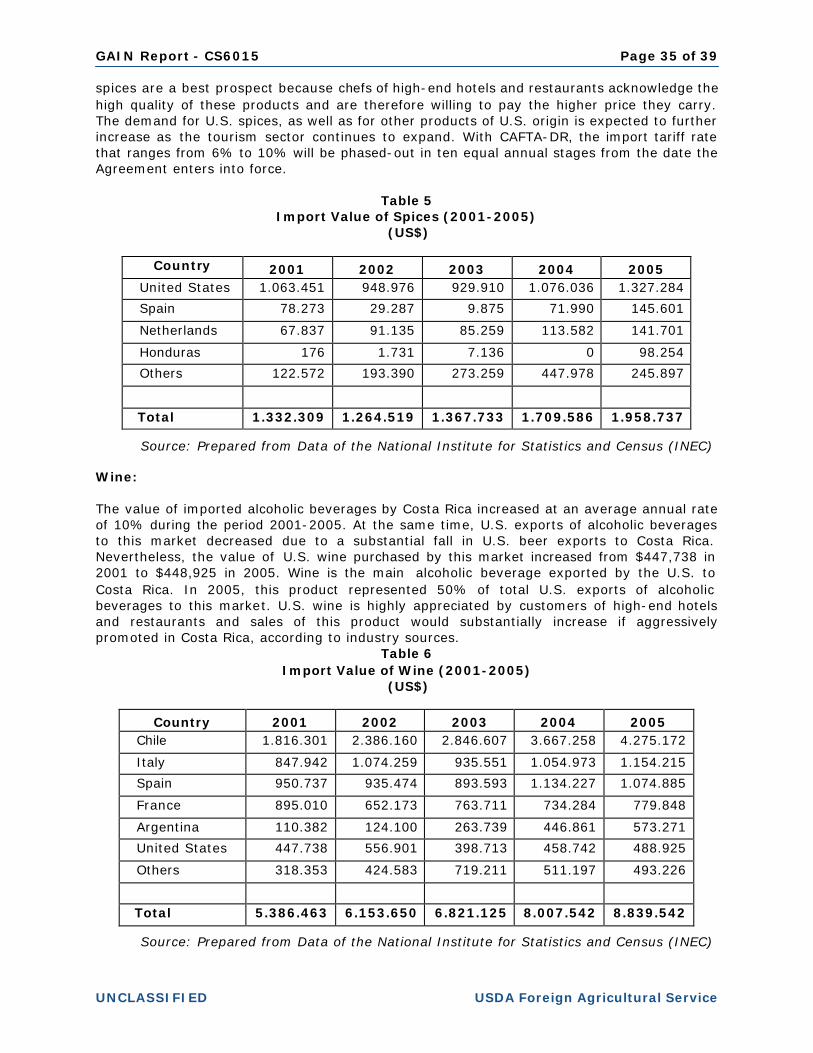
Source: Prepared from Import Tables of the National Institute for Statistics and Census (INEC) Wine consumption has increased in Costa Rica as consumers become more informed and educated about this product. The expansion of the tourism sector has also contributed to the growth of this product category. The wine market is highly competitive, with an estimated 50 importers/distributors selling to retail and HRI clients. Sparkling wines, as well as red and white wines are available in middle to high-end hotels and restaurants, but customers have a preference for red wine. The market is dominated by Chile, which exports an extensive variety of price and quality competitive wines to Costa Rica. There are few brands of Argentinean wines and these are marketed at prices similar to those of Chile. U.S. wines, especially from California, are viewed as high quality products, but expensive and lacking promotion. French, Italian and Spanish wines are quality competitive but also have higher prices than Chilean wines. The import tariff rate for wines is 15%. Chilean wines, according to the FTA signed with Costa Rica, are exempted from this import tariff. Other main competitors of U.S. wines do not have FTAs with Costa Rica and consequently pay the same duties as U.S. products.
IV. Best Prospects Best Prospects are U.S. products that have potential opportunities in the local market. The identification of these products was based on interviews with HRI companies and food service importers, as well as on trade statistics. Best prospects were products that met two or more of the following criteria:

GAIN Report - CS6015 Page 32 of 39
UNCLASSIFIED USDA Foreign Agricultural Service
• The product was one of the most requested items by the HRI companies interviewed or was among the first three main imports of the biggest food service importers interviewed.
• The U.S. product was considered price and/or quality competitive by the HRI sector. • The U.S. was one of the leading export countries in the product category. • During the period analyzed (2001-2005), imports of a best prospect had been
growing and/or U.S. exports of that particular product to this market were growing. • The size of the import market was relatively large (dollar value in excess of five
million dollars). • Import duties for the product were relatively small and/or will be eliminated when
CAFTA-DR is ratified. Products with tariff-rate-quotas or with tariff phase-outs in few years under CAFTA-DR were also evaluated.
Food and beverage products with the highest market potential according to these criteria are the following: frozen french fries, frozen beef, sauces, canned fruits, spices and wine. Frozen French Fries: Frozen french fries are one of the most demanded frozen products in the HRI sector, especially among fast-food chains, restaurants and hotels. The product is well known by local and foreign consumers and has the convenience of being prepared in a short period of time. The value of imported frozen french fries grew from $4,764,037 in 2001 to $6,573,183 in 2005, as shown in Table 1. The import value of this product increased by an average 9.5% per year during the five-year period and is expected to continue its strong growth in the near future.
Table 1 Import Value of Frozen French Fries (2001-2005)
(US$)
Country 2001 2002 2003 2004 2005 Canada 1.488.884 1.195.955 3.760.959 6.288.756 5.735.364 United States 1.613.885 1.581.924 416.589 299.791 690.564 Belgium 291.027 452.848 294.920 17.920 12.207 Netherlands 1.353.138 1.701.861 1.245.531 228.103 15.563 Others 17.103 140.107 39.184 824 119.371 Total 4.764.037 5.072.695 5.757.183 6.835.394 6.573.069
Source: Prepared from Data of the National Institute for Statistics and Census (INEC) According to local importers, U.S. exporters of frozen french fries are quality and price competitive Nevertheless, because Canadian products enjoy duty-free status for negotiated quotas, and have a low out-of-quota tariff rate, they have the advantage of carrying a lower local price. Once CAFTA-DR is in effect, the U.S. will receive the same treatment as Canada and will therefore be able to compete with lower prices in this market. Under CAFTA-DR, U.S. frozen french fries will have a duty- free quota of 2,631 metric tons in the first year the Agreement enters into force. This TRQ will increase to 3,046 metric tons in Year four. Import duties on U.S. product will be phased-out in five years. Frozen Beef:

GAIN Report - CS6015 Page 33 of 39
UNCLASSIFIED USDA Foreign Agricultural Service
Frozen beef is a best prospect for U.S. exporters because of the growing demand for this product in the high-end segment of the food service sector. This growth responds to the increasing number of foreign tourists visiting Costa Rica, especially from the United States, who look for the taste, texture and the overall high quality of U.S beef.
Table 2 Import Value of Frozen Beef (2001-2005)
(US$)
Country 2001 2002 2003 2004 2005 Mexico 0 0 0 1.408.936 1.899.266 Chile 294.598 1.439.489 1.805.065 1.083.666 1.175.400 Nicaragua 351.583 445.948 180.597 856.583 575.959 United States 671.348 866.282 955.570 89.063 501.982 Guatemala 1.751.271 1.746.253 1.760.923 541.463 0 Panama 137.045 592.481 47.122 0 0 Others 0 100.266 0 0 0 Total 3.205.845 5.190.719 4.749.277 3.979.711 4.152.607
Source: Prepared from Data of the National Institute for Statistics and Census (INEC) As shown in Table 2, imports of frozen beef reached $4,152,607 in 2005. The average annual growth rate for this product category was 7.3% during the five-year period. Under CAFTA-DR, U.S. companies will have the opportunity to expand exports of frozen beef to this market because U.S. prime and choice beef will be subject to immediate tariff reduction once the Agreement is ratified. In addition, the approval of U.S. meat processing plants should be expedited when the Agreement enters into force, removing one of the strongest obstacles for the growth of U.S. exports to this market. The import tariff for frozen beef is 15%. Sauces: Demand for U.S. sauces is growing in the HRI sector, in particular from U.S.-based fast-food chains and from hotels and restaurants visited by foreign tourists. High-end hotels and restaurants use internationally known brands of U.S. origin because their chefs have used these brands in other countries and are therefore familiarized with their quality. In addition, foreign tourists have developed a taste for international food prepared with theses sauces. Consequently, chefs look for these brands in order to replicate successful recipes. Table 3 presents the value of sauces imported by Costa Rica during the period 2001-2005. The import value of this product category increased from $9,796,088 in 2001 to $11,127,857 in 2005, a 3% average annual growth for the five-year period. Exports of U.S. sauces to this market increased by 9% in the same period, or three times faster than the category as a whole.
Table 3 Import Value of Sauces (2001-2005)
(US$)
Country 2001 2002 2003 2004 2005 Guatemala 926.683 545.975 859.785 2.923.817 4.037.097
United States 2.650.294 2.995.384 3.387.996 3.450.850 3.676.079 Panama 3.478.297 3.864.675 1.400.543 1.763.287 1.082.731

GAIN Report - CS6015 Page 34 of 39
UNCLASSIFIED USDA Foreign Agricultural Service
Venezuela 508 7.529 1.227.730 1.083.929 954.960 El Salvador 330.320 328.900 445.479 577.687 326.581 Mexico 267.355 456.294 419.097 340.644 316.275
Others 2.142.630 1.944.925 1.444.070 982.355 734.134 Total 9.796.088 10.143.682 9.184.698 11.122.569 11.127.857
Source: Prepared from Data of the National Institute for Statistics and Census (INEC) The import tariff rate for this product category is 15%. With CAFTA-DR, import duties on most demanded sauces, such as ketchup, mustard and mayonnaise will be phased-out in fifteen years. Duties on other U.S. sauces will be phased-out in ten to fifteen years. Canned fruits: Customers of the HRI sector have a preference for fresh indigenous fruits. Nevertheless, hotels and restaurants also purchase canned fruits, which have to be imported since few fruits are canned locally. As shown in Table 4, the value of imported canned fruits increased from $4,933,671 in 2001 to $5,417,581 in 2005, a 2.4% average annual growth for the period 2001-2005. The value of canned fruits imported from the U.S increased by 3.8% during the same period. The U.S. has well-positioned, high quality brands in this market and is the largest exporter of this product category to Costa Rica. However, Chile’s exports of canned fruits to this market are increasing rapidly because its products are quality and price competitive, and most of Chilean products enter duty free.
Table 4
Import Value of Canned Fruits (2001-2005) (US$)
Country 2001 2002 2003 2004 2005 United States 3.004.662 2.822.467 2.795.321 3.409.203 3.462.601
Chile 277.957 790.484 1.064.466 1.402.263 1.115.786
Mexico 16.291 16.377 227.800 321.772 214.499
Greece 146.479 147.906 32.984 39.934 107.867
Others 1.488.282 552.551 372.978 459.606 516.829
Total 4.933.671 4.329.785 4.493.549 5.632.778 5.417.581
Source: Prepared from Data of the National Institute for Statistics and Census (INEC) This tariff advantage of Chile over the U.S. will be reduced significantly once CAFTA-DR is ratified. U.S. pears, peaches and fruit mixes, among the most exported canned fruits to this market, will enter free of duty once this Agreement enters into effect. Import tariffs on other canned fruits exported by the U.S. will be phased-out in five to fifteen years. Spices: The consumption of imported spices, in general, has expanded considerably in the period 2001-2005. As shown in Table 5, the value of imported spices increased from $1,332,309 in 2001 to $1,958,737 in 2005, growing at an average annual import rate of 11.7% during the period. U.S. spice exports to this market increased by 6.2% during the same period. U.S.
GAIN Report - CS6015 Page 35 of 39
UNCLASSIFIED USDA Foreign Agricultural Service
spices are a best prospect because chefs of high-end hotels and restaurants acknowledge the high quality of these products and are therefore willing to pay the higher price they carry. The demand for U.S. spices, as well as for other products of U.S. origin is expected to further increase as the tourism sector continues to expand. With CAFTA-DR, the import tariff rate that ranges from 6% to 10% will be phased-out in ten equal annual stages from the date the Agreement enters into force.
Table 5
Import Value of Spices (2001-2005) (US$)
Country 2001 2002 2003 2004 2005
United States 1.063.451 948.976 929.910 1.076.036 1.327.284 Spain 78.273 29.287 9.875 71.990 145.601 Netherlands 67.837 91.135 85.259 113.582 141.701 Honduras 176 1.731 7.136 0 98.254 Others 122.572 193.390 273.259 447.978 245.897 Total 1.332.309 1.264.519 1.367.733 1.709.586 1.958.737
Source: Prepared from Data of the National Institute for Statistics and Census (INEC) Wine: The value of imported alcoholic beverages by Costa Rica increased at an average annual rate of 10% during the period 2001-2005. At the same time, U.S. exports of alcoholic beverages to this market decreased due to a substantial fall in U.S. beer exports to Costa Rica. Nevertheless, the value of U.S. wine purchased by this market increased from $447,738 in 2001 to $448,925 in 2005. Wine is the main alcoholic beverage exported by the U.S. to Costa Rica. In 2005, this product represented 50% of total U.S. exports of alcoholic beverages to this market. U.S. wine is highly appreciated by customers of high-end hotels and restaurants and sales of this product would substantially increase if aggressively promoted in Costa Rica, according to industry sources.
Table 6 Import Value of Wine (2001-2005)
(US$)
Country 2001 2002 2003 2004 2005 Chile 1.816.301 2.386.160 2.846.607 3.667.258 4.275.172 Italy 847.942 1.074.259 935.551 1.054.973 1.154.215 Spain 950.737 935.474 893.593 1.134.227 1.074.885 France 895.010 652.173 763.711 734.284 779.848 Argentina 110.382 124.100 263.739 446.861 573.271 United States 447.738 556.901 398.713 458.742 488.925 Others 318.353 424.583 719.211 511.197 493.226 Total 5.386.463 6.153.650 6.821.125 8.007.542 8.839.542
Source: Prepared from Data of the National Institute for Statistics and Census (INEC)

GAIN Report - CS6015 Page 36 of 39
UNCLASSIFIED USDA Foreign Agricultural Service
Table 6 presents the value of wine imported by Costa Rica during the period 2001-2005. The import value of this product category increased from $5,386,463 in 2001 to $8,839,542 in 2005, a 16% average annual growth for the five-year period. The value of U.S. wine exports to this market grew by 2% during the same period and by 11% during the last three years of this period (2003-2005), after recovering from a considerable fall in 2003. According to industry sources, the HRI sector purchases approximately 50% of total wine imports. Chilean wines are the leaders in this market, followed by European and Argentinean wines. U.S. wines are quality competitive but command higher prices. CAFTA-DR will increase the competitiveness of U.S. wines since the 15% import tariff rate applied to this product will be eliminated immediately when this Agreement enters into force. This exemption will apply to wines with an alcohol content of up to 15% by volume and bottled in recipients of up to two liters. Import tariffs for sparkling wines will be phased-out in five years, all other wines in fifteen years. V. Entry Strategy and Recommendations U.S. exporters of foods and beverage products are encouraged to review the following recommendations for entering the Costa Rican market: • The Costa Rican HRI sector is very competitive and most known U.S brands are already
in the market. U.S exporters could consider entering this market with differentiated or new products. However, hotels, restaurants and food service importers may need encouragement to purchase new products or less known brands. Therefore, U.S. exporters may need to engage in promotional activities with local counterparts in order to develop a market for these products.
• Because the Costa Rican HRI sector is relatively small and very competitive. U.S. exporters willing to learn more about local market conditions will be more successful in entering this market. In some cases, this may mean agreeing to smaller sales contracts than in other larger markets. U.S. exporters may also expect food service importers to ask for more flexible pricing since prices charged to customers in the HRI sector are lower than in the U.S, reflecting the smaller purchasing power of the Costa Rican consumer.
• Communications between U.S. exporters and local food service importers are sometimes hampered by language limitations. The business relation between the U.S. exporter and its local counterparts would be facilitated if U.S. exporters have Spanish-speaking personnel available.
• U.S. exporters may benefit from visualizing Costa Rica as a platform for entering the rest of Central American countries. Central America is a bigger and more attractive market and this approach may lower the costs of doing business in the region. There are differences in import regulations among countries but market penetration schemes would be similar, according to industry sources.
• Costa Rican consumers are not fully aware of the quality of American wines. A marketing campaign designed to educate and increase the awareness of Costa Rican consumers towards U.S. wines would encourage the consumption of these products.
• Trade Missions could be organized for U.S. exporters of best prospect products interested in visiting Costa Rica. U.S. exporters would have the opportunity to meet with importers interested in their products, have one-on-one meetings to obtain a better overview of the local company, get to know in person his main contact, and negotiate a price or quantity. There are several ways to do this. One is by visiting each local company and the other is by having one-on-one meetings at a hotel or conference room where they will have private conversations and negotiations.
GAIN Report - CS6015 Page 37 of 39
UNCLASSIFIED USDA Foreign Agricultural Service
• Qualified buyers from Costa Rica could also be invited to attend specific Food Service Trade Shows. The main objective of this activity would be to allow the buyers to see a variety of products at one location. The buyers would meet with U.S. suppliers for one-on-one meetings. This type of event could be followed by organized travel to visit specific companies of interest and/or shipping, distribution centers.
VI. Contact List
United States Embassy Foreign Agricultural Service (FAS) Tel: (506) 519-2285 Fax: (506) 519-2475 E-mail: [email protected] Website: http://sanjose.usembassy.gov Ms. Katherine Nishiura, Agricultural Attaché Ms. Justina Torry, Assistant Agricultural Attaché Mr. Victor Gonzalez, Agricultural Specialist Mrs. Ileana Ramirez, Marketing Specialist Ms. Rosie Murillo, Assistant Mrs. Cynthia Smith-Palliser, Marketing Clerk Government of Costa Rica Contacts Central Bank of Costa Rica P.O. Box: 1058 -1000 San José, Costa Rica Tel: (506) 243-3333 Fax: (506) 255-0867 Website: www.bccr.fi.cr Ministry of Foreign Trade P.O. Box: 1278-1007 Centro Colon, Costa Rica Tel: (506) 299-4700 Fax: (506) 255-3281 Website: www.comex.go.cr Ministry of Economy, Industry and Commerce P.O. Box: 10216-1000 San Jose, Costa Rica Tel: (506) 235-2700 Fax: (506) 235-5251 Website: www.meic.go.cr/ingles/ Website for labeling: www.etiquetado.go.cr Ministry of Agriculture P.O. Box: 10094-1000 San José, Costa Rica Tel: (506) 231-2344 Fax: (506) 232-2103 Website: www.mag.go.cr Ministry of Health P.O. Box: 10123-1000 San José, Costa Rica Tel: (506) 223-0333 Fax: (506) 223-0335 Website: www.ministeriodesalud.go.cr

GAIN Report - CS6015 Page 38 of 39
UNCLASSIFIED USDA Foreign Agricultural Service
Tourism Institute of Costa Rica P.O. Box: -1000 San José, Costa Rica Tel: (506) 299-5800 Fax: (506) 220-4210 Website: www.visitcostarica.com National Institute for Statistics and Census P.O. Box: 10163-1000 San José, Costa Rica Tel: (506) 280-9280 Fax: (506) 224-2221 Website: www.inec.go.cr Contacts of Private Sector Organizations AMCHAM (Local American Chamber of Commerce) P.O. Box: 4946-1000 San José, Costa Rica Tel: (506) 220-2200 Fax: (506) 220-2300 E-mail: [email protected] Website: www.amcham.co.cr Cámara Costarricense de la Industria Alimentaria (Costa Rican Chamber of Food Industry) P.O. Box: 7097-1000 San José, Costa Rica Tel: (506) 234-1127 Fax: (506) 234-6783 Website: www.cacia.org Cámara de Comercio de Costa Rica (Costa Rican Chamber of Commerce) P.O. Box: 1114-1000 San José, Costa Rica Tel: (506) 221-0005 Fax: (506) 233-1157 Website: www.camara-comercio.com Cámara de Representantes Extranjeros-CRECEX (Chamber of Representatives of Foreign Companies) P.O. Box: 3738-1000 San José, Costa Rica Tel: (506) 253-0126 Fax: (506) 234-2557 Website: www.crecex.com Cámara de Industrias de Costa Rica (Costa Rican Chamber of Industries) P.O. Box: 1003-1000 San José, Costa Rica Tel: (506) 281-0006 Fax: (506) 234-6163 Website: www.cicr.com Cámara Nacional de Agricultura y Agroindustrias (National Chamber of Agriculture and Agribusiness) P.O. Box: 1671-1000 San José, Costa Rica Tel: (506) 280-2173 Fax: (506) 280-0969 Website: www.cnaacr.com

GAIN Report - CS6015 Page 39 of 39
UNCLASSIFIED USDA Foreign Agricultural Service
Cámara Costarricense de Restaurantes y afines CACORE (Costa Rican Restaurant Chamber) P.O. Box: 142-1002 San José, Costa Rica Tel: (506) 222-0728 Fax: (506) 222-7827 E-mail: [email protected] Website: http://www.cacorestaurantes.com Cámara Costarricense de Hoteles (Costa Rican Hotel Chamber) Tel: (506) 248-0990 Fax: (506) 222-6716 E-mail: [email protected] Website: www.costaricanhotels.com Cámara Nacional de Turismo CANATUR (Costa Rican Tourism Chamber) P.O. Box: 828-1000 San José, Costa Rica Tel: (506) 234-6222 Fax: (506) 253-8102 E-mail: [email protected] Website: http://www.canatur.org