Embed Size (px)
Citation preview
GRAYS HARBOR RAIL TERMINAL LLC AIR QUALITY IMPACT TECHNICAL REPORT
March 2014 Prepared by:
HDR Engineering, Inc. 500 108th Avenue NE Suite 1200 Bellevue, WA 98004
Prepared for:
Grays Harbor Rail Terminal LLC 3020 Old Ranch Parkway, Suite 300 Seal Beach, CA 90740 (562) 799-5572

This page intentionally left blank.

Grays Harbor Rail Terminal LLC i Air Quality Impact Technical Report
Table of Contents
1. Introduction ..................................................................................................................... 1
2. Project Description .......................................................................................................... 1
3. Existing Conditions .......................................................................................................... 5
4. Construction Emissions ................................................................................................... 6
5. Storage Tanks .................................................................................................................. 7
6. Fugitive Emissions from Valves, Pumps, and Connectors ........................................... 8
7. Marine Vapor Combustion Unit ..................................................................................... 8
8. Railway Emissions ............................................................................................................ 9
9. Marine Vessels .............................................................................................................. 11
10. Emissions Expected from Construction and Operation ............................................ 12
11. Greenhouse Gas Emissions .......................................................................................... 14
12. References ..................................................................................................................... 15
List of Tables Table 1. Construction Equipment ................................................................................................. 6
Table 2. Estimated Fugitive Component Counts ......................................................................... 8
Table 3. Emission Factors Used for the MVCU ........................................................................... 9
Table 4. Emission Factors Used for Train Locomotives ............................................................ 10
Table 5. Emission Factors Used for Marine Vessels ................................................................. 12
Table 6. Construction Phase Maximum Daily Emissions ........................................................... 12
Table 7. Construction Phase Annual Emissions ........................................................................ 13
Table 8. Operational Daily Emissions ........................................................................................ 13
Table 9. Operational Annual Emissions ..................................................................................... 14
List of Figures
Figure 1. Project Vicinity Map ............................................................................................. 3

Grays Harbor Rail Terminal LLC ii Air Quality Impact Technical Report
This page intentionally left blank.

Grays Harbor Rail Terminal LLC 1 Air Quality Impact Technical Report
1. Introduction This technical report presents an evaluation of the potential impacts to air quality in the project area from the implementation of the Grays Harbor Rail Terminal project.
2. Project Description Grays Harbor Rail Terminal LLC (GHRT) is proposing a bulk liquids rail logistics facility at the Port of Grays Harbor Terminal 3 (T3) property. The facility will accommodate the receipt for export of not more than 45,000 barrels per day on average of various liquid bulk materials, specifically, various types of crude oil and condensates.
T3 is a 150 acre industrial site and includes an existing 600-foot-long concrete shipping terminal. The Port of Grays Harbor currently leases approximately 25 acres of the T3 site to a private tenant (Willis Enterprises), which utilizes the property for storing and sorting logs, and operating a wood chipping and processing facility. The tenant utilizes the existing wharf for product loading on to barges for export. The remaining area of the property (a former mill site) is occupied by 4 metal buildings and a rail spur line but is otherwise currently vacant.
The liquid bulk materials would be delivered to the proposed facility via unit trains in fully contained liquid bulk rail cars, unloaded into on-site storage tanks, and then loaded onto barges or other marine vessels for delivery to refineries.
The general layout of the proposed rail and off-loading facilities includes four 20-car yard tracks and two 20-car off-loading tracks (120 rail cars total). In addition, a “run-around” track would be used to reposition the locomotive engines and could also be used to hold cars awaiting maintenance. The off-loading spots would be equipped with permanent rack access structures where each rack structure would support connections for a maximum of 40 rail cars (20 spots on each side of a rack). The off-loading spots and central header would be located within secondary containment. The rack structures consist of elevated steel walkways with extendable access platforms used to access the tops of the rail cars. Off-loading would occur via 4-inch dry break connections, hoses, valves, and risers connecting the bottom rail car couplers to a central piping header. The rail cars would be off-loaded by gravity feed into the central header.
The liquid bulk materials would be stored in approximately six to eight above-ground storage tanks with secondary containment and internal floating roofs until a marine vessel (ship or barge) arrives. All tanks will be located outside the Shoreline District. The total combined tank storage would be approximately 800,000 – 1,000,000 barrels. Construction of multiple storage tanks would allow the facility to accommodate interruptions in vessel schedules as well as changes in delivery volumes, and would allow the facility to maintain consistent operations. Vessel calls are anticipated by barge and Panamax vessels occurring approximately 3-4 times per month.

Grays Harbor Rail Terminal LLC 2 Air Quality Impact Technical Report
As noted above, T3 includes an existing 600-foot-long concrete shipping terminal. There are currently four mooring dolphins (three downstream/one upstream) off the existing concrete wharf. Up to four additional mooring dolphins (two downstream and two upstream) would be constructed to minimize vessel movements during liquid bulk materials transfer. No additional overwater expansion of the wharf is proposed. The existing trestle (supporting the Willis conveyor) and the wharf can accommodate the liquid bulk materials pipe rack needed to transfer the materials from the tanks to the vessels. Stormwater collection, drainage improvements, and spill containment measures would be added to the existing wharf but no structural modifications are necessary.
To facilitate operations at the Grays Harbor Rail Terminal, the Puget Sound and Pacific Railroad would be permitting and supervising construction of an industrial lead track extension of their main line railroad system. This industrial lead track would extend from the current main line rail terminus, just east of Paulson Road, for approximately 1,300 lineal feet to the west. The industrial lead track would allow for the backing of rail cars strings into the project site and provide additional rail car storage for other Port tenants. The identification of the industrial lead track is to account for potential indirect or cumulative environmental impacts for the purposes of the State Environmental Policy Act (SEPA) only and is not a project component of the Grays Harbor Rail Terminal site development permitting.

Path:
G:\P
rojec
ts\Wa
shing
ton\U
SD_4
5638
8\PSA
P_Te
rm_T
5_22
5030
\Map
_Doc
s\BA\
REPO
RT_P
rojec
tVicin
ity.m
xd D
ate: 3
/18/20
14
Vicinity MapGrays Harbor Rail Terminal
Project Vicinity
Data Source: Parcels - Grays Harbor County GIS; Aerial - ESRI ArcGIS Online.Map inform ation w as com piled from th e best av ailable public sources. HDRdoes not w arrant th at th e inform ation is accurate or com plete.
0 250 500125Feet
Term inal 3 – Port of Grays Harbor, Hoquiam WAU S Dev elopm ent Group LLC
Project AreaIndustrial Lead TrackParcel

Grays Harbor Rail Terminal LLC 4 Air Quality Impact Technical Report
This page intentionally left blank.

Grays Harbor Rail Terminal LLC 5 Air Quality Impact Technical Report
3. Existing Conditions Air pollutant emissions associated with the proposed project would be released to the environment primarily in the Hoquiam area of Grays Harbor County. Train locomotive exhaust would also be released in Lewis and Thurston Counties. The portions of these counties traversed by the rail line do not include any National Ambient Air Quality Standards (NAAQS) nonattainment or maintenance areas. A part of Thurston County, the Olympia area, is maintenance for fine particulate (PM10), but that area would be unaffected by the proposed project.
Stationary sources of air emissions are subject to New Source Review and to approval by Olympic Region Clean Air Agency (ORCAA). ORCAA Rule6.1.4 will require that best-available control technology (BACT) be applied to the proposed stationary sources, For the proposed project, BACT will consist of a state-of-the-art marine vapor control unit, internal floating roof tanks with modern deck seals, dry-break fittings on unloading lines, and proper maintenance for valve, pumps, and connections. Taking into consideration the effects of BACT, estimated potential emissions are less than the 100 tons per year threshold for criteria pollutants that would trigger a major source permit under either the construction permit (PSD/NSR) or operating permit (Title V) programs.
There are sensitive receptors in the general vicinity of the proposed project, Hoquiam High School and Hoquiam Middle School are approximately 1,000 feet north of the railroad tracks and 2,500 feet northeast of the expected location for the vapor control unit. Residences are located within 1,000 feet of the unloading dock and 2,000 feet east of the expected location for the vapor control unit. However this proposed project is consistent with current activities at the Port of Grays Harbor and with the Land Use Action Steps proposed for the Hoquiam Industrial District in Section 3 of the City of Hoquiam 2009 Comprehensive Land Use Plan (Hoquiam, 2009)
Prior to being issued a permit by Olympic Region Clean Air Agency (ORCAA), the emission rate of toxic air pollutants (TAPs) expected from stationary sources will be compared to their respective Small Quantity Emission Rates (SQERs) to determine if modeling is required. Any TAP with emissions above its respective SQER must be evaluated using dispersion modeling to demonstrate that the ambient impact from the TAP is below its respective Acceptable Source Impact Level (ASIL). For TAPs with modeled impacts less than the ASIL, no further action is necessary to show compliance with WAC 173-460. For TAPs with modeled impacts greater than the ASIL, additional health impact analysis or mitigation measures to reduce expected emissions may be required. Based on current estimates for the preliminary design, emissions of nitrogen oxides (NOx), carbon monoxide (CO) and benzene may exceed SQERs and further analysis may be required before an Approval Order can be granted by ORCAA.
Grays Harbor Rail Terminal LLC 6 Air Quality Impact Technical Report
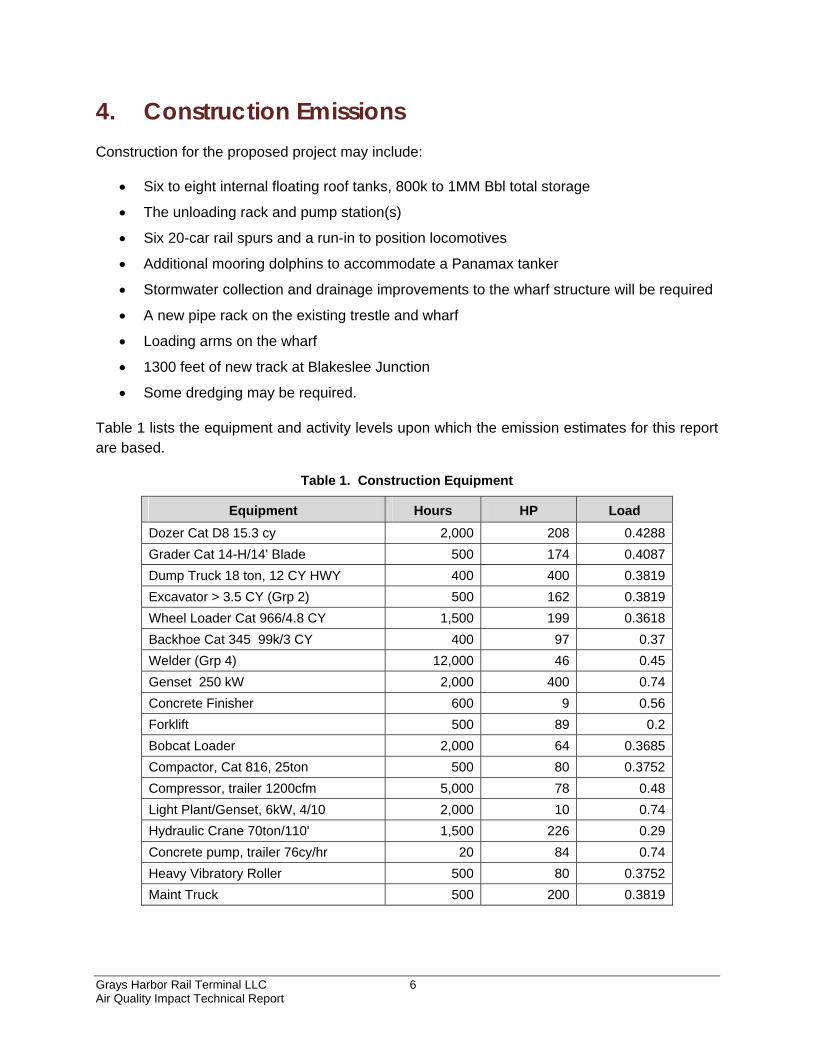
4. Construction Emissions Construction for the proposed project may include:
Six to eight internal floating roof tanks, 800k to 1MM Bbl total storage
The unloading rack and pump station(s)
Six 20-car rail spurs and a run-in to position locomotives
Additional mooring dolphins to accommodate a Panamax tanker
Stormwater collection and drainage improvements to the wharf structure will be required
A new pipe rack on the existing trestle and wharf
Loading arms on the wharf
1300 feet of new track at Blakeslee Junction
Some dredging may be required.
Table 1 lists the equipment and activity levels upon which the emission estimates for this report are based.
Table 1. Construction Equipment
Equipment Hours HP Load
Dozer Cat D8 15.3 cy 2,000 208 0.4288
Grader Cat 14-H/14' Blade 500 174 0.4087
Dump Truck 18 ton, 12 CY HWY 400 400 0.3819
Excavator > 3.5 CY (Grp 2) 500 162 0.3819
Wheel Loader Cat 966/4.8 CY 1,500 199 0.3618
Backhoe Cat 345 99k/3 CY 400 97 0.37
Welder (Grp 4) 12,000 46 0.45
Genset 250 kW 2,000 400 0.74
Concrete Finisher 600 9 0.56
Forklift 500 89 0.2
Bobcat Loader 2,000 64 0.3685
Compactor, Cat 816, 25ton 500 80 0.3752
Compressor, trailer 1200cfm 5,000 78 0.48
Light Plant/Genset, 6kW, 4/10 2,000 10 0.74
Hydraulic Crane 70ton/110' 1,500 226 0.29
Concrete pump, trailer 76cy/hr 20 84 0.74
Heavy Vibratory Roller 500 80 0.3752
Maint Truck 500 200 0.3819

Grays Harbor Rail Terminal LLC 7 Air Quality Impact Technical Report
Emissions were estimated for construction equipment using emission factors from the US EPA NONROAD emissions model, as programmed into the California Air Resources Board’s CalEEMod computer model. The use of the CalEEMod model facilitates estimates such as this because CalEEMod is programed to automatically adjust off-road and on-road vehicle emission factors to reflect fleet turnover to newer, cleaner engines as years progress.
CalEEMod generates site-specific estimates of construction and wind-blown dust based on soil silt content, wind, and rainfall for a particular location. Humbolt County California was selected as a site with wind and rainfall similar to Grays Harbor Washington.
The proximity to railroad tracks will mean that the most efficient way to ship the heavy materials (rails, railroad ties, and steel for tanks) will be by rail. Aggregate for rail bases and piping may also arrive by rail, but were assumed to arrive by truck, as will the concrete, from an average of 40 miles away.
Worker commute emissions assume 35 construction workers, some carpooling or arriving in crew pickups, for an average of 1.5 passengers per vehicle, from an average of 20 miles away.
It was assumed that the piping and tank exteriors, approximately 300,000 square feet of steel, would be painted with oil-base paint of approximately 250 grams per liter volatile organic compound (VOC).
5. Storage Tanks The design for the proposed project anticipates eight internal floating roof tanks with a capacity of 130,000 barrels (bbl) each. At 42 gallons per barrel, that is 5.46 million gallons per tank. Each tank would be 45 ft tall and 140 ft in diameter.
VOC emissions from the tanks were estimated using EPA’s TANKS 4.09d program. The maximum offloading capacity for this facility will be 44,975 barrels per day, or 16,415,875 barrels per year. Therefore the annual throughput for each tank was set at 15.78 turnovers (86.2M gal) per year. Other assumptions were: mechanical shoe primary seal with rim mounted secondary seal, welded deck, Tanks 4.09d default fitting counts and gasketed fittings.
Grays Harbor Rail Terminal LLC provided three crude oil material safety data sheets (MSDSs) that were deemed representative of the slate of crude oils that may be processed through this facility. These were: Cennovus Light Bakken Crude, Cennovus Heavy Crude in 10-50% hydrocarbon diluent, and Global Sweet Crude. Review of these MSDSs suggested that the Reid vapor pressure (RVP) of the crude may be anywhere from RVP 5 to RVP 11.7. Therefore, all calculations for the tanks and marine vapor combustion unit (MVRU) were performed using these two extreme cases to identify the worst-case for emissions.
Grays Harbor Rail Terminal LLC 8 Air Quality Impact Technical Report
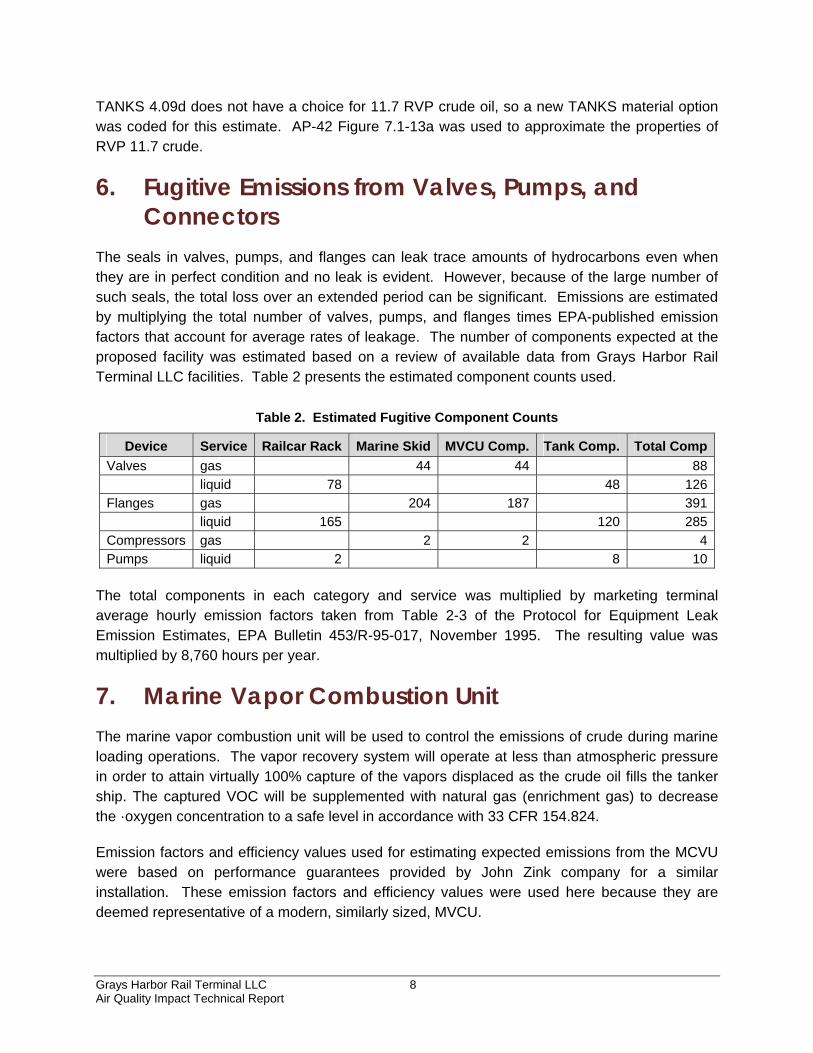
TANKS 4.09d does not have a choice for 11.7 RVP crude oil, so a new TANKS material option was coded for this estimate. AP-42 Figure 7.1-13a was used to approximate the properties of RVP 11.7 crude.
6. Fugitive Emissions from Valves, Pumps, and Connectors
The seals in valves, pumps, and flanges can leak trace amounts of hydrocarbons even when they are in perfect condition and no leak is evident. However, because of the large number of such seals, the total loss over an extended period can be significant. Emissions are estimated by multiplying the total number of valves, pumps, and flanges times EPA-published emission factors that account for average rates of leakage. The number of components expected at the proposed facility was estimated based on a review of available data from Grays Harbor Rail Terminal LLC facilities. Table 2 presents the estimated component counts used.
Table 2. Estimated Fugitive Component Counts
Device Service Railcar Rack Marine Skid MVCU Comp. Tank Comp. Total Comp
Valves gas 44 44 88
liquid 78 48 126
Flanges gas 204 187 391
liquid 165 120 285
Compressors gas 2 2 4
Pumps liquid 2 8 10
The total components in each category and service was multiplied by marketing terminal average hourly emission factors taken from Table 2-3 of the Protocol for Equipment Leak Emission Estimates, EPA Bulletin 453/R-95-017, November 1995. The resulting value was multiplied by 8,760 hours per year.
7. Marine Vapor Combustion Unit The marine vapor combustion unit will be used to control the emissions of crude during marine loading operations. The vapor recovery system will operate at less than atmospheric pressure in order to attain virtually 100% capture of the vapors displaced as the crude oil fills the tanker ship. The captured VOC will be supplemented with natural gas (enrichment gas) to decrease the ·oxygen concentration to a safe level in accordance with 33 CFR 154.824.
Emission factors and efficiency values used for estimating expected emissions from the MCVU were based on performance guarantees provided by John Zink company for a similar installation. These emission factors and efficiency values were used here because they are deemed representative of a modern, similarly sized, MVCU.

Grays Harbor Rail Terminal LLC 9 Air Quality Impact Technical Report
The mass of uncontrolled loading emissions was estimated using Equations 2 and 3 of AP-42 Section 5.2. The arrival emission factor CA was conservatively assumed to be 0.86 based on worst-case assumptions of volatile previous cargo and no water ballasting. A product temperature of 60°F was assumed.
For 16,415,875 bbl/yr (689,466,750 gal/yr) loaded, the mass of hydrocarbon vapor without enrichment gas was estimated to be:
RVP 5 339 ton/yr VOC RVP 11.7 480 ton/yr VOC
Estimated VOC emissions are based on the 99% destruction and removal efficiency (DRE) quoted by John Zink Company to Westway. Similarly, estimates of NOx and CO emissions are based on the John Zink Company specification of 4 mg NOx per liter of product loaded and 10 mg CO per liter of product loaded.
Estimates of emissions of other combustion products are taken from AP-42 Section 1.4 for external combustion of natural gas in small boilers. Because the heat density of crude oil vapor is different from the heat density of natural gas, the AP-42 natural gas factors were converted from units of lb/MMcf to lb/MMBtu using 1,020 Btu/scf for natural gas. These converted factors were applied to the heat content of the combusted crude oil vapors. The John Zink calculations assumed that crude oil hydrocarbon vapors are 1,884 Btu/scf, and that the vented stream is approximately 60% hydrocarbon vapors and 40% air before enrichment in the RVP 11.7 scenario. Table 3 lists the emission factors used to estimate emissions from the MVCU.
Table 3. Emission Factors Used for the MVCU
Pollutant Factor Units
VOC 0.01 lb/lb VOC vapor (99% DRE)
NOx 0.00014 lb/bbl loaded (4 mg per liter loaded)
CO 0.00035 lb/bbl loaded (10 mg per liter loaded)
PM10/PM2.5 0.00745 lb/MMBtu (7.6 lb/MMcf natural gas)
SOx 0.00059 lb/MMBtu (0.6 lb/MMcf natural gas)
CO2 1.2E+02 lb/MMBtu (120,000 lb/MMcf natural gas)
N2O 2.2E-03 lb/MMBtu (2.2 lb/MMcf natural gas)
Hourly emission rate estimates assume a loading rate of 20,000 bbl/hr. This results in an estimated total combustor firing rate of 240MMBtu/hr for the RVP 11.7 scenario.
8. Railway Emissions The proposed project would require a maximum of one train every two days at Port Terminal 3. Each train would have a maximum of two locomotives and 120 tank cars. In addition, a yard locomotive operated by Grays Harbor Rail Terminal LLC would maneuver 20-car segments into the six proposed new rail spurs and then into position next to the proposed unloading rack.

Grays Harbor Rail Terminal LLC 10 Air Quality Impact Technical Report
This analysis considers emissions from the yard locomotive as well as the line haul locomotives that deliver and retrieve the tank cars. All yard locomotive emissions and the maneuvering and idling of line haul locomotives in the immediate vicinity of the proposed terminal are considered to be “on-site” emissions. Off-site rail emissions are the result of line haul locomotives traveling from Hoquiam to the railroad main line adjacent to Interstate 5 at Centralia. This air quality evaluation ends at the railroad main line.
Emission rates from locomotives are currently declining with each passing year. Locomotive engines manufactured between 1973 and 2011 are subject to new emission standards when they are overhauled. The applicable standards are Tier 0, Tier 1, or Tier 2 depending on the date of original manufacture. Engines manufactured in 2012 through 2014 are subject to Tier 3 standards upon manufacture, and engines manufactured in 2015 and later will be subject to Tier 4 standards. Engines designated as switch engines are subject to slightly different, but similar, standards and schedules.
As locomotive engines are overhauled and replaced over time, the fleet average emission rates will decline. A study published by EPA, "Emission Factors for Locomotives" EPA-420-F-97-051 in December of 1997 anticipated the rate of engine overhauls and replacements as well as degradation of new and overhauled engines with time, and predicted the steadily declining locomotive fleet average emission factors for the years 1999 through 2040. These factors average line haul and switch engines into a combined weighted average factor. This estimate uses the predicted locomotive fleet average factor for calendar year 2015 from EPA-420-F-97-051.
Table 4. Emission Factors Used for Train Locomotives
PM10
g/gal
PM2.5
g/gal
VOC
g/gal
NOx
g/gal
SOx
g/gal
CO
g/gal
CO2e
g/gal
Line Haul and Yard Locomotives – 2015
5.3 5.3 8.5 151 0.095 27.4 10,241
Reference: EPA, 1997 and CEQ, 2010
The SOx emission factor was not published in this document but was calculated using a fuel sulfur content of 15 ppmw. The greenhouse gas (CO2e) factor was derived from Appendix D of Technical Support document to the Federal Greenhouse Gas Accounting and Reporting Guidance, published by the Council on Environmental Quality (CEQ) on 6 October 2010. Published factors were converted to fuel-based units using a locomotive thermal efficiency of 38.7% as was used in the EPA emission factor reference for locomotives.
Fuel use in yard and line haul locomotives operating in the vicinity of the proposed terminal was estimated based surveys of fuel consumption rates for yard (switching) and line haul locomotives operating in Long Beach Harbor in California. These data were used in the Port of Long Beach 2006 Emission Inventory" Section 5 – Locomotives. The average fuel consumption rates, which include both working and idling time, were estimated to be:

Grays Harbor Rail Terminal LLC 11 Air Quality Impact Technical Report
Line Haul Locomotives 49.76 gal/hr Switching Locomotives 9.6 gal/hr
Combining these fuel consumption rates with the conservative operating schedule times assumed in the noise analysis for this project resulted in total annual fuel consumption estimates of:
Onsite Locomotive Fuel Use 310,000 gal/yr Offsite Locomotive Fuel Use 100,000 gal/yr
This combined total was compared to the nation-wide rail freight average of 435.88 ton-miles per gallon of fuel used. This estimate works out to be 132% of the national average fuel consumption rate for moving this mass of freight over this distance, so it is believed to be of the proper magnitude. Given the short movements in and near the terminal, one would expect freight movement to be somewhat less efficient that a national average for line-haul freight movement.
9. Marine Vessels The proposed terminal will load 45 to 60 Panamax-sized tankers per year. The tankers will require the assistance of a tugboat to position at the terminal. A Panamax tanker is propelled by a 20,000 horsepower engine and can carry approximately 65,000 tons of cargo. Its design speed on open sea is approximately 15 knots (17 mph).
Tanker and tug time per call, as well as emission factors for these marine vessels, are not commonly documented emission inventory data. The values used in this estimate were taken from the Chevron Richmond Refinery Title V permit.
Tug Assist Time Per Call Barge 6 hours 131 gal/hr Tanker 4 hours 131 gal/hr
Transit Time Per Call Tanker 6 hours 394 gal/hr
No definitive EPA sanctioned source for marine vessel emission factors was found. Factors used in other inventories come from several sources, but generally appear to be similar to the AP-42 emission factors for large stationary diesel engines. The factors for this analysis are taken from the Chevron Richmond Refinery Title V permit, and are presented in Table 5

Grays Harbor Rail Terminal LLC 12 Air Quality Impact Technical Report
Table 5. Emission Factors Used for Marine Vessels
PM10
lb/Mgal
PM2.5
lb/Mgal
VOC
lb/Mgal
NOx
lb/Mgal
SOx
lb/Mgal
CO
lb/Mgal
CO2e
kg/MgalMotor Ships, Maneuvering and Hoteling
20 20 32.8 367 70.1 56.9 10,241
Tugs 25 25 13 571.2 70.1 56.9 10,241
Where M = 1000 Tugs manufactured or reconstructed in 2007 and later must meet slightly lower, Tier 2, emission standards. Late model tugs were not assumed in this estimate.
10. Emissions Expected from Construction and Operation
Table 6. Construction Phase Maximum Daily Emissions
Offsite Maximum Daily Emissions From Construction
PM10
lb/day
PM2.5
lb/day
VOC
lb/day
NOx
lb/day
SOx
lb/day
CO
lb/day
CO2e
kg/dayDelivery Trucks 0.06 0.03 0.06 0.76 0.001 0.49 57Worker Commutes 0.38 0.10 0.26 0.51 0.004 3.88 168Offsite Subtotal 0.44 0.13 0.32 1.27 0.005 4.38 225
Onsite Maximum Daily Emissions from Construction Site Preparation 19.45 10.79 1.68 21.56 0.018 7.52 863Construction 3.66 3.57 9.11 59.81 0.067 35.45 3,086Architectural Coating 0.25 0.25 60.38 2.78 0.003 1.92 128Onsite Subtotal 23.36 14.60 71.18 84.15 0.088 44.89 4,076
Total Construction Daily Emissions Construction Daily 23.80 14.73 71.50 85.41 0.093 49.27 4,301

Grays Harbor Rail Terminal LLC 13 Air Quality Impact Technical Report
Table 7. Construction Phase Annual Emissions
Offsite Annual Emissions From Construction
PM10
ton/yr
PM2.5
ton/yr
VOC
ton/yr
NOx
ton/yr
SOx
ton/yr
CO
ton/yr
CO2e
tonne/yrDelivery Trucks 0.003 0.002 0.003 0.042 0.0001 0.026 3Worker Commutes 0.023 0.006 0.014 0.027 0.0003 0.218 9Offsite Subtotal 0.026 0.008 0.017 0.069 0.0003 0.243 13
Onsite Annual Emissions from Construction Site Preparation 1.58 0.86 0.07 0.89 0.001 0.31 32Construction 0.22 0.21 0.55 3.63 0.004 2.19 175Architectural Coating 0.01 0.01 1.75 0.08 0.000 0.06 3Onsite Subtotal 1.81 1.08 2.37 4.60 0.005 2.56 211
Total Construction Annual Emissions Construction Annual 1.83 1.09 2.39 4.66 0.005 2.80 223
Table 8. Operational Daily Emissions
Offsite Maximum Daily Emissions From Operations
PM10
lb/day
PM2.5
lb/day
VOC
lb/day
NOx
lb/day
SOx
lb/day
CO
lb/day
CO2e
kg/day Trains Offsitea 19.47 19.47 31.22 554.59 0.35 100.63 17,061Marine Vesselsb 44.63 44.63 58.51 877.97 147.24 119.52 21,511Worker Commutes 0.38 0.10 0.26 0.51 0.004 3.88 168Offsite Subtotal 64.48 64.20 89.98 1,433.08 147.60 224.04 38,740
Onsite Maximum Daily Emissions from Operations Trains Onsitea 20.40 20.40 32.72 581.17 0.37 105.46 17,879Marine Vessel Onsiteb 16.80 16.80 27.55 308.28 58.88 47.80 8,602Fugitive Lossesc 1.65 Tank Emissions 87.95 Vapor Recovery Unitd 42.97 42.97 280.78 672.71 3.40 1,681.78 309,543Onsite Subtotal 80.17 80.17 430.65 1,562.16 62.654 1,835.03 336,024
Total Operational Daily Emissions Operational Daily 144.7 144.4 520.6 2,995.2 210.3 2,059.1 374,765
a. Offsite train traffic includes travel between the main line at Centralia and the train maneuvering
areas on and adjacent to the proposed project.
b. Offsite marine vessel traffic includes travel from the dock to the 3 mile limit and includes tug assist.
Maximum daily offsite marine vessel emissions estimated as four hours transit and tug assist.
c. Fugitive losses are losses through gaskets and seals at valves, pumps, and connectors.
d. Vapor recovery unit emissions assume negative pressure venting (100% capture) to a combustion
unit with 99% destruction efficiency.

Grays Harbor Rail Terminal LLC 14 Air Quality Impact Technical Report
Table 9. Operational Annual Emissions
Offsite Annual Emissions From Operations
PM10
ton/yr
PM2.5
ton/yr
VOC
ton/yr
NOx
ton/yr
SOx
ton/yr
CO
ton/yr
CO2e
tonne/yr
Trains Offsitea 0.58 0.58 0.94 16.64 0.01 3.02 512Marine Vesselsb 1.81 1.81 2.53 35.02 6.07 4.93 1,775Worker Commutes 0.05 0.01 0.03 0.05 0.00 0.44 18.81Offsite Subtotal 2.44 2.41 3.50 51.71 6.09 8.39 2,306
Onsite Annual Emissions from Operations Trains Onsitea 1.81 1.81 2.90 51.61 0.03 9.36 3,175Marine Vessel Onsiteb 0.60 0.60 0.99 11.10 2.12 1.72 619Fugitive Lossesc 0.30 Tank Emissions 16.05 Vapor Recovery Unitd 0.73 0.73 4.80 11.50 0.06 28.76 10,586Onsite Subtotal 3.15 3.15 25.05 74.21 2.211 39.84 14,381
Total Operational Annual Emissions Operational Annual 5.59 5.56 28.55 125.91 8.296 48.23 16,686
a. On-site train emissions include maneuvering and idling of both line haul and yard locomotives in
and adjacent to the proposed project site.
b. For this estimate, marine vessels have conservatively been assumed to idle during loading rather
than running an on-board generator or using shore power. Twenty hours hoteling on maximum day
as four hours would be spent in transit on the maximum day.
c. Fugitive losses are losses through gaskets and seals at valves, pumps, and connectors.
d. Vapor recovery unit emissions assume negative pressure venting (100% capture) to a combustion
unit with 99% destruction efficiency.
11. Greenhouse Gas Emissions The emissions tables in the previous section present estimates of greenhouse gases from fuel-burning stationary and mobile emission sources. Estimates of greenhouse gas emissions from combustion processes are very straightforward. The carbon content of the fuel is converted to carbon dioxide (CO2) in the combustion process. Combustion also results on trace amounts of unburned methane (CH4) and nitrous oxide (N2O). The methane and nitrous oxide are expressed in units of carbon dioxide equivalents (CO2e) by adjusting the mass of emissions by the EPA-published global warming potential of these gases. Total CO2e emissions are reported in metric units of kilograms per day or metric tonnes per year (kg/day or tonne/yr).
For projects that are expected to annually produce an average estimate of at least 10,000 but less than 25,000 metric tons CO2e, proponents should at least qualitatively disclose the GHG emissions caused by the project. A qualitative disclosure should include a general description of the project’s expected source(s) of the emissions, as well as any proposed GHG mitigation measures incorporated or designed into the project.

Grays Harbor Rail Terminal LLC 15 Air Quality Impact Technical Report
A proposal will be presumed to be not significant for greenhouse gas emissions and thus no further mitigation for greenhouse gas emissions will be necessary if it is:
Expected to result in fewer than 25,000 metric tons a year
Subject to a legal requirement to reduce or mitigate GHG emissions
Expected to result in emissions of 25,000 metric tons or more a year and has incorporated mitigation measures to reduce its emissions by approximately 11% below what its emissions would have been without those mitigation measures.
From the Emission Summary Table 4, estimated total annual operating GHG emissions associated with the proposed action are 16,686 tons per year. As discussed previously, the detailed analysis done for this environmental assessment ends at the three nautical mile limit offshore, and at the rail mainline at Centralia. Electrical demand for the proposed facility has not been estimated, but is expected to be on the order of 3,500 MW-hr per year. That would add another 1,500 tonne CO2e, for a total on the order of 19,000 tonnes per year of operational CO2e. This is less than the 25,000 tonne significance threshold suggested by the Washington Department of Ecology.
Based on the existing estimates of off-site train emissions, estimating emissions to the state line would add approximately 1,000 tons per year of CO2e to the estimate, depending on the route.
12. References EPA, 1995. Protocol for Equipment Leak Emission Estimates, EPA Bulletin 453/R-95-017,
November 1995
EPA, 1997. Emission Factors for Locomotives, EPA-420-F-97-051, December of 1997
Hoquiam, 2009. Comprehensive Land Use Plan, City of Hoquiam, February 2009.
POGH, 2014, Port of Grays Harbor website, Marine Terminals page. http://www.portofgraysharbor.com/terminals/terminals.php, Accessed 3/25/14.
POLB 2007. Port of Long Beach 2006 Emission Inventory Section 5 - Locomotives http://www.polb.com/civica/filebank/blobdload.asp?BlobID=5377