Embed Size (px)
Citation preview
B&B ENGINEERING INC.
Northern Arizona University
USCS Site Soil Classification
For OWDP Project
September 23, 2013
Prepared By: Patrick Belsheim
TABLE OF CONTENTS
1 Purpose .............................................................................................................................1
2 Methodology ....................................................................................................................1
2.1 Method for Percent Finer Passing the #200...............................................................1
2.2 Method for Grain Size Graph ...................................................................................2
2.3 Method for Coefficient of Uniformity and the Coefficient of Curvature....................2
2.4 Method for Classification into USCS .......................................................................3
3 Results ..............................................................................................................................3
3.1 Grain Size Graph ......................................................................................................4
3.2 Coefficient of Uniformity and the Coefficient of Curvature ......................................6
3.3 Soil Classifications ...................................................................................................6
4 Conclusion ........................................................................................................................6
5 Recommendations.............................................................................................................6
References ...............................................................................................................................7
Appendix A .............................................................................................................................7
Appendix B .............................................................................................................................8
Appendix C .............................................................................................................................9
1
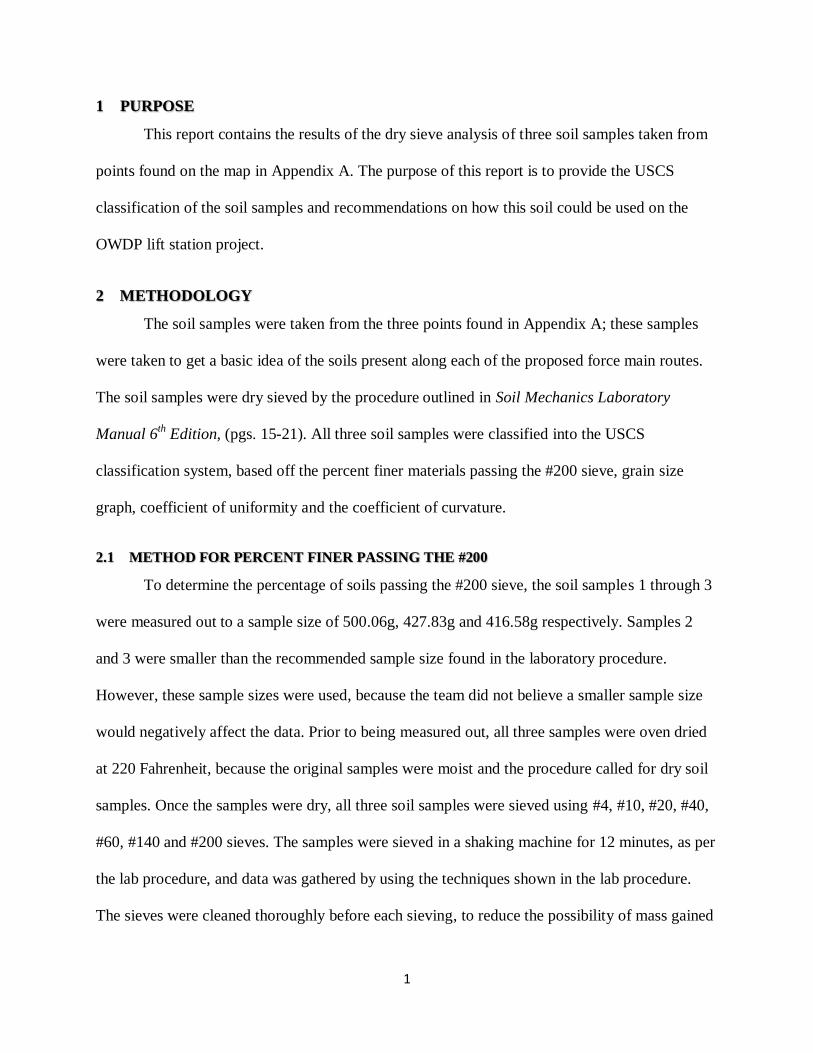
1 PURPOSE
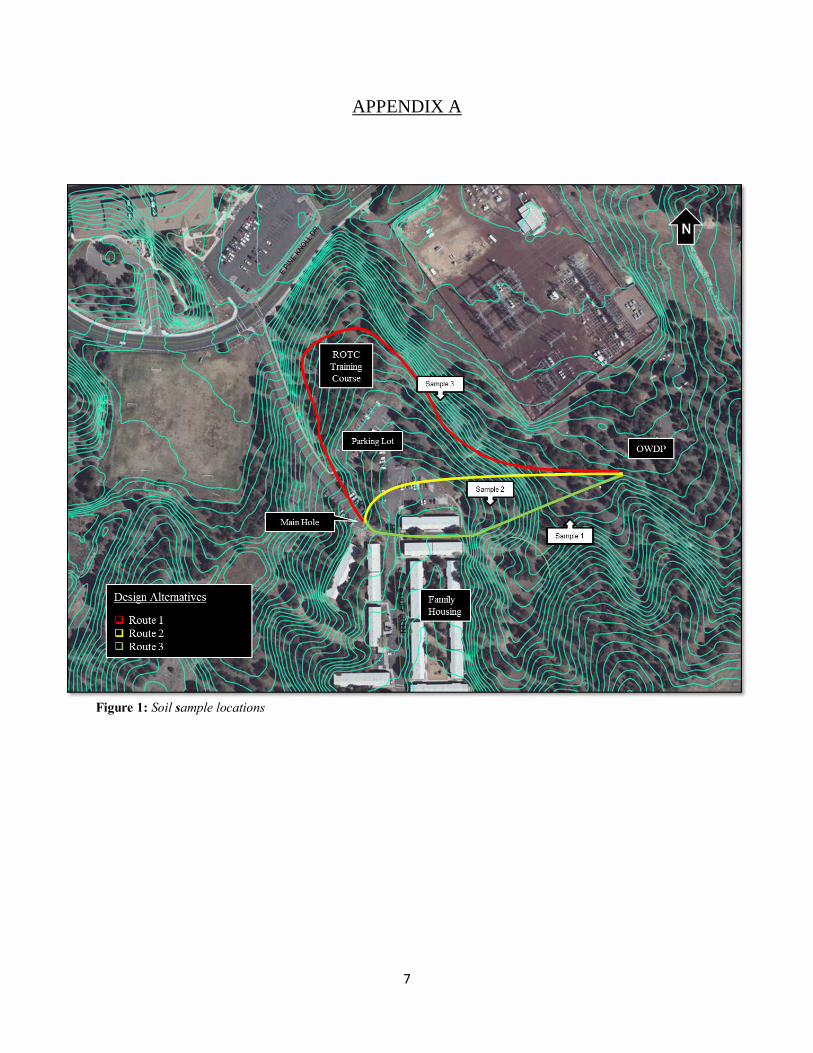
This report contains the results of the dry sieve analysis of three soil samples taken from
points found on the map in Appendix A. The purpose of this report is to provide the USCS
classification of the soil samples and recommendations on how this soil could be used on the
OWDP lift station project.
2 METHODOLOGY
The soil samples were taken from the three points found in Appendix A; these samples
were taken to get a basic idea of the soils present along each of the proposed force main routes.
The soil samples were dry sieved by the procedure outlined in Soil Mechanics Laboratory
Manual 6th Edition, (pgs. 15-21). All three soil samples were classified into the USCS
classification system, based off the percent finer materials passing the #200 sieve, grain size
graph, coefficient of uniformity and the coefficient of curvature.
2.1 METHOD FOR PERCENT FINER PASSING THE #200
To determine the percentage of soils passing the #200 sieve, the soil samples 1 through 3
were measured out to a sample size of 500.06g, 427.83g and 416.58g respectively. Samples 2
and 3 were smaller than the recommended sample size found in the laboratory procedure.
However, these sample sizes were used, because the team did not believe a smaller sample size
would negatively affect the data. Prior to being measured out, all three samples were oven dried
at 220 Fahrenheit, because the original samples were moist and the procedure called for dry soil
samples. Once the samples were dry, all three soil samples were sieved using #4, #10, #20, #40,
#60, #140 and #200 sieves. The samples were sieved in a shaking machine for 12 minutes, as per
the lab procedure, and data was gathered by using the techniques shown in the lab procedure.
The sieves were cleaned thoroughly before each sieving, to reduce the possibility of mass gained
2
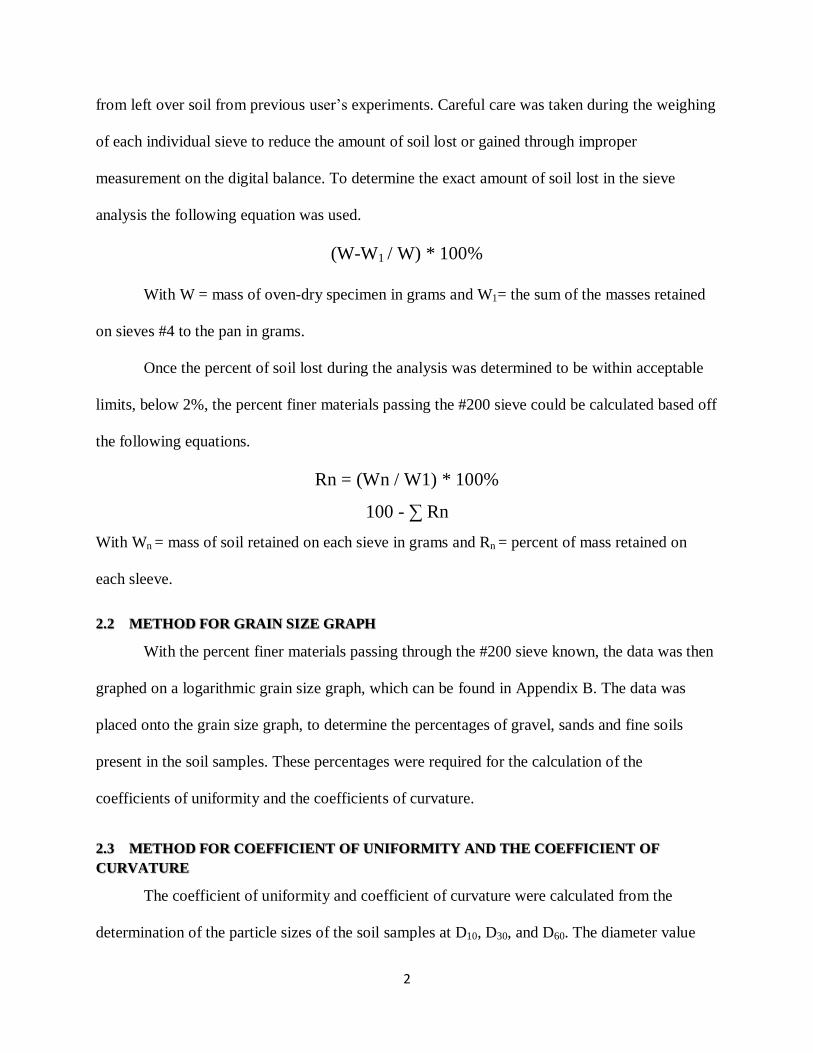
from left over soil from previous user’s experiments. Careful care was taken during the weighing
of each individual sieve to reduce the amount of soil lost or gained through improper
measurement on the digital balance. To determine the exact amount of soil lost in the sieve
analysis the following equation was used.
(W-W1 / W) * 100%
With W = mass of oven-dry specimen in grams and W1= the sum of the masses retained
on sieves #4 to the pan in grams.
Once the percent of soil lost during the analysis was determined to be within acceptable
limits, below 2%, the percent finer materials passing the #200 sieve could be calculated based off
the following equations.
Rn = (Wn / W1) * 100%
100 - ∑ Rn
With Wn = mass of soil retained on each sieve in grams and Rn = percent of mass retained on
each sleeve.
2.2 METHOD FOR GRAIN SIZE GRAPH
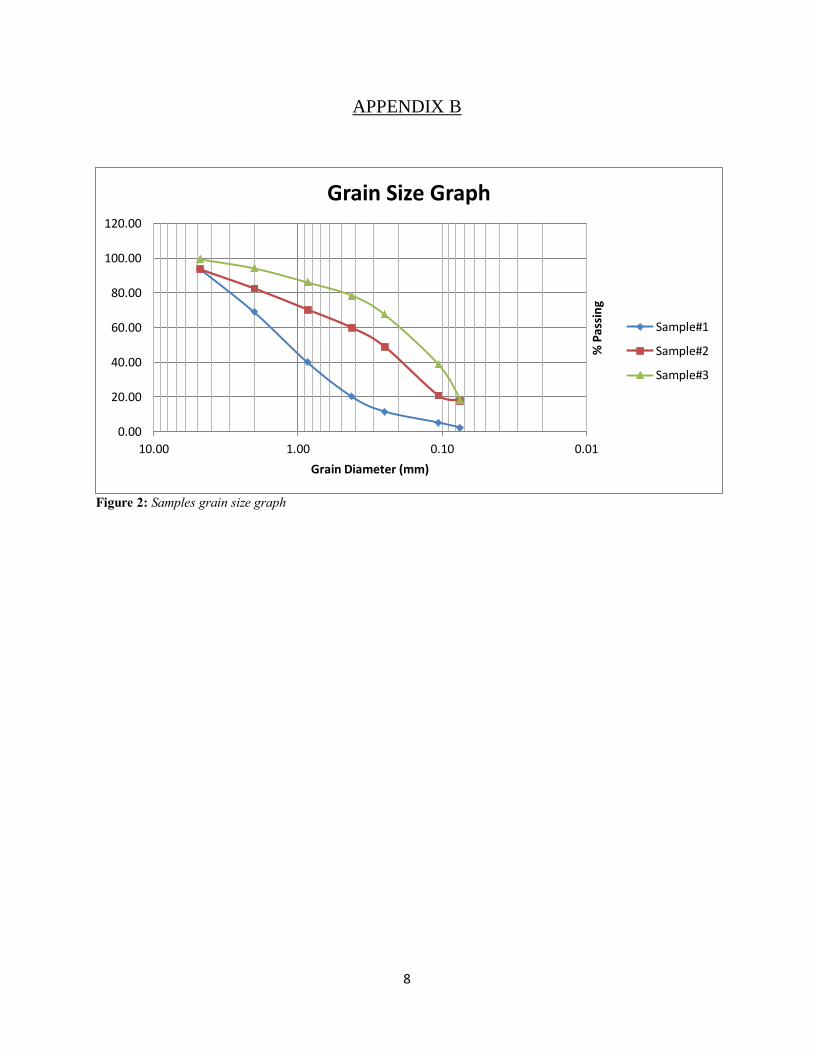
With the percent finer materials passing through the #200 sieve known, the data was then
graphed on a logarithmic grain size graph, which can be found in Appendix B. The data was
placed onto the grain size graph, to determine the percentages of gravel, sands and fine soils
present in the soil samples. These percentages were required for the calculation of the
coefficients of uniformity and the coefficients of curvature.
2.3 METHOD FOR COEFFICIENT OF UNIFORMITY AND THE COEFFICIENT OF
CURVATURE
The coefficient of uniformity and coefficient of curvature were calculated from the
determination of the particle sizes of the soil samples at D10, D30, and D60. The diameter value
3
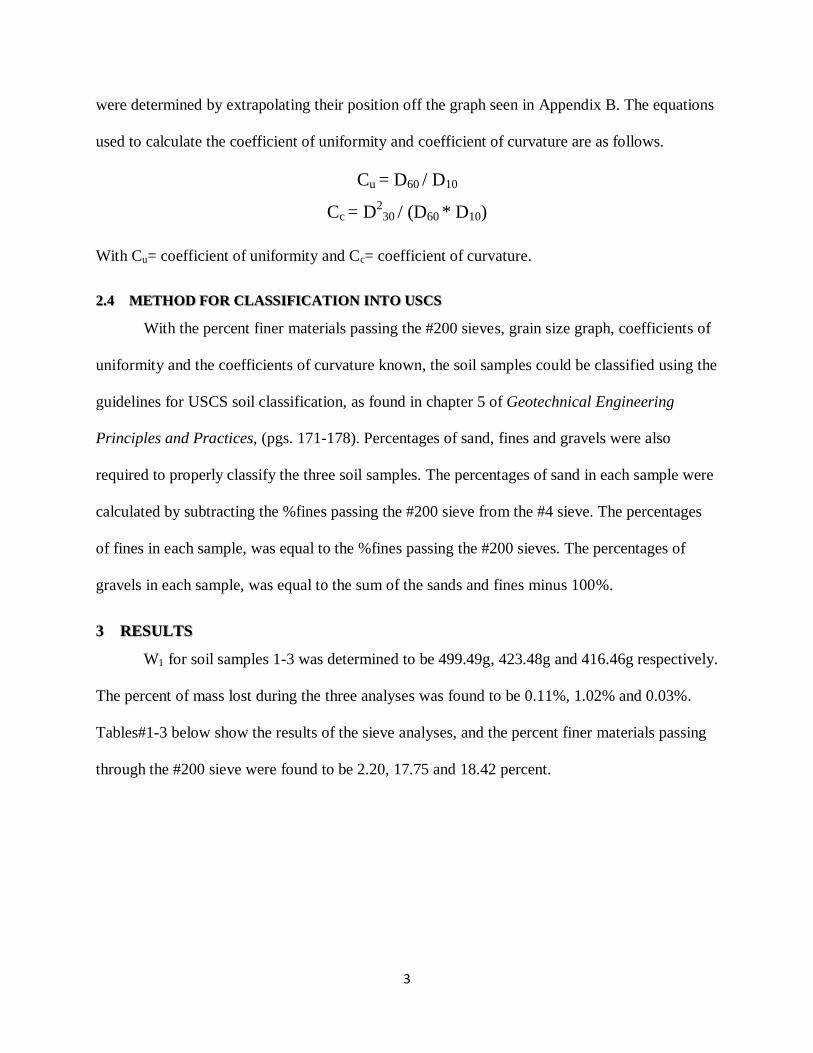
were determined by extrapolating their position off the graph seen in Appendix B. The equations
used to calculate the coefficient of uniformity and coefficient of curvature are as follows.
Cu = D60 / D10
Cc = D2
30 / (D60 * D10)
With Cu= coefficient of uniformity and Cc= coefficient of curvature.
2.4 METHOD FOR CLASSIFICATION INTO USCS
With the percent finer materials passing the #200 sieves, grain size graph, coefficients of
uniformity and the coefficients of curvature known, the soil samples could be classified using the
guidelines for USCS soil classification, as found in chapter 5 of Geotechnical Engineering
Principles and Practices, (pgs. 171-178). Percentages of sand, fines and gravels were also
required to properly classify the three soil samples. The percentages of sand in each sample were
calculated by subtracting the %fines passing the #200 sieve from the #4 sieve. The percentages
of fines in each sample, was equal to the %fines passing the #200 sieves. The percentages of
gravels in each sample, was equal to the sum of the sands and fines minus 100%.
3 RESULTS
W1 for soil samples 1-3 was determined to be 499.49g, 423.48g and 416.46g respectively.
The percent of mass lost during the three analyses was found to be 0.11%, 1.02% and 0.03%.
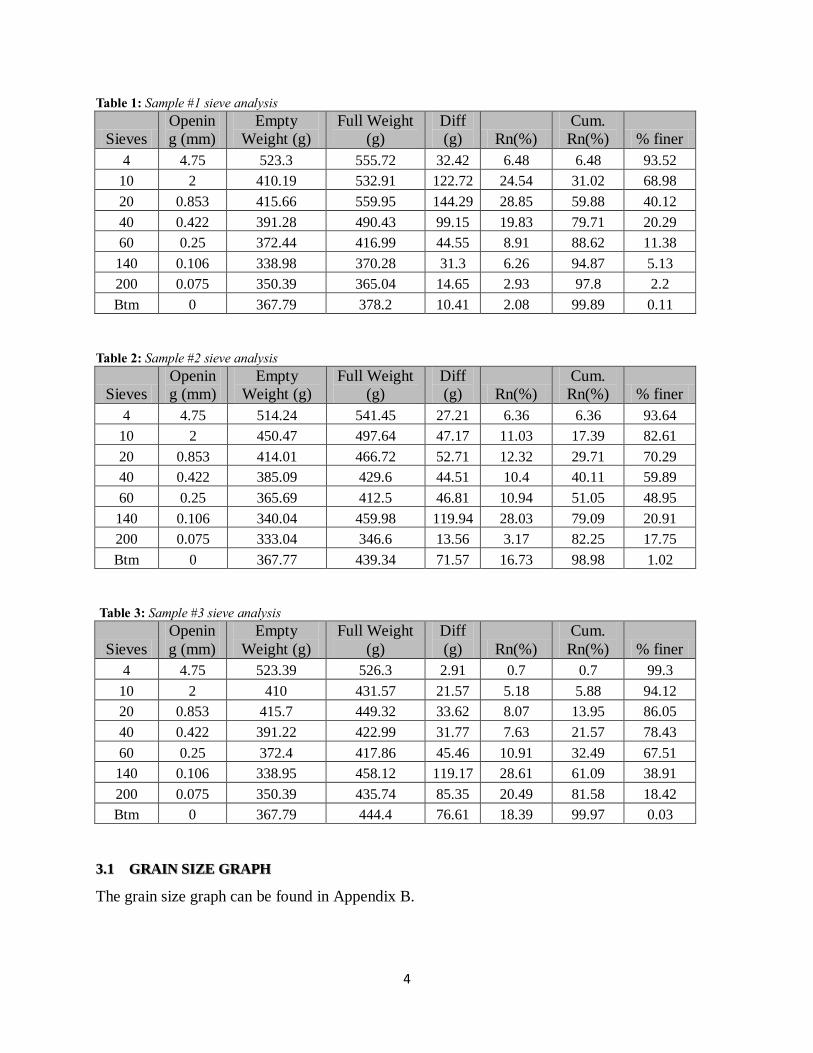
Tables#1-3 below show the results of the sieve analyses, and the percent finer materials passing
through the #200 sieve were found to be 2.20, 17.75 and 18.42 percent.
4
Table 1: Sample #1 sieve analysis
Sieves
Openin
g (mm)
Empty
Weight (g)
Full Weight
(g)
Diff
(g) Rn(%)
Cum.
Rn(%) % finer
4 4.75 523.3 555.72 32.42 6.48 6.48 93.52
10 2 410.19 532.91 122.72 24.54 31.02 68.98
20 0.853 415.66 559.95 144.29 28.85 59.88 40.12
40 0.422 391.28 490.43 99.15 19.83 79.71 20.29
60 0.25 372.44 416.99 44.55 8.91 88.62 11.38
140 0.106 338.98 370.28 31.3 6.26 94.87 5.13
200 0.075 350.39 365.04 14.65 2.93 97.8 2.2
Btm 0 367.79 378.2 10.41 2.08 99.89 0.11
Table 2: Sample #2 sieve analysis
Sieves
Openin
g (mm)
Empty
Weight (g)
Full Weight
(g)
Diff
(g) Rn(%)
Cum.
Rn(%) % finer
4 4.75 514.24 541.45 27.21 6.36 6.36 93.64
10 2 450.47 497.64 47.17 11.03 17.39 82.61
20 0.853 414.01 466.72 52.71 12.32 29.71 70.29
40 0.422 385.09 429.6 44.51 10.4 40.11 59.89
60 0.25 365.69 412.5 46.81 10.94 51.05 48.95
140 0.106 340.04 459.98 119.94 28.03 79.09 20.91
200 0.075 333.04 346.6 13.56 3.17 82.25 17.75
Btm 0 367.77 439.34 71.57 16.73 98.98 1.02
Table 3: Sample #3 sieve analysis
Sieves
Openin
g (mm)
Empty
Weight (g)
Full Weight
(g)
Diff
(g) Rn(%)
Cum.
Rn(%) % finer
4 4.75 523.39 526.3 2.91 0.7 0.7 99.3
10 2 410 431.57 21.57 5.18 5.88 94.12
20 0.853 415.7 449.32 33.62 8.07 13.95 86.05
40 0.422 391.22 422.99 31.77 7.63 21.57 78.43
60 0.25 372.4 417.86 45.46 10.91 32.49 67.51
140 0.106 338.95 458.12 119.17 28.61 61.09 38.91
200 0.075 350.39 435.74 85.35 20.49 81.58 18.42
Btm 0 367.79 444.4 76.61 18.39 99.97 0.03
3.1 GRAIN SIZE GRAPH
The grain size graph can be found in Appendix B.
6
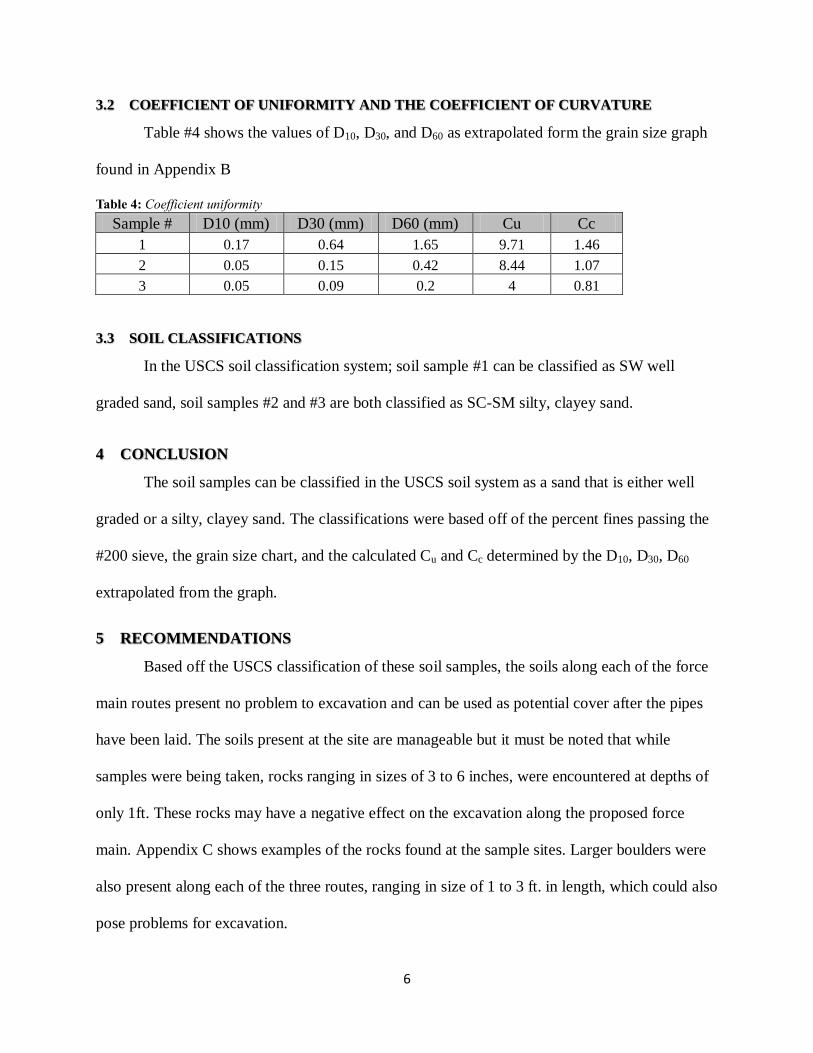
3.2 COEFFICIENT OF UNIFORMITY AND THE COEFFICIENT OF CURVATURE
Table #4 shows the values of D10, D30, and D60 as extrapolated form the grain size graph
found in Appendix B
Table 4: Coefficient uniformity
Sample # D10 (mm) D30 (mm) D60 (mm) Cu Cc
1 0.17 0.64 1.65 9.71 1.46
2 0.05 0.15 0.42 8.44 1.07
3 0.05 0.09 0.2 4 0.81
3.3 SOIL CLASSIFICATIONS
In the USCS soil classification system; soil sample #1 can be classified as SW well
graded sand, soil samples #2 and #3 are both classified as SC-SM silty, clayey sand.
4 CONCLUSION
The soil samples can be classified in the USCS soil system as a sand that is either well
graded or a silty, clayey sand. The classifications were based off of the percent fines passing the
#200 sieve, the grain size chart, and the calculated Cu and Cc determined by the D10, D30, D60
extrapolated from the graph.
5 RECOMMENDATIONS
Based off the USCS classification of these soil samples, the soils along each of the force
main routes present no problem to excavation and can be used as potential cover after the pipes
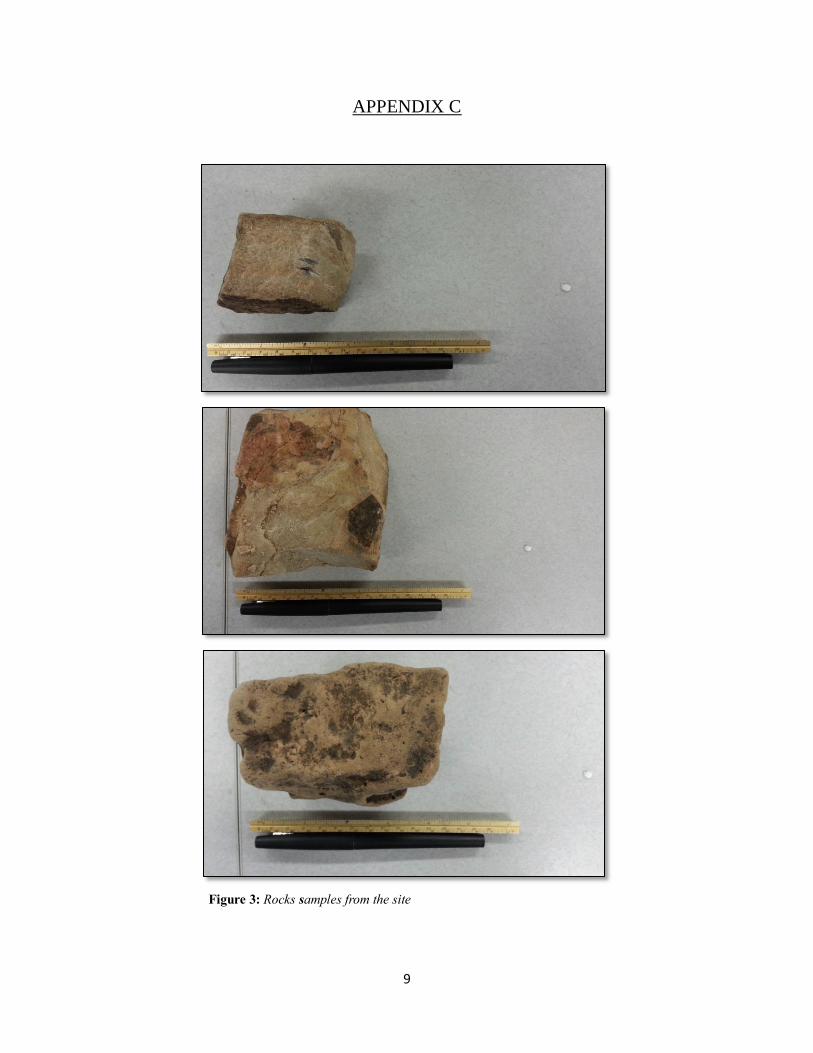
have been laid. The soils present at the site are manageable but it must be noted that while
samples were being taken, rocks ranging in sizes of 3 to 6 inches, were encountered at depths of
only 1ft. These rocks may have a negative effect on the excavation along the proposed force
main. Appendix C shows examples of the rocks found at the sample sites. Larger boulders were
also present along each of the three routes, ranging in size of 1 to 3 ft. in length, which could also
pose problems for excavation.
REFERENCES
Coduto. P. Donald, Kitch. A. William, Yeung. Man-chu. Geotechnical Engineering Principles
and Practices, Second Edition, Pearson Publishing
Das. M. Braja. 2002. Soil Mechanics Laboratory Manual. 6th Edition. Oxford University Press.
7
APPENDIX A
Figure 1: Soil sample locations
8
APPENDIX B
Figure 2: Samples grain size graph
0.00
20.00
40.00
60.00
80.00
100.00
120.00
0.010.101.0010.00
% P
assi
ng
Grain Diameter (mm)
Grain Size Graph
Sample#1
Sample#2
Sample#3
9
APPENDIX C
Figure 3: Rocks samples from the site

This page intentionally left blank