Embed Size (px)
Citation preview

GeotechnicalEngineeringResearchLaboratory EdwardL.Hajduk,D.Eng,PEOneUniversityAvenue LecturerLowell,Massachusetts01854 PA105DTel:(978)934‐2621 Fax:(978)934‐3052e‐mail: [email protected]:http://faculty.uml.edu/ehajduk
DEPARTMENTOFCIVILANDENVIRONMENTALENGINEERING
14.330 2013 Assignment 2 Solution Page 1 of 10
14.330 SOIL MECHANICS Assignment #2: Soil Classification Solution.
PROBLEM #1 (60 Points): GIVEN: Table 1. Soil Index Testing Summary.
Sample D422 D4318
Sieve Number
% Retained LL PL
1
10 0.1
NA NA
30 0.7
40 0.9
60 8.3
100 57.2
120 17.5
200 11.9
Pan 3.1
2
10 0.0
21 15
30 1.2
40 2.0
60 22.7
100 35.2
120 5.7
200 14.6
Pan 18.4
3
10 0.0
54 31
30 0.4
40 1.2
60 19.4
100 47.9
120 6.4
200 14.9
Pan 9.8
REQUIRED: Determine USCS and AASHTO soil classifications for each soil sample.

14.330 2013 Assignment 2 Solution Page 2 of 10
SOLUTION: USCS Classification: Plot grain size distribution for all soils and determine D60, D30, and D10 when necessary for Soil Samples #1, #2, and #3.
Figure A. Grain Size Distributions and D60, D30, and D10 for Samples #1, #2, and #3. Calculate Cc and Cu using information in Figure A for Samples #1 and #3 and the equations shown below. See Table A for summary of Cu and Cc calculations.
Coefficient of Uniformity = Cu = D60
D10
Coefficient of Curvature (a.k.a. Gradation) = Cc = (D30 )2
(D60xD10 )

14.330 2013 Assignment 2 Solution Page 3 of 10
Table A. Summary of Cu and Cc calculations.
Parameter Sample #1 Sample #3
D60 (mm) 0.172 0.208
D30 (mm) 0.15 0.147
D10 (mm) 0.106 0.076
Cc 1.62 2.74
Cu 1.23 1.37
Knowing that PI = LL-PL, LL vs. PI was plotted for Samples #2 and #3 on Figure B.
Figure B. Atterberg Limits Test Results Plotted on Casagrande’s Chart.
Since each soil sample has a % Passing a #200 sieve < 50%, use Figure 3 of ASTM D2487 to classify soil. See Figures C thru E for soil classification using ASTM D2487 Figure 3 for Soil Samples #1 thru 3, respectively.

14.330 2013 Assignment 2 Solution Page 4 of 10
Figure C. USCS Soil Classification of Sample #1 (using Figure 3 of ASTM D2487).
Figure D. USCS Soil Classification of Sample #2 (using Figure 3 of ASTM D2487).
SC-SM- Silty, Clayey Sand
SP - Poorly Graded Sand
Cu = 1.23
No Gravel
No Gravel
FC = 18%
FC = 3%

14.330 2013 Assignment 2 Solution Page 5 of 10
Figure E. USCS Soil Classification of Sample #3 (using Figure 3 of ASTM D2487). AASHTO Classification: Use Table 2 from ASTM D3282. Determine % Passing #10, #40, and #200 sieves (see Figure A for grain size distribution plots). See Figure F for soil classification using ASTM D3282 Table 2 for Samples #1 thru 3.
Figure F. AASHTO Soil Classification of Sample #1, #2, and #3 (using Table 2 of ASTM D3282).
TABLE 2 Classification of Soils and Soil-Aggregate Mixtures
General ClassificationGranular Materials
(35 % or less passing No. 200 (75 µm))Silt-Clay Materials
(More than 35 % passing No. 200 (75 µm))
Group classification
A-1
A-3
A-2
A-4 A-5 A-6
A-7
A-1-a A-1-b A-2-4 A-2-5 A-2-6 A-2-7A-7-5,A-7-6
Sieve analysis, % passing:No. 10 (2.00 mm) 50 max ... ... ... ... ... ... ... ... ... ...No. 40 (425 µm) 30 max 50 max 51 min ... ... ... ... ... ... ... ...No. 200 (75 µm) 15 max 25 max 10 max 35 max 35 max 35 max 35 max 36 min 36 min 36 min 36 min
Characteristics of fraction passingNo. 40 (425 µm):
Liquid limitPlasticity index
...6 max
...N.P.
40 max10 max
41 min10 max
40 max11 min
41 min11 min
40 max10 max
41 min10 max
40 max11 min
41 min11 minA
Usual types of significant consti-tuent materials
Stone Fragments,Gravel and Sand
FineSand
Silty or Clayey Gravel and Sand Silty Soils Clayey Soils
General rating as subgrade Excellent to Good Fair to Poor
APlasticity index of A-7-5 subgroup is equal to or less than LL minus 30. Plasticity index of A-7-6 subgroup is greater than LL minus 30 (see Fig. 1).Reprinted with permission of American Association of State Highway and Transportation Officials.
Cu = 1.37 MH SP-SM - Poorly
Graded Sand with Silt
No Gravel
FC = 10%
Sample #3Sample #1
Sample #2

14.330 2013 Assignment 2 Solution Page 6 of 10
Problem #1 Summary:
Sample Soil Classification
USCS Group Symbol & Name AASHTO
#1 (SP) Poorly Graded Sand A-3
#2 (SC-SM) Silty, Clayey Sand A-2-4
#3 (SP-SM) Poorly Graded Sand with Silt A-2-7
PROBLEM #2 (40 Points): GIVEN:
Figure 1. Mechanical Sieve and Hydrometer Results for Problem #2.
Table 3. Atterberg Limits (ASTM D4318) for Problem #2.
Soil LL PL
#1 61 31
#2 NA NA
#3 37 10
Soil #2
Soil #3
Soil #1

14.330 2013 Assignment 2 Solution Page 7 of 10
REQUIRED: Classify the soils in accordance with the Unified Soil Classification System (USCS) and AASHTO. USCS Classification: Calculate % Gravel, % Sand, and % Fines from Figure 1. A summary of these percentages is provided in Table B. Table B. Summary of % Gravel, % Sand, and % Fines from Figure 1.
Soil % Gravel % Sand % Fines Soil
1 0 0 100 Fine Grained
2 2 98 0 Coarse Grained
3 0 50 50 Fine Grained
Knowing that PI = LL-PL, PI vs. LL was plotted for Soils #1 and #2 on Figure G.
Figure G. Atterberg Limits Test Results Plotted on Casagrande’s Chart. Therefore, use Figure 1 from ASTM D2487 for Soils #1 and #3 and Figure 3 from ASTM D2487 for Soil #2 to classify the soils. See Figures H thru J for soil classification using ASTM D2487 Figures for Soils #1 thru #3, respectively.

14.330 2013 Assignment 2 Solution Page 8 of 10
Figure H. USCS Soil Classification of Soil #1 (using Figure 1 of ASTM D2487).
For Soil #2 (Using Figure 3, ASTM D2487):
10
60u
1060
230
c D
DC;
)DD(
)D(C
Soil D10
(mm) D30
(mm) D60
(mm) Cc Cu
#2 0.32 0.58 0.85 1.1 2.7
CH – Fat Clay
LL = 61
0% Plus #200
14.330 2013 Assignment 2 Solution Page 9 of 10
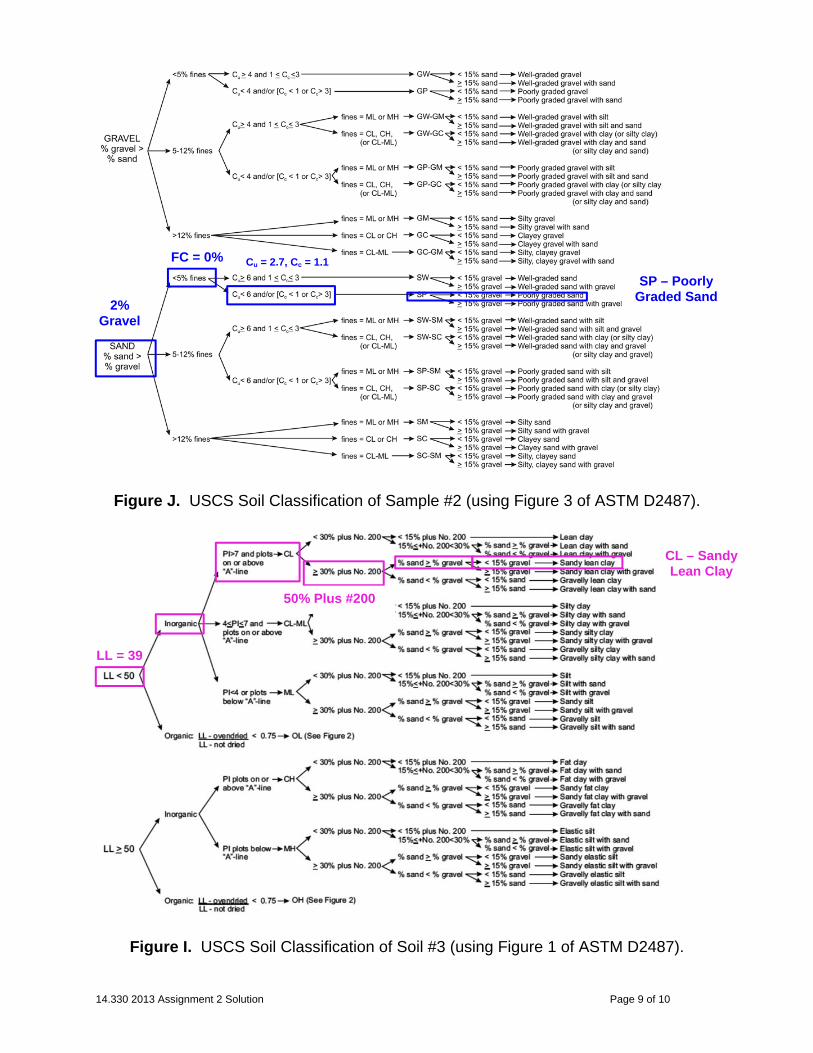
Figure J. USCS Soil Classification of Sample #2 (using Figure 3 of ASTM D2487).
Figure I. USCS Soil Classification of Soil #3 (using Figure 1 of ASTM D2487).
CL – Sandy Lean Clay
LL = 39
50% Plus #200
SP – Poorly Graded Sand
2% Gravel
FC = 0% Cu = 2.7, Cc = 1.1

14.330 2013 Assignment 2 Solution Page 10 of 10
AASHTO Classification: Use Table 2 from ASTM D3282. Determine % Passing #10, #40, and #200 sieves (see Figure 1 for grain size distribution plots). See Figure K for soil classification using ASTM D3282 Table 2 for Soils #1 thru 3.
Figure K. AASHTO Soil Classification of Soils #1, #2, and #3 (using Table 2 of ASTM
14.332D3282). Problem #2 Summary:
Sample Soil Classification
USCS Group Symbol & Name AASHTO
#1 (CH) Fat Clay A-7 (Acceptable)
A-7-5
#2 (SP) Poorly Graded Sand A-1-b
#3 (CL) Sandy Lean Clay A-6
EXTRA CREDIT (+5 Points): Which discipline of civil engineering you would like to work in when you graduate? Write a paragraph or two why you have selected this discipline. Use Guest Lecture assignment guidelines. Self-explanatory.
Soil #2 Soil #3
Soil #1