Embed Size (px)
Citation preview

Confidential. © 2021 IHS Markit®. All rights reserved.
01-February 2021
Darryl Rogers, Vice President, [email protected] +1 832 679 7265
IHS Markit – Midstream & NGL Markets
U.S. Propane Market – Status and Expectations
Confidential. © 2021 IHS Markit®. All rights reserved.
Copyright notice and disclaimer
© 2021 IHS Markit. All rights reserved. For IHS Markit clients’ use only.
These webinar slides are subject to IHS Markit copyright and are being provided to IHS Markit
clients only. You are free to redistribute the slides internally within your organization in the form as
made available by IHS Markit provided that all IHS Markit legal notices and markings are displayed.
You are not permitted to reproduce, reuse, or otherwise redistribute the slides or any portion of this
presentation to anyone outside of your organization without prior written consent of IHS Markit.
This presentation is not to be construed as legal or financial advice, use of or reliance on any
content is entirely at your own risk, and to the extent permitted by law, IHS Markit shall not be liable
for any errors or omissions or any loss, damage, or expense incurred by you or your organization.
2
Confidential. © 2021 IHS Markit®. All rights reserved.
Agenda
3
Market backdrop – U.S. and international views
Current weekly forecast and outlook – U.S. exports, U.S. to Asia arbitrage pricing
Year over year U.S. propane market fundamental changes
Implication to days of forward supply and pricing
Closing and thanks
Confidential. © 2021 IHS Markit®. All rights reserved.
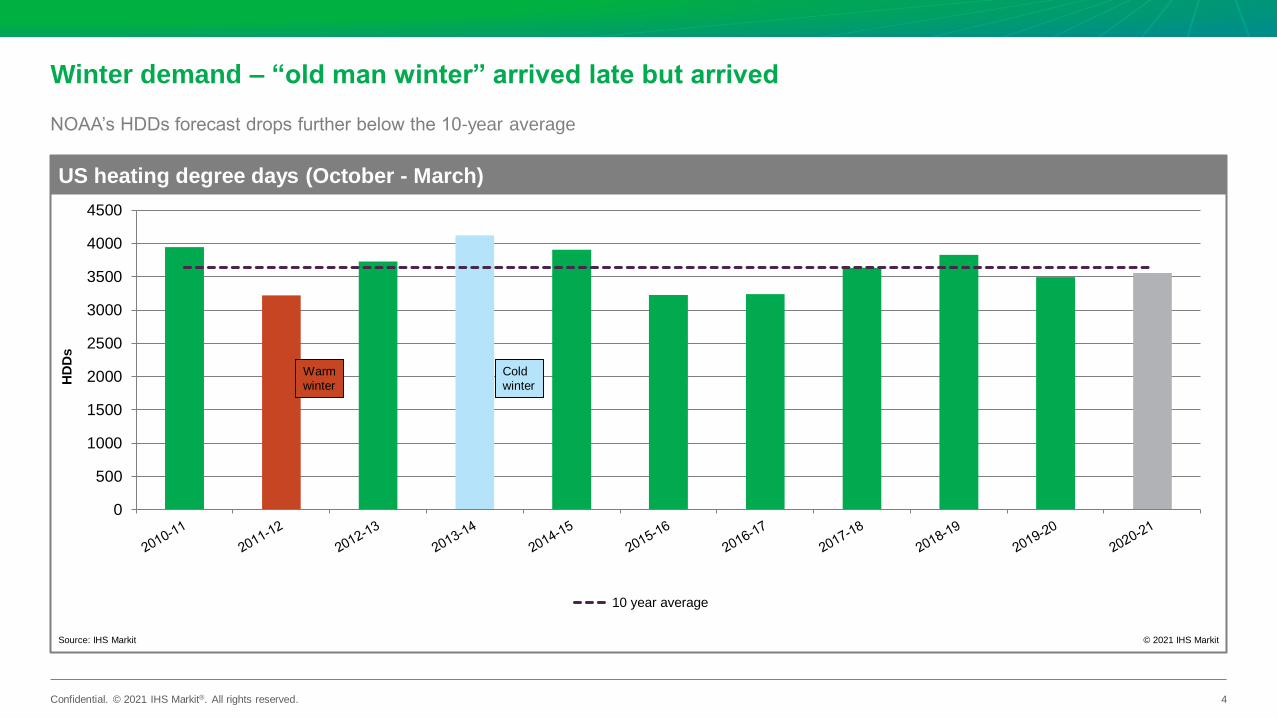
Winter demand – “old man winter” arrived late but arrived
0
500
1000
1500
2000
2500
3000
3500
4000
4500
10 year average
US heating degree days (October - March)
Source: IHS Markit © 2021 IHS Markit
HD
Ds
4
NOAA’s HDDs forecast drops further below the 10-year average
Warm
winter
Cold
winter

Confidential. © 2021 IHS Markit®. All rights reserved.
Mainland China LPG supply and demand – incremental demand requirements mainly being
met by the U.S.
5
0
1
2
3
4
5
6
7
Jan-17 Jul-17 Jan-18 Jul-18 Jan-19 Jul-19 Jan-20 Jul-20 Jan-21 Jul-21 Jan-22 Jul-22
Gas processing Refineries Net imports
Mainland China LPG supply
Source: IHS Markit © 2021 IHS Markit
Mil
lio
n m
etr
ic t
on
s
0
1
2
3
4
5
6
7
Jan-17 Jul-17 Jan-18 Jul-18 Jan-19 Jul-19 Jan-20 Jul-20 Jan-21 Jul-21 Jan-22 Jul-22
Residential and commercial Industrial Engine fuel Chemical Other demand
Mainland China LPG demand
Source: IHS Markit © 2021 IHS Markit
Mil
lio
n m
etr
ic t
on
s
0
500
1000
1500
2000
2500
Jan-17 Jul-17 Jan-18 Jul-18 Jan-19 Jul-19 Jan-20 Jul-20
Others Middle East (Kuwait, Qatar, Saudi, UAE, Oman) US
Mainland China LPG Imports
Source: IHS Markit Global Trade Atlas, Argus © 2021 IHS Markit
Th
ou
sand
metr
ic to
ns
Confidential. © 2021 IHS Markit®. All rights reserved.
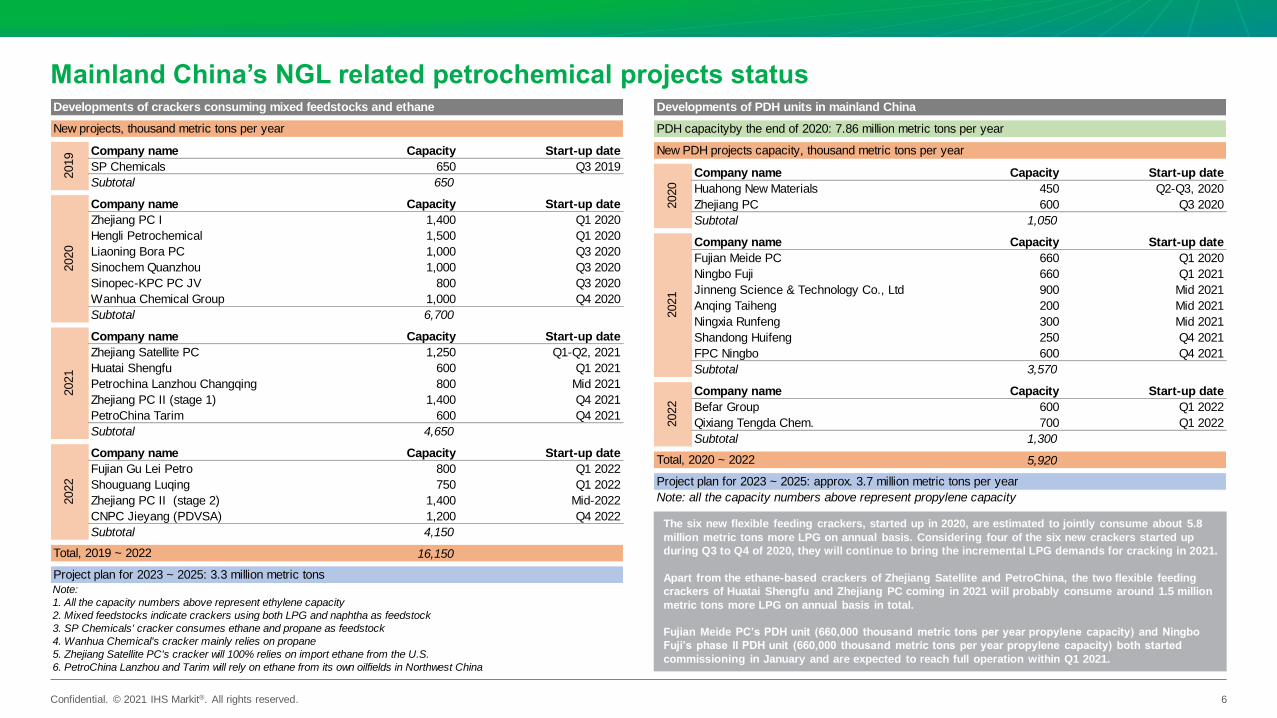
Mainland China’s NGL related petrochemical projects status
6
The six new flexible feeding crackers, started up in 2020, are estimated to jointly consume about 5.8
million metric tons more LPG on annual basis. Considering four of the six new crackers started up
during Q3 to Q4 of 2020, they will continue to bring the incremental LPG demands for cracking in 2021.
Apart from the ethane-based crackers of Zhejiang Satellite and PetroChina, the two flexible feeding
crackers of Huatai Shengfu and Zhejiang PC coming in 2021 will probably consume around 1.5 million
metric tons more LPG on annual basis in total.
Fujian Meide PC’s PDH unit (660,000 thousand metric tons per year propylene capacity) and Ningbo
Fuji’s phase II PDH unit (660,000 thousand metric tons per year propylene capacity) both started
commissioning in January and are expected to reach full operation within Q1 2021.
Company name Capacity Start-up date
SP Chemicals 650 Q3 2019
Subtotal 650
Company name Capacity Start-up date
Zhejiang PC I 1,400 Q1 2020
Hengli Petrochemical 1,500 Q1 2020
Liaoning Bora PC 1,000 Q3 2020
Sinochem Quanzhou 1,000 Q3 2020
Sinopec-KPC PC JV 800 Q3 2020
Wanhua Chemical Group 1,000 Q4 2020
Subtotal 6,700
Company name Capacity Start-up date
Zhejiang Satellite PC 1,250 Q1-Q2, 2021
Huatai Shengfu 600 Q1 2021
Petrochina Lanzhou Changqing 800 Mid 2021
Zhejiang PC II (stage 1) 1,400 Q4 2021
PetroChina Tarim 600 Q4 2021
Subtotal 4,650
Company name Capacity Start-up date
Fujian Gu Lei Petro 800 Q1 2022
Shouguang Luqing 750 Q1 2022
Zhejiang PC II (stage 2) 1,400 Mid-2022
CNPC Jieyang (PDVSA) 1,200 Q4 2022
Subtotal 4,150
16,150
6. PetroChina Lanzhou and Tarim will rely on ethane from its own oilfields in Northwest China
2022
5. Zhejiang Satellite PC's cracker will 100% relies on import ethane from the U.S.
4. Wanhua Chemical's cracker mainly relies on propane
Total, 2019 ~ 2022
Note:
Project plan for 2023 ~ 2025: 3.3 million metric tons
1. All the capacity numbers above represent ethylene capacity
2. Mixed feedstocks indicate crackers using both LPG and naphtha as feedstock
3. SP Chemicals' cracker consumes ethane and propane as feedstock
2019
2020
2021
Developments of crackers consuming mixed feedstocks and ethane
New projects, thousand metric tons per year
Company name Capacity Start-up date
Huahong New Materials 450 Q2-Q3, 2020
Zhejiang PC 600 Q3 2020
Subtotal 1,050
Company name Capacity Start-up date
Fujian Meide PC 660 Q1 2020
Ningbo Fuji 660 Q1 2021
Jinneng Science & Technology Co., Ltd 900 Mid 2021
Anqing Taiheng 200 Mid 2021
Ningxia Runfeng 300 Mid 2021
Shandong Huifeng 250 Q4 2021
FPC Ningbo 600 Q4 2021
Subtotal 3,570
Company name Capacity Start-up date
Befar Group 600 Q1 2022
Qixiang Tengda Chem. 700 Q1 2022
Subtotal 1,300
5,920
2022
Project plan for 2023 ~ 2025: approx. 3.7 million metric tons per year
Note: all the capacity numbers above represent propylene capacity
Developments of PDH units in mainland China
New PDH projects capacity, thousand metric tons per year
2020
2021
Total, 2020 ~ 2022
PDH capacityby the end of 2020: 7.86 million metric tons per year
Confidential. © 2021 IHS Markit®. All rights reserved.
0
5
10
15
20
25
30
35
40
45
50
55
60
0
10
20
30
40
50
60
70
80
90
100
110
120
7-A
ug-1
7
7-S
ep-1
7
7-O
ct-
17
7-N
ov-1
7
7-D
ec-1
7
7-J
an
-18
7-F
eb
-18
7-M
ar-
18
7-A
pr-
18
7-M
ay-1
8
7-J
un
-18
7-J
ul-
18
7-A
ug-1
8
7-S
ep-1
8
7-O
ct-
18
7-N
ov-1
8
7-D
ec-1
8
7-J
an
-19
7-F
eb
-19
7-M
ar-
19
7-A
pr-
19
7-M
ay-1
9
7-J
un
-19
7-J
ul-
19
7-A
ug-1
9
7-S
ep-1
9
7-O
ct-
19
7-N
ov-1
9
7-D
ec-1
9
7-J
an
-20
7-F
eb
-20
7-M
ar-
20
7-A
pr-
20
7-M
ay-2
0
7-J
un
-20
7-J
ul-
20
7-A
ug-2
0
7-S
ep-2
0
7-O
ct-
20
7-N
ov-2
0
7-D
ec-2
0
7-J
an
-21
Da
ys
Purity propane (left axis) U.S. propane/propylene days of forward supply (right axis)
Daily Mont Belvieu propane price and weekly propane/propylene inventory
Source: IHS Markit © 2021 IHS Markit
cp
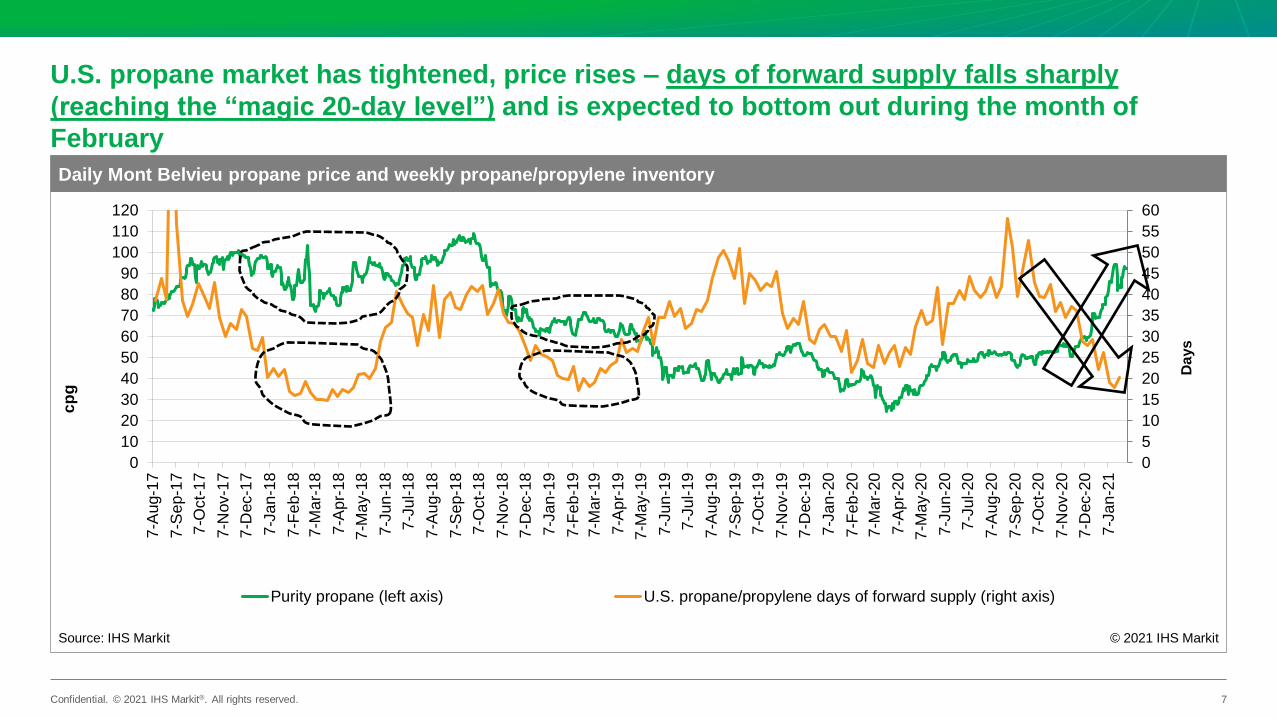
gU.S. propane market has tightened, price rises – days of forward supply falls sharply
(reaching the “magic 20-day level”) and is expected to bottom out during the month of
February
7

Confidential. © 2021 IHS Markit®. All rights reserved.
Current U.S. propane market weekly forecast – relatively flat supply and increasing demand
led by strong exports eroded inventory at a relatively high rate
8
Week ending 25-Dec 1-Jan 8-Jan 15-Jan 22-Jan 29-Jan 5-Feb 12-Feb 19-Feb
Supply (thousand b/d) 2,467 2,438 2,489 2,469 2,513 2,532 2,510 2,477 2,459
Production 2,329 2,257 2,340 2,295 2,356 2,368 2,321 2,315 2,301
Natural gas* 1,689 1,708 1,707 1,712 1,712 1,712 1,712 1,712 1,722
Refinery* 640 550 634 584 644 656 610 603 579
Imports 138 181 149 174 157 164 188 162 158
Demand (thousand b/d) 3,389 2,777 3,451 3,359 3,121 3,175 2,903 2,943 2,848
Product supplied 1,755 1,702 2,104 1,879 1,771 1,825 1,628 1,668 1,573
Residential and commercial, plus other* 1,086 1,036 1,433 1,215 1,116 1,165 986 1,028 933
Cracking plus PDH* 324 320 325 318 309 314 296 294 294
Propylene* 346 346 346 346 346 346 346 346 346
Exports 1,634 1,075 1,347 1,480 1,350 1,350 1,275 1,275 1,275
Stock change (thousand bbl) -6,450 -2,369 -6,729 -6,230 -4,255 -4,503 -2,753 -3,262 -2,723
Ending stocks (thousand bbl) 75,146 72,777 66,048 59,818 55,563 51,060 48,307 45,045 42,322
Days of supply/disposition 28 25 23 20 18 16 16 15 14
Source: IHS Markit, EIA
© 2021 IHS Markit
Propane/propylene supply and demandRealized Forecast
Note: Other includes the balancing item. PDH = propane dehydrogenation. *IHS Markit internal subcomponent estimates, not reported weekly by the EIA and not included in realized supply and demand totals.
IHS Markit-NPGA Propane Market
Weekly report – released every
Tuesday
Confidential. © 2021 IHS Markit®. All rights reserved.
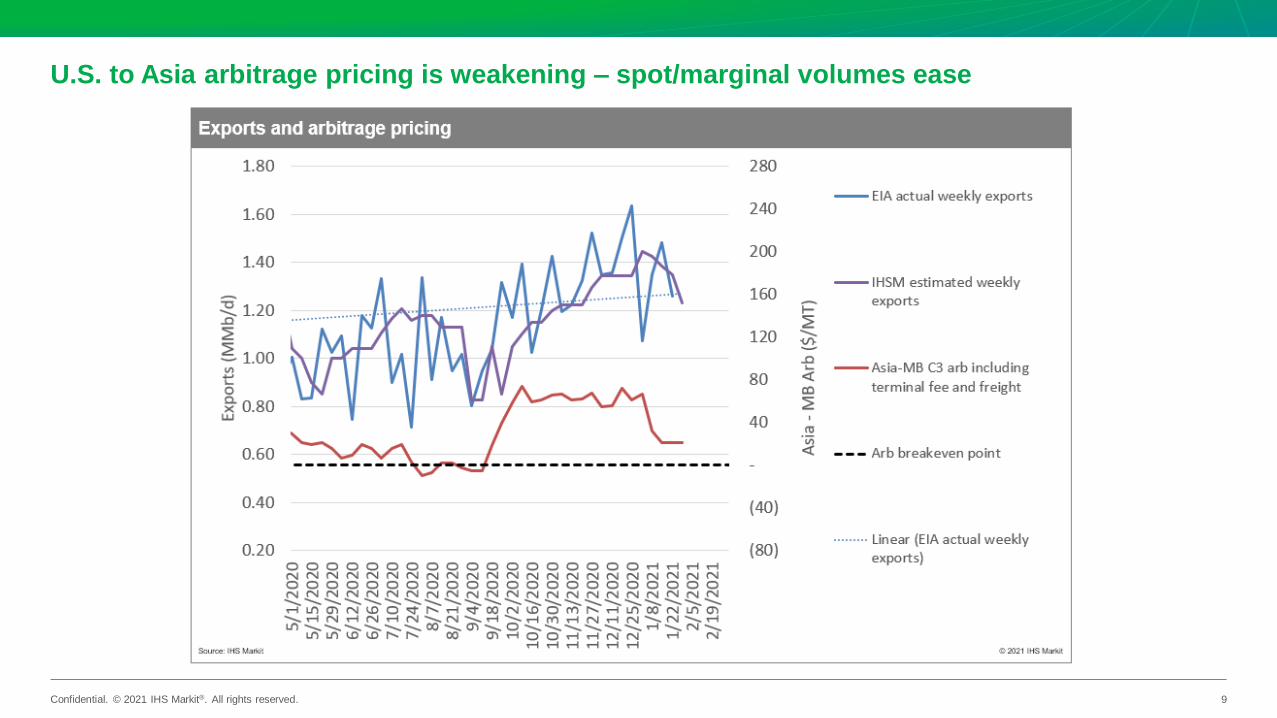
U.S. to Asia arbitrage pricing is weakening – spot/marginal volumes ease
9

Confidential. © 2021 IHS Markit®. All rights reserved.
Propane fundamentals (seasonal assessment) – minimal supply gains and higher demand
drives down inventory levels
0
200
400
600
800
1,000
1,200
1,400
1,600
1,800
2019-2020 2020-2021
DemandSupply
Propane winter supply and demand comparison (October - March)
© 2021 IHS Markit
MM
b/d
Source: IHS Markit
10

Confidential. © 2021 IHS Markit®. All rights reserved.
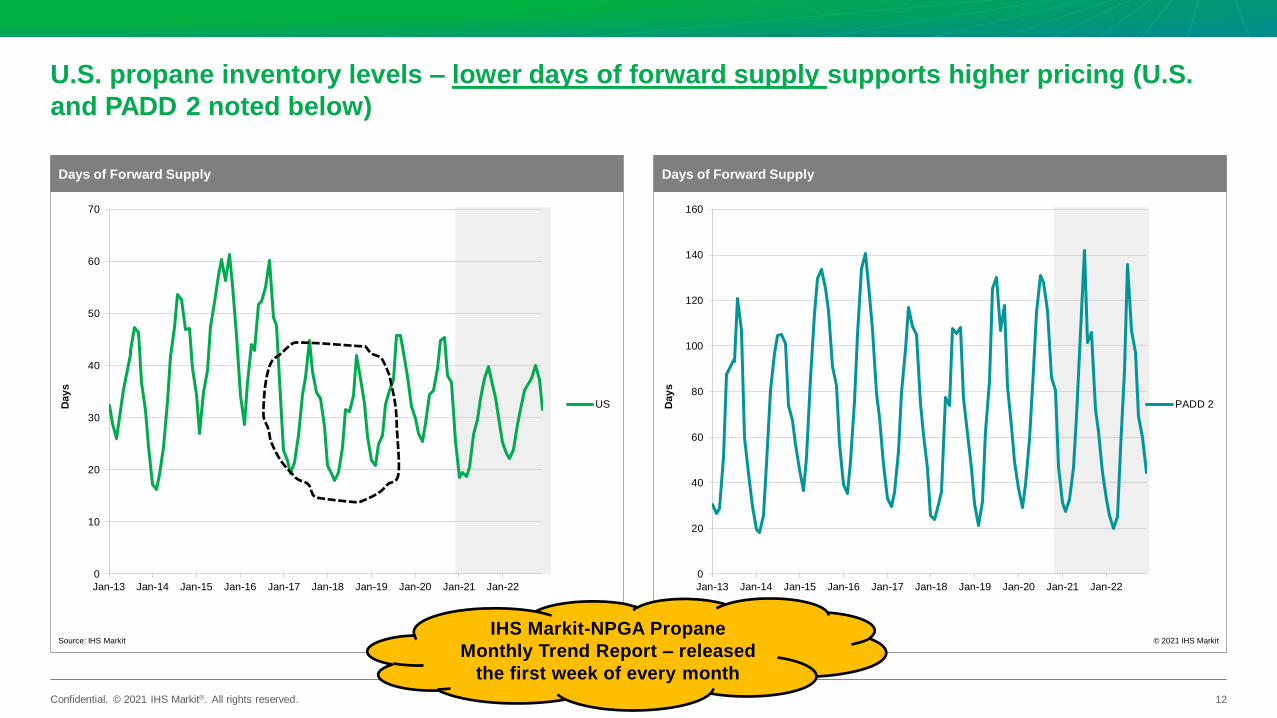
U.S. propane inventory levels – lower days of forward supply supports higher pricing (U.S.
and PADD 2 noted below)
11
0
20
40
60
80
100
120
140
160
Jan-13 Jan-14 Jan-15 Jan-16 Jan-17 Jan-18 Jan-19 Jan-20 Jan-21 Jan-22
PADD 2
Days of Forward Supply
Source: IHS Markit © 2021 IHS Markit
Day
s
0
10
20
30
40
50
60
70
Jan-13 Jan-14 Jan-15 Jan-16 Jan-17 Jan-18 Jan-19 Jan-20 Jan-21 Jan-22
US
Days of Forward Supply
Source: IHS Markit © 2021 IHS Markit
Day
s
IHS Markit-NPGA Propane
Monthly Trend Report – released
the first week of every month
Confidential. © 2021 IHS Markit®. All rights reserved.
U.S. propane inventory levels – lower days of forward supply supports higher pricing (U.S.
and PADD 2 noted below)
12
0
20
40
60
80
100
120
140
160
Jan-13 Jan-14 Jan-15 Jan-16 Jan-17 Jan-18 Jan-19 Jan-20 Jan-21 Jan-22
PADD 2
Days of Forward Supply
Source: IHS Markit © 2021 IHS Markit
Day
s
0
10
20
30
40
50
60
70
Jan-13 Jan-14 Jan-15 Jan-16 Jan-17 Jan-18 Jan-19 Jan-20 Jan-21 Jan-22
US
Days of Forward Supply
Source: IHS Markit © 2021 IHS Markit
Day
s
IHS Markit-NPGA Propane
Monthly Trend Report – released
the first week of every month

Confidential. © 2021 IHS Markit®. All rights reserved.
U.S. inventory levels – lower inventory levels on an absolute basis and comparisons to
previous periods, minimum and maximum levels
13
IHS Markit-NPGA Propane
Monthly Trend Report – released
the first week of every month
Confidential. © 2021 IHS Markit®. All rights reserved.
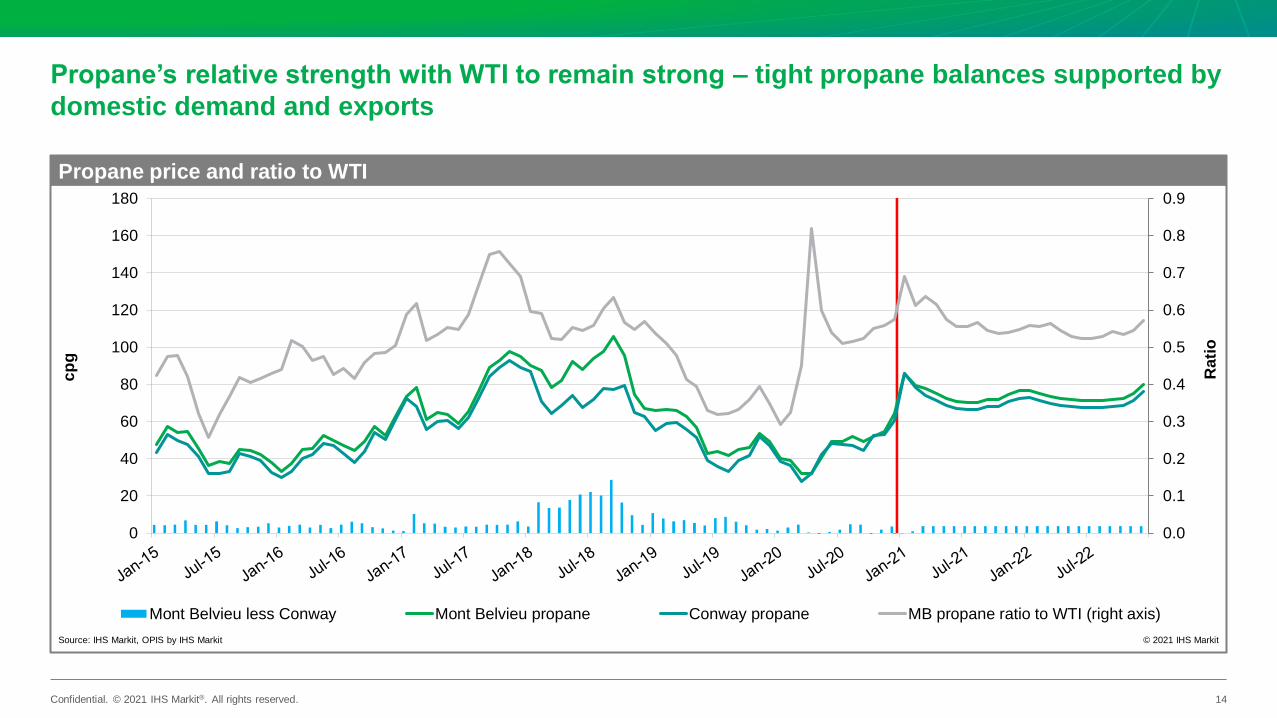
Propane’s relative strength with WTI to remain strong – tight propane balances supported by
domestic demand and exports
14
0.0
0.1
0.2
0.3
0.4
0.5
0.6
0.7
0.8
0.9
0
20
40
60
80
100
120
140
160
180
Mont Belvieu less Conway Mont Belvieu propane Conway propane MB propane ratio to WTI (right axis)
Propane price and ratio to WTI
Source: IHS Markit, OPIS by IHS Markit © 2021 IHS Markit
cp
g
Rati
o
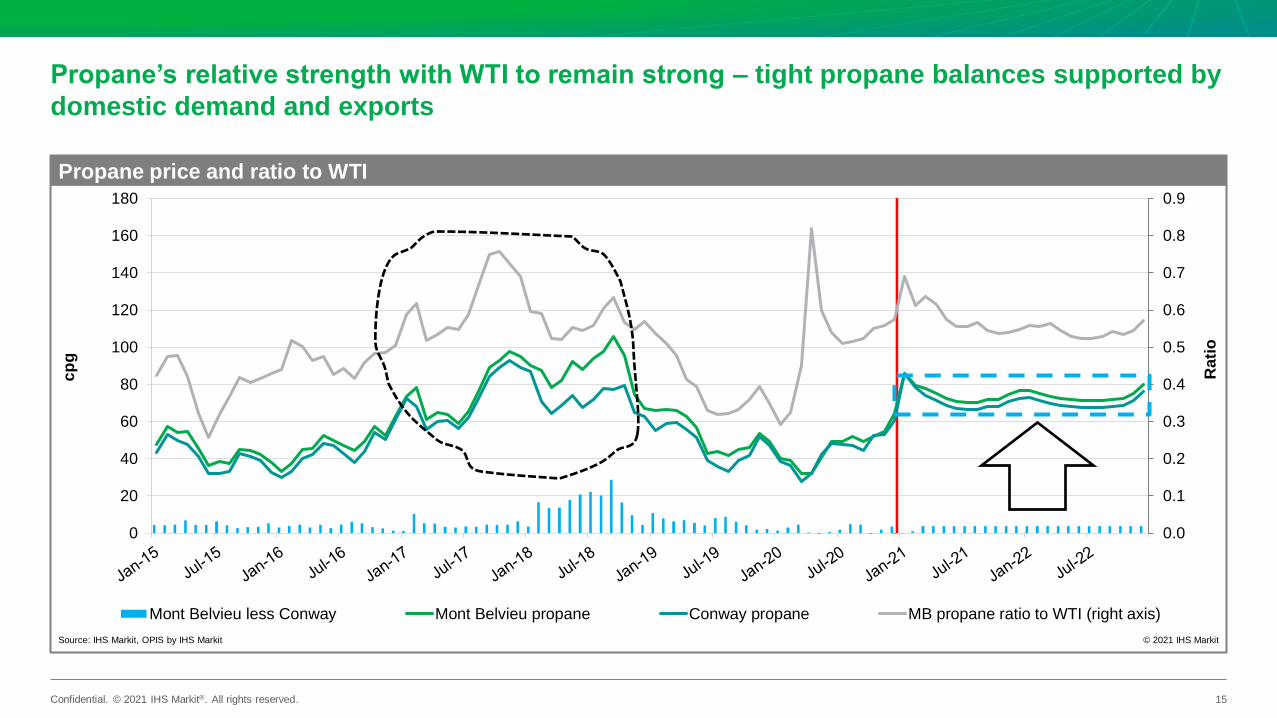
Confidential. © 2021 IHS Markit®. All rights reserved.
Propane’s relative strength with WTI to remain strong – tight propane balances supported by
domestic demand and exports
15
0.0
0.1
0.2
0.3
0.4
0.5
0.6
0.7
0.8
0.9
0
20
40
60
80
100
120
140
160
180
Mont Belvieu less Conway Mont Belvieu propane Conway propane MB propane ratio to WTI (right axis)
Propane price and ratio to WTI
Source: IHS Markit, OPIS by IHS Markit © 2021 IHS Markit
cp
g
Rati
o

Confidential. © 2021 IHS Markit®. All rights reserved.
Thanks!
Look for the next weekly report and the February monthly propane trend
report, both delivered this week!
16

IHS Markit Customer Care
Asia and the Pacific Rim
Japan: +81 3 6262 1887
Asia Pacific: +604 291 3600
Europe, Middle East, and Africa: +44 1344 328 300
Americas: +1 800 447 2273
Disclaimer
The information contained in this presentation is confidential. Any unauthorized use, disclosure, reproduction, or disseminat ion, in full or in part, in any media or by any means, without the prior written permission of IHS Markit or any of its affiliates ("IHS Markit") is strictly
prohibited. IHS Markit owns all IHS Markit logos and trade names contained in this presentation that are subject to license. Opinions, statements, estimates, and projections in this presentation (including other media) are solely those of the individual author(s) at the time of
writing and do not necessarily reflect the opinions of IHS Markit. Neither IHS Markit nor the author(s) has any obligation to update this presentation in the event that any content, opinion, statement, estimate, or projection (collectively, "information") changes or subsequently
becomes inaccurate. IHS Markit makes no warranty, expressed or implied, as to the accuracy, completeness, or timeliness of any information in this presentation, and shall not in any way be liable to any recipient for any inaccuracies or omissions. Without limiting the
foregoing, IHS Markit shall have no liability whatsoever to any recipient, whether in contract, in tort (including negligence), under warranty, under statute or otherwise, in respect of any loss or damage suffered by any recipient as a result of or in connection with any
information provided, or any course of action determined, by it or any third party, whether or not based on any information provided. The inclusion of a link to an external website by IHS Markit should not be understood to be an endorsement of that website or the site's
owners (or their products/services). IHS Markit is not responsible for either the content or output of external websites. Copyright © 2021, IHS Markit®. All rights reserved and all intellectual property rights are retained by IHS Markit.

Confidential. © 2021 IHS Markit®. All rights reserved.
Appendix
18

Confidential. © 2021 IHS Markit®. All rights reserved.
Dated Brent prices range from $55/bbl to $65/bbl in our base case. Key
assumptions are Saudi defense of oil prices and vaccine-driven demand
Key scenario assumptions:
Base-case scenario: COVID-19 vaccine by mid-2021
• World GDP contracts 3.9% in 2020 and grows 4.4% in 2021 and 4.1% in 2022.
• Oil demand stays at 93–94 MMb/d in fourth quarter 2020 and first quarter 2021. With
effective COVID-19 vaccines becoming widely available by mid-2021, global oil demand
picks up to 99 MMb/d in fourth quarter 2021. Chinese oil demand in 2021 is higher than in
2019, while other countries lag. At times during 2022, oil demand reaches pre–COVID-19
levels, although the annual average is still slightly below the 2019 level.
• Saudi Arabia cuts production in first quarter 2021 and then gradually increases output
along with other OPEC+ producers in the rest of 2021.
• US crude oil production grows during 2021, but the annual average of 11.4 MMb/d is even
with the 2020 average. In 2022, US crude output increases 0.4 MMb/d to average 11.8
MMb/d.
• Iranian output rises to 2.9 MMb/d by end-2021 and above 3.0 MMb/d in second quarter
2022.
• Prices hover around $60/bbl in 2022 as OPEC+ brings on more production, which leads to
supply surpluses.
High-case scenario: Bigger supply deficits
• Rapid vaccination with effective vaccines boosts economic activity faster than expected
compared with the base case and drives up demand. After prices rise above $70/bbl by
second half 2021, more supply limits further price increases through 2022.
Low-case scenario: OPEC+ misalignment and weak demand
• OPEC+ unleashes more supply, while the demand recovery stumbles. Vaccinations
encounter logistical bottlenecks and concerns about effectiveness, while mobility and
economic restrictions continue to restrain oil demand.
• Sluggish recovery in demand from mid-2021 gradually elevates prices to about $50/bbl
by second quarter 2022.
19
0
10
20
30
40
50
60
70
80
Jan
Fe
bM
ar
Apr
May
Jun
Jul
Aug
Sep
Oct
Nov
Dec
Jan
Fe
bM
ar
Apr
May
Jun
Jul
Aug
Sep
Oct
Nov
Dec
Jan
Fe
bM
ar
Apr
May
Jun
Jul
Aug
Sep
Oct
Nov
Dec
Jan
Fe
bM
ar
Apr
May
Jun
Jul
Aug
Sep
Oct
Nov
Dec
2019 2020 2021 2022
Dated Brent price scenarios
Source: IHS Markit, Argus Media Limited (historical prices)Note: Prices shown are indicative monthly price averages and not intended to project daily/weekly high and low prices.
© 2021 IHS Markit
$/b
bl
Base case: Mid-2021 vaccines
Outlook from
December 2020
(dotted line)
Low case: OPEC+
misalignment and
weak demand
High case: Bigger supply deficits
Average price ($/bbl)
2021 2022
High case 69 71
Base case 57 60
Low case 46 51

Confidential. © 2021 IHS Markit®. All rights reserved.
Gas plant-based production expected to be slightly higher in 2021 and will
help to keep up with growing exports
• Refinery rates have been lagging because of the COVID-19 pandemic, leading to
lower than typical seasonal butane blending demand. Winter blending demand
season is coming towards its end.
• Cracker demand is expected to average around 170 Mb/d in 2021-22. BASF cracker
restarted in late October after going down in June, boosting USGC butane demand by
~ 50 mb/d.
• Exports of normal butane reached an all-time high of 413,000 b/d in August and are
expected to average around 350,000 b/d to 400,000 b/d through the winter season.
• We expect butane inventory to remain around the 5-year range in 2021 due to low
domestic demand and larger inventory needed to accommodate exports.
20
-0.4-0.20.00.20.40.60.81.0
Gas processing Refinery Imports Net Supply
US normal butane supply
Source: IHS Markit, EIA © 2021 IHS Markit
MM
b/d
-0.2-0.10.00.10.20.30.40.5
Chemical Isomerization Other Refinery Exports
US normal butane demand
Source: IHS Markit, EIA © 2021 IHS Markit
MM
b/d
0
20
40
60
80
5-Yr range US Inventories Monthly 5-Yr average
US normal butane inventories
Source: IHS Markit, EIA © 2021 IHS Markit
MM
bb
l
Confidential. © 2021 IHS Markit®. All rights reserved.
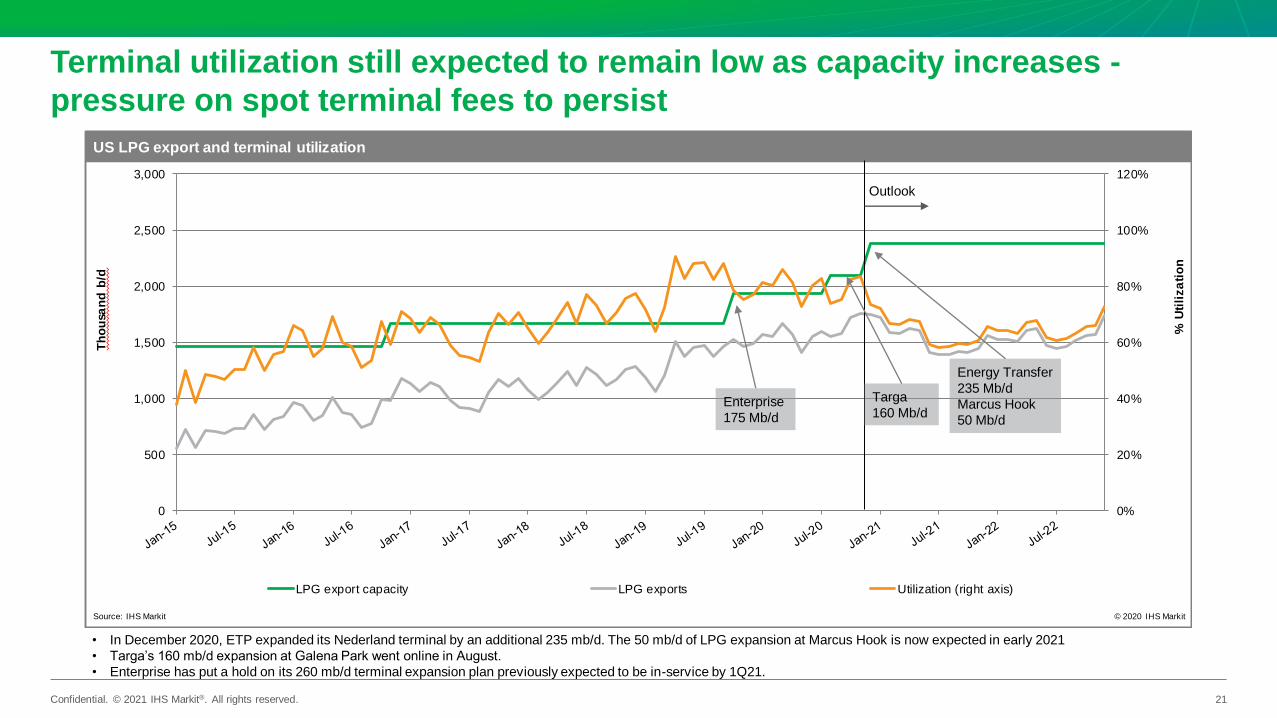
Terminal utilization still expected to remain low as capacity increases -
pressure on spot terminal fees to persist
0%
20%
40%
60%
80%
100%
120%
0
500
1,000
1,500
2,000
2,500
3,000
LPG export capacity LPG exports Utilization (right axis)
US LPG export and terminal utilization
Source: IHS Markit © 2020 IHS Markit
Th
ou
san
d b
/d
% U
tili
za
tio
n
21
Outlook
Targa
160 Mb/d
• In December 2020, ETP expanded its Nederland terminal by an additional 235 mb/d. The 50 mb/d of LPG expansion at Marcus Hook is now expected in early 2021
• Targa’s 160 mb/d expansion at Galena Park went online in August.
• Enterprise has put a hold on its 260 mb/d terminal expansion plan previously expected to be in-service by 1Q21.
Energy Transfer
235 Mb/d
Marcus Hook
50 Mb/d
Enterprise
175 Mb/d
Confidential. © 2021 IHS Markit®. All rights reserved.
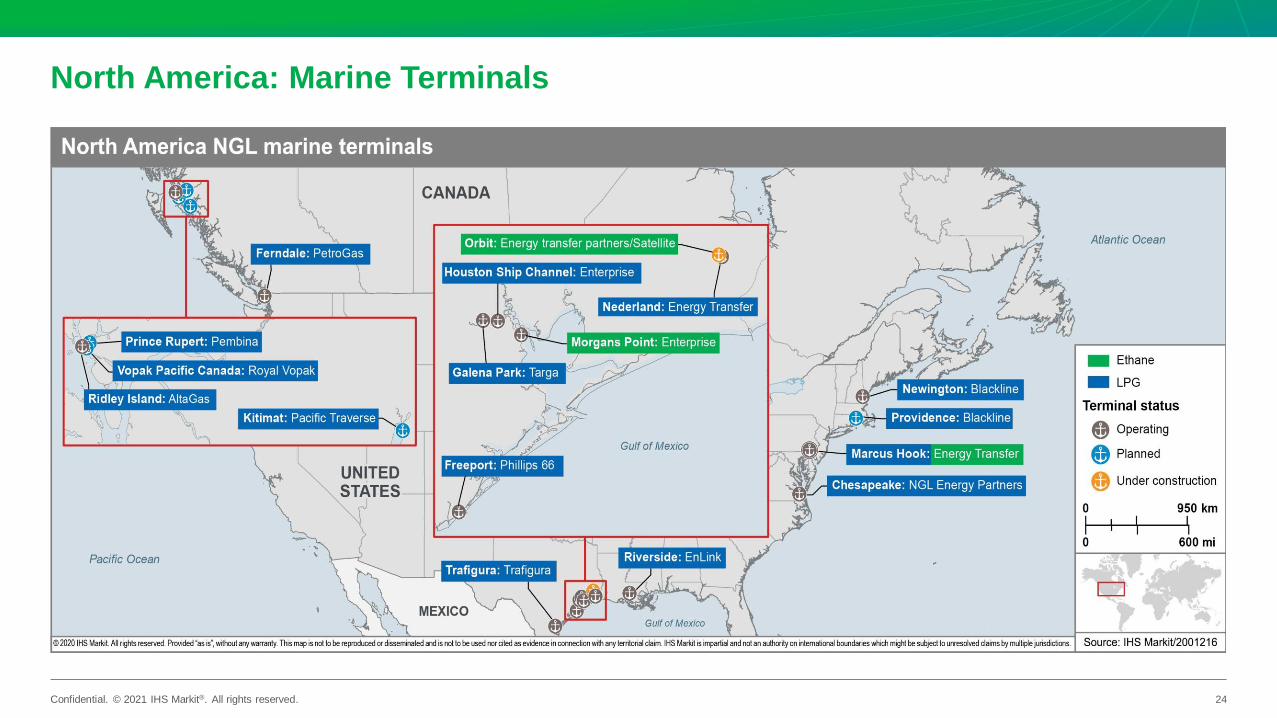
Company Terminal Name Location Capacity (Thousand b/d) Capacity (Mmtpa) Product Import/Export Status
NGL Energy Partners Chesapeake Virginia 15 0.5 LPG Import/Export Operating
Energy Transfer Partners Marcus Hook Expansion Pennsylvania 50 1.5 LPG Export Operating
Phillips 66 Freeport Texas 200 6.01 LPG Export Operating
Enterprise Products Partners Houston Texas 660 19.84 LPG Export Operating
Enterprise Products Partners Houston Expansion Texas 175 5.26 LPG Export Operating
Targa Resources Galena Park Texas 230 6.91 LPG Export Operating
Targa Resources Galena Park expansion 1 Texas 100 3.01 LPG Export Operating
Trafigura Corpus Christi Texas 33.3 1.00 LPG Export Operating
Energy Transfer Partners Nederland Texas 200 6.01 LPG Export Operating
Energy Transfer Partners Nederland expansion Texas 235 7.06 LPG Export Operating
EnLink Riverside Louisiana 16.6 0.5 LPG Export Operating
Petrogas / Alta Gas Ferndale Washington 30 0.9 Propane Export Operating
Alta Gas / Royal Vopak RIPET British Columbia, Canada 50 1.5 Propane Export Operating
Blackline Newington New Hampshire 5* 0.15 Propane Import Operating
Sunoco/Markwest Marcus Hook Pennsylvania 65 1.34 Ethane Export Operating
Enterprise Products Partners Morgan’s Point Texas 240 4.94 Ethane Export Operating
Targa Resources Galena Park expansion 2 Texas 160 4.81 LPG Export Operating
Energy Transfer Partners Orbit Texas 175 3.60 Ethane Export Operating
Total operating capacity 2,635 74.84
22
Op
era
tin
g T
erm
ina
ls
Company Terminal Name Location Capacity (Thousand b/d) Capacity (Mmtpa) Product Import/Export Status
Energy Transfer Partners Nederland expansion Texas 235 7.06 LPG Export Planned 4Q 2020
Energy Transfer Partners Marcus Hook expansion Pennsylvania 50 1.5 LPG Export Planned 4Q 2020
Blackline Providence Rhode Island 7 0.26 Propane Import Planned 2Q 2021
Enterprise Products Partners Houston Ship Channel expansion Texas 260 7.82 LPG Export Deferred
Pembina Prince Rupert British Columbia, Canada 25 0.75 Propane Export Planned 1Q 2021
Pembina Prince Rupert expansion British Columbia, Canada 15 0.45 Propane Export Deferred
Royal Vopak Vopak Pacific Canada British Columbia, Canada 40 1.20 Propane Export Planned 2023
Pacific Traverse Kitimat British Columbia, Canada 42 1.26 Propane Export Planned 2023
Total planned capacity 674 20.3
Pla
nn
ed
Te
rmin
als
North America NGL marine terminals
Note: *Capacity estimated based on year-to-date imports/exports
Confidential. © 2021 IHS Markit®. All rights reserved.
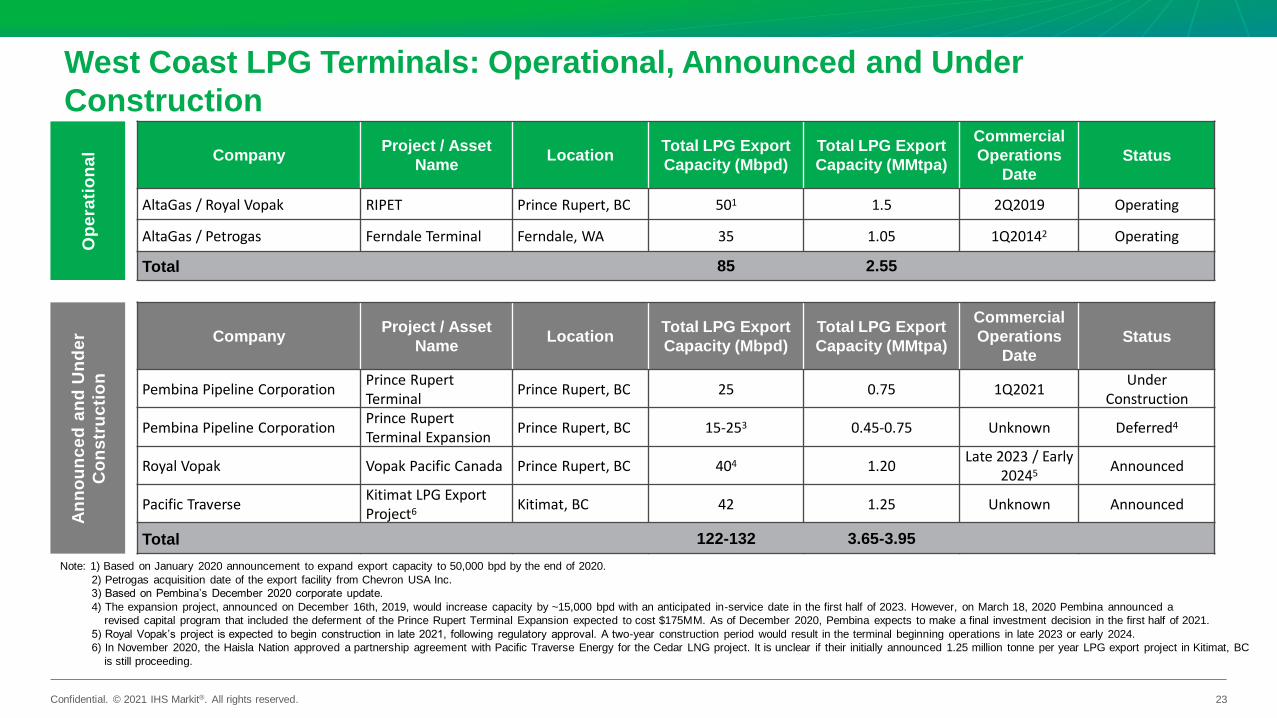
West Coast LPG Terminals: Operational, Announced and Under
Construction
23
CompanyProject / Asset
NameLocation
Total LPG Export
Capacity (Mbpd)
Total LPG Export
Capacity (MMtpa)
Commercial
Operations
Date
Status
AltaGas / Royal Vopak RIPET Prince Rupert, BC 501 1.5 2Q2019 Operating
AltaGas / Petrogas Ferndale Terminal Ferndale, WA 35 1.05 1Q20142 Operating
Total 85 2.55
Op
era
tio
na
l
CompanyProject / Asset
NameLocation
Total LPG Export
Capacity (Mbpd)
Total LPG Export
Capacity (MMtpa)
Commercial
Operations
Date
Status
Pembina Pipeline Corporation Prince Rupert Terminal
Prince Rupert, BC 25 0.75 1Q2021Under
Construction
Pembina Pipeline Corporation Prince Rupert Terminal Expansion
Prince Rupert, BC 15-253 0.45-0.75 Unknown Deferred4
Royal Vopak Vopak Pacific Canada Prince Rupert, BC 404 1.20Late 2023 / Early
20245Announced
Pacific TraverseKitimat LPG Export Project6
Kitimat, BC 42 1.25 Unknown Announced
Total 122-132 3.65-3.95
An
no
un
ce
d a
nd
Un
de
r
Co
ns
tru
cti
on
Note: 1) Based on January 2020 announcement to expand export capacity to 50,000 bpd by the end of 2020.
2) Petrogas acquisition date of the export facility from Chevron USA Inc.
3) Based on Pembina’s December 2020 corporate update.
4) The expansion project, announced on December 16th, 2019, would increase capacity by ~15,000 bpd with an anticipated in-service date in the first half of 2023. However, on March 18, 2020 Pembina announced a
revised capital program that included the deferment of the Prince Rupert Terminal Expansion expected to cost $175MM. As of December 2020, Pembina expects to make a final investment decision in the first half of 2021.
5) Royal Vopak’s project is expected to begin construction in late 2021, following regulatory approval. A two-year construction period would result in the terminal beginning operations in late 2023 or early 2024.
6) In November 2020, the Haisla Nation approved a partnership agreement with Pacific Traverse Energy for the Cedar LNG project. It is unclear if their initially announced 1.25 million tonne per year LPG export project in Kitimat, BC
is still proceeding.
Confidential. © 2021 IHS Markit®. All rights reserved.
North America: Marine Terminals
24