Embed Size (px)
Citation preview
U.S. Economic Outlook and Monetary Policy
Bank of Portugal February 24, 2014
Spencer Krane Senior Vice President, Federal Reserve Bank of Chicago The views expressed are my own and not those of the Federal Reserve Bank of Chicago or the Federal Reserve System
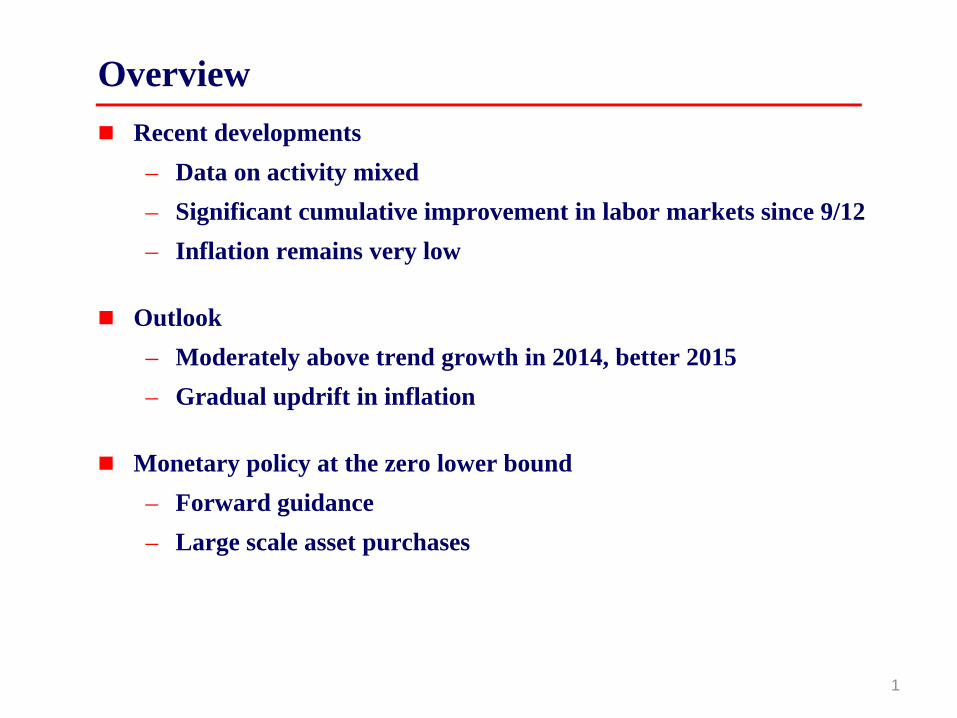
Overview Recent developments
– Data on activity mixed – Significant cumulative improvement in labor markets since 9/12 – Inflation remains very low
Outlook – Moderately above trend growth in 2014, better 2015 – Gradual updrift in inflation
Monetary policy at the zero lower bound – Forward guidance – Large scale asset purchases
1
0
4
8
12
2001 '03 '05 '07 '09 '11 '13 '15-1000
-500
0
500
2005 '07 '09 '11 '13
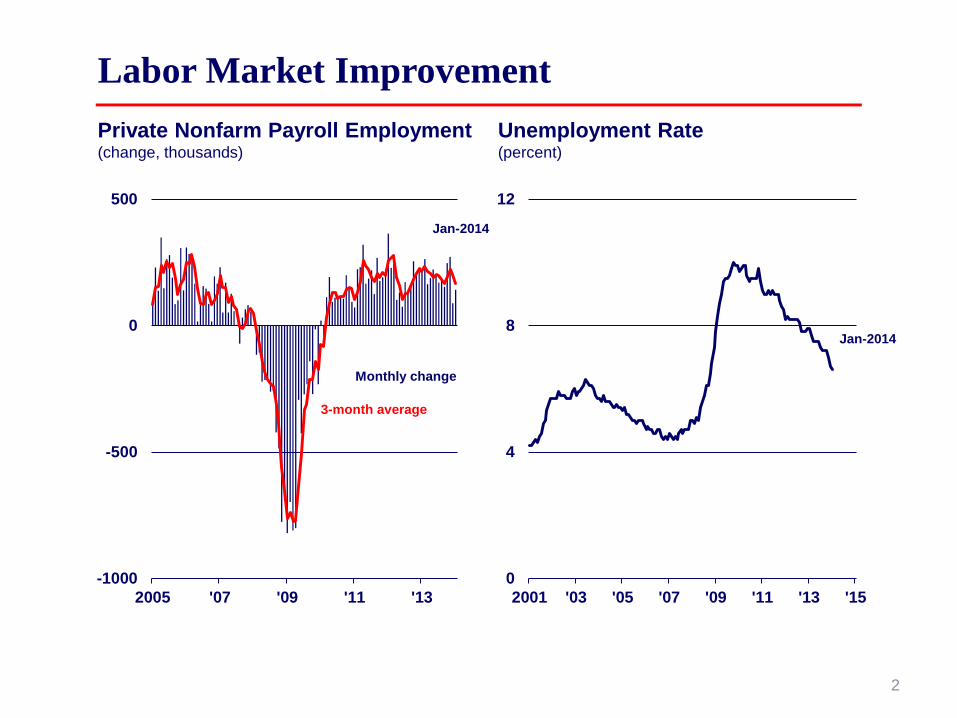
Labor Market Improvement Private Nonfarm Payroll Employment (change, thousands)
Unemployment Rate (percent)
Monthly change
3-month average
Jan-2014
Jan-2014
2
0
4
8
12
2001 '03 '05 '07 '09 '11 '13 '15-1000
-500
0
500
2005 '07 '09 '11 '13
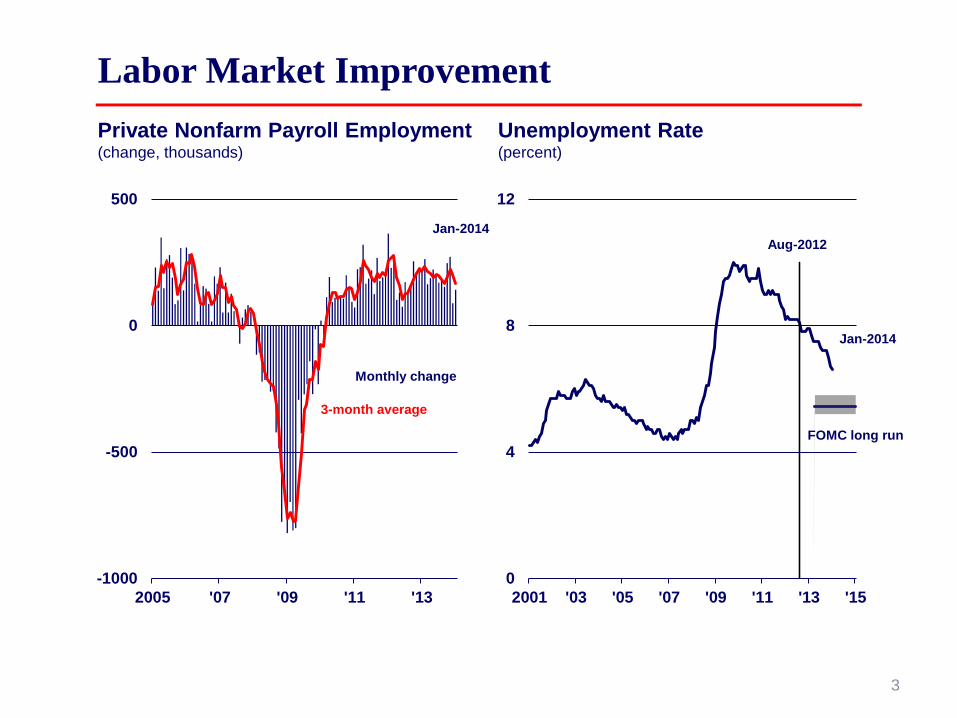
Labor Market Improvement Private Nonfarm Payroll Employment (change, thousands)
Unemployment Rate (percent)
Monthly change
3-month average
Jan-2014
Jan-2014
FOMC long run
Aug-2012
3
2001
2002
2003
2004
2005
2006
2007
2008
2009
2010
2011
2012
2013
2014
2015
2016
2017
2018
2019
2020
61
63
65
67
69
2001 2004 2007 2010 2013 2016
Jan-2014 19
8019
8219
8419
8619
8819
9019
9219
9419
9619
9820
0020
0220
0420
0620
0820
1020
1220
1420
1620
1820
20
54
57
60
63
66
2001 2004 2007 2010 2013 2016
Jan-2014
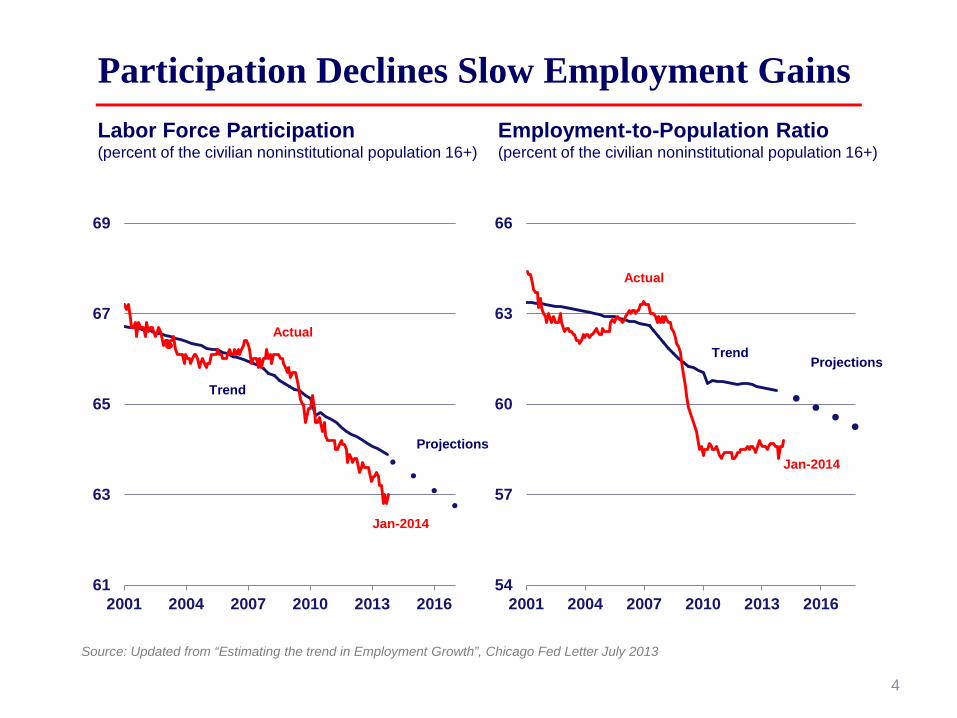
Participation Declines Slow Employment Gains
Source: Updated from “Estimating the trend in Employment Growth”, Chicago Fed Letter July 2013
Labor Force Participation (percent of the civilian noninstitutional population 16+)
Trend
Actual
Projections
Employment-to-Population Ratio (percent of the civilian noninstitutional population 16+)
Trend Projections
Actual
4
1.0
1.5
2.0
2.5
3.0
2001 '03 '05 '07 '09 '11 '131
2
3
4
5
2001 '03 '05 '07 '09 '11 '13
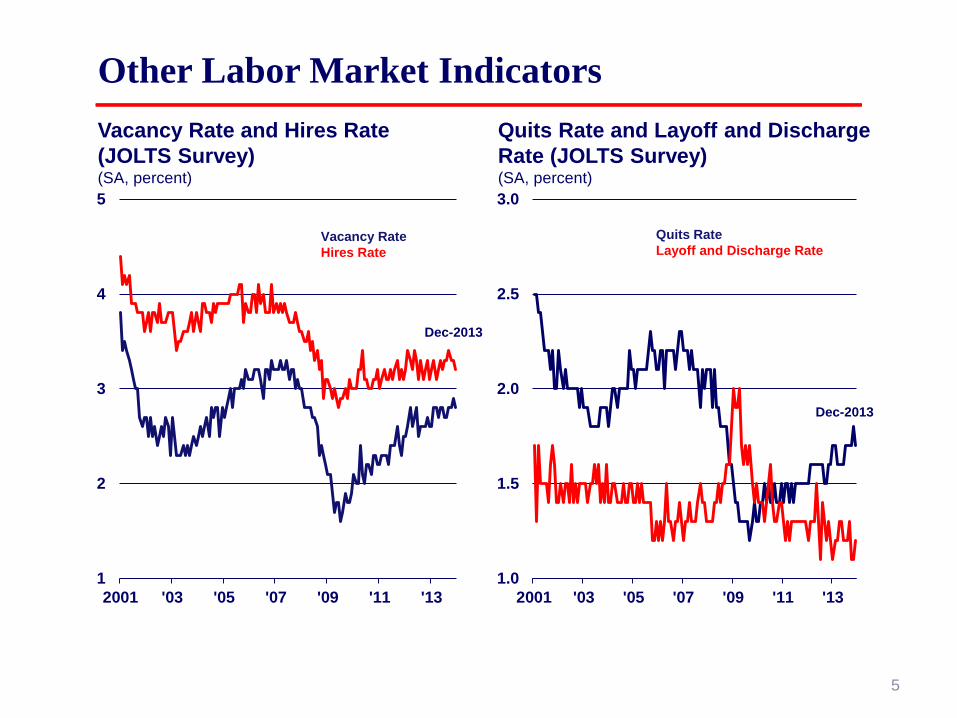
Other Labor Market Indicators Quits Rate and Layoff and Discharge Rate (JOLTS Survey) (SA, percent)
Vacancy Rate and Hires Rate (JOLTS Survey) (SA, percent)
Dec-2013
Dec-2013
Vacancy Rate Hires Rate
Quits Rate Layoff and Discharge Rate
5

0
50
100
150
200
250
0
400
800
1200
1600
2000
2000 '02 '04 '06 '08 '10 '12 '14
Consumption and Housing Housing Permits and Home Prices (millions of units, annual rate; Q1-2000=100)
Single Family Housing Permits CoreLogic Home Price Index
Jan-2014
-6
-4
-2
0
2
4
6
2007 '08 '09 '10 '11 '12 '13 '14
Q1-2014
Personal Consumption Expenditures (percent change, annual rate)
Dec-2013
2014 Q1 Estimate from the Survey of Professional Forecasters, Feb. 2014
6

Household Balance Sheets: Crisis and Aftermath
400
550
700
1985 '90 '95 '00 '05 '10
Household Net Worth (percent of disposable income)
Q3-2013
Household Liabilities and Homes with Mortgages in Negative Equity (percent of disposable income; millions of units)
0
10
20
50
100
150
1985 '90 '95 '00 '05 '10
Household Liabilities Single-Family Homes with Mortgages in Negative Equity
Q3-2013
7

Business Investment Indicators
45
50
55
60
65
70
2000 '02 '04 '06 '08 '10 '12
Nondefense Capital Goods ex. Aircraft (Bils. $, 3-month MA)
Nonresidential Private Construction (Bils. $)
Shipments New Orders
Dec-2013
200
250
300
350
400
450
2000 '02 '04 '06 '08 '10 '12
Dec-2013
8
-1
-0.5
0
0.5
1
2008 '09 '10 '11 '12 '13
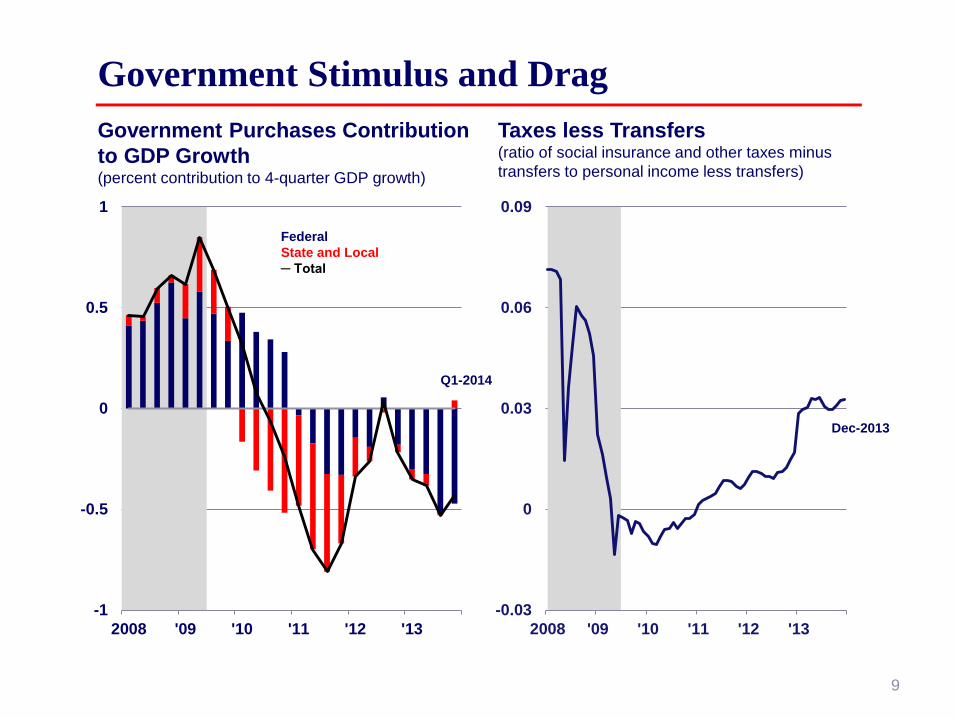
Government Stimulus and Drag
Federal State and Local ─ Total
Government Purchases Contribution to GDP Growth (percent contribution to 4-quarter GDP growth)
Q1-2014
Taxes less Transfers (ratio of social insurance and other taxes minus transfers to personal income less transfers)
-0.03
0
0.03
0.06
0.09
2008 '09 '10 '11 '12 '13
Dec-2013
9
-5
-4
-3
-2
-1
0
1
2
1990 '95 2000 2005 '10
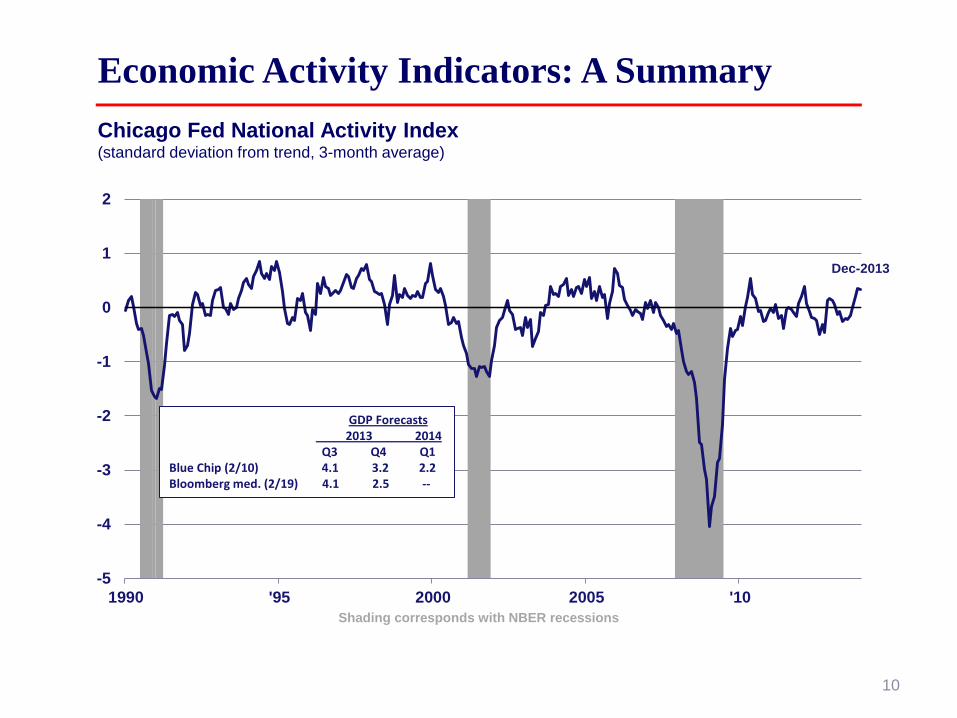
Economic Activity Indicators: A Summary Chicago Fed National Activity Index (standard deviation from trend, 3-month average)
Shading corresponds with NBER recessions
Dec-2013
GDP Forecasts 2013 2014 Q3 Q4 Q1 Blue Chip (2/10) 4.1 3.2 2.2 Bloomberg med. (2/19) 4.1 2.5 --
10

2013 2014 2015 2016
FOMC (12/19)
GDP1 2.25
(2.2, 2.3)
3.05
(2.8, 3.2)
3.25
(3.0, 3.4)
3.05
(2.5, 3.2)
Unemploy. 2 7.05
(7.0, 7.1)
6.45
(6.3, 6.6)
5.85
(5.8, 6.1)
5.45
(5.3, 5.8)
Blue Chip (2/10)
GDP1 2.7 2.7 3.0
Unemploy.2 7.0 6.4 5.9 FOMC forecasts are pseudo medians; central tendency in parentheses. 1. Percent change, Q4 to Q4 2. Fourth-quarter average
Medium Term Forecasts
11
12
14
16
18
2003 '06 '09 '12 '15
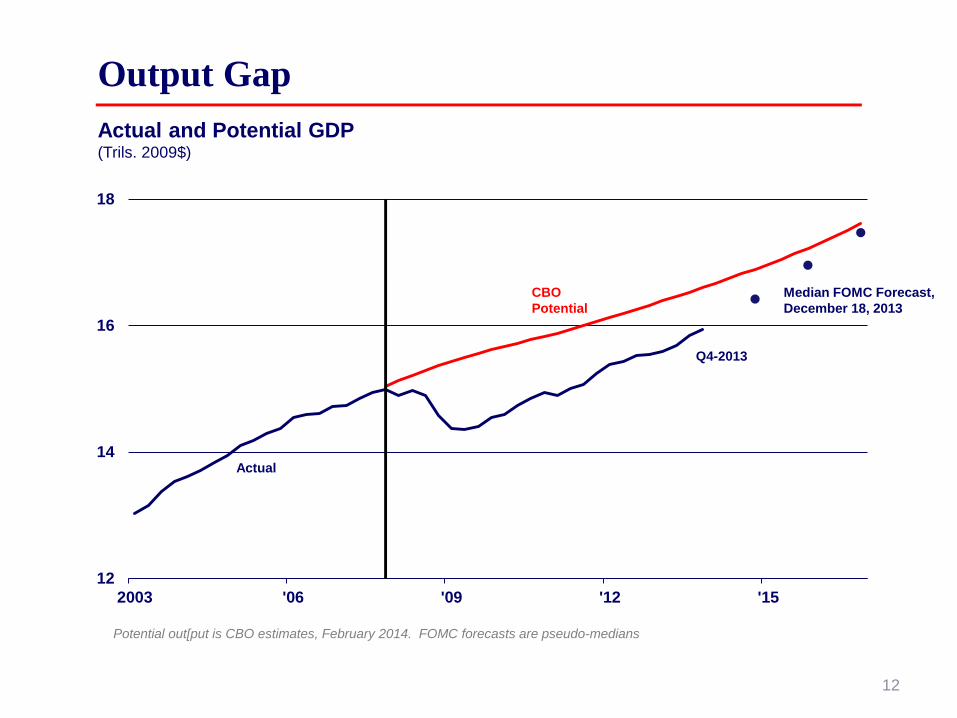
Output Gap Actual and Potential GDP (Trils. 2009$)
Q4-2013
Median FOMC Forecast, December 18, 2013
Actual
CBO Potential
Potential out[put is CBO estimates, February 2014. FOMC forecasts are pseudo-medians
12
250
375
500
625
20
95
170
2005 '07 '09 '11 '13
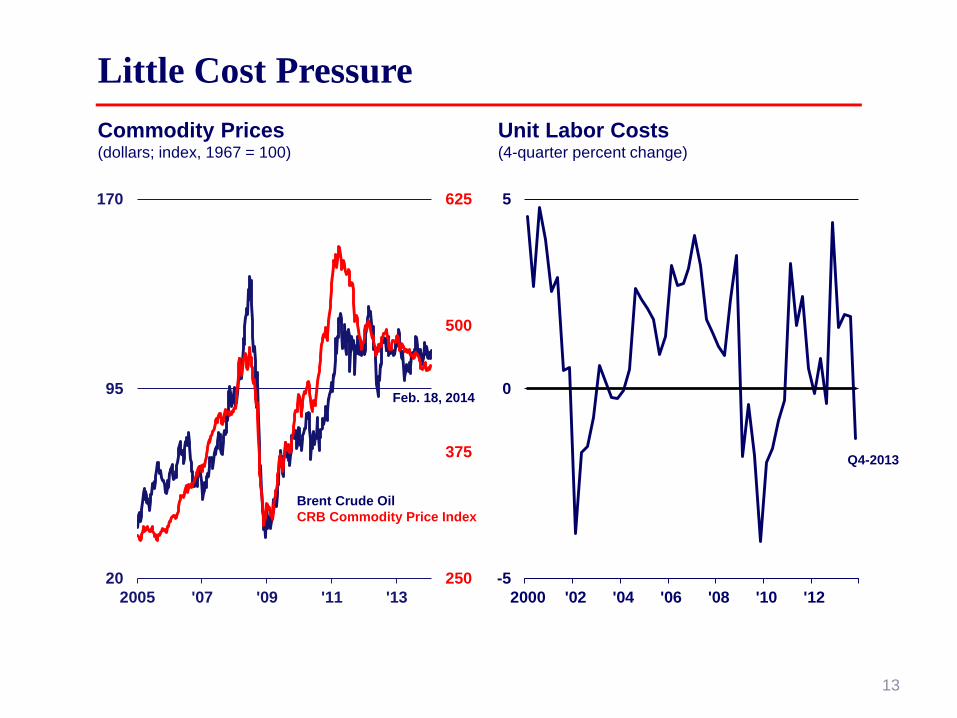
Brent Crude Oil CRB Commodity Price Index
-5
0
5
2000 '02 '04 '06 '08 '10 '12
Little Cost Pressure Unit Labor Costs (4-quarter percent change)
Feb. 18, 2014
Q4-2013
Commodity Prices (dollars; index, 1967 = 100)
13
-2
0
2
4
2005 '06 '07 '08 '09 '10 '11 '12 '131.6
1.8
2.0
2.2
2014 '15 '16 '17 '18 '19 '20 '21
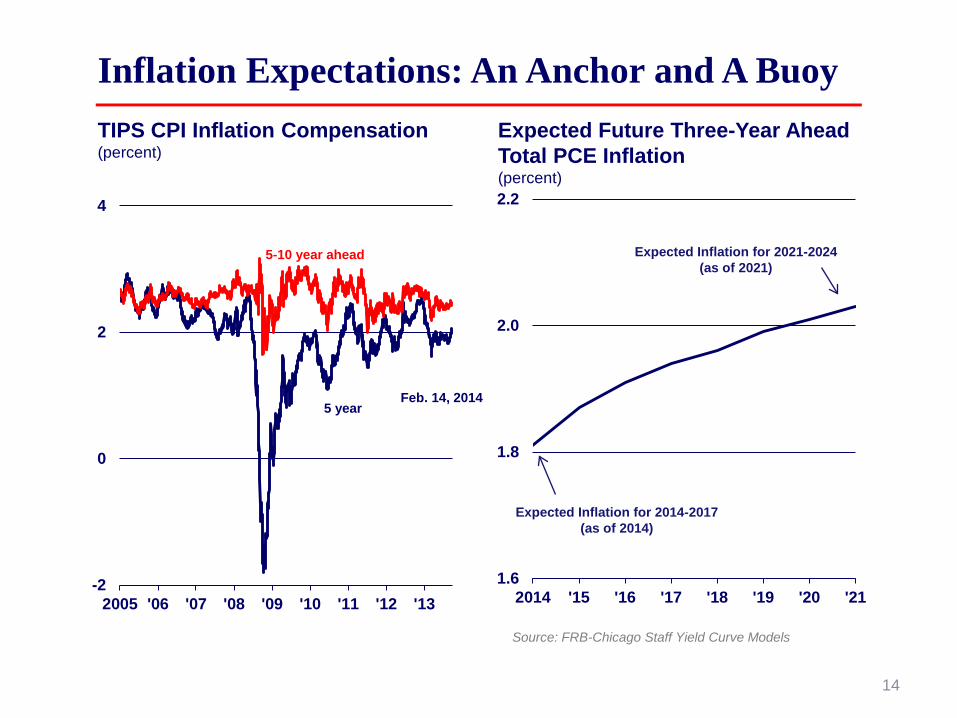
Inflation Expectations: An Anchor and A Buoy
Feb. 14, 2014
TIPS CPI Inflation Compensation (percent)
5 year
5-10 year ahead Expected Inflation for 2021-2024 (as of 2021)
Expected Inflation for 2014-2017 (as of 2014)
Expected Future Three-Year Ahead Total PCE Inflation (percent)
Source: FRB-Chicago Staff Yield Curve Models
14

Inflation Low; Expected to Return to Target PCE Price Index (percent)
-2
-1
0
1
2
3
4
5
1999 '02 '05 '08 '11 '14 '16
Target for Total PCE
Total
Core
Dec-2013
FOMC Forecasts* (December 18, 2013)
*Pseudo-medians of the forecasts made by the FOMC participants 15

-5
0
5
10
1989 1994 1999 2004 2009
Fed Funds Rate (percent)
History
Q4-2013
Policy Rate Constrained by Zero Lower Bound
Taylor (1999) Rule based on inflation and output gap
Taylor Rule based on CBO output gap, SPF long-run inflation forecast (before 2009), and FOMC SEP long-run inflation target (after 2009)
16
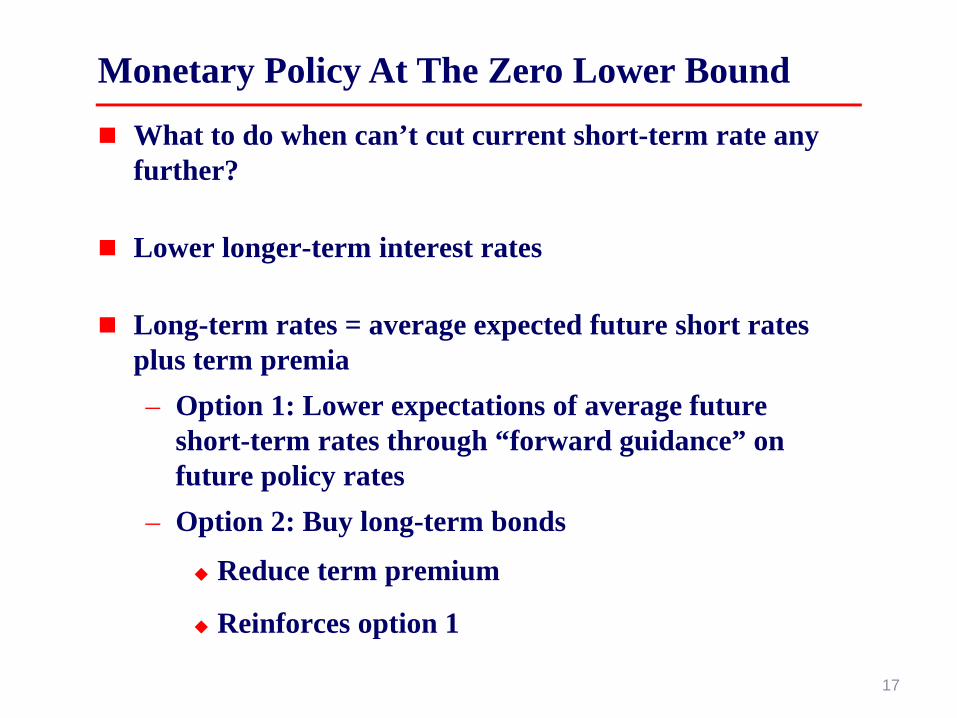
What to do when can’t cut current short-term rate any further?
Lower longer-term interest rates
Long-term rates = average expected future short rates plus term premia – Option 1: Lower expectations of average future
short-term rates through “forward guidance” on future policy rates
– Option 2: Buy long-term bonds
Reduce term premium
Reinforces option 1
Monetary Policy At The Zero Lower Bound
17
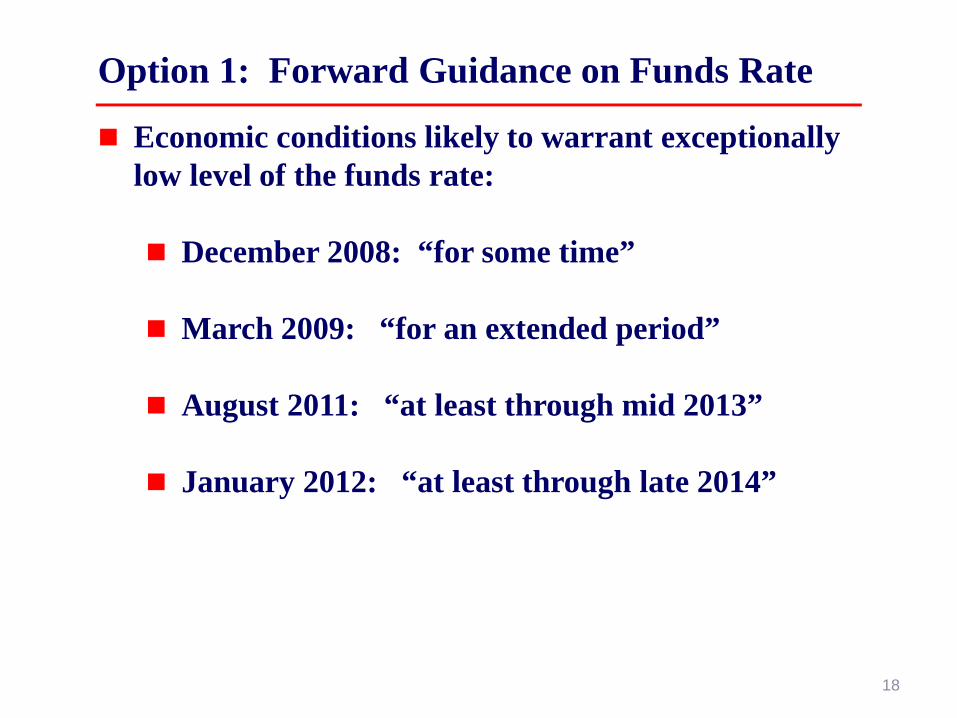
Option 1: Forward Guidance on Funds Rate
Economic conditions likely to warrant exceptionally low level of the funds rate:
December 2008: “for some time”
March 2009: “for an extended period”
August 2011: “at least through mid 2013”
January 2012: “at least through late 2014”
18
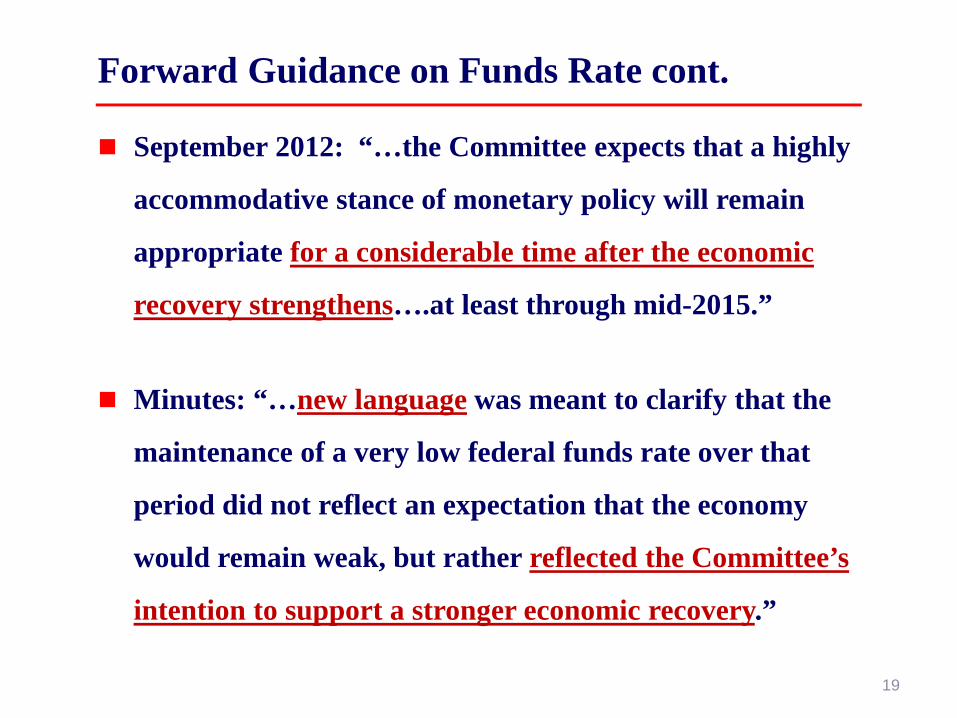
Forward Guidance on Funds Rate cont.
September 2012: “…the Committee expects that a highly
accommodative stance of monetary policy will remain
appropriate for a considerable time after the economic
recovery strengthens….at least through mid-2015.”
Minutes: “…new language was meant to clarify that the
maintenance of a very low federal funds rate over that
period did not reflect an expectation that the economy
would remain weak, but rather reflected the Committee’s
intention to support a stronger economic recovery.”
19
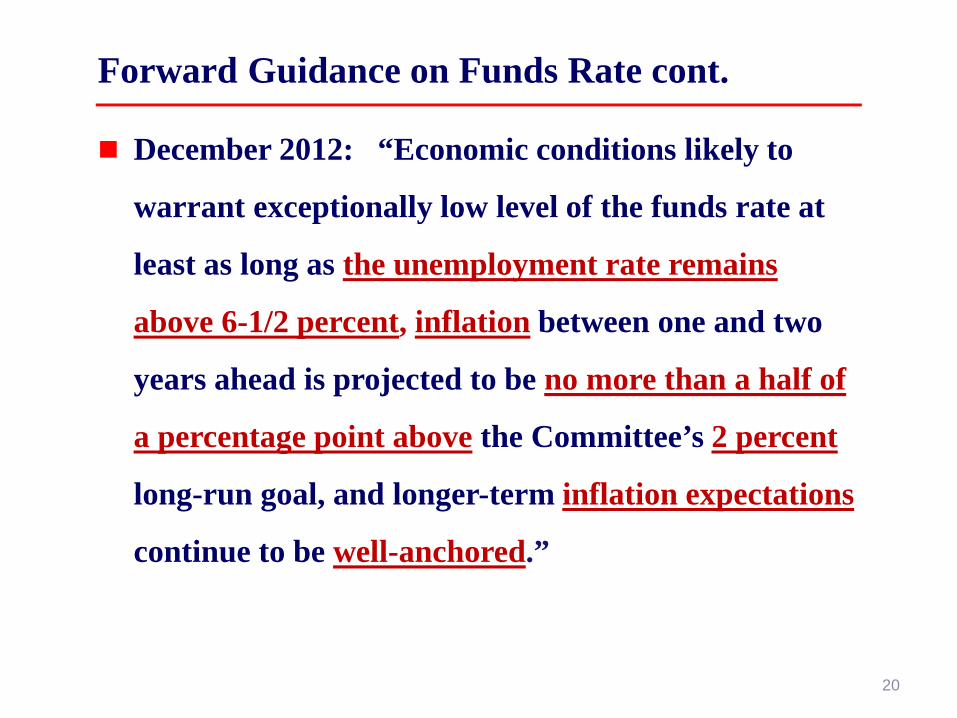
Forward Guidance on Funds Rate cont.
December 2012: “Economic conditions likely to
warrant exceptionally low level of the funds rate at
least as long as the unemployment rate remains
above 6-1/2 percent, inflation between one and two
years ahead is projected to be no more than a half of
a percentage point above the Committee’s 2 percent
long-run goal, and longer-term inflation expectations
continue to be well-anchored.”
20

Forward Guidance on Funds Rate cont.
December 2012 cont: “In determining how long to
maintain a highly accommodative stance of monetary
policy, the Committee will also consider other
information, including additional measures of labor
market conditions, indicators of inflation pressures
and inflation expectations, and readings on financial
developments.”
21

Forward Guidance on Funds Rate cont.
December 2013: “The Committee now anticipates,
based on its assessment of these factors, that it likely
will be appropriate to maintain the current target
range for the federal funds rate well past the time
that the unemployment rate declines below 6-1/2
percent, especially if projected inflation continues to
run below the Committee's 2 percent longer-run
goal.”
22
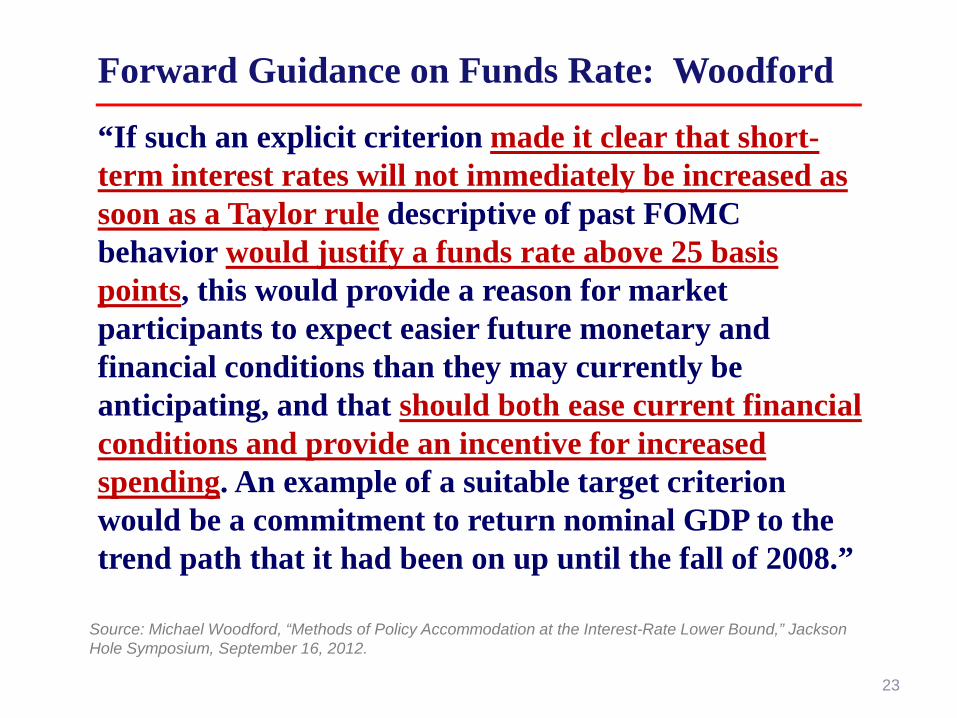
Forward Guidance on Funds Rate: Woodford
“If such an explicit criterion made it clear that short-term interest rates will not immediately be increased as soon as a Taylor rule descriptive of past FOMC behavior would justify a funds rate above 25 basis points, this would provide a reason for market participants to expect easier future monetary and financial conditions than they may currently be anticipating, and that should both ease current financial conditions and provide an incentive for increased spending. An example of a suitable target criterion would be a commitment to return nominal GDP to the trend path that it had been on up until the fall of 2008.”
Source: Michael Woodford, “Methods of Policy Accommodation at the Interest-Rate Lower Bound,” Jackson Hole Symposium, September 16, 2012.
23

Forward Guidance on Funds Rate cont.
October 2013 Minutes: “…statement could indicate
… anticipated keeping the rate below its longer-run
equilibrium value for some time, as economic
headwinds were likely to diminish only slowly. Other
factors … also mentioned as possibly providing a
rationale for maintaining a low trajectory for the
federal funds rate, including following through on a
commitment to support the economy by maintaining
more-accommodative policy for longer.
24
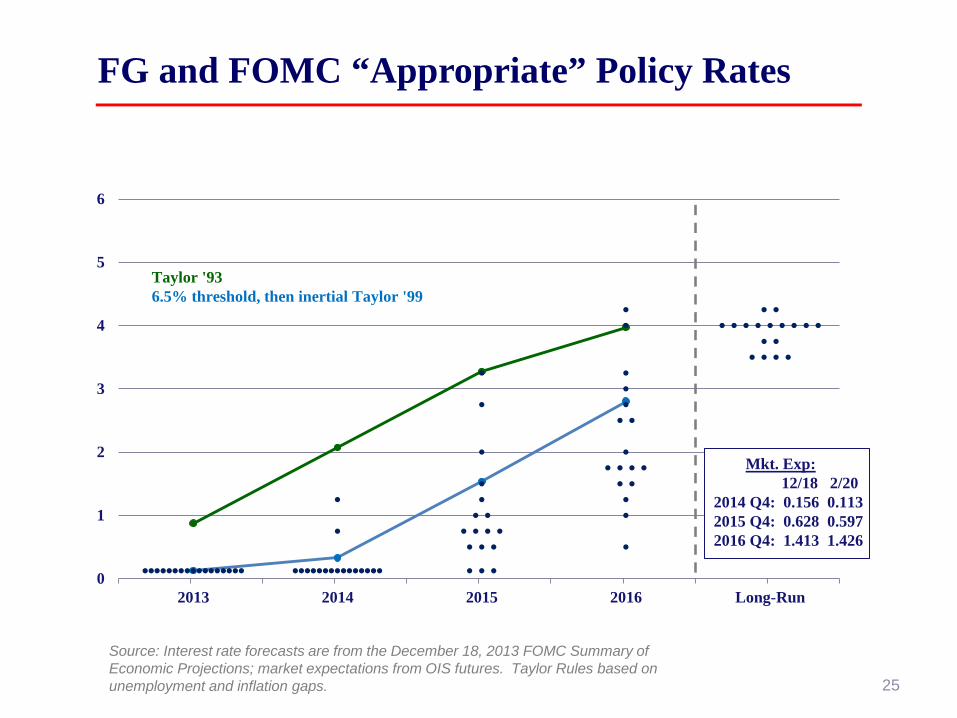
0
1
2
3
4
5
6
2013 2014 2015 2016 Long-Run
Taylor '93 6.5% threshold, then inertial Taylor '99
Mkt. Exp: 12/18 2/20 2014 Q4: 0.156 0.113 2015 Q4: 0.628 0.597 2016 Q4: 1.413 1.426
FG and FOMC “Appropriate” Policy Rates
Source: Interest rate forecasts are from the December 18, 2013 FOMC Summary of Economic Projections; market expectations from OIS futures. Taylor Rules based on unemployment and inflation gaps. 25
Option 2: Large Scale Asset Purchases (LSAP)
LSAP I (11/08): $600 bill agency debt/MBS
LSAP Ia (3/09): $850 bill agency debt/MBS; $300 bill Treas.
LSAP II (11/10): $600 bill Treas.
MEP (9/11): Exchange $400 bill short-term for $400 bill long-term Treas.
MEP extension (6/12): Extend MEP through end of 2012
26
Option 2: Large Scale Asset Purchases (LSAP)
LSAP III (9/12): $40 bill per month MBS, no fixed end date -- “until labor market outlook improved substantially”
LSAP IIIa (12/12): $40 bill per month MBS and $45 bill per month long-term Treas; no fixed end date
Purchases reduced $10 billion in 12/13 and 1/14
Current mkt expect purchases end in October 2014 => total purchases since January 2013 at about $1.5 trillion
27
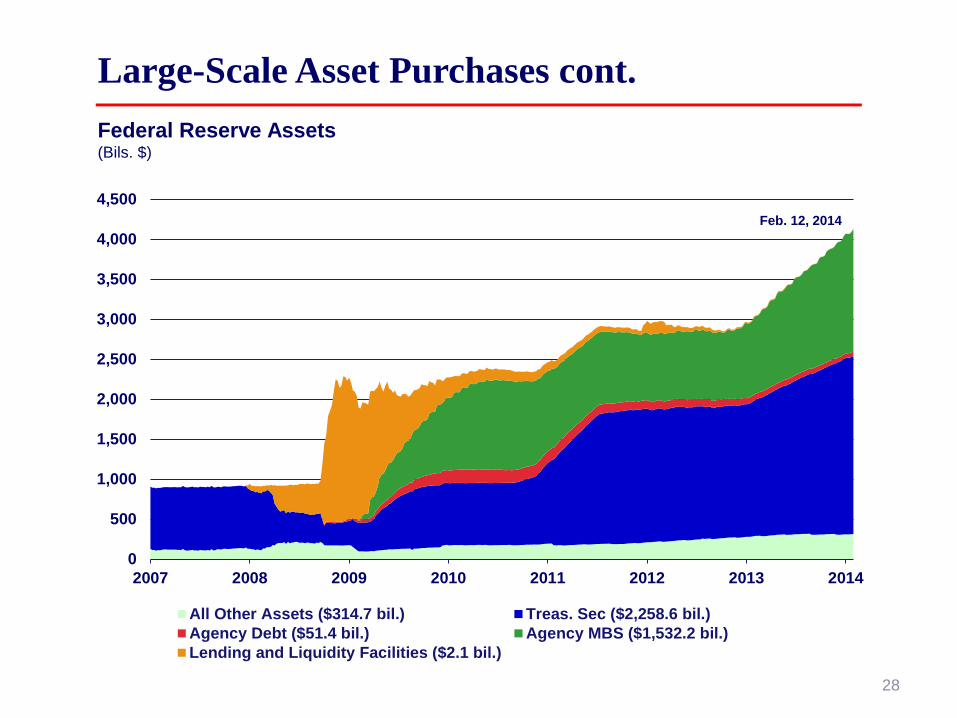
0
500
1,000
1,500
2,000
2,500
3,000
3,500
4,000
4,500
2007 2008 2009 2010 2011 2012 2013 2014
All Other Assets ($314.7 bil.) Treas. Sec ($2,258.6 bil.)Agency Debt ($51.4 bil.) Agency MBS ($1,532.2 bil.)Lending and Liquidity Facilities ($2.1 bil.)
Large-Scale Asset Purchases cont. Federal Reserve Assets (Bils. $)
Feb. 12, 2014
28
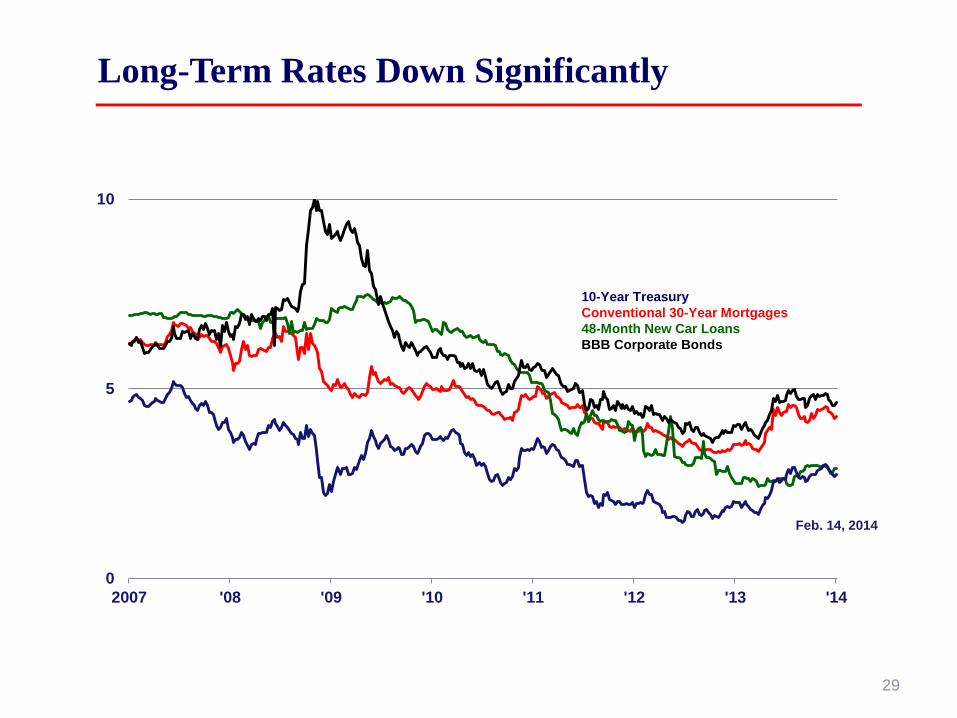
Long-Term Rates Down Significantly
0
5
10
2007 '08 '09 '10 '11 '12 '13 '14
10-Year Treasury Conventional 30-Year Mortgages 48-Month New Car Loans BBB Corporate Bonds
Feb. 14, 2014
29
1.5
2.0
2.5
3.0
3.5
Mar Apr May Jun Jul Aug Sep Oct Nov Dec Jan Feb
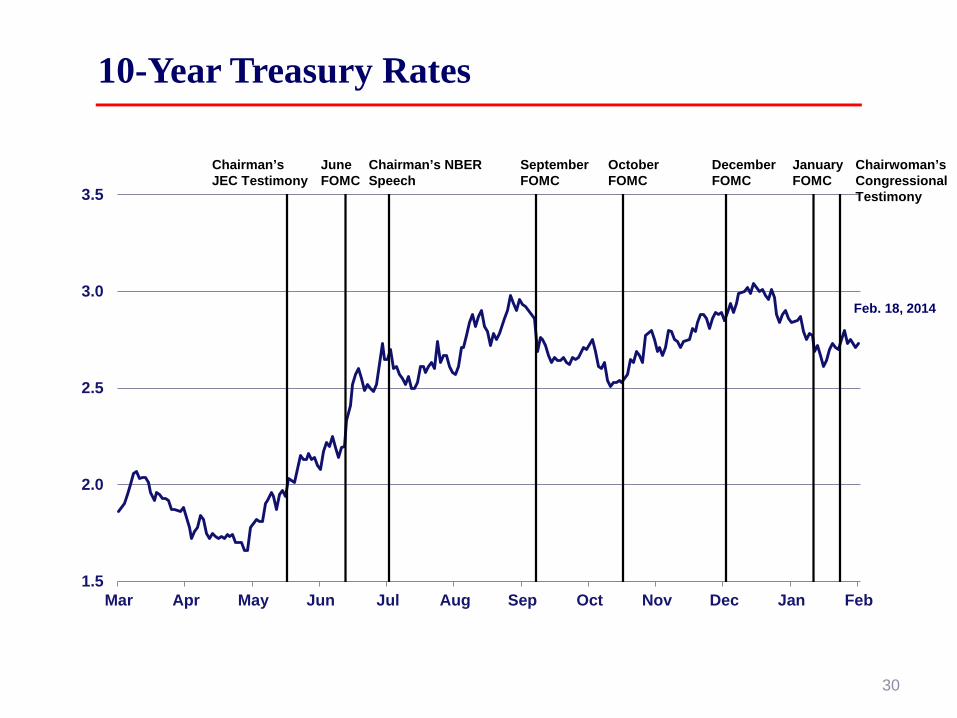
10-Year Treasury Rates
Feb. 18, 2014
Chairman’s JEC Testimony
September FOMC
June FOMC
Chairman’s NBER Speech
October FOMC
December FOMC
January FOMC
Chairwoman’s Congressional Testimony
30
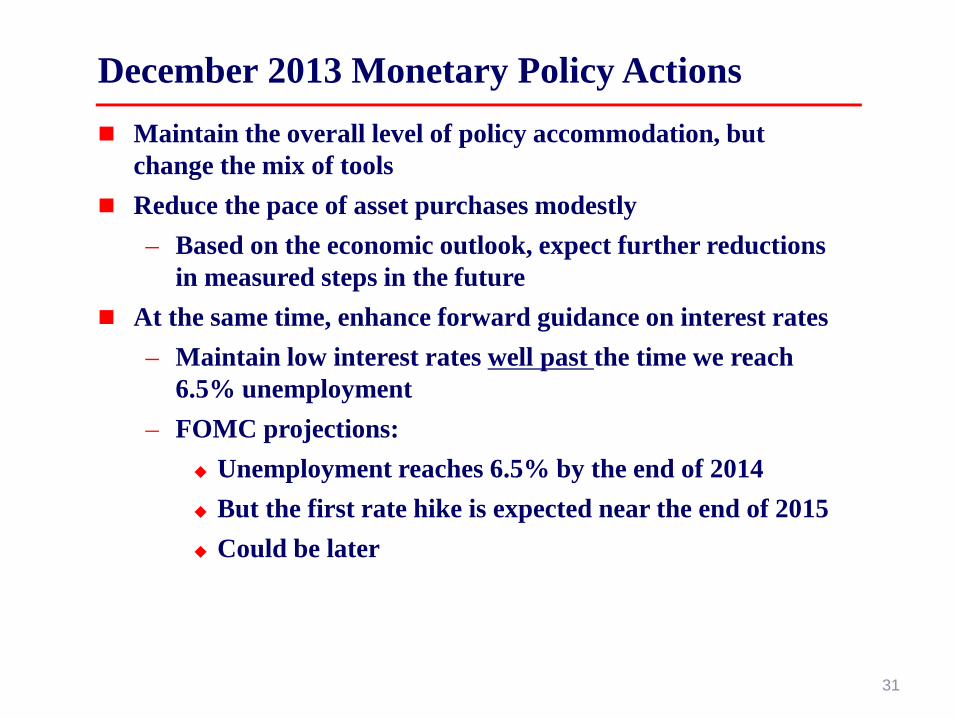
Maintain the overall level of policy accommodation, but change the mix of tools
Reduce the pace of asset purchases modestly – Based on the economic outlook, expect further reductions
in measured steps in the future At the same time, enhance forward guidance on interest rates
– Maintain low interest rates well past the time we reach 6.5% unemployment
– FOMC projections: Unemployment reaches 6.5% by the end of 2014 But the first rate hike is expected near the end of 2015 Could be later
December 2013 Monetary Policy Actions
31
0
1
2
3
4
5
6
2007 '08 '09 '10 '11 '12 '13 '14 '15 '16
Central Tendency of FOMC Long-Run
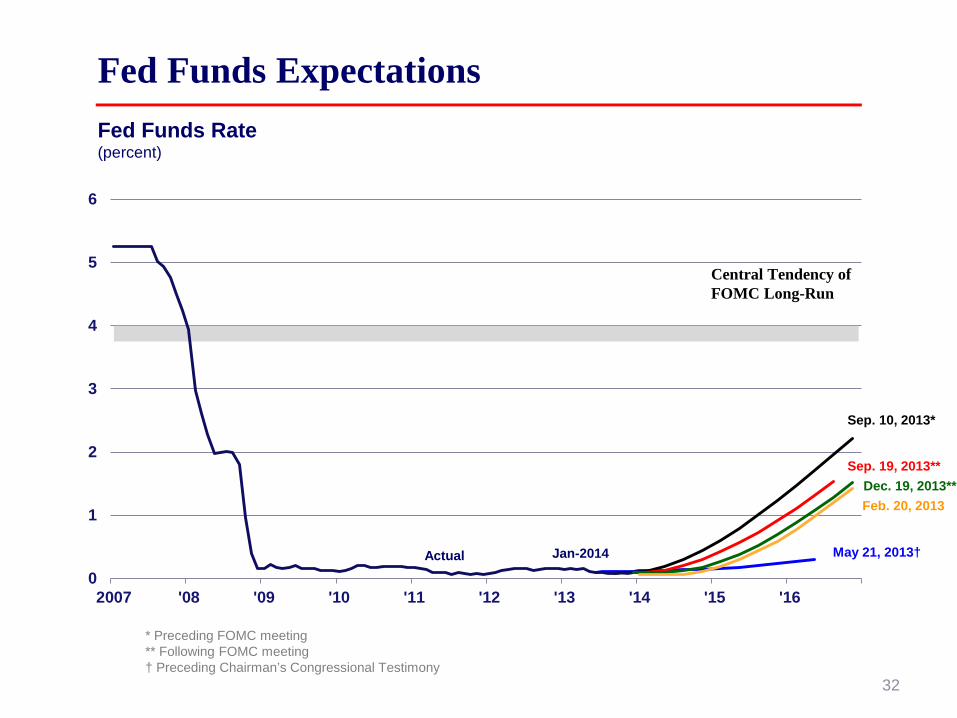
Fed Funds Rate (percent)
Fed Funds Expectations
May 21, 2013† Jan-2014
Sep. 10, 2013*
Sep. 19, 2013**
Actual
Dec. 19, 2013**
* Preceding FOMC meeting ** Following FOMC meeting † Preceding Chairman’s Congressional Testimony
Feb. 20, 2013
32
Appendix
33

Empirical Facts about Term Premia
Source: Ben Bernanke, “Long-Term Interest Rates,” San Francisco, March 1, 2013 34
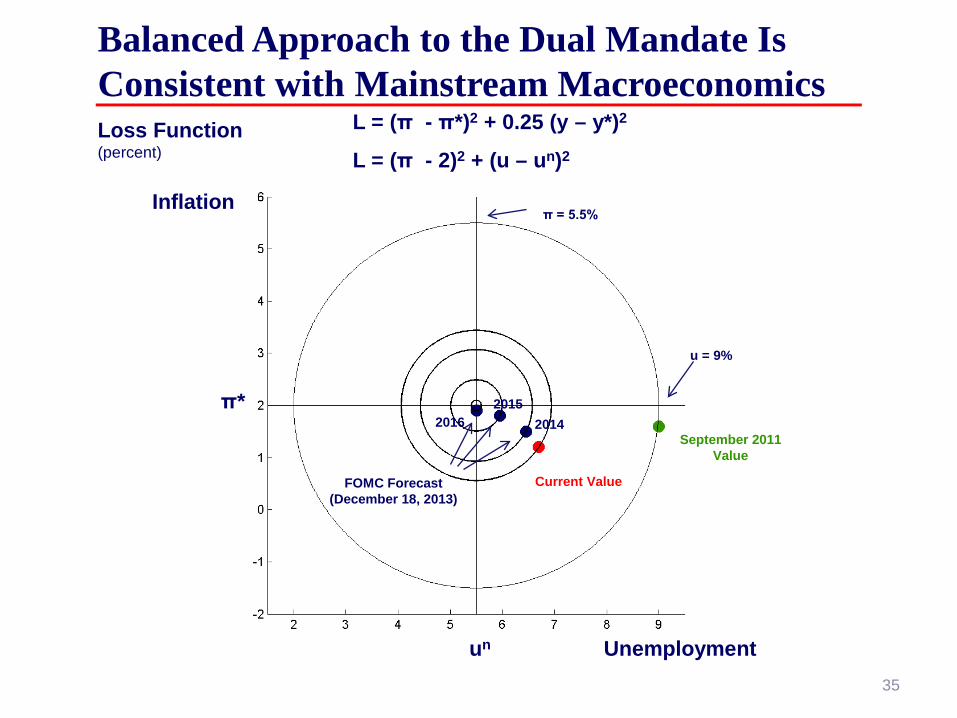
Balanced Approach to the Dual Mandate Is Consistent with Mainstream Macroeconomics Loss Function (percent)
L = (π - π*)2 + 0.25 (y – y*)2
L = (π - 2)2 + (u – un)2
FOMC Forecast (December 18, 2013)
Current Value
u = 9%
September 2011 Value
π = 5.5%
2016 2014 2015 π*
un
Inflation
Unemployment
35
0
1
2
3
4
5
6
2011 2012 2013 2014 2015 2016 2017 2018
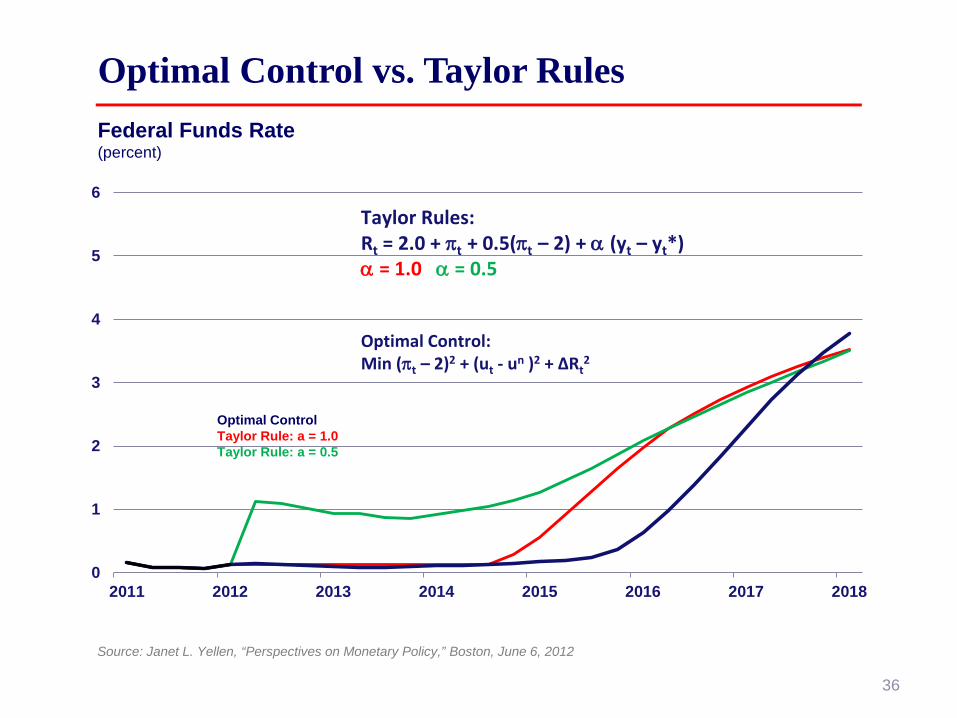
Taylor Rules: Rt = 2.0 + πt + 0.5(πt – 2) + α (yt – yt*) α = 1.0 α = 0.5
Optimal Control: Min (πt – 2)2 + (ut - un )2 + ΔRt
2
Optimal Control vs. Taylor Rules Federal Funds Rate (percent)
Optimal Control Taylor Rule: a = 1.0 Taylor Rule: a = 0.5
Source: Janet L. Yellen, “Perspectives on Monetary Policy,” Boston, June 6, 2012
36

4
5
6
7
8
9
10
2011 2013 2015 2017
Forecasts Under Alternative Policy Rules Unemployment Rate (percent)
Optimal Control Taylor Rule: a = 1.0 Taylor Rule: a = 0.5
1.0
1.5
2.0
2.5
3.0
3.5
4.0
2011 2013 2015 2017
PCE Inflation (4-quarter percent change)
Source: Janet L. Yellen, “The Economic Outlook and Monetary Policy,” New York, April 11, 2012
Optimal Control Taylor Rule: a = 1.0 Taylor Rule: a = 0.5
37
10
12
14
16
18
2005 2006 2007 2008 2009 2010 2011 2012 2013 2014 2015 2016
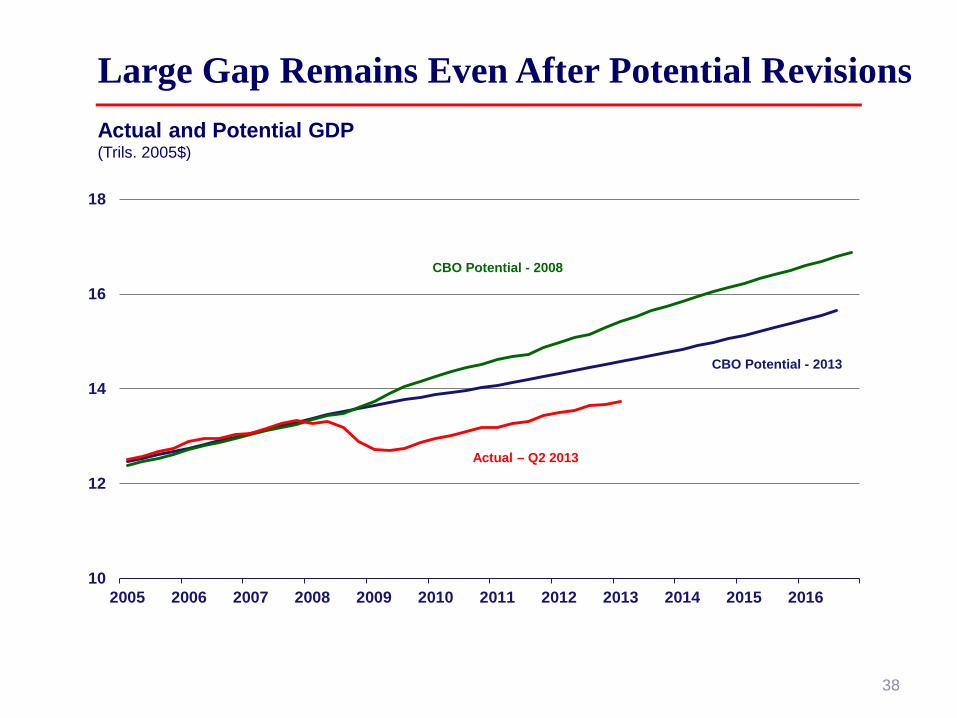
Large Gap Remains Even After Potential Revisions Actual and Potential GDP (Trils. 2005$)
Actual – Q2 2013
CBO Potential - 2013
CBO Potential - 2008
38
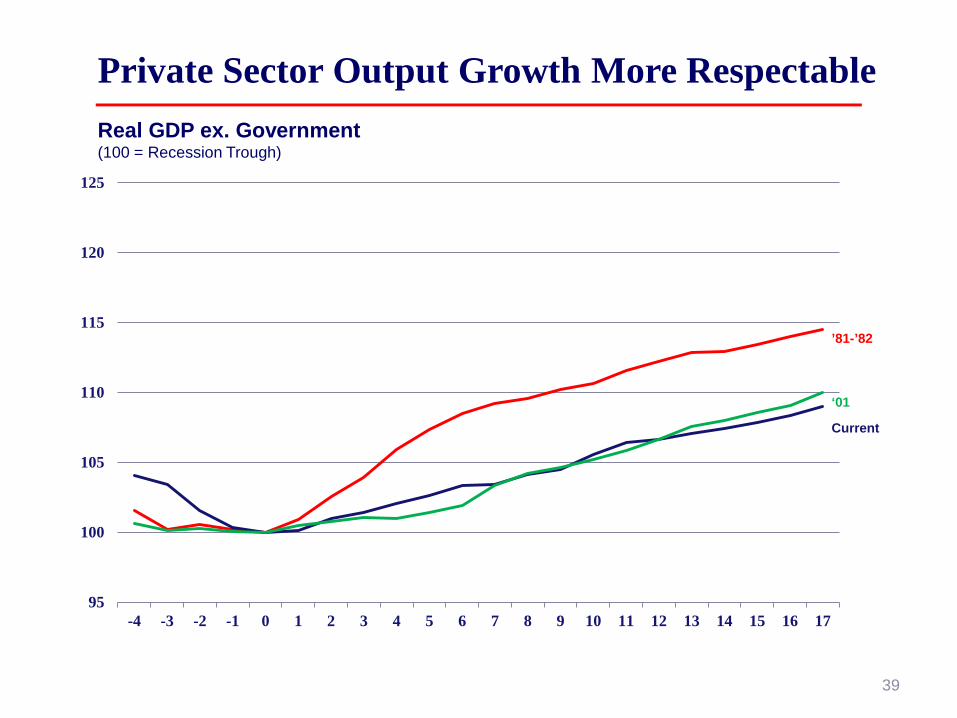
Private Sector Output Growth More Respectable Real GDP ex. Government (100 = Recession Trough)
Current
‘01
’81-’82
95
100
105
110
115
120
125
-4 -3 -2 -1 0 1 2 3 4 5 6 7 8 9 10 11 12 13 14 15 16 17
39

95
100
105
110
115
120
125
-4 -3 -2 -1 0 1 2 3 4 5 6 7 8 9 10 11 12 13 14 15 16 17
Consumption Recovery Especially Slow Per Capita Real PCE (100 = Recession Trough)
Current
‘01
’81-’82
40

Forward Guidance on Funds Rate: Woodford “Standard New Keynesian models imply that a higher level of expected real income or inflation in the future creates incentives for greater real expenditure and larger price increases now; but in the case of a conventional interest-rate reaction function for the central bank, short-term interest rates should increase, and the disincentive that this provides to current expenditure will attenuate (without completely eliminating) the sensitivity of current conditions to expectations. If nominal interest rates instead remain unchanged, the degree to which higher expected real income and inflation later produce higher real income and inflation now is amplified…. it is precisely when the interest-rate lower bound is expected to be a binding constraint for some time to come that expectations about the conduct of policy after the constraint ceases to bind should have a particularly large effect on current economic conditions…”
Source: Michael Woodford, “Methods of Policy Accommodation at the Interest-Rate Lower Bound,” Jackson Hole Symposium, September 16, 2012.
41
-6
-3
0
3
6
2000 '02 '04 '06 '08 '10 '121
2
3
4
5
2000 '02 '04 '06 '08 '10 '12
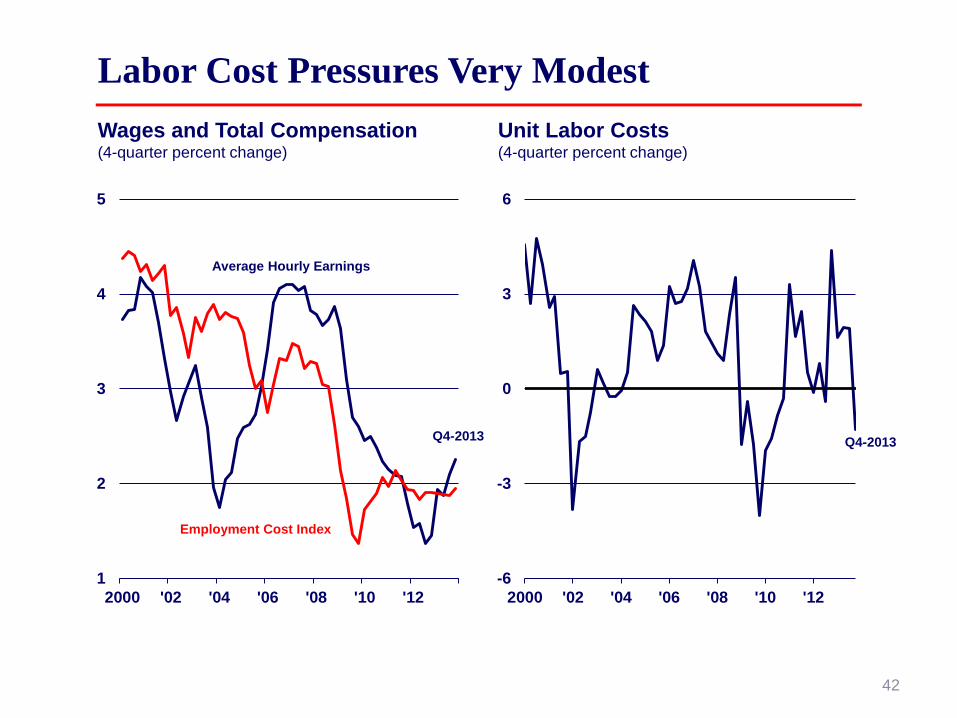
Labor Cost Pressures Very Modest Wages and Total Compensation (4-quarter percent change)
Unit Labor Costs (4-quarter percent change)
Employment Cost Index
Q4-2013 Q4-2013
Average Hourly Earnings
42