Embed Size (px)
Citation preview
U.S. Department of the InteriorU.S. Geological Survey
Earthquake Focal Mechanisms
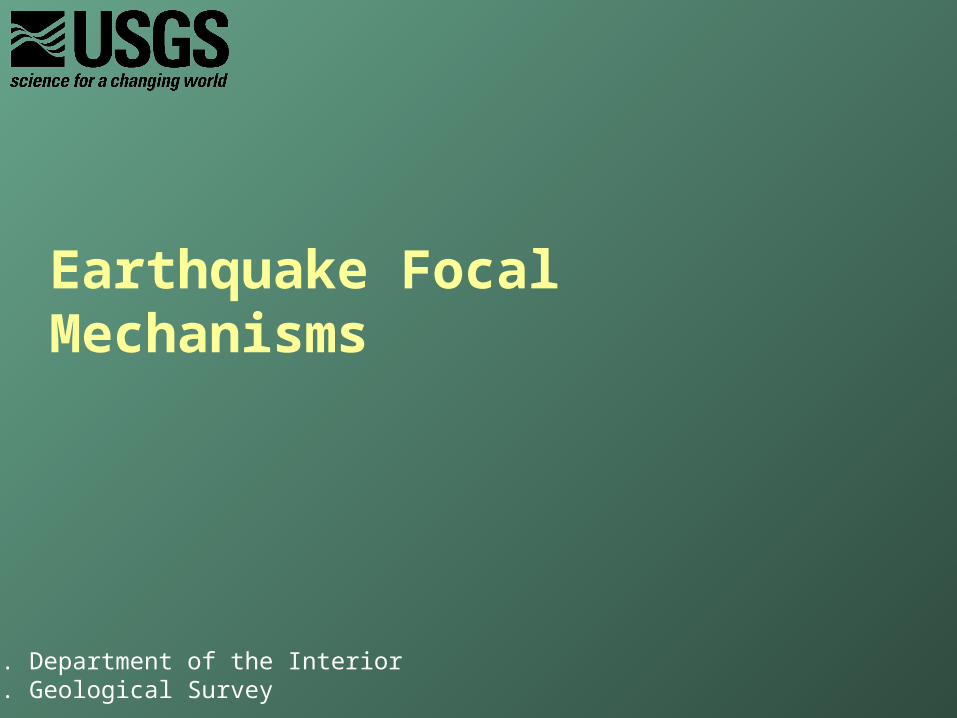
Focal Mechanism Solutions
Also called “beachball diagrams” “fault plane solutions”
Tell us the geometry and mechanism of the fault in a simple diagram
Generally reconstructed from waveform data derived from the moment tensor (which is more general), but originally calculated using first motions – done here to illustrate the concepts
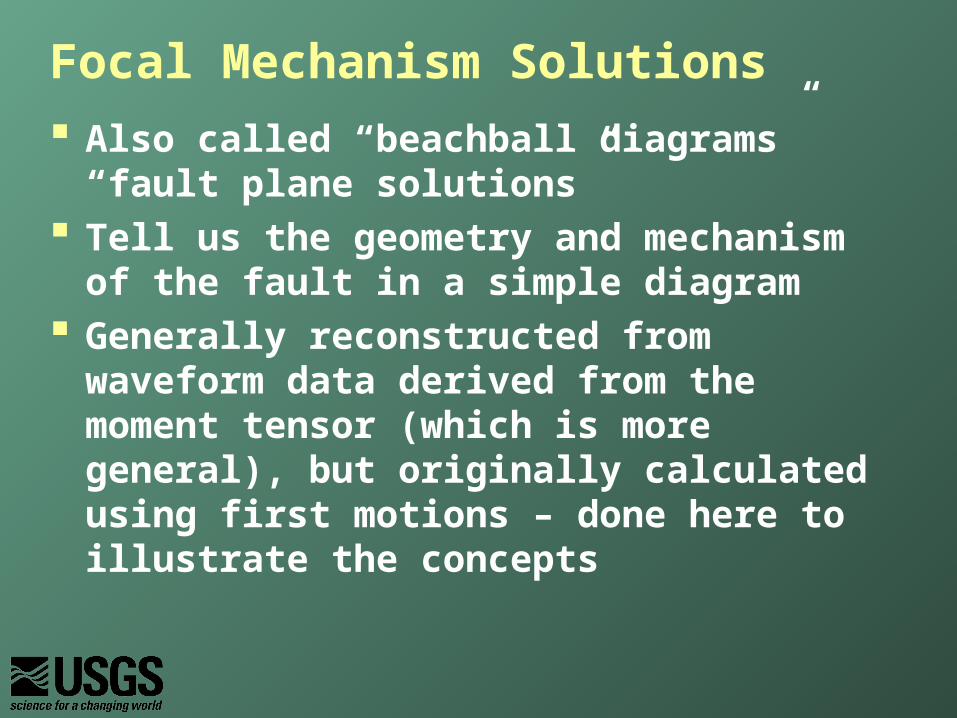
Examples
USGS

1) The stereographic projection
2) The geometry of first motions and how this is used to define fault motion.
Two steps to understanding
http://www.uwsp.edu/geo/projects/geoweb/participants/dutch/STRUCTGE/sphproj.htm

Stereographic projection
A method of projecting half a sphere onto a circle.
e.g. planes cutting vertically through the sphere plot as straight lines
Images from http://www.learninggeoscience.net/free/00071/index.html
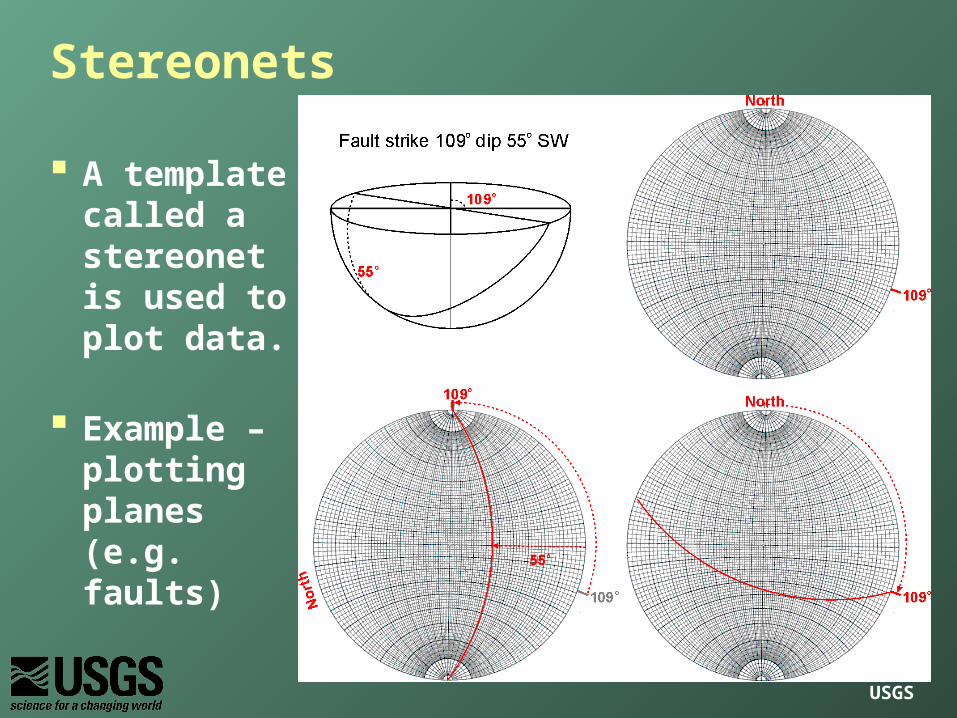
Stereonets
A template called a stereonet is used to plot data.
Example – plotting planes (e.g. faults)
USGS
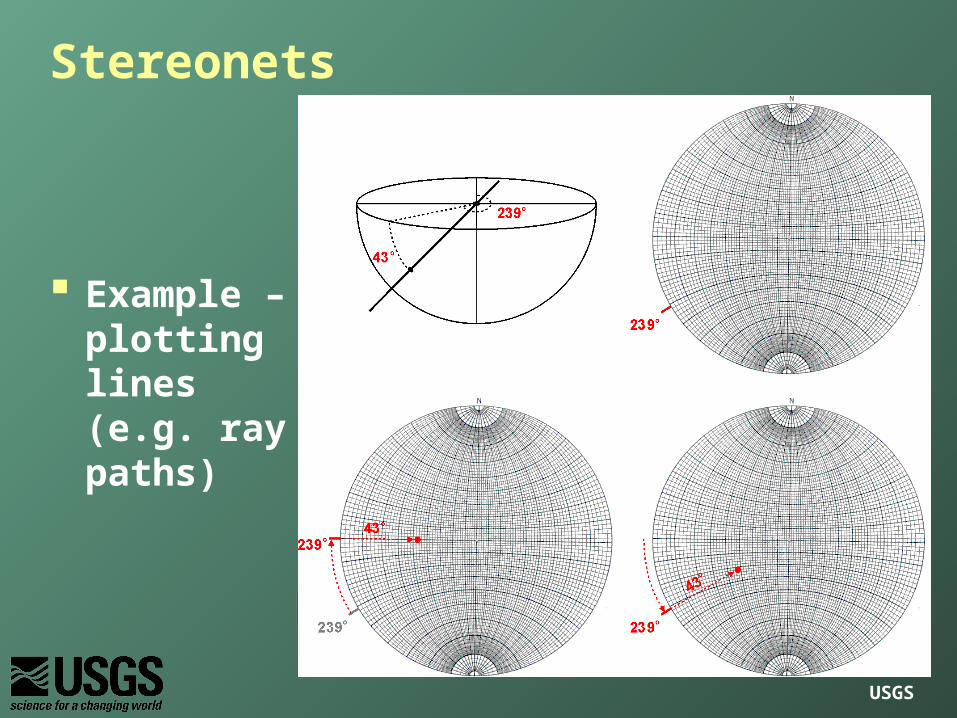
Stereonets
Example – plotting lines (e.g. ray paths)
USGS

Stereonets
Example – pitch (or rake) of a line on a plane (e.g. the slip direction on a fault)
USGS
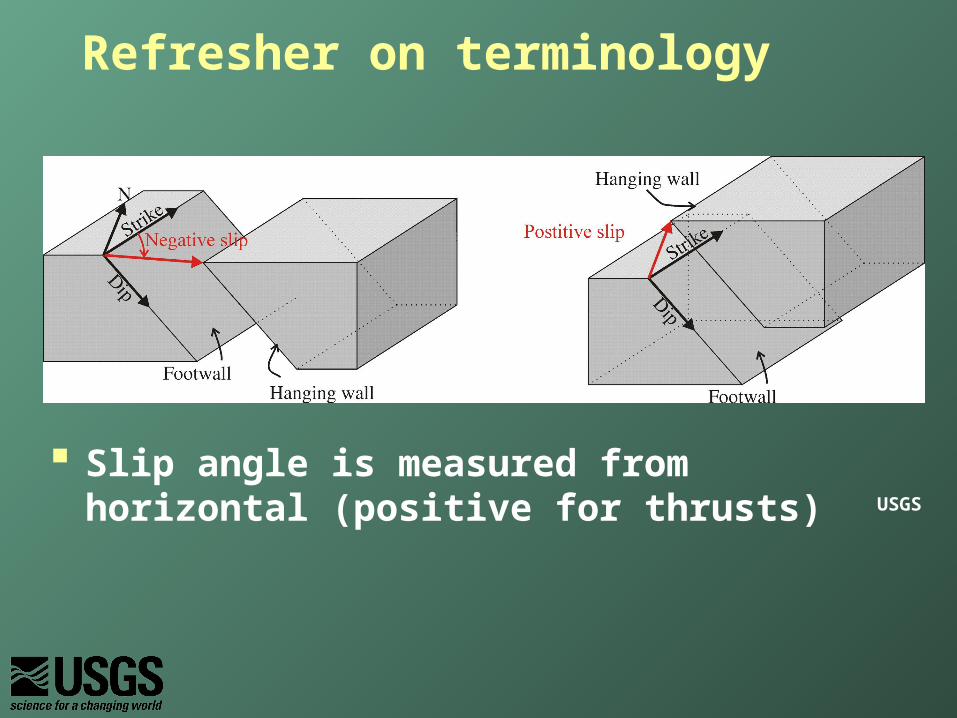
Refresher on terminology
USGS
Slip angle is measured from horizontal (positive for thrusts)
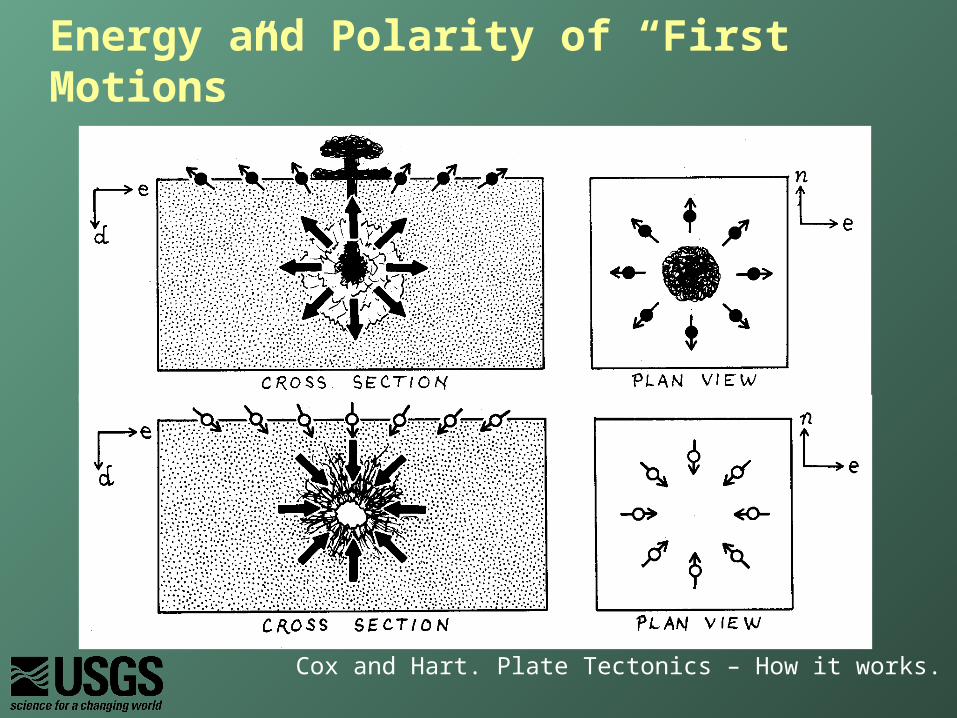
Energy and Polarity of “First Motions”
Cox and Hart. Plate Tectonics – How it works.
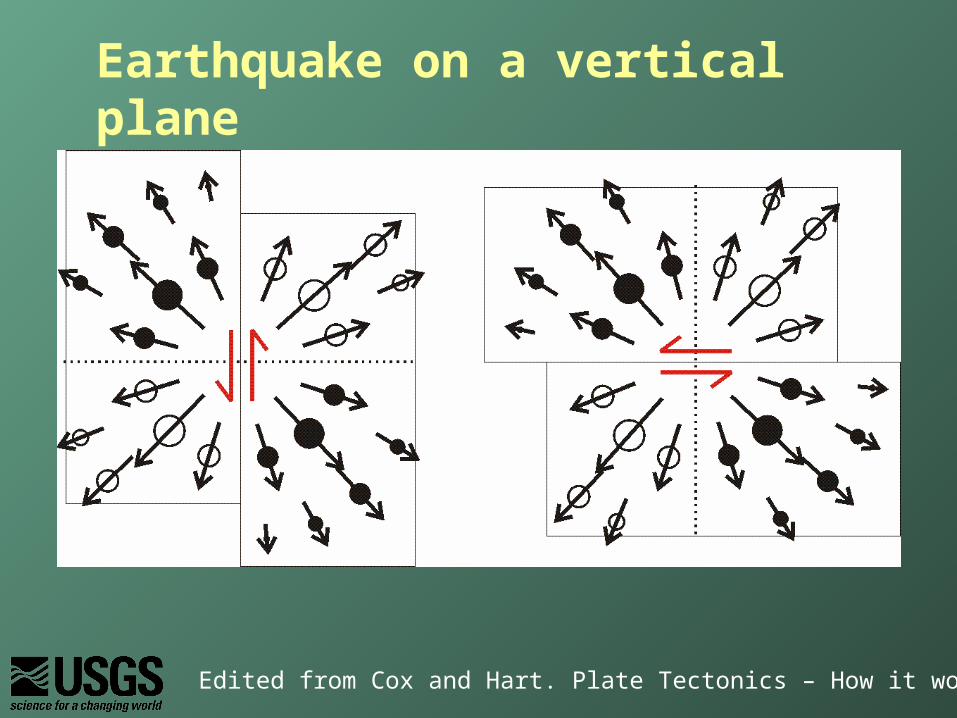
Earthquake on a vertical plane
Edited from Cox and Hart. Plate Tectonics – How it works.
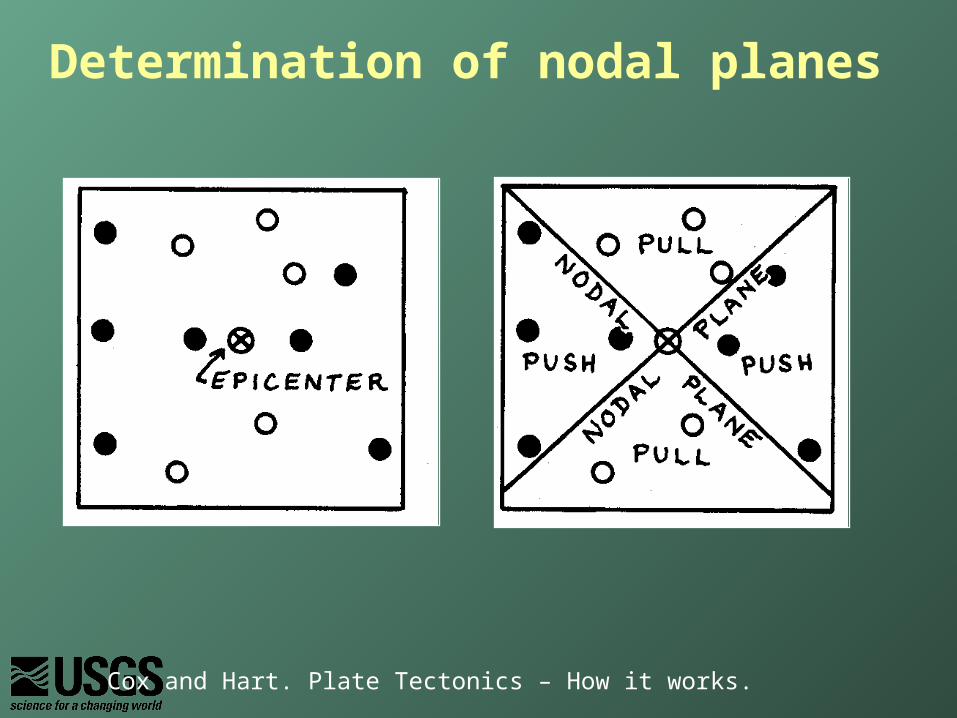
Determination of nodal planes
Cox and Hart. Plate Tectonics – How it works.
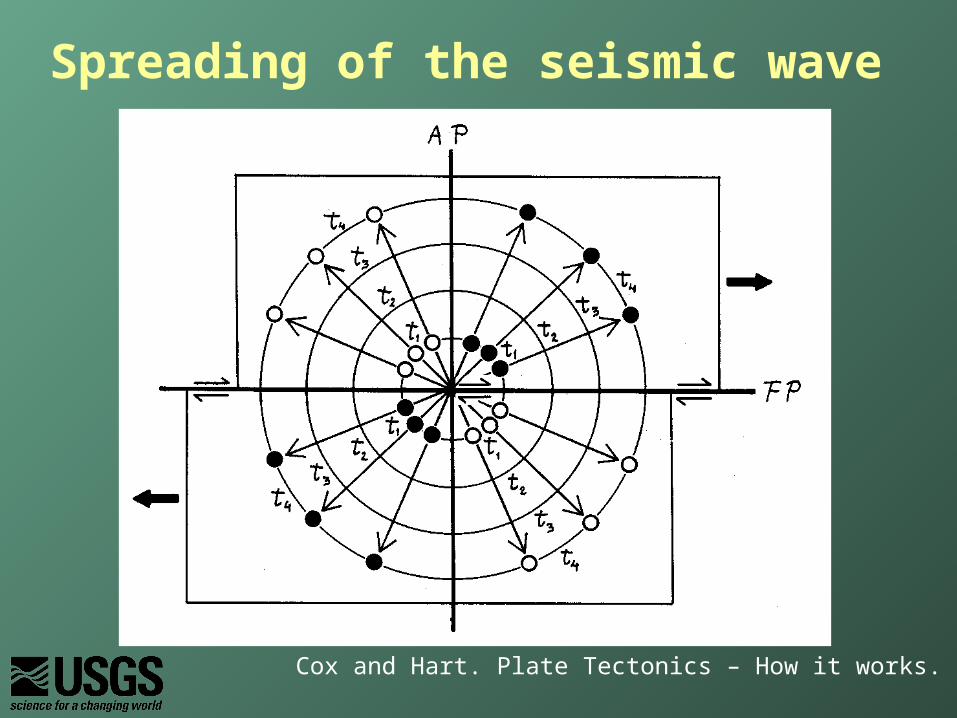
Spreading of the seismic wave
Cox and Hart. Plate Tectonics – How it works.

Data on the surface, interpreted in 3D
Cox and Hart. Plate Tectonics – How it works.

Take-off angle
The angle (from vertical) that the ray leaves the earthquake = take-off angle
Stein and Wysession, An Introduction to seismology, earthquakes and Earth structure
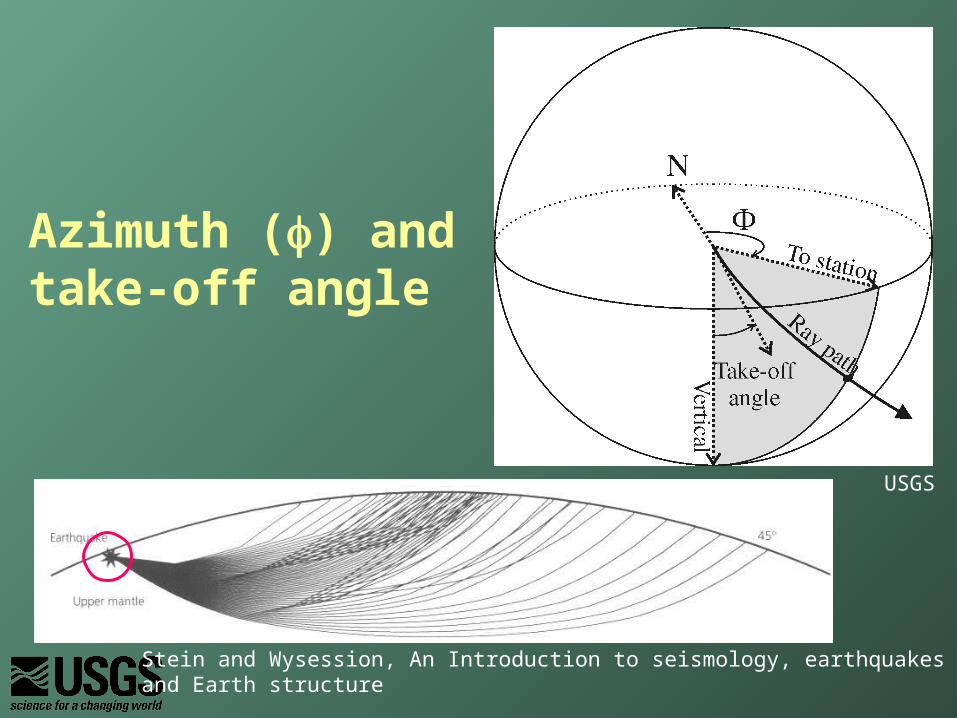
Azimuth () and take-off angle
USGS
Stein and Wysession, An Introduction to seismology, earthquakes and Earth structure
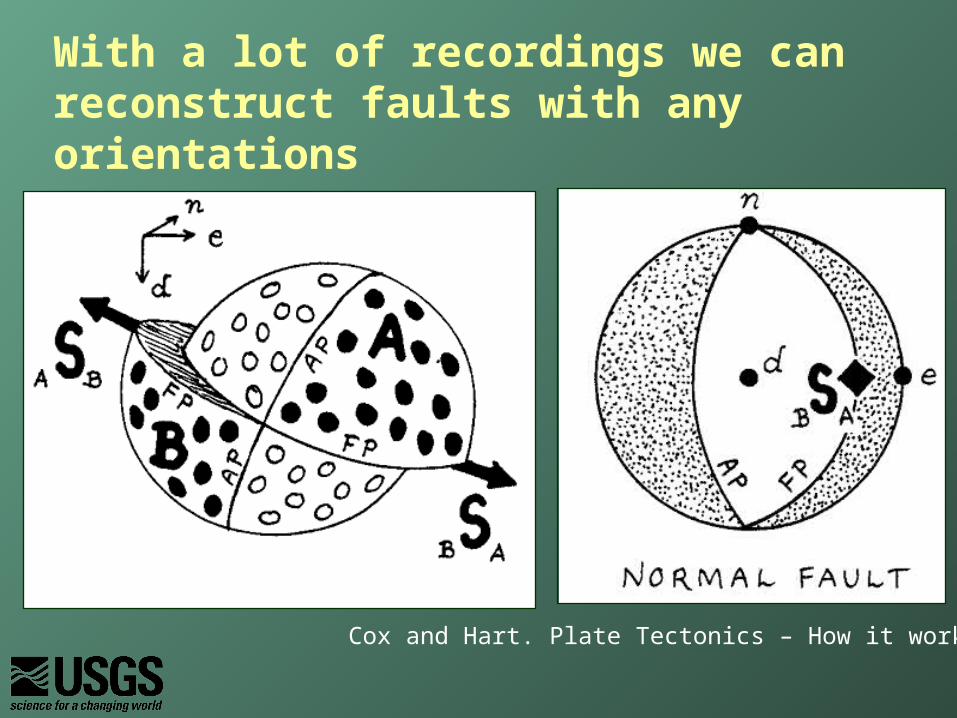
With a lot of recordings we can reconstruct faults with any orientations
Cox and Hart. Plate Tectonics – How it works.
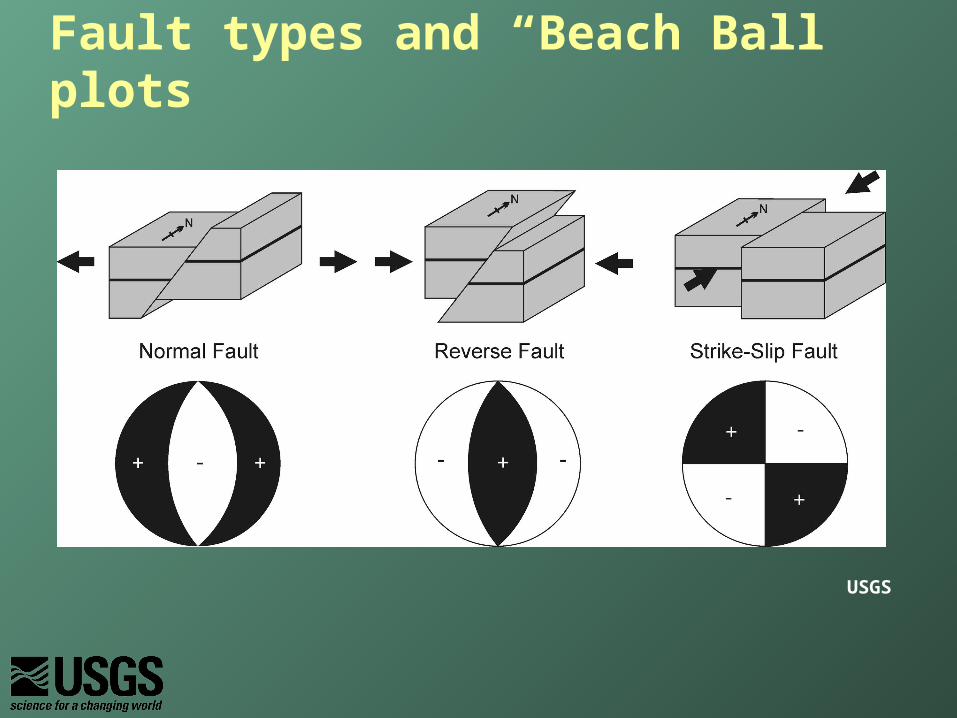
Fault types and “Beach Ball” plots
USGS
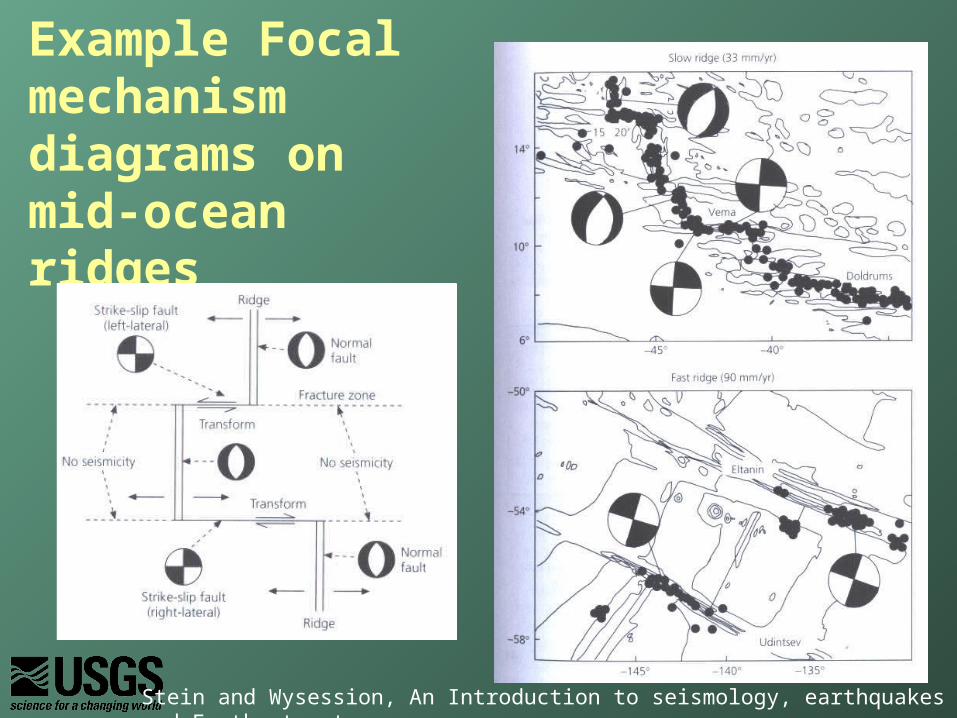
Example Focal mechanism diagrams on mid-ocean ridges
Stein and Wysession, An Introduction to seismology, earthquakes and Earth structure
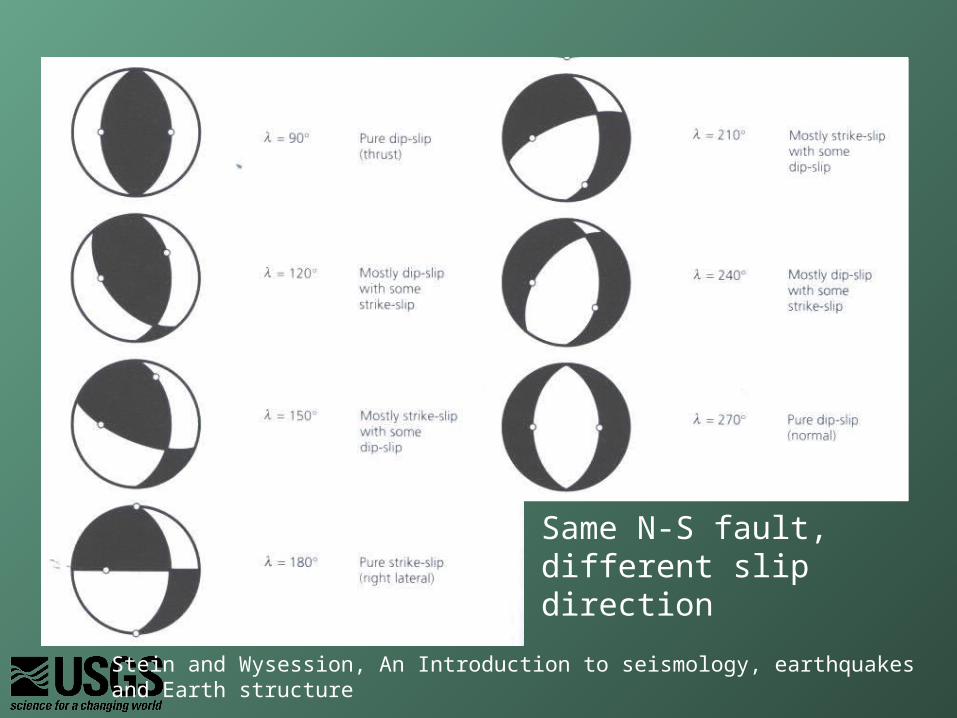
Same N-S fault, different slip direction
Stein and Wysession, An Introduction to seismology, earthquakes and Earth structure

Great review on the web at:
http://www.learninggeoscience.net/free/00071/

By constructing synthetic seismograms and comparing them to the recorded data we use more of the information in the seismogram, not just the arrival time and first motion data
Waveform modeling
Stein and Wysession, “An Introduction to seismology, earthquakes and Earth structure”
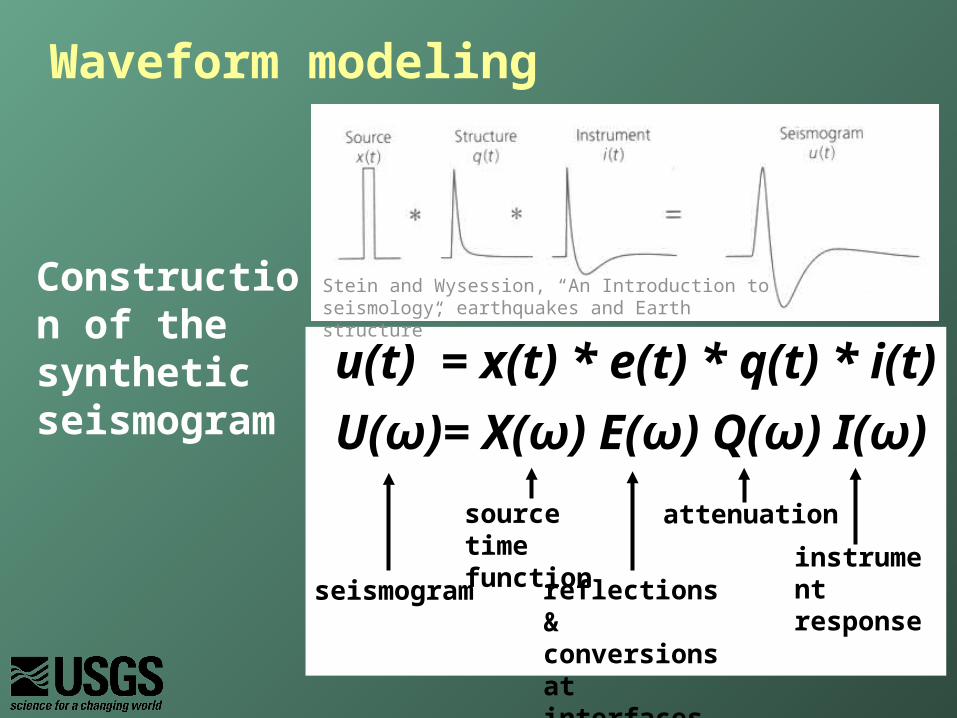
Waveform modeling
u(t) = x(t) * e(t) * q(t) * i(t)
seismogram
source time function instrument
responsereflections & conversions at interfaces
attenuation
U(ω)= X(ω) E(ω) Q(ω) I(ω)
Construction of the synthetic seismogram
Stein and Wysession, “An Introduction to seismology, earthquakes and Earth structure”

At one point on the fault slip takes a finite time (called “rise time”):
The slip travels along the fault at rupture velocity vr, so there is also a finite “rupture time”
Source-time function
Time
Slip
TDTime
Slip
rat
e
TD
Time
Slip
rat
e
TR
Fault= rupture
Map view
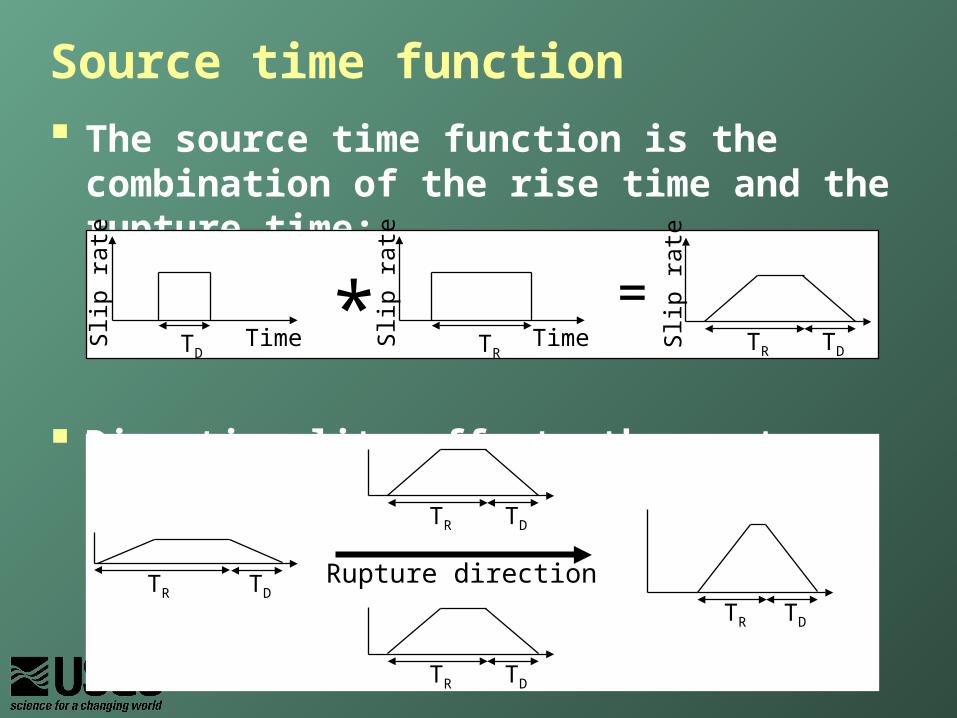
Source time function
The source time function is the combination of the rise time and the rupture time:
Directionality affects the rupture time
Time
Slip
rat
e
TDTime
Slip
rat
e
TR
Slip
rat
e
TR TD* =
TR TD
TR TD
TR TD
TR TDRupture direction
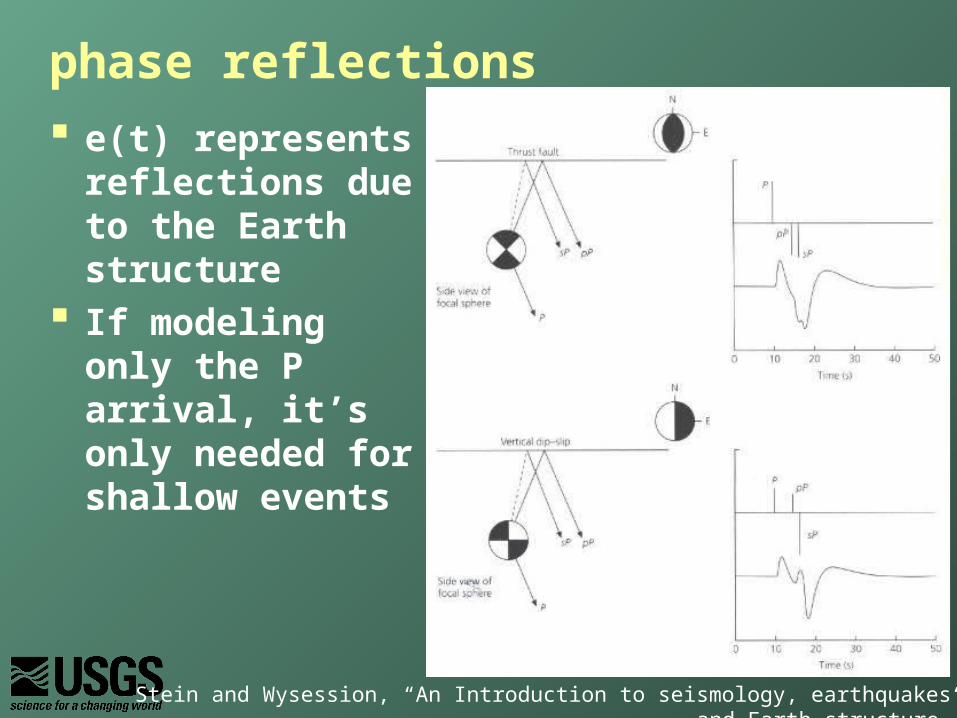
phase reflections
e(t) represents reflections due to the Earth structure
If modeling only the P arrival, it’s only needed for shallow events
Stein and Wysession, “An Introduction to seismology, earthquakes and Earth structure”
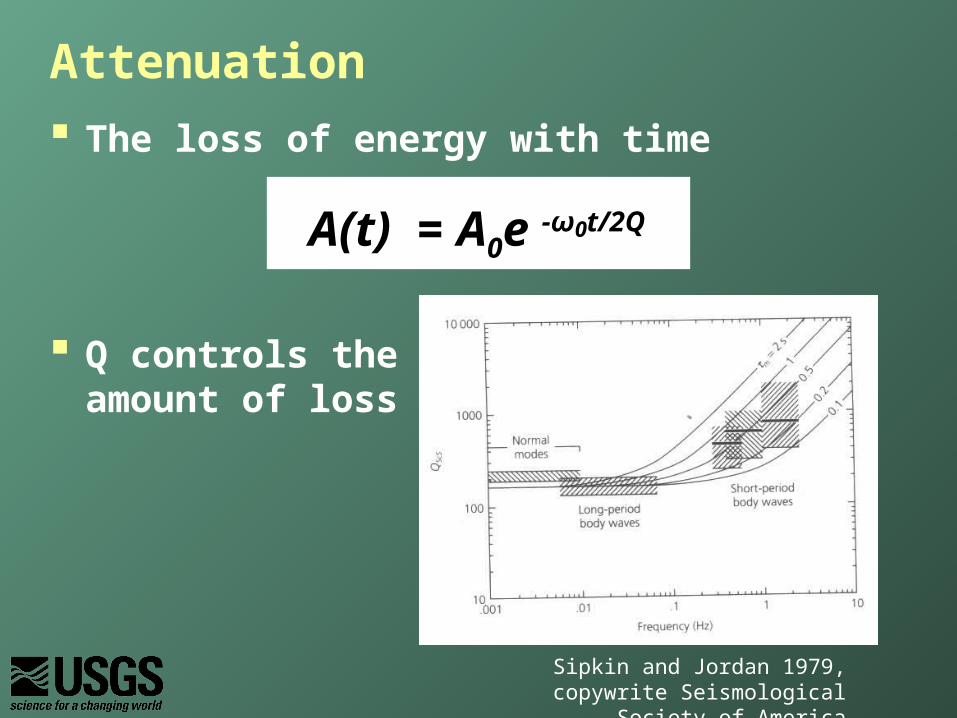
Attenuation
The loss of energy with time
Q controls the amount of loss
A(t) = A0e -ω0t/2Q
Sipkin and Jordan 1979, copywrite Seismological Society of America
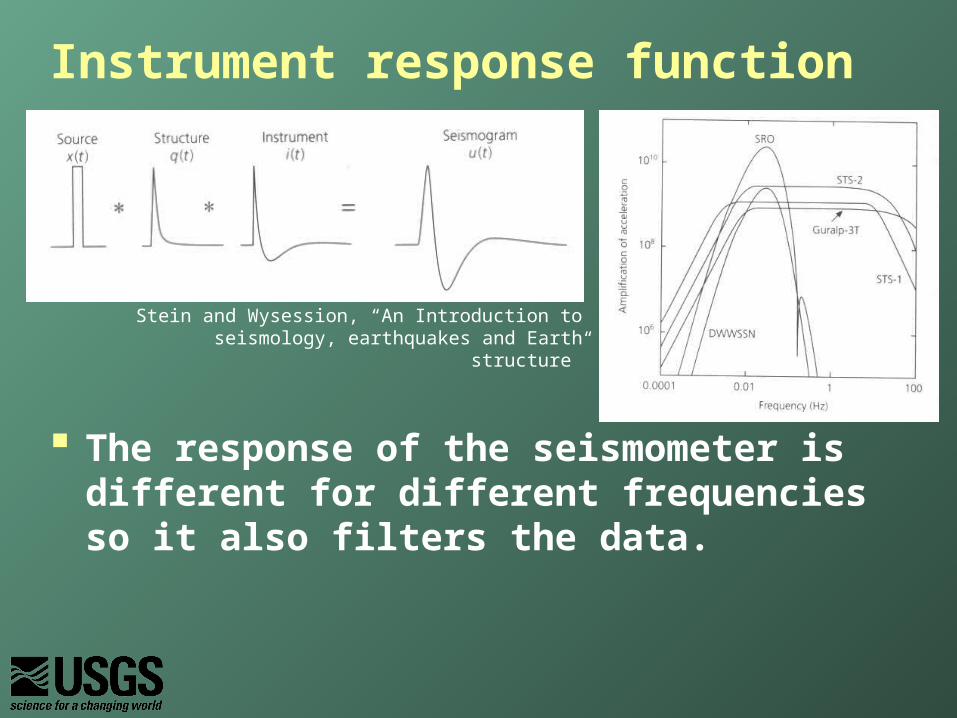
Instrument response function
The response of the seismometer is different for different frequencies so it also filters the data.
Stein and Wysession, “An Introduction to seismology, earthquakes and Earth structure”
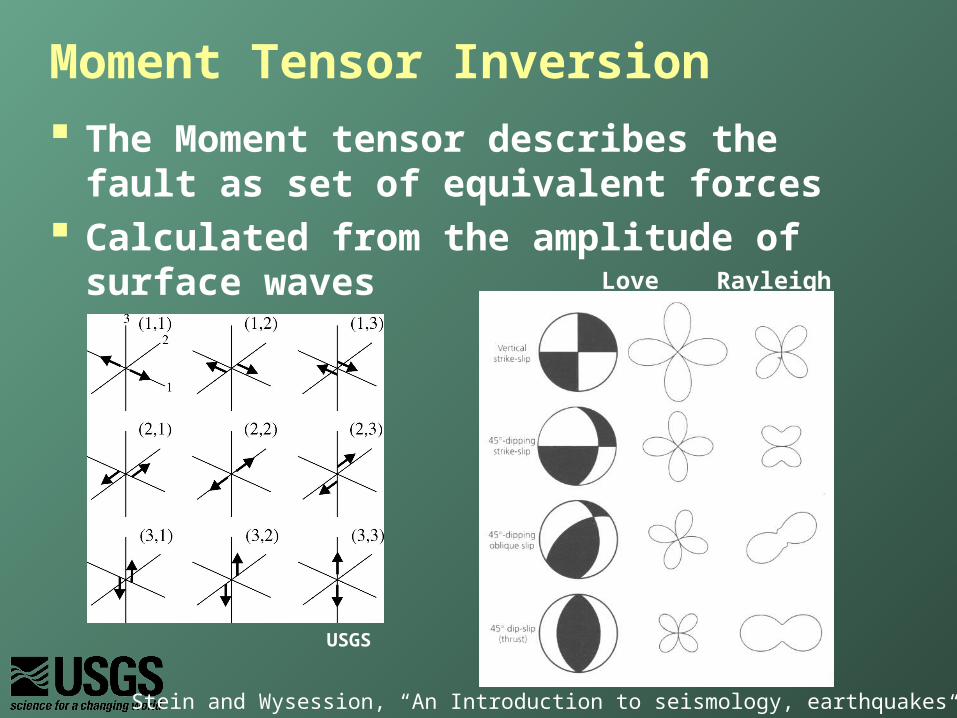
Moment Tensor Inversion
The Moment tensor describes the fault as set of equivalent forces
Calculated from the amplitude of surface waves Love Rayleigh
Stein and Wysession, “An Introduction to seismology, earthquakes and Earth structure”
USGS

![EARTHQUAKES: DETECTION, LOCATION & FOCAL GEOMETRY · 2011. 4. 20. · Normal to the Fault [Stein and Wysession, 2002] EARTHQUAKE SOURCE GEOMETRY The focal geometry of earthquakes](https://img.pdfslide.us/doc/110x75/60857bb83cc1d977241035ac/earthquakes-detection-location-focal-geometry-2011-4-20-normal-to-the.jpg)