Embed Size (px)
Citation preview

U.S. & Charlotte Economic Outlook: What’s Ahead for 2014
Mark Vitner, Managing Director & Senior EconomistJanuary 30, 2014
Economic Outlook 2
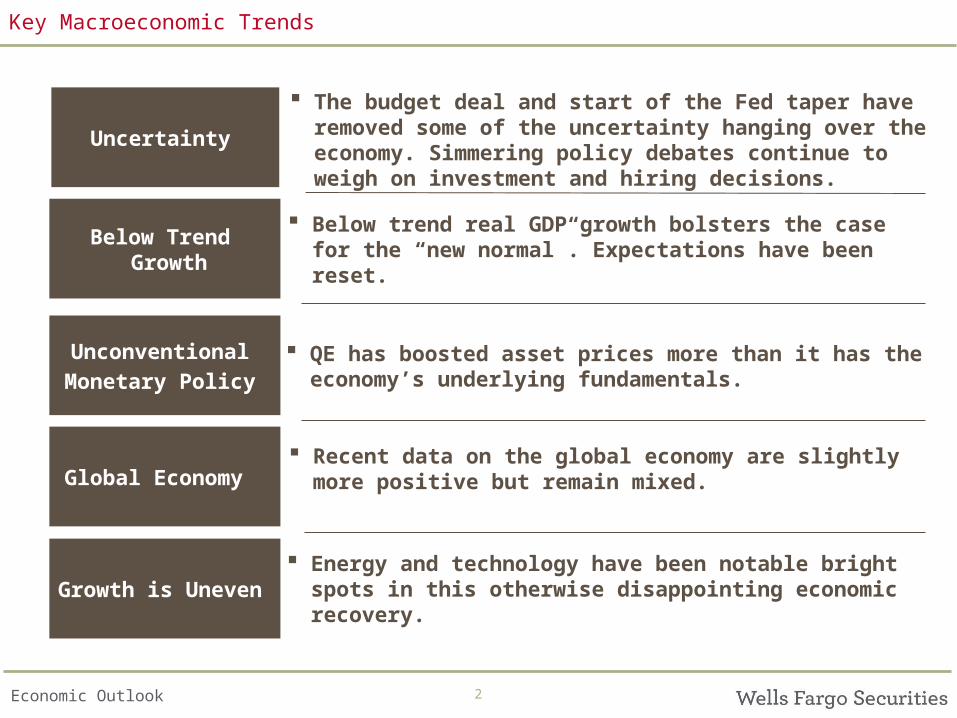
Key Macroeconomic Trends
Uncertainty
The budget deal and start of the Fed taper have removed some of the uncertainty hanging over the economy. Simmering policy debates continue to weigh on investment and hiring decisions.
Below Trend Growth
Below trend real GDP growth bolsters the case for the “new normal”. Expectations have been reset.
UnconventionalMonetary Policy
QE has boosted asset prices more than it has the economy’s underlying fundamentals.
Global Economy Recent data on the global economy are slightly
more positive but remain mixed.
Growth is Uneven Energy and technology have been notable bright
spots in this otherwise disappointing economic recovery.
Economic Outlook 3
-10%
-8%
-6%
-4%
-2%
0%
2%
4%
6%
8%
10%
-10%
-8%
-6%
-4%
-2%
0%
2%
4%
6%
8%
10%
2000 2002 2004 2006 2008 2010 2012 2014
U.S. Real GDP Bars = CAGR Line = Yr/Yr Percent Change
GDP - CAGR: Q3 @ 4.1%
GDP - Yr/Yr Percent Change: Q3 @ 2.0%
Forecast
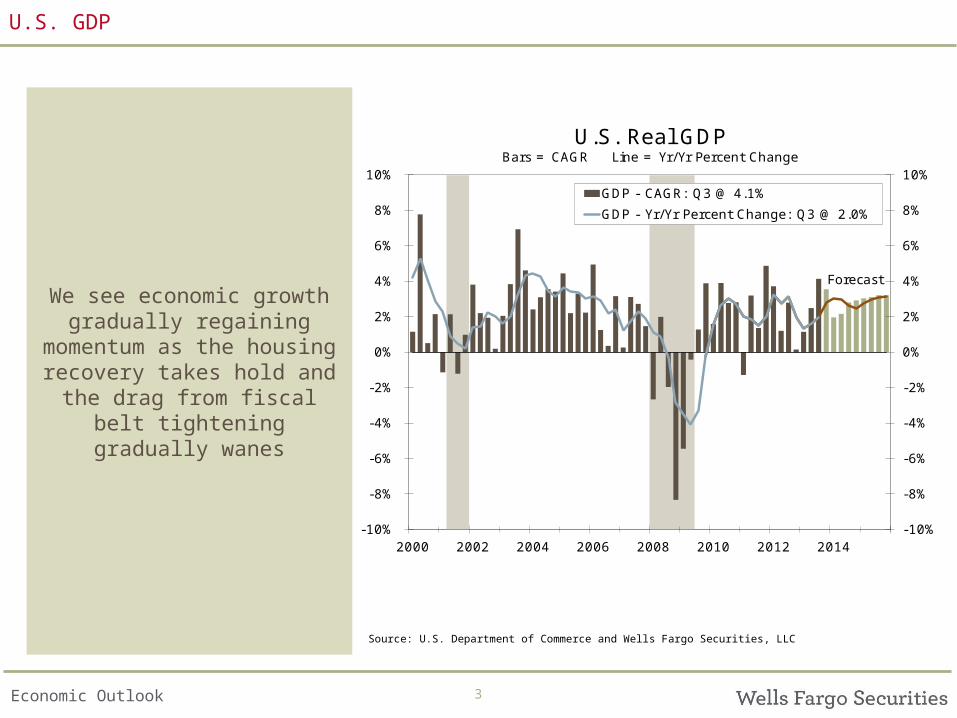
U.S. GDP
We see economic growth gradually regaining
momentum as the housing recovery takes hold and the
drag from fiscal belt tightening gradually wanes
Source: U.S. Department of Commerce and Wells Fargo Securities, LLC
Economic Outlook 44
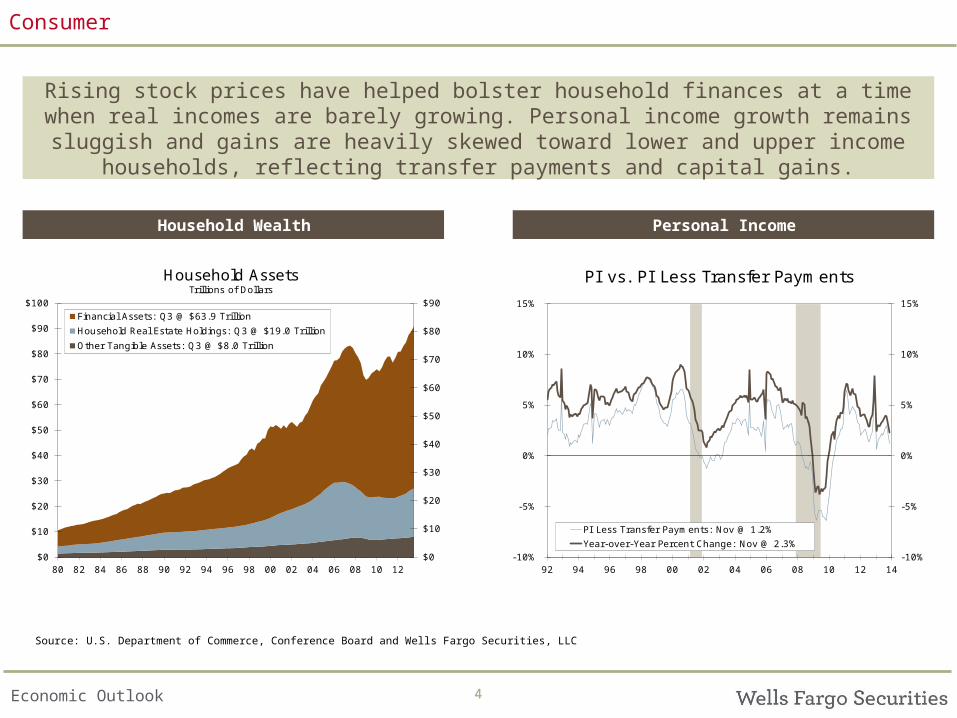
Consumer
Rising stock prices have helped bolster household finances at a time when real incomes are barely growing. Personal income growth remains sluggish and gains
are heavily skewed toward lower and upper income households, reflecting transfer payments and capital gains.
Source: U.S. Department of Commerce, Conference Board and Wells Fargo Securities, LLC
Personal IncomeHousehold Wealth
$0
$10
$20
$30
$40
$50
$60
$70
$80
$90
$0
$10
$20
$30
$40
$50
$60
$70
$80
$90
$100
80 82 84 86 88 90 92 94 96 98 00 02 04 06 08 10 12
Household AssetsTrillions of Dollars
Financial Assets: Q3 @ $63.9 Trillion
Household Real Estate Holdings: Q3 @ $19.0 Trillion
Other Tangible Assets: Q3 @ $8.0 Trillion
-10%
-5%
0%
5%
10%
15%
-10%
-5%
0%
5%
10%
15%
92 94 96 98 00 02 04 06 08 10 12 14
PI vs. PI Less Transfer Payments
PI Less Transfer Payments: Nov @ 1.2%
Year-over-Year Percent Change: Nov @ 2.3%
Client/Prospect Name
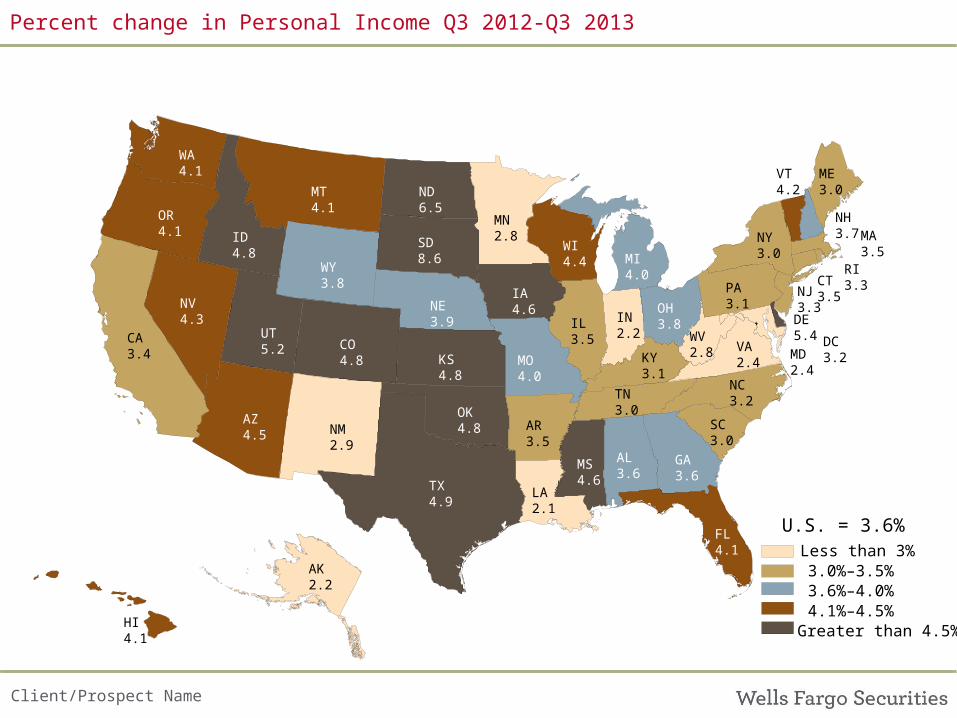
Percent change in Personal Income Q3 2012-Q3 2013
ID4.8
AR 3.5
AL3.6
ME3.0
KS4.8
SD8.6
OH3.8
WI4.4
AZ4.5
NH3.7
MT4.1
MS4.6
OK4.8
NV4.3 IL
3.5
GA3.6
FL4.1
CO4.8
CA3.4
NE3.9
MO4.0
UT5.2
NM2.9
WA4.1
IA4.6
MI4.0
LA2.1
VA2.4
TX4.9
PA3.1
IN2.2
NC3.2
MN2.8
KY3.1
VT4.2
TN3.0
OR4.1 NY
3.0
WV2.8
ND6.5
SC3.0
WY3.8
AK2.2
CT3.5
DE5.4
HI4.1
MA3.5
MD2.4
NJ3.3
RI3.3
DC3.2
U.S. = 3.6%
Greater than 4.5%
Less than 3%
4.1%–4.5%3.6%–4.0%3.0%–3.5%
Economic Outlook 66
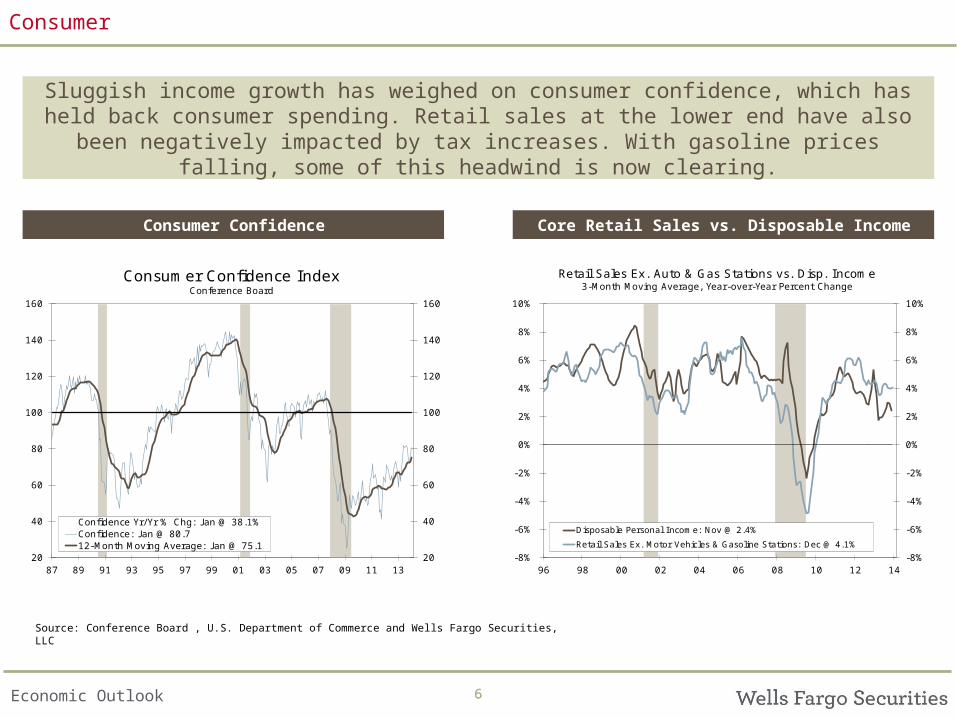
Consumer
Sluggish income growth has weighed on consumer confidence, which has held back consumer spending. Retail sales at the lower end have also been negatively impacted by tax increases. With gasoline prices falling, some of this headwind is
now clearing.
Source: Conference Board , U.S. Department of Commerce and Wells Fargo Securities, LLC
Core Retail Sales vs. Disposable IncomeConsumer Confidence
20
40
60
80
100
120
140
160
20
40
60
80
100
120
140
160
87 89 91 93 95 97 99 01 03 05 07 09 11 13
Consumer Confidence IndexConference Board
Confidence Yr/Yr % Chg: J an @ 38.1%Confidence: J an @ 80.712-Month Moving Average: J an @ 75.1
-8%
-6%
-4%
-2%
0%
2%
4%
6%
8%
10%
-8%
-6%
-4%
-2%
0%
2%
4%
6%
8%
10%
96 98 00 02 04 06 08 10 12 14
Retail Sales Ex. Auto & Gas Stations vs. Disp. Income3-Month Moving Average, Year-over-Year Percent Change
Disposable Personal Income: Nov @ 2.4%
Retail Sales Ex. Motor Vehicles & Gasoline Stations: Dec @ 4.1%
Economic Outlook 77
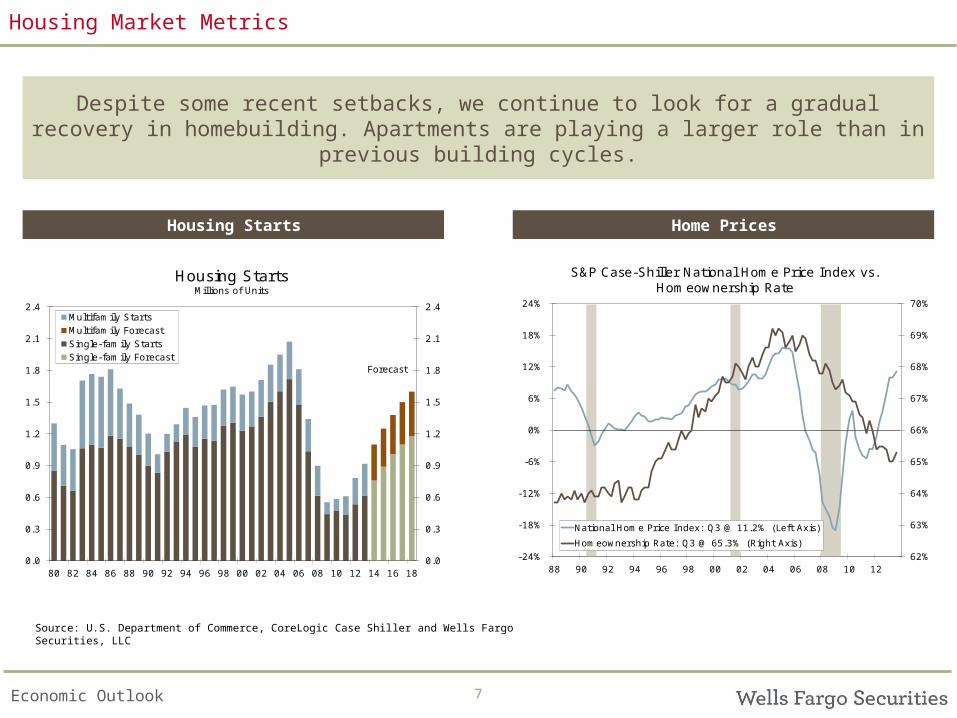
Housing Market Metrics
Despite some recent setbacks, we continue to look for a gradual recovery in homebuilding. Apartments are playing a larger role than in previous building
cycles.
Source: U.S. Department of Commerce, CoreLogic Case Shiller and Wells Fargo Securities, LLC
Home PricesHousing Starts
0.0
0.3
0.6
0.9
1.2
1.5
1.8
2.1
2.4
0.0
0.3
0.6
0.9
1.2
1.5
1.8
2.1
2.4
80 82 84 86 88 90 92 94 96 98 00 02 04 06 08 10 12 14 16 18
Th
ou
san
ds
Housing StartsMillions of Units
Multifamily StartsMultifamily ForecastSingle-family StartsSingle-family Forecast
Forecast
62%
63%
64%
65%
66%
67%
68%
69%
70%
-24%
-18%
-12%
-6%
0%
6%
12%
18%
24%
88 90 92 94 96 98 00 02 04 06 08 10 12
S&P Case-Shiller National Home Price Index vs. Homeownership Rate
National Home Price Index: Q3 @ 11.2% (Left Axis)
Homeownership Rate: Q3 @ 65.3% (Right Axis)
Economic Outlook 88
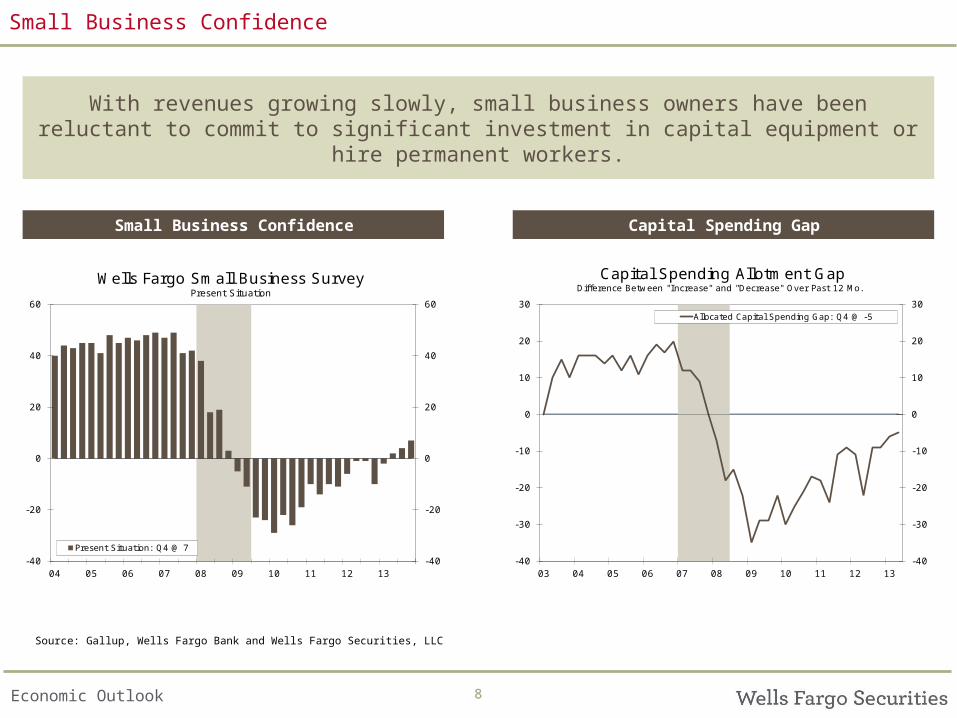
Small Business Confidence
With revenues growing slowly, small business owners have been reluctant to commit to significant investment in capital equipment or hire permanent workers.
Source: Gallup, Wells Fargo Bank and Wells Fargo Securities, LLC
Capital Spending GapSmall Business Confidence
-40
-20
0
20
40
60
-40
-20
0
20
40
60
04 05 06 07 08 09 10 11 12 13
Wells Fargo Small Business SurveyPresent Situation
Present Situation: Q4 @ 7
-40
-30
-20
-10
0
10
20
30
-40
-30
-20
-10
0
10
20
30
03 04 05 06 07 08 09 10 11 12 13
Capital Spending Allotment GapDifference Between "Increase" and "Decrease" Over Past 12 Mo.
Allocated Capital Spending Gap: Q4 @ -5

North Carolina & Charlotte
Economic Outlook 1010
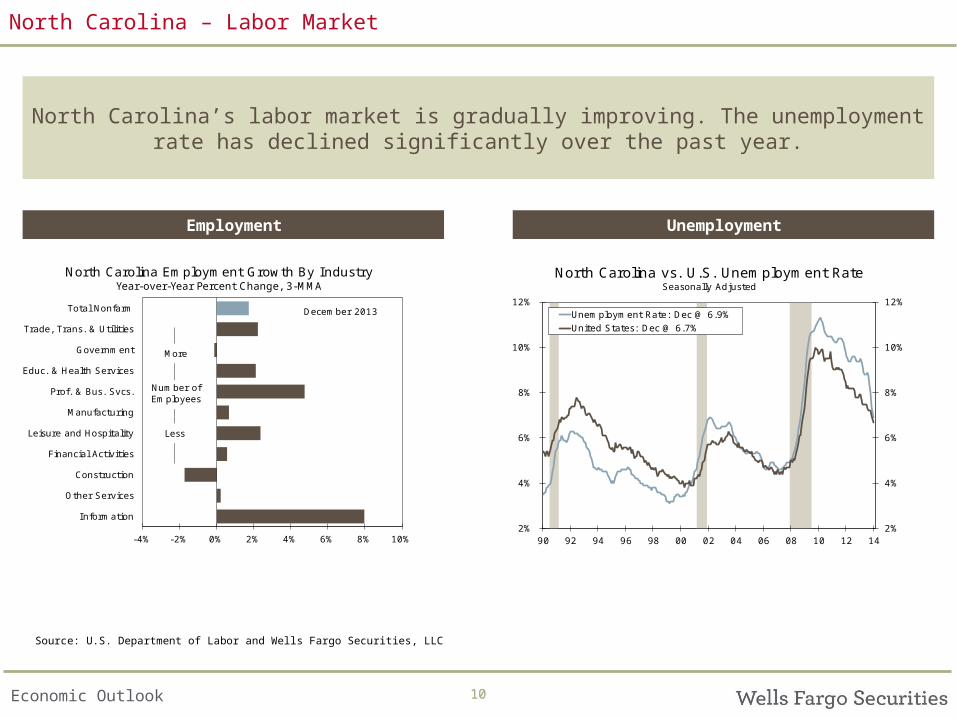
North Carolina – Labor Market
North Carolina’s labor market is gradually improving. The unemployment rate has declined significantly over the past year.
December 2013
-4% -2% 0% 2% 4% 6% 8% 10%
Information
Other Services
Construction
Financial Activities
Leisure and Hospitality
Manufacturing
Prof. & Bus. Svcs.
Educ. & Health Services
Government
Trade, Trans. & Utilities
Total Nonfarm
North Carolina Employment Growth By IndustryYear-over-Year Percent Change, 3-MMA
Number of Employees
Less
More
Source: U.S. Department of Labor and Wells Fargo Securities, LLC
UnemploymentEmployment
2%
4%
6%
8%
10%
12%
2%
4%
6%
8%
10%
12%
90 92 94 96 98 00 02 04 06 08 10 12 14
North Carolina vs. U.S. Unemployment RateSeasonally Adjusted
Unemployment Rate: Dec @ 6.9%United States: Dec @ 6.7%
Economic Outlook 11
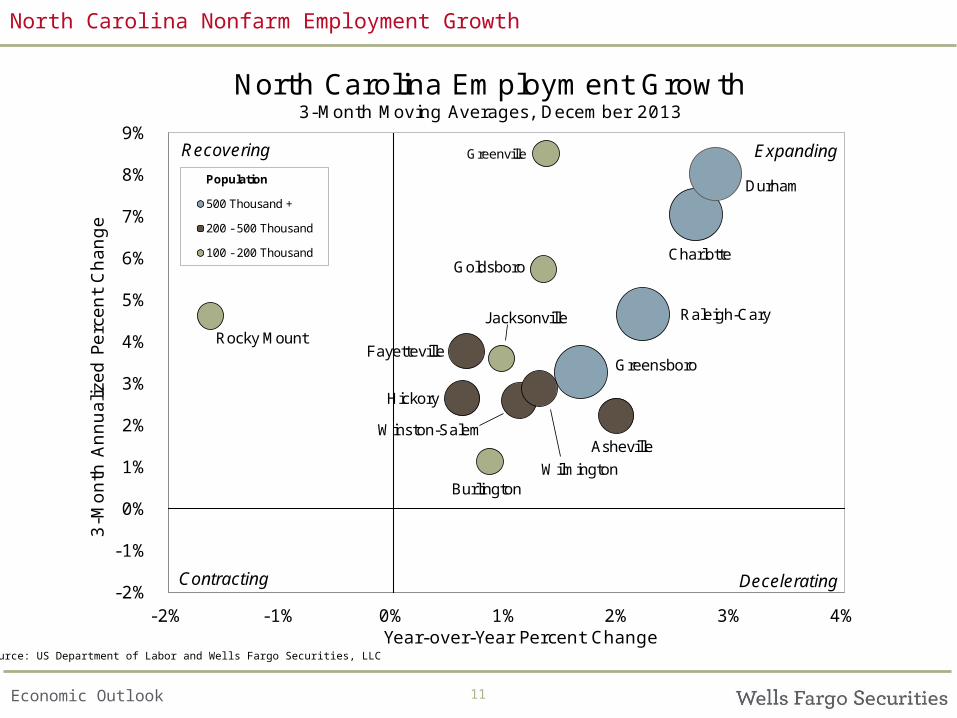
North Carolina Nonfarm Employment Growth
Source: US Department of Labor and Wells Fargo Securities, LLC
Raleigh-Cary
Winston-Salem
Hickory
Fayetteville
Charlotte
Durham
Asheville
Burlington
Greensboro
Wilmington
Greenville
JacksonvilleRocky Mount
Goldsboro
-2%
-1%
0%
1%
2%
3%
4%
5%
6%
7%
8%
9%
-2% -1% 0% 1% 2% 3% 4%
3-M
onth
Annualiz
ed P
erc
ent
Change
Year-over-Year Percent Change
North Carolina Employment Growth3-Month Moving Averages, December 2013
Population
500 Thousand +
200 - 500 Thousand
100 - 200 Thousand
Recovering Expanding
Contracting Decelerating

Economic Outlook
Unemployment Rate by County
North Carolina – Unemployment Rate Composition
North Carolina Unemployment RateNovember 2013
Greater than 10.5%
Less than 7.5%
7.5% to 8.5%
9.5% to 10.5%
8.5% to 9.5%
Source: US Department of Labor and Wells Fargo Securities, LLC
Economic Outlook 1313
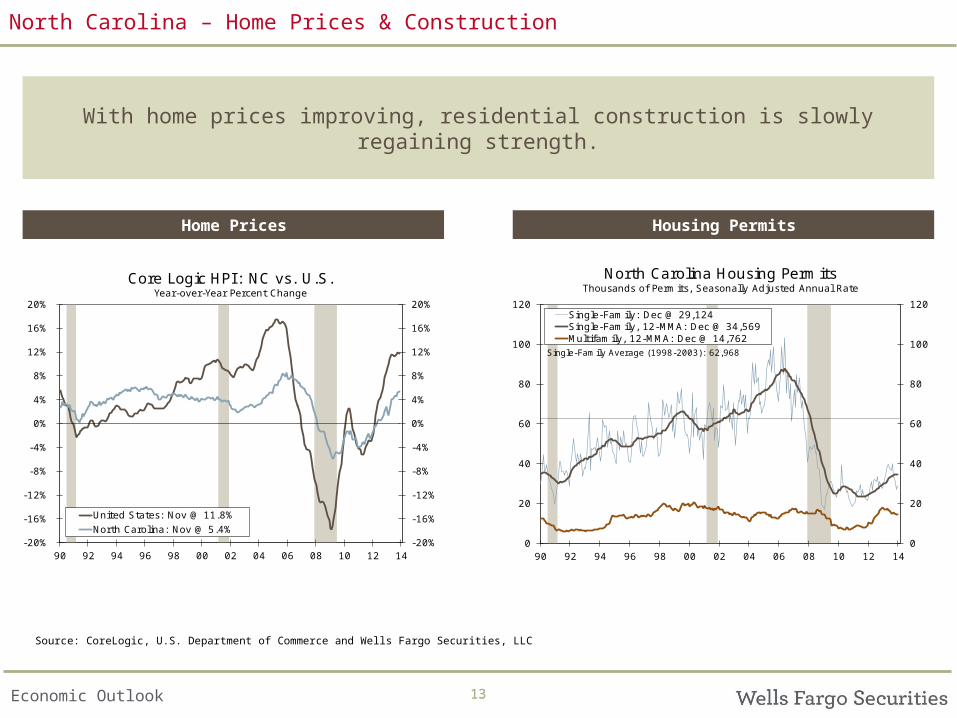
North Carolina – Home Prices & Construction
With home prices improving, residential construction is slowly regaining strength.
-20%
-16%
-12%
-8%
-4%
0%
4%
8%
12%
16%
20%
-20%
-16%
-12%
-8%
-4%
0%
4%
8%
12%
16%
20%
90 92 94 96 98 00 02 04 06 08 10 12 14
Core Logic HPI : NC vs. U.S.Year-over-Year Percent Change
United States: Nov @ 11.8%
North Carolina: Nov @ 5.4%
Source: CoreLogic, U.S. Department of Commerce and Wells Fargo Securities, LLC
Housing PermitsHome Prices
0
20
40
60
80
100
120
0
20
40
60
80
100
120
90 92 94 96 98 00 02 04 06 08 10 12 14
Thou
sand
s
Thou
sand
s
North Carolina Housing PermitsThousands of Permits, Seasonally Adjusted Annual Rate
Single-Family: Dec @ 29,124Single-Family, 12-MMA: Dec @ 34,569Multifamily, 12-MMA: Dec @ 14,762
Single-Family Average (1998-2003): 62,968
Economic Outlook 14
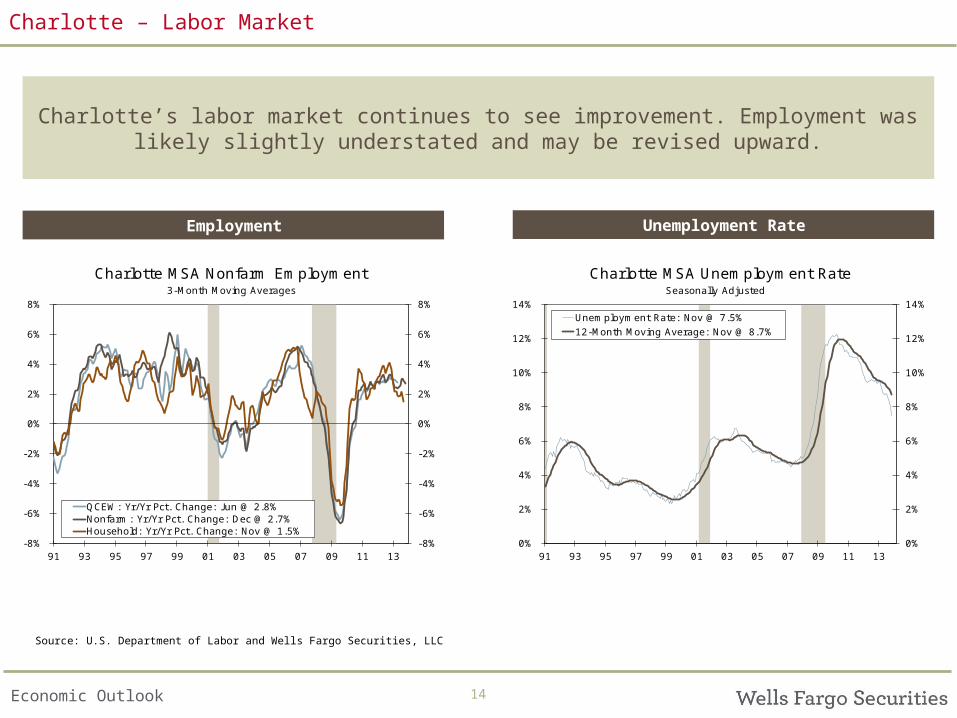
Charlotte – Labor Market
Charlotte’s labor market continues to see improvement. Employment was likely slightly understated and may be revised upward.
-8%
-6%
-4%
-2%
0%
2%
4%
6%
8%
-8%
-6%
-4%
-2%
0%
2%
4%
6%
8%
91 93 95 97 99 01 03 05 07 09 11 13
Charlotte MSA Nonfarm Employment
QCEW: Yr/Yr Pct. Change: J un @ 2.8%Nonfarm: Yr/Yr Pct. Change: Dec @ 2.7%Household: Yr/Yr Pct. Change: Nov @ 1.5%
3-Month Moving Averages
Source: U.S. Department of Labor and Wells Fargo Securities, LLC
Unemployment RateEmployment
0%
2%
4%
6%
8%
10%
12%
14%
0%
2%
4%
6%
8%
10%
12%
14%
91 93 95 97 99 01 03 05 07 09 11 13
Charlotte MSA Unemployment Rate
Unemployment Rate: Nov @ 7.5%12-Month Moving Average: Nov @ 8.7%
Seasonally Adjusted
Economic Outlook 15
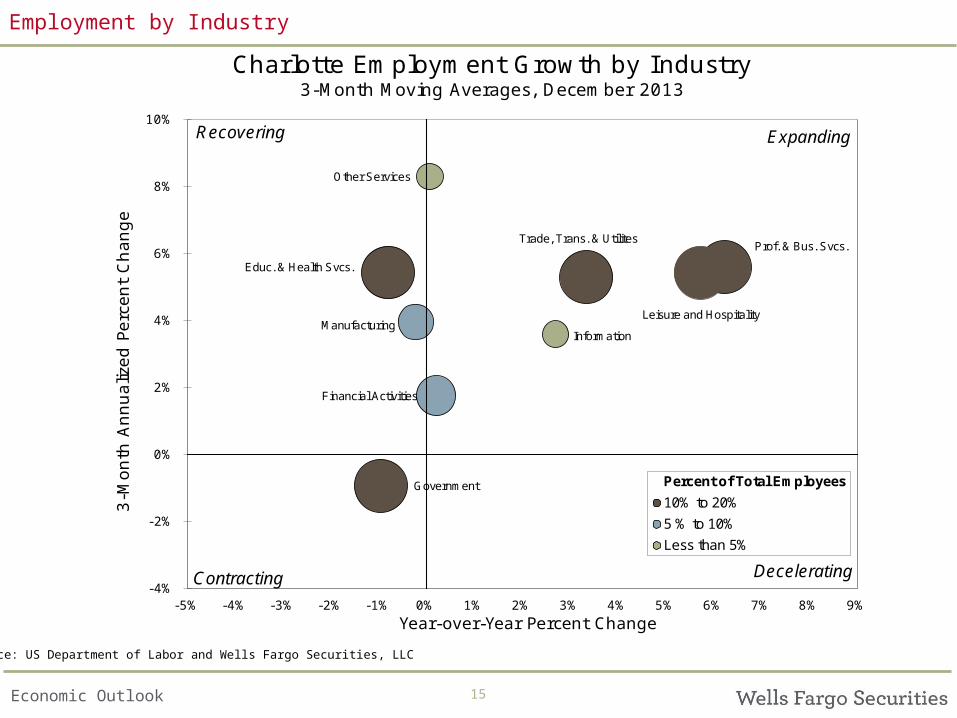
Employment by Industry
Source: US Department of Labor and Wells Fargo Securities, LLC
Government
Educ. & Health Svcs.
Other Services
Prof. & Bus. Svcs.
Leisure and Hospitality
Financial Activities
Trade, Trans. & Utilites
ManufacturingInformation
-4%
-2%
0%
2%
4%
6%
8%
10%
-5% -4% -3% -2% -1% 0% 1% 2% 3% 4% 5% 6% 7% 8% 9%
3-M
onth
Ann
ualiz
ed P
erc
ent
Change
Year-over-Year Percent Change
Charlotte Employment Growth by Industry3-Month Moving Averages, December 2013
Percent of Total Employees
10% to 20%
5 % to 10%
Less than 5%
Recovering Expanding
Contracting Decelerating
Economic Outlook 1616
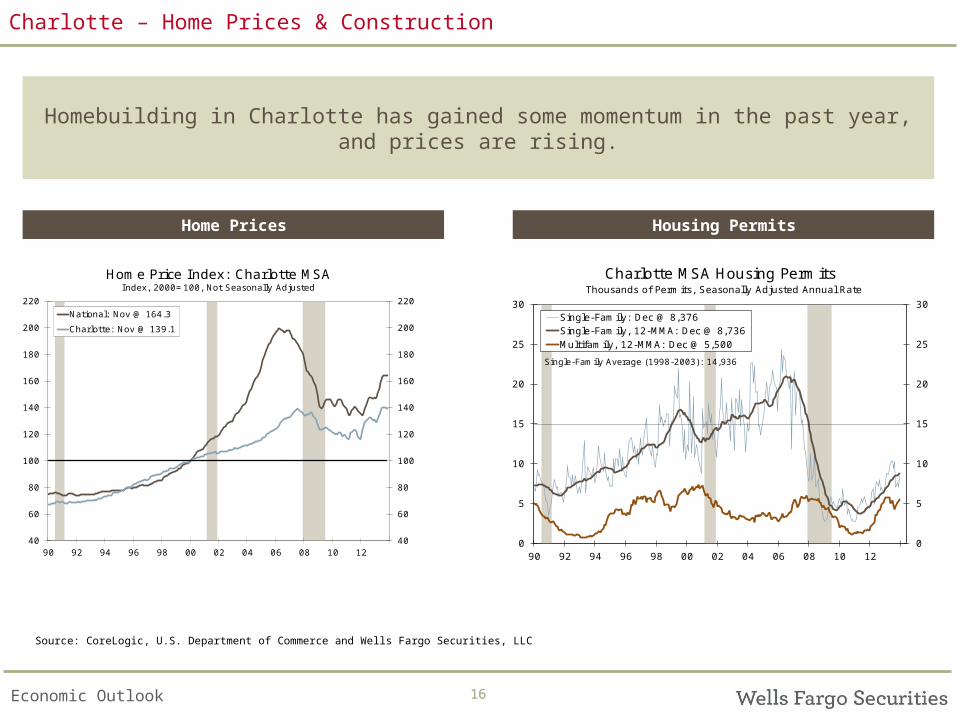
Charlotte – Home Prices & Construction
Homebuilding in Charlotte has gained some momentum in the past year, and prices are rising.
40
60
80
100
120
140
160
180
200
220
40
60
80
100
120
140
160
180
200
220
90 92 94 96 98 00 02 04 06 08 10 12
Home Price Index: Charlotte MSAIndex, 2000=100, Not Seasonally Adjusted
National: Nov @ 164.3
Charlotte: Nov @ 139.1
Source: CoreLogic, U.S. Department of Commerce and Wells Fargo Securities, LLC
Housing PermitsHome Prices
0
5
10
15
20
25
30
0
5
10
15
20
25
30
90 92 94 96 98 00 02 04 06 08 10 12
Thou
sand
s
Thou
sand
s
Charlotte MSA Housing Permits
Single-Family: Dec @ 8,376Single-Family, 12-MMA: Dec @ 8,736Multifamily, 12-MMA: Dec @ 5,500
Single-Family Average (1998-2003): 14,936
Thousands of Permits, Seasonally Adjusted Annual Rate
Economic Outlook 1717
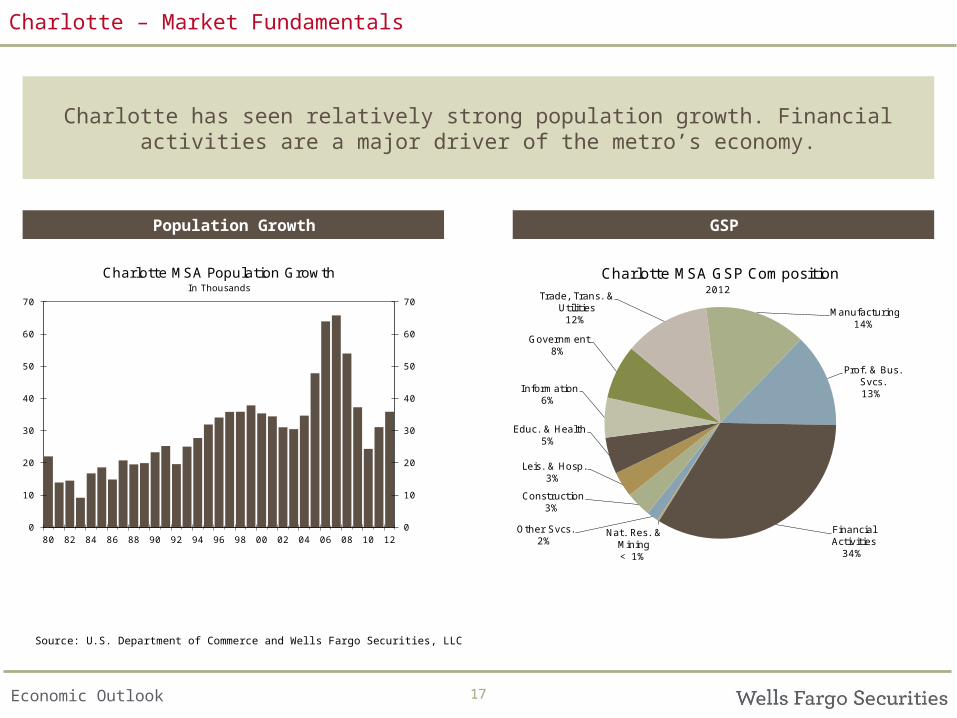
Charlotte – Market Fundamentals
Charlotte has seen relatively strong population growth. Financial activities are a major driver of the metro’s economy.
0
10
20
30
40
50
60
70
0
10
20
30
40
50
60
70
80 82 84 86 88 90 92 94 96 98 00 02 04 06 08 10 12
Charlotte MSA Population GrowthIn Thousands
Source: U.S. Department of Commerce and Wells Fargo Securities, LLC
GSPPopulation Growth
Nat. Res. & Mining< 1%
Other Svcs.2%
Construction3%
Leis. & Hosp.3%
Educ. & Health5%
Information6%
Government8%
Trade, Trans. & Utilities
12%Manufacturing
14%
Prof. & Bus. Svcs.13%
Financial Activities
34%
Charlotte MSA GSP Composition2012

Economic Outlook 1818
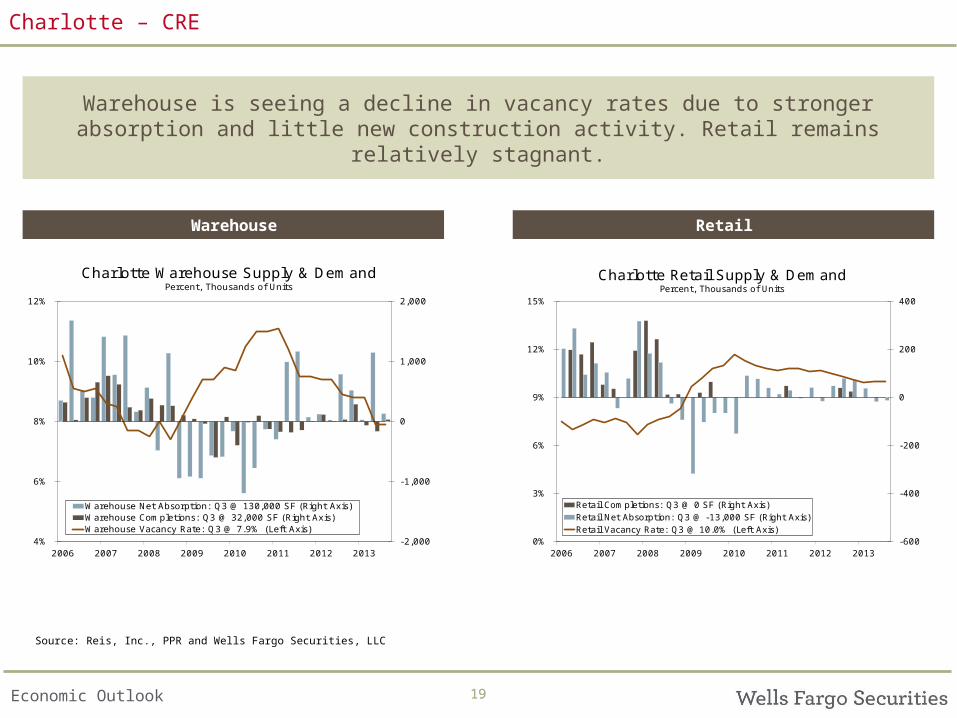
Charlotte – CRE
Charlotte’s apartment market has been one of the robust markets in the nation. The office market, however, has yet to gain traction in this recovery.
Source: Reis, Inc. and Wells Fargo Securities, LLC
OfficeApartment
-2.0
-1.0
0.0
1.0
2.0
3%
6%
9%
12%
15%
2006 2007 2008 2009 2010 2011 2012 2013
Charlotte Apartment Supply & DemandPercent, Thousands of Units
Apartment Completions: Q3 @ 904 Units (Right Axis)
Apartment Net Absorption: Q3 @ 738 Units (Right Axis)
Apartment Vacancy Rate: Q3 @ 4.8% (Left Axis)-1.0
-0.5
0.0
0.5
1.0
1.5
4%
8%
12%
16%
20%
24%
2006 2007 2008 2009 2010 2011 2012 2013
Charlotte Office Supply & DemandPercent, Millions of SF
Office Completions: Q3 @ 0 SF (Right Axis)
Office Net Absorption: Q3 @ -69,000 SF (Right Axis)
Office Vacancy Rate: Q3 @ 17.6% (Left Axis)
Economic Outlook 1919
Charlotte – CRE
Warehouse is seeing a decline in vacancy rates due to stronger absorption and little new construction activity. Retail remains relatively stagnant.
Source: Reis, Inc., PPR and Wells Fargo Securities, LLC
RetailWarehouse
-2,000
-1,000
0
1,000
2,000
4%
6%
8%
10%
12%
2006 2007 2008 2009 2010 2011 2012 2013
Charlotte Warehouse Supply & DemandPercent, Thousands of Units
Warehouse Net Absorption: Q3 @ 130,000 SF (Right Axis)Warehouse Completions: Q3 @ 32,000 SF (Right Axis)Warehouse Vacancy Rate: Q3 @ 7.9% (Left Axis)
-600
-400
-200
0
200
400
0%
3%
6%
9%
12%
15%
2006 2007 2008 2009 2010 2011 2012 2013
Charlotte Retail Supply & DemandPercent, Thousands of Units
Retail Completions: Q3 @ 0 SF (Right Axis)Retail Net Absorption: Q3 @ -13,000 SF (Right Axis)Retail Vacancy Rate: Q3 @ 10.0% (Left Axis)
Economic Outlook 20
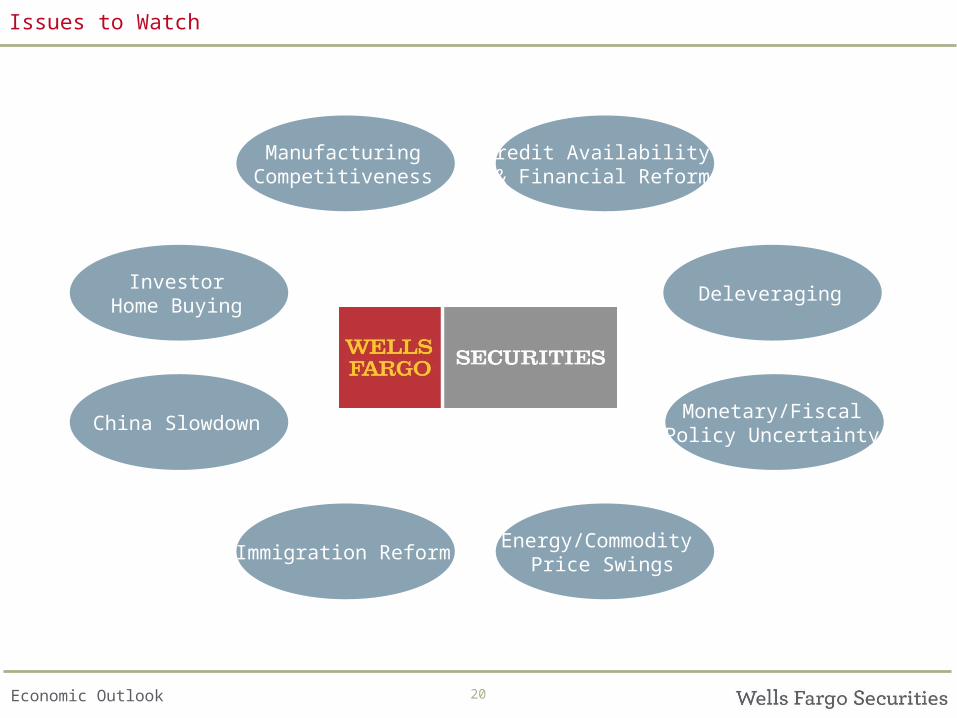
China Slowdown
InvestorHome Buying
Credit Availability & Financial Reform
ManufacturingCompetitiveness
Deleveraging
Monetary/FiscalPolicy Uncertainty
Immigration ReformEnergy/Commodity
Price Swings
Issues to Watch

Economic Outlook 21
Our Forecast
Wells Fargo U.S. Economic Forecast
2011 2012 2013 2014 2015
1Q 2Q 3Q 4Q 1Q 2Q 3Q 4Q
Real Gross Domestic Product 1 1.1 2.5 4.1 3.5 2.0 2.2 2.8 2.9 1.8 2.8 1.9 2.8 3.0
Personal Consumption 2.3 1.8 2.0 3.7 2.1 2.1 2.2 2.3 2.5 2.2 2.0 2.4 2.4
Inflation Indicators 2
PCE Deflator 1.4 1.1 1.1 0.9 1.0 1.5 1.5 2.0 2.4 1.8 1.1 1.5 2.2
Consumer Price Index 1.7 1.4 1.6 1.2 1.3 1.8 1.6 1.9 3.1 2.1 1.5 1.6 2.1
Industrial Production 1 4.1 1.2 2.3 6.2 5.2 4.3 4.4 4.5 3.4 3.6 2.6 4.4 4.7
Corporate Profits Before Taxes 2 2.1 4.5 5.7 5.0 4.1 5.4 5.5 5.6 7.9 7.0 4.3 5.2 5.9
Trade Weighted Dollar Index 3 76.2 77.5 75.2 76.4 78.0 79.0 80.0 80.5 70.9 73.5 75.9 79.4 80.6
Unemployment Rate 7.7 7.5 7.2 7.0 6.8 6.7 6.6 6.5 8.9 8.1 7.4 6.7 6.3
Housing Starts 4 0.96 0.87 0.88 0.97 0.98 1.07 1.18 1.21 0.61 0.78 0.94 1.10 1.25
Quarter- End Interest Rates 5
Federal Funds Target Rate 0.25 0.25 0.25 0.25 0.25 0.25 0.25 0.25 0.25 0.25 0.25 0.25 0.44Conventional Mortgage Rate 3.57 4.07 4.49 4.46 4.70 4.80 4.80 4.90 4.46 3.66 3.98 4.80 5.0510 Year Note 1.87 2.52 2.64 3.04 3.00 3.03 3.07 3.14 2.78 1.80 2.35 3.06 3.33
Forecast as of: J anuary 15, 20141 Compound Annual Growth Rate Quarter-over-Quarter2 Year-over-Year Percentage Change3 Federal Reserve Major Currency I ndex, 1973=100 - Quarter End4 Millions of Units5 Annual Numbers Represent Averages
2013
Actual Forecast
2014
ForecastActual

Appendix

Economic Outlook 23
Recent Special Commentary
Wells Fargo Economics Group Publications
To view any of our past research please visit:
http://www.wellsfargo.com/economics
To join any of our research distribution lists please
visit:http://www.wellsfargo.com/
economicsemail
Date Title Authors
J anuary- 10 Will The European Central Bank Ease Further? BrysonJ anuary- 07 Housing Data Wrap- Up: December 2013 Vitner, Khan & SilvermanJ anuary- 02 Singapore GDP Fell in Q4, But Underlying Trend is Solid BrysonJ anuary- 02 Argentine Economy Remains Strong in Q3 Aleman
December- 31 Colorado 2014 Economic Outlook Vitner & SilvermanDecember- 31 The Labor Market and Credit Risk Silvia,Iqbal & ZacharyDecember- 24 North Carolina's Unemployment Rate Tumbles in November VitnerDecember- 24 Texas: Frequently Asked Questions Vitner & WolfDecember- 24 Our Favorite Charts of 2013December- 20 Hotel Demand Remains Solid, but Cooling Is Expected Khan, Zachary & MillerDecember- 20 California Posts Another Big J ob Gain in November VitnerDecember- 20 Florida's J obless Rate Falls to 6.4 Percent in November Vitner & SilvermanDecember- 20 Georgia 2014 Economic Outlook Vitner & SilvermanDecember- 18 FOMC: Improving Economy, Low Inflation, Tapering to Start Silvia & HouseDecember- 18 Pennsylvania: Five Issues for 2014 Vitner & WolfDecember- 18 Office Fundamentals Show Modest Improvement Khan & ZacharyDecember- 17 Korea: Shifting Drivers of Growth Quinlan & MillerDecember- 17 Swedish Riksbank Eases Policy Again BrysonDecember- 17 Florida Economic Outlook: December 2013 Vitner & SilvermanDecember- 16 Uncharted Territory: A Completed Federal Budget? Silvia & BrownDecember- 16 Mexican Petroleum Sector Takes a Step Forward AlemanDecember- 16 Economic Growth in China Has Stabilized BrysonDecember- 11 2014 Economic OutlookDecember- 09 Minnesota Outlook: December 2013 Vitner & WolfDecember- 09 Is U.S. Growth Sensitive to Foreign Growth? Bryson, Iqbal & MillerDecember- 06 Housing Chartbook: November 2013 Vitner, Khan & SilvermanDecember- 05 California Economic Outlook: December 2013 Vitner & SilvermanDecember- 05 Brazilian Economy Weakens in Q3 AlemanDecember- 03 Reforms Affect Mexican Construction Sector AlemanDecember- 03 RBA on Hold Despite "Uncomfortably High" Aussie Dollar QuinlanDecember- 03 Prospects of Tapering and Commodity Prices AlemanDecember- 03 Swedish GDP Inched Higher in Q3- 2013 BrysonDecember- 02 Swiss GDP Growth in Q3 Not as Strong as Headline Suggests BrysonDecember- 02 Indian GDP Growth Remaind Lackluster in Q3 Bryson
November- 26 Florida Consumer Sentiment Bounces Back in November Vitner & SilvermanNovember- 25 New J ersey: Frequently Asked Questions Vitner & WolfNovember- 25 J apan's Economy & Structural Reform QuinlanNovember- 22 California Adds 39,800 J obs in October Vitner & SilvermanNovember- 22 Florida Leads the Nation in J ob Growth in October Vitner & SilvermanNovember- 22 Texas Labor Market Still Strong Vitner & Wolf
A Sampling of Our Recent Special, Regional & Industry Commentary
Economic Outlook
Wells Fargo Securities, LLC Economics Group
24
John E. Silvia … ...................... . … [email protected]
Global Head of Research and Economics
Diane Schumaker-Krieg ………………… ………[email protected] Head of Research & Economics
Chief Economist
Mark Vitner, Senior Economist……………....………. . .
Jay H. Bryson, Global Economist …………………....……….
Sam Bullard, Senior Economist [email protected]
Nick Bennenbroek, Currency Strategist ……[email protected]
Eugenio J. Alemán, Senior Economist……………….
Anika R. Khan, Senior Economist … . [email protected]
Senior Economists
Zachary Griffiths, Economic Analyst [email protected]
Sara Silverman, Economic Analyst [email protected]
Mackenzie Miller, Economic Analyst [email protected]
Blaire Zachary, Economic Analyst [email protected]
Economists
Azhar Iqbal, Econometrician………………………………[email protected]
Tim Quinlan, Economist …………………………………[email protected]
Michael A. Brown, Economist ………………… [email protected]
Sarah Watt House, Economist…………………………….
Michael T. Wolf, Economist …………………… .
Economic Analysts
Administrative Assistants
Wells Fargo Securities Economics Group publications are produced by Wells Fargo Securities, LLC, a U.S broker-dealer registered with the U.S. Securities and Exchange Commission, the Financial Industry Regulatory Authority, and the Securities Investor Protection Corp. Wells Fargo Securities, LLC, distributes these publications directly and through subsidiaries including, but not limited to, Wells Fargo & Company, Wells Fargo Bank N.A., Wells Fargo Advisors, LLC, Wells Fargo Securities International Limited, Wells Fargo Securities Asia Limited and Wells Fargo Securities (Japan) Co. Limited. Wells Fargo Securities, LLC. (“WFS”) is registered with the Commodities Futures Trading Commission as a futures commission merchant and is a member in good standing of the National Futures Association. Wells Fargo Bank, N.A. (“WFBNA”) is registered with the Commodities Futures Trading Commission as a swap dealer and is a member in good standing of the National Futures Association. WFS and WFBNA are generally engaged in the trading of futures and derivative products, any of which may be discussed within this publication. The information and opinions herein are for general information use only. Wells Fargo Securities, LLC does not guarantee their accuracy or completeness, nor does Wells Fargo Securities, LLC assume any liability for any loss that may result from the reliance by any person upon any such information or opinions. Such information and opinions are subject to change without notice, are for general information only and are not intended as an offer or solicitation with respect to the purchase or sales of any security or as personalized investment advice. Wells Fargo Securities, LLC is a separate legal entity and distinct from affiliated banks and is a wholly owned subsidiary of Wells Fargo & Company © 2014 Wells Fargo Securities, LLC.
SECURITIES: NOT FDIC-INSURED/NOT BANK-GUARANTEED/MAY LOSE VALUE
Important Information for Non-U.S. Recipients
For recipients in the EEA, this report is distributed by Wells Fargo Securities International Limited (“WFSIL”). WFSIL is a U.K. incorporated investment firm authorized and regulated by the Financial Conduct Authority. The content of this report has been approved by WFSIL a regulated person under the Act. WFSIL does not deal with retail clients as defined in the Markets in Financial Instruments Directive 2007. The FCA rules made under the Financial Services and Markets Act 2000 for the protection of retail clients will therefore not apply, not will the Financial Services Compensation Scheme be available. This report is not intended for, and should not be relied upon by, retail clients. This document and any other materials accompanying this document (collectively, the “Materials”) are provided for general informational purposes only.
Peg Gavin, Executive Assistant.
Cyndi Burris, Senior Administrative Assistant [email protected]