Embed Size (px)
Citation preview
US Agri-food Policy and the Farm Bill: A Canadian Perspective
Al MussellSenior Research Associate
Overview
Purpose/policy drivers
Basis for US Farm Bills
Major programs supported
Pressures/outllok facing 2013 Farm Bill
Why care? Canadian perspective
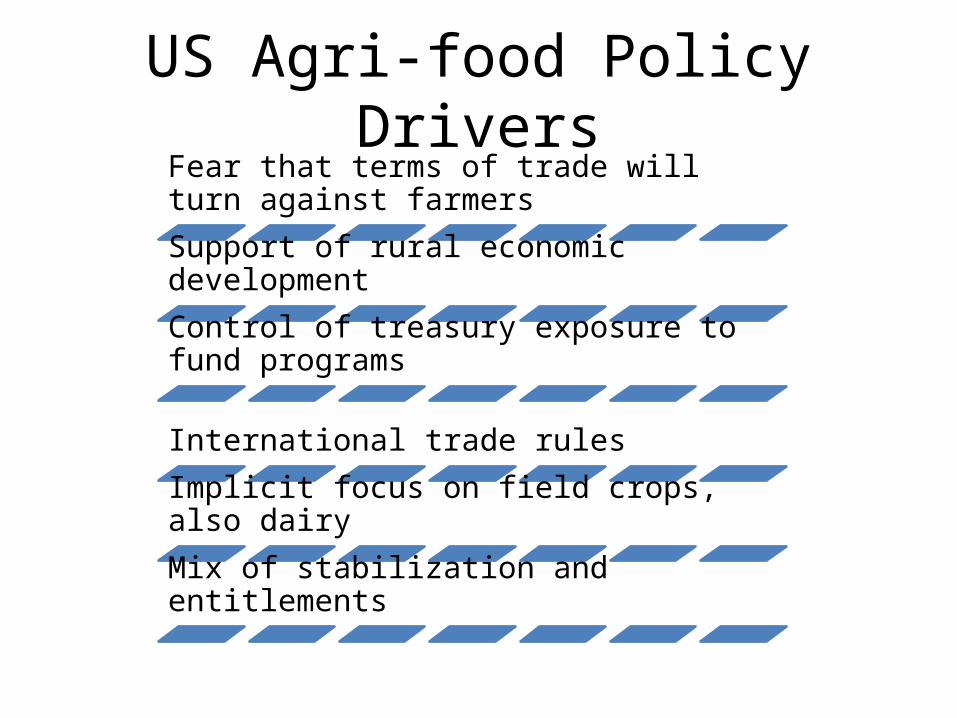
US Agri-food Policy Drivers
Fear that terms of trade will turn against farmers
Support of rural economic development
Control of treasury exposure to fund programs
International trade rules
Implicit focus on field crops, also dairy
Mix of stabilization and entitlements
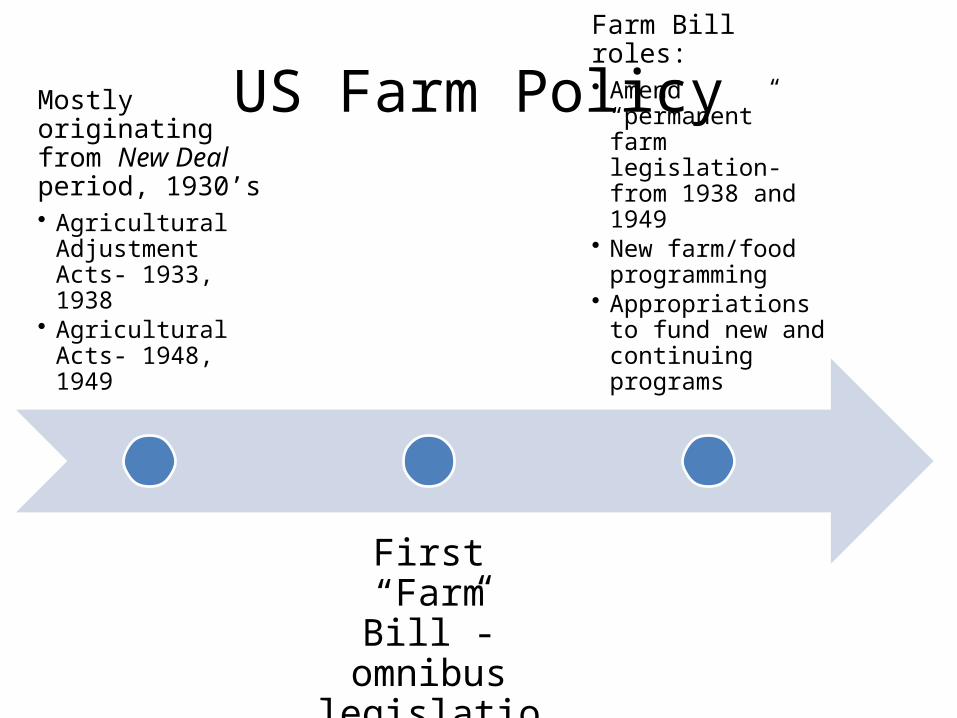
US Farm PolicyMostly originating from New Deal period, 1930’s• Agricultural
Adjustment Acts- 1933, 1938
• Agricultural Acts- 1948, 1949
First “Farm Bill”- omnibus
legislation- 1965
Farm Bill roles:• Amend “permanent”
farm legislation- from 1938 and 1949
• New farm/food programming
• Appropriations to fund new and continuing programs
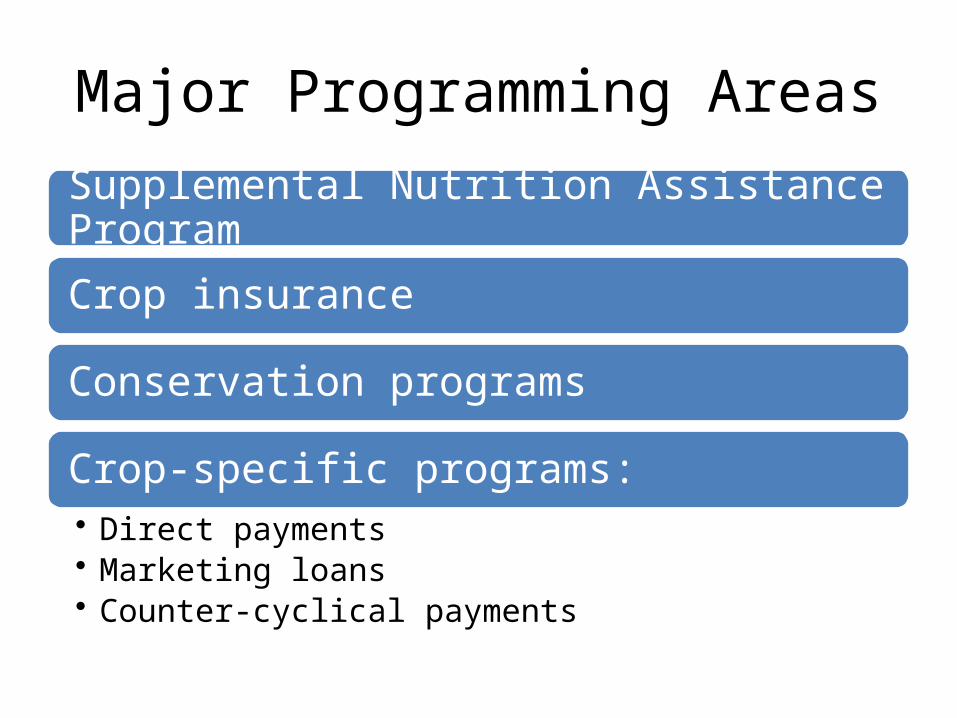
Major Programming Areas
Supplemental Nutrition Assistance Program
Crop insurance
Conservation programs
Crop-specific programs:• Direct payments• Marketing loans• Counter-cyclical payments
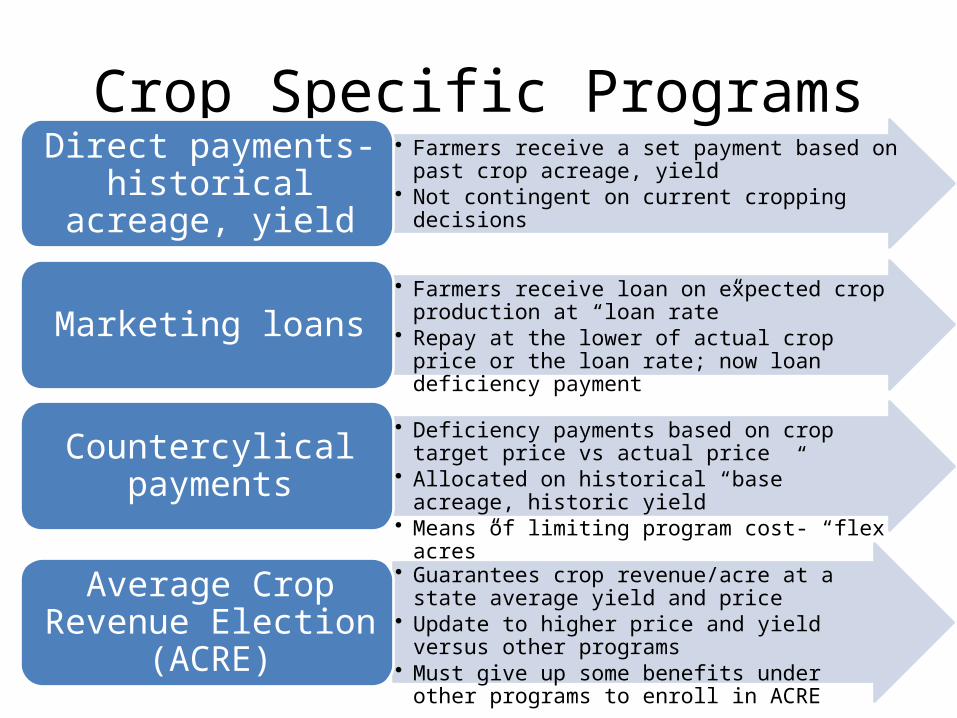
Crop Specific Programs• Farmers receive a set payment based on past crop
acreage, yield• Not contingent on current cropping decisions
Direct payments- historical acreage, yield
• Farmers receive loan on expected crop production at “loan rate”
• Repay at the lower of actual crop price or the loan rate; now loan deficiency payment
Marketing loans
• Deficiency payments based on crop target price vs actual price
• Allocated on historical “base” acreage, historic yield• Means of limiting program cost- “flex acres”
Countercylical payments
• Guarantees crop revenue/acre at a state average yield and price
• Update to higher price and yield versus other programs• Must give up some benefits under other programs to
enroll in ACRE
Average Crop Revenue Election (ACRE)
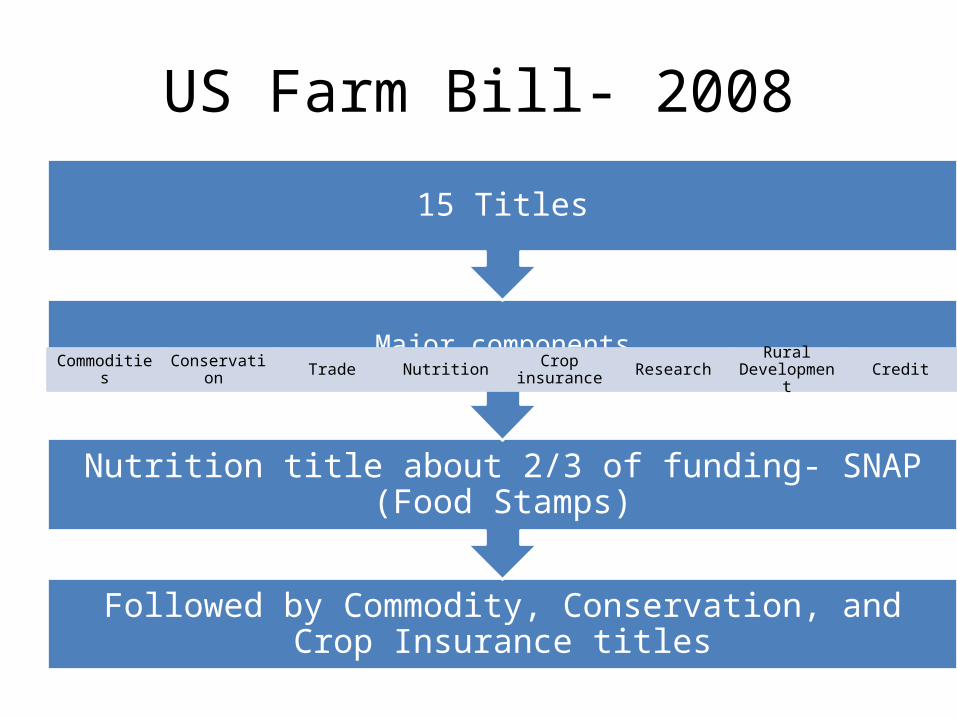
US Farm Bill- 2008
Followed by Commodity, Conservation, and Crop Insurance titles
Nutrition title about 2/3 of funding- SNAP (Food Stamps)
Major componentsCommodities Conservation Trade Nutrition Crop
insurance Research Rural Development Credit
15 Titles
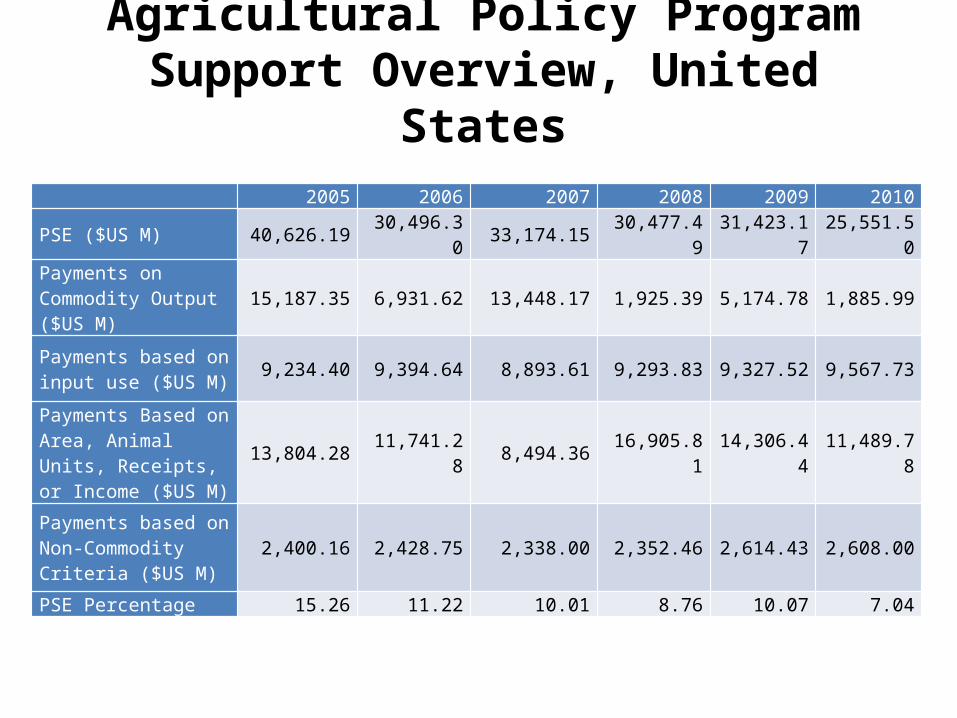
Agricultural Policy Program Support Overview, United States
2005 2006 2007 2008 2009 2010
PSE ($US M) 40,626.19 30,496.30 33,174.15 30,477.49 31,423.17 25,551.50
Payments on Commodity Output ($US M) 15,187.35 6,931.62 13,448.17 1,925.39 5,174.78 1,885.99
Payments based on input use ($US M) 9,234.40 9,394.64 8,893.61 9,293.83 9,327.52 9,567.73
Payments Based on Area, Animal Units, Receipts, or Income ($US M)
13,804.28 11,741.28 8,494.36 16,905.81 14,306.44 11,489.78
Payments based on Non-Commodity Criteria ($US M)
2,400.16 2,428.75 2,338.00 2,352.46 2,614.43 2,608.00
PSE Percentage 15.26 11.22 10.01 8.76 10.07 7.04
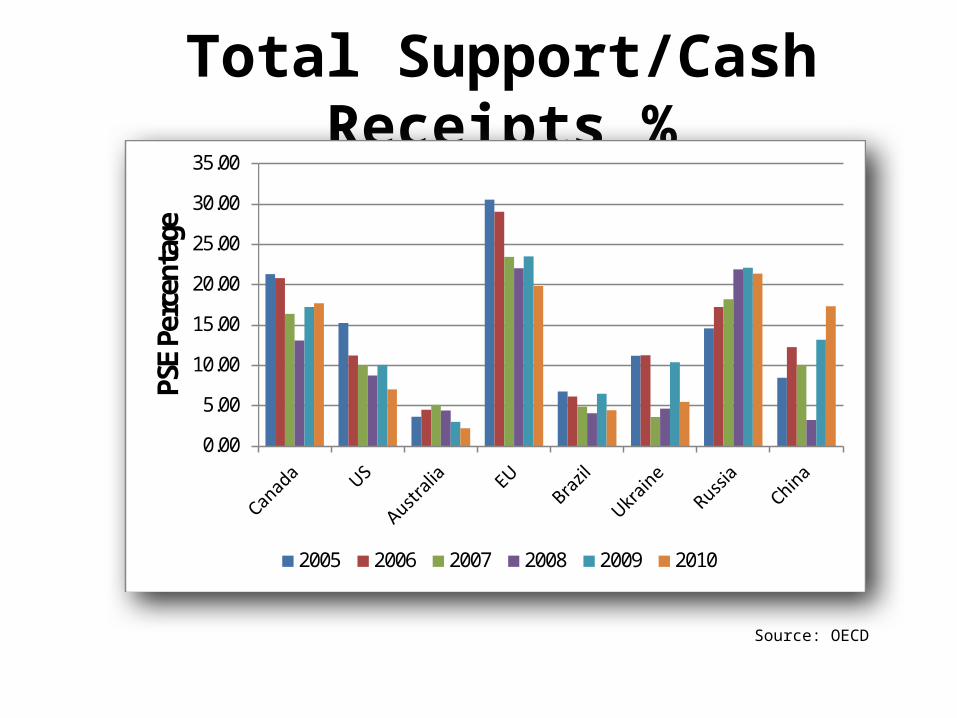
Total Support/Cash Receipts %
0.00
5.00
10.00
15.00
20.00
25.00
30.00
35.00PS
E Pe
rcen
tage
2005 2006 2007 2008 2009 2010
Source: OECD
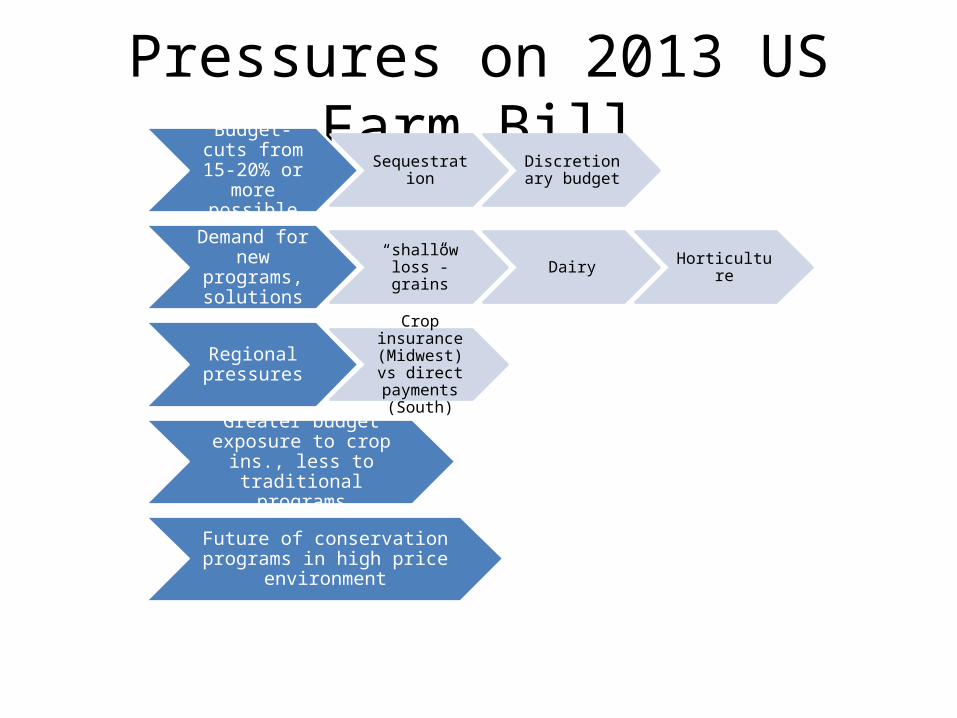
Pressures on 2013 US Farm BillBudget- cuts
from 15-20% or more possible
Sequestration Discretionary budget
Demand for new programs,
solutions
“shallow loss”- grains Dairy Horticulture
Regional pressures
Crop insurance (Midwest) vs
direct payments
(South)
Greater budget exposure to crop ins., less to traditional
programs
Future of conservation programs in high price environment
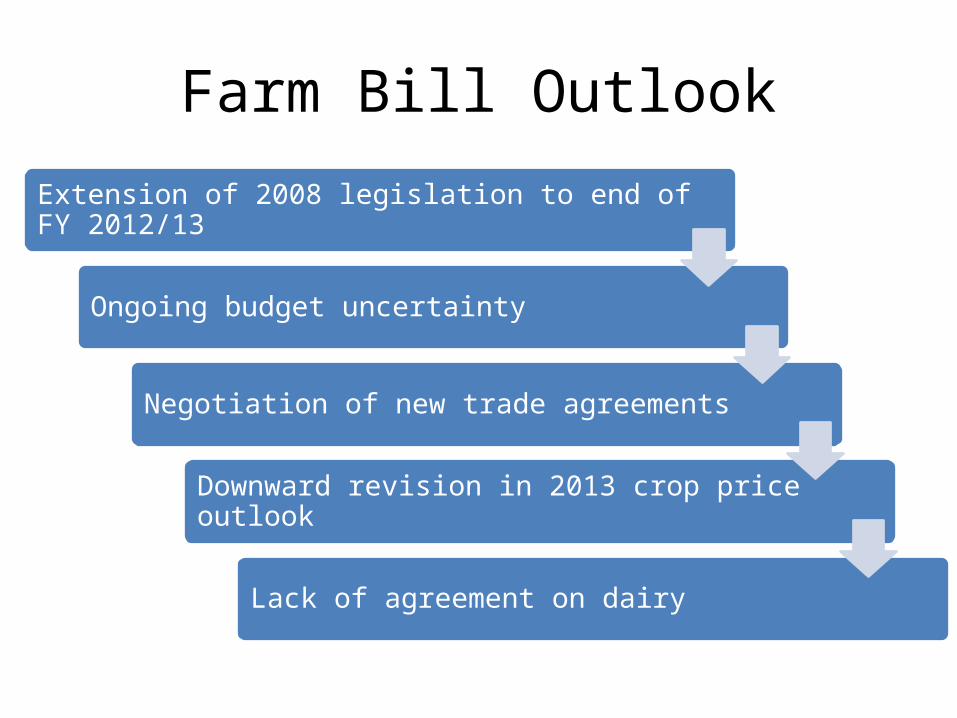
Farm Bill Outlook
Extension of 2008 legislation to end of FY 2012/13
Ongoing budget uncertainty
Negotiation of new trade agreements
Downward revision in 2013 crop price outlook
Lack of agreement on dairy
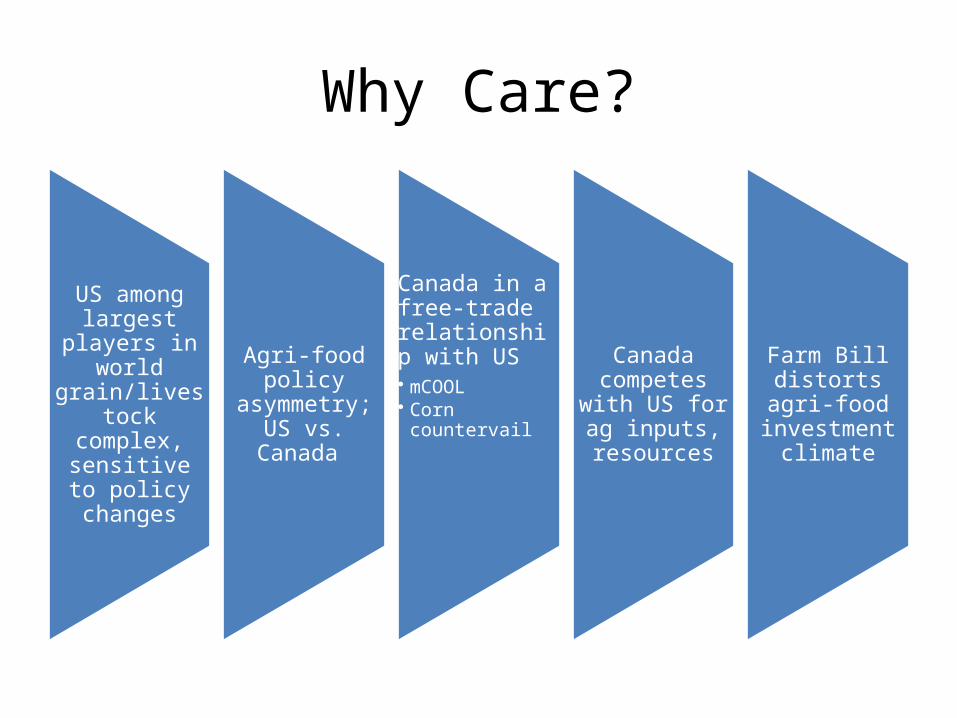
Why Care?
US among largest players
in world grain/livestock
complex, sensitive to
policy changes
Agri-food policy
asymmetry; US vs. Canada
Canada in a free-trade relationship with US• mCOOL• Corn countervail
Canada competes with
US for ag inputs,
resources
Farm Bill distorts agri-
food investment
climate