Embed Size (px)
Citation preview

An Overviewof the Canadian Agriculture
and Agri-Food System
2008

An Overview of the Canadian Agriculture and Agri-Food SystemProject ManagerKathleen Kittson
Project TeamJulie Smith, Nasreen Islam, Jordan Sheldrick and other members of the Agri-Food Chain and Integrated Risk Manage-ment Section.
This publication comprises data and analysis provided by all four divisions of the Research and Analysis Directorate as well as contributions from other Divisions and Branches of Agriculture and Agri-Food Canada particularly the Food Value Chain Bureau.
June 2008
Research and Analysis DirectorateStrategic Policy BranchAgriculture and Agri-Food Canada
IMPORTANT NOTICES
Copyright/Permission to ReproduceMaterials in this publication were produced and/or compiled by Agriculture and Agri-Food Canada for the purpose of providing Canadians with direct access to information about the programs and services offered by the Government of Canada.
The material in this publication is covered by the provisions of the Copyright Act, by Canadian laws, policies, regulations and international agreements. Such provisions serve to identify the information source and, in specific instances, to prohibit reproduction of materials without written permission.
Non-commercial ReproductionInformation in this publication has been provided with the intent that it be readily available for personal and public non-commercial use and may be reproduced, in part or in whole and by any means, without charge or further permission from Agriculture and Agri-Food Canada. We ask only that:
Users exercise due diligence in ensuring the accuracy of the materials reproduced; Agriculture and Agri-Food Canada be identified as the source depart-ment; and the reproduction is not represented as an official version of the materials reproduced, nor as having been made, in affiliation with or with the endorsement of Agriculture and Agri-Food Canada.
Commercial ReproductionReproduction of multiple copies of this publication, in whole or in part, for the purposes of commercial redistribution is prohibited except with written permission from the Government of Canada's copyright administrator, Public Works and Government Services Canada (PWGSC). Through the permis-sion granting process, PWGSC helps ensure individuals/organizations wishing to reproduce Government of Canada materials for commercial purposes have access to the most accurate, up-to-date versions. To obtain permission to reproduce materials in this publication for commercial purposes, please consult with PWGSC.
Public Works and Government Services CanadaPublishing and Depository Services350 Albert Street, 4th FloorOttawa, OntarioCanadaK1A 0S5
Third-party MaterialsSome of the materials and graphical elements found in this publication are subject to copyrights held by other organizations. This is particularly true of sites that are jointly operated by a Government of Canada institution and an external organization as part of a collaborative arrangement. In such cases, some restrictions on the reproduction of materials or graphical elements may apply and it may be necessary to seek permission from the rights holder prior to reproducing the material.
© Her Majesty the Queen in Right of Canada, 2008
Publication 10770EISSN 1708-4164ISBN 978-1-100-10925-1Catalogue A38-1/1-2008E-PDFProject 08-028-r
Electronic versions of Research and Analysis publications are available on the Internet at:http://www.agr.gc.ca/pol/index_e.php
Aussi disponible en français sous le titre :« Vue d’ensemble du système agricole et agroalimentaire canadien »
Note to Readers
This publication reflects the latest data available as of June 2008.Due to rounding, totals may not add to the sum of their components.

An Overview of the Canadian Agriculture and Agri-Food System iii
T A B L E O F C O N T E N T S
Foreword. . . . . . . . . . . . . . . . . . . . . . . . . . . . . . . . . . . . . . . . . . . . . . . . . . . . . . . . . . . . . . . . . . xi
Highlights . . . . . . . . . . . . . . . . . . . . . . . . . . . . . . . . . . . . . . . . . . . . . . . . . . . . . . . . . . . . . . . . xiii
Executive Summary . . . . . . . . . . . . . . . . . . . . . . . . . . . . . . . . . . . . . . . . . . . . . . . . . . . . . . . . . xv
Section A Special Feature . . . . . . . . . . . . . . . . . . . . . . . . . . . . . . . . . . . . . . . . . . . . . . . 1A1. Global Food Price Inflation . . . . . . . . . . . . . . . . . . . . . . . . . . . . . . . . . . . . . . . 3
Section B The Agriculture and Agri-Food System and the Canadian Economy . . . 11B1. GDP and Employment. . . . . . . . . . . . . . . . . . . . . . . . . . . . . . . . . . . . . . . . . . 13B2. International Trade . . . . . . . . . . . . . . . . . . . . . . . . . . . . . . . . . . . . . . . . . . . . 19B3. Productivity, R&D and Innovation . . . . . . . . . . . . . . . . . . . . . . . . . . . . . . . . 29
Section C Components of the Agriculture and Agri-Food System . . . . . . . . . . . . . . 41C1. Consumers . . . . . . . . . . . . . . . . . . . . . . . . . . . . . . . . . . . . . . . . . . . . . . . . . . 43C2. Food Distribution (Retail/Wholesale and Foodservice). . . . . . . . . . . . . . . . . 49C3. Food, Beverage and Tobacco (FBT) Processing. . . . . . . . . . . . . . . . . . . . . . . 57C4. Primary Agriculture . . . . . . . . . . . . . . . . . . . . . . . . . . . . . . . . . . . . . . . . . . . . 69C5. Agricultural Input and Service Suppliers . . . . . . . . . . . . . . . . . . . . . . . . . . . 93C6. Natural Resource Use and Environmental Impacts . . . . . . . . . . . . . . . . . . . . 99
Section D Government and the Agriculture and Agri-Food Sector . . . . . . . . . . . . 109D1. Government Expenditures . . . . . . . . . . . . . . . . . . . . . . . . . . . . . . . . . . . . . 111D2. Producer Support Estimates (PSE) and Agricultural Policies in
Other Countries. . . . . . . . . . . . . . . . . . . . . . . . . . . . . . . . . . . . . . . . . . . . . . 119
Glossary . . . . . . . . . . . . . . . . . . . . . . . . . . . . . . . . . . . . . . . . . . . . . . . . . . . . . . . . . . . . . . . . .123Acronyms. . . . . . . . . . . . . . . . . . . . . . . . . . . . . . . . . . . . . . . . . . . . . . . . . . . . . . . 124The System’s Components . . . . . . . . . . . . . . . . . . . . . . . . . . . . . . . . . . . . . . . . . 125Non-Financial Industries . . . . . . . . . . . . . . . . . . . . . . . . . . . . . . . . . . . . . . . . . . . 128Farm Definitions . . . . . . . . . . . . . . . . . . . . . . . . . . . . . . . . . . . . . . . . . . . . . . . . . 129Trade Categories . . . . . . . . . . . . . . . . . . . . . . . . . . . . . . . . . . . . . . . . . . . . . . . . . 130Government Support Categories . . . . . . . . . . . . . . . . . . . . . . . . . . . . . . . . . . . . 131Government Support Measures . . . . . . . . . . . . . . . . . . . . . . . . . . . . . . . . . . . . . 132Economic and Statistical Terminology . . . . . . . . . . . . . . . . . . . . . . . . . . . . . . . . 133
Data Sources and References . . . . . . . . . . . . . . . . . . . . . . . . . . . . . . . . . . . . . . . . . . . . . . . .137


An Overview of the Canadian Agriculture and Agri-Food System v
L I S T O F C H A R T S
Section A Special Features
A1 Global Food Price Inflation . . . . . . . . . . . . . . . . . . . . . . . . . . . . . . . . . . . . . . . . . . . . . .3A1.1 World Food Price Index, 1980-2008 . . . . . . . . . . . . . . . . . . . . . . . . . . . . . . . . . . . . . . . . . . . . . .4A1.2 Corn and Wheat Price Indices, 1996-2007 . . . . . . . . . . . . . . . . . . . . . . . . . . . . . . . . . . . . . . . . .4A1.3 Soybean and Rice Price Indices, 1996-2007 . . . . . . . . . . . . . . . . . . . . . . . . . . . . . . . . . . . . . . . .4A1.4 World Population and Population Growth, 1970-2007 . . . . . . . . . . . . . . . . . . . . . . . . . . . . . . .5A1.5 Annual GDP Growth in China and India, 2000 and 2007. . . . . . . . . . . . . . . . . . . . . . . . . . . . . .5A1.6 Percentage Growth in Consumption of Major Commodities in Emerging Economies,
1990-2005 . . . . . . . . . . . . . . . . . . . . . . . . . . . . . . . . . . . . . . . . . . . . . . . . . . . . . . . . . . . . . . . . . .5A1.7 World Primary Energy Consumption (BTU), 1980-2005. . . . . . . . . . . . . . . . . . . . . . . . . . . . . . .6A1.8 World Crude Oil Prices, 2002-2007. . . . . . . . . . . . . . . . . . . . . . . . . . . . . . . . . . . . . . . . . . . . . . .6A1.9 Anhydrous Ammonia and Natural Gas Prices, 1997-2007 . . . . . . . . . . . . . . . . . . . . . . . . . . . . .6A1.10 Wheat Production in Australia, 1987-2007 . . . . . . . . . . . . . . . . . . . . . . . . . . . . . . . . . . . . . . . . .7A1.11 Stock-to-Use Ratios, 1995-2007 . . . . . . . . . . . . . . . . . . . . . . . . . . . . . . . . . . . . . . . . . . . . . . . . . .7A1.12 World and Canadian Food Price Indices and U.S./Canada Exchange Rate, 2000-2007 . . . . . . .8A1.13 Consumer Price Increases for Various Countries, 2007. . . . . . . . . . . . . . . . . . . . . . . . . . . . . . . .8A1.14 CPI for Food, Energy and Overall Inflation Rate, 1981-2007. . . . . . . . . . . . . . . . . . . . . . . . . . . .9A1.15 Canadian Retail Food Price Inflation by Category, June 2007-June 2008 . . . . . . . . . . . . . . . . . .9A1.16 Household Expenditure Share of Food and Non-Alcoholic Beverages in Selected OECD
Countries, 2006 . . . . . . . . . . . . . . . . . . . . . . . . . . . . . . . . . . . . . . . . . . . . . . . . . . . . . . . . . . . . .10A1.17 Household Expenditure Share of Food in Emerging Countries Living on Less than
US$1/day, 2006 . . . . . . . . . . . . . . . . . . . . . . . . . . . . . . . . . . . . . . . . . . . . . . . . . . . . . . . . . . . . .10
Section B The Agriculture and Agri-Food System and the Canadian Economy
B1 GDP and Employment . . . . . . . . . . . . . . . . . . . . . . . . . . . . . . . . . . . . . . . . . . . . . . . . .13B1.1 Agriculture and Agri-Food System's Contribution to GDP, 2006 . . . . . . . . . . . . . . . . . . . . . . .14B1.2 The Agriculture and Agri-Food System's Contribution to GDP, 1991-2006 . . . . . . . . . . . . . . .14B1.3 The Agriculture and Agri-Food System's Contribution to Employment, 2006. . . . . . . . . . . . .15B1.4 Agriculture and Agri-Food System’s Contribution to Employment, 1991-2007. . . . . . . . . . . .15B1.5 Primary Agriculture and Food Processing’s Contribution to Provincial GDP, 2006 . . . . . . . . .16B1.6 Provincial Contribution to Canadian Agriculture and Food Processing GDP, 2006 . . . . . . . . .16B1.7 Agriculture and Agri-Food System’s Share of Provincial Employment, 2006 . . . . . . . . . . . . . .17B1.8 Provincial Contribution to Canadian Agriculture and Food Processing Sector
Employment, 2006 . . . . . . . . . . . . . . . . . . . . . . . . . . . . . . . . . . . . . . . . . . . . . . . . . . . . . . . . . .17
B2 International Trade . . . . . . . . . . . . . . . . . . . . . . . . . . . . . . . . . . . . . . . . . . . . . . . . . . .19B2.1 World Agricultural and Agri-Food Export Share by Country of Origin, 2007. . . . . . . . . . . . . .20B2.2 Canadian Dollar Effective Exchange Rate Index (CERI) . . . . . . . . . . . . . . . . . . . . . . . . . . . . . . .20

vi
Lis
t o
f C
ha
rts
An Overview of the Canadian Agriculture and Agri-Food System
B2.3 Canadian Agriculture and Agri-Food Export Sales (BICO), 2007 . . . . . . . . . . . . . . . . . . . . . . .21B2.4 Canadian Agriculture and Agri-Food Exports (BICO), 1990-2007 . . . . . . . . . . . . . . . . . . . . . .21B2.5 Destinations of Canadian Agriculture and Agri-Food Exports, 2007 . . . . . . . . . . . . . . . . . . . .22B2.6 Value of Canadian Agriculture and Agri-Food Exports by Country of Destination,
1992 and 2007. . . . . . . . . . . . . . . . . . . . . . . . . . . . . . . . . . . . . . . . . . . . . . . . . . . . . . . . . . . . . .22B2.7 Commodity Composition of Export Sales, 2007. . . . . . . . . . . . . . . . . . . . . . . . . . . . . . . . . . . .23B2.8 Commodity Composition of Export Sales, 1998 and 2007. . . . . . . . . . . . . . . . . . . . . . . . . . . .23B2.9 Value of Canadian Agriculture and Agri-Food Exports to Emerging Markets, 1992-2007 . . . .24B2.10 Value of Canadian Agriculture and Agri-Food Exports by Emerging Markets, 1992-2007 . . . .24B2.11 World Agricultural and Agri-Food Import Share by Country or Origin, 2007 . . . . . . . . . . . . .25B2.12 Canadian Agriculture and Agri-Food Imports (BICO), 1990-2007 . . . . . . . . . . . . . . . . . . . . . .25B2.13 Canadian Agriculture and Agri-Food Imports by Country of Origin, 2007 . . . . . . . . . . . . . . .26B2.14 Value of Canadian Agriculture and Agri-Food Imports by Country of Origin, 1996
and 2007 . . . . . . . . . . . . . . . . . . . . . . . . . . . . . . . . . . . . . . . . . . . . . . . . . . . . . . . . . . . . . . . . . .26B2.15 Commodity Composition of Import Sales, 1998 and 2007 . . . . . . . . . . . . . . . . . . . . . . . . . . .27B2.16 Agricultural Imports from North America and the Rest of the World, 1996-2007 . . . . . . . . . .27B2.17 Contribution of Agriculture and Agri-Food to Total Exports, 2007. . . . . . . . . . . . . . . . . . . . . .28B2.18 Contribution of Agriculture and Agri-Food to Total Imports, 2007 . . . . . . . . . . . . . . . . . . . . .28
B3 Productivity, R&D and Innovation . . . . . . . . . . . . . . . . . . . . . . . . . . . . . . . . . . . . . . 29B3.1 Comparison of Total Factor Productivity Growth in Primary Agriculture:
Canada vs. the U.S., 1988-2004 . . . . . . . . . . . . . . . . . . . . . . . . . . . . . . . . . . . . . . . . . . . . . . . .30B3.2 Productivity Growth in Canadian Food Processing and Total Manufacturing, 1988-2004 . . .30B3.3 Productivity Growth in the FBT Industries, Canada and the U.S., 1988-2004 . . . . . . . . . . . . .31B3.4 Stages of Technology Development or Innovation . . . . . . . . . . . . . . . . . . . . . . . . . . . . . . . . . .32B3.5 Extent of Innovations in Canada, 2002-2004 . . . . . . . . . . . . . . . . . . . . . . . . . . . . . . . . . . . . . .33B3.6 Impediments to Innovation in FBT, 2002-2004. . . . . . . . . . . . . . . . . . . . . . . . . . . . . . . . . . . . .33B3.7 Private Sector R&D Expenditures in the Agriculture and Agri-Food Sector, 1980-2007 . . . . . .34B3.8 Private Sector R&D Expenditures as a Share of GDP by Industry, 1980-2004 . . . . . . . . . . . . .34 B3.9 Federal Research Expenditures in Support of the Agriculture and Agri-Food Sector,
2005-06 to 2007-08 Fiscal Years . . . . . . . . . . . . . . . . . . . . . . . . . . . . . . . . . . . . . . . . . . . . . . . .35B3.10 Provincial Research Expenditures in Support of the Agriculture and Agri-Food Sector,
2005-06 to 2007-08 Fiscal Years . . . . . . . . . . . . . . . . . . . . . . . . . . . . . . . . . . . . . . . . . . . . . . . .35B3.11 Public R&D Support to the Agriculture and Agri-Food Sector, 1986-2007. . . . . . . . . . . . . . . .36B3.12 Total Public Agricultural Research Expenditures by Region . . . . . . . . . . . . . . . . . . . . . . . . . . .36B3.13 Rates of Return to Canadian Public R&D in Agriculture . . . . . . . . . . . . . . . . . . . . . . . . . . . . . .37B3.14 Wheat Yield Increases due to Genetic Improvements, 1972-2006 . . . . . . . . . . . . . . . . . . . . . .37B3.15 Revenues from Bioproducts by Region, 2005 and 2006 . . . . . . . . . . . . . . . . . . . . . . . . . . . . . .38B3.16 Number and Average Revenue of Firms in the Bioproducts Industry by Size, 2003
and 2006 . . . . . . . . . . . . . . . . . . . . . . . . . . . . . . . . . . . . . . . . . . . . . . . . . . . . . . . . . . . . . . . . . .38B3.17 Number of Firms Reporting Bioproduct Activity, 2003-2006 . . . . . . . . . . . . . . . . . . . . . . . . . .39B3.18 Bioproduct Activity Reported by Firms, 2006 . . . . . . . . . . . . . . . . . . . . . . . . . . . . . . . . . . . . . .39
Section C Components of The Agriculture and Agri-Food System
C1 Consumers . . . . . . . . . . . . . . . . . . . . . . . . . . . . . . . . . . . . . . . . . . . . . . . . . . . . . . . . . . 43C1.1 Distribution of Personal Expenditure on Goods, 2007 . . . . . . . . . . . . . . . . . . . . . . . . . . . . . . 44C1.2 Distribution of Personal Expenditure on Services, 2007 . . . . . . . . . . . . . . . . . . . . . . . . . . . . . 44
vii
Lis
t of C
ha
rts
An Overview of the Canadian Agriculture and Agri-Food System
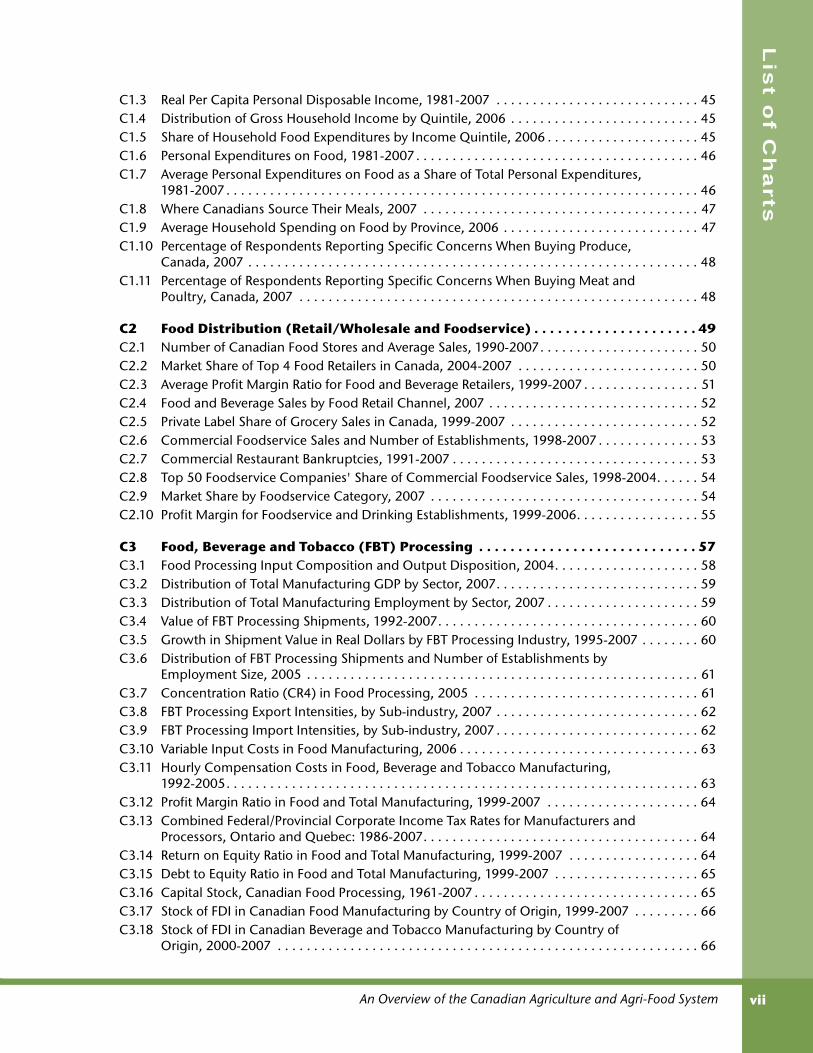
C1.3 Real Per Capita Personal Disposable Income, 1981-2007 . . . . . . . . . . . . . . . . . . . . . . . . . . . . 45C1.4 Distribution of Gross Household Income by Quintile, 2006 . . . . . . . . . . . . . . . . . . . . . . . . . . 45C1.5 Share of Household Food Expenditures by Income Quintile, 2006 . . . . . . . . . . . . . . . . . . . . . 45C1.6 Personal Expenditures on Food, 1981-2007 . . . . . . . . . . . . . . . . . . . . . . . . . . . . . . . . . . . . . . . 46C1.7 Average Personal Expenditures on Food as a Share of Total Personal Expenditures,
1981-2007 . . . . . . . . . . . . . . . . . . . . . . . . . . . . . . . . . . . . . . . . . . . . . . . . . . . . . . . . . . . . . . . . . 46C1.8 Where Canadians Source Their Meals, 2007 . . . . . . . . . . . . . . . . . . . . . . . . . . . . . . . . . . . . . . 47C1.9 Average Household Spending on Food by Province, 2006 . . . . . . . . . . . . . . . . . . . . . . . . . . . 47C1.10 Percentage of Respondents Reporting Specific Concerns When Buying Produce,
Canada, 2007 . . . . . . . . . . . . . . . . . . . . . . . . . . . . . . . . . . . . . . . . . . . . . . . . . . . . . . . . . . . . . . 48C1.11 Percentage of Respondents Reporting Specific Concerns When Buying Meat and
Poultry, Canada, 2007 . . . . . . . . . . . . . . . . . . . . . . . . . . . . . . . . . . . . . . . . . . . . . . . . . . . . . . . 48
C2 Food Distribution (Retail/Wholesale and Foodservice) . . . . . . . . . . . . . . . . . . . . . 49C2.1 Number of Canadian Food Stores and Average Sales, 1990-2007. . . . . . . . . . . . . . . . . . . . . . 50C2.2 Market Share of Top 4 Food Retailers in Canada, 2004-2007 . . . . . . . . . . . . . . . . . . . . . . . . . 50C2.3 Average Profit Margin Ratio for Food and Beverage Retailers, 1999-2007 . . . . . . . . . . . . . . . . 51C2.4 Food and Beverage Sales by Food Retail Channel, 2007 . . . . . . . . . . . . . . . . . . . . . . . . . . . . . 52C2.5 Private Label Share of Grocery Sales in Canada, 1999-2007 . . . . . . . . . . . . . . . . . . . . . . . . . . 52C2.6 Commercial Foodservice Sales and Number of Establishments, 1998-2007 . . . . . . . . . . . . . . 53C2.7 Commercial Restaurant Bankruptcies, 1991-2007 . . . . . . . . . . . . . . . . . . . . . . . . . . . . . . . . . . 53C2.8 Top 50 Foodservice Companies' Share of Commercial Foodservice Sales, 1998-2004. . . . . . 54C2.9 Market Share by Foodservice Category, 2007 . . . . . . . . . . . . . . . . . . . . . . . . . . . . . . . . . . . . . 54C2.10 Profit Margin for Foodservice and Drinking Establishments, 1999-2006. . . . . . . . . . . . . . . . . 55
C3 Food, Beverage and Tobacco (FBT) Processing . . . . . . . . . . . . . . . . . . . . . . . . . . . . 57C3.1 Food Processing Input Composition and Output Disposition, 2004. . . . . . . . . . . . . . . . . . . . 58C3.2 Distribution of Total Manufacturing GDP by Sector, 2007. . . . . . . . . . . . . . . . . . . . . . . . . . . . 59C3.3 Distribution of Total Manufacturing Employment by Sector, 2007 . . . . . . . . . . . . . . . . . . . . . 59C3.4 Value of FBT Processing Shipments, 1992-2007. . . . . . . . . . . . . . . . . . . . . . . . . . . . . . . . . . . . 60C3.5 Growth in Shipment Value in Real Dollars by FBT Processing Industry, 1995-2007 . . . . . . . . 60C3.6 Distribution of FBT Processing Shipments and Number of Establishments by
Employment Size, 2005 . . . . . . . . . . . . . . . . . . . . . . . . . . . . . . . . . . . . . . . . . . . . . . . . . . . . . . 61C3.7 Concentration Ratio (CR4) in Food Processing, 2005 . . . . . . . . . . . . . . . . . . . . . . . . . . . . . . . 61C3.8 FBT Processing Export Intensities, by Sub-industry, 2007 . . . . . . . . . . . . . . . . . . . . . . . . . . . . 62C3.9 FBT Processing Import Intensities, by Sub-industry, 2007 . . . . . . . . . . . . . . . . . . . . . . . . . . . . 62C3.10 Variable Input Costs in Food Manufacturing, 2006 . . . . . . . . . . . . . . . . . . . . . . . . . . . . . . . . . 63C3.11 Hourly Compensation Costs in Food, Beverage and Tobacco Manufacturing,
1992-2005. . . . . . . . . . . . . . . . . . . . . . . . . . . . . . . . . . . . . . . . . . . . . . . . . . . . . . . . . . . . . . . . . 63C3.12 Profit Margin Ratio in Food and Total Manufacturing, 1999-2007 . . . . . . . . . . . . . . . . . . . . . 64C3.13 Combined Federal/Provincial Corporate Income Tax Rates for Manufacturers and
Processors, Ontario and Quebec: 1986-2007. . . . . . . . . . . . . . . . . . . . . . . . . . . . . . . . . . . . . . 64C3.14 Return on Equity Ratio in Food and Total Manufacturing, 1999-2007 . . . . . . . . . . . . . . . . . . 64C3.15 Debt to Equity Ratio in Food and Total Manufacturing, 1999-2007 . . . . . . . . . . . . . . . . . . . . 65C3.16 Capital Stock, Canadian Food Processing, 1961-2007 . . . . . . . . . . . . . . . . . . . . . . . . . . . . . . . 65C3.17 Stock of FDI in Canadian Food Manufacturing by Country of Origin, 1999-2007 . . . . . . . . . 66C3.18 Stock of FDI in Canadian Beverage and Tobacco Manufacturing by Country of
Origin, 2000-2007 . . . . . . . . . . . . . . . . . . . . . . . . . . . . . . . . . . . . . . . . . . . . . . . . . . . . . . . . . . 66

viii
Lis
t o
f C
ha
rts
An Overview of the Canadian Agriculture and Agri-Food System
C3.19 Accumulated Outward Investment in Food Manufacturing by Country of Origin,1999-2007 . . . . . . . . . . . . . . . . . . . . . . . . . . . . . . . . . . . . . . . . . . . . . . . . . . . . . . . . . . . . . . . . 67
C4 Primary Agriculture . . . . . . . . . . . . . . . . . . . . . . . . . . . . . . . . . . . . . . . . . . . . . . . . . . 69C4.1 Disposition of the Value of Agricultural Production, 2004 . . . . . . . . . . . . . . . . . . . . . . . . . . . 70C4.2 Provincial Shares of Farmland and Farms, 2006 . . . . . . . . . . . . . . . . . . . . . . . . . . . . . . . . . . . 71C4.3 Number and Size of Farms, 2006. . . . . . . . . . . . . . . . . . . . . . . . . . . . . . . . . . . . . . . . . . . . . . . 71C4.4 Farm Market Receipts by Commodity, 1990 and 2007 . . . . . . . . . . . . . . . . . . . . . . . . . . . . . . 72C4.5 Regional Farm Market Receipts by Commodity Share, 2007. . . . . . . . . . . . . . . . . . . . . . . . . . 72C4.6 Share of Production from Export Sales, 2004-2006 . . . . . . . . . . . . . . . . . . . . . . . . . . . . . . . . 73C4.7 Share of Farm Market Receipts from Export Sales for Canada, the U.S. and the EU,
1999-2006 . . . . . . . . . . . . . . . . . . . . . . . . . . . . . . . . . . . . . . . . . . . . . . . . . . . . . . . . . . . . . . . . 73C4.8 U.S. Corn, Wheat and Soybean Prices, 1980-2008 . . . . . . . . . . . . . . . . . . . . . . . . . . . . . . . . . .74C4.9 Farm Product Price Index: Crop Prices and Livestock Prices, 1991-2007. . . . . . . . . . . . . . . . . .74C4.10 Farm Market Receipts by Commodity, 2007 Relative to Five-Year Average . . . . . . . . . . . . . . . 75C4.11 Regional Farm Market Receipts, 2007 Relative to Five-Year Average . . . . . . . . . . . . . . . . . . . . 75C4.12 Program Payments per Farm, 2003-2008 . . . . . . . . . . . . . . . . . . . . . . . . . . . . . . . . . . . . . . . . .76C4.13 Net Cash Income per Farm, 2003-2008. . . . . . . . . . . . . . . . . . . . . . . . . . . . . . . . . . . . . . . . . . .76C4.14 Value-Added in Agriculture, 1991-2008 . . . . . . . . . . . . . . . . . . . . . . . . . . . . . . . . . . . . . . . . . 77C4.15 Distribution of Net Value-Added, 2008 . . . . . . . . . . . . . . . . . . . . . . . . . . . . . . . . . . . . . . . . . . 77C4.16 Number of Farms by Revenue Class, 1980-2005 . . . . . . . . . . . . . . . . . . . . . . . . . . . . . . . . . . . 78C4.17 Percent of Farms by Revenue Class, 1980-2005 . . . . . . . . . . . . . . . . . . . . . . . . . . . . . . . . . . . 78C4.18 Distribution of Gross Farm Receipts by Revenue Class (2005 Constant $), 1986-2006 . . . . . 79C4.19 Average Net Cash Income by Revenue Class, 2008. . . . . . . . . . . . . . . . . . . . . . . . . . . . . . . . . 80C4.20 Average Net Cash Income by Province, 2008 . . . . . . . . . . . . . . . . . . . . . . . . . . . . . . . . . . . . . 80C4.21 Average Net Cash Income by Farm Type, 2008. . . . . . . . . . . . . . . . . . . . . . . . . . . . . . . . . . . . 80C4.22 Average Net Market Income and Program Payments, 2003-2008 . . . . . . . . . . . . . . . . . . . . . 81C4.23 Average Total Income by Province, 2008. . . . . . . . . . . . . . . . . . . . . . . . . . . . . . . . . . . . . . . . . 82C4.24 Average Total Income by Farm Type, 2008 . . . . . . . . . . . . . . . . . . . . . . . . . . . . . . . . . . . . . . . 82C4.25 Average Income of Farm Families by Source of Income, 2008 . . . . . . . . . . . . . . . . . . . . . . . . 83C4.26 Distribution of Farms with $10,000 or more in Gross Farm Receipts by Typology
Group, 2006. . . . . . . . . . . . . . . . . . . . . . . . . . . . . . . . . . . . . . . . . . . . . . . . . . . . . . . . . . . . . . . 84C4.27 Definition of Farm Typology . . . . . . . . . . . . . . . . . . . . . . . . . . . . . . . . . . . . . . . . . . . . . . . . . . 84C4.28 Farm Typology Data, 2006. . . . . . . . . . . . . . . . . . . . . . . . . . . . . . . . . . . . . . . . . . . . . . . . . . . . 85C4.29 Most Important Business Goal by Farm Typology, 2007. . . . . . . . . . . . . . . . . . . . . . . . . . . . . 86C4.30 Gross Margin Ratios Reported by High Cost and Low Cost Farms by Typology, 2006. . . . . . 86C4.31 Average Farm Net Worth, 1995-2006 . . . . . . . . . . . . . . . . . . . . . . . . . . . . . . . . . . . . . . . . . . . 87C4.32 Average Farm Net Worth by Province, 2004-2006 . . . . . . . . . . . . . . . . . . . . . . . . . . . . . . . . . 87C4.33 Average Assets, Liabilities and Net Worth by Farm Type, 2006 . . . . . . . . . . . . . . . . . . . . . . . . 88C4.34 Average Quota Holdings of Supply-Managed Farms, 1995-2006. . . . . . . . . . . . . . . . . . . . . . 88C4.35 Debt to Asset Ratios for All Farms, Canada, 1995-2006. . . . . . . . . . . . . . . . . . . . . . . . . . . . . . 89C4.36 Financial Stress for All Farms, Canada, 2006 . . . . . . . . . . . . . . . . . . . . . . . . . . . . . . . . . . . . . . 89C4.37 Financial Stress Levels of Grain and Oilseed Farms in Canada, 2006 . . . . . . . . . . . . . . . . . . . 90C4.38 Financial Stress Levels of Hog Farms in Canada, 2006 . . . . . . . . . . . . . . . . . . . . . . . . . . . . . . 90C4.39 Rates of Return in the Farming Sector by Farm Type, 1997-2006 Average . . . . . . . . . . . . . . . 91C4.40 Rates of Return for Grain Farms, 1997-2006 . . . . . . . . . . . . . . . . . . . . . . . . . . . . . . . . . . . . . . 91C4.41 Rates of Return for Hog Farms, 1997-2006 . . . . . . . . . . . . . . . . . . . . . . . . . . . . . . . . . . . . . . . 92

ix
Lis
t of C
ha
rts
An Overview of the Canadian Agriculture and Agri-Food System
C5 Agricultural Input and Service Suppliers . . . . . . . . . . . . . . . . . . . . . . . . . . . . . . . . . 93C5.1 The Value Chain of Agriculture-Specific Input and Service Suppliers . . . . . . . . . . . . . . . . . . . 94C5.2 Farm Input Prices and Farm Product Prices, 1971-2007 . . . . . . . . . . . . . . . . . . . . . . . . . . . . . . 95C5.3 Farm Net Operating Expenses and Depreciation, 2007 . . . . . . . . . . . . . . . . . . . . . . . . . . . . . . 95C5.4 Chemical Input Usage in Farming, 1971-2007 . . . . . . . . . . . . . . . . . . . . . . . . . . . . . . . . . . . . . 96C5.5 Farm Expenses on Machinery Fuel, 1980-2007 . . . . . . . . . . . . . . . . . . . . . . . . . . . . . . . . . . . . 96C5.6 Market Shares of Co-operatives in Farm Supplies, 1986-2005. . . . . . . . . . . . . . . . . . . . . . . . . 97C5.7 Co-operative Supply Sales, 2005 . . . . . . . . . . . . . . . . . . . . . . . . . . . . . . . . . . . . . . . . . . . . . . . 97
C6 Natural Resource Use and Environmental Impacts . . . . . . . . . . . . . . . . . . . . . . . . . 99C6.1 World Arable Land and Permanent Cropland, 1961-2005. . . . . . . . . . . . . . . . . . . . . . . . . . . 100C6.2 Arable Land in Canada Relative to Other Countries, 2005. . . . . . . . . . . . . . . . . . . . . . . . . . . 100C6.3 Share of Agricultural Land and Land in Forest to Total Land, 2001 . . . . . . . . . . . . . . . . . . . . 101C6.4 Canadian Agricultural Land Use, 2006 . . . . . . . . . . . . . . . . . . . . . . . . . . . . . . . . . . . . . . . . . . 101C6.5 Share of Major Countries in Global Renewable Water Resources, 1998-2002 Average. . . . . 102C6.6 Share of Selected Countries in World Water Withdrawal, 1998-2002 Average . . . . . . . . . . . 102C6.7 Agricultural Water Withdrawal as a Percentage of Total Water Withdrawal in
Selected Countries, 1998-2002 Average. . . . . . . . . . . . . . . . . . . . . . . . . . . . . . . . . . . . . . . . . 102C6.8 Agricultural Water Withdrawal as a Percentage of Total Renewable Resources in
Selected Countries, 1998-2002 Average. . . . . . . . . . . . . . . . . . . . . . . . . . . . . . . . . . . . . . . . . 103C6.9 Distribution of Total Agricultural Water Use in Canada, by Type, 2006. . . . . . . . . . . . . . . . . 103C6.10 Agricultural Total Water Use by Province, 2001 and 2006 . . . . . . . . . . . . . . . . . . . . . . . . . . . 104C6.11 Irrigated Areas by Province, 2000 and 2005. . . . . . . . . . . . . . . . . . . . . . . . . . . . . . . . . . . . . . 104C6.12 Land Use by Province, 2001 and 2006 . . . . . . . . . . . . . . . . . . . . . . . . . . . . . . . . . . . . . . . . . . 105C6.13 Tillage Practices by Region, 2001 and 2006. . . . . . . . . . . . . . . . . . . . . . . . . . . . . . . . . . . . . . 105C6.14 Breakdown of Total Cropland Area by Erosion Risk Classes, 1981-2006 . . . . . . . . . . . . . . . . 106C6.15 Livestock Numbers by Province, 2001 and 2006 . . . . . . . . . . . . . . . . . . . . . . . . . . . . . . . . . . 107C6.16 Nutrient Content to Fertilized Area by Province, 2000 and 2005 . . . . . . . . . . . . . . . . . . . . . 107C6.17 Estimated National Over-Winter Nitrogen Losses and Nitrate-Nitrogen Concentrations
in Drainage Water, 1981-2006 . . . . . . . . . . . . . . . . . . . . . . . . . . . . . . . . . . . . . . . . . . . . . . . . 108C6.18 GHG Emission Levels, 2001 and 2006, by Sector and Province . . . . . . . . . . . . . . . . . . . . . . . 108
Section D Government and the Agriculture and Agri-Food Sector
D1 Government Expenditures . . . . . . . . . . . . . . . . . . . . . . . . . . . . . . . . . . . . . . . . . . . . 111D1.1 Government Expenditures in Support of the Agriculture and Agri-Food Sector,
1985-86 to 2007-08 Fiscal Years . . . . . . . . . . . . . . . . . . . . . . . . . . . . . . . . . . . . . . . . . . . . . . . 112D1.2 Government Expenditures in Support of the Agriculture and Agri-Food Sector
as a Share of GDP, 1985-86 to 2007-08 . . . . . . . . . . . . . . . . . . . . . . . . . . . . . . . . . . . . . . . . . 112D1.3 Government Expenditures in Support of the Agriculture and Agri-Food Sector
by Province, 2007-08 Fiscal Year . . . . . . . . . . . . . . . . . . . . . . . . . . . . . . . . . . . . . . . . . . . . . . . 113D1.4 Government Expenditures in the Agriculture and Agri-Food Sector as a Share of
Sector GDP by Province, 2007-08 Fiscal Year . . . . . . . . . . . . . . . . . . . . . . . . . . . . . . . . . . . . . 113D1.5 Federal Government Expenditures in Support of the Agriculture and Agri-Food
Sector by Major Category, 2007-08 Fiscal Year . . . . . . . . . . . . . . . . . . . . . . . . . . . . . . . . . . . 114D1.6 Provincial Government Expenditures in Support of the Agriculture and Agri-Food
Sector by Major Category, 2007-08 Fiscal Year . . . . . . . . . . . . . . . . . . . . . . . . . . . . . . . . . . . 114D1.7 Government Research Expenditures on Agriculture and Agri-Food, 1990-91 to
2006-07 Fiscal Years . . . . . . . . . . . . . . . . . . . . . . . . . . . . . . . . . . . . . . . . . . . . . . . . . . . . . . . . 115

x
Lis
t o
f C
ha
rts
An Overview of the Canadian Agriculture and Agri-Food System
D1.8 Support to Farm Producers Through Tax Rebates and Exemptions, 1991-92 to2007-08 Fiscal Years . . . . . . . . . . . . . . . . . . . . . . . . . . . . . . . . . . . . . . . . . . . . . . . . . . . . . . . . .116
D1.9 The Stock of Public Infrastructure in Canada, 1961-2007 . . . . . . . . . . . . . . . . . . . . . . . . . . . .116D1.10 Engineering Infrastructure: Shares by Level of Government, 1961-2007 . . . . . . . . . . . . . . . .117
D2 Producer Support Estimates (PSE) and Agricultural Policies inOther Countries . . . . . . . . . . . . . . . . . . . . . . . . . . . . . . . . . . . . . . . . . . . . . . . . . . . . . 119
D2.1 Percent of PSE, Selected Countries, 1986-2007 . . . . . . . . . . . . . . . . . . . . . . . . . . . . . . . . . . . 120D2.2 Composition of Support to Producers, Canada, 1986-1988 and 2005-2007 . . . . . . . . . . . . 120D2.3 Composition of Support to Producers, EU, 1986-1988 and 2005-2007 . . . . . . . . . . . . . . . . 121D2.4 Composition of Support to Producers, U.S., 1986-1988 and 2005-2007 . . . . . . . . . . . . . . . 121

An Overview of the Canadian Agriculture and Agri-Food System xi
F O R E W O R D
This 2008 report provides an economic overview of the Canadian agriculture and agri-food system.
It is meant to be a multi-purpose reference document to provide:
• an introduction to the agriculture and agri-food system;
• a snapshot of structural changes that are occurring throughout the system in response to variousfactors; and
• background data and information to inform public discussions on challenges and opportunities facingthe Canadian agriculture and agri-food system.
Charts and tables with brief accompanying texts are used to summarize information and to provide baseperformance indicators.
The 2008 report begins with a special feature describing recent developments in global commoditymarkets when prices rose dramatically over the past year.
It continues by reviewing each segment of the system, going upstream from consumers to fooddistribution, food, beverage and tobacco (FBT) processing, primary agriculture, and input suppliers. Itconcludes with a review of government expenditures in support of agriculture including measures ofinternational support. It introduces a new section this year that considers the natural resources available inCanada and the environmental impacts of agriculture on the environment.
It describes the Canadian agriculture and agri-food system as a highly complex, integrated, internationallycompetitive and growing part of the Canadian economy. It is a resilient system, responding to thechallenges and opportunities it faces by restructuring and adapting to changing consumer demands,advancing technology, increased demand for non-food and non-feed products, North Americanintegration and globalization.

An Overview of the Canadian Agriculture and Agri-Food System xiii
H I G H L I G H T S
• The agriculture and agri-food system encompasses several industries including the farm input andservice supplier industries, primary agriculture, food, beverage and tobacco (FBT) processing, whole-sale and retail food industries and foodservice. It continues to play an important role in the federaland provincial economies, making a significant contribution to Gross Domestic Product (GDP) andemployment. It directly provided one in eight jobs and accounted for 8% of total GDP in 2006.
• Export opportunities are critical for the growth of most Canadian agriculture and agri-food industries.In 2007, Canada was the fourth-largest exporter and sixth-largest importer of agriculture and agri-food products in the world, with exports and imports valued at $32 billion and $26 billion, respec-tively.
• The agriculture and agri-food system is becoming more internationally focussed with Canada's shareof world agriculture and agri-food trade increasing over the past 15 years in response to trade liberali-zation and growing world economies. The composition of the agriculture and agri-food system'strade has also changed with increasing exports of consumer-oriented goods that meet changinginternational demands.
• Changing consumer demands are influencing changes throughout the whole agriculture and agri-food system. Consumers are demanding more variety, more convenience, more environmentally-friendly and healthier food choices, accompanied by proper assurances of quality and safety.
• Canadians enjoy some of the lowest food costs in the world, with food from stores accounting foronly 10% of personal household expenditures in recent years.
• In response to challenges and changing market conditions, the agriculture and agri-food sector hasgone through considerable transformation with a continued trend towards fewer, larger farms andfirms and increased concentration. There is also an increasing number of farms and firms diversifyingproduction, growing organic products and adopting environmentally-friendly production methods.
• The agriculture and agri-food sector is also continuously developing innovative products such as bio-products and functional foods and nutraceutical (FFN) products that provide excellent market oppor-tunities to diversify and meet challenges in a competitive global market.
• The prosperity of the sector depends on its ability to be productive and competitive. Although Canadahas become more competitive in the net export of various agricultural and agri-food products, it haslost competitiveness in several sectors due to rising costs.
• Innovation is a key factor in determining competitiveness, with public and private spending onresearch and development (R&D) as a major input to innovation. Public R&D spending in the agricul-ture and agri-food sector has been increasing over time. However, private R&D spending as a share ofGDP in the food manufacturing industry is significantly lower than that of total manufacturing.
• While primary agriculture accounts for a small share of the total economy, it is at the heart of the agri-culture and agri-food system. Any changes in commodity markets can therefore have impacts on theperformance of primary agriculture and the whole supply chain.
An Overview of the Canadian Agriculture and Agri-Food Systemxiv
Hig
hli
gh
ts
• Canadian farms differ by size, scale, farm type and typology, while farm operators differ by manage-ment skills and business strategies. Therefore differences in performance between farms can beexplained by this diversity.
• Farm income varies by farm size, type, region and typology. On average, high performance farmstend to have better cost control, which along with support from government policies and programshelp them manage through income variability. Some farm families rely more on off-farm income tohelp them manage.
• The food, beverage and tobacco (FBT) processing sector is a group of industries that transforms pri-mary production and is the second most important manufacturing sector in Canada.
• FBT processing experienced growth in 2007 leading to higher GDP, but higher input costs aresqueezing margins and forcing the sector to adjust business strategies.
• Input suppliers and service providers also perform important functions in the agriculture and agri-food system. In 2007, producers spent over $38 billion in operating expenses, with commercial feedconstituting the largest part of expenses. In addition to already large input expenses, recent increasesin the costs of fuel, fertilizer and pesticides are putting added pressure on farmers. Recent increases infeed prices have added to the financial pressures for livestock farms in particular.
• Total government (federal and provincial) support to the agriculture and agri-food sector rose to arecord high level in 2007-2008 at an estimated value of $8.1 billion or just under 40% of total sectorGDP.
• Program payments continue to account for the largest portion of both federal and provincial govern-ment expenditures in support of the sector in 2006-2007, followed by spending on research andinspection.
• Government support to the sector varies across provinces. On the basis of government support as apercentage of agriculture and agri-food GDP, farmers in Quebec, Nova Scotia and Newfoundland andLabrador received the most support.
• Agricultural policies in Canada and other countries have evolved over time. Some countries havemade major reforms to their agricultural policies, leading to reductions in levels of support and modi-fications to the types of support provided.
• Canada's Producer Support Estimate (PSE) for all commodities was estimated at 18% in 2007compared to 10% for the U.S. and 26% for the EU(27). In 2007, the percent PSE declined for the mainOECD countries mainly because of increased farm gross receipts and reduced market price supportdue to higher world prices in all countries but the U.S.

An Overview of the Canadian Agriculture and Agri-Food System xv
E X E C U T I V E S U M M A R Y
The ag riculture and ag ri - food systemcontinues to be a complex and highly inte-grated group of industries that contributessignificantly to the Canadian economy.
The agriculture and agri-food system continues toplay a significant role in the Canadian economy,particularly when the whole supply chain is consid-ered. The agriculture and agri-food system contrib-uted $87.9 billion (chained 1997 dollars) to thecountry's Gross Domestic Product (GDP) or 8% of theCanadian economy and employed 2.1 million Canadi-ans in 2006. This complex, integrated production anddistribution system includes input and service suppli-ers, primary agriculture producers, food, beverageand tobacco (FBT) processors, food retailers andwholesalers and foodservice providers.
The importance of the agriculture and agri-foodsector varies across provinces, with food processingbeing more important in Eastern Canada, and primaryagriculture being more important on the Prairies.
The Canadian agriculture and agri-food sectordepends on trade
The agriculture and agri-food system has beengrowing at an average rate of 2.4% per year over thepast decade with most of the growth in GDPoccurring in FBT processing, food retail/wholesale andfoodservice.
Growth in the system has been driven partly by exportgrowth, and in particular, by exports of consumer-oriented products. In 2007, total sector export salesreached $32 billion, with just under 50% representingconsumer-oriented products.
Canada continued to be the world's fourth largestagriculture and agri-food exporter in 2007 after Brazil,the U.S. and the EU with 5.6% of total world exports ifEU countries are counted as a trade bloc, and 3.1% ifthey are treated separately.
Source: Statistics Canada and AAFC calculations.
The Agriculture and Agri-Food System's Contribution to GDP and Employment, 2006
0.7 0.41.3 1.8
2 1.7
2.6 3.7
1.5
5.0
0
2
4
6
8
10
12
14
GDP Employment
% of Total
Foodservice
Food Retail/Wholesale
FBT Processing
Primary Agriculture
Input & Service Suppliers
$87.9 (Billion 1997 $)
12.8%
2.1 Million People
8.0 %
Source: Statistics Canada and AAFC calculations.
*BICO: Bulk, Intermediate, and Consumer-Oriented.
Canadian Agriculture and Agri-Food Exports (BICO)*,1990-2007
Bulk
Intermediate
Consumer-Oriented
0
5
10
15
20
25
30
35
1990 1992 1994 1996 1998 2000 2002 2004 2006
Billion $

An Overview of the Canadian Agriculture and Agri-Food Systemxvi
Ex
ec
uti
ve
Su
mm
ary
Overall, Canada's agricultural producersare much more export oriented thanthose in the U.S and the EU.
In 2006, for example, about 45% of Canada'sagr i cu l tura l p roduct ion was ex por tedcompared to 18% in the U.S. and 7% in the EU.Grains and oilseeds and red meats were partic-ularly export oriented.
A rise in global commodity prices in 2007and early 2008 has had an impact on theperformance of the agriculture and agri-food system.
Global commodity prices increased in 2007 andearly 2008 as a result of changes in supply anddemand conditions around the world. TheWorld Food Price Index roughly doubledbetween 2002 and 2008. During the first half of2008 in particular, world food prices rose 32%over 2007 prices.
Source: International Monetary Fund (IMF).
*Note: 2008 data reflects prices as of June 2008.
World Food Price Index, 1980-2008*
0
20
40
60
80
100
120
140
160
180
1980 1983 1986 1989 1992 1995 1998 2001 2004 2007
2005 = 100
Source: Statistics Canada, OECD and AAFC calculations.
Note: Export dependency is calculated as a value of production weighted average of the export dependencies of the following commodities - wheat, coarse grains, oilseeds, beef, pork, dairy and poultry. These commodities cover about 50% of the EU's total farm production, 60% of the U.S.'s total of the farm production and 75% of Canada's total farm production.
Share of Farm Market Receipts from Export Sales for Canada, the U.S. and the EU,
1999-2006
0
10
20
30
40
50
1999-2000 2001-2002 2003-2004 2005-2006
Market Receipts (%) Canada
U.S.EU

An Overview of the Canadian Agriculture and Agri-Food System xvii
Ex
ec
utiv
e S
um
ma
ry
Changing supply and demand conditionsaround the world has led to highercommodity prices.
A rising middle income class in emerging econo-mies contributed to increased demand for higher-value agricultural commodities such as meat anddairy products.
This, combined with droughts in Australia andpoor weather in Europe, tightened supplies andled to the lowest stock-to-use ratios for grains andoilseeds in several years. Stock-to-use ratios forwheat were 25% in 2007, down from 44% in1999. Stock-to-use ratios for coarse grains fell to20% in 2007 from 33% in 1999. At the same time,many countries reduced their public stock hold-ings of cereals over this period.
At the same time, rising energy consump-tion has contributed to higher crude oilprices which have raised input costs.
Crude oil prices climbed from $US25 per barrel in2002 to $US72 per barrel in 2007 and reachedover $US140 per barrel in mid 2008 before fallingback.
Higher energy prices enter directly into farmers’and food manufacturers’ costs of production,increase transportation costs and indirectly affectprices of other inputs.
Source: OECD.
Stock-to-Use Ratios, 1995-2007
0
5
10
15
20
25
30
35
40
45
50
1995 1996 1997 1998 1999 2000 2001 2002 2003 2004 2005 2006 2007
Percent
Wheat
Coarse Grains
Oilseeds
Rice
Sources: IMF and AAFC calculations.
World Crude Oil Prices, 2002-2007
0
20
40
60
80
2002 2003 2004 2005 2006 2007
US$/Barrel

An Overview of the Canadian Agriculture and Agri-Food Systemxviii
Ex
ec
uti
ve
Su
mm
ary
Higher energy and ag riculturalcommodity prices have affected sectorperformance.
Higher crude oil prices have also contributed tohigher input costs, such as farm expenses onmachinery fuel and fertilizer, as well as raisingthe costs of transporting food products aroundthe world.
In Canada, rising commodity prices havehad a limited impact on food priceinflation, as the appreciation of theCanadian dollar since 2003 partiallymoderated food price increases inCanada.
The Canadian dollar appreciation also hadother impacts on the Canadian agriculture andagri-food sector. This included dampeningexport demand, lowering farm and food mar-ket export revenues and increasing the relativelabour cost in Canada and the U.S. It alsolowered the cost of imported inputs, such asmachinery and equipment, thereby encourag-ing investment in the sector.
Source: Statistics Canada.
Farm Expenses on Machinery Fuel, 1980-2007
0.0
0.5
1.0
1.5
2.0
2.5
1980 1983 1986 1989 1992 1995 1998 2001 2004 2007
Billion $
Sources: Bank of Canada; Statistics Canada; IMF.
World and Canadian Food Price Indices and U.S./Canada Exchange Rate,
2000-2007
80
100
120
140
160
180
200
2000 2001 2002 2003 2004 2005 2006 2007
2002 = 100
0.50
0.55
0.60
0.65
0.70
0.75
0.80
0.85
0.90
0.95
1.00
US$/CAN$
World CPI
US$/CAN$
Canada CPI

An Overview of the Canadian Agriculture and Agri-Food System xix
Ex
ec
utiv
e S
um
ma
ry
Canadian consumers continued to spenda smaller share of their budgets on foodin 2007.
In 2007, Canadians spent $150 billion on foodfrom stores and from restaurants. This repre-sented only 13% of their total personal spend-ing, down from 17% in 1981. This occurred asreal per capita personal disposable incomeincreased in 2007. While spending on foodfrom stores was down to under 10% of totalspending, the share allocated to restaurantmeals continued to become more important.
The lowest income households inCanada, however, allocated larger sharesof spending on food (16% in 2006)compared to the average.
While Canadian food prices increased onlymoderately in the wake of global commodityprice inflation, low income Canadians areaffected since they spend more on food.
Source: Statistics Canada and AAFC calculations.
Average Personal Expenditures on Food as a Share of Total Personal Expenditures,
1981-2007
0
5
10
15
20
25
30
1981 1986 1991 1996 2001 2006
0
500
1,000
1,500
2,000
2,500
3,000
3,500
Food Purchased from Restaurants
Food Purchased from Stores
Avg. Personal Expenditure on Food
Avg. Personal Expenditure
(Chained 2002 $/Person)
Total Personal Expenditures
(%)
Source: Statistics Canada and AAFC calculations.
*Quintile: Households are ranked in ascending order by total household income and are then divided into five equal groups. The 1st quintile is the lowest 20% of households and the 5th quintile is the highest 20% of households.
Share of Household Food Expenditures by Income Quintile*, 2006
0
4
8
12
16
20
First Quintile SecondQuintile
Third Quintile FourthQuintile
Fifth Quintile
$22,600 $40,600 $62,700 $96,500 >$96,500
Percent
Upper Limit on Quintile

An Overview of the Canadian Agriculture and Agri-Food Systemxx
Ex
ec
uti
ve
Su
mm
ary
Compared to many other countries,Canadians spend a relatively small shareon food from stores (10%), as do citizensin the U.S. and the UK.
This compares with emerging countries, wherelarge portions of the population live on lessthan US$1 per day, and allocate well over 60%of total household expenditures on food.
Global commodity price increases in 2008 havehit citizens in these countries particularly hard,leading to calls for greater food aid to thoseregions.
The food, beverage and tobacco (FBT)processing sector has also been affectedby international market developmentsin 2007 and 2008.
FBT processing is the second-largest manufac-turing sector in Canada after transportationequipment. The FBT industry is highly exportoriented with some sub-sectors more depend-ent on trade than others. Therefore, it has beenaffected by the appreciated exchange rate.Nevertheless, FBT GDP was up 2.2% in 2007.
Source: International Food Policy Research Institute (IFPRI).
Household Expenditure Share of Food in Developing Countries Living on Less than
US$1/Day, 2006
0
10
20
30
40
50
60
70
80
Sub-SaharanAfrica
South Asia Central Asia East Asia Latin America
Percent
Source: Statistics Canada and AAFC calculations.
FBT Processing Export Intensities,by Sub-industry, 2007
0 10 20 30 40 50 60 70 80
Dairy
Animal Food
Beverages
Tobacco
Other Food
Bakeries & Tortilla
Meat
Fruit, Vegetable Preserving & SpecialtyFood
Sugar & Confectionery
Grain & Oilseed
Seafood
Shipments (%)
FBT Average 25%

An Overview of the Canadian Agriculture and Agri-Food System xxi
Ex
ec
utiv
e S
um
ma
ry
Profit margins were higher in 2007 butthe gap between FBT and total manufac-turing narrowed.
2008 is seeing higher raw material, labour,t ranspor tat ion and energy cos ts . Th is ,combined with an appreciated exchange rate, iscreating competitive pressures that are leadingthe industry to further rationalize and restruc-ture.
Lower costs for imported machinery and equip-ment, because of an appreciated exchange rate,have meant that food manufacturers have beenable to invest in new capital stock particularlymachinery and equipment. This may lead toproductivity improvements and enhanced com-petitiveness in the future.
Source: Statistics Canada.
Note: See Glossary for definition of the profit margin ratio.
Profit Margin Ratio in Food and Total Manufacturing, 1999-2007
0
2
4
6
8
10
1999 2000 2001 2002 2003 2004 2005 2006 2007
Food & Soft Drink Processing
Total Manufacturing
Profit Margin Ratio (%)
Source: Statistics Canada.
Note: End-year net stock (Geometric).
Capital Stock, Canadian Food Processing, 1961-2007
0
1
2
3
4
5
6
7
8
9
1961 1966 1971 1976 1981 1986 1991 1996 2001 2006
Billion 2002 $
Machinery & Equip men t
Machinery & Equipment
Build ing Construction

An Overview of the Canadian Agriculture and Agri-Food Systemxxii
Ex
ec
uti
ve
Su
mm
ary
The primary agriculture sector contin-ues to adjust to international marketforces.
In the primary agriculture sector, there is anincreas ing number of large farms thatdominate production. Million dollar farmsaccount for only 2.5% of farms, but accountfor 40% of revenues, and their importance hasincreased over time. Farms have consolidatedin order to be able to benefit from economiesof scale and improvements in productivity andnew technologies in order to compete.
Farming remains a highly-diverse sector. Somehighly-profitable farms are small, businessfocussed farms, while less profitable farms arelifestyle farms that rely largely on off-farmincome.
In 2007 and 2008, as commodity prices haverisen, farm market receipts and net farmincome for grain and oilseed farms have alsoincreased. Livestock farms, on the other hand,which have experienced higher feed costs andlower prices due to high liquidation of herds,are experiencing lower receipts and net farmincome.
Source: Statistics Canada, 2006 Census of Agriculture.
Distribution of Gross Farm Receipts by Revenue Class (2005 Constant $),
1986-2006
47 4537 29 25
22 2221
1919
13 1414
1616
13 1516
20 24
5 511 16 16
0
10
20
30
40
50
60
70
80
90
100
1986 1991 1996 2001 2006
Share of Gross Farm Receipts (%)
Less than $250,000 $250,000 - $499,999$500,000 - $999,999 $1,000,000 - $4,999,999$5,000,000 or more
Source: Statistics Canada.
2007 Farm Market Receipts by Commodity, Relative to Five-Year Average
-10 -5 0 5 10 15 20 25 30 35 40 45 50 55 60 65
Hogs
Cattle & Calves
Fruits & Vegetables
Other Commodities
Poultry & Eggs
Dairy
Sheep & Lambs
Grains
Oilseeds
Percent Change

An Overview of the Canadian Agriculture and Agri-Food System xxiii
Ex
ec
utiv
e S
um
ma
ry
Program payments are expected tobe down in 2008 from previous yearsas market income has grown.
Net market income per farm is expected toincrease from $14,300 to $20,877 for farmsbetween 2007 and 2008.
Program payments per farm are expectedto fall from $21,013 to $20,144 for farmsbetween 2007 and 2008.
Net value-added in agriculture,whic h measures the economicactivity of the sector as a whole, isexpected to be higher in 2007 and2008 than in previous years.
Agriculture’s net-value added will rise to$12.2 billion in 2008, up from $9.4 billionin 2007. This is due to the rapid growth inthe value of agricultural production, asimproved prices in the crop sector willmore than offset high costs of productionand lower receipts for red meat producers.
Source: Statistics Canada and AAFC calculations. Note: 2008 figures are forecasts.
Average Net Market Income and Program Payments, 2003-2008
0
5
10
15
20
25
30
35
40
45
2003 2004 2005 2006 2007 2008
Thousand $
Program Payments
Net Market Income
Source: AAFC calculations.
Note: 2008 figures are forecasts.
Value-Added in Agriculture, 1991-2008
0
2
4
6
8
10
12
14
1991 1993 1995 1997 1999 2001 2003 2005 2007
Billion $
An Overview of the Canadian Agriculture and Agri-Food Systemxxiv
Ex
ec
uti
ve
Su
mm
ary
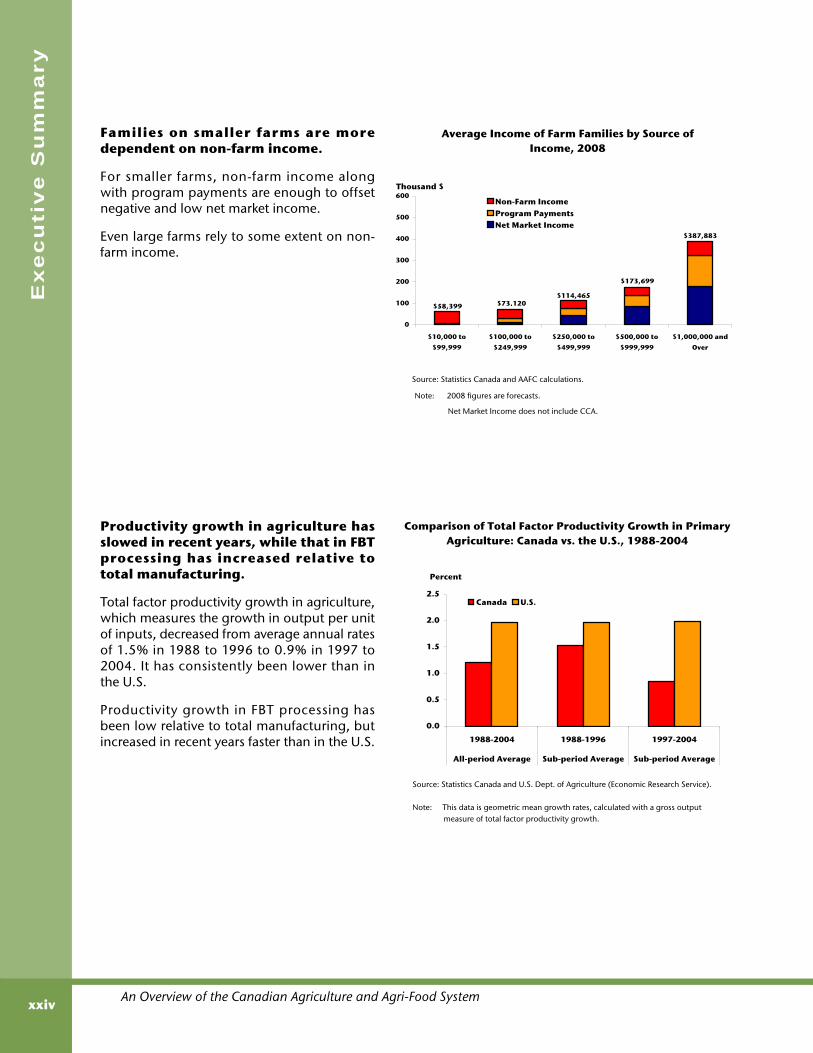
Families on smaller farms are moredependent on non-farm income.
For smaller farms, non-farm income alongwith program payments are enough to offsetnegative and low net market income.
Even large farms rely to some extent on non-farm income.
Productivity growth in agriculture hasslowed in recent years, while that in FBTprocessing has increased relative tototal manufacturing.
Total factor productivity growth in agriculture,which measures the growth in output per unitof inputs, decreased from average annual ratesof 1.5% in 1988 to 1996 to 0.9% in 1997 to2004. It has consistently been lower than inthe U.S.
Productivity growth in FBT processing hasbeen low relative to total manufacturing, butincreased in recent years faster than in the U.S.
Source: Statistics Canada and U.S. Dept. of Agriculture (Economic Research Service). Note: This data is geometric mean growth rates, calculated with a gross output measure of total factor productivity growth.
Comparison of Total Factor Productivity Growth in Primary Agriculture: Canada vs. the U.S., 1988-2004
0.0
0.5
1.0
1.5
2.0
2.5
1988-2004 1988-1996 1997-2004
All-period Average Sub-period Average Sub-period Average
Percent
Canada U.S.
Source: Statistics Canada and AAFC calculations.
Note: 2008 figures are forecasts.
Net Market Income does not include CCA.
Average Income of Farm Families by Source of Income, 2008
0
100
200
300
400
500
600
$10,000 to
$99,999
$100,000 to
$249,999
$250,000 to
$499,999
$500,000 to
$999,999
$1,000,000 and
Over
Thousand $
Non-Farm IncomeProgram PaymentsNet Market Income
$173,699
$387,883
$73,120$114,465
$58,399

An Overview of the Canadian Agriculture and Agri-Food System xxv
Ex
ec
utiv
e S
um
ma
ry
Productivity improvements occur as aresult of R&D investments andinnovation.
In primary agriculture, public spending onR&D has fallen both in absolute terms and as ashare of gross farm receipts, and relative toAustralia and the U.S.
Private R&D spending on FBT processing,which is lower than in total manufacturing,has stabilized after having increased in 2004.
Canada is endowed with a relativeabundance of arable land and water.
Canada's rank as second in the world for theavailability of arable land per person explainsour status as a large producer and exporter ofagricultural products. Canada's share of landsuitable for agricultural production is only asmall percentage (5%) of the total.
('000 ha) ('000 people)
Australia 49,742 3.2 20,000 2.49 1
Canada 52,110 3.3 32,000 1.63 2
Russia 123,581 7.9 143,000 0.86 3
Ukraine 33,353 2.1 47,000 0.71 4
U.S. 177,178 11.3 296,000 0.60 5
Brazil 66,600 4.3 184,000 0.36 6
Nigeria 35,000 2.2 134,000 0.26 7
Indonesia 36,600 2.3 220,000 0.17 8
India 169,650 10.9 1,102,000 0.15 9
China 156,327 10.0 1,304,000 0.12 10
Sources: United Nations, Demographic Yearbook 2005.
Food and Agriculture Organization of the United Nations (FAO).
http://faostat.fao.org
ha/person Rank
Arable Land in Canada Relative to Other Countries, 2005
Population% of world arable land
Arable land
Source: OECD, Agricultural Policies in OECD Countries: At a Glance, 2008.
Public R&D Support to the Agriculture and Agri-Food Sector, 1986-2007
0.0
0.2
0.4
0.6
0.8
1.0
1.2
1.4
1.6
1.8
1986-1995 1996-2005 2006 2007
Gross Farm Receipts (%)
Canada
Australia
U.S.

An Overview of the Canadian Agriculture and Agri-Food Systemxxvi
Ex
ec
uti
ve
Su
mm
ary
In Canada, agriculture uses a relativelysmall share of its abundant renewablewater resources for irrigation andlivestock.
In Canada, only 0.18% of the country’s totalrenewable water resources were used foragriculture. This compares with India where30% of total renewable water resources are foragricultural use.
Canadian farmers are adopting envi-ronmentally-friendly best manage-ment practices which are sustainable.
Canadian farmers are increasingly adoptingmanagement practices to farm with environ-mental concerns in mind by conserving thesoil, protecting water quality and reducinggreenhouse gas emissions through bestmanagement practices. Increased no-tillpractices are an example of a practice whichleads to reduced fuel and fertilizer costs whilehelping conserve soils.
Source: Calculated from AQUASTAT database of the Food and Agriculture Organization (FAO).
Agricultural Water Withdrawal as a Percentage of Total Renewable Resources in
Selected Countries, 1998-2002 Average
0
5
10
15
20
25
30
35
India
Mexico
China
U.S.
Germany
Austra
lia
Indonesia
Argentin
a
France
Brazil
Russia
New Zealand
Canada
Percent
Source: Census of Agriculture, 2006.
Tillage Practices by Region, 2001 and 2006
0%
20%
40%
60%
80%
100%
2001 2006 2001 2006 2001 2006 2001 2006 2001 2006
B.C. Prairies Ont. Que Atlantic
Conventional Tillage Moderate Tillage No Tillage
An Overview of the Canadian Agriculture and Agri-Food System xxvii
Ex
ec
utiv
e S
um
ma
ry
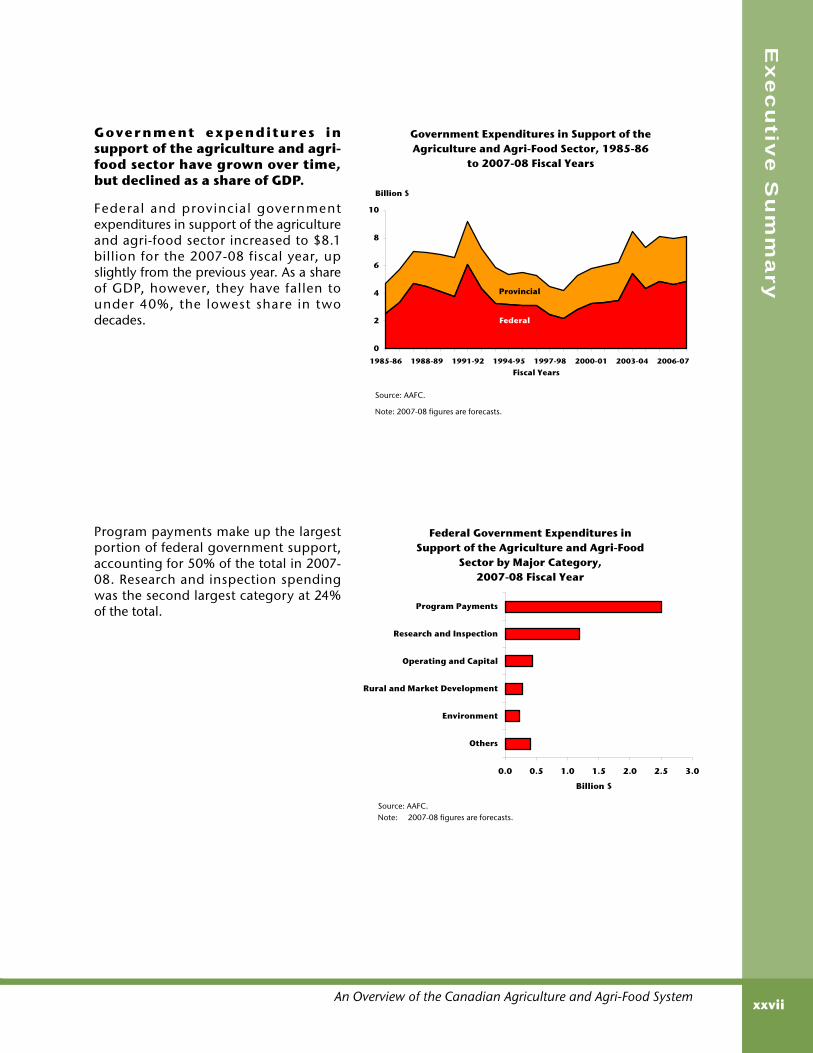
Government e xpenditures insupport of the agriculture and agri-food sector have grown over time,but declined as a share of GDP.
Federal and provincial governmentexpenditures in support of the agricultureand agri-food sector increased to $8.1billion for the 2007-08 fiscal year, upslightly from the previous year. As a shareof GDP, however, they have fallen tounder 40%, the lowest share in twodecades.
Program payments make up the largestportion of federal government support,accounting for 50% of the total in 2007-08. Research and inspection spendingwas the second largest category at 24%of the total.
Source: AAFC.Note: 2007-08 figures are forecasts.
Federal Government Expenditures in Support of the Agriculture and Agri-Food
Sector by Major Category,2007-08 Fiscal Year
0.0 0.5 1.0 1.5 2.0 2.5 3.0
Others
Environment
Rural and Market Development
Operating and Capital
Research and Inspection
Program Payments
Billion $
Source: AAFC.
Note: 2007-08 figures are forecasts.
Government Expenditures in Support of the Agriculture and Agri-Food Sector, 1985-86
to 2007-08 Fiscal Years
0
2
4
6
8
10
1985-86 1988-89 1991-92 1994-95 1997-98 2000-01 2003-04 2006-07
Fiscal Years
Billion $
Provincial
Federal

An Overview of the Canadian Agriculture and Agri-Food Systemxxviii
Ex
ec
uti
ve
Su
mm
ary
Based on the OECD estimates of ProducerSubsidy Equivalents (PSE), suppor t toCanadian producers as a share of gross farmreceipts fell from 20% in 2006 to 18% in2007, primarily due to an increase in farmreceipts and a decrease in market price sup-port due to higher world commodity prices.This compares with the EU and the U.S.,where the PSE was 26% and 10% respectively,in 2007.
Source: OECD, Trade and Agriculture Directorate, Producer and
Consumer Support Estimates, OECD Database 1986-2007.
Percent of PSE, Selected Countries, 1986-2007
0
10
20
30
40
50
1986 1988 1990 1992 1994 1996 1998 2000 2002 2004 2006
Gross Farm Receipts (%) Canada
EU
U.S.

1
S E C T I O N ASpecial Feature


3
S E C T I O N A 1G l o b a l F o o d P r i c e
I n f l a t i o n
Global prices for commodities such as crude oil, wheat and rice rose in 2008 as a result of changes insupply and demand conditions around the world. A rising middle income class in emerging economieshas contributed to increased demand for commodities, while droughts in Australia and poor weather inEurope have tightened supplies, leading to the lowest stock-to-use ratios for grains in a decade. Highercrude oil prices have also put upward pressure on farm input costs such as fuel and fertilizer. In Canada,a stronger dollar relative to the U.S. dollar moderated price increases for most agricultural commoditiesand food.
An Overview of the Canadian Agriculture and Agri-Food System4
Se
cti
on
A1
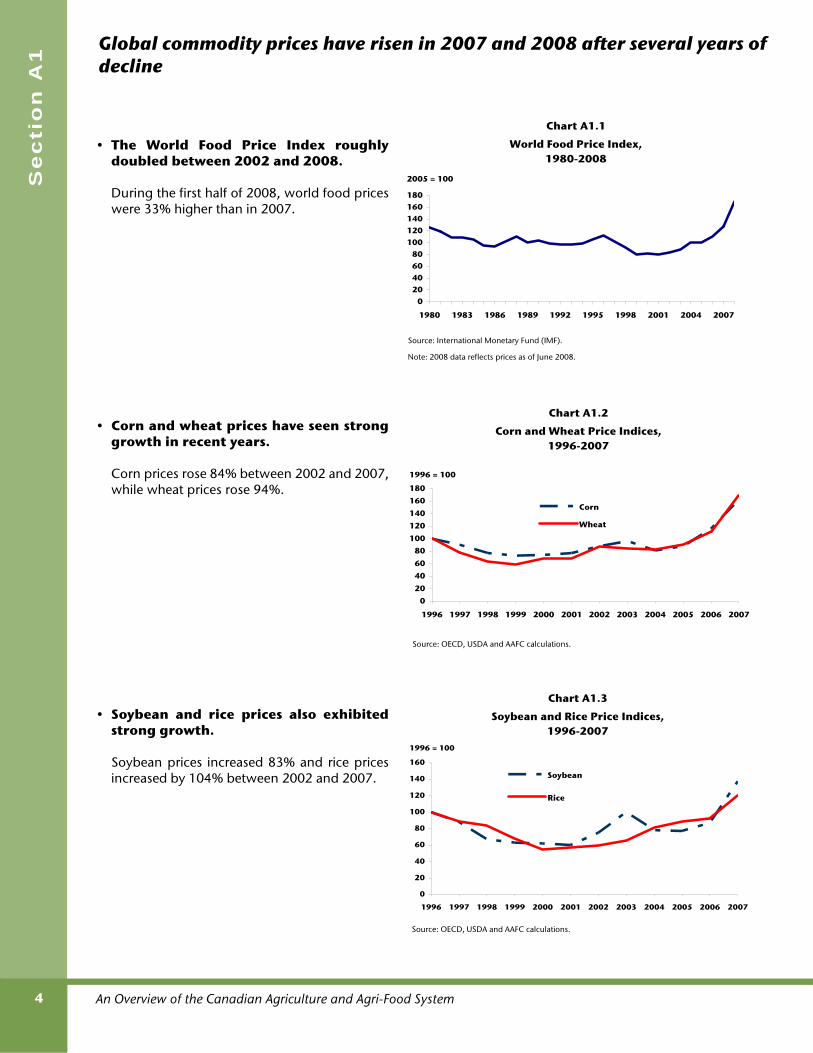
• The World Food Price Index roughlydoubled between 2002 and 2008.
During the first half of 2008, world food priceswere 33% higher than in 2007.
• Corn and wheat prices have seen stronggrowth in recent years.
Corn prices rose 84% between 2002 and 2007,while wheat prices rose 94%.
• Soybean and rice prices also exhibitedstrong growth.
Soybean prices increased 83% and rice pricesincreased by 104% between 2002 and 2007.
Source: OECD, USDA and AAFC calculations.
Chart A1.2
Corn and Wheat Price Indices, 1996-2007
020
4060
80100
120140
160180
1996 1997 1998 1999 2000 2001 2002 2003 2004 2005 2006 2007
1996 = 100
Corn
Wheat
Source: OECD, USDA and AAFC calculations.
Chart A1.3
Soybean and Rice Price Indices, 1996-2007
0
20
40
60
80
100
120
140
160
1996 1997 1998 1999 2000 2001 2002 2003 2004 2005 2006 2007
1996 = 100
Soybean
Rice
Source: International Monetary Fund (IMF).
Note: 2008 data reflects prices as of June 2008.
Chart A1.1
World Food Price Index, 1980-2008
020406080
100120140160180
1980 1983 1986 1989 1992 1995 1998 2001 2004 2007
2005 = 100
Global commodity prices have risen in 2007 and 2008 after several years ofdecline

An Overview of the Canadian Agriculture and Agri-Food System 5
Glo
ba
l Fo
od
Pric
e In
flatio
n
• The world’s population continues togrow, but at slower rates.
The world's population grew from 3.7 billion in1970 to approximately 6.7 billion in 2008.
However, annual population growth hasslowed from 2.1% in 1970 to roughly 1.2% in2008.
• The increase in global demand forcommodities is partly due to risingincomes in emerging countries likeChina and India.
Annual GDP growth in China has exceeded10% per year since 2003, while India postedannual GDP growth of 7.7% in 2007, downfrom 8.7% in 2006.
• As incomes in emerging markets havegrown, consumption patterns of majorcommodities have changed.
Rising incomes have fuelled demand for meat,dairy products, fish, and fruits and vegetables.In China, for example, consumption of meatand milk grew by 140% and 200%,respectively, between 1990 and 2005.
Growing consumption of meat and dairyproducts in emerging economies has alsocreated greater demand for animal feed,putting further pressure on grain prices.
Source: U.S. Census Bureau.
Chart A1.4
World Population and Population Growth, 1970-2007
0
1
2
3
4
5
6
7
8
1970 1973 1976 1979 1982 1985 1988 1991 1994 1997 2000 2003 2006
World Population (Billions)
0.0
0.5
1.0
1.5
2.0
2.5
Population Growth Rate
(%)
Population
Growth Rate
Source: OECD.
Chart A1.5
Annual GDP Growth in China and India, 2000-2007
0
2
4
6
8
10
12
2000 2001 2002 2003 2004 2005 2006 2007
Annual GDP Growth (%)
China
India
India China BrazilCereals ~ -20% 20%
Meat 20% 140% 70%
Milk 20% 200% 20%
Fish 20% 130% -10%
Fruits 30% 250% -20%
30% 190% 30%
Source: International Food Policy Research Institute.
Percentage Growth in Consumption of Major Commodities in Emerging Economies,
1990 and 2005
Vegetables
Chart A1.6
Emerging markets include those countries which in the past were classified as developing economies, buthave more recently emerged with strong annual economic growth and greater roles in the global economy.This group includes India, China, and Brazil, among others.
Strong economic growth in emerging economies has led to increaseddemand for higher value food such as meat and dairy products

An Overview of the Canadian Agriculture and Agri-Food System6
Se
cti
on
A1
• Emerging markets are rapidly catchingup with developed nations in terms ofenergy consumption.
World energy consumption increased 63%between 1980 and 2005, but even morerapidly in emerging markets such as China,where it increased by 283% over this period.
China is quickly catching up with the U.S., theworld’s largest energy-consuming nation.
• Rising energy consumption has contri-buted to higher crude oil prices.
Crude oil prices climbed from $US25 per barrelin 2002 to $US72 per barrel in 2007, andreached over $US140/barrel in mid-2008.
Higher energy prices enter directly intofarmers’ costs of production, increase transpor-tation costs and indirectly affect prices of otherinputs.
• For example, higher oil prices have alsoaffected the prices of major agriculturalinputs, such as fertilizers.
Fertilizer prices rose by 6% between 2006 and2007, and to over $1,074/tonne by mid-2008.
Source: Natural Resources Canada and Ridgetown College, University of Guelph.
Note: Prices reported per year differ since they are based on the number of times they are
surveyed each year.
Chart A1.9
Anhydrous Ammonia and Natural Gas Prices,1997-2007
0
200
400
600
800
1000
Ammonia
Price
$/Tonne
0
5
10
15
Natural Gas Price
$/MegajouleAnhydrous Ammonia Price, Ontario
Natural Gas Price, Alberta
1997 1998 1999 2000 2001 2002 2003 2004 2005 2006 2007
Chart A1.7
World Primary Energy Consumption (BTU), 1980-2005
Source: Energy Information Administration.
050
100150200250300350400450500
1980 1983 1986 1989 1992 1995 1998 2001 2004
World (Quadrillion
BTU)
0
20
40
60
80
100
120
China & U.S. (Quadrillion
BTU)World
China
U.S.
Chart A1.8
Sources: IMF and AAFC calculations.
World Crude Oil Prices, 2002-2007
0
20
40
60
80
2002 2003 2004 2005 2006 2007
US$/Barrel
World energy consumption and population have also grown steadily

An Overview of the Canadian Agriculture and Agri-Food System 7
Glo
ba
l Fo
od
Pric
e In
flatio
n
• Weather conditions in Europe andAustralia have impacted the globalsupply of agricultural commodities,which has influenced prices.
Australia, a major exporter of wheat, was hitwith droughts in 2002 and 2006. Thiscontributed to lower world wheat stocks.
• Supply and demand pressures havepushed stocks of cereals to their lowestpoint in over a decade, creat ingadditional pressure on global cerealprices.
Many countries reduced their public stockholdings of cereals over this period.
Stock-to-use ratios for wheat were 25% in2007, down from 44% in 1999. Stock-to-useratios for coarse grains fell to 20% in 2007 from33% in 1999.
World cereal production increased 22%between 1995 and 2007, while consumptionincreased 20% over the same period.
Source: OECD.
Chart A1.11Stock-to-Use Ratios, 1995-2007
0
5
10
15
20
25
30
35
40
45
50
1995 1996 1997 1998 1999 2000 2001 2002 2003 2004 2005 2006 2007
Percent
Wheat
Coarse Grains
Oilseeds
Rice
Source: Australian Bureau of Agricultural and Resource Economics, OECD.
Chart A1.10Wheat Production in Australia, 1987-2007
0
5
10
15
20
25
30
1987 1989 1991 1993 1995 1997 1999 2001 2003 2005 2007
Tonnes (Million)
Supply side pressures for cereals due to droughts in Australia and poorweather in Europe, in conjunction with growing demand, have led to thelowest stocks in a decade

An Overview of the Canadian Agriculture and Agri-Food System8
Se
cti
on
A1
• While world food prices rose sharply in2007 and early 2008, Canada’s retailfood prices increased at a moderatepace below other countries.
A 40% appreciation of the Canadian dollarsince 2003 mitigated rising prices of food inCanada.
• In 2007, Canadian consumer prices roseby far less than in many OECD andemerging nations.
Canadian consumer prices rose 2.1% in 2007,which was below the 2.9% growth rate in theU.S. and 2.3% in the UK.
Emerging nations generally saw much higherrates of overall consumer price inflation. Forexample, consumer prices rose 9% in Russia,6% in India and 5% in China in 2007.
Sources: Bank of Canada; Statistics Canada; IMF.
Chart A1.12World and Canadian Food Price Indices and
U.S./Canada Exchange Rate,2000-2007
80
100
120
140
160
180
200
2000 2001 2002 2003 2004 2005 2006 2007
2002 = 100
0.50
0.55
0.60
0.65
0.70
0.75
0.80
0.85
0.90
0.95
1.00
US$/CAN$
World CPI
US$/CAN$
Canada CPI
Sources: OECD; National Bureau of Statistics of China.
Chart A1.13
Consumer Price Increases for Various Countries, 2007
0.0 2.0 4.0 6.0 8.0 10.0
Japan
France
Netherlands
Italy
Canada
Germany
UK
Korea
Spain
U.S.
Brazil
Mexico
China
India
Russia
Annual Growth Rate (%)
In Canada, rising commodity prices have had a limited impact on food priceinflation as the appreciation of the Canadian dollar partially moderatedfood price increases

An Overview of the Canadian Agriculture and Agri-Food System 9
Glo
ba
l Fo
od
Pric
e In
flatio
n
• Food price inflation has declined sincethe 1980s and is comparable to overallinflation.
Annual food price inflation has averaged 2.6%in the 2000s, which is only slightly higher thanthe average annual inflation rate of 2.3% forconsumer prices overall.
Food price inflation has declined from anannual average rate of 5.1% in the 1980s, whenoverall inflation averaged 6% and energy priceinflation averaged 8%.
• In June 2008, Canada's Consumer PriceIndex (CPI) for food was 2.8% higherthan a year earlier.
This was below the increase in overallconsumer prices of 3.1%.
There was a noticeable increase in the prices ofcereal and bakery products, fats and oils andfresh vegetables, which put upward pressureon the CPI for food.
However, fruit prices in early 2008 were downfrom the same period in 2007 when a freeze inFlorida drove up prices.
In addition, prices of beef and pork are takingtime to adjust as livestock owners respond tohigher feed costs by liquidating herds.
Category Inflation (%)
Overall CPI 3.1
Food 2.8
Food Purchased From Stores 3.0
Beef Fresh or Frozen -1.3
Pork Fresh or Frozen 0.7
Poultry Fresh or Frozen 2.8
Dairy Products 3.7
Eggs 2.9
Bakery and Cereal Products 13.1
Fresh Fruits -2.8
Fresh Vegetables 1.4
Sugar and Confectionery 2.4
Fats and Oils 14.5
Food Purchased From Restaurants 2.5
Source: Statistics Canada.
Chart A1.15
Canadian Retail Food Price Inflation by Category,June 2007-June 2008
Source: Statistics Canada and AAFC calculations.
Chart A1.14
CPI for Food, Energy and Overall Inflation Rate, 1981-2007
0
1
2
3
4
5
6
7
8
9
1981-1990 1991-2000 2001-2007
Average Annual Growth
(%)Food
Energy
Overall Inflation Rate (CPI -All Items)
Consumer inflation in Canada remains low by historical standards

An Overview of the Canadian Agriculture and Agri-Food System10
Se
cti
on
A1
• The impact of rising retail prices onCanadian consumers is limited sincefood accounts for a small portion ofhousehold expenditures
On average, about 10% of total Canadianhousehold expenditures go toward food. This isone of the lowest total household expenditureshares for food, after the U.S. at 7% and the UKat 9%.
Food does account for a higher proportion ofexpenditures in lower income households inCanada. For example, food accounts for 16% ofexpenditures in these households (see ChartC1.5).
Canadians also purchase more highly-processed food, for which agriculturalcommodities constitute a smaller share of thefinal price. Commodity price increases aretherefore mitigated.
• Rising food prices have a much largerimpact in countries where householdsgenerally subsist on low incomes.
Food takes up a larger share of householdbudgets in low income countries where largeportions of the population live on less thanUS$1 per day. Food accounts for well over 60%of total household expenditures.
In light of higher world food prices, this hascontributed to increased food insecurity andcalls for greater food aid to those regions.
Source: OECD.
*Note: 2004 figures for Mexico and 2005 figures for the UK.
Chart A1.16
Household Expenditure Share of Food and Non-Alcoholic Beverages in Selected OECD
Countries, 2006
0
5
10
15
20
25
30
U.S. UK* Canada Germany Australia Mexico*
Share of Total Household
Expenditures (%)
Food and Non-Alcoholic Beverages
Source: International Food Policy Research Institute (IFPRI).
Chart A1.17
Household Expenditure Share of Food in Developing Countries Living on Less than
US$1/Day, 2006
0
10
20
30
40
50
60
70
80
Sub-SaharanAfrica
South Asia Central Asia East Asia Latin America
Percent
Canadians are impacted to a lesser extent by rising commodity prices thanconsumers in many other countries, due to the low budget share for foodand more highly-processed food
11
S E C T I O N B
T h e A g r i c u l t u r ea n d A g r i - F o o d S y s t e m
a n d t h e C a n a d i a n E c o n o m y


13
S E C T I O N B 1G D P
a n d E m p l oy m e n t
The Canadian agriculture and agri-food system is a complex and integrated supply chain of importanceto the Canadian economy. It makes significant direct and indirect contributions to the Canadian GrossDomestic Product (GDP) and employment, but its importance varies from province to province.

An Overview of the Canadian Agriculture and Agri-Food System14
Se
cti
on
B1
• The Canadian agriculture and agri-foodsystem accounted for 8% of totalCanadian Gross Domestic Product (GDP)in 2006.
The food retail/wholesale industry was themajor contributor to the agriculture and agri-food system’s GDP, followed by food, beverageand tobacco (FBT) processing.
Primary agriculture accounted for about 1.3%of national GDP.
• Since 1991, the overall agriculture andagri-food system has been growing at anaverage annual rate of 2.4%, which isbelow the 3.1% growth rate in the over-all economy.
Food retail/wholesale is the fastest growingcomponent, with an average annual growth rateof 4.0%. Primary agriculture and food process-ing GDP have an average annual growth rate of1.3% and 1.4%, respectively.
Source: Statistics Canada and AAFC calculations.
Chart B1.1
Agriculture and Agri-Food System's Contribution to GDP, 2006
1.5%
2.6%
2.0%
1.3%
0.7%
0
1
2
3
4
5
6
7
8
9
GDP
Percent of Total
Input & ServiceSuppliers
Primary Agriculture
FBT Processing
Food Retail/Wholesale
Foodservice
8.0%
$87.9 (Billion 1997 $)
Source: Statistics Canada and AAFC calculations.
Chart B1.2
Agriculture and Agri-Food System's Contribution to GDP, 1991-2006
0
10
20
30
40
50
60
70
80
90
1991 1994 1997 2000 2003 2006
Input & Service Suppliers
Primary Agriculture
FBT Processing
Food Retail/Wholesale
Foodservice
Billion 1997 $
The agriculture and agri-food system plays a significant role in the Canadianeconomy
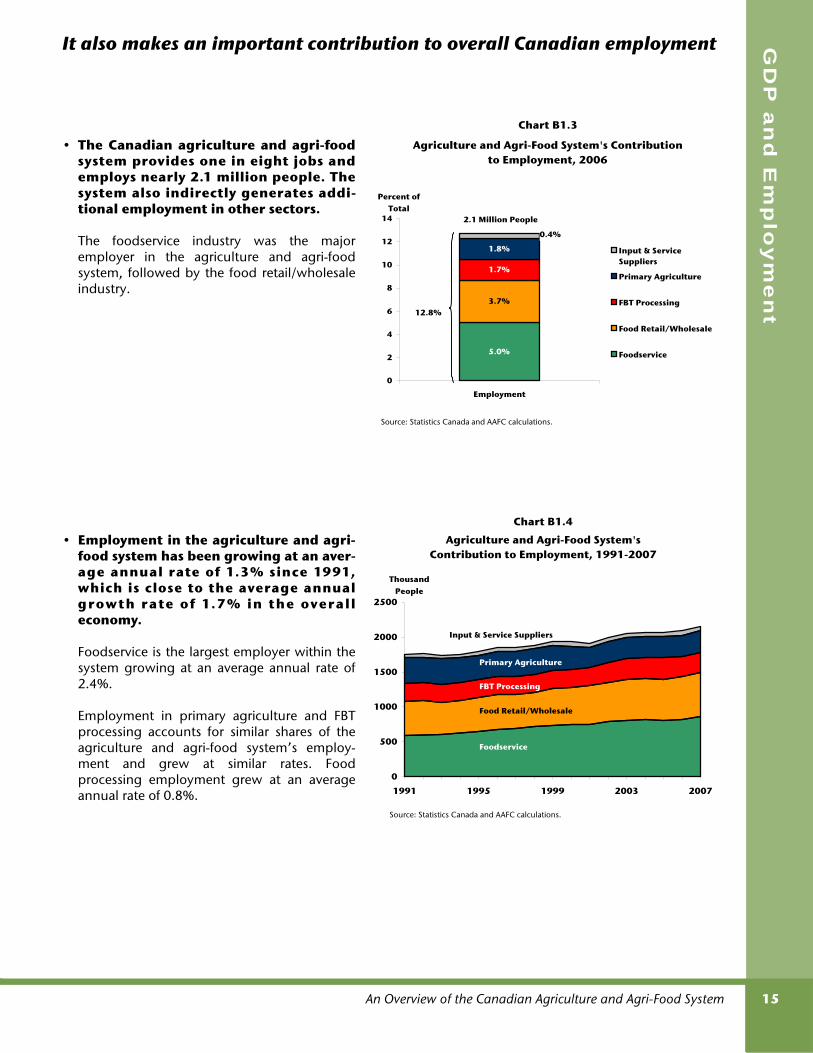
An Overview of the Canadian Agriculture and Agri-Food System 15
GD
P a
nd
Em
plo
ym
en
t
• The Canadian agriculture and agri-foodsystem provides one in eight jobs andemploys nearly 2.1 million people. Thesystem also indirectly generates addi-tional employment in other sectors.
The foodservice industry was the majoremployer in the agriculture and agri-foodsystem, followed by the food retail/wholesaleindustry.
• Employment in the agriculture and agri-food system has been growing at an aver-age annual rate of 1.3% since 1991,which is close to the average annualgrowth rate of 1.7% in the overalleconomy.
Foodservice is the largest employer within thesystem growing at an average annual rate of2.4%.
Employment in primary agriculture and FBTprocessing accounts for similar shares of theagriculture and agri-food system’s employ-ment and grew at similar rates. Foodprocessing employment grew at an averageannual rate of 0.8%.
Source: Statistics Canada and AAFC calculations.
Chart B1.3
Agriculture and Agri-Food System's Contribution to Employment, 2006
5.0%
3.7%
1.7%
1.8%
0.4%
0
2
4
6
8
10
12
14
Employment
Percent of Total
Input & ServiceSuppliers
Primary Agriculture
FBT Processing
Food Retail/Wholesale
Foodservice
12.8%
2.1 Million People
Source: Statistics Canada and AAFC calculations.
Chart B1.4
Agriculture and Agri-Food System's Contribution to Employment, 1991-2007
0
500
1000
1500
2000
2500
1991 1995 1999 2003 2007
Thousand People
Primary Agriculture
FBT Processing
Food Retail/Wholesale
Foodservice
Input & Service Suppliers
It also makes an important contribution to overall Canadian employment

An Overview of the Canadian Agriculture and Agri-Food System16
Se
cti
on
B1
• In terms of contribution to total provin-cial GDP, agriculture and food processingplay the largest role in Prince EdwardIsland and Saskatchewan, accounting fornearly 13% and 12% of provincial GDP,respectively.
The mix between primary agriculture and foodprocessing also varies across provinces. East ofManitoba, except for P.E.I., food processing ac-counts for the largest share of provincial GDP.In the Prairies, primary agriculture plays a moreimportant role.
• The contribution of each province to thetotal Canadian agriculture and foodprocessing sector GDP varies acrossCanada.
In 2006, Ontario, Quebec, and Albertaaccounted for almost 70% of the totalCanadian agriculture and food processingGDP.
Source: Statistics Canada and AAFC calculations.
Note: Excludes beverages and tobacco processing.
The contribution of P.E.I. and N.B. is an AAFC estimate.
Chart B1.6
Provincial Contribution to Canadian Agriculture and Food Processing GDP, 2006
N.S.2.0% N.B.
2.6%Que.
17.7%
Ont.34.2%
Man.6.6%
Sask.11.5%
Alta.16.1%
B.C.7.2%
P.E.I.1.3%N.L.
0.8%
Source: Statistics Canada and AAFC calculations.
Note: Excludes beverages and tobacco processing.
The contribution of food processing in P.E.I. and N.B. is an estimate.
Chart B1.5
Primary Agriculture and Food Processing’s Contribution to Provincial GDP, 2006
0
2
4
6
8
10
12
14
N.L. P.E.I. N.S. N.B. Que. Ont. Man. Sask. Alta. B.C.
Total Provincial GDP
(%) Food Processing
Primary Agriculture
Canadian Average
The agriculture and agri-food sector is an important source of income inmost provinces

An Overview of the Canadian Agriculture and Agri-Food System 17
GD
P a
nd
Em
plo
ym
en
t
• The agriculture and agri-food systemaccounts for the largest share of provin-cial employment in Prince EdwardIsland and Saskatchewan.
In many provinces, employment in foodserviceaccounted for the largest share of total employ-ment in the agriculture and agri-food system,with the exception of Saskatchewan, whereprimary agriculture had the largest share ofprovincial employment. In P.E.I., primary agri-culture was the second most importantemployer after foodservice.
• Ontario and Quebec make up the largestshare of people employed in agricul-ture, accounting for 56% of the totalCanadian food processing sector.
Source: Statistics Canada and AAFC calculations.
Note: Excludes beverages and tobacco processing.
Chart B1.8
Provincial Contribution to Canadian Agriculture and Food Processing Sector Employment, 2006
Man.6.4%
N.B.2.7%
N.L.1.7%
N.S.2.5%
Ont.33.5%
P.E.I1.2%
Que.22.7%
Sask. 8.5%
B.C.8.9%
Alta.11.7%
Source: Statistics Canada and AAFC calculations.
Note: Provincial input & service suppliers have been excluded because of reliability and confidentiality data concerns with many of its component industries.
Agriculture and Agri-Food System's Share of Provincial Employment, 2006
Chart B1.7
0
5
10
15
20
25
N.L. P.E.I. N.S. N.B. Que. Ont. Man. Sask. Alta. B.C.
Total Provincial
Employment (%)
Foodservice
Food Retail/Wholesale
FBT Processing
Primary Agriculture
The agriculture and agri-food system is also a major employer in provincialeconomies


19
S E C T I O N B 2
I n t e r n a t i o n a l T r a d e
The success of the agriculture and agri-food sector depends on trade since Canada's domestic market isrelatively small. During the past 15 years, Canada has increased its share of world agri-food trade inresponse to trade liberalization and changing market conditions by producing increasingly processedgoods that meet changing market demands. The recent appreciation of the Canadian dollar has led tochallenges for the sector, such as declining export demand and increased competition from emergingeconomies. Nevertheless, agriculture and agri-food exports have continued to grow.

An Overview of the Canadian Agriculture and Agri-Food System20
Se
cti
on
B2
• Canada is the world’s fourth-largestagriculture and agri-food exporter, afterthe EU, the U.S. and Brazil.
Canada accounts for 5.6% of total world agri-culture and agri-food exports if the EU coun-tries are included as a trade bloc.
Canada accounts for 3.1% of total world agri-culture and agri-food exports if EU countries aretreated separately.
• The Canadian Dollar Effective ExchangeRate Index (CERI) rose 40% between2002 and 2007 before falling backpartially in 2008. Much of the overallincrease was due to the growing strength ofthe Canadian dollar against the currency of theU.S. The CERI also rose 25% against othermajor trading partner currencies, including theMexican peso, the Japanese yen and theChinese yuan, between 2002 and 2007.
The CERI is a summary measure of theCanadian dollar's movement against thecurrencies of important trading partners.
Source: Bank of Canada.
*Basket includes U.S. dollar, Euro, Japanese Yen, Chinese Yuan, Mexican Peso and British Pound.
Chart B2.2
Canadian Dollar Effective Exchange Rate Index (CERI)*
60
70
80
90
100
110
120
130
Jan-00 Jan-02 Jan-04 Jan-06 Jan-08
1992=100
With US$
Without US$
Source: Global Trade Atlas and AAFC calculations.
*Notes: 1) Excludes intra-EU trade.
2) Excludes fresh seafood.
Chart B2.1
World Agricultural and Agri-Food Export* Share by Country of Origin, 2007
EU18.4%
U.S.17.6% Brazil
8.3%
Canada5.6%
Argentina5.1%
China5.1%
Australia3.8%
Rest of World36.2%
Canada is a major player in world agri-food trade
Agriculture and agri-food exports are defined here as agriculture and processed food, beverage andtobacco products. They include processed seafood but do not include fresh seafood.
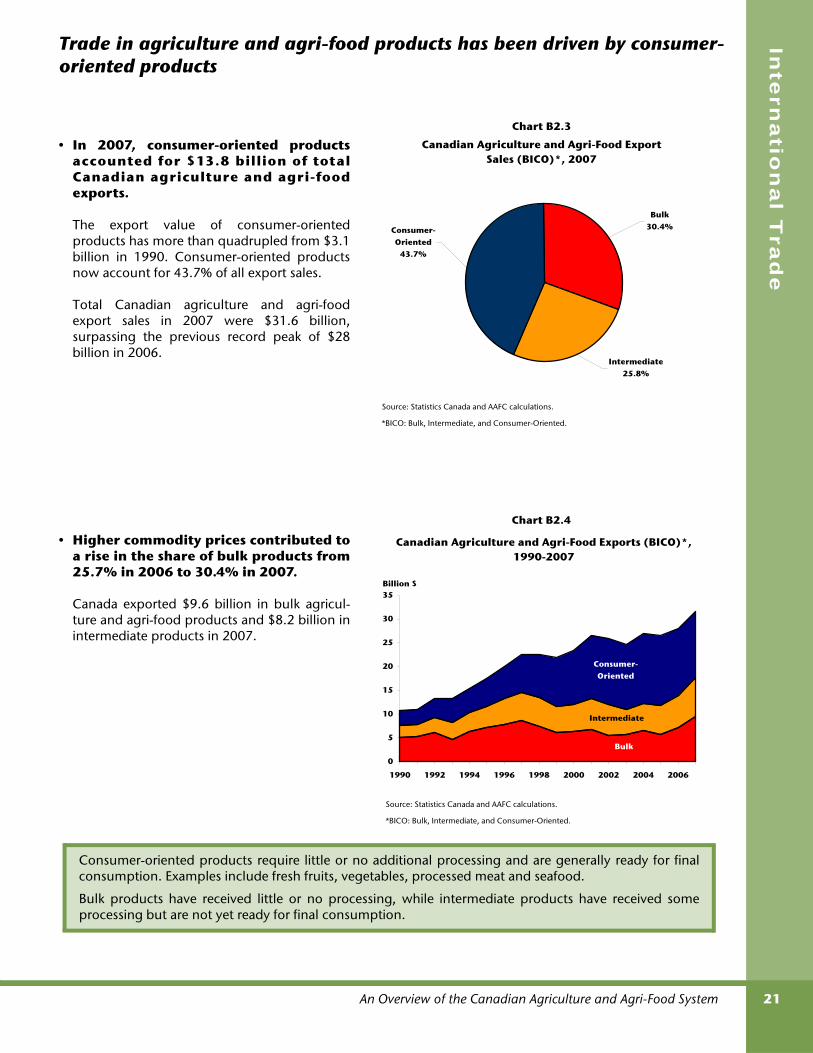
An Overview of the Canadian Agriculture and Agri-Food System 21
Inte
rna
tion
al T
rad
e
• In 2007, consumer-oriented productsaccounted for $13.8 billion of totalCanadian agriculture and agri-foodexports.
The export value of consumer-orientedproducts has more than quadrupled from $3.1billion in 1990. Consumer-oriented productsnow account for 43.7% of all export sales.
Total Canadian agriculture and agri-foodexport sales in 2007 were $31.6 billion,surpassing the previous record peak of $28billion in 2006.
• Higher commodity prices contributed toa rise in the share of bulk products from25.7% in 2006 to 30.4% in 2007.
Canada exported $9.6 billion in bulk agricul-ture and agri-food products and $8.2 billion inintermediate products in 2007.
Source: Statistics Canada and AAFC calculations.
*BICO: Bulk, Intermediate, and Consumer-Oriented.
Chart B2.4
Canadian Agriculture and Agri-Food Exports (BICO)*,1990-2007
Bulk
Intermediate
Consumer-Oriented
0
5
10
15
20
25
30
35
1990 1992 1994 1996 1998 2000 2002 2004 2006
Billion $
Source: Statistics Canada and AAFC calculations.
*BICO: Bulk, Intermediate, and Consumer-Oriented.
Chart B2.3
Canadian Agriculture and Agri-Food Export Sales (BICO)*, 2007
Bulk30.4%
Intermediate25.8%
Consumer-Oriented
43.7%
Consumer-oriented products require little or no additional processing and are generally ready for finalconsumption. Examples include fresh fruits, vegetables, processed meat and seafood.
Bulk products have received little or no processing, while intermediate products have received someprocessing but are not yet ready for final consumption.
Trade in agriculture and agri-food products has been driven by consumer-oriented products

An Overview of the Canadian Agriculture and Agri-Food System22
Se
cti
on
B2
• In 2007, the U.S. accounted for 54.9% ofCanada’s total agriculture and agri-foodexport sales in comparison to a 40%share in 1990.
However, exports to Mexico, the EU and Japanhave also increased over time.
• Canadian agriculture and agri-foodexport sales to the U.S. have nearlytripled since 1992, while those toMexico have increased sixfold.
Japan and the EU have also become importantexport destinations.
Source: Global Trade Atlas and AAFC calculations.
Chart B2.5
Destinations of Canadian Agriculture and Agri-Food Exports, 2007
U.S.54.9%
Japan8.5%
EU6.4%
Mexico4.1%
China3.2%
Rest of World22.9%
Source: Statistics Canada and AAFC calculations.
Chart B2.6
Value of Canadian Agriculture and Agri-Food Exports by Country of Destination,
1992 and 2007
0
4
8
12
16
20
U.S. Japan EU Mexico China Rest ofWorld
Billion $
1992
2007
Most of Canada's agriculture and agri-food trade is destined for the U.S.market as North American trade has become increasingly integrated

An Overview of the Canadian Agriculture and Agri-Food System 23
Inte
rna
tion
al T
rad
e
• Grains and oilseeds and their productsaccounted for 42% of the total value ofagriculture and agri-food exports in2007.
Red meats and live animals (excluding poultry)were the next largest item in terms of exportsales at 19%.
• The composition of Canadian export saleshas remained relatively constant over thepast ten years.
Red meats, fruits and vegetables, and grain andoilseed products have experienced growth inexport sales over the past decade.
Source: Global Trade Atlas and AAFC calculations.
Chart B2.7
Commodity Composition of Export Sales, 2007
All Other33.0%
Fruits & Vegetables
5.9%
Red Meats11.5%
Live Animals Excl. Poultry
7.5%
Grain & Oilseed
Products13.4%
Grains and Oilseeds28.7%
Source: Global Trade Atlas and AAFC calculations.
Commodity Composition of Export Sales, 1998 and 2007
Chart B2.8
All Other
Grains and Oilseeds
Red Meats
Fruits & Vegetables
1998 2007
Total $22.8 Billion Total $32.0 Billion
$0.9
$1.9
$2.5
$2.8
$6.9
$7.8
4.1%
34.3%
30.2%
12.1%
10.9%
8.5%5.9%
33.0%
28.7%
13.4%
7.5%
11.5%
$1.9
$2.4
$3.7
$4.3
$9.2
$10.6
Grain & Oilseed Products
Live Animals Excl. Poultry
The composition of Canada’s export sales has remained fairly constant overthe past decade

An Overview of the Canadian Agriculture and Agri-Food System24
Se
cti
on
B2
• Emerging markets accounted for 17% ofCanadian agriculture and agri-foodexport sales in 2007, up slightly fromthe 1990s.
• Canadian agriculture and agri-foodexport sales to emerging markets morethan doubled between the early 1990sand 2007.
Export sales to Mexico quadrupled between2007 and the early 1990s, and export sales toIndia increased sevenfold.
Source: Statistics Canada and AAFC calculations.
Chart B2.10
Value of Canadian Agriculture and Agri-Food Exports by Emerging Markets*,
1992-2007
0.0
0.2
0.4
0.6
0.8
1.0
1.2
1.4
Mex
ico
Ch
ina
Ind
ia
Ind
on
esia
S.K
ore
a
Ho
ng
Ko
ng
Ven
ezu
ela
Pak
ista
n
Annual Avg. (Billion $)
1992-1996
1997-2001
2002-2006
2007
Source: Statistics Canada and AAFC calculations.
Chart B2.9
Value of Canadian Agriculture and Agri-Food Exports to Emerging Markets*,
1992-2007
0
5
10
15
20
25
30
35
1992 1994 1996 1998 2000 2002 2004 2006
Billion $
Emerging Markets*
Rest of World
Trade with emerging markets is important for the sector
* Emerging markets generally include countries that have experienced rapid growth over the past decade,such as Mexico, Russia, China, India and Brazil.

An Overview of the Canadian Agriculture and Agri-Food System 25
Inte
rna
tion
al T
rad
e
• Canada is the world’s sixth-largest agri-culture and agri-food importer, after theEU, the U.S., Japan, China and Russia.
Canada accounts for 2.5% of world agricultureand agri-food imports.
• Consumer-oriented products make upthe majority of Canadian agricultureand agri-food imports, accounting for 74%of the total in 2007.
In 2007, total Canadian agriculture and agri-food import sales reached a high of $25.5billion.
Source: Statistics Canada and AAFC calculations.
*BICO: Bulk, Intermediate, and Consumer-Oriented.
Chart B2.12
Canadian Agriculture and Agri-Food Imports (BICO)*, 1990-2007
Bulk
Intermediate
Consumer-Oriented
0
5
10
15
20
25
30
1990 1992 1994 1996 1998 2000 2002 2004 2006
Billion $
Source: Global Trade Atlas and AAFC calculations.
*Notes: 1) Excludes intra-EU trade. 2) Excludes fresh seafood.
Chart B2.11
World Agricultural and Agri-Food Import* Share by Country of Origin, 2007
China7.2%
Canada4.4%
Rest of World39.9%
U.S.14.5%
Japan8.8%
EU20.4%
Russia4.7%
Canada continues to be a relatively large importer of agriculture and agri-food products

An Overview of the Canadian Agriculture and Agri-Food System26
Se
cti
on
B2
• The U.S. is Canada's main source of agri-culture and agri-food imports, account-ing for 58.8% of the total, followed by the EUwith nearly 13.9%.
About 4.8% and 2.7% of our imports comefrom Mexico and Brazil, respectively.
• Canada is importing more agricultureand agri-food products from traditionaltrading partners and emerging markets.
Emerging markets such as Brazil, Mexico andChina are becoming increasingly competitivein international markets.
Imports from Mexico, Brazil and China rose275%, 111% and 180%, respectively between1996 and 2007.
Source: Global Trade Atlas and AAFC calculations.
Chart B2.14
Value of Canadian Agriculture and Agri-Food Imports by Country of Origin,
1996 and 2007
0
2
4
6
8
10
12
14
16
U.S. Rest ofWorld
EU Mexico Brazil China
Billion $
1996
2007
Source: Global Trade Atlas and AAFC calculations.
Canadian Agriculture and Agri-Food Imports by Country of Origin, 2007
Chart B2.13
U.S. 58.8%EU 13.9%
Mexico 4.8%
Brazil 2.7%
China 2.1%
Australia 1.9%
Rest of World 15.8%
Canada continues to import agriculture and agri-food products from theU.S.

An Overview of the Canadian Agriculture and Agri-Food System 27
Inte
rna
tion
al T
rad
e
• Fruits and vegetables was the singlemost important import category in2007 with a 20.8% share of totalimports. This was down from 27% in 1998.
Alcoholic and non-alcoholic beverage importsgrew to 14.4% in 2007, up from roughly 9% in1998.
• North American Free Trade Agreement(NAFTA) accounts for roughly two-thirds of Canada’s imports.
Imports from NAFTA countries totalled $15.8billion in 2007, while imports from non-NAFTAcountries reached $9.0 billion.
Source: Global Trade Atlas and AAFC calculations.
Chart B2.16
Agricultural Imports from North America and the Rest of the World, 1996-2007
0
5
10
15
20
25
30
1996 1997 1998 1999 2000 2001 2002 2003 2004 2005 2006 2007
Billion $
Rest of World
North America
Source: Global Trade Atlas and AAFC calculations.
*Note: Includes grains and oilseeds and their products.
Commodity Composition of Import Sales, 1998 and 2007
Chart B2.15
All Other
Fruits & Vegetables
Beverages
Grain & Oilseed Products
*
PlantationCrops
Red Meats
1998 2007
Total $16.3 Billion Total $22.8 Billion
$1.0
$1.7
$1.6
$1.4
$4.4
6.1%
37.9%
27.0%
8.9%
9.7%
10.5%
6.9%
37.4%
20.8%
14.4%
8.4%
12.0%
$1.6
$1.9
$2.7
$3.3
$4.8
$8.5$6.2
The composition and the source of agriculture and agri-food imports haschanged over time

An Overview of the Canadian Agriculture and Agri-Food System28
Se
cti
on
B2
• Agriculture and agri-food exports con-tributed to 7% of total Canadian exportsales in 2007. This share is comparableto 8% in the U.S. and 6% in the EU.
Total Canadian exports were $428 billion in2007. In Brazil and Australia, agriculture andagri-food exports accounted for much largershares of total exports, at 28% and 15%,respectively.
• Agriculture and agri-food importsaccounted for 6% of Canada’s $387 bil-lion in total imports in 2007. This sharewas slightly higher than 4% for the U.S.and 5% for the EU.
In Russia and Japan, agriculture and agri-foodimports accounted for much larger shares oftotal imports, at 13% and 7%, respectively.
Source: Global Trade Atlas and AAFC calculations.
Chart B2.17
Contribution of Agriculture and Agri-Food to Total Exports, 2007
0
5
10
15
20
25
30
CanadaU.S
.EU
China
Japan
Austra
lia
Mexico
Russia
Brazil
Percent
Source: Global Trade Atlas and AAFC calculations.
Chart B2.18
Contribution of Agriculture and Agri-Food to Total Imports, 2007
0
2
4
6
8
10
12
14
CanadaU.S
.EU
China
Japan
Austra
lia
Mexico
Russia
Brazil
Percent
Canada's agriculture and agri-food trade contributes significantly toCanada's overall trade surplus

29
S E C T I O N B 3P r o d u c t i v i t y , R & D
a n d I n n o v a t i o n
Innovation is key to the agriculture and agri-food system’s productivity growth and long-termprosperity. Innovation improves the manner in which capital and labour inputs are combined, resultingin more efficient and effective production. Innovation has been taking place in the food, beverage andtobacco processing industry, but has been challenged by impediments in developing new products andprocesses, as well as in commercializing.

An Overview of the Canadian Agriculture and Agri-Food System30
Se
cti
on
B3
• Average annual productivity growth inprimary agriculture has been high inboth Canada and the United States. How-ever, Canadian agricultural productivitygrowth has been consistently lower than thatin the U.S. Over the 17 years between 1988and 2004, the average annual productivitygrowth rate in Canada was 1.2%, while in theU.S. it was 2.0%.
Average annual productivity growth rates inCanada decreased from 1.5% in 1988-1996 to0.9% in 1997-2004. In the U.S., average annualproductivity growth rates were comparable inthe two periods.
• Productivity growth in food processinghas been low relative to total manufac-turing, but increased in recent years.
Between 1988 and 2004, the average annualproductivity growth rate for food processingwas 0.1%, compared with a growth rate ofabout 0.4% for total manufacturing.
Growth rates differed between sub-periods: forfood processing, annual productivity growthwas -0.1%, on average, between 1988 and1996. The average annual growth rateincreased to 0.4% between 1997 and 2004.This led to an improved productivityperformance relative to total manufacturing.
Source: Statistics Canada and U.S. Dept. of Agriculture (Economic Research Service). Note: This data is geometric mean growth rates, calculated with a gross output measure of total factor productivity growth.
Chart B3.1
Comparison of Total Factor Productivity Growth in Primary Agriculture: Canada vs. the U.S., 1988-2004
0.0
0.5
1.0
1.5
2.0
2.5
1988-2004 1988-1996 1997-2004
All-period Average Sub-period Average Sub-period Average
Percent
Canada U.S.
Source: Statistics Canada. Note: This data is geometric mean growth rates, calculated with a gross output measure of total factor productivity growth.
Productivity Growth in Canadian Food Processing and Total Manufacturing, 1988-2004
Chart B3.2
-0.3
0.0
0.3
0.5
0.8
1988-2004 1988-1996 1997-2004
All-period Average Sub-period Average Sub-period Average
Percent Food
Total Manufacturing
Productivity growth has slowed in recent years in the Canadian agriculturesector

An Overview of the Canadian Agriculture and Agri-Food System 31
Pro
du
ctiv
ity, R
&D
an
d In
no
va
tion
• Since the late 1980s, productivitygrowth in the Canadian FBT sector hasbeen higher than that in the U.S. Produc-tivity growth in the U.S. was negative between1988 and 2004, averaging -0.34% annually. InCanada, the average productivity growth ratewas low, but positive, with growth at anaverage of 0.15% per year.
When viewed in terms of the two sub-periods,it can be seen that over time, the Canadianproductivity growth rate improved, while in theU.S., the growth rate declined. In Canada, theincrease in the productivity growth ratebetween 1988 and 1996 came about largelyfrom productivity growth in the beverage andtobacco industries; growth between 1997 and2004 was largely due to changes in the foodindustry.
Source: Statistics Canada, U.S. Bureau of Labor Statistics.
Note: This data is geometric mean growth rates, calculated with a gross output measure of total factor productivity growth. Data for Canada are computed aggregates.
Chart B3.3
Productivity Growth in the FBT Industries, Canada and the U.S., 1988-2004
-0.8
-0.5
-0.3
0.0
0.3
0.5
0.8
1988-2004 1988-1996 1997-2004
All-period Average Sub-period Average Sub-period Average
Percent
Canada
U.S.
Productivity growth has increased in recent years in Canadian FBTprocessing
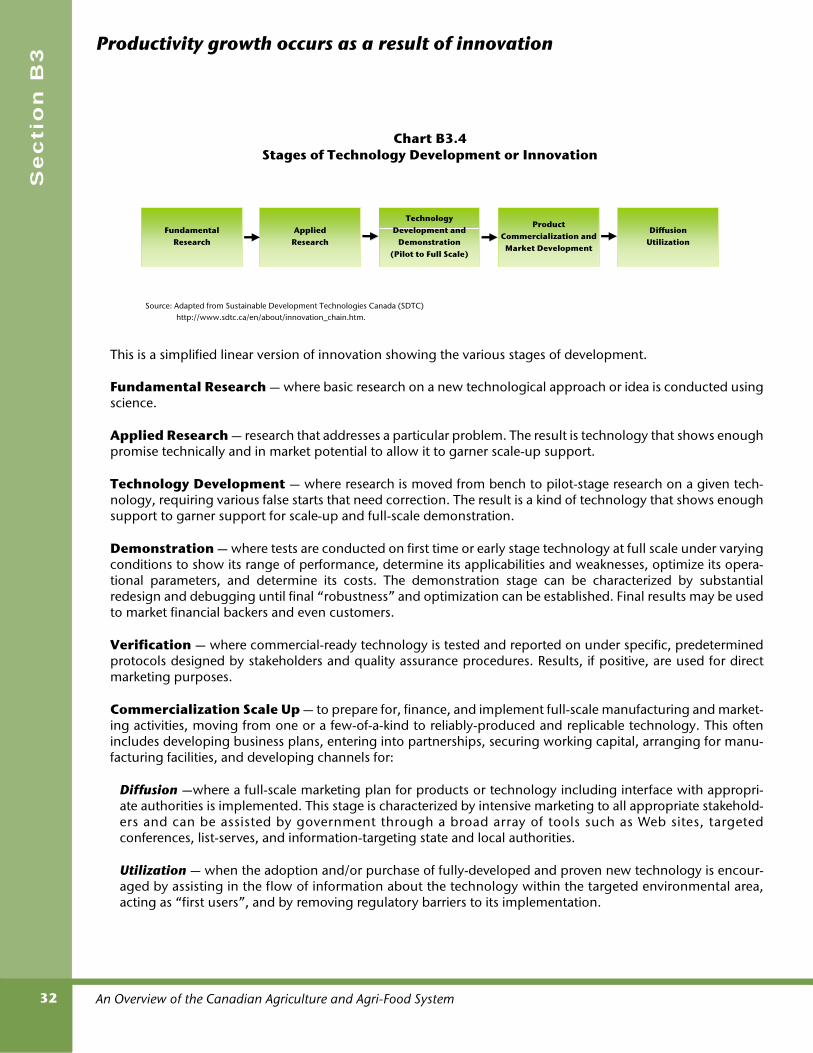
An Overview of the Canadian Agriculture and Agri-Food System32
Se
cti
on
B3
This is a simplified linear version of innovation showing the various stages of development.
Fundamental Research — where basic research on a new technological approach or idea is conducted usingscience.
Applied Research — research that addresses a particular problem. The result is technology that shows enoughpromise technically and in market potential to allow it to garner scale-up support.
Technology Development — where research is moved from bench to pilot-stage research on a given tech-nology, requiring various false starts that need correction. The result is a kind of technology that shows enoughsupport to garner support for scale-up and full-scale demonstration.
Demonstration — where tests are conducted on first time or early stage technology at full scale under varyingconditions to show its range of performance, determine its applicabilities and weaknesses, optimize its opera-tional parameters, and determine its costs. The demonstration stage can be characterized by substantialredesign and debugging until final “robustness” and optimization can be established. Final results may be usedto market financial backers and even customers.
Verification — where commercial-ready technology is tested and reported on under specific, predeterminedprotocols designed by stakeholders and quality assurance procedures. Results, if positive, are used for directmarketing purposes.
Commercialization Scale Up — to prepare for, finance, and implement full-scale manufacturing and market-ing activities, moving from one or a few-of-a-kind to reliably-produced and replicable technology. This oftenincludes developing business plans, entering into partnerships, securing working capital, arranging for manu-facturing facilities, and developing channels for:
Diffusion —where a full-scale marketing plan for products or technology including interface with appropri-ate authorities is implemented. This stage is characterized by intensive marketing to all appropriate stakehold-ers and can be assisted by government through a broad array of tools such as Web sites, targetedconferences, list-serves, and information-targeting state and local authorities.
Utilization — when the adoption and/or purchase of fully-developed and proven new technology is encour-aged by assisting in the flow of information about the technology within the targeted environmental area,acting as “first users”, and by removing regulatory barriers to its implementation.
Chart B3.4Stages of Technology Development or Innovation
FundamentalResearch
AppliedResearch
Technology Development and
Demonstration(Pilot to Full Scale)
Product Commercialization and
Market Development
DiffusionUtilization
Source: Adapted from Sustainable Development Technologies Canada (SDTC) http://www.sdtc.ca/en/about/innovation_chain.htm.
Productivity growth occurs as a result of innovation
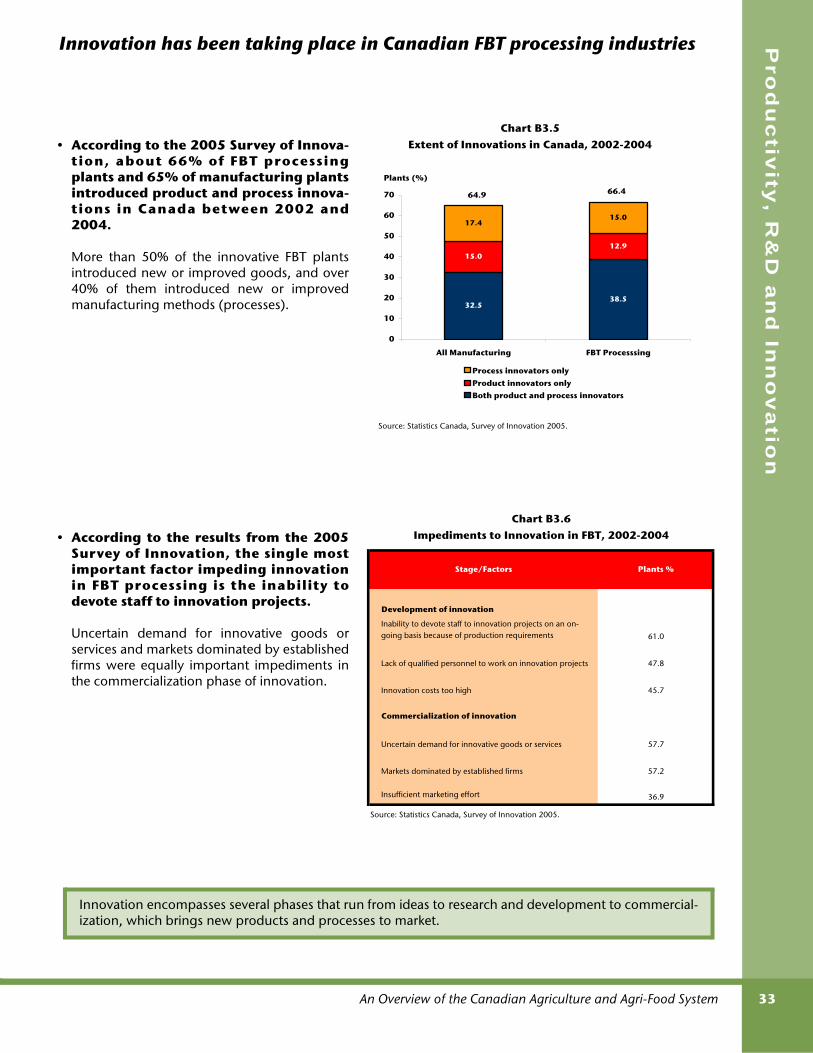
An Overview of the Canadian Agriculture and Agri-Food System 33
Pro
du
ctiv
ity, R
&D
an
d In
no
va
tion
• According to the 2005 Survey of Innova-tion, about 66% of FBT processingplants and 65% of manufacturing plantsintroduced product and process innova-tions in Canada between 2002 and2004.
More than 50% of the innovative FBT plantsintroduced new or improved goods, and over40% of them introduced new or improvedmanufacturing methods (processes).
• According to the results from the 2005Survey of Innovation, the single mostimportant factor impeding innovationin FBT processing is the inability todevote staff to innovation projects.
Uncertain demand for innovative goods orservices and markets dominated by establishedfirms were equally important impediments inthe commercialization phase of innovation.
Development of innovation
Inability to devote staff to innovation projects on an on-going basis because of production requirements 61.0
Lack of qualified personnel to work on innovation projects 47.8
Innovation costs too high 45.7
Commercialization of innovation
Uncertain demand for innovative goods or services 57.7
Markets dominated by established firms 57.2
Insufficient marketing effort 36.9
Source: Statistics Canada, Survey of Innovation 2005.
Stage/Factors Plants %
Chart B3.6Impediments to Innovation in FBT, 2002-2004
Source: Statistics Canada, Survey of Innovation 2005.
Chart B3.5Extent of Innovations in Canada, 2002-2004
32.538.5
12.915.0
17.415.0
0
10
20
30
40
50
60
70
All Manufacturing FBT Processsing
Plants (%)
Process innovators only Product innovators only Both product and process innovators
64.9 66.4
Innovation encompasses several phases that run from ideas to research and development to commercial-ization, which brings new products and processes to market.
Innovation has been taking place in Canadian FBT processing industries
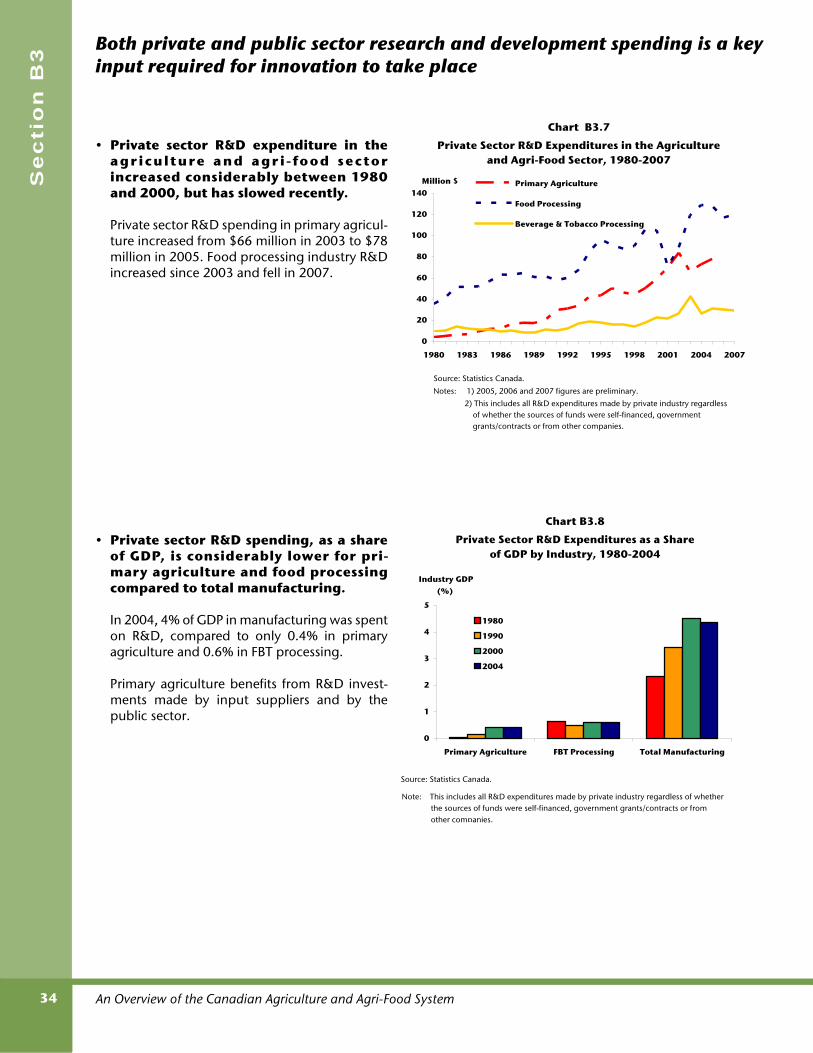
An Overview of the Canadian Agriculture and Agri-Food System34
Se
cti
on
B3
• Private sector R&D expenditure in theagriculture and agr i - food sectorincreased considerably between 1980and 2000, but has slowed recently.
Private sector R&D spending in primary agricul-ture increased from $66 million in 2003 to $78million in 2005. Food processing industry R&Dincreased since 2003 and fell in 2007.
• Private sector R&D spending, as a shareof GDP, is considerably lower for pri-mary agriculture and food processingcompared to total manufacturing.
In 2004, 4% of GDP in manufacturing was spenton R&D, compared to only 0.4% in primaryagriculture and 0.6% in FBT processing.
Primary agriculture benefits from R&D invest-ments made by input suppliers and by thepublic sector.
Source: Statistics Canada.
Chart B3.8
Private Sector R&D Expenditures as a Share of GDP by Industry, 1980-2004
Note: This includes all R&D expenditures made by private industry regardless of whether the sources of funds were self-financed, government grants/contracts or from other companies.
0
1
2
3
4
5
Primary Agriculture FBT Processing Total Manufacturing
1980
1990
2000
2004
Industry GDP (%)
Note: This includes all R&D expenditures made by private industry regardless of whether the sources of funds were self-financed, government grants/contracts or from other companies.
Source: Statistics Canada.
Notes: 1) 2005, 2006 and 2007 figures are preliminary.
2) This includes all R&D expenditures made by private industry regardless of whether the sources of funds were self-financed, government grants/contracts or from other companies.
Chart B3.7
Private Sector R&D Expenditures in the Agriculture and Agri-Food Sector, 1980-2007
0
20
40
60
80
100
120
140
1980 1983 1986 1989 1992 1995 1998 2001 2004 2007
Million $ Primary Agriculture
Food Processing
Beverage & Tobacco Processing
Both private and public sector research and development spending is a keyinput required for innovation to take place

An Overview of the Canadian Agriculture and Agri-Food System 35
Pro
du
ctiv
ity, R
&D
an
d In
no
va
tion
• Approximately 80% of federal researchexpenditures in support of the agri-foodsector is allocated to support the opera-tions of research branches and federalresearch centres.
In Canada, a large part of publicly-fundedresearch is carried out by the federalgovernment, including giving grants andcontributions to universities and privateindustry to carry out research.
\
• Over the last three fiscal years, at theprovincial level, program expenditureswere the most impor tant researchexpenditure.
Approximately three-quarters of provincialresearch expenditures are allocated to grantsand contributions provided to universities andscientific organizations for technological devel-opment in the agricultural sector.
Source: AAFC, Farm Income, Financial Conditions and Government Assistance Data Book.
Chart B3.9
Federal Research Expenditures in Support of the Agriculture and Agri-Food Sector,2005-06 to 2007-08 Fiscal Years
0
20
40
60
80
100
2005 - 06 2006 - 07 2007 - 08
Total (%)
Program
Capital
Operating
Source: AAFC, Farm Income, Financial Conditions and Government Assistance Data Book.
Chart B3.10
Provincial Research Expenditures in Support of theAgriculture and Agri-Food Sector, 2005-06 to 2007-08 Fiscal Years
0
30
60
90
2005 - 06 2006 - 07 2007 - 08
Total (%)
Program
Capital
Operating
Public R&D spending in agriculture and agri-food occurs at both the federaland provincial government levels

An Overview of the Canadian Agriculture and Agri-Food System36
Se
cti
on
B3
• Canada's public R&D spending in theag riculture and ag ri - food sectordeclined from 1.6% in 1986-1995 to1.3% in 1996-2005 and 1.1% in 2007.
In 2007, public sector R&D, as a share of grossfarm receipts, was lower in Canada than inAustralia, but higher than in the U.S. The aver-age share in Australia jumped from 0.7% in the1986-95 period to 1.2% in 1996-2005 and1.4% in 2007. In the U.S., this share hasremained in the 0.7% range over the pasttwenty years.
• Since the early 1990s, there has been alarge contraction in support for publicagricultural R&D spending among high-income developed countries, in particu-lar, but less so in emerging countries.
Growth rates in public R&D spending arenowhere near those of the 1970s, whenincreased public R&D led to the Green Revolu-tion in Asia and Latin America.
Source: OECD, Agricultural Policies in OECD Countries: At a Glance, 2008.
Chart B3.11
Public R&D Support to the Agriculture and Agri-Food Sector, 1986-2007
0.0
0.2
0.4
0.6
0.8
1.0
1.2
1.4
1.6
1.8
1986-1995 1996-2005 2006 2007
Gross Farm Receipts (%)
Canada
Australia
U.S.
Source: Pardey, Beintema, Dehmer, and Wood (2006).
Chart B3.12
Total Public Agricultural Research Expenditures by Region
-10
0
10
20
30
40
50
60
70
Asia-Pacific LatinAmerica &
theCaribbean
Sub-SaharanAfrica
DevelopingCountries
High-IncomeCountries
Growth Rate (%)
1981-91
1991-2000
Public R&D expenditures in agriculture have been declining in Canada andother countries around the world

An Overview of the Canadian Agriculture and Agri-Food System 37
Pro
du
ctiv
ity, R
&D
an
d In
no
va
tion
• Canada, like other countries, has experi-enced high rates of return to publicly-funded R&D on large acreage cropswhere incremental improvements aremagnified over a vast cropping area.
These high rates of return indicate that more re-sources could be profitably devoted to agricul-tural research.
• Genetic improvements, brought aboutby plant breeding, improved yields ofwestern bread wheats by 16% between1972 and 2007.
Source: Adapted from Galushko and Gray, 2008 and Statistics Canada.
Chart B3.14
Wheat Yield Increases Due to Genetic Improvements, 1972-2006
1.60
1.65
1.70
1.75
1.80
1.85
1.90
1.95
2.00
1972 1976 1980 1984 1988 1992 1996 2000 2004
Thousand of $/Hectare
Benefit-Cost Ratio
Rate of Return
Wheat (Galushko and Gray. 2008)
14.83 43-53%*
Barley (Scott et al. 2005)
4.12 36.8%*
Pulses (Gray and Scott. 2003)*
- - - 20.4%*
Canola (Boyd, Goddard, and Benkie. 2008)
6.65 - - -
Source: Various.
Notes: 1) *Calculated jointly with producer check-off and public sector R&D funding for
genetics/breeding. 2) Estimates vary depending on the timeframe and market information used.
Rates of Return to Canadian Public R&D in Agriculture
Chart B3.13
Yield increases attributable-to-genetic improvements were calculated using the average weighted breadyield index (Galuschko and Gray, 2008). This index isolates the impact of breeding on wheat yields of thePrairies. The index takes into account the share of wheat types (classes).
Rates of return on publicly-funded agricultural research have consistentlybeen high in Canada, particularly in the area of crops

An Overview of the Canadian Agriculture and Agri-Food System38
Se
cti
on
B3
• The Bioproducts industry has beengrowing. According to the 2006 BioproductsDevelopment Survey, 239 firms reported bio-product activities in Canada.
These firms generated $1.7 billion in revenues,$828 million in exports, invested $90 million inR&D and employed 3,900 people.
Bioproduct firms in Quebec and Ontario gener-ated the highest revenues.
• Like many newly-emerging industries,the bioproducts industry is character-ized by a high proportion of small andmedium-sized firms. Over 80 percent off irms in the industry are small (less than50 employees).
The industry's twenty largest firms account forsixty percent of the bioproducts industryrevenues (averaging $53M per firm).
Source: Statistics Canada, Bioproducts Development and Production Survey 2006.
Chart B3.16
Number and Average Revenue of Firms in the Bioproducts Industry by Size,
2003 and 2006
154
40 38
199
20 20
Small F irms Med ium Firms Large Firms
2003
2006
Employees: < 50 Emp loyees: 51-149 Emp loyees: >150
2006 Average Bioproduct Rev enue
$1.8
$16.3
$53.3
Million $
Small
Med ium
Large
Source: Statistics Canada, Bioproducts Development and Production Survey 2006.
Chart B3.15
Revenues from Bioproducts by Region,2005 and 2006
616
506
256
320
580 565
254
359
0
100
200
300
400
500
600
700
Quebec Ontario B.C. Prairies &Atlantic
Million $
2005 2006
Canada
1,758
1,698 2005
2006
Bioproducts are products (other than food, feed, or medicine) made from renewable biological inputs(often referred to as biomass). The term includes new bio-based products as well as those traditionalproducts which have been adapted to replace non-renewable inputs. Conventionally-made industrialproducts (such as lumber) are excluded. The term biomass refers to materials sourced from forestry, ag-ricultural (plant, livestock products or by-products) marine, and aquaculture materials, as well as fromindustrial and municipal wastes.
The bioproducts industry is an example of an industry that has experienced growth dueto innovation

An Overview of the Canadian Agriculture and Agri-Food System 39
Pro
du
ctiv
ity, R
&D
an
d In
no
va
tion
• The bioproducts industry has shiftedwestward. By the end of 2006, WesternCanada was home to 48% of the indus-try's firms compared to 40% in 2003.
• Bioproduct firms reported activity in awide range of markets including biofu-els, chemicals, plastics and composites,fibreboard, biocontrol agents (pesti-cides, fungicides, herbicides) and bio-catalysts. Smaller firms are more diversifiedwhile larger firms are specialized.
Source: Statistics Canada, Bioproducts Development and Production Survey 2006.
Chart B3.18
Bioproduct Activity Reported by Firms, 2006
10
23
43
11
36
4
9
4
86
4
5
6
5
9
4
32
4
3
3
Liquid
Gaseous
Solid
Biochemicals
Bioplastics
Biocontrol agents
Fibre composites
Fibreboard/agri-
fibre panels
Biocatalysts
Other
Number of Firms Reporting Activity
Small
Medium
Large
Bio
fuel
s
Source: Statistics Canada, Bioproducts Development and Production Survey 2006.
Chart B3.17Number of Firms Reporting Bioproduct
Activity, 2003-2006
14.3
65.8
52.158.5
47.8
15
72
5354
38
2006
2003
BCPrairies
Ontario
Quebec
Atlantic
The bioproducts industry can be found in all provinces and spans manyestablished industries


41
S E C T I O N CC o m p o n e n t s
o f t h e A g r i c u l t u r ea n d A g r i - F o o d S y s t e m


43
S E C T I O N C 1C o n s u m e r s
Canadian consumers are typical of consumers in developed economies. On average they have high standards of living and allocate a relatively small percentage of their total personal disposable income to food. In fact for the average Canadian, the food expenditure share is declining due to weak food price inflation.
Canadian consumers are typical of consumers in developed economies. On average, they allocate arelatively small percentage of their total personal disposable income to food. In fact, for the averageCanadian, the food expenditure share is declining.
As incomes increase, consumers are able to look beyond staple foods to product attributes that reflecttheir divergent preferences and values. In response to consumer demands, the food industry is offeringa variety of products which embody not only consumer preferences for convenience and health, but alsothe methods of production such as those which address environmental, fair trade and animal welfareissues.

An Overview of the Canadian Agriculture and Agri-Food System44
Se
cti
on
C1
• Food, beverage and tobacco (FBT)expenditures represent the secondlargest consumer goods expenditurecategory.
In 2007, Canadians spent $106 billion (or26.5% of their total personal expenditureson consumer goods) on FBT productspurchased from stores.
• Foodservice is the third-largestconsumer ser vice e xpenditurecategory.
In 2007, Canadians spent $50 billion onfoodservice, accounting for 11% of personalexpenditures on consumer services inCanada.
Together, food expenditures at retail andfoodservice establishments ($156 billion),accounted for 18% of personal expenditureson consumer goods and services.
Source: Statistics Canada.
Chart C1.1
Distribution of Personal Expenditure on Goods, 2007
Clothing &
Footwear
8.8%
Other
5.7%
Recreation &
Entertainment
11.4%
Household Goods
14.6%
Food, Beverage &
Tobacco
26.5%
Transportation &
Communications
32.9%
Source: Statistics Canada.
Chart C1.2
Distribution of Personal Expenditure on Services, 2007
Recreational Service7.7%
Health Service6.6%
Foodservice11.3%
Financial & Legal Services13.7%
Other17.8%
Shelter & Energy43.0%
Canadians spend over $150 billion each year on food from stores andrestaurants

An Overview of the Canadian Agriculture and Agri-Food System 45
Co
ns
um
ers
• Real personal disposable income perperson continues to grow in Canada,reaching $30,063 in 2007.
• In 2006, the lowest income Canadianhouseholds (first quintile) received only4% of gross personal income while thehighest income Canadian households(fifth quintile) received 46%.
• In 2006, the lowest income Canadians(first quintile) allocated 15.6% of theirhousehold expenditures to food atretail. This was the largest share amongall income quintiles.
The highest income Canadians (fifth quintile)allocated only 8% of their expenditures to foodat retail.
Source: Statistics Canada and AAFC calculations.*Quintile: Households are ranked in ascending order by total household income and are then divided into five equal groups. The 1st quintile is the lowest 20% of households and the 5th quintile is the highest 20% of households.
Chart C1.5
Share of Household Food Expenditures by Income Quintile*, 2006
0
4
8
12
16
20
First Quintile SecondQuintile
Third Quintile FourthQuintile
Fifth Quintile
$22,600 $40,600 $62,700 $96,500 >$96,500
Percent
Upper Limit on Quintile
Source: Statistics Canada and AAFC calculations.
Chart C1.3
Real Per Capita Personal Disposable Income, 1981-2007
0
5,000
10,000
15,000
20,000
25,000
30,000
35,000
1981 1985 1989 1993 1997 2001 2005
Chained 2002 $
Source: Statistics Canada and AAFC calculations.
Chart C1.4
Distribution of Gross Household Income by Quintile*, 2006
*Quintile: Households are ranked in ascending order by total household income and are divided into five equal groups. The 1st quintile is the lowest 20% of income and the 5th quintile is the highest 20% of income.
*Quintile: Households are ranked in ascending order by total household income and are divided into five equal groups. The 1st quintile is the lowest 20% of households and the 5th quintile is the highest 20% of households.
Third Quintile 15.6%
Second Quintile
9.7%
Fourth Quintile 23.7%
First Quintile4.1%
Fifth Quintile46.8%
This is made possible by rising personal disposable income

An Overview of the Canadian Agriculture and Agri-Food System46
Se
cti
on
C1
• Total real personal expenditures on foodfro m store s a nd fro m re st a ura ntscontinued to rise in Canada in 2007 to$68 billion and $35 billion, respectively.On a per capita basis, food expenditures rose to$3,183 per person annually with 36% beingspent on restaurant meals.
• Although average real personal foodexpenditure per person has increased,its share of total personal expenditurehas been declining for the past 26 years.
Canadians allocated only 13% of their totalspending to food in 2007, down from 17% in1981. Consumers are spending a greater shareof their expenditures on other goods andservices such as housing, computers andelectronic equipment.
Source: Statistics Canada and AAFC calculations.
Chart C1.6
Personal Expenditures on Food,1981-2007
0
10
20
30
40
50
60
70
1981 1986 1991 1996 2001 2006
Food Purchased from Stores
Food Purchased from Restaurants
Billion Chained 2002 $
Source: Statistics Canada and AAFC calculations.
Average Personal Expenditures on Food as a Share of Total Personal Expenditures,
1981-2007
Chart C1.7
0
5
10
15
20
25
30
1981 1986 1991 1996 2001 2006
0
500
1,000
1,500
2,000
2,500
3,000
3,500
Food Purchased from Restaurants
Food Purchased from Stores
Avg. Personal Expenditure on Food
Avg. Personal Expenditure
(Chained 2002 $/Person)
Total Personal Expenditures
(%)
The share Canadians allocate towards restaurant meals continued to growin 2007

An Overview of the Canadian Agriculture and Agri-Food System 47
Co
ns
um
ers
• Almost 75% of all Canadians’ meals aresourced from retail stores.
Commercial foodservice accounts for around10% of all meals.
• The average Canadian visited arestaurant 184 times in 2007, downfrom 192 visits in 2006. The majority(60%) were visits to quick-ser vicerestaurants.
Residents of British Columbia, Alberta, PrinceEdward Island and Ontario spent a larger thanaverage share of their personal foodexpenditures on restaurant meals thanresidents of other provinces.
Differences in provincial sales tax (PST) do notexplain these differences as restaurant mealsunder $4.00 are only exempt from PST inAlberta, Saskatchewan and Ontario.
% of Meals
In-Home–From Retail 67
At a Restaurant 8
Skipped Meals 8
Carried From Home 8
All Other Away-From-Home 7
In-Home–From Restaurants 2
Source: Canadian Restaurant and Foodservices Association.
(Sourced from National Eating Trends Canada, NPD Group
Canada Inc.)
Chart C1.8
Where Canadians Source Their Meals, 2007
Meal Type
Source: Statistics Canada and AAFC calculations.
Note: Food purchased from stores includes board paid to private households.
Chart C1.9Average Household Spending on Food by Province, 2006
0
2
4
6
8
10
N.L. P.E.I. N.S. N.B. Que. Ont. Man. Sask. Alta. B.C. Canada
Thousand $
Food Purchased from Restaurants
Food Purchased from Stores
However, the largest share of food spending is still spent on food from stores

An Overview of the Canadian Agriculture and Agri-Food System48
Se
cti
on
C1
• Canadian consumers report that theyare concerned with how fruits andvegetables are processed, if pesticidesare used or if the produce is fresh.
• Canadian consumers report that theyare more concerned with freshness,worker sanitation and hormone usewhen buying red meat and poultry.
Source: Canadian Federation of Agriculture (CFA) and Meyers Noris Penny,
Canadian Label Project: Branding Canada at Home.
Chart C1.11
Percentage of Respondants Reporting Specific Concerns When Buying Red Meat
and Poultry, Canada, 2007
0
10
20
30
40
50
60
70
80
90
Freshness Sanitation Hormone
Use
Antibiotic Diet of
Animal
Animal
Welfare
Origin
PercentSomewhat Worried
Very Worried
Source: Canadian Federation of Agriculture (CFA) and Meyers Noris Penny, Canadian Label Project: Branding Canada at Home.
Chart C1.10
Percentage of Respondants Reporting Specific Concerns When Buying Produce,
Canada, 2007
0
10
20
30
40
50
60
70
80
90
Freshness Pesticide Use Worker Hygene Origin
Concerns
Percent
Somewhat Worried
Very Worried
Issues related to food safety and quality, hormone and pesticide use, fresh-ness and sanitation are important to Canadian consumers when buying foodproducts

49
S E C T I O N C 2Food Distribution
( R e t a i l / W h o l e s a l e a n d F o o d s e r v i c e )
Food retail and foodservice are major components of Canada's agriculture and agri-food system. Foodretailers are responding to a changing marketplace and changing players (e.g. Wal-Mart) byrestructuring to maintain and increase their market share, resulting in increased concentration.Foodservice establishments also continue to adjust product/service offerings to increase sales inresponse to competition from food retailers who are offering consumers convenience with an increasingvariety of prepared food and take-home meals.
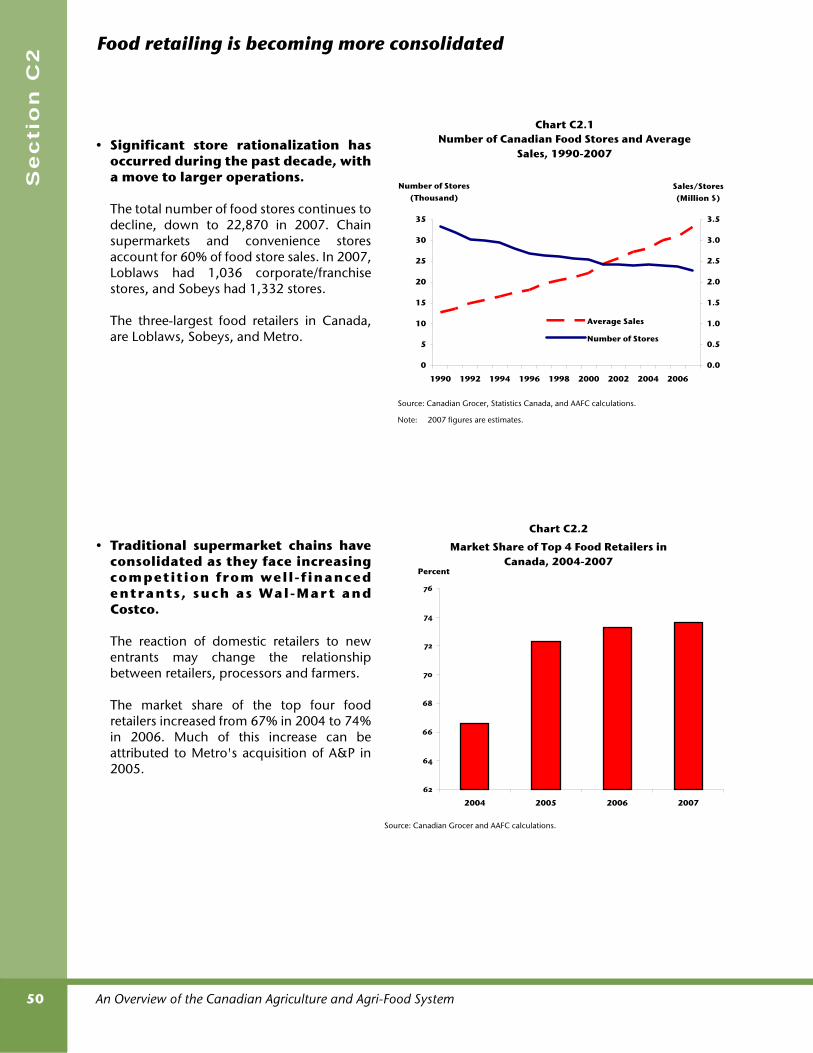
An Overview of the Canadian Agriculture and Agri-Food System50
Se
cti
on
C2
• Significant store rationalization hasoccurred during the past decade, witha move to larger operations.
The total number of food stores continues todecline, down to 22,870 in 2007. Chainsupermarkets and convenience storesaccount for 60% of food store sales. In 2007,Loblaws had 1,036 corporate/franchisestores, and Sobeys had 1,332 stores.
The three-largest food retailers in Canada,are Loblaws, Sobeys, and Metro.
• Traditional supermarket chains haveconsolidated as they face increasingcompetition from well-f inancedentrants, such as Wal-Mar t andCostco.
The reaction of domestic retailers to newentrants may change the relationshipbetween retailers, processors and farmers.
The market share of the top four foodretailers increased from 67% in 2004 to 74%in 2006. Much of this increase can beattributed to Metro's acquisition of A&P in2005.
Source: Canadian Grocer, Statistics Canada, and AAFC calculations.
Note: 2007 figures are estimates.
Chart C2.1Number of Canadian Food Stores and Average
Sales, 1990-2007
0
5
10
15
20
25
30
35
1990 1992 1994 1996 1998 2000 2002 2004 2006
0.0
0.5
1.0
1.5
2.0
2.5
3.0
3.5
Average Sales
Number of Stores
Sales/Stores (Million $)
Number of Stores (Thousand)
Source: Canadian Grocer and AAFC calculations.
Chart C2.2
Market Share of Top 4 Food Retailers in Canada, 2004-2007
62
64
66
68
70
72
74
76
2004 2005 2006 2007
Percent
Food retailing is becoming more consolidated

An Overview of the Canadian Agriculture and Agri-Food System 51
Fo
od
Dis
tribu
tion
(Re
tail/W
ho
les
ale
an
d F
oo
ds
erv
ice
)
• Canadian food and beverage retailershave seen their profit margins fall belowthose of non-food retailers.
Food and beverage retailers' profit marginshover around 3% annually. In the early 2000s,food and beverage retailers had higher profitmargins than non-food retailers, however since2005, non-food retailers’ profit margins havesurpassed those of food and beverage retailers.
Source: Statistics Canada, Quarterly Financial Statistics for Enterprises.Note: *See Glossary for definition of the profit margin ratio and non-financial industries. Does not include government-controlled co-operatives, for example LCBO, SAQ.
Chart C2.3
Average Profit Margin Ratio for Food and Beverage Retailers, 1999-2007
0
1
2
3
4
5
1999 2000 2001 2002 2003 2004 2005 2006 2007
Profit Margin Ratio (%)
All Retail Trade
Food & Beverage Retail Trade
Canadian food and beverage retailers are experiencing declining profitmargins

An Overview of the Canadian Agriculture and Agri-Food System52
Se
cti
on
C2
• Department stores, drug stores andgas stations are increasingly sellingfood items, while traditional foodretailers/wholesalers have expandedtheir non-food selections.
Within general merchandise stores, sales offood and beverages were the fastestgrowing sales category in 2007, growing by11% since 2006. For the first time, food andbeverage became the largest sales categoryfor general merchandise stores.
General merchandisers now account for10.1% of the food and beverage market, upfrom 7.4% in 1998.
• Private label products account for asignificant share (21%) of grocerysales, and food retailers continue tofocus on the development of privatelabel products to attract and retaincustomers.
Development of private label productsremains a key competitive strategy for largefood retailers. For example, Loblaws’ privatelabel sales, such as President’s Choice,currently account for 24% of Loblaws’ sales.Sobeys’ private label brand, Complimentswas launched in 2005, and now includesapproximately 4,800 Compliments products.
Food and Beverage Stores
General Merchandise Stores
Gas Stations and Automotive Dealers
Drug Stores
Other
Source: Statistics Canada, Quarterly Retail Commodity Survey, Special Tabulation.
0.3
10.1
2.6
1.6
Chart C2.4
Food and Beverage Sales by Food Retail Channel, 2007
%
85.4
Retail Channel
Source: A.C. Nielsen.
Chart C2.5
Private Label Share of Grocery Sales in Canada, 1999-2007
0
5
10
15
20
25
30
1999 2001 2003 2005 2007
Retail Sales (%)
Lines between food retail and non-food retail, food wholesale and foodprocessing are becoming blurred

An Overview of the Canadian Agriculture and Agri-Food System 53
Fo
od
Dis
tribu
tion
(Re
tail/W
ho
les
ale
an
d F
oo
ds
erv
ice
)
• Commercial foodservice sales haveincreased by 45% during the lastdecade, whi le the number ofestablishments has stabilized, growingby only 5%.
Commercial foodservice sales were valued at$46.6 billion in 2007, representing a 3%increase since 2006.
In 2007, there were around 79,000 commercialfoodservice establishments in Canada, of which39% were in Ontario and 23% in Quebec.
• Commercial restaurant bankruptciesfell by 3% in 2007 compared to 2006.
The number of bankruptcies has declinedconsiderably and fairly consistently throughoutthe last decade or so, from a high of 1,933 in1996 to 683 in 2007.
Source: Canadian Restaurant and Foodservices Association, Quarterly InfoStats.
Chart C2.7
Commercial Restaurant Bankruptcies,1991-2007
0
500
1,000
1,500
2,000
2,500
1991 1993 1995 1997 1999 2001 2003 2005 2007
Number of Bankruptcies
Source: Statistics Canada.
Chart C2.6Commercial Foodservice Sales and Number of
Establishments, 1998-2007
0
10
20
30
40
50
1998 2001 2004 2007
0
15
30
45
60
75
90
Sales
Establishments
Foodservice Sales
(Billion $)
Number ofCommercial
Establishments(Thousand)
Foodservice sales continue to grow and bankruptcies are down

An Overview of the Canadian Agriculture and Agri-Food System54
Se
cti
on
C2
• Consolidation has been occurring infoodservice as well.
• When Canadians eat out, they tend toprefer more to less service. More thanone-third of sales in commercial foodserviceoccurs at full-service restaurants.
Non-commercial foodservice sales grew by5% in 2007, faster than the commercialsegment, which grew by 3%.
Total foodservice sales (i.e., commercial andnon-com merc ia l foodserv i ce ) wereestimated at $57.5 billion in 2007.
Source: Canadian Restaurant and Foodservices Association.
Top 50 Foodservice Companies' Share of Commercial Foodservice Sales, 1998-2004
Chart C2.8
0
10
20
30
40
50
60
1998 1999 2000 2001 2002 2003 2004
Percent
%
Commercial Foodservice 79
Full-Service Restaurants 36
Limited-Service Restaurants 32
Contract and Social Caterers 7
Pubs, Taverns and Nightclubs 4
Total Non-Commercial Foodservice 21
Accommodation Foodservice 9
Institutional Foodservice 6
Retail Foodservice 2
Other Foodservice 4
Source: Canadian Restaurant and Foodservices Association and AAFC calculations.
Note: 2007 figures are preliminary.
Chart C2.9
Market Share by Foodservice Category, 2007
Foodservice Category
Canadians have a large choice of foodservice outlets to choose from

An Overview of the Canadian Agriculture and Agri-Food System 55
Fo
od
Dis
tribu
tion
(Re
tail/W
ho
les
ale
an
d F
oo
ds
erv
ice
)
• Foodservice and drinking establish-ments saw an increase in their averageprofit margin from 2.7% in 2005 to3.9% in 2006.
Source: Statistics Canada, Financial and Taxation Statistics for Enterprises, Annual.
Chart C2.10
Profit Margin for Foodservice and Drinking Establishments, 1999-2006
0.0
0.5
1.0
1.5
2.0
2.5
3.0
3.5
4.0
4.5
1999 2000 2001 2002 2003 2004 2005 2006
Percent
As Canadians spend more on restaurant meals, profit margins have risen

57
S E C T I O N C 3F o o d , B e v e r a g e
a n d T o b a c c o ( F B T )P r o c e s s i n g
The domestic food, beverage and tobacco (FBT) processing industry is the link between farmers,retailers, foodservice and consumers (domestically and internationally). This link has become in-creasingly dynamic as FBT processors integrate with both farmers and retailers (domestically andabroad) to provide consumers with the products they demand. The Canadian FBT industry has facedsignificant challenges in the last few years as a result of an appreciating dollar and tight labourmarkets. This has driven up labour costs, created higher input prices for raw materials and increasedinternational competition.
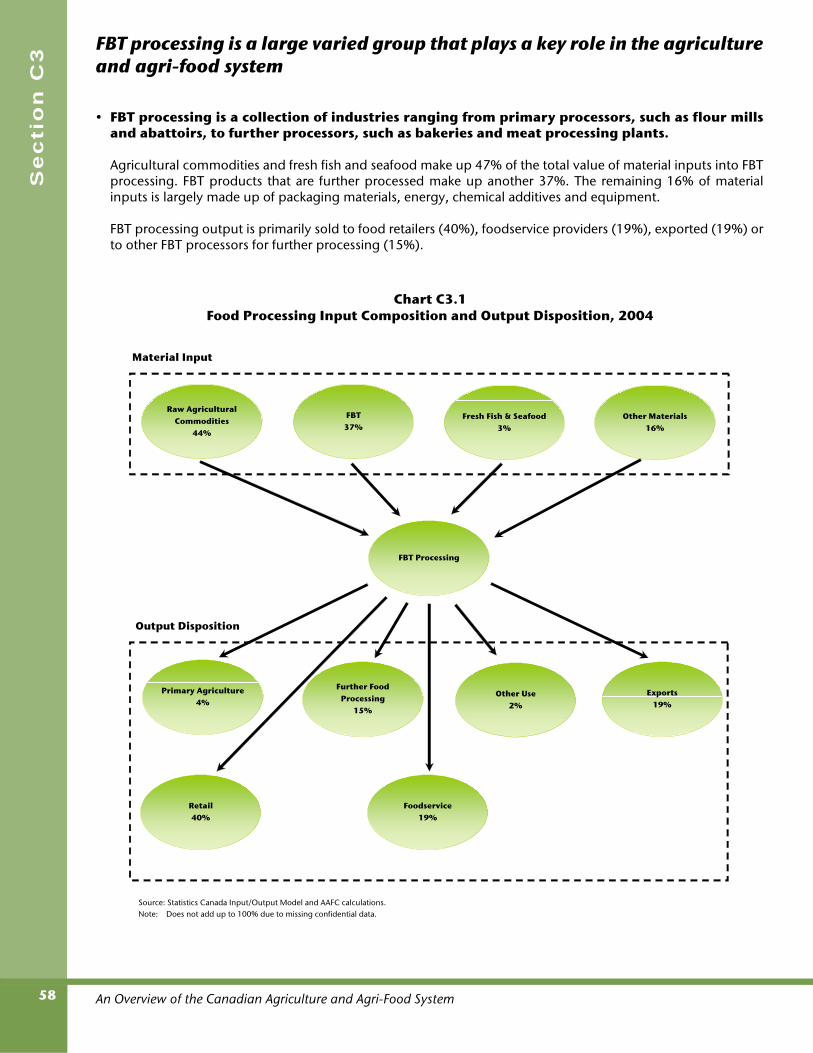
An Overview of the Canadian Agriculture and Agri-Food System58
Se
cti
on
C3
• FBT processing is a collection of industries ranging from primary processors, such as flour millsand abattoirs, to further processors, such as bakeries and meat processing plants.
Agricultural commodities and fresh fish and seafood make up 47% of the total value of material inputs into FBTprocessing. FBT products that are further processed make up another 37%. The remaining 16% of materialinputs is largely made up of packaging materials, energy, chemical additives and equipment.
FBT processing output is primarily sold to food retailers (40%), foodservice providers (19%), exported (19%) orto other FBT processors for further processing (15%).
Source: Statistics Canada Input/Output Model and AAFC calculations.Note: Does not add up to 100% due to missing confidential data.
Chart C3.1Food Processing Input Composition and Output Disposition, 2004
Foodservice19%
Retail40%
Exports19%
Other Use2%
Further Food Processing
15%
Primary Agriculture4%
FBT Processing
Other Materials16%
Fresh Fish & Seafood3%
FBT37%
Raw Agricultural Commodities
44%
Material Input
Output Disposition
FBT processing is a large varied group that plays a key role in the agricultureand agri-food system

An Overview of the Canadian Agriculture and Agri-Food System 59
Fo
od
, Be
ve
rag
e a
nd
To
ba
cc
o (F
BT
) Pro
ce
ss
ing
• FBT processing is the second largestcontributor to total manufacturing GDPin Canada, following transportationequipment manufacturing.
In 2007, FBT processing's share of manufacturingGDP was 12.8%, with food processing aloneaccounting for 10.3%.
• FBT processing is the largest manufacturingemployer, and accounted for about 14.5% oftotal manufacturing employment in 2007.
Source: Statistics Canada, Survey of Employment, Payroll and Hours (SEPH).
Chart C3.3
Distribution of Total Manufacturing Employment by Sector, 2007
Machinery Manufacturing
7.8%
Fabricated Metal Product Manufacturing
10.0%
Transportation Equipment
Manufacturing12.5%
FBT Processing14.5%
All Other Manufacturing
55.1%
Source: Statistics Canada.
Chart C3.2
Distribution of Total Manufacturing GDP by Sector, 2007
Transportation Equipment
Manufacturing18.9%
FBT Processing12.8%
Chemical Manufacturing
8.6%Primary Metal Manufacturing
6.3%
All Other Manufacturing
37.7%
Fabricated Metal Product Manufacturing
7.8%
Machinery Manufacturing
7.7%
FBT processing is one of the most important manufacturing sectors inCanada

An Overview of the Canadian Agriculture and Agri-Food System60
Se
cti
on
C3
• After a number of consecutive years ofgrowth, the value of FBT processingshipments fell slightly in 2007.
However, FBT processing shipments haveincreased by $20 billion since the early 1990s.
The largest FBT processing industry is meatproduct processing, followed by dairy productprocessing and beverage processing.
Meat and dairy product processing togetheraccount for about 40% of the value of FBTshipments.
• Most food processing industries haveexperienced a slowdown in growthrelative to the late 1990s. Notableexceptions are bakeries, dairy process-ing, and sugar and confectionery.
Some industries, such as beverage manufactur-ing have experienced slightly negative growthin recent years, while the tobacco productsindustry has shrunk significantly due to a majorreduction in demand.
Source: Statistics Canada and AAFC calculations.
Chart C3.5
Growth in Shipment Value in Real Dollars by FBT Processing Industry, 1995-2007
-5 0 5 10
1995-2000
-20 -15 -10 -5 0 5 10
Average Annual Growth (%)2001-2007
Tobacco
Dairy
Bakeries
Seafood
Sugar & Confectionery
Grain & Oilseed
Fruit & Veg. Pres.& Spec.Food
Beverage
Meat
Other Food
Animal Food
Source: Statistics Canada.
Chart C3.4
Value of FBT Processing Shipments,1992-2007
40
50
60
70
80
1992 1995 1998 2001 2004 2007
Billion 1997$
FBT output is slowing

An Overview of the Canadian Agriculture and Agri-Food System 61
Fo
od
, Be
ve
rag
e a
nd
To
ba
cc
o (F
BT
) Pro
ce
ss
ing
• In 2005, 3,347 FBT processing establish-ments were operating across Canada, eachproducing at least $23,000 in sales.
Large FBT processing establishments (with 200or more employees) produce the bulk ofoutput. In 2005, they comprised only 10% ofthe total number of establishments butaccounted for 54% of the value of shipments.
In contrast, small establishments (with less than50 employees) comprised 70% of the totalnumber of establishments, but accounted foronly 15% of the total value of shipments.
• Concentration ratios (CR4) in the foodprocessing industry vary from the mostconcentrated dairy sector to the leastconcentrated seafood processing sector.
The Canadian food processing industry hasundergone significant structural change sincethe early 1990s and is becoming increasinglyconsolidated.
The largest players in those industries, withincreasing CR4, have consolidated throughmergers and acquisitions to achieve greatereconomies of scale in an effort to remaincompetitive in the global market.
Source: Statistics Canada.Note: * This is not comparable to previous information due to changes in definitions.
Chart C3.6
Distribution of FBT Processing Shipments and Number of Establishments by Employment Size, 2005*
0
20
40
60
80
100
Small (<50 Employees) Medium (50-199Employees)
Large (200+Employees)
Percent of Total
Number of Establishments
Value of Shipments
Source: Statistics Canada, Annual Survey of Manufacturing and Logging
Concentration Ratio (CR4) in Food Processing, 2005
Chart C3.7
0.0 0.1 0.2 0.3 0.4 0.5 0.6 0.7 0.8
Seafood
Animal Food
Bakeries & Tortilla
Other Food
Fruit, Vegetable Preserving &Specialty Food
Meat
Sugar & Confectionery
Grain & Oilseed
Dairy
Ratio (CR4)
Large FBT processing firms account for half of the FBT output

An Overview of the Canadian Agriculture and Agri-Food System62
Se
cti
on
C3
• About three-quarters of FBT processingshipments in Canada are destined for thed o m e s t i c m a r ke t a n d t h e res t a reexported.
However, some sub-sectors are more export-oriented than others. For example, almost three-quarters of seafood products and half of thegrain and oilseed products are exported.
In 2007, about 71% of Canadian FBT exportswere to the U.S.
• FBT processors compete with importsfor domestic sales. On average, FBTproduct imports accounted for 22% ofthe domestic market in 2007.
In general, those sub-sectors with the highestand lowest export intensities also have thehighest and lowest import intensities.
Source: Statistics Canada and AAFC calculations.
Chart C3.8
FBT Processing Export Intensities,by Sub-industry, 2007
0 20 40 60 80
Dairy
Animal Food
Beverages
Tobacco
Other Food
Bakeries & Tortilla
Meat
Fruit, Vegetable Preserving & SpecialtyFood
Sugar & Confectionery
Grain & Oilseed
Seafood
Shipments (%)
FBT Average 25%
Source: Statistics Canada and AAFC calculations.
Chart C3.9
FBT Processing Import Intensities, by Sub-industry, 2007
0 10 20 30 40 50 60 70
Dairy
Animal Food
Meat
Bakeries & Tortilla
Tobacco
Beverages
Other Food
Fruit, Vegetable Preserving & SpecialtyFood
Sugar & Confectionery
Grain & Oilseed
Seafood
Domestic Consumption (%)
FBT Average 22%
Export intensities measure the share of production (shipments) that are exported.Import intensities measure the share of domestic consumption that is imported.
Some FBT processing industries are more dependent on trade

An Overview of the Canadian Agriculture and Agri-Food System 63
Fo
od
, Be
ve
rag
e a
nd
To
ba
cc
o (F
BT
) Pro
ce
ss
ing
• The cost of materials and suppliesaccounts for two-thirds of the totale xp e n s e s o f f o o d p ro c e s s i n gestablishments. For ever y dollar ofshipments, around 64 cents is spent onmaterials and supplies.
Energy, water utility and vehicle fuel costaccount for a small percentage (2%) whilelabour costs account for 12% of total expenses.
• The cost of labour in Canadian FBTmanufacturing industries, which hasbeen lower in the past relative to that ofthe U.S., rose slightly above wages in theU.S. in 2005 when both are measured inU.S. dollars.
The hourly compensation cost in FBTmanufacturing in Canada increased fromUS$13.89 per hour in 2000 to US$20.74 in 2005.U.S. wages in 2005 were US$19.50 per hour.
When measured in national currencies, U.S.and Canadian wages exhibited similar trends ingrowth between 1992 and 2005.
Source: Statistics Canada and AAFC calculations.
Chart C3.10Variable Input Costs in Food Manufacturing,
2006
Energy, Water Utility &
Vehicle Fuel 2%
Materials and Supplies
63%
Salaries and Wages 12%
Other23%
Source: Statistics Canada and U.S. Bureau of Labor Statistics
Chart C3.11Hourly Compensation Costs in Food, Beverage and
Tobacco Manufacturing, 1992-2005
0
5
10
15
20
25
1992 1994 1996 1998 2000 2002 2004
US$
0
5
10
15
20
25
30
CAN$
Canada (US$)
U.S. (US$)
Canada (CAN$)
Rising input costs are squeezing margins in many industries

An Overview of the Canadian Agriculture and Agri-Food System64
Se
cti
on
C3
• Profit margins in food and soft drinkprocessing have been consistently lowerthan total manufacturing, but the gapnarrowed in 2007.
These profit margins reflect improved revenuein the face of rising costs. Some companieshave restructured to focus on value-addedoperations while others have consolidated tocut costs and remain competitive.
• Corporate income tax rates forbusinesses pr imari ly eng ag ed inmanufacturing and processing havedeclined in all provinces since the mid-1980s due to changes in government taxmeasures.
For example, in Ontario and Quebec, thecombined federal and provincial corporate taxrates were around 46% and 37%, respectivelyin the mid-1980s. The combined rates fell to34% and 32%, respectively in 2007.
Lower rates improved returns for corporations.
• Return on equity measures the rate ofreturn of ownership and i s f a ir lyvariable for the food and soft drinkindustr y. However, i t shows anincreasing trend over the last threeyears.
Source: AAFC, "Corporate Income Tax Rate Database: Canada and the Provinces, 1960-2007" (revised August 2008).
Chart C3.13
Combined Federal/Provincial Corporate Income Tax Rates for Manufacturers and Processors,
Ontario and Quebec: 1986-2007
25
30
35
40
45
50
1986 1989 1992 1995 1998 2001 2004 2007
Percent
Ontario
Quebec
Source: Statistics Canada.
Note: See Glossary for definition of the profit margin ratio.
Chart C3.12
Profit Margin Ratio in Food and Total Manufacturing, 1999-2007
0
2
4
6
8
10
1999 2000 2001 2002 2003 2004 2005 2006 2007
Food & Soft Drink Processing
Total Manufacturing
Profit Margin Ratio (%)
Source: Statistics Canada.
Note: See Glossary for definition of the return on equity ratio.
Chart C3.14
Return on Equity Ratio in Food and Total Manufacturing, 1999-2007
0
5
10
15
1999 2000 2001 2002 2003 2004 2005 2006 2007
Return on Equity Ratio
(%)
Food & Soft Drink Processing
Total Manufacturing
Profit margins in food processing have improved in 2007

An Overview of the Canadian Agriculture and Agri-Food System 65
Fo
od
, Be
ve
rag
e a
nd
To
ba
cc
o (F
BT
) Pro
ce
ss
ing
• The food and soft drink industry’s debtto equity ratio has fallen recently butstill remains higher than the average fortotal manufacturing.
• Growth in the total stock of productivecapital in food processing has slowed inthe past decade, increasing by only 0.3%annually between 1998 and 2007.
During this time period, the stock of machineryand equipment increased by 1.2% annually butthe stock of buildings decreased by 1.7%.
This indicates a significant change in thecomposition of capital, reflecting increasedinvestment in machinery and equipmentinputs due to the appreciated exchange ratesince 2003, which lowered the cost of importedgoods.
Source: Statistics Canada.
Note: See Glossary for definition of the debt to equity ratio.
Chart C3.15
Debt to Equity Ratio in Food and Total Manufacturing, 1999-2007
0.0
0.2
0.4
0.6
0.8
1.0
1.2
1999 2000 2001 2002 2003 2004 2005 2006 2007
Debt to Equity Ratio Food & Soft Drink Processing
Total Manufacturing
Source: Statistics Canada.
Note: End-year net stock (Geometric).
Chart C3.16
Capital Stock, Canadian Food Processing, 1961-2007
0
1
2
3
4
5
6
7
8
9
1961 1966 1971 1976 1981 1986 1991 1996 2001 2006
Billion 2002 $
Machinery & Equip men t
Machinery & Equipement
Bu ilding Construction
Lower debt to equity ratios in food processing reflect reduced borrowing tofinance capital investments
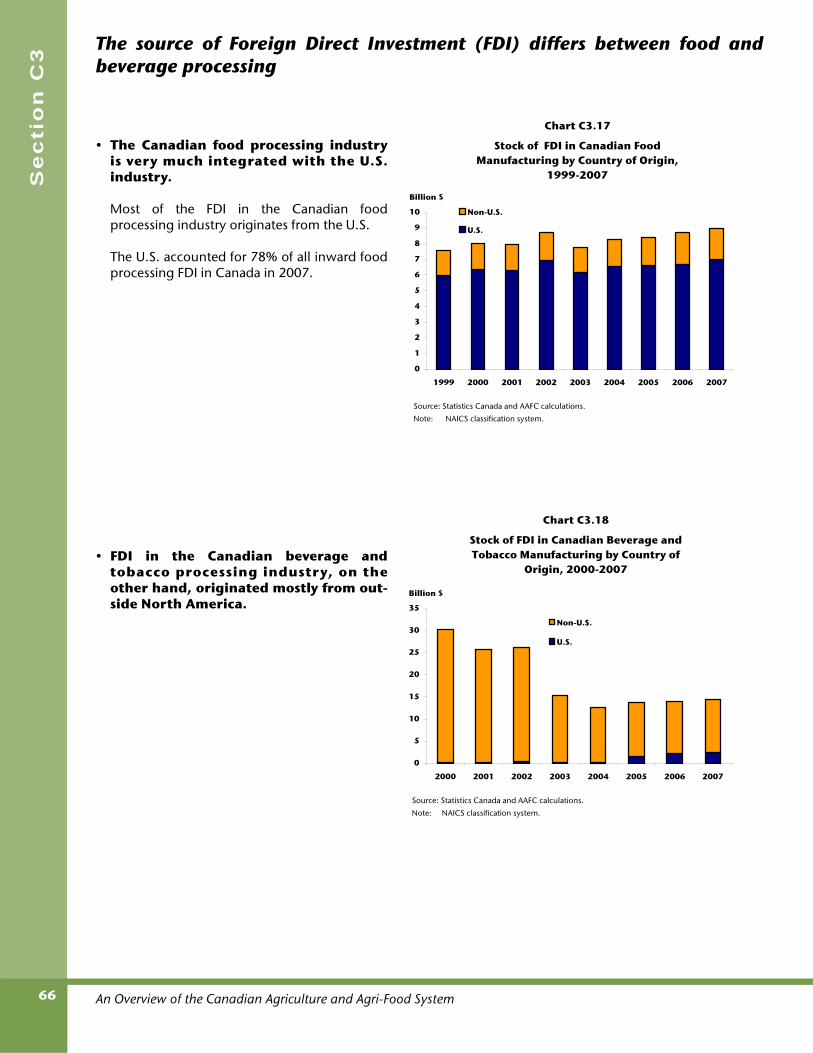
An Overview of the Canadian Agriculture and Agri-Food System66
Se
cti
on
C3
• The Canadian food processing industryis very much integrated with the U.S.industry.
Most of the FDI in the Canadian foodprocessing industry originates from the U.S.
The U.S. accounted for 78% of all inward foodprocessing FDI in Canada in 2007.
• FDI in the Canadian beverage andtobacco processing industry, on theother hand, originated mostly from out-side North America.
Source: Statistics Canada and AAFC calculations.
Note: NAICS classification system.
Chart C3.17
Stock of FDI in Canadian Food Manufacturing by Country of Origin,
1999-2007
0
1
2
3
4
5
6
7
8
9
10
1999 2000 2001 2002 2003 2004 2005 2006 2007
Billion $
Non-U.S.
U.S.
Source: Statistics Canada and AAFC calculations.
Note: NAICS classification system.
Chart C3.18
Stock of FDI in Canadian Beverage and Tobacco Manufacturing by Country of
Origin, 2000-2007
0
5
10
15
20
25
30
35
2000 2001 2002 2003 2004 2005 2006 2007
Billion $
Non-U.S.
U.S.
The source of Foreign Direct Investment (FDI) differs between food andbeverage processing

An Overview of the Canadian Agriculture and Agri-Food System 67
Fo
od
, Be
ve
rag
e a
nd
To
ba
cc
o (F
BT
) Pro
ce
ss
ing
• Canadian companies also invest in foodprocessing industries in other countries.
More than 79% of total outward foodprocessing FDI by Canadian companies went tothe U.S. in 2007.
Source: Statistics Canada and AAFC calculations.
Note: NAICS classification system.
Accumulated Outward Investment in Food Manufacturing by Destination Country,
1999-2007
Chart C3.19
0
1
2
3
4
5
6
7
8
1999 2000 2001 2002 2003 2004 2005 2006 2007
Billion $
Non-U.S.
U.S.
Canadian food and beverage processing firms have also been investingabroad


69
S E C T I O N C 4P r i m a r y
A g r i c u l t u r e
Agricultural producers have direct links to other stages in the supply chain and production is becomingincreasingly integrated. Hence, developments in commodity markets, such as production and pricetrends, have impacts on the performance of primary agriculture and throughout the supply chain. At thedisaggregated level, farms are diverse with different business strategies and management skills and alsodiffer by typology, farm size and type. This diversity explains the differences in performance betweenfarms.
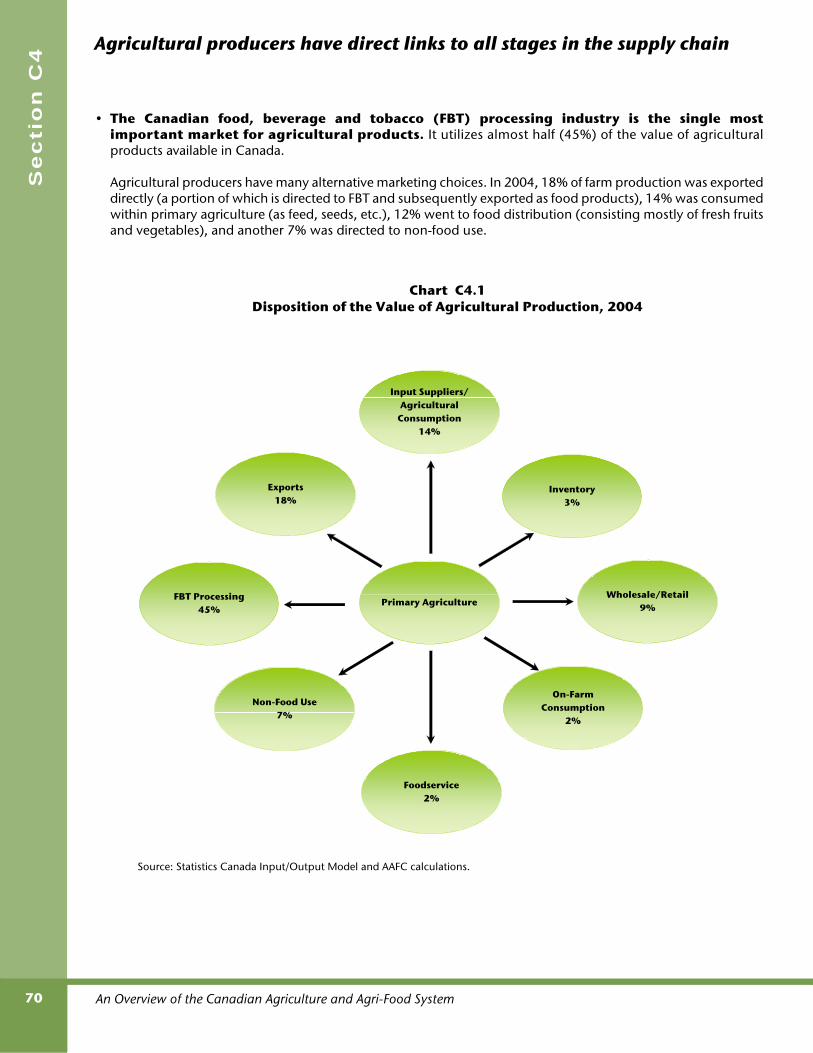
An Overview of the Canadian Agriculture and Agri-Food System70
Se
cti
on
C4
• The Canadian food, beverage and tobacco (FBT) processing industry is the single mostimportant market for agricultural products. It utilizes almost half (45%) of the value of agriculturalproducts available in Canada.
Agricultural producers have many alternative marketing choices. In 2004, 18% of farm production was exporteddirectly (a portion of which is directed to FBT and subsequently exported as food products), 14% was consumedwithin primary agriculture (as feed, seeds, etc.), 12% went to food distribution (consisting mostly of fresh fruitsand vegetables), and another 7% was directed to non-food use.
Source: Statistics Canada Input/Output Model and AAFC calculations.
Chart C4.1Disposition of the Value of Agricultural Production, 2004
Foodservice2%
On-Farm Consumption
2%
Non-Food Use7%
FBT Processing45%
Wholesale/Retail9%Primary Agriculture
Inventory3%
Exports18%
Input Suppliers/ Agricultural
Consumption 14%
Agricultural producers have direct links to all stages in the supply chain

An Overview of the Canadian Agriculture and Agri-Food System 71
Prim
ary
Ag
ricu
lture
• The Prairie provinces account for roughly81% of total farmland. British Columbia,Ontario and Quebec account for another17%. The remaining 2% of farmland is locatedin Atlantic Canada. However, most farms arelocated in Ontario, Alberta and Saskatchewan.
• Farm size varies across Canada depending,in large part, on commodity specializationand geographic characteristics of regions.
The average farm size in Ontario, where farmingin more intensive, is around 230 acres. Theaverage farm size in Saskatchewan, wherefarming is more extensive, is nearly six times thissize at 1,450 acres.
There are more farm operators than there arefarms because of partnerships and other jointownership arrangements.
Source: Statistics Canada, 2006 Census of Agriculture.
Chart C4.2Provincial Shares of Farmland and Farms, 2006
Percent of Canadian Farmland
Percent of Canadian Farms
4.2%31.2%
38.5%
11.4%
8.0%
5.1%8.7%
21.6%19.3%
8.3%
24.9%
13.4%
0.6%1.2%
0.2%
0.6%
1.7%
0.4%0.7% 0.1%
Canada 167,010 229,373 728 327,055 304,600
N.L. 89 558 160 715 1,700
P.E.I. 620 1,700 365 2,335 3,700
N.S. 996 3,795 262 5,095 4,300
N.B. 977 2,776 352 3,695 5,800
Que. 8,557 30,675 279 45,470 61,900
Ont. 13,310 57,211 233 82,410 88,000
Man. 19,073 19,054 1,001 26,620 25,500
Sask. 64,254 44,329 1,449 59,185 41,800
Alta. 52,128 49,431 1,055 71,660 41,200
B.C. 7,007 19,844 353 29,870 30,500
Source: Statistics Canada, 2006 Census of Agriculture, Labour Force Survey.
Note: Farm operators are those who are actually involved in the management decisions
made for the agricultural operation.
Employment is recorded by major work activity. Thus, if a farm operator relies
on off-farm work for a significant portion of his/her income, he/she is not
considered to be in farm employment.
Farm Operators
(#)
Farm Employment
(#)
Chart C4.3Number and Size of Farms, 2006
Farmland (Thousand
Acres)
Average Farm Size
(Acres)Farms (#)
Production is very diverse across all provinces

An Overview of the Canadian Agriculture and Agri-Food System72
Se
cti
on
C4
• The commodity mix is changing asproducers are diversifying production.
In 2007, farm market receipts totalled $36.4billion, up from $20.1 billion in 1990. Since1990, the cont r ibut ions o f f ru i t s andvegetables, grains and oilseeds and other farmcommodities have increased relative to atraditional mix of products such as dairy andred meats.
• Product mix varies by province.
In the Prairies, red meats and grains and oilseedsaccounted for the largest share of farm marketreceipts, whereas in British Columbia, highercontribution came from fruits, vegetables andother farm products.
In Quebec, red meats and dairy accounted for themajority of farm market receipts.
In the Atlantic provinces, other farm commoditiessuch as special crops contributed to over 40% offarm market receipts in 2007.
Source: Statistics Canada.
Chart C4.5
Regional Farm Market Receipts by Commodity Share, 2007
0
10
20
30
40
50
60
70
80
90
100
B.C. Prairies Ont. Que. Atlantic
Percent
Red Meats Grains & Oilseeds
Other Farm Commodities Dairy
Poultry & Eggs Fruits & Vegetables
Source: Statistics Canada.
Farm Market Receipts by Commodity, 1990 and 2007
Chart C4.4
30.4% 26.8%
27.8% 30.0%
15.7% 14.3%
12.5% 15.4%
7.2%6.3%
8.4%5.2%
1990 2007
Grains & Oilseeds
Red Meats
Other Farm Commodities
Dairy
Poultry & Eggs
Fruits & VegetablesTotal $36.4B
$2.3$2.6
$5.6
$5.2
$10.9
$9.7
Total $20.1B
$1.1$1.7
$2.5
$3.2
$5.6
$6.1
Canada produces a diverse set of commodities which has evolved and variesby province

An Overview of the Canadian Agriculture and Agri-Food System 73
Prim
ary
Ag
ricu
lture
• The grain and oilseed and red meatindustries have increased their exportmarket share over time.
In 2006, grain and oilseed, and red meat pro-ducers earned 49%, 84% and 58%, respectivelyof their farm cash receipts from export markets.This was an improvement from that of the pre-vious year.
• Overall, Canada’s agricultural producersare significantly more export orientedthan those in the U.S. and EU.
About 45% of Canada’s agricultural productionwas exported in 2006 compared to 18% and7% for the U.S. and EU respectively.
Source: Statistics Canada, OECD and AAFC calculations.
Note: Export dependency is calculated as a value of production weighted average of the export dependencies of the following commodities - wheat, coarse grains, oilseeds, beef, pork, dairy and poultry. These commodities cover about 50% of the EU's total farm production, 60% of the U.S.'s total of the farm production and 75% of Canada's total farm production.
Chart C4.7Share of Farm Market Receipts from Export
Sales for Canada, the U.S. and the EU, 1999-2006
0
10
20
30
40
50
1999-2000 2001-2002 2003-2004 2005-2006
Market Receipts (%) Canada
U.S.EU
Source: Statistics Canada and AAFC calculations.
Note: Export dependency is calculated in terms of volume to avoid export and farmgate price differentials. Grain and oilseed export dependency is calculated on a crop year basis and dairy on a dairy year basis.
Chart C4.6Share of Production from Export Sales, 2004-2006
0
10
20
30
40
50
60
70
80
90
Grain Oilseeds Red Meat Poultry Eggs Dairy
Market Receipts (%)
2004
2005
2006
The Canadian agriculture and agri-food sector is very export dependent,both on a commodity and national level

An Overview of the Canadian Agriculture and Agri-Food System74
Se
cti
on
C4
• Corn, wheat and soybean prices rose34%, 33% and 46%, respectively,between 2006 and 2007. The trend ofrising prices continued into 2008.
Higher cereal and oilseed prices have led toincreased farm revenues for crop producers.
However, rising corn prices have had a negativeimpact on livestock producers who use grains asfeed.
• Overall, crop prices rose 24% between2006 and 2007. Livestock prices havechanged very little.
Livestock owners have responded to higherfeed prices by liquidating animal stocks, whichhas kept livestock and animal prices stable.
Source: Statistics Canada.
Chart C4.9
Farm Product Price Index:Crop Prices and Livestock Prices,
1991-2007
0
20
40
60
80
100
120
140
1991 1993 1995 1997 1999 2001 2003 2005 2007
1997 = 100
Crops
Livestock and Animal Products
Source: IMF Primary Commodity Price.
Note: Data reflects prices as of June 2008.
Chart C4.8
U.S. Corn, Wheat and Soybean Prices,1980-2008
0
100
200
300
400
500
600
1980 1983 1986 1989 1992 1995 1998 2001 2004 2007
US$/ Tonne
Corn
Wheat
Soybeans
In 2007 and 2008, prices in the grain and oilseed sector increased rapidly,while livestock prices remained largely unchanged
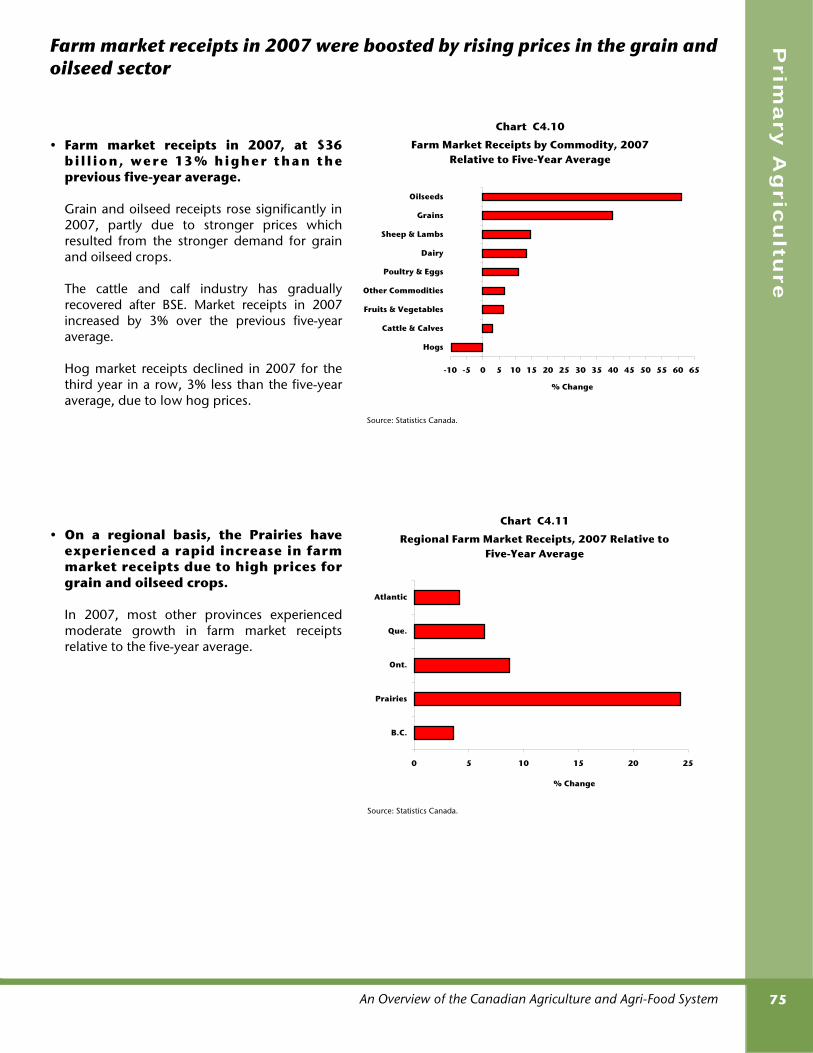
An Overview of the Canadian Agriculture and Agri-Food System 75
Prim
ary
Ag
ricu
lture
• Farm market receipts in 2007, at $36b i l l i o n , we re 13% h i g h e r t h a n t heprevious five-year average.
Grain and oilseed receipts rose significantly in2007, partly due to stronger prices whichresulted from the stronger demand for grainand oilseed crops.
The cattle and calf industry has graduallyrecovered after BSE. Market receipts in 2007increased by 3% over the previous five-yearaverage.
Hog market receipts declined in 2007 for thethird year in a row, 3% less than the five-yearaverage, due to low hog prices.
• On a regional basis, the Prairies haveexperienced a rapid increase in farmmarket receipts due to high prices forgrain and oilseed crops.
In 2007, most other provinces experiencedmoderate growth in farm market receiptsrelative to the five-year average.
Source: Statistics Canada.
Chart C4.11
Regional Farm Market Receipts, 2007 Relative to Five-Year Average
0 5 10 15 20 25
B.C.
Prairies
Ont.
Que.
Atlantic
% Change
Source: Statistics Canada.
Chart C4.10
Farm Market Receipts by Commodity, 2007 Relative to Five-Year Average
-10 -5 0 5 10 15 20 25 30 35 40 45 50 55 60 65
Hogs
Cattle & Calves
Fruits & Vegetables
Other Commodities
Poultry & Eggs
Dairy
Sheep & Lambs
Grains
Oilseeds
% Change
Farm market receipts in 2007 were boosted by rising prices in the grain andoilseed sector

An Overview of the Canadian Agriculture and Agri-Food System76
Se
cti
on
C4
• Program payments per farm fell in 2007and are expected to fall further in 2008,as incomes are partially recovering afterpeaking in the 2005 to 2006 period.
Program payments per farm are expected tocontinue to drop in 2008 to $20,144 from theirpeak in 2005 of $22,730.
• Net cash income per farm is expected torebound in 2008 due to higher cropprices.
In 2008, net cash income per farm will average$41,021, up from $35,314 the year before.However, income varies for individualproducers, depending on type of commodityproduced, degree of specialization anddiversification, size of operation and financialsituation.
Source: Statistics Canada and AAFC calculations.
Note: 2008 figures are forecasts.
Chart C4.12Program Payments per Farm, 2003-2008
0
5
10
15
20
25
2003 2004 2005 2006 2007 2008
Thousand $
Source: Statistics Canada and AAFC calculations.
Note: 2008 figures are forecasts.
Chart C4.13
Net Cash Income per Farm, 2003-2008
0
5
10
15
20
25
30
35
40
45
2003 2004 2005 2006 2007 2008
Thousand $
Program payments have declined overall in recent years as market incomehas improved

An Overview of the Canadian Agriculture and Agri-Food System 77
Prim
ary
Ag
ricu
lture
• Net value-added measures the value ofeconomic production in the Canadianagriculture sector.
Agriculture’s net value-added is expected torise to $12.2 billion in 2008, up from $9.4billion in 2007.
In 2008, value-added in agriculture willincrease due to the rapid growth in the value ofagricultural production, as improved prices inthe crop sector will more than offset high costsof production and lower receipts for red meatproducers.
• Net value-added measures the return tothe various factors of production,including rent to non-operatorlandlords, interest to lenders and wagesto non-family members.
Interest and wages are expected to account for61% of net value-added in 2008.
Corporation profits and unincorporated operatorreturns will account for about 27% of net value-added in 2008.
A sizeable share (12%) of value-added isattributed to non-operator landowners.
Source: Statistics Canada and AAFC calculations.
Note: 2008 figures are forecasts.
Chart C4.15Distribution of Net Value-Added, 2008
Interest26.1%
Non-Family Wages21.3%
Family Wages13.5%
Cash and Share Rent to
Non-Operators
12.4%
Corporation Profits and Unincorp-
orated Operator Returns26.8%
Source: Statistics Canada and AAFC calculations.
Note: 2008 figures are forecasts.
Chart C4.14Value-Added in Agriculture, 1991-2008
0
2
4
6
8
10
12
14
1991 1993 1995 1997 1999 2001 2003 2005 2007
Billion $
Net value-added is defined as the value of economic production from agricultural establishments and isexpressed as gross value-added minus depreciation allowances. Gross value-added is calculated asincome from all sources (sales, program payments, rent, and income-in-kind) minus expenses on inputsand business taxes.
The result was an increase in net value-added

An Overview of the Canadian Agriculture and Agri-Food System78
Se
cti
on
C4
• While the total number of farms inCanada is decreasing, technologies havechanged the optimal scale of productionfor many agricultural commodities.
In the last 25 years, the total number of farms inCanada declined 28%. Large farms, with grossrevenues of $250,000 and over, witnessed athreefold increase in farm numbers, increasingfrom 11,005 farms in 1981 to 38,980 in 2006.
At the same time, the number of small tomedium-sized farms with less than $250,000 ingross revenues decreased by 38%.
• The number and share of million-dollarfarms in Canada is on the rise.
Million-dollar farms account for 2.5% of farmsin Canada.
Between 1981 and 2006, farms with grossrevenues of between $1 million and $4.9million increased fourfold (430%) to 5,339farms in 2006.
Over the same period, five-million-dollar farmsincreased sevenfold (660%) to 563 farms in2006.
Source: Statistics Canada, Census of Agriculture, various years.
Chart C4.16
Number of Farms by Revenue Class,1981 - 2006
0
50
100
150
200
250
300
350
1981 1986 1991 1996 2001 2006
Thousand
0
5
10
15
20
25
30
35
40
45
Thousand
All farms
Small to medium sized farms
Large farms
Source: Statistics Canada, Census of Agriculture, various years. Note: Revenue categories based on reference year and are in constant 2005$.
Chart C4.17
Percent of Farms by Revenue Class,1981-2006
0
10
20
30
40
50
60
70
80
90
100
1981 1986 1991 1996 2001 2006
Percent
Less than $250,000 $250,000 - $499,999$500,000- $999,999 $1,000,000-$4,999,999$5,000,000 or more
Large farms are increasing in number and importance
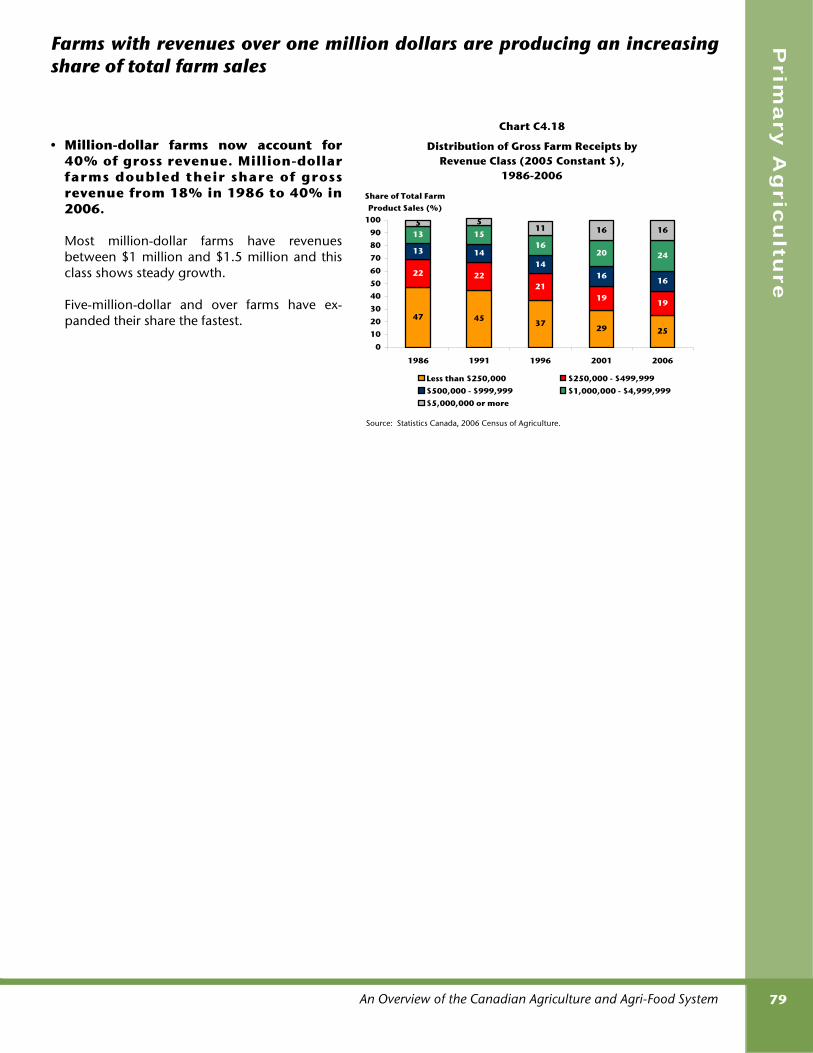
An Overview of the Canadian Agriculture and Agri-Food System 79
Prim
ary
Ag
ricu
lture
• Million-dollar farms now account for40% of gross revenue. Million-dollarfarms doubled their share of grossrevenue from 18% in 1986 to 40% in2006.
Most million-dollar farms have revenuesbetween $1 million and $1.5 million and thisclass shows steady growth.
Five-million-dollar and over farms have ex-panded their share the fastest.
Source: Statistics Canada, 2006 Census of Agriculture.
Chart C4.18
Distribution of Gross Farm Receipts by Revenue Class (2005 Constant $),
1986-2006
47 4537
29 25
22 2221
1919
13 1414
1616
13 1516
20 24
5 511 16 16
0
10
20
30
40
50
60
70
80
90
100
1986 1991 1996 2001 2006
Share of Total Farm Product Sales (%)
Less than $250,000 $250,000 - $499,999$500,000 - $999,999 $1,000,000 - $4,999,999$5,000,000 or more
Farms with revenues over one million dollars are producing an increasingshare of total farm sales

An Overview of the Canadian Agriculture and Agri-Food System80
Se
cti
on
C4
• Average net cash income is expected tobe $41,021 in 2008.
Average net cash income varies from $1,651 forfarms with gross revenues of $10,000 to$99,999, to $324,257 for million-dollar andover operations.
• Saskatchewan and Manitoba areforecast to report the highest averagenet cash income.
Average net cash income will range from$14,267 in Newfoundland to $44,480 inSaskatchewan.
• On average, dairy and horticulturefarms are forecast to have the highestaverage net cash income among farmsin 2008.
Hog and cattle farms are expected to report thelowest average net cash income in 2008.
Record high grain and oilseed prices in 2008will lead to stronger returns for grain andoilseed farms, but this will also mean higherfuel costs for cattle and hog farms. Source: Statistics Canada and AAFC calculations.
Note: 2008 figures are forecasts.
Chart C4.21
Average Net Cash Income by Farm Type, 2008
-20 0 20 40 60 80 100
All
Hogs
Dairy
Cattle
Horticulture
Grains & Oilseeds
Thousand $
Source: Statistics Canada and AAFC calculations.
Note: 2008 figures are forecasts.
Average Net Cash Income by Revenue Class, 2008
Chart C4.19
0 50 100 150 200 250 300 350
$10,000 to $99,999
$100,000 to $249,999
$250,000 to $499,999
$500,000 to $999,999
$1,000,000 and Over
All Farms
Thousand $
Source: Statistics Canada and AAFC calculations.
Note: 2008 figures are forecasts.
Chart C4.20
Average Net Cash Income by Province, 2008
0
10
20
30
40
50
B.C. Alta. Sask. Man. Ont. Que. N.B. N.S. P.E.I. N.L.
Thousand $
Aggregate net cash income masks the difference among individual farms,which varies by farm size, type and province

An Overview of the Canadian Agriculture and Agri-Food System 81
Prim
ary
Ag
ricu
lture
• Net market income per farm is expectedto increase from $14,300 to $20,877 forfarms between 2007 and 2008.
Program payments per farm will decrease from$21,013 for farms between 2007 and 2008.
Market income is up because of higher pricesfor grains and oilseeds.
Source: Statistics Canada and AAFC calculations. Note: 2008 figures are forecasts.
Average Net Market Income and Program Payments, 2003-2008
Chart C4.22
0
5
10
15
20
25
30
35
40
45
2003 2004 2005 2006 2007 2008
Thousand $
Program Payments
Net Market Income
Farm net market income has increased with program payments making upfor shortfalls in market revenue
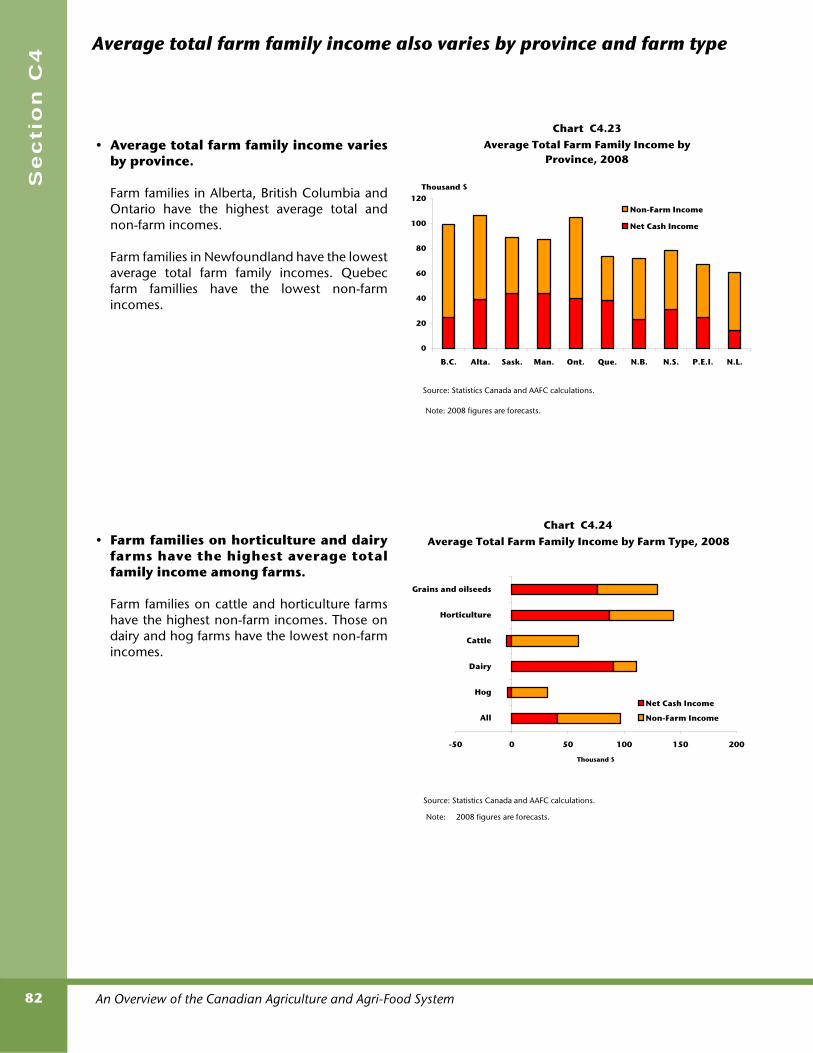
An Overview of the Canadian Agriculture and Agri-Food System82
Se
cti
on
C4
• Average total farm family income variesby province.
Farm families in Alberta, British Columbia andOntario have the highest average total andnon-farm incomes.
Farm families in Newfoundland have the lowestaverage total farm family incomes. Quebecfarm famillies have the lowest non-farmincomes.
• Farm families on horticulture and dairyfarms have the highest average totalfamily income among farms.
Farm families on cattle and horticulture farmshave the highest non-farm incomes. Those ondairy and hog farms have the lowest non-farmincomes.
Source: Statistics Canada and AAFC calculations.
Note: 2008 figures are forecasts.
Chart C4.23Average Total Farm Family Income by
Province, 2008
0
20
40
60
80
100
120
B.C. Alta. Sask. Man. Ont. Que. N.B. N.S. P.E.I. N.L.
Thousand $
Non-Farm Income
Net Cash Income
Source: Statistics Canada and AAFC calculations.
Note: 2008 figures are forecasts.
Chart C4.24Average Total Farm Family Income by Farm Type, 2008
-50 0 50 100 150 200
All
Hog
Dairy
Cattle
Horticulture
Grains and oilseeds
Thousand $
Net Cash Income
Non-Farm Income
Average total farm family income also varies by province and farm type

An Overview of the Canadian Agriculture and Agri-Food System 83
Prim
ary
Ag
ricu
lture
• Families on smaller farms are moredependent on non-farm income.
For smaller farms, non-farm income along withprogram payments are enough to offsetnegative and low net market income.
Source: Statistics Canada and AAFC calculations.
Note: 2008 figures are forecasts.
Net market income does not include CCA.
Average Income of Farm Families by Source of Income, 2008
Chart C4.25
0
100
200
300
400
500
600
$10,000 to
$99,999
$100,000 to
$249,999
$250,000 to
$499,999
$500,000 to
$999,999
$1,000,000 and
Over
Thousand $
Non-Farm IncomeProgram PaymentsNet Market Income
$173,699
$387,883
$73,120$114,465
$58,399
Non-farm income accounts for a significant amount of farm family income

An Overview of the Canadian Agriculture and Agri-Food System84
Se
cti
on
C4
• Farm and farm families operate farms fordifferent reasons. Farms can be classifiedby age of the operator, income, and focus.
About 38% of farms are business oriented andcan be categorized by their scale of operation.They range from small to very large businessfocussed farms. Another 30% of farms areeither retirement or lifestyle farms, whereas the21% of remaining farms are low income farms.
Source: Statistics Canada and AAFC, 2007 Farm Financial Survey.
Chart C4.26
Distribution of Farms with $10,000 or more in Gross Farm Receipts by Typology Group, 2006
Non-Family Farms0.3%
Very Large Business Focussed
10.1%
Large Business Focussed
14.2%
Medium Business Focussed
14.4%Small Business
Focussed9.2%
Low Income21.3%
Lifestyle10.4%
Pension20.1%
Typology Definitions
Farm families operating with gross farm revenues of $10,000 to $49,999, and whose farm family earn $50,000 or more from non-farm sources of income.
Farm families where total household income is below Statistics Canada's Low Income Measure (LIM).
Farms with $10,000 to $249,999 in gross revenues that do not fall in any of the three previous categories.
Farms with gross revenues of $10,000 to $99,999.
Farms with gross revenues of $100,000 to $249,999.
Farms with gross revenues of $250,000 to $499,999.
Farms with gross revenues of $500,000 or more.
Farms organized as non-family corporations, co-operatives or communal operations. Also includes farms held in estates or trusts.
Note: Typology definitions have changed from previous years and are not directly comparable.
Hobby farms, those with less than $10,000 in gross revenues, are not included in this breakdown.
Large-scale Family Farms (gross revenues of $250,000 or more)
Large Business Focussed
Very Large Business Focussed
Non-family Farms
Medium Business Focussed
Small Family Farms (gross revenues of $10,000 - $249,999)
Pension
Lifestyle
Low Income
Farms whose operators are 65 and over, and those 60 to 64 receiving pension income. Multi-generational farms are excluded.
Chart C4.27
Definition of Farm Typology
Business Focussed
Small Business Focussed
Different people farm for different reasons, which is captured by farmtypology
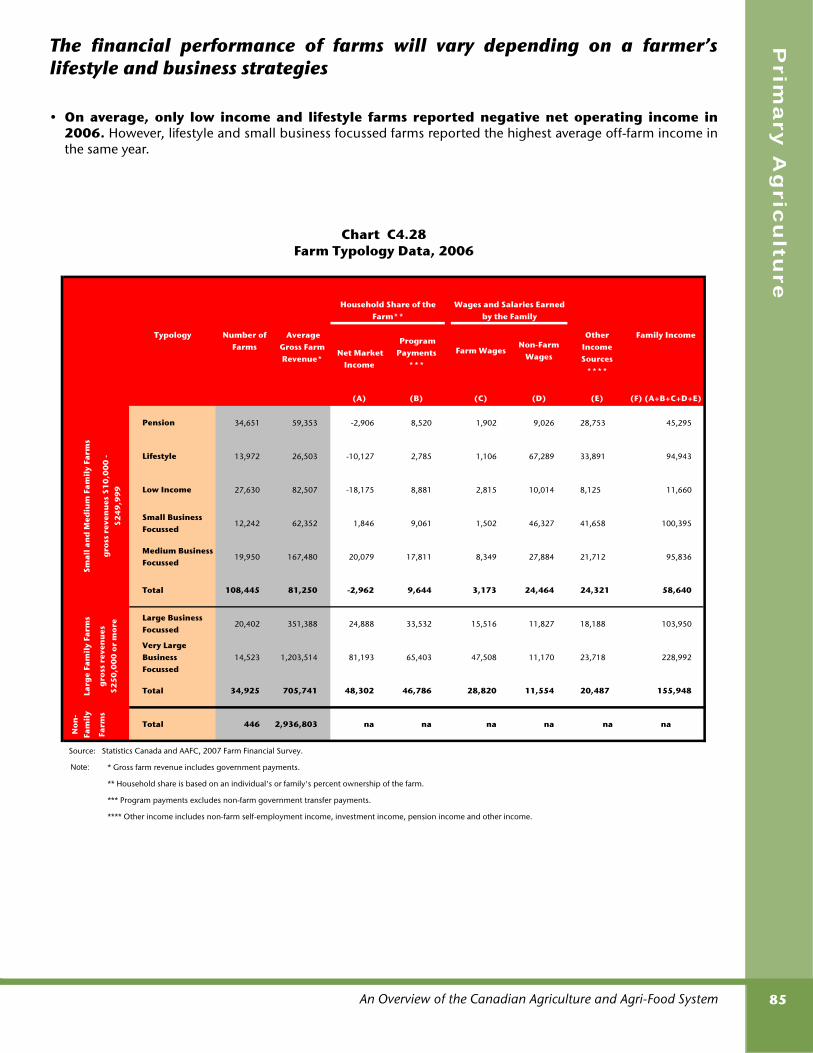
An Overview of the Canadian Agriculture and Agri-Food System 85
Prim
ary
Ag
ricu
lture
• On average, only low income and lifestyle farms reported negative net operating income in2006. However, lifestyle and small business focussed farms reported the highest average off-farm income inthe same year.
Typology Number of Farms
Average Gross Farm Revenue*
Net Market Income
Program Payments
***
Farm WagesNon-Farm
Wages
Other Income Sources
****
Family Income
(A) (B) (C) (D) (E) (F) (A+B+C+D+E)
Pension 34,651 59,353 -2,906 8,520 1,902 9,026 28,753 45,295
Lifestyle 13,972 26,503 -10,127 2,785 1,106 67,289 33,891 94,943
Low Income 27,630 82,507 -18,175 8,881 2,815 10,014 8,125 11,660
Small Business Focussed
12,242 62,352 1,846 9,061 1,502 46,327 41,658 100,395
Medium Business Focussed
19,950 167,480 20,079 17,811 8,349 27,884 21,712 95,836
Total 108,445 81,250 -2,962 9,644 3,173 24,464 24,321 58,640
Large Business Focussed
20,402 351,388 24,888 33,532 15,516 11,827 18,188 103,950
Very Large Business Focussed
14,523 1,203,514 81,193 65,403 47,508 11,170 23,718 228,992
Total 34,925 705,741 48,302 46,786 28,820 11,554 20,487 155,948
No
n-
Fam
ily
Farm
s
Total 446 2,936,803 na na na na na na
Source: Statistics Canada and AAFC, 2007 Farm Financial Survey.
Note: * Gross farm revenue includes government payments.
** Household share is based on an individual's or family's percent ownership of the farm.
*** Program payments excludes non-farm government transfer payments.
**** Other income includes non-farm self-employment income, investment income, pension income and other income.
Smal
l an
d M
ediu
m F
amil
y Fa
rms
gro
ss r
even
ues
$1
0,0
00
- $
24
9,9
99
Larg
e Fa
mil
y Fa
rms
gro
ss r
even
ues
$
25
0,0
00
or
mo
re
Farm Typology Data, 2006
Household Share of the Farm**
Wages and Salaries Earned by the Family
Chart C4.28
The financial performance of farms will vary depending on a farmer’slifestyle and business strategies

An Overview of the Canadian Agriculture and Agri-Food System86
Se
cti
on
C4
• Business goals vary by typology.
According to the 2007 National RenewalSurvey, maximizing return on investment andpaying off debts were two of the mostimportant business goals of the majority offarms in the business focussed group.
For the pension and lifestyle groups, producingthe best products possible was the mostimportant goal.
For the low income group, paying off theirdebts was considered the most important goalfollowed by maximizing their return oninvestment.
• Low cost business focussed farms,generate comparable gross margin ratiosregardless of size.
Conversely, high cost business focussed farms,which are small, generate the highest negativemargin among all farm types.
Source: Statistics Canada and AAFC, 2007 Farm Financial Survey.Note: Includes farms with $10,000 or more in gross revenues. *Gross margin ratios are calculated as the ratio of net operating income to gross farm revenues. **Low cost and high cost farms are the top and bottom 20% of farms respectively, based on operating margin.
Chart C4.30Gross Margin Ratios* Reported by High Cost and
Low Cost Farms** by Typology, 2006
-1.5 -1.0 -0.5 0.0 0.5 1.0 1.5 2.0
Small BusinessFocussed
Medium BusinessFocussed
Large BusinessFocussed
Very LargeBusiness Focussed
Low Cost Farms
High Cost Farms
Source: AAFC, 2007 Renewal Survey
Note: Includes farms with $100,000 or more in gross revenues. BF: Business focussed.
Chart C4.29
Most Important Business Goal by Farm Typology, 2007
0
5
10
15
20
25
30
35
40
Pension Lifestyle Low income Small BF Medium BF Large BF Very large
BF
Expanding the size of the farm/ranchMaximising productivityProducing the best products possiblePaying off your debtsMaximising return on investment
Percent
Farm financial performance depends on the management skills of farmers,and even varies within a revenue class

An Overview of the Canadian Agriculture and Agri-Food System 87
Prim
ary
Ag
ricu
lture
• The net financial position of farms maybe measured by average net worth.
In Canada, average farm net worth continuedto increase over the last few years after a slightdecline occurred in 2003. In 2006, the averagenet worth was $1,102,537, up 6.4% from 2005and 78% from 1995.
• All provinces showed an increase inaverage net worth in 2006 compared to2005 and 2004, with the exception ofPr ince Edward Is land and NewBrunswick where average net worthdeclined compared to 2005.
Average net worth increased faster in BritishColumbia and Alberta than in other provinces,partly due to the increasing land values inWestern Canada.
Source: Statistics Canada and AAFC, Farm Financial Survey, various years. Note: Includes farms with $10,000 or more in gross revenues.
Chart C4.31Average Farm Net Worth, 1995-2006
0.0
0.2
0.4
0.6
0.8
1.0
1.2
1995 1997 1999 2001 2002 2003 2004 2005 2006
Million $
Source: Statistics Canada and AAFC, Farm Financial Survey, various years.
Note: Includes farms with $10,000 or more in gross revenues.
Chart C4.32
Average Farm Net Worth by Province, 2004-2006
0.0
0.2
0.4
0.6
0.8
1.0
1.2
1.4
1.6
1.8
N.L. P.E.I. N.S. N.B. Que. Ont. Man. Sask. Alta. B.C.
Million $
200420052006
The financial situation of farms takes into account both income and networth measures, which have grown over time and vary by province

An Overview of the Canadian Agriculture and Agri-Food System88
Se
cti
on
C4
• Poultry and egg farms, potato, dairyand hog farms have the highest networ th, ranging from $1.5 to $2.9million.
The Canadian average for all farms was $1.1million in 2006. Cattle farms had the lowestassets, liabilities and net worth, on average.
On average, potato farms carry the largestdebts ($898,700 per farm) followed by poultryand eggs, and dairy farms with debts of$687,200 and $679,600, respectively.
• Quota values in the supply-managedindustries have grown significantly inrecent years.
In 2006, the average dairy farm had around$1.4 million worth of quota and the averagepoultry farm around $1.9 million, accountingfor 47% and 46% of total farm assets,respectively.
The trend is caused by the increase in the valueof quota per animal and the increase in thenumber of animals per farm.
Source: Statistics Canada and AAFC, 2007 Farm Financial Survey. Note: Includes farms with $10,000 or more in gross revenues.
Chart C4.33
Average Assets, Liabilities and Net Worth by Farm Type, 2006
0.0 0.5 1.0 1.5 2.0 2.5 3.0 3.5 4.0
Cattle
Grains & Oilseeds
Fruits & Vegetables
Hogs
Dairy
Potatoes
Poultry & Eggs
Million $
AssetsLiabilitiesNet Worth
Source: Statistics Canada and AAFC, Farm Financial Survey, various years. Note: *Includes farms with $10,000 or more in gross revenues.
Chart C4.34
Average Quota Holdings of Supply-Managed Farms, 1995-2006
0
500
1,000
1,500
2,000
2,500
1996* 1998* 2000* 2002 2004 2006
Dairy
Poultry & Eggs
Average Market Quota Value per Farm*
(Thousand $)
Farm net worth also varies by farm type

An Overview of the Canadian Agriculture and Agri-Food System 89
Prim
ary
Ag
ricu
lture
• The debt to asset ratio measures thefarm's financial risk by determining howmuch of the farm's assets have beenfinanced by debt.
Overall, the debt to asset ratio for all farms hasdeclined in 2005 and 2006.
The debt to asset ratio fell from 17.7% in 2004to 15.5% in 2005 and 2006, reflecting animprovement in financial conditions.
• Financial stress is determined by cashflow and equity levels.
The vast majority of farms were in a goodfinancial position at the end of 2006.
Only 7.6% were under significant financialstress, while 17.1% of farms were undermoderate financial stress.
Source: Statistics Canada and AAFC, Farm Financial Survey, various years.
Note: Includes farms with $10,000 or more in gross revenues.
*Average per farm.
Chart C4.35
Debt to Asset Ratios* for All Farms, Canada, 1995-2006
0.00
0.05
0.10
0.15
0.20
1995 1997 1999 2001 2002 2003 2004 2005 2006
Debt to Asset Ratio
Less than 50%
50% to 75%Greater than
75%All Net Worth
Less than $20,000 2.1% 4.7% 14.8% 21.6%
$20,000 to $35,000 0.8% 2.3% 7.8% 10.9%
Greater than $35,000 5.2% 12.4% 49.9% 67.5%
All Cash Flow 8.1% 19.4% 72.5% 100.0%
Source: Statistics Canada and AAFC, 2007 Farm Financial Survey.Note: Includes farms with $10,000 or more in gross revenues excluding co-ops and communal operations.
Equity in Percentage
Chart C4.36
Financial Stress for All Farms, Canada, 2006
Cash Flow Categories
Legend: Significant risk. Moderate risk.
The financial conditions of farms are reflected by both cash flow and debt toasset ratios

An Overview of the Canadian Agriculture and Agri-Food System90
Se
cti
on
C4
• With improving grain prices, more thanthree-quarters of grain and oilseedfarms were in good financial shape atthe end of 2006.
The vast majority of grain and oilseed farmswere in a good financial position at the end of2006, with 76.2% not under financial stress.
Only 7.6% were under significant financialstress while 16.2% were under moderatefinancial stress.
• In 2006, 28% of hog farms were undermoderate and signif icant f inancialstress.
Among hog farms, 16.3% were undersignificant financial stress, while 11.7% wereunder moderate financial stress. A relativelyhigh percentage of farms (28.2%) had equitylevels of less than 50%.
Less than 50%
50% to 75%Greater than
75%
2.4% (1,232)
4.5% (2,263)
14.7% (7,386)
0.7% (345)
1.5% (746)
6.7% (3,373)
4.2% (2,117)
13.2% (6,642)
52.2% (26,296)
7.3% (3,694)
19.2% (9,652)
73.5% (37,055)
Source: Statistics Canada and AAFC, 2007 Farm Financial Survey.
Equity in Percentage
21.6% (10,881)
8.9% (4,464)
69.6% (35,055)
All Cash Flow
All Equity
100% (50,401)
Cash Flow Categories
Less than $20,000
$20,000 to $35,000
Greater than $35,000
Chart C4.37
Financial Stress Levels of Grain and Oilseed Farms in Canada, 2006
Legend: Significant risk. Moderate risk.
Less than 50%
50% to 75%Greater than
75%
7% (302)
5.5% (238)
10.7% (464)
3.8% (166)
1% (45)
5.5% (240)
17.4% (752)
18% (779)
31% (1341)
28.2% (1220)
24.5% (1062)
47.3% (2045)
Source: Statistics Canada and AAFC, 2007 Farm Financial Survey.
Chart C4.38
Less than $20,000
$20,000 to $35,000
Greater than $35,000
Financial Stress Levels of Hog Farms in Canada, 2006
10.4% (451)
66.4% (2872)
100% (4327)
All Cash Flow
All Equity
23.2% (1004)
Equity in Percentage
Cash Flow Categories
Legend: Significant risk. Moderate risk.
The financial stress of farms also varies by farm type
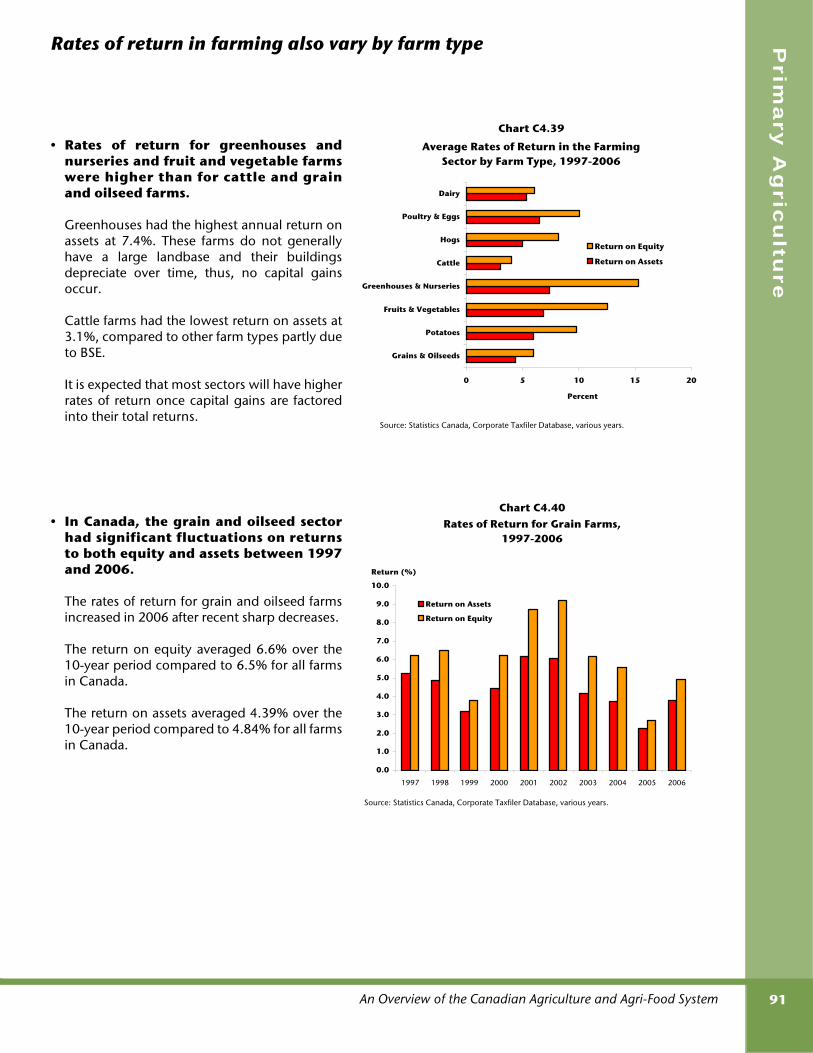
An Overview of the Canadian Agriculture and Agri-Food System 91
Prim
ary
Ag
ricu
lture
• Rates of return for greenhouses andnurseries and fruit and vegetable farmswere higher than for cattle and grainand oilseed farms.
Greenhouses had the highest annual return onassets at 7.4%. These farms do not generallyhave a large landbase and their buildingsdepreciate over time, thus, no capital gainsoccur.
Cattle farms had the lowest return on assets at3.1%, compared to other farm types partly dueto BSE.
It is expected that most sectors will have higherrates of return once capital gains are factoredinto their total returns.
• In Canada, the grain and oilseed sectorhad significant fluctuations on returnsto both equity and assets between 1997and 2006.
The rates of return for grain and oilseed farmsincreased in 2006 after recent sharp decreases.
The return on equity averaged 6.6% over the10-year period compared to 6.5% for all farmsin Canada.
The return on assets averaged 4.39% over the10-year period compared to 4.84% for all farmsin Canada.
Source: Statistics Canada, Corporate Taxfiler Database, various years.
Chart C4.40Rates of Return for Grain Farms,
1997-2006
0.0
1.0
2.0
3.0
4.0
5.0
6.0
7.0
8.0
9.0
10.0
1997 1998 1999 2000 2001 2002 2003 2004 2005 2006
Return (%)
Return on Assets
Return on Equity
Source: Statistics Canada, Corporate Taxfiler Database, various years.
Chart C4.39
Average Rates of Return in the Farming Sector by Farm Type, 1997-2006
0 5 10 15 20
Grains & Oilseeds
Potatoes
Fruits & Vegetables
Greenhouses & Nurseries
Cattle
Hogs
Poultry & Eggs
Dairy
Percent
Return on Equity
Return on Assets
Rates of return in farming also vary by farm type

An Overview of the Canadian Agriculture and Agri-Food System92
Se
cti
on
C4
• The hog sector also had significantfluctuations in returns.
In 2006, return on assets and return on equitydecreased significantly for incorporated hogfarms. In 2006, rates fell as hog farms becameless competitive with the appreciation of theCanadian dollar and the increase in feed prices.
The return on equity in the hog sector averaged8.23% over the 10-year period, compared to6.5% for all farms in Canada.
The return on assets in the hog sector averaged4.99% over the 10-year period, compared to4.84% for all farms in Canada.
Source: Statistics Canada, Corporate Taxfiler Database.
Chart C4.41
Rates of Return for Hog Farms,1997-2006
0.0
2.0
4.0
6.0
8.0
10.0
12.0
14.0
16.0
1997 1998 1999 2000 2001 2002 2003 2004 2005 2006
Return (%)
Return on Assets
Return on Equity
Rates of return on asset and on equity are calculated for incorporated farms with $50,000 or more inrevenue or $50,000 or more in assets.
Rates of return in farming also vary by farm type

93
S E C T I O N C 5A g r i c u l t u r a l I n p u t
a n d S e r v i c e S u p p l i e r s
Canadian consumers are typical of consumers in developed economies. On average they have high standards of living and allocate a relatively small percentage of their total personal disposable income to food. In fact for the average Canadian, the food expenditure share is declining due to weak food price inflation.
Input and service suppliers, ranging from multinational firms and commodity brokers to small localbusinesses, play a major role in the Canadian agriculture and agri-food system. Higher fuel prices andincreasing demand have contributed to rising input prices globally with significant implications foroperating expenses. In order to reduce operating expenses many producers purchase inputs through co-operatives, purchase inputs during off-season periods, or adopt energy-efficient practices.

An Overview of the Canadian Agriculture and Agri-Food System94
Se
cti
on
C5
• Agriculture-specific input and service suppliers constitute a whole value chain within theagriculture and agri-food system. They include input manufacturers, service providers, andretailers/wholesalers. They supply and support primary agriculture, and at the same time act as buyers ofproducts from downstream industries (e.g. prepared animal feed from grain and oilseed mills or feeder calvesfrom cow-calf operations).
Agriculture-specific input and service suppliers are heterogeneous. They range from multinational firmsproducing agricultural machinery and implements to small local businesses selling feed and pesticides, andfrom international commodity brokers to the next-door neighbour doing custom work.
Source: AAFC.
Chart C5.1
The Value Chain of Agriculture-Specific Input and Service Suppliers
Preparedanimal feed
Live animals,grains &oilseeds
Imports
Agricultural Input
Wholesalers/ Retailers
Agriculture-Specific Input Manufacturing
Wholesale Agents
& Brokers
Agriculture-SpecificServices
AgriculturalProduction
Non-Agriculture Specific Input
Manufacturing
Food and Beverage Production
Artificial insemination,veterinarian, crop spraying
Fertilizers,pesticides,agriculturalimplements
Exports
Energy
Input suppliers are a whole value chain
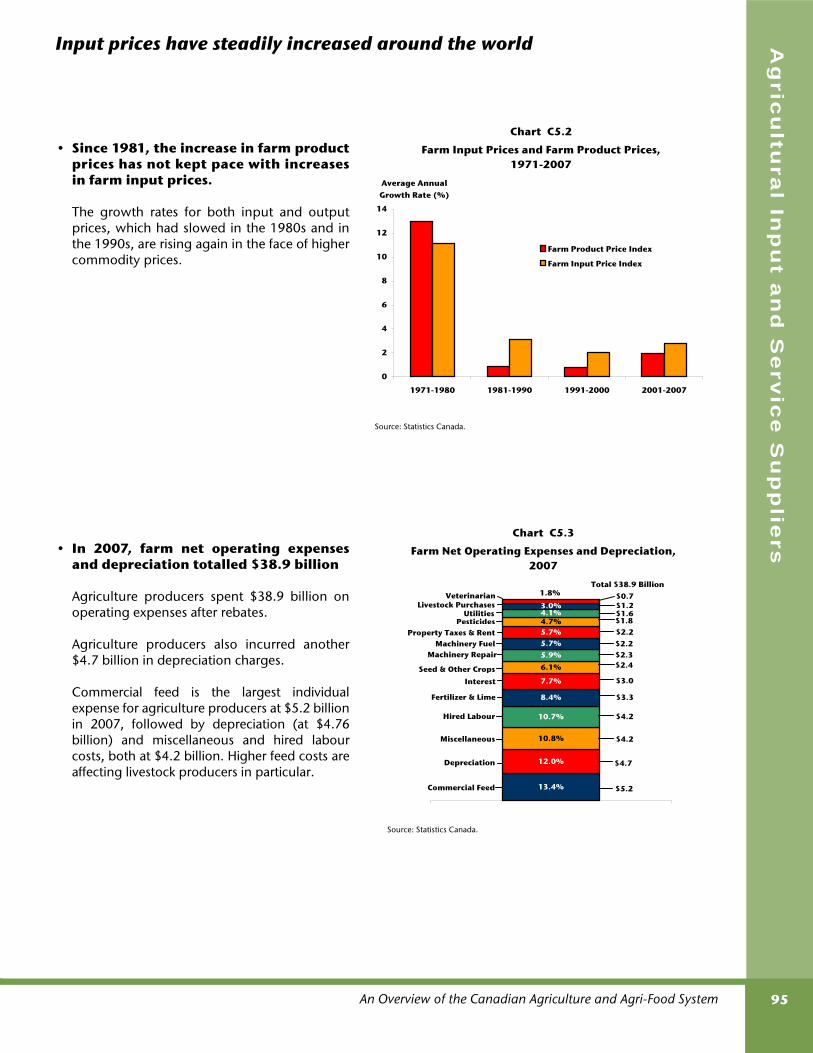
An Overview of the Canadian Agriculture and Agri-Food System 95
Ag
ricu
ltura
l Inp
ut a
nd
Se
rvic
e S
up
plie
rs
• Since 1981, the increase in farm productprices has not kept pace with increasesin farm input prices.
The growth rates for both input and outputprices, which had slowed in the 1980s and inthe 1990s, are rising again in the face of highercommodity prices.
• In 2007, farm net operating expensesand depreciation totalled $38.9 billion
Agriculture producers spent $38.9 billion onoperating expenses after rebates.
Agriculture producers also incurred another$4.7 billion in depreciation charges.
Commercial feed is the largest individualexpense for agriculture producers at $5.2 billionin 2007, followed by depreciation (at $4.76billion) and miscellaneous and hired labourcosts, both at $4.2 billion. Higher feed costs areaffecting livestock producers in particular.
Source: Statistics Canada.
Chart C5.2
Farm Input Prices and Farm Product Prices, 1971-2007
0
2
4
6
8
10
12
14
1971-1980 1981-1990 1991-2000 2001-2007
Farm Product Price Index
Farm Input Price Index
Average Annual Growth Rate (%)
Source: Statistics Canada.
Chart C5.3
Farm Net Operating Expenses and Depreciation, 2007
13.4%
12.0%
10.8%
10.7%
8.4%
7.7%
6.1%
5.9%5.7%5.7%4.7%4.1%3.0%
1.8%
Depreciation
Miscellaneous
Hired Labour
Interest
Machinery Repair
Fertilizer & Lime
Seed & Other Crops
Property Taxes & RentMachinery Fuel
Pesticides
Livestock PurchasesUtilities
Veterinarian
$5.2
$4.7
$4.2
$4.2
$3.3
$3.0
$2.4$2.3$2.2$2.2$1.8$1.6$1.2$0.7
Total $38.9 Billion
Commercial Feed
Input prices have steadily increased around the world

An Overview of the Canadian Agriculture and Agri-Food System96
Se
cti
on
C5
• Fertilizer and pesticide consumption hasbeen steadily growing over time. As aresult, agricultural yields continue toincrease. However, with higher pricesfor fertilizer and concerns about theenvironmental impact of their use,chemical input usage stabilized in 2007.
• Fuel prices are a particularly-importantc on tr i b u to r to t he h i g h er c os ts ofproduction.
Farm expenses on machinery fuel have risensignificantly since 2004 due to increases in fuelprices.
Source: Statistics Canada.
Chart C5.5
Farm Expenses on Machinery Fuel, 1980-2007
0.0
0.5
1.0
1.5
2.0
2.5
1980 1983 1986 1989 1992 1995 1998 2001 2004 2007
Billion $
Source: Statistics Canada and AAFC calculations.
Chart C5.4Chemical Input Usage in Farming, 1971-2007
0.0
0.2
0.4
0.6
0.8
1.0
1.2
1.4
1.6
1.8
1971 1977 1983 1989 1995 2001 2007
Fertilizers
Pesticides
Billion 1992 $
Chemical input usage has been increasing, although higher prices andenvironmental concerns have recently dampened their use

An Overview of the Canadian Agriculture and Agri-Food System 97
Ag
ricu
ltura
l Inp
ut a
nd
Se
rvic
e S
up
plie
rs
• Co-operatives of farm supplies arebusinesses owned by farmers, whichstr ive to provide high qual ity,affordable farm supplies to farmers.
The surplus generated by these co-operatives isre turned to fa rmer members , therebycontributing to farm incomes.
• The market share of co-operative sales offarm petroleum rose between 1986 and2005, primarily due to expanded operations inWestern Canada.
However, there was a significant declinein co-operatives’ market share infertilizer and chemical sales between2001 and 2005. A contributing factor wasthe demutualization of Agricore Co-operativein 2001 and Saskatchewan Wheat Pool in 2005,which had previously sold significant quantitiesof fertilizer and chemicals.
• Total co-operative supply sales in 2005were $3.8 billion, an increase from $3.4billion in 2004.
Co-operatives sell a wide range of supplies fromfertilizer and chemicals to feed, farm machinery,farm supplies (such as water bowls andwheelbarrows) and non-farm supplies (such ashome garden seeds and clothing).
1986 1991 1996 2001
31 36 35 38
22 29 27 41
23 17 17 8
26 25 17 15
Source: Co-operatives Secretariat, AAFC and Statistics Canada.
Market Shares of Co-operatives in Farm Supplies, 1986-2005
2005
Chart C5.6
Fertilizer & Chemicals
% of Farm Expenditures
14Feed
Farm Petroleum
Seed
52
8
13
Source: Co-operatives Secretariat, AAFC.
Note: Excludes wholesaler sales.
Chart C5.7Co-operative Supply Sales, 2005
Seed2.4%Other Supplies
3.9%
Machinery3.2%
Farm Supplies10.2%
Feed13.6%Farm
Petroleum36.7%
Fertilizer & Chemicals
30.0%
Producers purchase a significant proportion of their inputs throughco-operatives


99
S E C T I O N C 6N a t u r a l R e s o u r c e U s e
a n d E n v i r o n m e n t a lI m p a c t s
Canadian consumers are typical of consumers in developed economies. On average they have high standards of living and allocate a relatively small percentage of their total personal disposable income to food. In fact for the average Canadian, the food expenditure share is declining due to weak food price inflation.
Agricultural production depends on the availability and quality of land and water. Cropping choices,farming practices, and input use patterns will vary in response to market conditions, as well as variousenvironmental factors. Environmental effects of agriculture will vary in similar ways, partly because ofvariations in crop choice and cultivation methods and partly because of regionally-specificenvironmental conditions.

An Overview of the Canadian Agriculture and Agri-Food System100
Se
cti
on
C6
• There has been an expansion ofagricultural production worldwide since1961, with the area of arable land andpermanent cropland increasing from1.37 to 1.57 billion hectares.
During the same period, Canada's arable landand permanent cropland area remainedrelatively constant at 52 million hectares.
• Canada ranks second in the world forthe availability of arable land perperson.
This relative abundance underpins our status asa large net exporter of agricultural products.
Source: Food and Agriculture Organization of the United Nations (FAO).
http://faostat.fao.org
Chart C6.1World Arable Land and Permanent
Cropland1, 1961-2005
1,250
1,300
1,350
1,400
1,450
1,500
1,550
1,600
1961 1965 1969 1973 1977 1981 1985 1989 1993 1997 2001 2005
Million Hectares
1 See Glossary.
('000 ha) ('000 people)
Australia 49,742 3.2 20,000 2.49 1
Canada 52,110 3.3 32,000 1.63 2
Russia 123,581 7.9 143,000 0.86 3
Ukraine 33,353 2.1 47,000 0.71 4
U.S. 177,178 11.3 296,000 0.60 5
Brazil 66,600 4.3 184,000 0.36 6
Nigeria 35,000 2.2 134,000 0.26 7
Indonesia 36,600 2.3 220,000 0.17 8
India 169,650 10.9 1,102,000 0.15 9
China 156,327 10.0 1,304,000 0.12 10
Sources: United Nations, Demographic Yearbook 2005.
Food and Agriculture Organization of the United Nations (FAO).
http://faostat.fao.org
ha/person Rank
Chart C6.2
Arable Land in Canada Relative to Other Countries, 2005
Population% of world arable land
Arable land
Canada is endowed with a relative abundance of arable land

An Overview of the Canadian Agriculture and Agri-Food System 101
Na
tura
l Re
so
urc
e U
se
an
d E
nv
iron
me
nta
l Imp
ac
ts
• In 2001, only 5% of total land was usedfor agriculture.
• In 2006, about 60% of Canada’sagricultural land was used for crops.Pastures represent about 30 % ofagricultural land use.
Source: Natural Resources Canada, Canada's Forest Inventory.
Chart C6.3
Share of Agricultural Land and Land in Forest to Total Land, 2001
Agricultural 4.9%
Forest 35.2%
Other 59.9%
Source: Census of Agriculture 2006.
Chart C6.4Canadian Agricultural Land Use, 2006
Other Land10%
Native Pasture23%
Tame Pasture8%
Land in Crops59%
Canada's land suitable for agricultural production is relatively small, eventhough we are the world’s largest country

An Overview of the Canadian Agriculture and Agri-Food System102
Se
cti
on
C6
• The Food and Agriculture Organization(FAO) of the U nited Nations hasdeveloped an index that reflects thewater resources theoretically availablefor development from all sources. Theindex is called, Total Actual RenewableWater Resources (TARWR).
According to this index, there are more than 55thousand cubic kilometers of TARWR per yearon the earth. Brazil, Russia, the U.S., andCanada together possess almost 34% of theglobal TARWR. China and India, each having apopulation exceeding a billion, possess just 5%and 3% of the global TARWR, respectively.
• On average, between 1998 and 2002,only about 7% of TARWR/year waswithdrawn.
India, China, and the U.S. accounted for almosthalf of the world’s water withdrawals. Globally,about 70% of water withdrawals are foragriculture.
• Water withdrawal for agricultureamounted to more than two-thirds oftotal water withdrawal in Indonesia,India, Australia, Mexico, Argentina,Brazil, and China.
In contrast, only about 12% of the waterwithdrawal in Canada was used for agriculture,while industrial use amounted to 69%.
Source: Calculated from AQUASTAT database of Food and Agriculture Organization (FAO).
Chart C6.6
Share of Selected Countries in World Water Withdrawal, 1998-2002 Average
Rest of the World 42.8%
Indonesia2.2%
India16.9%
China16.5%
U.S.12.6%
Pakistan4.4%Japan
2.3%Thailand
2.3%
Chart C6.5
Share of Major Countries in Global Renewable Water Resources, 1998-2002
Average
Source: Calculated from AQUASTAT database of the Food and Agriculture Organization (FAO).
Argentina1.5%
Brazil14.9%
Australia0.9%
Canada5.3%
China5.1%
U.S.5.5%
India3.4%
Indonesia5.1%
Russia8.2%
Rest of the World50.1%
Chart C6.7
Agricultural Water Withdrawal as a Percentage of Total Water Withdrawal in Selected Countries, 1998-2002 Average
Source: Calculated from AQUASTAT database of the Food and Agriculture Organization (FAO).
0
20
40
60
80
100
Indonesia
India
Mexico
Austra
lia
Argentin
a
China
Brazil
New Zeala
ndU.S
.
Germany
Russia
Canada
France
Percent
Fresh water from renewable sources is unevenly distributed worldwide, andin most countries agriculture is a major user of this resource

An Overview of the Canadian Agriculture and Agri-Food System 103
Na
tura
l Re
so
urc
e U
se
an
d E
nv
iron
me
nta
l Imp
ac
ts
• In Canada, only 0.18% of the country'stotal renewable water resources wereused for agriculture, whereas in Indiaabout 30% of total renewable waterresources were for agricultural use.
Mexico and China also used a high proportionof their renewable water resources foragriculture.
• In 2006, total water use by the Canadianag ricultural sector amounted toapproximately 4.6 billion cubic metres,an increase of 25% over 2001.
Water needed to irrigate crops is by far the mostimportant type of usage followed by livestockuse. These two types of water usage make upclose to 99% of the Canadian agriculturalsector’s total water use.
Although still a small share of total agriculturalwater use, water quantity used in greenhousesincreased by more than 21% between 2001and 2006.
Source: Calculated from AQUASTAT database of the Food and Agriculture Organization (FAO).
Chart C6.8
Agricultural Water Withdrawal as a Percentage of Total Renewable Resources in
Selected Countries, 1998-2002 Average
0
5
10
15
20
25
30
35
India
Mexico
China
U.S.
Germany
Australia
Indonesia
Argentin
a
France
Brazil
Russia
New Zealand
Canada
Percent
Source: AAFC calculations using the Canadian Regional Agriculture
Water Use Model (CRAWUM).
Chart C6.9
Distribution of Total Agricultural Water Use in Canada, by Type, 2006
Livestock, 20.74%
Crop Spraying,
0.15%
Greenhouses, 1.18%
Irrigation, 77.93%
In Canada, agriculture uses a relatively small share of its abundantrenewable water resources, mostly for irrigation and livestock

An Overview of the Canadian Agriculture and Agri-Food System104
Se
cti
on
C6
• In 2006, Alberta, with its large livestockindustr y and moisture def ic i t ,accounted for 60% of total Canadianag ricultural water use, whi lehorticultural crop production madeBritish Columbia the second mostimportant agricultural water user in thecountry.
Total agricultural water use fell in the Atlanticprovinces and Quebec, mostly due to a smalldecrease in livestock production.
Expansion of greenhouses, irrigated areas andlivestock production between 2001 and 2006,led to increased water use by the agriculturalsector in the Western provinces and Ontario.
• In 2005, Canada had about 845thousand hect ares of i rr ig atedcropland, representing a small increasesince 2000.
In many regions, irrigation is not used on aconsistent basis, but only when rainfall isinsufficient.
Alberta is the province with the largest irrigatedarea, accounting for 63% of the national total,followed by British Columbia at 14%.
Between 2000 and 2005, a notable increase inirrigated areas occurred in Prince EdwardIsland, Ontario and Alberta.
Source: AAFC calculations using the Canadian Regional Agriculture
Water Use Model (CRAWUM).
Chart C6.10
Agricultural Total Water Use by Province, 2001 and 2006
0 500 1,000 1,500 2,000 2,500 3,000
B.C.
Alta.
Sask.
Man.
Ont.
Que.
Million Cubic Metres
2006
2001
Thousand Cubic Metres
1,733
7,964
10,921
17,750
1,071
13,152
6,954
8,680
N.L.
P.E.I.
N.S.
N.B.
Source: Census of Agriculture, 2006.
Chart C6.11
Irrigated Areas by Province, 2000 and 2005
0
100
200
300
400
500
600
B.C. Alta. Sask. Man. Ont. Que.
Thousand Hectares
2000
2005
1,144
1,7713,491
739
859
3,217
140N.L.
N.S.
Hectares
188
Water use by agriculture is more important in moisture-deficit areas, wherefruits and vegetables are produced, and where livestock is concentrated

An Overview of the Canadian Agriculture and Agri-Food System 105
Na
tura
l Re
so
urc
e U
se
an
d E
nv
iron
me
nta
l Imp
ac
ts
• Land allocated to crops has declinedbetween 2001 and 2006 in all provinceswith the exception of Quebec andNewfoundland.
In contrast, land allocated to cover crops suchas hay and alfalfa has seen an increase in everyprovince with the exception of BritishColumbia, Alberta and Newfoundland. Therehas been an important shift towards seededpasture in the Western provinces, while in theEast the trend has been the opposite.
• No-till practices are becoming morepopular as they can reduce fuel andfertilizer costs while helping conservesoils.
With the exception of Newfoundland, no-tillpractices increased while conventional tillagedecreased in all provinces. In 2006, about 70%of cropland was cultivated using no-till ormoderate tillage.
B.C. -10,1% -30,4% -2,3% 5,5% 24,2%
Alta. -0,4% -26,7% -3,2% 11,3% -2,2%
Sask. -7,1% -22,4% 37,4% 39,6% 1,0%
Man. -2,1% -50,5% 7,6% 29,9% -2,0%
Ont. -0,7% - - - 2,3% -3,1% -15,3%
Que. 0,9% - - - 9,4% -19,4% -14,7%
N.B. -2,6% - - - 6,2% -6,6% -7,1%
N.S. -7,0% - - - 0,7% 2,2% -3,6%
P.E.I. -8,4% - - - 9,8% -8,5% -4,7%
N.L. 47,4% - - - -1,5% -8,0% 45,1%
Source: Census of Agriculture, 2006
Chart C6.12
Percentage Change in Acreage Between 2001 and 2006
Land Use Change by Province, 2001 and 2006
Cropland Summerfallow HaylandSeeded Pasture
Native Pasture
Source: Census of Agriculture, 2006.
Chart C6.13
Tillage Practices by Region, 2001 and 2006
0%
20%
40%
60%
80%
100%
2001 2006 2001 2006 2001 2006 2001 2006 2001 2006
B.C. Prairies Ont. Que Atlantic
Conventional Tillage Moderate Tillage No Tillage
In response to market conditions as well as to better conserve soils,Canadian farmers are changing the way they use and till their land

An Overview of the Canadian Agriculture and Agri-Food System106
Se
cti
on
C6
• The combined risk of erosion from wind,water, and t i l lag e has decreasedsubstantively, especially over the last 15years.
Currently, only about 10% of all cropland areais subject to moderate to very high erosion risk.The reduction in erosion risk is the result of ageneral decrease in tillage intensity, summer-fallow use, and area of annual crops on thehighly erodible land. The majority of area withthe highest erosion risk is currently the moresloping lands in Central and Eastern Canada.
Source: McConkey, B.G., Lobb, D.A., Li, S., and Black, J.M.W. (forthcoming) 2009.
Chart C6.14
Breakdown of Total Cropland Area by Erosion Risk Classes, 1981-2006
0
10
20
30
40
50
60
70
80
90
100
1981 1986 1991 1996 2001 2006
Percent
Very Low Low Moderate High to Very HighErosion Risk Class
More cover crops and pastures combined with less intensive tillage practiceshelp reduce soil erosion

An Overview of the Canadian Agriculture and Agri-Food System 107
Na
tura
l Re
so
urc
e U
se
an
d E
nv
iron
me
nta
l Imp
ac
ts
• Quebec, Ontario and Alberta have thehighest concentration of pigs, beef anddairy cows.
Between 2001 and 2006, the number of pigshas been increasing in the Prairie provinces aswell as in Ontario.
In the same period, the beef herd grew in allprovinces except British Columbia, Alberta andNova Scotia.
British Columbia, Manitoba and Newfoundlandwere the only provinces which saw an increasein the size of their dairy herds.
• Between 2001 and 2005, Canadianf armers have been applying lessnitrog en to their crops with theexception of the Atlantic provinces,where nitrogen application to landincreased by more than 40%.
As a consequence, total nutrient content toland ratio decreased in most provinces,especially in Ontario and Quebec, butincreased in the Atlantic provinces.
Sources: Census of Agriculture, 2006.
Canadian Fertilizer Institute.
Chart C6.16
Nutrient Content to Fertilized Area by Province, 2000 and 2005
0
50
100
150
200
250
300
20
00
20
05
20
00
20
05
20
00
20
05
20
00
20
05
20
00
20
05
20
00
20
05
20
00
20
05
B.C. Alta. Sask. Man. Ont. Que. Atlantic
Nutrient Content to
Area (kg / ha)
Potassium (K)
Phosphorous (P)
Nitrogen (N)
Source: Census of Agriculture, 2006.
Chart C6.15
Livestock Numbers by Province, 2001 and 2006
0
1
2
3
4
5
6
7
8
9
10
2001 2006 2001 2006 2001 2006 2001 2006 2001 2006 2001 2006
B.C. Alta. Sask. Man. Ont. Que.
Million Heads
Pigs Beef Cows Dairy Cows
20012006200120062001200620012006
N.L
.N
.S.P
.E.I
.N.B
.
Thousand Heads
9.0175.4
143.0154.0
152.4
148.3176.4
8.1
Canadian farmers have been raising more animals and applying lessfertilizer to their land in recent years

An Overview of the Canadian Agriculture and Agri-Food System108
Se
cti
on
C6
• From 1981 to 2006, there has been anoverall increase in both nitrate-nitrogenconcentrat ions and over-winternitrogen losses.
In 2006, the estimated nitrate losses fromagricultural soils in the Atlantic provinces,(from 33.8 to 40 kg N/ha), were greater than inQuebec (22.9 kg N/ha) and Ontario (14.7 kg N/ha), whereas the Prairie provinces (0.2 to 0.3 kgN/ha) had the lowest losses.
Manitoba (11.6 mg N/L), Quebec (11.7 mg N/L), New Brunswick (14.2 mg N/L), Nova Scotia(11.4 mg N/L) and Prince Edward Island(11.6 mg N/L) all had estimated nitrate concen-trations above the drinking water guidelines of10 mg N/L in 2006.
Increases in fertilizer use, livestock numbers,and legume crop acreage are some of thefactors that contributed to the increase in thelosses and concentrations.
• Between 2001 and 2006, greenhousegas emissions from primary agriculturerose by 4% to reach 60.8 million tonnesof CO2 equivalent.
The main contributor was livestock production,which accounted for about 60% of this total onaverage. On a provincial basis, emissions arehigher where animals are concentrated buthave been relatively stable over time, with theexception of Saskatchewan and Manitobawhere there has been an expansion of hog andbeef production since 2001.
Source: De Jong, R., Drury, C.F., and Yang, J.Y. (forthcoming) 2009.
Chart C6.17Estimated National Over-Winter Nitrogen
Losses and Nitrate-Nitrogen Concentrations in Drainage Water,
1981-2006
0
1
2
3
4
5
6
1981 1986 1991 1996 2001 2006
N lost (kg N/ha)N conc. (mg N/L)
N Losses
N Concentrations
Source: Environment Canada. 2008. National Inventory Report: Greenhouse Gas Sources
and Sinks in Canada 1990–2006.
Chart C6.18
GHG Emission Levels, 2001 and 2006, by Sector and Province
0
5
10
15
20
25
2001 2006 2001 2006 2001 2006 2001 2006 2001 2006 2001 2006
B.C. Alta. Sask. Man. Ont. Que.
Million Tonnes C02eq
Crops Livestock
20012006200120062001200620012006
N.B
.P.E
.I.N
.S.
N.L
.Thousand Tonnes C02eq
Nutrients from manure and fertilizer application can impact water and airquality

S E C T I O N DGovernment
and the Agricultureand Agri-Food Sector


S E C T I O N D 1Government
Expenditures
Government expenditures in support of the agriculture and agri-food sector rose to record levels in2007-08. As a share of sector GDP, government expenditures rose slightly to 40%. Program paymentsmade up the largest portion of government expenditures to the sector.

An Overview of the Canadian Agriculture and Agri-Food System112
Se
cti
on
D1
• Federal and provincial governmentsprovide a significant level of support tothe agriculture and agri-food sector inCanada with an increased trend since1998-99.
Total government expenditures in support ofthe agriculture and agri-food sector wereestimated to be $8.1 billion for the 2007-08fiscal year. This is the third-largest level ofgovernment support recorded for the sector inCanada.
• Government expenditures in support ofthe agriculture and agri-food sectorhave grown over the last year, butdeclined as a share of GDP.
During the 1990s, government expenditures indollar terms and as a share of agriculture andagri-food GDP were declining. Starting in 1999-2000, both increased, but at different rates.More recently, government expenditures havecontinued to increase in dollar terms, but havedeclined as a share of agriculture and agri-foodGDP.
Source: AAFC.
Note: 2007-08 figures are forecasts.
Chart D1.1Government Expenditures in Support of the Agriculture and Agri-Food Sector, 1985-86
to 2007-08 Fiscal Years
0
2
4
6
8
10
1985-86 1988-89 1991-92 1994-95 1997-98 2000-01 2003-04 2006-07
Fiscal Years
Billion $
Provincial
Federal
Source: AAFC.
Note: 2007-08 figures are forecasts.
Chart D1.2
Government Expenditures in Support of the Agriculture and Agri-Food Sector, as a Share
of GDP, 1985-86 to 2007-08
0
1
2
3
4
5
6
7
8
9
10
1985-86 1990-91 1995-96 2000-01 2005-06
Billion $
Fiscal Years
0
10
20
30
40
50
60
70
80
90
Percentage
Total GE ($)
GE/GDP (%)
Government expenditures in support of the agriculture and agri-foodsector have grown over time but have declined as a share of GDP

An Overview of the Canadian Agriculture and Agri-Food System 113
Go
ve
rnm
en
t Ex
pe
nd
iture
s
• Although the federal governmentcontributes a larger share of totalsupport in most provinces, there arevariations across provinces. Provincialgovernments in Quebec, Nova Scotia, andNewfoundland and Labrador provided a largershare of total support in the 2007-08 fiscal yearin the provinces.
• In the 2007-08 fiscal year, totalgovernment expenditures in support ofthe agriculture and agri-food sector inCanada were estimated at 36.3% ofagriculture and agri-food sector GDP,but there are var iat ions acrossprovinces.
The agriculture and agri-food sector in PrinceEdward Island, Quebec, Saskatchewan andManitoba received the most governmentsupport (when expressed as a share ofagriculture and agri-food GDP), while NewBrunswick and British Columbia received thelowest support.
Source: AAFC.
Note: 2007-08 figures are forecasts.
Chart D1.3Government Expenditures in Support of the
Agriculture and Agri-Food Sector by Province, 2007-08 Fiscal Year
0.0
0.5
1.0
1.5
2.0
2.5
N.L. P.E.I. N.S. N.B. Que. Ont. Man. Sask. Alta. B.C.
Government Expenditures
(Billion $)
Provincial
Federal
Source: AAFC.
Note: 2007-08 figures are forecasts.
Chart D1.4Government Expenditures in the Agriculture
and Agri-Food Sector as a Share of Sector GDP by Province,
2007-08 Fiscal Year
0
10
20
30
40
50
60
N.L. P.E.I. N.S. N.B. Que. Ont. Man. Sask. Alta. B.C.
Agriculture & Agri-Food GDP
(%) Provincial
Federal
Government expenditures in support of the agriculture and agri-foodsector vary by province
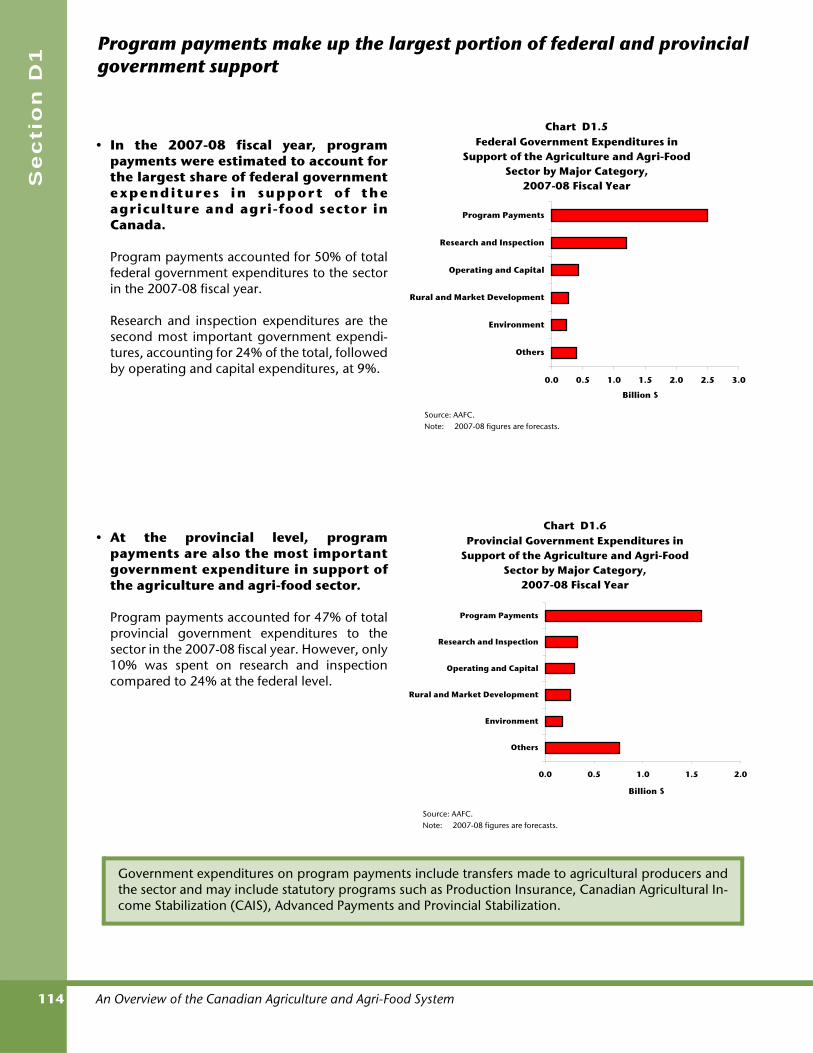
An Overview of the Canadian Agriculture and Agri-Food System114
Se
cti
on
D1
• In the 2007-08 fiscal year, programpayments were estimated to account forthe largest share of federal governmente xpenditures in suppor t of theagriculture and agri-food sector inCanada.
Program payments accounted for 50% of totalfederal government expenditures to the sectorin the 2007-08 fiscal year.
Research and inspection expenditures are thesecond most important government expendi-tures, accounting for 24% of the total, followedby operating and capital expenditures, at 9%.
• At the provincial level, programpayments are also the most importantgovernment expenditure in support ofthe agriculture and agri-food sector.
Program payments accounted for 47% of totalprovincial government expenditures to thesector in the 2007-08 fiscal year. However, only10% was spent on research and inspectioncompared to 24% at the federal level.
Source: AAFC.Note: 2007-08 figures are forecasts.
Chart D1.5Federal Government Expenditures in
Support of the Agriculture and Agri-Food Sector by Major Category,
2007-08 Fiscal Year
0.0 0.5 1.0 1.5 2.0 2.5 3.0
Others
Environment
Rural and Market Development
Operating and Capital
Research and Inspection
Program Payments
Billion $
Source: AAFC.Note: 2007-08 figures are forecasts.
Chart D1.6Provincial Government Expenditures in
Support of the Agriculture and Agri-Food Sector by Major Category,
2007-08 Fiscal Year
0.0 0.5 1.0 1.5 2.0
Others
Environment
Rural and Market Development
Operating and Capital
Research and Inspection
Program Payments
Billion $
Government expenditures on program payments include transfers made to agricultural producers andthe sector and may include statutory programs such as Production Insurance, Canadian Agricultural In-come Stabilization (CAIS), Advanced Payments and Provincial Stabilization.
Program payments make up the largest portion of federal and provincialgovernment support

An Overview of the Canadian Agriculture and Agri-Food System 115
Go
ve
rnm
en
t Ex
pe
nd
iture
s
• There is an increased trend in totalpublicly-funded research expendituresfor the agriculture and agri-food sectorover the last decade with a peak of $507million in the 2005-06 fiscal year.
In Canada, publicly-funded research expendi-tures in agriculture are funded predominantlyby the federal government. On average, federalexpenditures have accounted for 71% of totalpublic expenditures over the past ten years(1998-99 to 2007-08).
Source: AAFC.
Note: 2007-08 figures are forecasts.
Chart D1.7Government Research Expenditures on
Agriculture and Agri-Food, 1990-1991 to 2007-2008 Fiscal Years
0,0
0,1
0,2
0,3
0,4
0,5
0,6
1990-91 1994-95 1998-99 2002-03 2006-07
Fiscal Years
Billion $
Federal
Provincial
Public research expenditures in agriculture and agri-food are importantinvestments for the future growth of the sector

An Overview of the Canadian Agriculture and Agri-Food System116
Se
cti
on
D1
• Foregone tax revenue (tax expendi-tures) is a source of government supportto the agriculture and agri-food sector.From 1990-91 to 2007-08, tax expendi-tures represented 7.3% of total govern-ment support.
In fiscal year 2007-08, provincial taxexemptions and rebates associated withprimary agriculture were estimated at $506million. Tax expenditures have been increasingsince 2002-03.
• The stock of total public infrastructurehas increased substantially since 1961.The last decade has seen unprecedentedgrowth, at an average annual rate of nearly6%. This contrasts with the previous decade,where growth averaged only 1% per year.
The stock of total public infrastructure includesbuildings, roads, sewers and all other fixedcapital owned by federal, provincial, territorialand municipal governments. Research hasshown that growth in the stock of publicinfrastructure has been an importantcontributor to productivity growth in the foodand beverage processing industries.
Source: Statistics Canada.
Chart D1.9
The Stock of Public Infrastructure in Canada, 1961-2007
0
5
10
15
20
25
30
1961 1965 1969 1973 1977 1981 1985 1989 1993 1997 2001 2005
Billion 2002 $
Source: AAFC.
Note: 2007-08 figures are forecasts.
Chart D1.8
Support to Farm Producers Through Tax Rebates and Exemptions,
1991-92 to 2007-08 Fiscal Years
0
100
200
300
400
500
600
1991-92 1995-96 1999-00 2003-04 2007-08
Million $
0
2
4
6
8
10
12
14
Fiscal Year
PercentTotal TaxExpenditures
% of GE
Governments also use favourable tax measures to support the agricultureand agri-food sector

An Overview of the Canadian Agriculture and Agri-Food System 117
Go
ve
rnm
en
t Ex
pe
nd
iture
s
• The share of engineering infrastructureheld by provinces and municipalities haschanged significantly since the early1980s. Over 50% of the Canadian public stockof engineering infrastructure is held andmaintained by local governments. This has comeabout, in part, because provincial and federalgovernments have shifted responsibility forengineering capital to municipalities and otherlocal governments.
The most important elements of engineeringinfrastructure are roads, highways and sewersand sewage treatment facilities. Together,these have typically accounted for about 60%of all public infrastructure in Canada.
Source: AAFC calculations.
Chart D1.10
Engineering Infrastructure: Shares by Level of Government, 1961-2007
0
10
20
30
40
50
60
1961 1965 1969 1973 1977 1981 1985 1989 1993 1997 2001 2005
Percent
Federal
Provincial
Municipal
Public infrastructure investment is important for economic growth andproductivity growth in the agriculture and agri-food sector


S E C T I O N D 2Producer Support
Estimates (PSE)and Agricultural Policies
in Other Countries
Agricultural policies in Canada and other countries have evolved over time. Changes have been madenot only by decreasing the level of support, but also by modifying the type of support. Some countrieshave made significant reforms to their agricultural policies. The Organisation for Economic Co-operationand Development (OECD) indicators and the World Trade Organization (WTO) classification fordomestic support are used to present these policy changes.

An Overview of the Canadian Agriculture and Agri-Food System120
Se
cti
on
D2
• In 2007, the PSE for Canada was 18% ofgross farm receipts compared to 26%for the EU and 10% for the U.S.
In 2007, Canadian support to producersdeclined as it did in most OECD countries. Thisis because of an increase in value of gross farmreceipts and a decrease in market price support(MPS) due to higher world prices foragricultural commodities, except for the U.S.where MPS increased.
• Over time, Canada has moved towardsmore decoupled and less distortingforms of support.
Support to Canadian agricultural producersdropped from 36% of gross farm receipts in1986-88 to 21% in 2005-07.
The share of the single commodity transfers hasdecreased substantially in favour of moredecoupled and less distorting forms of support.In 2005-2007, it represents 55% of the total PSEcompared to 71% in 1986-88.
Nevertheless, single commodity transferscontinue to account for more than half ofproducers' support in Canada, close to theOECD average of 59%.
Source: OECD, Trade and Agriculture Directorate, Producer and
Consumer Support Estimates, OECD Database 1986-2007.
Chart D2.1
Percent of PSE, Selected Countries, 1986-2007
0
10
20
30
40
50
1986 1988 1990 1992 1994 1996 1998 2000 2002 2004 2006
Percent of Gross Farm Receipts Canada
EU
U.S.
Source: OECD, Agriculture Policies in OECD Countries: At a Glance 2008.
Chart D2.2
Composition of Support to Producers, Canada, 1986-1988 and 2005-2007
0
5
10
15
20
25
30
35
40
1986-1988 2005-2007
Other Transfers
Single Commodity Transfers
Percent of Gross Farm Receipts
In recent years, support to Canadian producers in percentage PSE has risenabove that of the U.S., but is still below the EU

An Overview of the Canadian Agriculture and Agri-Food System 121
Pro
du
ce
r Su
pp
ort E
stim
ate
s (P
SE
) an
d A
gric
ultu
ral P
olic
ies
• Between 1986-88 and 2005-07, the EUreduced its support to agriculturalproducers from 40% to 29% of grossfarm receipts.
In addition, single commodity transfers havedecreased substantially in favour of more de-coupled and less distorting forms of support. Itrepresents 48% of the total PSE in 2005-07,compared to 94% in 1986-88. Singlecommodity transfers account for less than halfof producers' support in the EU, and they willprobably continue to decrease as a result of the2003 Common Agricultural Policy reform andthe Health Check review.
• Between 1986-88 and 2005-07, the U.S.suppor t to agricultural producersdecreased from 22% to 12% of grossfarm receipts.
In addition, single commodity transfers havedecreased substantially in favour of moredecoupled and less distorting forms of support.They represent 36% of the total PSE in 2005-07,compared to 72% in 1986-88. Even thoughsingle commodity transfers have decreasedover time, they increased from 31% in 2006 to39% in 2007 because of increased MPS.
Source: OECD, Agriculture Policies in OECD Countries: At a Glance 2008.
Chart D2.4
Composition of Support to Producers, U.S., 1986-1988 and 2005-2007
0
5
10
15
20
25
1986-1988 2005-2007
Other Transfers
Single Commodity Transfers
Percent of Gross Farm Receipts
Source: OECD, Agriculture Policies in OECD Countries: At a Glance 2008.
Chart D2.3
Composition of Support to Producers, EU, 1986-1988 and 2005-2007
0
5
10
15
20
25
30
35
40
45
1986-1988 2005-2007
Other Transfers
Single Commodity Transfers
Gross Farm Receipts (%)
Developments in policy directions in other countries have moved towardreduced direct support in favour of more general support


Glossary

An Overview of the Canadian Agriculture and Agri-Food System
Glo
ss
ary
124
AAFC Agriculture and Agri-Food Canada BICO Bulk, Intermediate, and Consumer-OrientedBSE Bovine Spongiform EncephalopathyCAP Common Agricultural PolicyCAIS Canadian Agricultural Income Stabilization ProgramCANSIM Canadian Socio-economic Information Management System CCA Capital Cost AllowanceCERI Canadian Dollar Effective Exchange Rate Index CPI Consumer Price IndexCR4 Concentration RatioECE Eligible Capital PropertyEU European UnionFAO Food and Agriculture Organization of the United NationsFBT Food, Beverage and Tobacco FDI Foreign Direct InvestmentFFN Functional Foods and Nutraceuticals FPPI Farm Product Price IndexGDP Gross Domestic Product IFPRI International Food Policy Research InstituteMPS Market Price SupportNAFTA North American Free Trade AgreementNAICS North American Industrial Classification SystemNFI Net Farm IncomeNPD Group A global market research companyOECD Organisation for Economic Co-operation and DevelopmentPDI Personal Disposable IncomePSE Producer Support EstimatePST Provincial Sales TaxR&D Research and Development TARWR Total Actual Renewable Water ResourcesTFP Total Factor ProductivityUSDA United States Department of AgricultureUSDOE United States Department of EnergyWTO World Trade Organization
Acronyms

An Overview of the Canadian Agriculture and Agri-Food System
Glo
ss
ary
125
Agriculture and Agri-Food SectorThe agriculture and agri-food sector is composed of all industries whose primary role is to produce food andagricultural products. It encompasses both primary agriculture and food, beverage and tobacco (FBT)processors.
Canadian Agriculture and Agri-Food SystemThe Canadian agriculture and agri-food system is a value chain of industries focussed on producingagricultural and food products. It includes agricultural input and service suppliers, primary agriculture, food,beverage and tobacco processors, food retailers/wholesalers, and foodservice establishments.
Unless otherwise noted, component stages of the agriculture and agri-food system are defined according tothe North American Industrial Classification System (NAICS). The glossary contains a detailed listing ofincluded industries for each component stage of the system.
Agricultural Input & Service SuppliersAgricultural input and service suppliers are composed of the following industries as defined by NAICS:
At the 4-digit level1151 Support Activities for Crop Production1152 Support Activities for Animal Production3253 Pesticide, Fertilizer and Other Agricultural Chemical Manufacturing4171 Farm, Lawn and Garden Machinery and Equipment Wholesaler-Distributors4183 Agricultural Supplies Wholesaler-Distributors
At the 5-digit level33311 Agricultural Implement Manufacturing
Primary AgriculturePrimary agriculture is composed of the following industries as defined by NAICS:
At the 4-digit level1111 Grain and Oilseed Farming1112 Vegetable and Melon Farming1113 Fruit and Tree Nut Farming1114 Greenhouse, Nursery and Floriculture Production1119 Other Crop Farming1121 Cattle Ranching and Farming1122 Hog and Pig Farming1123 Poultry and Egg Production1124 Sheep and Goat Farming 1125 Animal Aquaculture1129 Other Animal Production
FBT Processors FBT processors are composed of the following industries as defined by NAICS:
At the 3-digit level311 Food Manufacturing312 Beverage and Tobacco Product Manufacturing
The System’s Components

An Overview of the Canadian Agriculture and Agri-Food System
Glo
ss
ary
126
Food Retailers/WholesalersFood retailers/wholesalers are composed of the following industries as defined by NAICS:
At the 3-digit level411 Farm Product Wholesaler-Distributors413 Food, Beverage and Tobacco Wholesaler-Distributors445 Food and Beverage Stores
At the 5-digit level41911 Farm Product Agents and Brokers41913 Food, Beverage and Tobacco Agents and Brokers44422 Nursery Stores and Garden Centres49312 Refrigerated Warehousing and Storage49313 Farm Product Warehousing and Storage
Foodservice Foodservice is composed of the following industries as defined by NAICS:
At the 3-digit level722 Food Services and Drinking Places
At the 4-digit level4542 Vending Machine Operators
Food Distribution SectorThe food distribution sector is composed of all industries whose primary role is to directly provide and servicethe final consumer with food and agricultural products. It encompasses food retailers/wholesalers andfoodservice establishments.
Commercial Foodservice Commercial foodservice includes full-service restaurants, limited-service restaurants, social and contractcaterers and taverns.
Full-Service Restaurants include licensed and unlicensed fine dining restaurants, familyrestaurants and restaurant bars.
Limited-Service Restaurants include cafeterias, fast-food restaurants, food courts, and take-outand delivery establishments.
Social Caterers provide foodservice for special events.
Contract Caterers supply foodservice to airlines, railways, institutions and at recreationalfacilities.
Taverns are establishments primarily engaged in serving alcoholic beverages for immediateconsumption, such as pubs, cocktail lounges and nightclubs.
The System’s Components (cont’d)
An Overview of the Canadian Agriculture and Agri-Food System
Glo
ss
ary
127
Food-Only ProcessorsFood-only processors refers to manufacturers of food where food is defined in the narrowest sense (i.e.excludes beverage and tobacco products).
Non-Food ProcessorsNon-food processors encompasses all industrial uses of farm products other than food or animal feedconsumption. It includes bioproducts manufacturers as well as the more traditional non-food industries suchas leather tanneries and textile mills.
Other and Non-Commercial FoodserviceOther foodservice includes accommodation, institutional, retail and other foodservice.
Accommodation Foodservice is foodservice offered by hotels, motels and resorts.
Institutional Foodservice is foodservice in hospitals, residential care facilities, schools, prisons,factories and offices.
Retail Foodservice is foodservice operated by department stores and convenience stores.
Other Foodservice includes vending machines, movie theatres, stadiums and other seasonal orentertainment operations.
The System’s Components (cont’d)

An Overview of the Canadian Agriculture and Agri-Food System
Glo
ss
ary
128
Non-financial industries are composed of the following industries, as defined by the North AmericanIndustry Classification System (NAICS).
11 Agriculture, Forestry, Fishing and Hunting211 Oil and Gas Extraction213 Support Activities for Mining22 Utilities23 Construction31-33 Manufacturing42 Wholesale Trade44-45 Retail Trade48-49 Transportation and Warehousing51 Information53 Real Estate and Rental and Leasing54 Professional, Scientific, and Technical Services56 Administrative and Support and Waste Management
and Remediation Services61 Educational Services62 Health Care and Social Assistance71 Arts, Entertainment, and Recreation72 Accommodation and Food Services811 Repair and Maintenance812 Personal and Laundry Services
Non-Financial Industries

An Overview of the Canadian Agriculture and Agri-Food System
Glo
ss
ary
129
Census FarmAn agricultural operation with gross farm receipts > $2,499 that produces at least one of the followingproducts intended for sale: crops (field crops, tree fruits or nuts, berries or grapes, vegetables, seed); livestock(cattle, pigs, sheep, horses, exotic birds, etc.), animal products (milk or cream, eggs, wool, fur, meat), or otheragricultural products (greenhouse or nursery products, Christmas trees, mushrooms, sod, honey, maplesyrup products).
Commercial FarmsThese are business focussed farms with most of their income derived from farming.
Communal Farms/OperatorsThis is a system of farms where operators pull production resources together.
Corporate FarmsCorporate farms are farms with an organizational business structure that is incorporated.
Non-Commercial FarmsThese are non-business focussed farms.
Non-Family FarmsFarms organized as non-family corporations, co-operatives or communal operations. Also includes farms heldin estates or trusts.
Unincorporated FarmsUnincorporated farms are farms with an organizational business structure that is unincorporated such as a soleproprietorship and partnership.
Farm Definitions

An Overview of the Canadian Agriculture and Agri-Food System
Glo
ss
ary
130
Agriculture and Agri-Food ExportsAgriculture and agri-food exports include the export of agriculture commodities, food (excluding fish and fishproducts), non-alcoholic beverages (including bottled water), alcoholic beverages, tobacco products, andfloriculture and nursery.
Agriculture and Agri-Food ImportsAgriculture and agri-food imports include the import of agriculture commodities, food (excluding fish and fishproducts), non-alcoholic beverages (including bottled water), alcoholic beverages, tobacco products andfloriculture and nursery.
Trade ClassificationTrade statistics for the agriculture and agri-food system are categorized according to the BICO classificationsystem which separates products into three different groupings: bulk, intermediate, and consumer oriented.
• Bulk (B)Products that have received little or no processing, such as, wheat, feedgrains and oilseeds.
• Intermediate (I)Products that have received some processing, but generally are not yet ready for final consumption. Examples include wheat flour, vegetable oils and slaughter animals.
• Consumer Oriented (CO)Products that require little or no additional processing and are basically ready for humanconsumption. Examples include dairy products, eggs, beef, fresh fruits, and floriculture, as well ascanned soups, frozen meals, baby foods, etc.
Value-Added TradeValue-added exports/imports include exports/imports of all intermediate and consumer-oriented goods.
Trade Categories

An Overview of the Canadian Agriculture and Agri-Food System
Glo
ss
ary
131
Government ExpendituresGovernment spending (at all levels) on agriculture and food processing in a year, both direct and indirect, toindividuals, agencies or associations.
Major Categories of Expenditures
Development, Trade and Environment-Related Program ExpendituresInclude administration and capital expenditures incurred by the government to work on regionaldevelopment, marketing and trade, and environmental activities as well as grants andcontributions issued by the government for work on these activities.
Operating and Capital ExpendituresInclude government expenditures on general administration and management, and on policy,information and statistical services.
Other ExpendituresInclude government expenditures on food aid and international assistance, extension, andeducation as well as social program payments.
Program Payment ExpendituresInclude payments for income support and stabilization programs, ad hoc and cost reductionprograms, crop insurance programs and financing assistance programs.
Research and Inspection ExpendituresInclude administration and capital expenditures incurred by the government to perform researchand inspection activities, as well as grants and contributions issued by the government for work onthese activities.
Storage and Freight Assistance ExpendituresProgram payments for storage and freight.
Public InfrastructureThe quantity of physical capital owned by the municipal, provincial and federal governments of Canada. Thisincludes buildings such as schools, libraries and post offices, engineering structures, and machinery such assnow removal vehicles and ambulances.
Transportation InfrastructureThis is a subset of engineering structures, and includes highways, roads, streets, runways, rail track, bridges,and tunnels.
Government Support Categories

An Overview of the Canadian Agriculture and Agri-Food System
Glo
ss
ary
132
Market Price Support (MPS)Transfers to agricultural producers from policy measures that create a gap between domestic market pricesand border prices of a specific agricultural commodity.
Producer Support Estimate (PSE)A yearly measure of policy support to farm producers. It is the sum of market price support and budgetarypayments to producers, expressed as a percentage of the Gross Farm Receipts.
Gross Farm ReceiptsThe value of commodity production plus the direct transfers received by producers in the currentyear.
Single Commodity TransfersTransfers to agricultural producers from policy linked to the production of a single commodity such that theproducer must produce the designated commodity in order to receive the transfer.
Government Support Measures

An Overview of the Canadian Agriculture and Agri-Food System
Glo
ss
ary
133
Arable LandFAO defines arable land as land under temporary crops, meadow and pasture. FAO defines permanentcropland as land cultivated with crops that occupy the land for long periods and need not be replanted aftereach harvest (e.g. cocoa, coffee, and rubber). For Canada, permanent cropland is equal to area on farms thatis covered with forest and woodland.
BiomassThe term biomass refers to materials sourced from forestry, agricultural (plant, livestock products or by-products) marine, and aquaculture materials, as well as from industrial and municipal wastes.
BioproductsBioproducts are products (other than food, feed, or medicine) made from renewable biological inputs (oftenreferred to as biomass). The term includes new bio-based products as well as those traditional products whichhave been adapted to replace non-renewable inputs. Conventionally-made industrial products (such aslumber) are excluded.
Capital Cost AllowanceCapital cost allowance applies to amount deducted for depreciable property for tax purposes.
Concentration Ratio (CR4)Concentration ratio is a measure of an industry's concentration level and expresses sales of a set number ofthe top firms in the industry as a percentage of total industry sales. CR4 is the acronym for the concentrationratio of the top four firms in the industry.
Constant PricesConstant prices refers to a value from which the overall effect of a general price inflation has been removed.
Debt to Asset RatioDebt to asset ratio at the farm level is total debt divided by total assets.
Debt to Equity RatioDebt to equity ratio at the industry level is borrowings plus loans and accounts with affiliates all divided bytotal equity. This ratio examines the relationship of debt (loans, bonds, debentures) to shareholders’ equity.It compares the relative size of debt to resources invested by the owners. It indicates the extent to which a firmrelies on borrowed funds to finance its operations.
Farm ExpensesFarm expenses are estimates of farm operating expenses and represent business costs incurred by farmoperators for goods and services used in the production of agricultural commodities. All expense informationis on a calendar year basis. If direct rebates are paid to farmers to reduce the cost of particular inputs, then thenet expense estimates are used in the preparation of net income, although both gross and net expenses maybe displayed. As the objective is to produce provincial estimates of net income, flows from one farm to anotherare excluded from the estimates. The province can be viewed as one large farm.
Farm Family Income Farm family income is the sum of the total income of the operator and his/her family members. It includesincome from both farm and non-farm sources.
Farm Market ReceiptsFarm market receipts refers to cash income from the sale of agricultural commodities, but excludes directprogram payments to producers.
Economic and Statistical Terminology
An Overview of the Canadian Agriculture and Agri-Food System
Glo
ss
ary
134
Farm Net WorthFarm net worth is measured as the total assets of the farm evaluated at current market value less total liabilities.
Foreign Direct Investment (FDI)FDI refers to investment by non-residents in an enterprise where the non-residents own 10 percent or more ofthe ordinary shares or voting power in incorporated enterprises or the equivalent in unincorporatedenterprises.
Geometric (infinite)End-year net stock.
Gross Domestic Product (GDP)The GDP for a country is the total unduplicated value of the goods and services produced in that country duringa given period.
Gross Farm ReceiptsGross farm receipts include cash income from the sale of agricultural commodities and direct programpayments. They are compiled from census forms sent to all farms every five years.
Gross MarginGross margin is farm revenues minus farm expenses.
Gross Margin RatiosGross margin ratios are calculated as the ratio of gross margin earned by a farm relative to its market revenue.
Health CheckThe Health Check is a significant “fine tuning” of the 2003 CAP Reform and is expected to put in place furtherreforms over the years 2009-2013, i.e. to the end of the present budget period.
Intramural R&D ExpendituresIntramural R&D expenditures are all expenditures on research and development that are made by a particularorganization in a given time frame and includes work financed by others.
Intra-Regional TradeTrade between two regions in a given location. For example trade between Canadian provinces.
Labour ProductivityLabour productivity is a measure of an industry's output per hour of labour worked.
Multifactor ProductivityMultifactor productivity measures the efficiency in use of all inputs. Its growth is calculated as the rate of growthof output less the rate of growth of all inputs.
Net Cash IncomeNet cash income measures farm business cash flow (farm cash receipts minus operating expenses) generatedfrom the production of agricultural goods. Net cash income represents the amount of money available for debtrepayment, investment or withdrawal by the owner
Net Operating IncomeNet operating income is a term used at the farm level, and it is the difference between gross farm revenues andtotal farm cash expenses.
Economic and Statistical Terminology (cont’d)

An Overview of the Canadian Agriculture and Agri-Food System
Glo
ss
ary
135
Net Value-AddedNet value-added measures agriculture's contribution to the national economy's production of goods andservices created in a particular year. It is derived by calculating the total value of agricultural sector production,including program payments, and subtracting the related costs of production (expenses on inputs, businesstaxes and depreciation). Net value added is distributed to the various factors of production, including rent tonon-operator landlords, interest to lenders, wages and profits.
Net WorthNet worth corresponds to total assets minus total liabilities of the farm.
Off-Farm IncomeThe term off-farm income is a bit misleading in that it includes wages and salaries paid to family members forwork done on the farm. On average, for Canada, wages and salaries earned on the farm account for 22% oftotal wages and salaries earned for a farm family operating an unincorporated farm. The percentage varies byfarm type and province.
Operating MarginThis is operating revenue minus operating expenses.
Permanent CroplandFAO defines permanent cropland as land cultivated with crops that occupy the land for long periods and neednot be replanted after each harvest (e.g. cocoa, coffee, and rubber) For Canada, permanent cropland is equalto area on farms that is covered with forest and woodland.
Profit Margin RatioProfit margin ratio at the industry level is calculated as operating profits divided by total operating revenues.Operating profit is the net result of the principal business activities of a firm. It is calculated before taking intoaccount interest expense, investment income, non-recurring losses from the write-down of assets, gains orlosses realized on the disposal of assets, and income tax expense. This ratio indicates management’s ability togenerate earnings from the principal business activities of a firm.
QuintilesQuintiles are ranking households in ascending order of total household income and organized into five groupsof equal numbers.
Rate of Return on Long-term CapitalThe rate of return on long-term capital is calculated as operating income (without deducting either taxes orinterest paid) divided by long-term capital where long-term capital is taken to be the sum of shareholders'equity and long-term debt.
Realized Net Farm IncomeRealized net farm income is calculated as realized net market Income plus government program payments.
Realized Net Market IncomeRealized net market income is calculated as farm market receipts plus income-in-kind less operating expensesand depreciation.
Return on AssetsThe rate of return on assets at the farm level is calculated as net operating income plus interest expense minuscapital cost allowance divided by the total value of assets at cost. In the case of dairy and poultry farms theAllowance on Eligible Capital Property (ECE) for quota was also deducted.
Economic and Statistical Terminology (cont’d)

An Overview of the Canadian Agriculture and Agri-Food System
Glo
ss
ary
136
Return on EquityThe rate of return on equity at the farm level is calculated as net operating income minus capital costallowance divided by net worth at cost. In the case of dairy and poultry farms the Allowance on Eligible CapitalProperty (ECE) for quota was also deducted.
Return on Equity RatioReturn on equity ratio at the industry level is calculated as after-tax profit divided by total equity x 100. Thisratio measures the level of return to the owners (investors) and it represents their measure of profitability. Theearnings figure is the after-tax profits, including a deduction for interest expense (payments to lenders) It isthe net profit available to the owners (investors). The ratio indicates how many cents are returned to everydollar invested by the owners.
Total Actual Renewable Water Resources (TARWR)TARWR is an index developed by the Food and Agriculture Organization (FAO) of the United Nations andreflects the water resources theoretically available for development from all sources within a country.According to this index, there are more than 55 thousand cubic kilometers of TARWR per year in the earth.However, due to the mismatch between distribution of water resources and populations on wide geographicareas, and the seasonal variations in stock of water resource, only a fraction of these resources was withdrawnfor various purposes. On average, world withdrew only about 7 per cent of TARWR per year between theperiod of 1998-2002. Globally, approximately 70 per cent of water withdrawal is for agriculture.
Total Factor Productivity (TFP)TFP is measured as output divided by all inputs (i.e. capital, labour etc.).
Value-Added ProductionValue-added production refers to products that have undergone some processing.
Economic and Statistical Terminology (cont’d)

Data Sourcesand References

An Overview of the Canadian Agriculture and Agri-Food System
Da
ta S
ou
rce
s a
nd
Re
fere
nc
es
138
Chart Source
Section A Special Features
Section A1: Global Food Price Inflation
A1.1 International Monetary Fund (IMF)(http://www.imf.org/external/np/res/commod/externaldata.csv)
A1.2 & A1.3 OECD, USDA, AAFC calculations
A1.4 U.S. Census Bureau(http://www.census.gov/ipc/www/idb/worldpop.html)
A1.5 OECD
A1.6 International Food Policy Research Institute(http://www.ifpri.org/pubs/fpr/pr18.pdf)
A1.7 Energy Information Administration(http://www.eia.doe.gov/pub/international/iealf/tablee1.xls)
A1.8 IMF, Renewable Fuels Association Annual Industry Outlook (various years)(http://www.imf.org/external/np/res/commod/externaldata.csv; http://www.ethanolrfa.org/industry/outlook/)
A1.9 Natural Resources Canada and Ridgetown College, University of Guelph
A1.10 Australian Bureau of Agricultural and Resource Economics, OECD
A1.11 OECD
A1.12 Bank of Canada; Statistics Canada; CANSIM Table 326-00211- Consumer price index (CPI), 2005 basket, Annual (2002=100); IMF(http://www.bankofcanada.ca/en/rates/exchange_avg_pdf.html; http://www.imf.org/external/np/res/commod/externaldata.csv)
A1.13 Statistics Canada(http://www.statcan.ca/english/freepub/62-001-XIE/2008007/t033_en.htm)
A1.14 Statistics Canada and AAFC calculationsCANSIM Table 326-00211 - Consumer price index (CPI), 2005 basket, Annual (2002=100)
A1.15 OECD; National Bureau of Statistics of China
A1.16 OECD
A1.17 IFPRI and AAFC calculations(http://www.ifpri.org/2020/dp/vp43.asp)
Section B The Agriculture and Agri-Food System and the Canadian Economy
Section B1: GDP and Employment
B1.1-B1.4 CANSIM Table 379-0017 - Gross Domestic Product (GDP) at basic prices by North American Industry Classification System (NAICS), annual *T*
CANSIM Table 301-0003 - Annual Survey of Manufactures *T*
Data Sources and References

An Overview of the Canadian Agriculture and Agri-Food System
Da
ta S
ou
rce
s a
nd
Re
fere
nc
es
139
Chart Source
CANSIM Table 301-0006 - Annual Survey of Manufactures and Logging
B1.5 & B1.6 Statistics Canada, CANSIM Table 379-0025 - Gross Domestic Product (GDP) at basic prices by North American Industry Classification System (NAICS) and province, annual and special tabulations for AAFC
Data for P.E.I and N.B. GDP are estimation based on the shares of AAFC GDP of provincial GDP, based on GDP data provided by the Conference Board
B1.7 & B1.8 Statistics Canada, Labour Force Survey special tabulation for AAFC
Section B2: International Trade
B2.1 Global Trade Atlas and AAFC calculations
B2.2 Bank of Canada(http://www.bankofcanada.ca/en/rates/ceri-lookup.html)
B2.3 & B2.4 Statistics Canada and AAFC calculations(Canadian International Merchandise Trade Database via Canadian Agri-Food Trade System)
B2.5 Global Trade Atlas and AAFC calculations
B2.6 Statistics Canada and AAFC calculations(Canadian International Merchandise Trade Database)
B2.7 & B2.8 Global Trade Atlas and AAFC calculations
B2.9 & B2.10 Statistics Canada and AAFC calculations(Canadian International Merchandise Trade Database)
B2.11 Global Trade Atlas and AAFC calculations
B2.12 Statistics Canada and AAFC calculations(Canadian International Merchandise Trade Database via Canadian Agri-Food Trade System)
B2.13-B2.18 Global Trade Atlas and AAFC calculations
Section B3: Productivity, R&D and Innovation
B3.1 Statistics CanadaCANSIM Table 383-0022: Multifactor productivity, gross output, value-added, capital, labour and intermediate inputs at a detailed industry level, by North American Industry Classification System (NAICS)
United States Department of Agriculture (Economic Research Service)Table 1 Indices of farm output, input, and total factor productivity for the United States 1948-2004 (excel file table01.xls from web page http://www.ers.usda.gov/Data/AgProductivity)
B3.2 Statistics Canada
CANSIM Table 383-0022: Multifactor productivity, gross output, value-added, capital, labour and intermediate inputs at a detailed industry level, by North American Industry Classification System (NAICS)
Data Sources and References (cont’d)

An Overview of the Canadian Agriculture and Agri-Food System
Da
ta S
ou
rce
s a
nd
Re
fere
nc
es
140
Chart Source
B3.3 Statistics Canada
CANSIM Table 383-0022: Multifactor productivity, gross output, value-added, capital, labour and intermediate inputs at a detailed industry level, by North American Industry Classification System (NAICS)
United States Bureau of Labor Statistics, 1987-2006 Aggregate Manufacturing and Manufacturing Industries KLEMS Multifactor Productivity Tables, (excel file klems_mfp_1987_to_2006.xls from web page http://www.bls.gov/mfp/mprdload.htm)
B3.4 Sustainable Development Technologies Canada (SDTC)(http://www.sdtc.ca/en/about/innovation_chain.htm)
B3.5 & B3.6 Statistics Canada, Survey of Innovation 2005
B3.7 Statistics Canada, Service Bulletin, Science Statistics, “Industrial Research and Development, 2003 to 2007”, November 2007. Catalogue 88-001-X.
B3.8 Statistics Canada, Service Bulletin, Science Statistics, “Industrial Research and Development, 2003 to 2007”, November 2007. Catalogue 88-001-X.
Statistics Canada, CANSIM, Table 379-0023 - Gross Domestic Product (GDP) at basic price in current dollars, system of national accounts benchmark values by North American Industry Classification System (NAICS), Annual
B3.9 & B3.10 Agriculture and Agri-Food Canada, Farm Income, Financial Conditions and Government Assistance Databook
B3.11 OECD, Agricultural Policies in OECD Countries: At a Glance, 2008
B3.12 Calculated by authors based on Agricultural Science and Technology Indicators (ASTI) initiative data; Pardey and Beintema (2001); RICYT (2005); Casas, Solh, and Hafez (1999); OECD (2005); Eurostat (2005); and USDA/CRIS (2006)
B3.13 Galushko, Viktoriya, & Gray, Richard. (2008) Benefits from wheat breeding research in Western Canada. CAIRN Working Paper. University of Saskatchewan.
Scott T., Guzel, A., Furtan, H., & Gray, R. (2005). Returns to research, Western Grains Research Foundation, wheat and barley check-offs.
Goddard, Ellen, Benkie, James, and Boyd, Curtis. 2008. Impact of ACIDF Fund 2001. Presented at the ACIDF Annual General Meeting, June 10.
Boyd, Curtis, Goddard, Ellen, and Benkie, James. (2008) An Assessment of returns to research in field peas and canola. CAES Selected Paper, presented at the CAES meetings, June 30, 2008.
B3.14 Galushko, Viktoriya and R. Gray, Benefits from Wheat Breeding Research in Western Canada, forthcoming CAIRN Working paper. 2008
B3.15-B3.18 Statistics Canada, Bioproducts Development and Production Survey 2006
Data Sources and References (cont’d)

An Overview of the Canadian Agriculture and Agri-Food System
Da
ta S
ou
rce
s a
nd
Re
fere
nc
es
141
Chart Source
Section C Components of the Agriculture and Agri-Food System
Section C1: Consumers
C1.1 & C1.2 Statistics Canada, CANSIM, Table 380-0024 - Personal expenditure on goods and services, Annual
C1.3 Statistics Canada, CANSIM Table 380-0019, Sector Accounts, Persons and Unincorporated Businesses, AnnualCANSIM Table 051-0001, Estimates of Population, Annual
C1.4 Statistics Canada, Spending Patterns in Canada, 2006, Catalogue no. 62-202-X
C1.5 Statistics Canada, CANSIM Table 202-0405, Upper Income limits and income shares of total income quintiles, by economic family type, 2006 constant dollars, Annual
C1.6 & C1.7 Statistics Canada, CANSIM Table 380-0024 Personal expenditure on goods and services, Annual
C1.8 Canadian Restaurant and Foodservices Association(Sourced from Eating Patterns in Canada Report 2005, NPD Group Canada Inc.)
C1.9 Statistics Canada, CANSIM Table 203-002, Household Spending on Food by Province and Territory, Annual
C1.10 & C1.11 Canadian Federation of Agriculture and Meyers Norris Penny, CFA Canadian Label Project: Branding Canada at Home Final Report. June 18, 2007
Section C2: Food Distribution (Retail/Wholesale and Foodservice)
C2.1 Canadian Grocer, Statistics Canada, and AAFC calculations(Canadian Grocer, Feb 2008; CANSIM Table 355-0006 - Monthly survey of food services and drinking places, by North American Industry Classification System (NAICS), computed annual average)
C2.2 Canadian Grocer, Statistics Canada, and AAFC calculations
C2.3 Statistics Canada, Quarterly Financial Statistics for Enterprises
CANSIM Table 187-0001 - Quarterly balance sheet and income statement, by North American Industry Classification System (NAICS);
CANSIM Table 187-0002 - Quarterly statement of changes in financial position, by North American Industry Classification System (NAICS), selected financial ratios and selected seasonally adjusted components
C2.4 Statistics Canada, Quarterly Retail Commodity Survey, Special Tabulation
C2.5 A.C. Nielsen.
C2.6 Statistics Canada
CANSIM Table 355-0006 - Monthly survey of food services and drinking places, by North American Industry Classification System (NAICS)
C2.7 Canadian Restaurant and Foodservices Association, Quarterly InfoStats(http://www.crfa.ca/research/2008/foodservice_bankruptcies_at_27-year_low.asp)
Data Sources and References (cont’d)

An Overview of the Canadian Agriculture and Agri-Food System
Da
ta S
ou
rce
s a
nd
Re
fere
nc
es
142
Chart Source
C2.8 Canadian Restaurant and Foodservices Association(http://www.crfa.ca/research/2005/top_50_chains_capture_over_half_ market_share.asp)
C2.9 Canadian Restaurant and Foodservices Association and AAFC calculations(http://www.crfa.ca/research/statistics/sales_07-06.asp)
C2.10 Statistics Canada, Financial and Taxation Statistics for Enterprises, Annual
CANSIM Table 180-0003 - Financial and taxation statistics for enterprises, by North American Industry Classification System (NAICS), Annual
Section C3: Food, Beverage and Tobacco (FBT) Processing
C3.1 Statistics Canada, Input/Output Model 2004 and AAFC calculations
C3.2 Statistics Canada, CANSIM Table 379-0017 - Gross Domestic Product (GDP). at basic price by North American Industry Classification System (NAICS), Annual
C3.3 Statistics Canada, CANSIM Table 281-0024 - Employment (SEPH), unadjusted for seasonal variation, by type of employee for selected industries classified using the North American Industry Classification System (NAICS), Annual
C3.4-C3.5 Statistics Canada, CANSIM Table 304-0014 - Manufacturers' shipments, inventories, orders and inventory to shipment ratios, by North American Industry Classification System (NAICS), Canada, Monthly
C3.6 & C3.7 Statistics Canada, special tabulations from Annual Survey of Manufactures and Logging
C3.8 & C3.9 Canadian International Merchandise Trade Database via strategis.gc.ca
Statistics Canada, Monthly Survey of Manufactures, special tabulation for AAFC
C3.10 Statistics Canada, CANSIM Table 301-0006 - Principal statistics for manufacturing industries, by North American Industry Classification System (NAICS), Annual (dollars x 1,000)
C3.11 Statistics Canada and U.S. Bureau of Labor Statistics
CANSIM Table 176-0064 - Foreign exchange rates in Canadian dollars, computed annual average
ftp://ftp.bls.gov/pub/special.requests/ForeignLabor/ind3112naics.txt
C3.12 Statistics Canada, special tabulation from Quarterly Survey of Financial Statistics for Enterprises
C3.13 AAFC, “Corporate Income Tax Rate Database: Canada and the Provinces, 1960-2007” via AAFC web page
C3.14 & C3.15 Statistics Canada, special tabulation from Quarterly Survey of Financial Statistics for Enterprises
C3.16 Statistics Canada, CANSIM Table 031-0002 - Flows and stocks of fixed non-residential capital, by North American Industry Classification System (NAICS), Annual (dollars)
Data Sources and References (cont’d)

An Overview of the Canadian Agriculture and Agri-Food System
Da
ta S
ou
rce
s a
nd
Re
fere
nc
es
143
Chart Source
C3.17-C3.19 Statistics Canada
Table 376-0052 - International investment position, Canadian direct investment abroad and foreign direct investment in Canada, by North American Industry Classification System (NAICS) and region, Annual (dollars)
Section C4: Primary Agriculture
C4.1 Statistics Canada Input/Output Model and AAFC calculations
C4.2 & C4.3 Statistics Canada, 2006 Census of Agriculture, Labour Force Survey, MonthlyCANSIM, Table 282-0007 - Labour force survey estimates
C4.4 & C4.5 Statistics Canada, Farm Cash ReceiptsCANSIM, Table 002-0001
C4.6 Statistics Canada and AAFC calculations
C4.7 Statistics Canada, OECD and AAFC calculations
C4.8 IMF Primary Commodity Database(http://www.imf.org/external/np/res/commod/externaldata.csv)
C4.9 Statistics CanadaCANSIM Table 002-0022 - Farm product price index (FPPI), annual (index, 1997=100)
C4.10-C4.11 Statistics Canada, Farm Cash ReceiptsCANSIM, Table 002-0001
C4.12-C4.15 Statistics Canada and AAFC calculationshttp://www4.agr.gc.ca/AAFC-AAC/display-afficher.do?id=1202760466112&lang=0
C4.16 & C4.17 Statistics Canada, Census of Agriculture, various years
C4.18 Statistics Canada, 2006 Census of Agriculture
C4.19-C4.25 Statistics Canada and AAFC calculationshttp://www4.agr.gc.ca/AAFC-AAC/display-afficher.do?id=1202760466112&lang=0
C4.26-C4.27 Statistics Canada and AAFC, 2007 Farm Financial Survey
C4.28 Statistics Canada and AAFC, 2006 Farm Financial Survey
C4.29 AAFC, 2007 National Renewal Survey
C4.30 Statistics Canada and AAFC, 2007 Farm Financial Survey
C4.31 & C4.32 Statistics Canada and AAFC, Farm Financial Survey, various years
C4.33 Statistics Canada and AAFC, 2007 Farm Financial Survey
C4.34 & C4.35 Statistics Canada and AAFC, Farm Financial Survey, various years
C4.36 Statistics Canada and AAFC, 2007 Farm Financial Survey
C4.37 & C4.38 Statistics Canada and AAFC, 2007 Farm Financial Survey
C4.39-C4.41 Statistics Canada, Corporate Taxfiler Database, various years
Data Sources and References (cont’d)

An Overview of the Canadian Agriculture and Agri-Food System
Da
ta S
ou
rce
s a
nd
Re
fere
nc
es
144
Chart Source
Section C5: Agricultural Input and Service Suppliers
C5.1 Agriculture and Agri-Food Canada (AAFC)
C5.2 Statistics Canada
CANSIM Table 002-0022 - Farm product price index (FPPI), annual (index, 1997=100)CANSIM Table 328-0014 - Farm input price index, annual (index, 1992=100); Table 328-0001 - Farm input price index, quarterly (index, 1986=100)
C5.3 Statistics CanadaCANSIM Table 002-0005 - Farm operating expenses and depreciation charges, annual (dollars)
C5.4 Statistics Canada and AAFC calculationsCANSIM Table 002-0005 - Farm operating expenses and depreciation charges, annual (dollars)CANSIM Table 328-0014 - Farm input price index, annual (index, 1992=100)
C5.5 Statistics CanadaCANSIM Table 002-0005 - Farm operating expenses and depreciation charges, annual (dollars)
C5.6 Co-operatives Secretariat, AAFC and Statistics Canada; Cooperatives Secretariat, General Publications “Profile of Canadian Agricultural Co-operatives” various issues
C5.7 Co-operatives Secretariat, AAFC
Section C6: Natural Resource Use and Environmental Impacts
C6.1 Food and Agriculture Organization of the United Nations (FAO). FAOSTAT Online Statistical Service. Rome(http://faostat.fao.org)
C6.2 United Nations, Demographic Yearbook 2005
Food and Agriculture Organization of the United Nations (FAO). FAOSTAT Online Statistical Service. Rome(http://faostat.fao.org)
C6.3 Natural Resources Canada, Canada's Forest Inventory. CanFi 2001
C6.4 Census of Agriculture, 2006, Farm data and farm operator data tables
C6.5-C6.8 Food and Agriculture Organization of the United Nations (FAO). AQUASTAT database
C6.9 & C6.10 Canadian Regional Agriculture Water Use Model (CRAWUM), AAFC
C6.11-C6.13 Census of Agriculture, 2006.
C6.14 McConkey, B.G., Lobb, D.A., Li, S., and Black, J.M.W. (forthcoming) 2009. Risk of Erosion. Agri-Environmental Indicator Report Series, Report #3, AAFC
C6.15 Census of Agriculture, 2006. Farm data and farm operator data tables
C6.16 Census of Agriculture, 2006. Farm data and farm operator data tables
Canadian Fertilizer Institute
Data Sources and References (cont’d)

An Overview of the Canadian Agriculture and Agri-Food System
Da
ta S
ou
rce
s a
nd
Re
fere
nc
es
145
Chart Source
C6.17 De Jong, R., Drury, C.F., and Yang, J.Y. (forthcoming) 2009. Indicator of the Risk of Water Contamination by Nitrogen (IROWC-N). Agri-Environmental Indicator Report Series, Report #3, AAFC
C6.18 Canadian Economic and Emissions Model for Agriculture (CEEMA), AAFC
Section D Government and the Agriculture and Agri-Food Sector
Section D1: Government Expenditures in Canada
D1.1 - D1.8 Agriculture and Agri-Food Canada (AAFC); Farm Income, Financial Conditions and Government Assistance - Databook, Table C.1 (April 2008 update)
D1.9 Statistics CanadaTable 031-0002 - Flows and stocks of fixed non-residential capital, by North American Industry Classification System (NAICS), Annual
D1.10 AAFC calculationsTable 031-0002 - Flows and stocks of fixed non-residential capital, by North American Industry Classification System (NAICS), Annual
Section D2: Producer Support Estimates (PSE) and Agricultural Policies in Canada and Other Countries
D2.1 OECD, Trade and Agriculture Directorate, Producer and Consumer Support Estimates, OECD Database 1986-2007
D2.2-D2.4 OECD, Agriculture Policies in OECD Countries: At a Glance 2008
Data Sources and References (cont’d)