Embed Size (px)
Citation preview
A Canadian Biomass Inventory: Feedstocks for a Bio-based Economy 1S. Wood and D. B. Layzell, BIOCAP Canada Foundation
A Canadian Biomass Inventory:Feedstocks for a
Bio-based Economy
Final Report
Prepared for Industry CanadaContract # 5006125
June 27, 2003
Susan M. Wood and David B. Layzell
BIOCAP Canada Foundation, Queen’s University, 156 Barrie Street,Kingston, Ont. K7L 3N6

A Canadian Biomass Inventory: Feedstocks for a Bio-based Economy 2S. Wood and D. B. Layzell, BIOCAP Canada Foundation
Executive Summary
A detailed analysis was carried out to assess the capacity of Canada’s biological resources – inparticular, agriculture and forestry - to support a bio-based economy. In a bio-based economy, theagriculture and forestry sectors are involved in the large-scale production of bio-based energy (e.g.fuels), industrial chemicals and feed-stocks, in addition to the production of food, feed and fibre.
The analysis explored Forest Production, Agricultural Production and Municipal Waste streams.Key findings of the analysis include:
• Land Area: Of the 998 M ha of land in Canada, about 42% is forested, and about 25% (245M ha) is considered Timber Productive Forest. A further 6.8% (67.5 M ha) of Canada isagricultural land, of which 36.4 M ha (3.6%) is cropland.
• Standing Biomass / Bio-energy stock: The 245 M ha of Timber Productive Forest inCanada has a biomass carbon stock of about 15,835 Mt C. This resource has an energycontent (566 EJ) that is equal to 69 years of Canada’s current energy demand that is met byfossil fuels (8.24 EJ/yr).
• Annual Harvest: Each year, the biomass harvest from Canada’s forestry and agriculturalsectors is about 143 Mt C, an amount of carbon that is similar to the atmospheric emissionsof carbon from fossil fuel use in Canada (about 150 Mt C/yr in 1998):
o The energy content of the annual biomass harvest in Canada (5.1 EJ/yr) is equal to62% of the energy derived from fossil fuel combustion;
o A 25% increase in forestry and agricultural production in Canada could provide about1.25 EJ/yr in biomass energy, an amount equivalent to about 15% of the energy thatCanada now gets from fossil fuels.
• Residual or Waste Biomass: There are large residual or waste biomass carbon streamsassociated with the existing agriculture and forestry, and coming from municipalities:
o Of the >66 Mt C/yr in the residual or waste biomass carbon stream, about 60 Mt C/yrmay be considered an ‘available’ feedstock for a bio-based economy. Thisrepresents about 42% of the entire forestry and agricultural harvest;
o The energy content of this biomass resource, conservatively calculated to range from1.5 EJ/yr to 2.2 EJ/yr, is equivalent to between 18% and 27% of Canada’s currentenergy demand that is met by fossil fuels (8.24 EJ/yr).
This study illustrates the major potential that Canada has to utilize its vast forestry and agriculturalresources to provide a renewable and sustainable supply of bio-based energy, chemicals anmaterials to help meet the needs of society.
Such a bio-based economy would help the nation meet its international climate changecommitments while stimulating the rural economy and encouraging innovation and economicgrowth. Certainly, when it comes to a bio-based economy, Canada has a ‘Green Advantage’relative to other developed countries of the world.

A Canadian Biomass Inventory: Feedstocks for a Bio-based Economy 3S. Wood and D. B. Layzell, BIOCAP Canada Foundation
Table of Contents1. General Introduction ..................................................................................................................5
1.1. Why a Biomass Inventory? .................................................................................................5
1.2. The Approach Used ............................................................................................................6
1.3. Acknowledgements .............................................................................................................6
2. Biomass from Forest Resources .................................................................................................72.1. Introduction .........................................................................................................................7
2.2. Land Area of the Timber Productive Forest .......................................................................7
2.3. Biomass and Carbon Stocks in the Timber Productive Forest ...........................................8
2.4. The Annual Biomass and Carbon Harvest .......................................................................13
2.5. Mill Residues ....................................................................................................................15
2.6. Energy from Forest Biomass ............................................................................................16
3. Biomass from Agricultural Sources..........................................................................................183.1. Introduction .......................................................................................................................18
3.2. Agricultural Land Use .......................................................................................................18
3.3. Crop production ................................................................................................................19
3.4. Crop residues ...................................................................................................................20
3.5. Biomass from livestock waste ...........................................................................................24
3.6. Summary of Biomass from Agricultural Sources ..............................................................25
4. Biomass from Municipal Waste ...............................................................................................274.1. Municipal waste as a source of biomass ..........................................................................27
4.2. Energy potential of recycled materials ..............................................................................30
4.3. Energy potential of disposed municipal wastes ................................................................30
4.4. Municipal biosolid generation and availability ...................................................................31
4.5. Energy potential of biosolids .............................................................................................32
4.6. Summary of biomass from municipal wastes ...................................................................33
5. Summary of the Biomass – Bioenergy Inventory .....................................................................345.1. Canada’s Biomass Carbon and Energy Stock ..................................................................34
5.2. Annual Biomass Production in Forestry, Agriculture and Municipalities ............................35
5.3. Residual and Waste Biomass and Energy Resources .....................................................36
6. Hurdles ....................................................................................................................................376.1. The Challenge of Using Biomass as an Energy Resource ..............................................37
6.2. Some Concluding Thoughts ..............................................................................................38
7. References ...............................................................................................................................40

A Canadian Biomass Inventory: Feedstocks for a Bio-based Economy 4S. Wood and D. B. Layzell, BIOCAP Canada Foundation
List of Tables:
Page
Table 1.1. Canada’s Non-biomass energy use 6
Table 2.1. Regional Distribution of Forests 8
Table 2.2. Timber-Productive Forest Volume and C Stocks of Merchantable Trees,1996
9
Table 2.3. Average non-stem Biomass Density by Province, 1997 10
Table 2.4. Total Non-stem Biomass and proportion of Total biomass that ismerchantable, 1997
11
Table 2.5. Merchantable Volume of Roundwood Harvested, 2000 13
Table 2.6. Summary of Harvest Site Biomass. 15
Table 2.7. Wood Residue Production, Use and Surplus, 1998 17
Table 3.1. Farm Land Area, Canada, 2001 18
Table 3.2. Agricultural Crop Production, Canada, 2001 19
Table 3.3. Biomass from Agricultural Crop Residues in Canada, 2001 23
Table 3.4. Livestock Manure Production, Canada, 2001 24
Table 3.5. Biogas and Heating Potential from Livestock Wastes, 2001 25
Table 4.1. Generation of Municipal Solid Wastes, 2000 28
Table 4.2. Diversions of Municipal Wastes by Recycling, 2000 29
Table 4.3. Carbon Potential of Recycled materials, 2000 29
Table 4.4. Energy Potential of Disposed Municipal Solid Wastes, 2000 30
Table 4.5. Biosolid Generation, 2001 31
Table 5.1. Summary of the Biomass Sources in Canada and their Energy Content 34
List of Figures:Page
Fig. 1.1. Canada’s GHG emissions and the Kyoto Target for 2008-12 5
Fig. 2.1. Distribution of Forested Lands in Canada, 1991 7
Fig. 2.2. Allowable Annual Cut by Region, 1999 9
Fig. 2.3. Distribution of Non-stem Forest Biomass by Region 12
Fig. 2.4. The Proportion of Forest C Stocks that are Merchantable 13
Fig. 2.5. Typical Sawlog Useage 14
Fig. 5.1. Comparison of Canada’s Annual Fossil Fuel use and Biomass Carbon Yield. 35
Fig. 5.2. Comparison of the Energy Content of Different Energy Sources 36
A Canadian Biomass Inventory: Feedstocks for a Bio-based Economy 5S. Wood and D. B. Layzell, BIOCAP Canada Foundation
1. General Introduction1.1. Why a Biomass Inventory?
Countries around the world are reconsidering biomass as a potential source of renewable andsustainable energy, chemicals and materials; in essence, biomass will provide the feedstocks for abio-based economy.
There are many ‘drivers’ that have come together tofocus attention on biomass and a bio-economy,including:
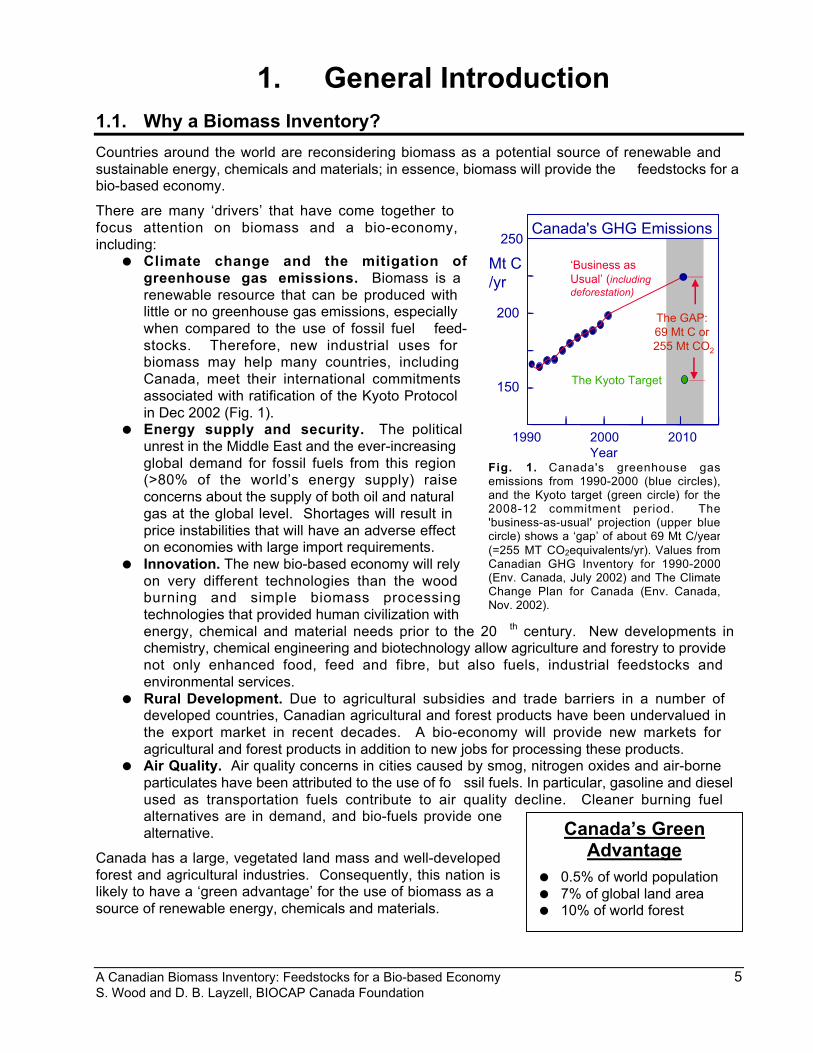
= Climate change and the mitigation ofgreenhouse gas emissions. Biomass is arenewable resource that can be produced withlittle or no greenhouse gas emissions, especiallywhen compared to the use of fossil fuel feed-stocks. Therefore, new industrial uses forbiomass may help many countries, includingCanada, meet their international commitmentsassociated with ratification of the Kyoto Protocolin Dec 2002 (Fig. 1).
= Energy supply and security. The politicalunrest in the Middle East and the ever-increasingglobal demand for fossil fuels from this region(>80% of the world’s energy supply) raiseconcerns about the supply of both oil and naturalgas at the global level. Shortages will result inprice instabilities that will have an adverse effecton economies with large import requirements.
= Innovation. The new bio-based economy will relyon very different technologies than the woodburning and simple biomass processingtechnologies that provided human civilization withenergy, chemical and material needs prior to the 20 th century. New developments inchemistry, chemical engineering and biotechnology allow agriculture and forestry to providenot only enhanced food, feed and fibre, but also fuels, industrial feedstocks andenvironmental services.
= Rural Development. Due to agricultural subsidies and trade barriers in a number ofdeveloped countries, Canadian agricultural and forest products have been undervalued inthe export market in recent decades. A bio-economy will provide new markets foragricultural and forest products in addition to new jobs for processing these products.
= Air Quality. Air quality concerns in cities caused by smog, nitrogen oxides and air-borneparticulates have been attributed to the use of fo ssil fuels. In particular, gasoline and dieselused as transportation fuels contribute to air quality decline. Cleaner burning fuelalternatives are in demand, and bio-fuels provide onealternative.
Canada has a large, vegetated land mass and well-developedforest and agricultural industries. Consequently, this nation islikely to have a ‘green advantage’ for the use of biomass as asource of renewable energy, chemicals and materials.
Canada's GHG Emissions
1990 2000 2010Year
150
200
250
Mt C/yr
The Kyoto Target
The GAP: 69 Mt C or 255 Mt CO2
‘Business asUsual’ (includingdeforestation)
Fig. 1. Canada's greenhouse gasemissions from 1990-2000 (blue circles),and the Kyoto target (green circle) for the2008-12 commitment period. The'business-as-usual' projection (upper bluecircle) shows a ‘gap’ of about 69 Mt C/year(=255 MT CO2equivalents/yr). Values fromCanadian GHG Inventory for 1990-2000(Env. Canada, July 2002) and The ClimateChange Plan for Canada (Env. Canada,Nov. 2002).
Canada’s GreenAdvantage
= 0.5% of world population= 7% of global land area= 10% of world forest

A Canadian Biomass Inventory: Feedstocks for a Bio-based Economy 6S. Wood and D. B. Layzell, BIOCAP Canada Foundation
The purpose of this study was to explore the magnitude of Canada’s biomass resource by:(a) Quantifying Canada’s forestry and agriculture production in units of carbon harvested per
year and the energy content of that harvest. Comparing the amount of biomass carbonharvested to Canada’s current fossil fuel and energy usage should allow an assessment ofthe extent of increase in agricultural or forest production that would be required to make asignificant contribution to Canada’s energy needs;
(b) Estimating the extent of waste biomass carbon streams produced by Canada’s forestry,agricultural and municipal sectors and the contribution these could make to the energyneeds of Canada.
This study was not intended to offer an economic assessment of the potential of biomass from anyspecific sector, or to identify regions with strong potential for future development. Neither was itdesigned to identify all hurdles associated with the production, processing or marketing of biomassto support a bio-based economy. The study does not offer a full assessment of the potential frommarine biomass. Although marine-source biomass has some potential for the future, aninfrastructure for the production and harvest of algal and marine invertebrate and vertebrate lifedoes not currently exist; some marine source waste from fish processing plants is included in themunicipal waste stream of this study.
This assessment is an extension of an earlier, less detailed study (Layzell, 2001 ) , and provides anaccurate assessment of carbon and energy stocks upon which policy decisions may be confidentlybased.
1.2. The Approach Used
This inventory was undertaken to evaluate the current status ofbiomass production and availability from three sectors: forestry,agriculture and municipal waste.
The magnitude of the agricultural and forest harvest was obtainedfrom a wide range of sources including Statistics Canada, NaturalResources Canada and Agriculture and Agri-food Canada.Allowances were then made for other biomass harvested but notincluded in the official numbers, and then these values wereconverted into units of mega- tonnes (Mt) of elemental carbon (C)harvested per year. Eventually, summary values were convertedinto energy content in units of Exajoules (10 18 joules) per year.
The energy potential of the biomass carbon streams were comparedwith the non-biomass energy use in Canada (Table 1.1). Biomassenergy has been estimated as providing about 4.1% of Canada’senergy supply in the mid 1990’s ( Klass, 1998).
The calculation of the waste C streams was more complex and involved identifying the sources andquantities of biomass carbon that are not currently being used as a primary product, nor in theproduction of energy or bioproducts. All conversion factors were assessed for validity andcompared to the best-known standards and the most recent scientific literature.
Where biomass residues had a measurable diversion for traditional uses or where known hurdles inharvesting or post-harvest processing exist, reduction factors were introduced. A final figure ofbiomass available from each sector is provided.
1.3. Acknowledgements
Numerous contributors offered information and statistics for this report, as well as helpfuldiscussions. Their assistance was invaluable and greatly appreciated, but the authors accept allresponsibility for the calculations and interpretations provided in this report.
Table 1.1. Canada’s non-biomass energy use; year
2000 estimate
Source EJ/yrCoal 1.40Oil 2.92Natural Gas 3.91
Total FF 8.24Net Nuclear 1.05Net Hydro 3.30
Total 12.60from Canada's EnergyOutlook, 1996-2000

A Canadian Biomass Inventory: Feedstocks for a Bio-based Economy 7S. Wood and D. B. Layzell, BIOCAP Canada Foundation
Figure 2.1 Distribution of Forested Lands in Canada, 1991
Inventoried
forest land
Land area
Total area
Timber-
productive forest land
0
4
8
12
M K
m2
2. Biomass from Forest Resources2.1. Introduction
Forested lands constitute Canada’s greatest biomass reserve, and provide resources for the$74B/yr forest industry. As well as providing wood and specialized forest products, the forestindustry generates biomass residues suitable for bio-product and energy production.
In Section 2.2, the extent and distribution of forested land is described, with special emphasis onthat portion classified as ‘timber-productive forest’ (TPF). Total biomass and carbon stocks, derivedusing different model systems, are assessed for the TPF regions (Section 2.3) and then informationon how these models contribute to the determination of the annual allowable harvest, along withactual harvest data for each region is provided (Section 2.4).
The processes of harvest and preliminary handling eliminate non-merchantable fractions of the totalharvest, thereby creating wood residues. Wood residues are of particular interest because theyrepresent a biomass resource available in every region. Some wood residues are used for co-generation or secondary manufacturing; however, unused wood residues from the harvest site andmill may be combined to provide an estimate of biomass currently available for bio-products andenergy (Section 2.5).
The forest industry uses both volume and mass units. In this chapter, measurements are convertedto units of carbon for easy comparison, and energy values (EJ) are provided for wood residues.
2.2. Land Area of the Timber Productive Forest
By far the greatest proportion of annual biomass accumulation occurs on forested lands, whichcover 4.17 M km 2 (41.8%) of Canada’s total 9.98 M km 2 landmass (Statistics Canada, 2001 reportof data collected by NRCan, GeoAccess Division).
Canada’s forests account for 10% of the world’s forest resources (Penner et al., 1997) and theyhave a high rate of public ownership, with 71% provincially owned, and 22% federally owned(including territorial forests). Only 7% of forested land is privately held.
Of inventoried forest land, about 58% is considered to be “productive” (i.e. that available for growingand harvesting trees). The remaining 42% is reserved forest land and therefore not available for

A Canadian Biomass Inventory: Feedstocks for a Bio-based Economy 8S. Wood and D. B. Layzell, BIOCAP Canada Foundation
production and protected from harvest by law (Statistics Canada, CANSIM Matrix 6076, 1991).Timber productive forests account for 25% of Canada’s total land area (Lowe et al., 1996), andthese have been evaluated for density (stocking) and productivity.
The proportions of inventoried and timber-productive forest lands of the total landmass of Canadaare presented in Figure 2.1, and the regional distribution of forested area is provided in Table 2.1.
2.3. Biomass and Carbon Stocks in the Timber Productive Forest
In this section, biomass and carbon stocks that are available within the timber productive forest areestimated. These stocks include the bole of the trees that provide the merchantable product(Section 2.3.1) and the non-stem biomass (Section 2.3.2) that includes the bark, branches andleaves of all tree species within the forest.
2.3.1. Merchantable biomass and carbon stocksMerchantable trees are the targeted biomass for harvest by the forest industry. A traditional toolof forest management, known as a “forest inventory”, is used to determine the appropriatevolume of trees for harvest, or “annual allowable cut” (AAC), for any given region. Over time,models to determine the volume of merchantable tree stems (Bonner, 1982) have becomemore refined and have taken into consideration many factors affecting the growth of forestspecies in order to improve sustainability of AAC rates.
The merchantable volume reports only the wood portion of a stem suitable for harvest fromstump to top in cubic meters (m 3). Site-specific factors such as the overall productivity of theland (Class I or Class II), the tree density or “stocking” factor, and local merchantability limits(the minimum size of tree cut for sale, for example) are also considered. A detailed “forestinventory”, called the “Canadian Forest Inventory” (CANFI), was produced for the year 1991,with an update in 1994 (Lowe et al., 1996). A summary of timber productive forest volume, byregion and composition is provided in Table 2.2.
Table 2.1 Regional Distribution of Forests1
(TPF = Timber Productive Forest)
Area (Mha) ha/yr
Region TotalFreshWater Land Forests TPF
AnnualHarvest3
NL 41 3.1 37.4 22.5 11.27 17,415PE 1 0 0.6 0.3 0.28 5,780NS 6 0.2 5.3 3.9 3.77 49,680NB 7 0.1 7.1 6.1 5.95 111,077QC 154 17.7 136.5 83.9 53.99 384,208ON 108 15.9 91.8 58 42.2 201,522MB 65 9.4 55.4 26.3 15.24 15,509SK 65 5.9 59.2 28.8 12.63 21,169AB 66 2 64.2 38.2 25.71 42,210BC 94 2 92.5 60.6 51.74 176,312YT 48 0.8 47.4 27.6 7.47 xNT 135 16.3 118.3 61.4 14.32 547NU2 209 15.7 193.6 54.5 x x
Canada 998 89.1 909 417.6 244.6 1,025,429Totals may not add up due to rounding.1Data source, Lowe et al., 1996.2Data source, NRCan, GeoAccess Division3Data from NRCan 1999, Compendium of Forest Statistics

A Canadian Biomass Inventory: Feedstocks for a Bio-based Economy 9S. Wood and D. B. Layzell, BIOCAP Canada Foundation
Figure 2.2. Allowable Annual Cut, by Region, 1999
NL1%
NB5%
QC26%
ON16%
MB4%
AB12%
BC33%
NS3%
The assessment of forestvolume is used to establish theannual allowable cut (AAC). It isunusual for the entire quota tobe filled in any given yearbecause of technologicalchallenges associated withharvest, and fluctuations in themarketplace. Although the AAChas hovered around the 230 Mm3 mark for all of Canada, in theperiod from 1970 to 1999,actual harvest has beensomewhat lower. Theproportion of the AAC allocatedby region is illustrated in Figure2.2, and is proportional to thetimber productive forest volumeshown in Table 2.2.
Table 2.2 Timber-Productive Forest Volume and
C Stocks of Merchantable Trees, 19961
Coniferous BroadleavedTotal
VolumeTotal
Carbon Region Volume M m3 Mt C3
NL 492 40 532 127PE 16 10 26 6NS 156 106 263 63NB 434 212 646 154QC 2,938 1,320 4,258 1014ON 2,399 1,384 3,783 901MB 612 326 938 223SK 461 435 896 213AB 1,922 1,198 3,120 743BC 9,884 711 10,595 2523YT 572 66 638 152NT 333 133 466 111NU2 x x x x
Canada 20,218 5,941 26,159 6,229Totals may not add up due to rounding.1Data source, Lowe et al., 1996.2Data not available.3 Assumes 4.2 m 3 per t C in biomass

A Canadian Biomass Inventory: Feedstocks for a Bio-based Economy 10S. Wood and D. B. Layzell, BIOCAP Canada Foundation
Table 2.3 Average Non-stem Biomass Density by Province, 19971
Species Carbon3
Coniferous Mixed Broadleaved UCWeightedAverage2
DensityRegion ODT/ha t C/ha
NL 52 76 84 80 54 23.8PE 73 83 99 x 84 37.0NS 71 70 83 x 75 33.0NB 87 87 90 16 81 35.6QC 59 89 105 43 70 30.8ON 83 85 101 84 87 38.3MB 46 74 72 x 55 24.2SK 35 67 89 x 54 23.8AB 82 92 68 x 78 34.3BC 169 111 80 55 158 69.5YT x x x x 72 31.7NT x x x x 52 22.9NU2 x x x x x x
Canada 101 81 88 28 89 41.4x - data not available; UC – unclassified1Data source Penner et al., 19972Weighted for the hectares of each species in each region3Assumes 12% water in oven dried biomass, and 50%C in dry weight, therefore 0.44 t C/ODT
2.3.2. Non-Stem Biomass and Carbon StocksBiomass and Carbon Density T he forest industry’s “biomass inventory” assesses all non-stemwood, above-ground tissues including the bark, branches and leaves of all tree specieswithin a given stocked timber-productive forest, regardless of the size of the individual trees, ortheir suitability for commercial harvest. This assessment gives the best estimate of allmaterials with potential as a feedstock for bio-based energy, chemicals and materials.
The earliest methods of estimating total biomass used extrapolation of harvest data, butincluded inherent errors because critical factors such as land productivity, or the nature of treeand understory species were not considered. More recent models for estimating total biomasshave been refined to accommodate more variables (Bonner, 1985). The best, currentlyavailable biomass model permits estimation of biomass on both high productivity (Class II) andlower productivity (Class I) lands as defined by provincial standards (Penner et al., 1997).
The model of Penner et al. (1997) used a series of equations to convert merchantable stemwood volumes (m 3) from the forest inventory, to biomass estimates in oven-dried tonnes perhectare (ODT/ha). Conversion factors to account for all aboveground biomass ofmerchantable, as well as intact sub-merchantable trees are included, so that the estimateaccounts for all aboveground but non-stem wood, biological tissues attributable to trees and tallshrubs within a given stand. Biomass of small shrubs and herbaceous foliage is not included inthe biomass inventory.
Site-specific factors affecting growth rate and stand density, regional and speciesmerchantability limits, typical stump height and regional yield tables were included in the model,so that the degree of accuracy, as confirmed by actual field measurements was high (Penner et

A Canadian Biomass Inventory: Feedstocks for a Bio-based Economy 11S. Wood and D. B. Layzell, BIOCAP Canada Foundation
Table 2.4 Total Non-stem Biomass and Proportion of Total Biomass that isMerchantable, by Region, 1997
Non-Stem Biomass Merchantable TPF1 Average2 Total Carbon3 Carbon4 Region M ha ODT/ha M ODT Mt C Mt C % of TotalNL 11 54 610 268 127 32.1%PE 0 84 25 11 6 36.0%NS 4 75 285 125 63 33.3%NB 6 81 486 214 154 41.8%QC 54 70 3,780 1663 1014 37.9%ON 42 87 3,671 1615 901 35.8%MB 15 55 836 368 223 37.8%SK 13 54 680 299 213 41.6%AB 26 78 2,005 882 743 45.7%BC 52 158 8,169 3594 2523 41.2%YT 8 72 540 238 152 39.0%NT 14 52 744 327 111 25.3%NU2 x x x x x xCanada 245 - 21,831 9,606 6,229 39.3%1From Table 2.12 From Table 2.23Assumes 12% water in oven dried biomass, and 50%C in dry weight, therefore0.44 tC/ODT4From Table 2.2
al., 1997). The average non-stem biomass, as determined using this model, is shown in Table2.3 for various regions and forest types.
All biomass measurements were presented as “oven-dried tonnes” (ODT); biomass that hasbeen oven-dried for analysis retains 12% moisture on average. These values were convertedto t C/ha.
Total Biomass and Carbon. When the average values for non-stem biomass density wereapplied to the land areas for each region, values for total non-stem biomass were derived asshown in Table 2.4. As expected, total biomass was greater in more heavily forested regions.
Across Canada, total estimated biomass on TPF land was estimated at 21,831 OD Mt, or 9,606Mt of carbon, assuming that oven dried biomass was 44% carbon.
Figure 2.3 illustrates the distribution of non-stem biomass across Canada (calculated by themethod of Penner et al., 1997). Other national biomass inventories, such as the Alexeyev et al.,1995 study of Russia and the Birdsey (1992) study of the United States, have used similarstudy techniques to generate reasonable national estimates. All studies that are based on theapproach of estimating total biomass from stemwood volume are admittedly prone to errorwhere local variability in soil type and moisture accessibility is high, however, the calculationspresented in Table 2.4 are reasonably aligned with those of Russia and the United States.
Comparing Merchantable and Non-Stem Biomass and C Stocks The data from Tables 2.2and 2.4 were combined to calculate the proportion of total forest biomass that is merchantable.The results for the major regions of Canada are provided in Table 2.4. Note that values rangedfrom a 25% to 46%. The national average shows that about 39% of the total biomass in thetimber productive forest is merchantable.

A Canadian Biomass Inventory: Feedstocks for a Bio-based Economy 12S. Wood and D. B. Layzell, BIOCAP Canada Foundation
Figure 2.3 Distribution of Non-Stem Forest Biomass by Region.
NL
PE
NS
NB
QC
ONMBSKAB
BC YT NT
Figure 2.4. The Proportion of Forest C Stocks that are Merchantable
Logs and Bolts83%
Other Industrial2%
Pulpwood14%
Fuelwood and Firewood
1%

A Canadian Biomass Inventory: Feedstocks for a Bio-based Economy 13S. Wood and D. B. Layzell, BIOCAP Canada Foundation
Table 2.5 Merchantable Volume of Roundwood Harvested, 20001
Roundwood Harvested
Logs &bolts2
Fuelwood &firewood3 Pulpwood4
Otherindustrial5 Total
Non-Stemwood
Total
Region 000 m3/yr M m3/yr M ODT/yr6 Mt C/yr7 Mt C/yr8
NL 602 429 1,837 x 2.87 1.55 0.68 1.45PE 345 188 133 5 0.67 0.36 0.16 0.28NS 3,898 68 2,168 29 6.16 3.33 1.47 2.94NB 8,231 33 3,573 x 11.84 6.39 2.82 3.92QC 37,462 2,000 3,905 117 43.48 23.48 10.35 16.99ON 16,878 124 7,989 3,127 28.12 15.18 6.69 12.01MB 594 53 1,526 15 2.19 1.18 0.52 0.86SK 2,113 3 2,157 272 4.55 2.45 1.08 1.52AB 16,752 5 4,813 357 21.93 11.84 5.22 6.20BC 78,422 x x x 78.42 42.35 18.67 26.60YT 1 30 x x 0.03 0.02 0.01 0.01NT 3 19 x x 0.02 0.01 0.01 0.02NU x x x x x x x x
Canada 165,301 2952 28,101 3922 200.3 108.2 47.7 72.791Data source, National Forestry Database Program, 2000.2Logs and bolts refers to stemwood sold for sawmill lumber and veneer wood.3Fuelwood is used for industrial and institutional energy production; firewood is used for residential andhousehold energy production: both terms refer to commercial stemwood sold for fuel.4Pulpwood refers to stemwood sold for pulping, chipping, fibre and paper manufacture.5Other industrial stemwood is sold for the manufacture of poles, pilings and composite board.6Assumes 0.54ODT per m37Assumes 1tC occupies approximately 4.2m 3
8Calculated from the Mt C/yr roundwood harvest assuming the proportion of total biomass that ismerchantable as per Fig. 2.4
2.4. The Annual Biomass and Carbon Harvest
2.4.1. Merchantable Harvest of RoundwoodRecording the volume of merchantable tree stems (roundwood) harvested and sold from eachregion has formed the basis of traditional forest resource assessment and management.Roundwood is categorized by anticipated or dedicated use, and sold as “logs and bolts” forlumber, “fuelwood and firewood” for energy, “pulpwood” for pulp, fibre, chip or chemicalfeedstocks and “other industrial” roundwood for a variety of purposes, such as utility poles andpilings.
These statistics provide a measure of the volume of timber harvested by region and updatesare appended to the National Forestry Database on an annual basis (National ForestryDatabase, 1991).
A summary of roundwood harvested by category and region is presented in Table 2.5. Whenthe area of harvested roundwood data is compared to the inventoried land total, less than halfof 1% of timber-productive land (about 1 M ha, Table 2.1) is harvested in any year. BCproduces the highest volume of total harvested forest products, with 78 M cubic metersharvested annually; QC is a distant second at 43 M m 3. The Canadian forest industry harvestsover 200 M m 3 of roundwood every year, with a carbon equivalent of about 47 Mt C/yr.

A Canadian Biomass Inventory: Feedstocks for a Bio-based Economy 14S. Wood and D. B. Layzell, BIOCAP Canada Foundation
The distribution of harvest volume by usage category is illustrated in Figure 2.5. Note thatabout 22% of the sawlog is waste (bark, sawdust, etc).
2.4.2. Harvest of Non-Stem BiomassRoundwood harvested for logs and bolts leaves behind residual biomass in the form of treetops and branches. In Tables 2.2 and 2.4 of this document, estimates were provided for thestocks of merchantable trees (i.e. potential roundwood stock) and the non-stem biomass,respectively, the latter of which is typically left at the harvest site. Fig. 2.4 shows that onlyabout 39% of the total biomass in the timber productive forest is merchantable.
Assuming that the proportion is similar in the forest that is harvested each year, then anestimate can be made of the harvest of non-stem biomass using the roundwood harvest data.This calculation is shown in Table 2.5 and predicts that a 47.7 MtC/yr roundwood harvest wouldleave an additional 72.8 Mt C/yr at the harvest site for a total biomass harvest of about 120MtC/yr.
However, the proportion of the timber productive forest that is actually harvested each yearvaries widely (by 10 fold) among provinces. Therefore, very different numbers are obtained forall of Canada when the values of Penner (1997) were applied to the actual annual harvest areafor each province and then summed for a national total (Table 2.6). In this case, the non-stembiomass was estimated to contain about 40.4 Mt C/yr rather than 72.8 MT C/yr, and given aroundwood harvest of 47.6 MtC/yr, it was estimated to account for 54% of the total aboveground woody biomass, not 39% as predicted in Table 2.4.
The more conservative values outlined in Table 2.6 were the one that have been used in thesubsequent calculations carried out in this paper.
2.4.3 Non-stem Biomass for Ecological ServiceLeaving some biomass at the harvest site offers a variety of benefits and promotes sustainability.Tree branches and tops provide cover for wildlife, prevent erosion, help to maintain soil carbonstocks, protect emerging tree seedlings and minimize moisture loss from the forest floor. Theamount of biomass that should be left is site specific, and depends upon the nature of the harvestoperation (clearcut vs. select cut), geophysical characteristics (slope, soil type and depth), localclimatic considerations and predominant harvest species, as well as many other factors.Furthermore, considerable debate amongst scientists and foresters exists in regards to the amountof biomass required for site regeneration and sustainability; the percentage of required biomass isproposed to range from 0 to 100% and it is clear that no figure will adequately account for theneeds of every harvest site. Thus, it is proposed that the non-stem biomass carbon and energy,
Figure 2.5 Typical Sawlog Usage
Lumber40%
Pulp and Paper38%
Residues22%
A Canadian Biomass Inventory: Feedstocks for a Bio-based Economy 15S. Wood and D. B. Layzell, BIOCAP Canada Foundation
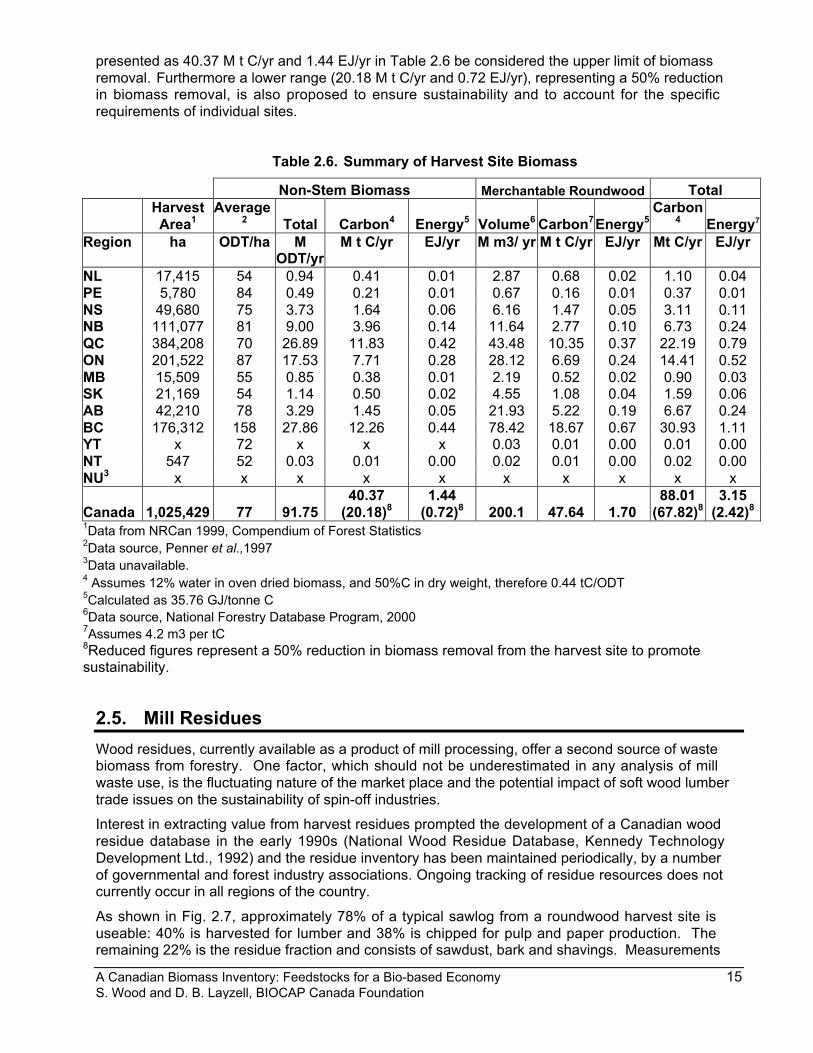
presented as 40.37 M t C/yr and 1.44 EJ/yr in Table 2.6 be considered the upper limit of biomassremoval. Furthermore a lower range (20.18 M t C/yr and 0.72 EJ/yr), representing a 50% reductionin biomass removal, is also proposed to ensure sustainability and to account for the specificrequirements of individual sites.
2.5. Mill Residues
Wood residues, currently available as a product of mill processing, offer a second source of wastebiomass from forestry. One factor, which should not be underestimated in any analysis of millwaste use, is the fluctuating nature of the market place and the potential impact of soft wood lumbertrade issues on the sustainability of spin-off industries.
Interest in extracting value from harvest residues prompted the development of a Canadian woodresidue database in the early 1990s (National Wood Residue Database, Kennedy TechnologyDevelopment Ltd., 1992) and the residue inventory has been maintained periodically, by a numberof governmental and forest industry associations. Ongoing tracking of residue resources does notcurrently occur in all regions of the country.
As shown in Fig. 2.7, approximately 78% of a typical sawlog from a roundwood harvest site isuseable: 40% is harvested for lumber and 38% is chipped for pulp and paper production. Theremaining 22% is the residue fraction and consists of sawdust, bark and shavings. Measurements
Table 2.6. Summary of Harvest Site Biomass
Non-Stem Biomass Merchantable Roundwood Total
HarvestArea1
Average2 Total Carbon4 Energy5 Volume6 Carbon7Energy5
Carbon4 Energy7
Region ha ODT/ha MODT/yr
M t C/yr EJ/yr M m3/ yr M t C/yr EJ/yr Mt C/yr EJ/yr
NL 17,415 54 0.94 0.41 0.01 2.87 0.68 0.02 1.10 0.04PE 5,780 84 0.49 0.21 0.01 0.67 0.16 0.01 0.37 0.01NS 49,680 75 3.73 1.64 0.06 6.16 1.47 0.05 3.11 0.11NB 111,077 81 9.00 3.96 0.14 11.64 2.77 0.10 6.73 0.24QC 384,208 70 26.89 11.83 0.42 43.48 10.35 0.37 22.19 0.79ON 201,522 87 17.53 7.71 0.28 28.12 6.69 0.24 14.41 0.52MB 15,509 55 0.85 0.38 0.01 2.19 0.52 0.02 0.90 0.03SK 21,169 54 1.14 0.50 0.02 4.55 1.08 0.04 1.59 0.06AB 42,210 78 3.29 1.45 0.05 21.93 5.22 0.19 6.67 0.24BC 176,312 158 27.86 12.26 0.44 78.42 18.67 0.67 30.93 1.11YT x 72 x x x 0.03 0.01 0.00 0.01 0.00NT 547 52 0.03 0.01 0.00 0.02 0.01 0.00 0.02 0.00NU3 x x x x x x x x x x
Canada 1,025,429 77 91.7540.37
(20.18)81.44
(0.72)8 200.1 47.64 1.7088.01
(67.82)83.15
(2.42)8
1Data from NRCan 1999, Compendium of Forest Statistics2Data source, Penner et al.,19973Data unavailable.4 Assumes 12% water in oven dried biomass, and 50%C in dry weight, therefore 0.44 tC/ODT5Calculated as 35.76 GJ/tonne C6Data source, National Forestry Database Program, 20007Assumes 4.2 m3 per tC8Reduced figures represent a 50% reduction in biomass removal from the harvest site to promotesustainability.
A Canadian Biomass Inventory: Feedstocks for a Bio-based Economy 16S. Wood and D. B. Layzell, BIOCAP Canada Foundation
of residue production (Table 2.7 ), varied greatly by province but averaged about 19% nationally(equivalent to about 18 Mt Bone Dry Tonnes of biomass per year).
The residue portion may be used for a wide variety of purposes including value-added forestproducts and energy production, although economic considerations have meant that this fractionhas been historically under-utilized.
The most recent data, compiled in 1999, shows a trend towards better utilization of forest residues(Hatton, 1999). Best estimates suggest that residue use averages 70% across the country; thisfraction currently contributes to both value-added forest product manufacture, and to the productionof energy through co-generation (Table 2.6).
The remaining 30% of residues (equivalent to about 2.7 MT C/yr, Table 2.6) are left along the sideof logging roads if delimbing occurs in a centralized areanear the harvest site, landfilled, orincinerated without energy recovery. Incineration has been the focus of considerable debate, asthe burning of mill residues, also commonly called “hog fuel” can result in the emission ofparticulates; both hog-fuel burners and particulate emissions are regulated by permit. Legislation tocompletely eliminate beehive burners, has been unsuccessful in fully addressing the problem, butan economically viable alternative could reduce the problem of particulate emission and improveefficiency of energy recovery.
Similarly, abandoning non-merchantable biomass at the harvest site, or land-filling wood residuesoverlooks the opportunity to harvest both bio-products and energy from this potential resource;even harvesting biogas from the landfill site would improve efficiency.
As the utilization rate of residues has increased, the availability of the surplus has fallen, and it isexpected that this trend will continue. Both residue production and surplus availability are greatestin BC, AB, ON and QC, which together account for 94% of current surpluses (Hatton, 1999). ABhas addressed this gap with the installation of cogeneration facilities, with more planned pendingfunding support.
2.6. Energy from Forest Biomass
The previous sections have examined Canada’s forest resources and reported values in Mt Cstocks or Mt C harvested per year. This biomass contains a considerable amount of energy,estimated at 35.76 GJ / t C (Layzell, 2001).
For example, the 245 M Ha of the timber productive forest of Canada contains about 15,800 Mt C(Tables 2.2 and 2.4 ) which converts to about 566 EJ of energy. The annual energy use in Canadais about 12.6 EJ/yr, of which 8.24 EJ/yr is fossil fuel derived (Table 1.1). At any point in time, thestanding biomass in the Canadian forest contains sufficient energy to provide about 45 years ofCanada’s current total non-biomass energy needs, and about 69 years of Canada’s fossil fuelderived energy demand.
Each year, Canada’s forestry sector harvests about 47.7 Mt C/yr as roundwood, and about 40.4 MtC/yr of non-stem biomass for a total harvest of 88 Mt C/yr (Table 2.6). This harvest alone has anenergy content of about 3.1 EJ/yr, or approximately 36% of the current national energy that isprovided from fossil fuels. When biomass removal from the site is reduced by 50% to promotesustainability and protect ecosystem balance, a total harvest of 67.82 Mt C/yr, with energy contentof 2.42 EJ/yr, or approximately 29% of current national energy from fossil fuels is proposed.

A Canadian Biomass Inventory: Feedstocks for a Bio-based Economy 17S. Wood and D. B. Layzell, BIOCAP Canada Foundation
Table 2.7 Wood Residue Production, Use and Surplus 19981
Residue Production Residue Utilization Residue SurplusRegion M BDT/yr2 % Harvest3 M BDT/yr2 % Used M BDT/yr M t C/yr4 % harvest EJ/yr5
NL 0.07 5.1% 0.05 71 0.02 0.01 1.46% 0.000PE x x x x x x x xNS 0.2 6.8% 0.14 70 0.06 0.03 2.04% 0.001NB 0.61 10.8% 0.43 70 0.18 0.09 3.19% 0.003QC 5.73 27.7% 4.09 71 1.64 0.82 7.92% 0.029ON 1.53 11.5% 1.08 70 0.45 0.225 3.36% 0.008MB 0.08 7.7% 0.06 75 0.02 0.01 1.92% 0.000SK 0.16 7.4% 0.11 68 0.05 0.025 2.31% 0.001AB 1.57 15.1% 0.67 42 0.9 0.45 8.62% 0.016BC 7.75 20.8% 5.69 73 2.06 1.03 5.52% 0.037
Canada 17.7 18.6% 12.32 70% 5.38 2.69 5.64% 0.0961Data source, Hatton, 1999 2BDT - bone dry tonnes; all water extracted from sample 3Calculated residue production divided by the roundwood harvest (ODT/yr, Table 2.5)corrected for the 12% water content 4Assumes 0.5tC/BDT biomass5 Assumes 35.76 GJ / tonne C
Of course the majority of the roundwood harvest is used for forest products, but a significant portionof the non-stem biomass (20.2 - 40.4 Mt C/yr) should be available and has an energy content of0.72 - 1.44 EJ/yr or as much as 17% of Canada’s current fossil fuel energy use.
In addition, processing the roundwood yields a biomass residue that is surplus to current use in theamount of 2.7 MT C/yr and with an energy content of about 0.1 EJ/yr (Table 2.7). Therefore,without additional forest harvest, Canada has an untapped forest biomass resource of about 43.1Mt C/yr, equivalent to 1.54 EJ/yr, an energy value of about 19% of the national fossil fuel use.

A Canadian Biomass Inventory: Feedstocks for a Bio-based Economy 18S. Wood and D. B. Layzell, BIOCAP Canada Foundation
3. Biomass from Agricultural Sources3.1. Introduction
Agricultural activity in Canada produces millions of tons of biomass each year and has the potentialto offer feedstocks for bioenergy and specific bioproducts while improving the rural economy.
Biomass may be classified into two general categories: virgin biomass, which is the primaryoutcome of intentional biomass cultivation; and waste biomass, which comprises the residualfraction from primary harvest, as well as livestock wastes.
3.2. Agricultural Land Use
Farmland occupies about 67.5 M Ha of Canada’s land area, or 6.7% of the total. Crops are grownon 36.4 Mha (3.6% of the total landmass, or 53.9% of farmland). Agricultural land use is detailed inTable 3.1.
In general, agricultural production occurs on Class 1 and 2 lands, which offer superior soils andgeophysical characteristics, as well as appropriate growing seasons. These lands are concentratedin the southernmost regions of the country, and must compete with urban development. Class 3lands may be improved and brought into cultivation, but the proportion of land used for agriculturalproduction has increased very little over the last 25 years (Agriculture Canada, 1985; StatisticsCanada, 2002).
Of the lands used for agricultural production, about 54% are used for crop production, 7% aresummer-fallowed, a further 7% is used for the production of tame hay, while 23% is considered“natural pasture”. Other lands are occupied by rural buildings, wetlands and bush-lots and occupyabout 9% of total agricultural lands (Table 3.1).
Table 3.1 Farm Land Area, Canada, 2001
Area (Mha)
Region Total Land FarmLand2 Crop Land3 SummerfallowTame
Pasture4NaturalPasture All Other5
NL 41 0.04 0.01 0.001 0.003 0.007 0.02PE 1 0.3 0.2 0.001 0.01 0.001 0.06NS 6 0.4 0.1 0.001 0.02 0.03 0.2NB 7 0.4 0.1 0.001 0.02 0.03 0.2QC 154 3.4 1.8 0.01 0.2 0.2 1.2ON 108 5.5 3.7 0.01 0.3 0.5 1.0MB 65 7.6 4.7 0.3 0.4 1.6 0.7SK 65 26.2 15.4 3.1 1.4 5.1 1.2AB 66 21.1 9.7 1.2 2.2 6.7 1.2BC 94 2.6 0.6 0.04 0.2 1.2 0.5YT 48NT 135NU 209Canada 998 67.5 36.4 4.7 4.8 15.4 6.21Data source, Statistics Canada, Census of Agriculture, 20012Includes all farms reporting income from agricultural production.3Includes all crops except Christmas tree production.4Includes all tame and seeded pasture lands.5Includes Christmas tree production.

A Canadian Biomass Inventory: Feedstocks for a Bio-based Economy 19S. Wood and D. B. Layzell, BIOCAP Canada Foundation
Table 3.2 Agricultural Crop Production, Canada1
ProductionCrop Area Yield Total C in Yield C in plant3 Energy M ha ODT/ha M ODT Mt C/yr Mt C/yr EJ/yrWheat 10.95 1.88 20.57 8.64 17.28 0.62Barley 4.70 2.31 10.85 4.56 9.11 0.33Oats 1.91 1.41 2.69 1.13 2.26 0.08Grain corn 1.29 6.42 8.31 3.49 6.98 0.25Sum ofstarchcrops 18.85 42.42 17.81 35.63 1.27Canola 3.83 1.29 4.93 2.46 4.93 0.18Soybeans 1.08 1.51 1.63 0.82 1.63 0.06Flaxseed 0.67 1.06 0.72 0.36 0.72 0.03Sum of oilcrops 5.58 7.27 3.64 7.27 0.26Rye 0.18 1.26 0.23 0.10 0.10 0.00Fodder corn 0.18 5.21 2.19 2.19 0.08Tame hay 7.07 3.27 23.15 9.72 9.72 0.35Sum offoragecrops 7.44 28.59 12.01 12.01 0.43Totals 31.87 av. 2.27 78.27 33.46 54.91 1.961Crop production and area statistics from Statistics Canada, Census ofAgriculture 2001, with the exception of "fodder corn", which is derived fromprovincial statistics for 2001. Area devoted to fodder corn production isunderestimated because of non-reporting by the Province of Alberta, whichreveals production tonnage, but not production area; thus, yield has not beencalculated for this parameter.2Carbon content is assumed to be 50% of oil seed crops and 42% of starchseed crops and forages.3Assumes a harvest index of 50% for seed crops and 100% for forage crops.
3.3. Crop production
3.3.1. Crop Types and Production RatesMany of the agricultural crop species grown in Canada store carbon in the form of starch. Thisgroup includes the cereal grains (wheat, barley, oats, rye), and grain corn. Together, starch-producing crops occupy 59% of the land area devoted to the production of the ten major cropspecies, and account for 54% of the dry tonnage produced (Table 3.2).
Other crops, such as canola, soybeans and flaxseed are grown for their carbon dense seed oils(lipids). Seed oil crops occupy approximately 17% of the land area devoted to major crops, andproduce about 9% of the total crop tonnage.
The remaining portion of land devoted to the ten major crops (23%) is used to produce foragecrops such as tame hay, and fodder corn. Forage crops, which contain lignocellulosic carbon,are essential livestock feeds and represent 36% of major crop production.
The major crops listed in Table 3.2 each occupy a significant land area and have dedicatedmarket commitments. Nevertheless, the total area occupied by these crops (31.8 M ha)represented only 47% of all agricultural lands (67.5 M ha) in 2001 (Statistics Canada, 2001

A Canadian Biomass Inventory: Feedstocks for a Bio-based Economy 20S. Wood and D. B. Layzell, BIOCAP Canada Foundation
Census of Agriculture).
The remaining land base includes arable land that is more fluid in seasonal usage andencompasses the demands of livestock rearing, specialty crop production, fruit and vegetableproduction, ornamental and landscape species cultivation and numerous minor enterprises. Aswell, some land is occupied by farm buildings, roads, wetlands and bush and is not consideredreadily available for crop production.
Cultivation of biomass for bioenergy or for targeted bioproducts seems likely to initially occur onless dedicated agricultural lands, where localized response to regional needs may be morequickly addressed, and where a strong interest in non-food uses of agricultural crops hasalready been identified ( Jannasch et al., 2001).
3.3.2. Annual Carbon ProductionSince oil is more highly reduced than starch, oil seeds (e.g. canola, soyeans) have a higher Ccontent (about 50% of dry weight) than that of starch containing seeds such as wheat or corn(about 42% of dry weight). Similarly, lignocellulosic plant material has a C content of about 42%of dry weight ( Klass, 1998).
Assuming these values, the carbon content of the agricultural harvest in Canada is about 33 MtC / yr, 53% of which is associated with the starch producing crops.
However, an accurate assessment of the carbon content related to yield must also account forthe portion of the plant that is harvested. Forage crops are harvested nearly intact, and henceare considered to have a harvest index of 100%; in contrast, the reported harvested portion ofcereal grains and seed crops represents only about 50% of the total plant mass andconsequently, only 50% of the total carbon. From the ten major agricultural crops listed in Table3.1, carbon content of the entire crop has been estimated at 55 Mt C/yr (Table 3.2).
The difference between the whole plant C yield and the crop yield is about 21.4 Mt C/yr and isconsidered to be crop residue, consisting of straw and chaff of cereal crops, stover of corn andunused fodder crops.
3.4. Crop residues
3.4.1. Factors Affecting Residue ProductionThe maximum C potential of crop residues overestimates true availability because someresidues must remain in the field to ensure soil fertility, and other portions are lost duringcollection. As well, residues perform traditional roles, serving as animal bedding andagricultural mulches.
Straw to grain ratios vary with individual crop species, and the extent of drought stressexperienced by the crop in an individual year. When the soil type and soil moisture deficit(SMD) data is known for an individual region, the straw to grain ratio may be predicted with ahigh degree of accuracy (see “Agricultural Fibre in Manitoba”, 2000). Under average weatherconditions, the straw to grain ratio for wheat is conservatively estimated to be 1.3:1 ( Klass,1998; Levelton, 2000); all other seed crops are assumed to average a 1:1 ratio of harvested toresidue fractions.
Both of these ratios reflect the lower limit of actual production, which may be as high as 1.7:1for wheat ( Levelton, 2000) and 1.4:1 for other crops ( Helwig et al., 2002). It is important to notethat the amount of straw produced can be altered simply by cultivar selection and that thisparticular characteristic is one amenable to adjustment both by traditional breeding methodsand by genetic alteration, thus offering growers the potential for economic reward whenresidues are in demand.

A Canadian Biomass Inventory: Feedstocks for a Bio-based Economy 21S. Wood and D. B. Layzell, BIOCAP Canada Foundation
The development of new semi-dwarf varieties of wheat with improved wind tolerance and lowerlodging rates, in contrast, produced similar amounts of crop residue, but a larger proportion ofchaff to harvestable straw ( Bulman et al., 1995). While semi-dwarf varieties are not yet widelygrown, improving collection technology to capture more chaff would allow producers to reap thebenefits of better field characteristics, while retaining optimal residue biomass (PrairieAgricultural Machinery Institute (PAMI, 2003).
3.4.2. Use of residues to maintain soil healthIn all crop systems, a portion of the crop residue must be returned to the soil to ensure themaintenance of soil tilth, humic content and fertility. The requirements of individual soilsdepend on a number of factors, which include but are not limited to, soil type and pH, soilfertility and method of fertility enhancement, susceptibility to wind or water erosion, the natureof crop rotation patterns and the depth of tillage.
For cereal crops, residues may be removed when yield exceeds 4.0 t/ha ( Kerstetter and Lyons,2001; assumes 2.4711 acres/ha, 2204 lbs/t, 36.7 bushels of wheat/t). On prairie soils, between750 and 1500 kg/ha of crop residue is essential to prevent wind erosion ( Bulman et al., 1995),with conservation tillage reducing the requirements to the very lowest end of this scale(Larson, 1979).
Minimal residue requirements for cereal croplands are estimated to be 20% of total cropresidues (Stumborg et al., 1996). At the present time, grain corn, canola and soybean stoversare often not removed from the field, primarily because there is no infrastructure for theirsubsequent use. Under conservation tillage systems in Ontario and Quebec, the advantages ofimproved soil warming in the spring and facilitation of seedling emergence are believed tojustify the cost of grain corn stover removal ( Helwig et al., 2002); this stover is usuallycomposted or burned without energy capture.
3.4.3. Recovery of stover residuesBiomass of soybean and canola stover are estimated to be equal the harvested crop, but maybe difficult to recover as natural degradation processes cause leaf drop by the time seed podsare sufficiently dry for harvest. Similarly, wet fall conditions frequently delay the harvest of graincorn until after the soil has frozen and considerable biomass losses have occurred.
The relationship between mass of stem and leaf tissue at the time of harvest is not known, sothe recovery rate of stover has been reduced to 50% to account for anticipated losses duringharvest. Similarly, other crops have been assumed to have lower than ideal recovery rates toaccount for the vagaries of harvest season weather, and consequent losses due to excessivemoisture or mud.
Improvements in the recovery of residues offer the potential to increase biomass availability by30 – 40 percent (PAMI, 2003). This single factor could mean an increase in carbon harvestfrom 14.6 Mt C/yr to 20.4 Mt C/yr.
3.4.4. Market diversions of agricultural residuesHistorically, agricultural residues have been used for livestock bedding, insulation andmulching. More recently, interests in using straw for ethanol production ( Iogen Corp., Ottawa,ON) or the manufacture of composite board (“Wood Stalk ‘”, Dow-Bioproducts, Elie, MB) havecreated local demand for cereal grain straw and prompted interest in improving efficiency ofharvest and transportation infrastructure (PAMI, 2003).
In Eastern Canada, approximately 65% of straw residues supply existing markets ( Helwig etal., 2002), but the distribution of usage is very different in the Western provinces. In Manitobafor example, 93.5% of barley straw is committed to livestock bedding but only 6.7% of wheatstraw is used for livestock bedding with a further 6% used for the production of strawboard inthe Elie plant just west of Winnipeg; by comparison, there is virtually no demand for the

A Canadian Biomass Inventory: Feedstocks for a Bio-based Economy 22S. Wood and D. B. Layzell, BIOCAP Canada Foundation
600,000 tonnes of oat straw produced per year (see, “Agricultural Fibre in Manitoba”, 2000).Only 25.8% of the total 4.7 M tonnes of straw available in Manitoba supplies dedicated usage,and burning in the field eliminates a considerable fraction
In the calculations presented here, 50% of cereal grain straw is considered to be availablealthough this number seems very low given the apparent potential outlined by the Manitobastatistics, which suggest that over 70% of straw may be available. Actual harvest datahowever, show extreme variability in the production of straw residues over the six-year periodfrom 1992-1998 (see, “Agricultural Fibre in Manitoba”, 2000) as a result of poor weatherconditions. Over the longer term, 50% availability provides a more realistic framework forbiomass planning in the west and more accurately matches harvest data for Eastern Canada,where weather patterns were less severe over the same survey period and harvests morestable.
For crops such as grain corn, where stover has not traditionally been harvested, 100% ofrecoverable residues are considered available for biofuel or bioproducts manufacture or for useas an energy source.
Agricultural residues that are recoverable from the field, while preserving soil integrity andaccounting for losses during the harvest process, provide 14.6 Mt C/yr with an energy value of0.5 EJ. Traditional uses reduce current availability to 8.6 Mt C/yr, with energy potential of 0.3EJ, but emerging markets have already shown that residue diversion can occur quickly witheconomic motivation.

A C
anad
ian
Bio
mas
s In
vent
ory:
Fee
dsto
cks
for
a B
io-b
ased
Eco
nom
y23
S. W
ood
and
D. B
. Lay
zell,
BIO
CA
P C
anad
a F
ound
atio
n
Tab
le 3
.3 B
iom
ass
fro
m A
gri
cult
ura
l Cro
p R
esid
ues
in C
anad
a, 2
001
Yie
ld o
f C
rop
s an
d C
rop
Res
idu
esC
urr
entl
y A
vaila
ble
Res
idu
es
Cro
pT
otal
Pro
duct
ion
Str
aw/
Sto
ver
Sus
tain
ably
Rem
ovab
leR
esid
ues
(SR
R)1,
2,3,
4R
ecov
erab
le S
RR
5E
nerg
y P
oten
tial
of S
RR
8A
mou
ntA
vaila
ble6
C C
onte
nt7
E
nerg
yP
oten
tial8
M
OD
T/y
rM
OD
T/y
rM
OD
T/y
rM
OD
T/y
rM
tC
/yr
EJ/
yrM
OD
T/y
rM
t C
/yr
EJ/
yrW
hea
t20
.626
.721
.414
.97
6.74
0.24
17.
493.
370.
120
Bar
ley
10.8
10.8
8.68
6.07
2.73
0.09
83.
041.
370.
049
Oat
s2.
72.
72.
151.
510.
680.
024
0.75
0.34
0.01
2G
rain
co
rn8.
38.
36.
653.
331.
500.
054
3.33
1.50
0.05
4C
ano
la4.
94.
93.
942.
761.
240.
044
2.76
1,24
0.04
4S
oyb
ean
s1.
61.
60.
330.
160.
070.
003
0.16
0.7
0.00
3F
laxs
eed
0.72
0.72
0.57
0.40
0.18
00.
006
0.20
0.9
0.00
3R
ye0.
230.
230.
180.
130.
570.
002
0.06
0.29
0.00
1F
od
der
co
rn5.
20
00
0.26
0.00
90.
260.
120.
004
Tam
e h
ay23
.10
00
1.15
70.
041
1.16
0.52
0.01
9
To
tals
78.2
756
.09
43.8
929
.33
14.6
20.
523
17.7
98.
640.
309
1 Ass
umes
that
str
aw to
gra
in r
atio
for
whe
at is
1.3
:1 (
Leve
lton,
200
0 A
sses
smen
t of n
et e
mis
sion
s of
GH
G fr
om E
tOH
-ble
nded
gas
olin
es in
Can
ada;
ligno
cellu
losi
c fe
edst
ocks
, R-2
000-
2 A
AF
C).
Thi
s ra
tio r
epre
sent
s th
e lo
wer
end
of L
evel
ton'
s pr
opos
ed r
ange
of 1
.3 -
1.7
:1.
2 Ass
umes
a s
traw
to g
rain
rat
io o
f 1:1
for
all o
ther
cer
eal g
rain
s (H
elw
ig e
t al.,
2002
).3
Sto
ver
from
gra
in c
orn
prod
uctio
n in
Eas
tern
Can
ada
aver
ages
2.5
OD
T/h
a an
d eq
uals
the
quan
tity
of c
orn
grai
n ha
rves
ted
in O
TD
s (
Hel
wig
et a
l., 2
002)
.S
tatis
tics
Can
ada,
how
ever
, sho
ws
that
har
vest
ed y
ield
ave
rage
s ju
st o
ver
6 O
DT
/ha
whi
ch is
sub
stan
tially
diff
eren
t... i
t is
uncl
ear
whe
ther
the
Sta
ts c
anfig
ure
incl
udes
fodd
er a
nd g
rain
cor
n, o
r gr
ain
corn
alo
ne. A
1:1
rat
io o
f har
vest
ed c
rop
to s
tove
r is
ass
umed
.4 A
ssum
es a
n av
erag
e su
stai
nabl
e re
mov
al r
ate
of 8
0% (
Kla
ss, 1
998;
Hel
wig
et a
l., 2
002)
for
all c
rops
exc
ept s
oybe
an.
Soy
bean
sto
ver
is n
ot g
ener
ally
cons
ider
ed h
arve
stab
le e
xcep
t on
cons
erva
tion
tilla
ge s
oil,
whi
ch c
onst
itute
s ap
prox
imat
ely
20%
of s
oybe
an la
nd, w
here
they
may
be
com
plet
ely
rem
oved
.H
ence
, yie
ld o
f sus
tain
ably
rem
ovab
le s
oybe
an r
esid
ues
is a
ssum
ed to
be
20%
of s
tove
r.5 A
ssum
es th
at n
ot a
ll su
stai
nabl
y re
mov
able
res
idue
s m
ay b
e re
trie
ved,
and
red
uces
thes
e by
30%
to a
ccou
nt fo
r di
fficu
lties
dur
ing
reco
very
, exc
ept f
orgr
ain
corn
and
soy
bean
s, w
hich
are
red
uced
by
50%
to a
ccou
nt fo
r la
te h
arve
st.
6 Ass
umes
that
bio
mas
s w
ill c
ontin
ue to
be
dive
rted
to tr
aditi
onal
use
s, le
avin
g av
aila
ble:
50%
of c
erea
l str
aws;
100
% o
f rec
over
able
gra
in c
orn
stov
er,
cano
la, a
nd s
oybe
an s
tove
r; 5
% o
f fod
der
corn
, and
tam
e ha
y w
hich
is u
nuse
d in
an
aver
age
year
(H
elw
ig e
t al.,
200
2). T
his
assu
mpt
ion
over
estim
ates
avai
labi
lity
of s
traw
in N
B a
nd P
EI,
whe
re p
rodu
ctio
n is
qui
te lo
w, a
nd u
nder
estim
ates
ava
ilabi
lity
in M
B a
nd S
K w
here
pro
duct
ion
is h
ighe
r on
ave
rage
.7 C
arbo
n co
nten
t is
base
d on
an
aver
age
yiel
d fo
r ag
ricul
tura
l res
idue
s of
45%
C in
OD
bio
mas
s (B
ioen
ergy
Con
vers
ion
Fac
tors
_ .
8 A
ssum
es th
at 3
5.76
GJ
of e
nerg
y m
ay b
e de
rived
from
eac
h to
nne
of c
arbo
n fr
om d
ried
biom
ass.
Thi
s co
nver
sion
fact
or h
as b
een
test
ed a
gain
st u
pper
and
low
er h
eatin
g va
lues
, bot
h th
eore
tical
and
mea
sure
d, fo
r a
varie
ty o
f bio
logi
cal f
eeds
tock
s an
d is
acc
urat
e to
5%
in e
very
cas
e. C
ompa
rativ
e fig
ures
from
Kla
ss, 1
998,
wer
e us
ed to
der
ive
this
con
vers
ion
fact
or.
9 Ass
umes
that
1.0
gig
ajou
le (
GJ)
= 1
.0 X
109 jo
ules
; 1.0
exa
joul
e (E
J) =
1.0
X 1
018 jo
ules
; 1.0
GJ/
t = 1
.0 X
106 B
TU
s/to
n (K
lass
, 199
8).

A Canadian Biomass Inventory: Feedstocks for a Bio-based Economy 24S. Wood and D. B. Layzell, BIOCAP Canada Foundation
3.5. Biomass from livestock waste
Livestock manure is a readily available source of waste biomass in Canada. In general, manuresare used directly as soil amendments, and the opportunities for deriving energy is overlooked.
However, there are problems associated with direct application of manure to soils includingbacterial contamination of surface and groundwater supplies, over-enrichment of soils with nitrogenor phosphorus and nuisance odours. In addition, manure produces methane gas and nitrous oxide,two potent greenhouse gases.
Treatment of manure by aerobic or anaerobic digestion systems, with concomitant harvest ofbiogas, could mitigate these problems, while producing a nutrient-rich fertilizer and providing arenewable energy resource.
3.5.1. Livestock Waste ProductionTable 3.4 shows livestock waste production by four major industries: dairy, beef, poultry andswine, while Table 3.5 demonstrates the biogas and heating potential for each industry.Energy derived from livestock waste is expected to supply on-farm requirements, althoughlarger farms have the potential to supply some off-farm users as well.
Estimates show that typical household electrical demands could be met by the averageQuebec dairy farm, which would offer a considerable savings to the farm owner/operator(Helwig et al., 2002). While energy potential from manure wastes will not address a large
Table 3.4 Livestock Manure Production, Canada, 2001
LivestockNumber ofAnimals1
Averagemass/animal2
Manureanimal/day3
Dailytotal
Yearlytotal
%Recoverable4
Recoverablemanure/yr
Kg/animal Kg/animal M kg Mt % Mt
Dairy (maturecows) 1,060,965 636 52 55 19 75 14Beef (largeanimals) 6,533,500 568 34 222 81 25 20Poultry 126,159,529 1 0.06 8 2 85 2Swine 13,913,001 90 5 72 26 85 22Totals
147,666,995 - - 357 128 581Assumes the number of living animals at any time during the calendar year; poultry numbers are for thestanding flock and are calculated by dividing yearly production by the number of flocks raised per year.Poultry numbers are for meat chickens only, and do not include laying hens or turkeys. Beef and dairylivestock numbers are based on mature animals and do not include calves. Statistics Canada livestockinventory numbers, used here, do not match provincial data; available provincial data are consistently higher.2Assumes that average slaughter weight for steers and heifers is 400 kg, 500 kg for cows and 800 kg forbulls; average slaughter weight for swine is 120 kg.3 Mass of manure produced per animal per day (Helwig et al., 2002). While these figures are not for ovendried residues and moisture content varies depending upon food source, and method of manure collection,they are within the scope of other sources, such as Klass, 1998 and Statistics Canada, when moisturecontent is calculated at 50% of mass.4 The percentage of recoverable manure depends on the growth environment of the livestock. Manure fromfield grazed animals is considered lost due to difficulties in collection. The percentages used are highlyconservative and actual recovery rates could be much higher on individual farms.

A Canadian Biomass Inventory: Feedstocks for a Bio-based Economy 25S. Wood and D. B. Layzell, BIOCAP Canada Foundation
Table 3.5 Biogas and Heating Potential from Livestock Wastes, 2001
LivestockRecoverablemanure/yr
Biogas Potential1 % methane2
Energeticheating value3
Mt m3/day m3/yr % GJ/day GJ/yrDairy(maturecows) 14 1,504,086 548,991,590 54 29,808 10,880,015Beef (largeanimals) 20 4,661,092 1,701,298,790 53 92,470 33,751,572
Poultry 2 515,061 187,997,626 60 11,445 4,177,725
Swine 22 2,003,269 731,193,287 58 43,108 15,734,539Totals
58 8,683,508 3,169,481,293 176,831 64,543,8491Assumes that conversion of ft3 to m3 = ft3/35.315 (Klass, 1998), and conversion of lbs to kgs = lbs/2.205. Alsoassumes that biogass production per 493.8 kg body weight for beef is 0.62 m3/day, for dairy is 1.10 m3/day, forpoultry is 1.44 m3/day and for swine is 0.79 m3/day, (Helwig et al., 2002). Biogas calculated as livestock biogasproduction constant/493.8kg bodyweight X number of animals X average weight/animal.2Percentage methane presented is specific for different livestock species and may vary according to availablefeeds. The values presented here are from Helwig et al., 2002 and are consistent with values expressed in othersources such as Klass, 1998 where a variety of measurement techniques are compared.3 Energetic heating value calculated as per Helwig et al., 2002, using derived constants for dairy, 0.021 GJ/493.8kg bodyweight; beef 0.012 GJ/493.8 kg; poultry 0.032 GJ/493.8 kg; and swine 0.017 GJ/493.8 kg. Energeticheating potential presumes the combustion of dried wastes.
proportion of Canada’s total energy requirement, the possibility of meeting local need issignificant.
Some technological hurdles associated with efficient function of digester systems in coldCanadian climates must be addressed, but recent nutrient management legislation designed tominimize the environmental impact of animal wastes will be a strong motivator for producers toconsider digesters for their multiple advantages, and livestock wastes for their carbon potential.
3.6. Summary of Biomass from Agricultural Sources
Farmland occupies 67.5 M ha (6.7% of Canada’s total land mass) and this land is used for theannual production of crops and animals, primarily for food and feed (Table 3.1).
Crop production involves 36.4 M ha of land. Of this area, about 32 M ha are planted each year toproduce a crop yield with a carbon content of about 33.5 Mt C/yr (Table 3.2). The total yield of theabove ground biomass from these plants has a carbon content of roughly 55 Mt C/yr, with anenergy content of about 2 EJ/yr (Table 3.2). This energy content is equivalent to about 24% of theannual fossil fuel energy use in Canada.
Agricultural residues were estimated to have a total of 56 M ODT/yr, but some of this residue mustbe incorporated into the soil to maintain soil fertility and carbon content. However, the recoverableportion contains 14.6 Mt C/yr, with an energy potential of 0.52 EJ/yr (Table 3.3). This representsabout 25% of the energy content in the annual agricultural harvest in Canada, and is equivalent toabout 6.3% of the fossil fuel energy use in Canada.
However, not all residue is likely to be available since there are some traditional uses for the strawand stovers, including animal bedding and mulching. When these amounts are considered, as wellas a discount for variability in harvest success, agricultural biomass availability may be as low as8.6 Mt C/yr, having a energy content of 0.31 EJ/yr (Table 3.3). This represents about 16% of the

A Canadian Biomass Inventory: Feedstocks for a Bio-based Economy 26S. Wood and D. B. Layzell, BIOCAP Canada Foundation
energy content in the annual agricultural harvest in Canada, and is equivalent to about 3.7% of thefossil fuel energy use in Canada.
Research to improve harvesting equipment to better gather crop residues, and to reduce handlingcosts is currently underway (PAMI). Considerable interest in innovative agricultural productdevelopment, and commitment of research and development funds has already been made (CARC,Pembina, BIOCAP).
Livestock wastes could produce over 3 billion m 3 of biogas annually through anaerobic digestion.This process could provide an energy source of 0.065 EJ/yr, an amount equal to 3.3% of the annualagricultural harvest, or 0.8% of the current fossil fuel energy use in Canada. As well as providingenergy, digestion of livestock wastes mitigates odour and reduces the risk of surface andgroundwater contamination and complies with “nutrient management” initiatives recently introduced.Digested livestock manure is an excellent soil amendment.

A Canadian Biomass Inventory: Feedstocks for a Bio-based Economy 27S. Wood and D. B. Layzell, BIOCAP Canada Foundation
4. Biomass from Municipal Waste4.1. Municipal waste as a source of biomass
Anthropogenic wastes contain discarded energy-containing biomass materials, often of virginbiomass origin. Because the disposal of wastes is costly, and has negative environmental impacts,it is advantageous to remove and recycle biomass from disposed materials. By doing so, thevolume of solid waste may be dramatically reduced, nuisance odors controlled, bacterial pollution ofwater resources minimized and the opportunity for energy derivation optimized.
Municipal solid waste is highly abundant, particularly in regions of greatest population density, andis generated with a steady flow. The fact that wastes tend to be concentrated in production permitscentralization of processing. In Canada, approximately 750 kg/person of municipal solid waste isgenerated each year (derived from Statistics Canada, 2000).
4.1.1. Generation of municipal solid wastesIn general, municipal solid wastes (MSW) may be considered to fall into three categories: urbanor residential wastes, which are generally picked up at the curb or transported directly by theproducer to landfill; industrial, commercial and institutional (I, C & I) wastes, which arise fromcommercial enterprises and are temporarily stored on-site in bulk-lift containers before haulage;and demolition, landscaping and construction (DLC) wastes, which are usually trucked directlyto landfill. Canadian municipal waste generation data, as tabulated by municipalities on thebasis of wastes for which tipping fees must be paid, is summarized by province and source inTable 4.1. A majority of municipal waste is disposed of by landfilling; some smallercommunities have limited combustion programs as well.
4.1.2. Diversions of municipal solid wastes by recyclingNot all municipal solid wastes generated are disposed of through landfilling or combustion: anincreasingly significant proportion of waste is diverted from landfill through recycling. Recyclingmay occur at residential, commercial or industrial sources, and diverts approximately 24% ofgenerated wastes on a per capita basis as shown in Table 4.2. Other sources suggest thatresidential and IC&I source recycling occurs at a significantly lower level than reported(Chornet, 2002).
4.1.3. Biomass potential of recycled materialsOver 60% of recycled materials have biomass potential, and a carbon value totaling 2 Mt C/yr,as summarized in Table 4.3. Some recycled materials serve dedicated markets, but the extentof these markets varies widely geographically, leaving unused biomass suitable for energyproduction in every region. An accurate assessment of biomass availability is made moredifficult by the variability in recycling strategies and capabilities. It is clear, however, that in allregions there is strong potential for extracting biomass materials from recycled wastes, and thatcommitment to recycling is an increasing trend.

A Canadian Biomass Inventory: Feedstocks for a Bio-based Economy 28S. Wood and D. B. Layzell, BIOCAP Canada Foundation
Table 4.1 Generation of Municipal Solid Wastes, 2000
Sources of Municipal Solid Wastes
Urban1 IC&I2 DLC3 Sum4 Per Capita5Regiontonnes kg/person
NL x x x x 842PE x x x x 746NS 266,503 287,025 24,561 578,089 615NB 273,159 279,572 x 552,731 750QC6 3,457,320 4,840,380 1,383,500 9,681,200 1,312ON 3,807,311 5,080,065 975,281 9,862,657 925MB 358,222 x x 358,222 1,007SK 380,851 x x 380,851 1,074AB 822,310 1,618,907 x 2,441,217 xBC 1,168,668 x x 1,168,668 x
YT, NT, NU x x x x 778Canada 10,869,156 15,814,967 3,802,440 25,023,634 1,021
Source: Statistics Canada, 2000Numbers may not add up due to rounding.x - Provinces may choose non-disclosure of Provincial data under the Secrecy Act.1Assumes amount of non-hazardous residential waste disposed of in public andprivate waste disposal facilities. Does not include wastes disposed in hazardouswaste disposal facilities or wastes managed by the producer on site.2Assumes Industrial, Commercial, and Institutional (IC&I) solid non-hazardousrecyclable materials are those generated by all IC&I sources in a municipality, andare excluded from the residential waste stream. These include: industrial recyclablematerials, which are generated by manufacturing and primary and secondaryindustries, and managed off-site from the manufacturing operation; commercialrecyclable materials, which are generated by commercial operations such asshopping centres, restaurants, offices, etc; and institutional materials which aregenerated by institutional facilities such as schools, hospitals, government facilities,seniors homes, universities, etc.3Assumes construction and demolition non-hazardous recyclable materials refer tomaterials generated by demolition, land-clearing and construction (DLC) activities.These generally include materials such as concrete, brick, painted wood, rubble,drywall, metal, cardboard, doors, windows, wiring, etc. but exclude materials fromland clearing on areas not previously developed, asphalt and clean sand or gravel.4Does not include net exports of garbage, which exceed 900,000 t in Ontario aloneand are not disclosed by other provinces.5All population data from Statistics Canada , CANSIM, Table 051-0001.6Data derived from provincial survey.
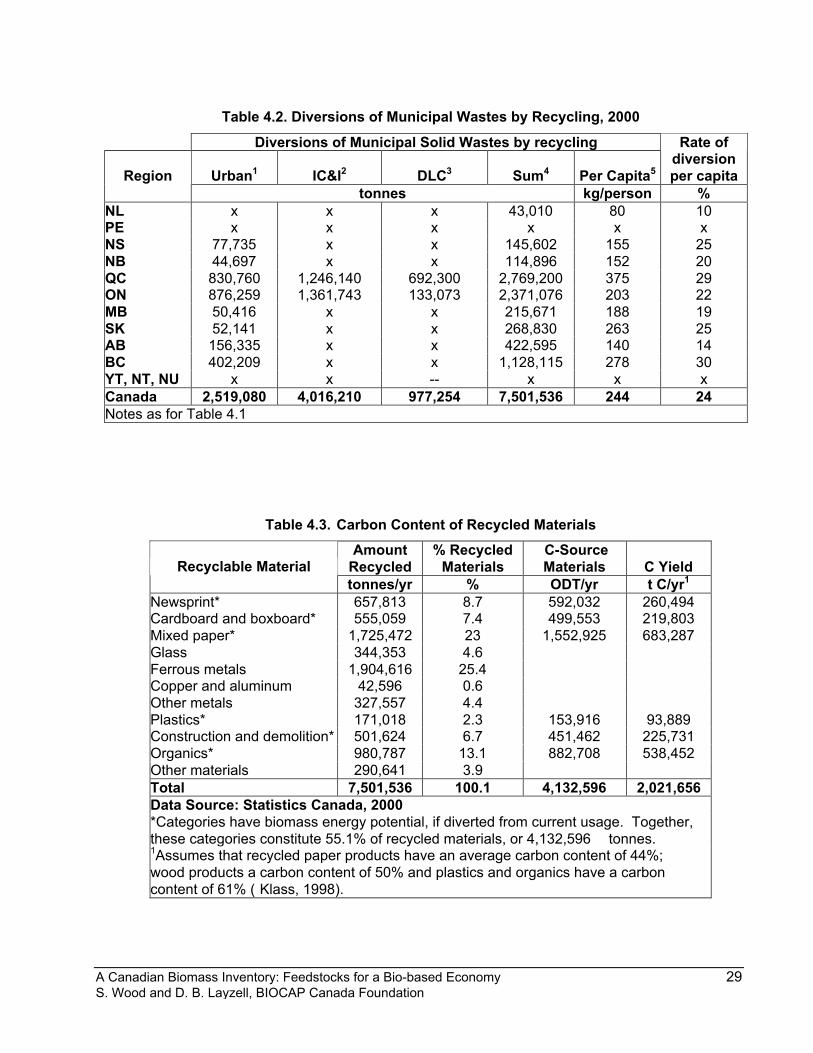
A Canadian Biomass Inventory: Feedstocks for a Bio-based Economy 29S. Wood and D. B. Layzell, BIOCAP Canada Foundation
Table 4.3. Carbon Content of Recycled Materials
AmountRecycled
% RecycledMaterials
C-SourceMaterials C YieldRecyclable Material
tonnes/yr % ODT/yr t C/yr1
Newsprint* 657,813 8.7 592,032 260,494Cardboard and boxboard* 555,059 7.4 499,553 219,803Mixed paper* 1,725,472 23 1,552,925 683,287Glass 344,353 4.6 Ferrous metals 1,904,616 25.4 Copper and aluminum 42,596 0.6 Other metals 327,557 4.4 Plastics* 171,018 2.3 153,916 93,889Construction and demolition* 501,624 6.7 451,462 225,731Organics* 980,787 13.1 882,708 538,452Other materials 290,641 3.9 Total 7,501,536 100.1 4,132,596 2,021,656Data Source: Statistics Canada, 2000*Categories have biomass energy potential, if diverted from current usage. Together,these categories constitute 55.1% of recycled materials, or 4,132,596 tonnes.1Assumes that recycled paper products have an average carbon content of 44%;wood products a carbon content of 50% and plastics and organics have a carboncontent of 61% ( Klass, 1998).
Table 4.2. Diversions of Municipal Wastes by Recycling, 2000
Diversions of Municipal Solid Wastes by recycling
Urban1 IC&I2 DLC3 Sum4 Per Capita5
Rate ofdiversionper capitaRegion
tonnes kg/person %NL x x x 43,010 80 10PE x x x x x xNS 77,735 x x 145,602 155 25NB 44,697 x x 114,896 152 20QC 830,760 1,246,140 692,300 2,769,200 375 29ON 876,259 1,361,743 133,073 2,371,076 203 22MB 50,416 x x 215,671 188 19SK 52,141 x x 268,830 263 25AB 156,335 x x 422,595 140 14BC 402,209 x x 1,128,115 278 30YT, NT, NU x x -- x x xCanada 2,519,080 4,016,210 977,254 7,501,536 244 24Notes as for Table 4.1

A Canadian Biomass Inventory: Feedstocks for a Bio-based Economy 30S. Wood and D. B. Layzell, BIOCAP Canada Foundation
Table 4.4 Energy Potential of Disposed Municipal Solid Wastes, 2000
TotalDisposedWastes
CombustibleFraction
(CF)1 Dried CF2CarbonYield3
EnergyPotential4
Region tonnes EJ/yrNL 409,599 348,159 269,824 110,628 0.004PE x x x x xNS 432,487 367,614 284,901 116,809 0.004NB 472,612 401,720 311,333 127,647 0.005
QC6 6,912,000 5,875,200 4,553,280 1,866,845 0.067ON 7,491,581 6,367,844 4,935,079 2,023,382 0.075MB 938,624 797,830 618,318 253,510 0.009SK 828,359 704,106 545,682 223,730 0.008AB 2,750,004 2,337,503 1,811,565 742,742 0.027BC 2,592,191 2,203,362 1,707,606 700,118 0.025
YT, NT and NU x x x x x
Canada 22,985,027 19,403,339 15,037,587 6,165,411 0.2241Assumes that 85% of MSW is combustible (Klass, 1998).2Assumes that average moisture content of MSW is 22.5% (Klass, 1998).3Assumes that carbon yield from MSW averages 41% (Klass, 1998).4Assumes 35.76 GJ/t dried biomass.
4.2. Energy potential of recycled materials
Assuming that 35.76 GJ of energy are produced per tonne of dried biomass carbon, a total of 0.07EJ of energy are available from the recycled biomass components of MSW, with the best potentialfor mixed paper and organics. Direct derivation of heat energy from recycled materials may not bethe most efficient approach for claiming this carbon source. More typically, recycled materials areprocessed into consumer products. Reclaimed paper, for example may be recycled into paper, orused for boxboard manufacture; the real energy saving in this instance comes from the reduction inenergy used for primary manufacture along with the reduction in use of primary carbon resources,with savings evaluated on a case-by-case basis.
4.3. Energy potential of disposed municipal wastes
Despite diversions of specific waste components to recycling, MSW contains on average 85%combustible materials from which energy may be derived by a variety of methods. Thesetechnologies include combustion, pyrolysis, gasification and production of biogas through aerobic oranaerobic fermentation. The first three technologies listed require the removal of approximately22.5% moisture from the raw garbage, but offer great potential both for the capture of energy andthe production of specific bio-products.
Concerns about the emission of particulates from combustion processes caused a shift to landfillingin Canada, and an overall decline in the support for incineration. Improvements in combustiontechnology have shown that particulate emission is manageable and that substantial energycapture, as well as a reduction in the need for landfilling sites, are measurable benefits.
A Japanese model has demonstrated long-term success, and modern co-generation facilities arenow operational in Ottawa. Energy potential of disposed municipal wastes, based on carbon yield ispresented in Table 4.4. The total energy potential is 0.22 EJ, which represents 2.7% of Canada’s

A Canadian Biomass Inventory: Feedstocks for a Bio-based Economy 31S. Wood and D. B. Layzell, BIOCAP Canada Foundation
total annual energy use from fossil fuels (Table 1.1). With the addition of energy from recycledmaterials, combined MSWs could produce 2% of total energy consumption. In their document“Renewables in global energy supply, 2001”, the International Energy Agency ( www.iea.org)suggests that energy derived by combustion of biomass from municipal solid wastes is worthy ofconsideration in outlying, off-the-grid areas of Canada.
Clearly the potential for co-generation of energy using MSW as the carbon source, is real and mostconcentrated in areas of population density. Combustion of MSW using modern technology offersadded benefits of environmental protection and waste management.
Derivation of energy from MSW is also possible without immediate combustion, as has beenexplored through a pilot project operated at the City of Sherbrooke, QC through the cooperativeefforts of Universite de Sherbrooke, Enerkem Technologies Inc., and Groupe KemestrieInc.(Chornet, 2002). Residential and ICI MSWs brought to the pilot project site are sorted.Recyclable metals and glass are removed and sent to the appropriate recycling facilities, putrescentmaterials are composted and non-recyclable residues are gasified to produce syngas used forgeneration of heat, steam or electricity. Economic analysis shows that this method of garbagehandling is cost effective when tipping charges for landfilling exceed $30 US/ tonne, with the addedvalue of recovering energy for co-generation. Tipping charges are expected to rise as restrictionson landfilling are implemented.
4.4. Municipal biosolid generation and availability
A second source of municipal biomass is biosolids, or sewage sludge, that is the product oftreatment of wastewater. Wastewater treatment facilities are used to remove excrement as well asparticulate, organic, bacterial, chemical and toxic materials from residential and industrial effluent
Table 4.5 Biosolid Generation, 2001
Region
Population1
Populationserved by
watertreatment2
Available biosolidresidues3
Combustionenergy
potential4
kg/day t/yr GJ/yrNL 531,595 414,644 26,122 9,534 181,160PE 139,913 109,132 6,875 2,509 47,680NS 944,765 736,917 46,425 16,945 321,962NB 756,652 590,189 37,181 13,571 257,856PQ 7,455,208 5,815,062 366,348 133,717 2,540,629ON 12,068,301 9,413,275 593,036 216,458 4,112,706MB 1,150,848 897,661 56,552 20,641 392,192SK 1,011,808 789,210 49,720 18,147 344,809AB 3,113,586 2,428,597 153,001 55,845 1,061,066BC 4,141,272 3,230,192 203,502 74,278 1,411,287YT, NT, NU 100,042 78,033 4,916 1,794 34,092Canada 21,585,857 16,836,968 1,060,729 387,166 7,356,1551Statistics Canada, CANSIM ll 051-00001 2Assumes 78% of wastewater undergoes primary, secondary or tertiarytreatment (Eco-research Chair of Environmental Law and Policy, 2002).3Assumes biosolid production of 0.063 dry kg/person/day ( Klass, 1998) andthat all biosolids removed by wastewater treatment are available for energyproduction.4Assumes lower heating value of 19 MJ/dry kg of sludge ( Klass, 1998).

A Canadian Biomass Inventory: Feedstocks for a Bio-based Economy 32S. Wood and D. B. Layzell, BIOCAP Canada Foundation
waters before these are returned to surface waters such as lakes and streams.
Although Canada has made good improvements in the proportion of the population served bymunicipal wastewater treatment, increasing from 64% to 78% of the population in the yearsbetween 1990 and 1997, over 90 municipalities including the cities of Victoria, Halifax and St,John’s continue to dump raw untreated sewage into their local waterways (Eco-research Chair ofEnvironmental Law and Policy, 2002). While the trend in Canada is clearly towards improving theextent of treatment of wastewater, only 33% of wastewater treatment is at the highest or tertiarylevel. All treatment levels remove the biosolids proportion, but may not inactivate the bacterialfraction or remove toxic chemicals.
As a consequence, disposal of biosolids is problematic. In most regions, the favoured approach isto spread the biosolids on agricultural land, where it acts as a fertile soil amendment. Sites areselected according to stringent criteria set out by provincial government environmental agencies;these criteria are intended to minimize contamination of surface or groundwater supplies, avoidnuisance odour complaints and select for lands where crops intended for animal consumption aregrown (OMOE and OMAFRA, 1996). In fact, areas where all the criteria may be adequately metare in short supply, so that spreading sites may be heavily loaded. As well, biosolids are often notadequately stabilized and may contain high levels of contaminates (Ho, T. 2001).
Where disposal by land application has become a problem, disposal of biosolids in landfill is afavoured option. A better solution may be to subject biosolids to fermentative processes, whichserve to stabilize the bacterial component, permit the time needed for precipitation of toxicchemicals, and produce a high-grade biogas that may be captured and used for co-generation. Theresulting low-odour, lower volume and biologically inert sludge may be used as a soil amendmentwith fewer complications. This option may be economically beneficial for municipalities, as theycurrently must pay for the use of land as well as shipment to the site; sale of sludge as fertilizer isnot currently permitted in Canada. Furthermore, co-generation may offset the energy cost oftreating an increasing volume of sludge to a higher degree.
As with the production of MSWs, biosolids are produced with consistency and in greaterconcentrations where population density is highest. In non-urban areas, wastewater treatmenttends to be simpler (primary) or non-existent. About 9% of the Canadian population has noavailable treatment for sewage, although the bulk of this fraction is captured by septic systems(Eco-research Chair, 2002). The trend for increasing attention to the extent of wastewatertreatment is expected to ensure an increasing volume of biosolids, which may be viewed asbiomass suitable for energy production. The extent of biosolids generation, based on population isshown in Table 4.5.
4.5. Energy potential of biosolids
Biosolids do not represent a huge biomass resource and energy potential through combustionrepresents only 0.5% of Canada’s energy requirement. However, the treatment of biosolids willrequire an increasing proportion of municipal energy and finances over time. Biogas productionfrom biosolids can meet the energy requirement for biosolid tertiary treatment with additionalpotential for contribution to the municipal grid.
An excellent example of the potential for energy production is the Edmonton Waste ManagementCentre of Excellence (EWMCE), which produces biogas from both MSW and biosolids in separatefacilities. Capture and burning of biogas from biosolids produces sufficient energy to operate thetreatment plant, with an excess of 40%, which will eventually be used for the production ofelectricity (www.ewmce.com/fac2.html).
In regions where total wastewater treatment capacity is relatively small, energy capture throughcombustion is also a realistic option, and the energy potential from combustion is presented inTable 4.5. It should be noted that the ash fraction from biosolid combustion is considered a suitable

A Canadian Biomass Inventory: Feedstocks for a Bio-based Economy 33S. Wood and D. B. Layzell, BIOCAP Canada Foundation
mineral amendment for agricultural soils and horticultural applications, providing that industrialeffluents with high chemical loads do not contribute to pre-treatment wastewater.
4.6. Summary of biomass from municipal wastes
Municipal solid wastes (MSW) contain large quantities of biomass suitable for energy production.Carbon from disposed (6 Mt C/yr) and recycled materials (2 Mt C/yr) exceeds 8 Mt C per year.Energy potential of disposed MSW is 0.22 EJ/yr, with an additional 0.07 EJ/yr available fromrecycled biomass and 0.007 EJ/yr from biosolids. The combined energy potential of all fractions(0.29 EJ/yr) represents about 3.5% of Canada’s current use of fossil fuel energy.
More efficient use of MSWs could significantly reduce emissions of GHG from landfill, while offeringlocal solutions to waste management, and contributing to Canada’s energy needs.
Technologies such as modern combustion, pyrolysis or gasification may be used to harvest energyfrom MSW. Such energy production has been proven to be cost effective in a pilot project by theCity of Sherbrooke, QC.
Disposal of municipal biosolids is expensive, and currently poses health concerns in many parts ofCanada. Digestion treatments offer the opportunity to harvest biogas, while stabilizing the sludge;where co-generation facilities are operating, a net surplus of energy (0.007 EJ/yr) is produced.

A Canadian Biomass Inventory: Feedstocks for a Bio-based Economy 34S. Wood and D. B. Layzell, BIOCAP Canada Foundation
5. Summary of the Biomass – BioenergyInventory
5.1. Canada’s Biomass Carbon and Energy Stock
Of the 418 M ha of forest in Canada, 245 M ha are considered part of the Timber Productive Forest.On this land base, there is an estimated 15,835 Mt C with an energy content of 566 EJ (Table 5.1).Given that fossil fuels provide Canada with about 8.24 EJ/yr, the biomass of the timber productiveforest is sufficient to meet Canada’s energy needs for about 69 years.
In most agricultural systems, the crops are annual, so there really is no standing biomass C stockon Canada cropland that differs from the annual harvest. The C content of the annual harvest willbe discussed in the next section.
The situation is a somewhat different for municipal waste. Landfill sites have been collectingmunicipal waste for many years, and there certainly are large C stocks at these sites. This studyhas not considered the existing carbon stocks that now exist in landfill sites, and the potential torecover the energy from this biomass. Rather, we have only considered the energy content in theannual production of municipal waste streams and this will be considered in the next section.
It should be noted that the production of methane from existing landfill sites is an important sourceof biomass energy that is increasingly being tapped.
Table 5.1. Summary of the Biomass Sources in Canada and their Energy Content
Agriculture Municipal Waste
Units
Forestry
CropsAnimalProd'n Recycling
MunicipalSolid
Waste Bio-solids
Total Footnote
Standing Carbon StocksMt C 15,835 - - - - - 15,835 1
- On Timber Productive LandEJ 566 - - - - - 566 2
Annual Harvest - Yield of harvested product Mt C/yr 47.7 33.5 - - - - 81.2 3
Mt C/yr 88 54.9 - - - - 142.9 4 - Total harvest (incl. residue)
EJ/yr 3.1 2.0 - - - - 5.1 2Residual or Waste biomass
Mt C/yr 43.1 8.6 - 2.0 6.17 - 59.9 5 - Available Unused biomass
EJ/yr 1.54 0.31 0.065 0.07 0.22 0.007 2.2 2 & 6Footnotes:1. From Tables 2.2 & 2.42. Assumes 35.76 EJ/ tonne C in biomass (Layzell, 2001)3. From Table 2.5 & 3.24. From Table 2.5 & 3.25. From Table 2.6, 2.7, 4.36. From Table 3.3, 3.5, 4.4, 4.5

A Canadian Biomass Inventory: Feedstocks for a Bio-based Economy 35S. Wood and D. B. Layzell, BIOCAP Canada Foundation
5.2. Annual Biomass Production in Forestry, Agriculture andMunicipalities
The potential for the conversion of carbon from agricultural and forest production to energy isexcellent. Energy conversion processes could include combustion, pyrolysis, conversion to biofuelssuch as ethanol or biodiesel, anaerobic fermentation to produce methanol, and gasification.
The choice of conversion technology depends on the nature of the feedstock ( cellulosic orlignocellulosic) and the degree of homogeneity of the biomass. The conversion efficiency for thesepotential processes varies widely, so energy potential is best measured on the basis of a carbon-based conversion factor.
A conversion factor of 35.76 GJ/t C from dried biomass (Fig. 5.2) has been challenged againsthigher and lower heating values (theoretical and measured) and has been within 5.0% accuracy fora wide variety of biological feedstocks.
The annual production of forest and agricultural products in Canada has a C content of about 143Mt C/yr, a value that is similar to the GHG emissions that are associated with fossil fuel combustionin Canada in 1998 (about 150 Mt C/yr, Table 5.1, Fig. 5.1). This comparison clearly illustrates themagnitude of the forest and agricultural production sectors in Canada.
The energy content of forest and agricultural production biomass is about 5.1 EJ (Table 5.1) ,equivalent to about 62% of the energy that Canada obtains from fossil fuels (Fig. 5.1). Note that theenergy content of biomass is lower than that for coal, oil or natural gas (Fig. 5.2).
Approximately 54% of the forest harvest, and 61% of the agricultural harvest was removed from theland as roundwood or agricultural yield, respectively (Table 5.1). In some cases, uses havedeveloped for the residual biomass, but in many cases it is either left to decompose or burned withlittle or no energy capture. The magnitude of the residual biomass from existing forestry and
Fig. 5.1. Comparison of Canada’s annual fossil fuel use and biomass carbon yield (Left panel) andtheir energy content (right panel). The right panel also shows the energy content in the existingand available biomass resources, as well as the impact of a 25% increase in agricultural and forestproduction to provide biomass feed-stocks for bio-based energy. The values in Fig. 5.2 were usedto calculate energy content.
FossilFuels
200
100
0
Mt C/yr
GHGEmissions
1998
Other
Carbon
Agriculture& Forestry
Harvest
Yield
Round-wood
Agric-ulture
Forestry
Residual
Residual
95%
.
0
4
8
Gas
Oil
Coal
EJ/yr
ExistingFossil
Energy
Energy
EnergyContent inHarvest
AvailableBiomassEnergy
Forestry
--- Biomass ---
Agric-ulture
Existing
MunicipalWaste
A 25% increase inforestry & agricultural
production
.

A Canadian Biomass Inventory: Feedstocks for a Bio-based Economy 36S. Wood and D. B. Layzell, BIOCAP Canada Foundation
agriculture will be considered in section 5.3.
Figure 5.1 illustrates the potential an increase in forest and agricultural production in Canada couldprovide to the supply of renewable and sustainable energy. For example, a 25% increase inforestry and agricultural production could translate into a major contribution of about 1.25 EJ/yr, anamount equivalent to about 15% of the energy that Canada now derives from fossil fuels (Fig. 5.1).
5.3. Residual and Waste Biomass and Energy Resources
Residual or waste biomass can be obtained from a wide range of sources, in addition to the wastestreams generated by forestry and agricultural production. Examples of these sources and theestimated energy content associated with each aresummarized in Table 5.1. Note that the use ofthese biomass resources could provide as much as2.2 EJ/yr, significantly more energy than thatcurrently obtained from biomass (about 0.34 EJ/yr).
Dried biomass is readily combustible although thecombustion efficiency may vary dramatically withfeedstock quality and the degree of homogeneity.For example, Table 3.3 shows the energy potential,totaling 0.523 EJ, of the major crop residuesthrough combustion, assuming 50% combustionefficiency.
Alternatively, dried cellulosic biomass, such ascereal straws may be readily converted to ethanolby fermentation, at a rate of 300 litres of ethanolproduced per tonne of dried biomass; if the entireagricultural residue currently available wasconverted to ethanol, 5,336 M litres of ethanolcould be produced.
Fig. 5.2. Comparison of the energycontent of different energy sources
(From Klass, 1998)
-
10
20
30
40
50
60
70
Biomass Coal Oil Gas
GJ/
t C

A Canadian Biomass Inventory: Feedstocks for a Bio-based Economy 37S. Wood and D. B. Layzell, BIOCAP Canada Foundation
6. Hurdles6.1. The Challenge of Using Biomass as an Energy Resource
It was not the goal of this study to identify all the barriers to the production, collection and use ofbiomass for energy and bio-products. Nevertheless, some common hurdles must be overcome tosuccessfully optimize the use biomass from the forest or agricultural industries, or from municipalwaste sources, for the production of bio-products and energy. In any specific geographic region,these problems could include: distribution and availability of biomass resources; economic viability;social acceptance and public perception; technological and processing bottlenecks; and competitionfrom the petroleum based sector.
6.1.1. Distribution and availability of biomass resourcesBiomass residues tend to be neglected during the harvest process because of theirtraditionally lower value. Tops and branches, or slash, of harvested trees may be left at theharvest site, or along the roadside where logging trucks are loaded. Similarly, agriculturalresidues are widely dispersed as a result of harvest techniques that focus on the “crop”fraction. In order to be used for purposes other than soil amendment, residues must, at thevery least, be removed from the field to some processing facility.
Costs associated with this first simple step include equipment, consumables (such as balingtwine), labour, transportation and storage or weather protection and together, these costsmay be quite substantial. Straw hauling to processing sites in Manitoba has been carefullyexamined, with projected and actual costs evaluated using a variety of techniques andequipment (Agricultural Fibre in Manitoba, 2000).
Costs of baling and transportation within a 50 km radius of a processing facility averageapproximately $33.00/t, with an additional $1.65 /t for protective covering, should storage berequired. These figures do not include the purchase cost of the straw.
In contrast, biomass from municipal sources is typically collected and taken to a commonfacility (landfill or incinerator), and the cost of collection is fixed whether the biomass fractionis withdrawn for energy production or not. In general, greater concentrations of waste areproduced in regions where energy demand is highest.
6.1.2. Economic viabilityThe cost of biomass procurement and processing is directly dependant upon the costs ofenergy and labour, and the status of world markets. One of the potential hurdles of usingagricultural residues is that they tend to be widely dispersed and in relatively lowabundance, so careful planning for harvesting and transportation strategies is vital to ensurestrong economic success.
Estimating residue production and evaluating the economic issues of collection andtransportation to central facilities has been aided by the development of interactive modelsbased on biophysical analysis and GIS reports of agronomic activity (Huffman et al., 2000).Such models have been used to determine the economic feasibility of developing residue-handling facilities and have powerful potential for estimating availability of residues in anygrowing season (see, http://192.197.71.108/ims/addboard15/maps.html).
As well as interactive modeling, remote sensing is useful for assessing biomassaccumulation within specific fields, or areas of fields, throughout the growing season (see,http://www.ccrs.nrcan.gc.ca/ccrs/learn/tour/25/25scene2_e.html). Both remote sensing andinteractive modeling serve to reduce economic risk, and optimize biomass utilization.

A Canadian Biomass Inventory: Feedstocks for a Bio-based Economy 38S. Wood and D. B. Layzell, BIOCAP Canada Foundation
Although markets for forest products and agricultural commodities may be described as“dedicated”, general consensus suggests that commodity use is market-driven. Thus, whilecorn is predominantly grown for food and feed, a significant proportion could be drawn awayfrom these traditional uses if a strong market emerged for the use of corn for energyproduction. Likewise, roundwood intended for lumber could be redirected for energypurposes if market conditions were favourable.
Similarly, it must be noted that some crops with strong bio-product potential, includinghorticultural species, non-forestry products from forests, and silviculture species have notbeen included in this study because they do not have significant economic impact at thecurrent time. Their potential, along with that of marine biomass may become significant withchanging market pressures.
A cost point assessment would be a logical next step arising from the current study, alongwith assessment of specific regional sites where potential is highest.
6.1.3. Public perception and acceptanceFrom a traditional viewpoint, agricultural land should be used for the production of food andanimal feeds and there has been some resistance to the notion of using agricultural landsfor the production of bio-products and biomass for energy.
This trend seems to be changing, with better acceptance for example, of the growing of “flaxfor fibre” rather than flax seed in the agricultural sector (Braun, 2003). In contrast, the ideaof using trees for non-roundwood, non-pulping has been largely ignored. With decliningdemand for softwood in the USA, it would seem reasonable to divert a portion of thepotential Canadian harvest to bio-energy production, rather than to scale back harvestoperations.
6.1.4. Technological and processing requirementsThere is a need for technological advancement to improve efficiency of materials handling,and biological conversion. Fermentation of cellulose to produce ethanol fuels has been welldeveloped, however, fermentation of ligno-cellulosic feedstocks, such as wood residues, isnot yet available on a commercial scale. Research focused on translating laboratory or pilot-project successes to field applications must be a top priority.
6.1.5. Changing weather patternsProjections of biomass availability presume continued favorable growing conditions. Yetrecent drought conditions in the Canadian West, coupled with a prediction of continuedclimate change, have some producers reevaluating the viability of traditional agriculturalproduction systems.
This situation may have negative impacts on the availability of agricultural residues fromtraditional sources; alternatively, it may present an excellent opportunity for an adjustmenttowards cultivation of crops, such as switchgrass, intended specifically for their biomasspotential.
6.2. Some Concluding Thoughts
Despite the large potential that residual or waste biomass offers to Canada’s energy needs, thereare significant hurdles that must be overcome before we will see large scale use of biomass as anenergy, chemical and material resource. For example, harvest residues from the forest industry, aswell as crop residues may be difficult to collect, dispersed over a wide region, costly to transport,seasonally available and variable in quality. These factors all pose economic, technological orlogistical problems.

A Canadian Biomass Inventory: Feedstocks for a Bio-based Economy 39S. Wood and D. B. Layzell, BIOCAP Canada Foundation
Moreover, there is inevitably resistance to adopting new management strategies until an economicadvantage is proven. However, precedents that show that the manufacture of bio-energy and bio-products are economically successful and offer excellent potential for stimulation of the ruraleconomy have already been made.
With strong economic incentives, movement towards a bio-based economy using currentlyavailable waste biomass could happen quickly and efficiently resulting in positive outcomes for theforest industry, rural economy, manufacturing sector as well as an improved ability to meet GHGreduction targets while strengthening the Canadian economy.

A Canadian Biomass Inventory: Feedstocks for a Bio-based Economy 40S. Wood and D. B. Layzell, BIOCAP Canada Foundation
7. ReferencesAgriculture Canada. 1985. Agricultural soil and water resources in Canada: Situation and outlook.
Prairie Farm Rehabilitation Administration.
Alexeyev, V., Birdsey, R. , Stankanov, V., and Korotkov, I. 1995. Carbon in vegetation of Russianforests: methods to estimate stage and geographical distribution. Water, Air and Soil Pollution82:271-282.
BIOCAP Canada Foundation. 156 Union St., Kingston ON K7L 3N6
Bioenergy Conversion Factors. http://bioenergy.ornl.gov/papers/misc/energy_conv.html
Birdsey, R.A. 1992. Carbon storage and accumulation in United States forest ecosystems. U.S.Department of Agriculture, Forest Service General Technical Report. WO-59.
Bonner, G.M. 1982. Canada’s forest inventory 1981. Canadian Forest Service (CFS), ForestStatistics and Systems Branch, Petawawa, ON. Information Report PI-X-45.
Bonner, G.M. 1985. Inventory of forest biomass in Canada. CFS, Petawawa ON.
Bulman, P., Stobbe, E., and Henry, S. 1995. Straw management alternatives to stubble burning.University of Manitoba Report, Winnpeg, Manitoba.
Braun, L. 2003. Personal communication with Linda Braun, Executive Director, Saskatchewan FlaxDevelopment Commission, January 2003.
Canada Centre for Remote Sensing. http://www.ccrs.nrcan.gc.ca
Chornet, E. 2002. Biofuels and co-products from lignocellulosics. Enerkem Technologies Inc. andGroupe Kemestrie Inc. Sherbrooke, Quebec.
District #15 Agriculture Development and Diversification (ADD) Board.http://192.197.71.108/ims/addboard15/maps.html
Eco-research Chair of Environmental Law and Policy, University of Victoria, 2002 – Canada vs. theOECD. An environmental comparison.http://www.environmental/indicators.com/htdocs/index/html
Edmonton Waste Management Centre of Excellence ( www.ewmce.com/fac.html)
Environment Canada. 2002 The Canadian greenhouse gas inventory for 1990-2000.http://www.ec.gc.ca/pdb/ghg/1990_00_report/foreward_e.cfm
Environment Canada. 2002. The climate change plan for Canada.http://www.climatechange.gc.ca/plan_for_canada/plan/index.html
Forest Products Laboratory, 1989. The Encyclopedia of Wood. Sterling Publishing Co. Inc., NewYork, N.Y.
Hatton, T. 1999. Canada’s wood residues: a profile of current surplus and regional concentrations.Canadian Forest Service, Industry, Economics and Programs Branch. Draft.
Helwig, T., Jannasch, R., Samson, R., DeMaio, A., and Caumartin, D. 2002. Agricultural biomassresidues inventories and conversion systems for energy production in Eastern Canada.NRCan Contract #23348-016095/001/SQ
Huffman, E, R.G. Eilers, G.A. Padbury, G. Wall and K.B. MacDonald, 2000. Canadian agri-environmental indicators related to land quality: integrating census and biophysical data toestimate soil cover, wind erosion and soil salinity. Agriculture, Ecosystems and Environment81 (2000) 113-123.

A Canadian Biomass Inventory: Feedstocks for a Bio-based Economy 41S. Wood and D. B. Layzell, BIOCAP Canada Foundation
Ho, T. 2001. Study of fate and significance of selected contaminants in sewage biosolids applied toagricultural land through literature review and consultation with stakeholder groups. WaterEnvironment Association of Ontario.
International Energy Agency. Renewables in global energy supply, 2001. http://www.iea.com/
Integrative mapping of Canadian agricultural soils.http://192.197.71.108/ims/addboard15/maps.html
Jannasch, R., Samson, R., DeMaio, A., and Helwig, T. 2001. Switchgrass fuel pellet production inEastern Ontario: a market study. Resource Efficient Agricultural Production (REAP) – Canada.www.reap-canada.com
Kennedy Technology Development Ltd. 1992. Canada wood residue production, use and disposaldatabase. Prepared for CANMET, Efficiency and Alternative Energy Branch, NaturalResources Canada.
Kerstetter, J.D., and Lyons, J.K. 2001. Wheat straw for ethanol production in Washington: aresource, technical, and economic assessment. Prepared for: Washington State Office ofTrade and Economic Development. www.pacific.biomass.org/publications
Klass, D.L. 1998. Biomass for renewable energy, fuels and chemicals. Academic Press, San Diego,California.
Larson, W.E. 1979. Crop residues: energy production or erosion control? Journal of Soil and WaterConservation. 2:61-73.
Layzell, D.B. 2001. Canada’s Green Advantage for a Bio-based Future. Bio-products Leader’sWorkshop, Industry Canada
Levelton Engineering ltd., (S& T)2 Consulting Inc. J.E. & Associates. 2000. Assessment of netemissions of greenhouse gases from ethanol-blended gasolines in Canada: lignocellulosicfeedstocks R-2000-2. Prepared for: Agriculture and Agri-food Canada
Lowe, J.J., Power, K., and Gray, S.L. 1996. Canada’s forest inventory 1991: the 1994 version. Anaddendum to Canada’s forest inventory 1991. CFS Information report BC-X-362. PacificForestry Centre, Victoria B.C. Http://warehouse.pfc.forestry.ca/pfc/4590.pdf
Manitoba Agriculture and Food, 2000. Agricultural fibre in Manitoba.
National Forestry Database, 1991, 1997, 2000. Canadian Council of Forest Ministers, Compendiumof Canadian Forest Statistics:CFS, NRCan. http://nfdp.ccfm.org/framesinv_e.htm
Natural Resources Canada (NRCan) 1999. Compendium of Forest Statistics. http://nfdp.ccfm.org
Natural Resources Canada (NRCan) GeoAccess Divison.www.ceonet.ccrs.nrcan.gc.ca
Ontario Ministry of the Environment and Ontario Ministry of Agriculture, Food and Rural Affairs,1996 – Guidelines for the utilization of biosolids and other wastes on agricultural lands.
Pembina Institute for Appropriate Development. http://www.pembina.org
Penner, M., Power, K., Muhairewe, C., Tellier, R., and Wang, Y. 1997. Canada’s forest biomassresources: deriving estimates from Canada’s forestry inventory. CFS, NRCan Info report BC-X-370, Pacific Forestry Centre, Victoria, B.C. http://warehouse.pfc.forestry.ca/pfc/4775.pdf
Prairie Agricultural Machinery Institute (PAMI). Humboldt, Saskatchewan, S0A 2A0http://www.pami.ca/
Statistics Canada. 1991. CANSIM Matrix 6076.
Statistics Canada 2000. CANSIM Matrix 051-0001.
Statistics Canada. 2001. Census of Agriculture. www.statcan.ca

A Canadian Biomass Inventory: Feedstocks for a Bio-based Economy 42S. Wood and D. B. Layzell, BIOCAP Canada Foundation
Statistics Canada. 2001. Natural Resources Canada, GeoAccess Division.
Stumborg, M.A., Townley-Smith, I., and Coxworth, E. 1996. Sustainability and economic issues forcereal crop residue export. Canadian Journal of Plant Science 76:182-193.
United States Department of Energy. 2001 World primary energy consumption, 1980-2001.http://www.eia.doe.gov/pub/international/iealf/tablee1.xls
Wang, M., Sarricks, C., and Wu, M. 1999. Fuel ethanol produced from Midwest US corn: help orhindrance to the vision of Kyoto? Journal of Air and Waste Management Association 49:756-772.


![Above- and belowground biomass in relation to envi …sourcedb.nwipb.cas.cn/yw/lw/201310/P...global biomass database[6,7], inventory data[8,9], remote sensing model[10], and field](https://img.pdfslide.us/doc/110x75/5cca8b1288c993b6028b7a44/above-and-belowground-biomass-in-relation-to-envi-biomass-database67-inventory.jpg)