Embed Size (px)
Citation preview
US AD SPENDINGeMarketer’s Updated Estimates and Forecast for 2015–2020
NOVEMBER 2016
Cindy Liu
Contributors: Martín Utreras
Read this on eMarketer for iPad
US AD SPENDING: EMARKETER’S UPDATED ESTIMATES AND FORECAST FOR 2015–2020 ©2016 EMARKETER INC. ALL RIGHTS RESERVED 2
US AD SPENDING: EMARKETER’S UPDATED ESTIMATES AND FORECAST FOR 2015–2020
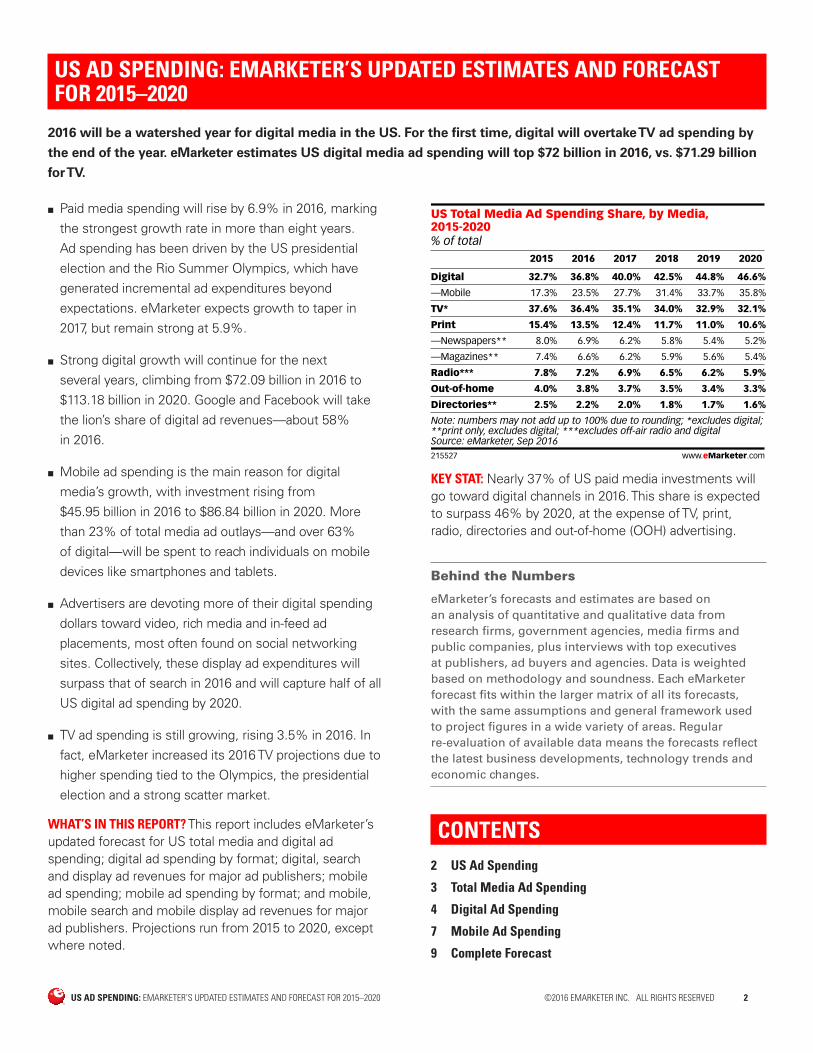
2016 will be a watershed year for digital media in the US. For the first time, digital will overtake TV ad spending by
the end of the year. eMarketer estimates US digital media ad spending will top $72 billion in 2016, vs. $71.29 billion
for TV.
■ Paid media spending will rise by 6.9% in 2016, marking the strongest growth rate in more than eight years. Ad spending has been driven by the US presidential election and the Rio Summer Olympics, which have generated incremental ad expenditures beyond expectations. eMarketer expects growth to taper in 2017, but remain strong at 5.9%.
■ Strong digital growth will continue for the next several years, climbing from $72.09 billion in 2016 to $113.18 billion in 2020. Google and Facebook will take the lion’s share of digital ad revenues—about 58% in 2016.
■ Mobile ad spending is the main reason for digital media’s growth, with investment rising from $45.95 billion in 2016 to $86.84 billion in 2020. More than 23% of total media ad outlays—and over 63% of digital—will be spent to reach individuals on mobile devices like smartphones and tablets.
■ Advertisers are devoting more of their digital spending dollars toward video, rich media and in-feed ad placements, most often found on social networking sites. Collectively, these display ad expenditures will surpass that of search in 2016 and will capture half of all US digital ad spending by 2020.
■ TV ad spending is still growing, rising 3.5% in 2016. In fact, eMarketer increased its 2016 TV projections due to higher spending tied to the Olympics, the presidential election and a strong scatter market.
WHAT’S IN THIS REPORT? This report includes eMarketer’s updated forecast for US total media and digital ad spending; digital ad spending by format; digital, search and display ad revenues for major ad publishers; mobile ad spending; mobile ad spending by format; and mobile, mobile search and mobile display ad revenues for major ad publishers. Projections run from 2015 to 2020, except where noted.
% of total
US Total Media Ad Spending Share, by Media,2015-2020
2015 2016 2017 2018 2019 2020
Digital 32.7% 36.8% 40.0% 42.5% 44.8% 46.6%
—Mobile 17.3% 23.5% 27.7% 31.4% 33.7% 35.8%
TV* 37.6% 36.4% 35.1% 34.0% 32.9% 32.1%
Print 15.4% 13.5% 12.4% 11.7% 11.0% 10.6%
—Newspapers** 8.0% 6.9% 6.2% 5.8% 5.4% 5.2%
—Magazines** 7.4% 6.6% 6.2% 5.9% 5.6% 5.4%
Radio*** 7.8% 7.2% 6.9% 6.5% 6.2% 5.9%
Out-of-home 4.0% 3.8% 3.7% 3.5% 3.4% 3.3%
Directories** 2.5% 2.2% 2.0% 1.8% 1.7% 1.6%
Note: numbers may not add up to 100% due to rounding; *excludes digital;**print only, excludes digital; ***excludes off-air radio and digitalSource: eMarketer, Sep 2016215527 www.eMarketer.com
KEY STAT: Nearly 37% of US paid media investments will go toward digital channels in 2016. This share is expected to surpass 46% by 2020, at the expense of TV, print, radio, directories and out-of-home (OOH) advertising.
Behind the Numbers
eMarketer’s forecasts and estimates are based on an analysis of quantitative and qualitative data from research firms, government agencies, media firms and public companies, plus interviews with top executives at publishers, ad buyers and agencies. Data is weighted based on methodology and soundness. Each eMarketer forecast fits within the larger matrix of all its forecasts, with the same assumptions and general framework used to project figures in a wide variety of areas. Regular re-evaluation of available data means the forecasts reflect the latest business developments, technology trends and economic changes.
CONTENTS2 US Ad Spending
3 Total Media Ad Spending
4 Digital Ad Spending
7 Mobile Ad Spending
9 Complete Forecast
US AD SPENDING: EMARKETER’S UPDATED ESTIMATES AND FORECAST FOR 2015–2020 ©2016 EMARKETER INC. ALL RIGHTS RESERVED 3
TOTAL MEDIA AD SPENDING
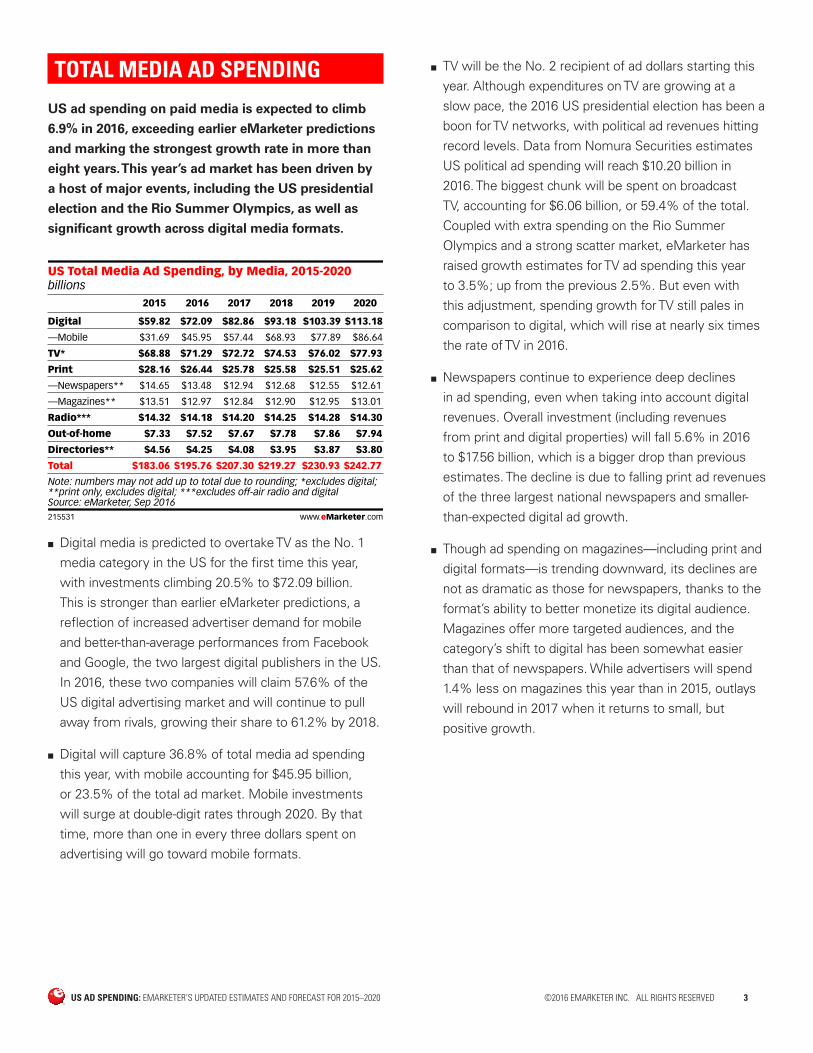
US ad spending on paid media is expected to climb
6.9% in 2016, exceeding earlier eMarketer predictions
and marking the strongest growth rate in more than
eight years. This year’s ad market has been driven by
a host of major events, including the US presidential
election and the Rio Summer Olympics, as well as
significant growth across digital media formats.
billionsUS Total Media Ad Spending, by Media, 2015-2020
2015 2016 2017 2018 2019 2020
Digital $59.82 $72.09 $82.86 $93.18 $103.39 $113.18
—Mobile $31.69 $45.95 $57.44 $68.93 $77.89 $86.64
TV* $68.88 $71.29 $72.72 $74.53 $76.02 $77.93
Print $28.16 $26.44 $25.78 $25.58 $25.51 $25.62
—Newspapers** $14.65 $13.48 $12.94 $12.68 $12.55 $12.61
—Magazines** $13.51 $12.97 $12.84 $12.90 $12.95 $13.01
Radio*** $14.32 $14.18 $14.20 $14.25 $14.28 $14.30
Out-of-home $7.33 $7.52 $7.67 $7.78 $7.86 $7.94
Directories** $4.56 $4.25 $4.08 $3.95 $3.87 $3.80
Total $183.06 $195.76 $207.30 $219.27 $230.93 $242.77
Note: numbers may not add up to total due to rounding; *excludes digital; **print only, excludes digital; ***excludes off-air radio and digitalSource: eMarketer, Sep 2016215531 www.eMarketer.com
■ Digital media is predicted to overtake TV as the No. 1 media category in the US for the first time this year, with investments climbing 20.5% to $72.09 billion. This is stronger than earlier eMarketer predictions, a reflection of increased advertiser demand for mobile and better-than-average performances from Facebook and Google, the two largest digital publishers in the US. In 2016, these two companies will claim 57.6% of the US digital advertising market and will continue to pull away from rivals, growing their share to 61.2% by 2018.
■ Digital will capture 36.8% of total media ad spending this year, with mobile accounting for $45.95 billion, or 23.5% of the total ad market. Mobile investments will surge at double-digit rates through 2020. By that time, more than one in every three dollars spent on advertising will go toward mobile formats.
■ TV will be the No. 2 recipient of ad dollars starting this year. Although expenditures on TV are growing at a slow pace, the 2016 US presidential election has been a boon for TV networks, with political ad revenues hitting record levels. Data from Nomura Securities estimates US political ad spending will reach $10.20 billion in 2016. The biggest chunk will be spent on broadcast TV, accounting for $6.06 billion, or 59.4% of the total. Coupled with extra spending on the Rio Summer Olympics and a strong scatter market, eMarketer has raised growth estimates for TV ad spending this year to 3.5%; up from the previous 2.5%. But even with this adjustment, spending growth for TV still pales in comparison to digital, which will rise at nearly six times the rate of TV in 2016.
■ Newspapers continue to experience deep declines in ad spending, even when taking into account digital revenues. Overall investment (including revenues from print and digital properties) will fall 5.6% in 2016 to $17.56 billion, which is a bigger drop than previous estimates. The decline is due to falling print ad revenues of the three largest national newspapers and smaller-than-expected digital ad growth.
■ Though ad spending on magazines—including print and digital formats—is trending downward, its declines are not as dramatic as those for newspapers, thanks to the format’s ability to better monetize its digital audience. Magazines offer more targeted audiences, and the category’s shift to digital has been somewhat easier than that of newspapers. While advertisers will spend 1.4% less on magazines this year than in 2015, outlays will rebound in 2017 when it returns to small, but positive growth.
US AD SPENDING: EMARKETER’S UPDATED ESTIMATES AND FORECAST FOR 2015–2020 ©2016 EMARKETER INC. ALL RIGHTS RESERVED 4
■ Ad spending on over-the-air radio, which excludes digital advertising, will fall by 1.0% in 2016 before returning to positive growth next year. Even though traditional radio will benefit somewhat from political advertising this year, it is becoming harder for the format to compete with internet audio alternatives. Spending on digital radio services like Pandora, as well as revenues derived from banner ads, pop-up ads, streaming ads and other digital ad formats on radio websites, will total $3.15 billion, up 21.0% from 2015. Digital’s size relative to traditional radio is still small, however, accounting for just 18.2% of total radio ad spending in 2016.
■ Besides TV, OOH advertising is the only other traditional media category that will see ad spending growth in 2016. OOH ad spending will rise 2.6% in 2016 to reach $7.52 billion, driven by continued investment in billboards, transit ads and cinema. However, this spending will represent just 3.8% of total US ad investment for the year.
■ eMarketer has increased total media ad spending for every year of the forecast due to higher-than-projected spending on digital and mobile ad formats, and increased spending related to the US presidential election and the Rio Summer Olympics.
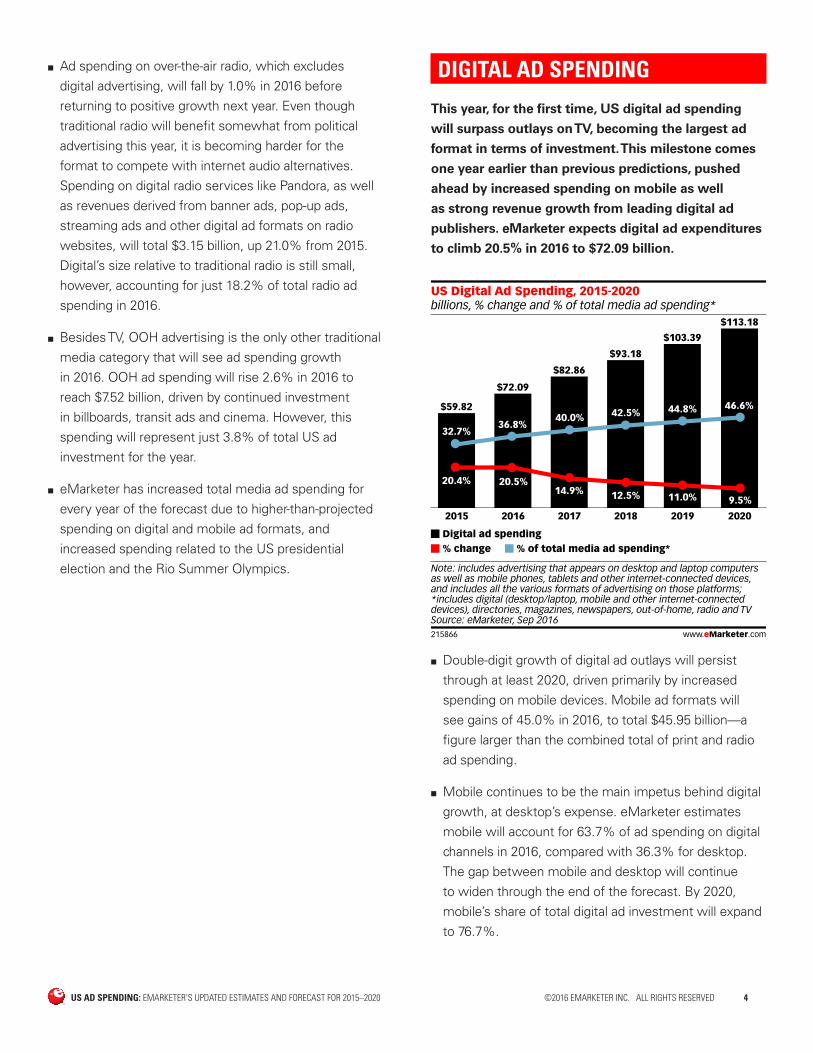
DIGITAL AD SPENDING
This year, for the first time, US digital ad spending
will surpass outlays on TV, becoming the largest ad
format in terms of investment. This milestone comes
one year earlier than previous predictions, pushed
ahead by increased spending on mobile as well
as strong revenue growth from leading digital ad
publishers. eMarketer expects digital ad expenditures
to climb 20.5% in 2016 to $72.09 billion.
billions, % change and % of total media ad spending*US Digital Ad Spending, 2015-2020
2015
$59.82
2016
$72.09
2017
$82.86
2018
$93.18
2019
$103.39
2020
$113.18
Digital ad spending% change % of total media ad spending*
Note: includes advertising that appears on desktop and laptop computersas well as mobile phones, tablets and other internet-connected devices,and includes all the various formats of advertising on those platforms;*includes digital (desktop/laptop, mobile and other internet-connecteddevices), directories, magazines, newspapers, out-of-home, radio and TVSource: eMarketer, Sep 2016215866 www.eMarketer.com
32.7%36.8%
40.0% 42.5% 44.8% 46.6%
20.4% 20.5%14.9% 12.5% 11.0% 9.5%
■ Double-digit growth of digital ad outlays will persist through at least 2020, driven primarily by increased spending on mobile devices. Mobile ad formats will see gains of 45.0% in 2016, to total $45.95 billion—a figure larger than the combined total of print and radio ad spending.
■ Mobile continues to be the main impetus behind digital growth, at desktop’s expense. eMarketer estimates mobile will account for 63.7% of ad spending on digital channels in 2016, compared with 36.3% for desktop. The gap between mobile and desktop will continue to widen through the end of the forecast. By 2020, mobile’s share of total digital ad investment will expand to 76.7%.
US AD SPENDING: EMARKETER’S UPDATED ESTIMATES AND FORECAST FOR 2015–2020 ©2016 EMARKETER INC. ALL RIGHTS RESERVED 5
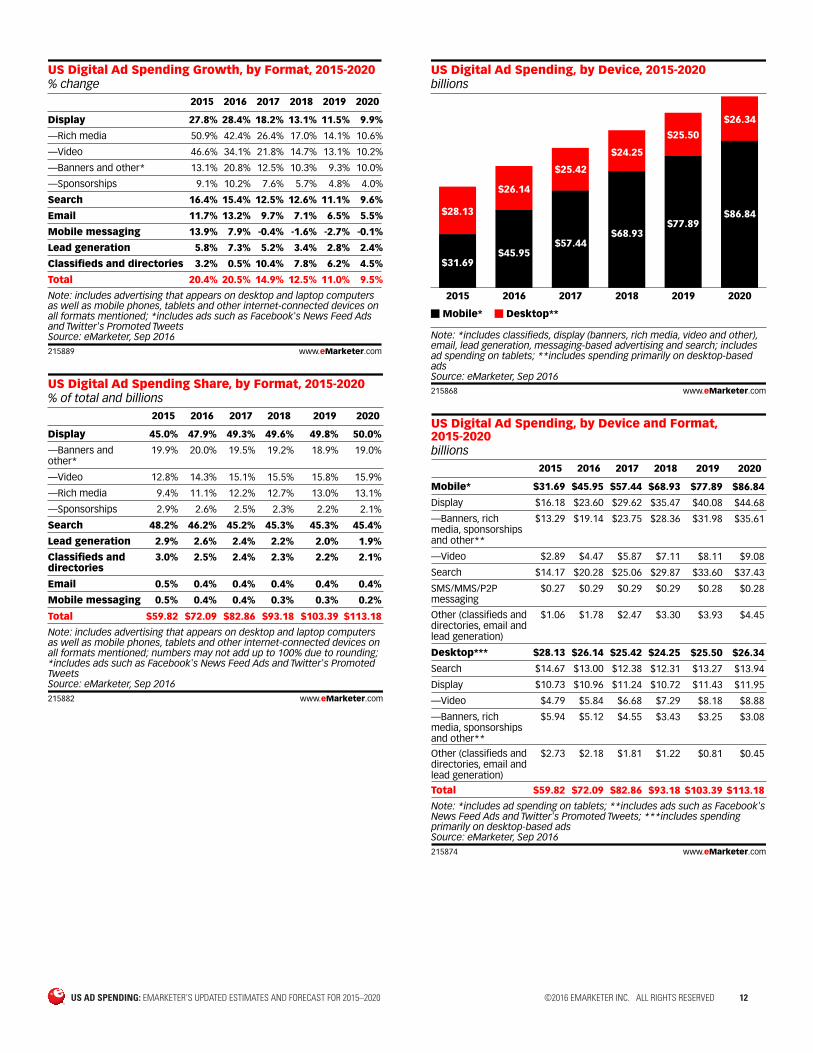
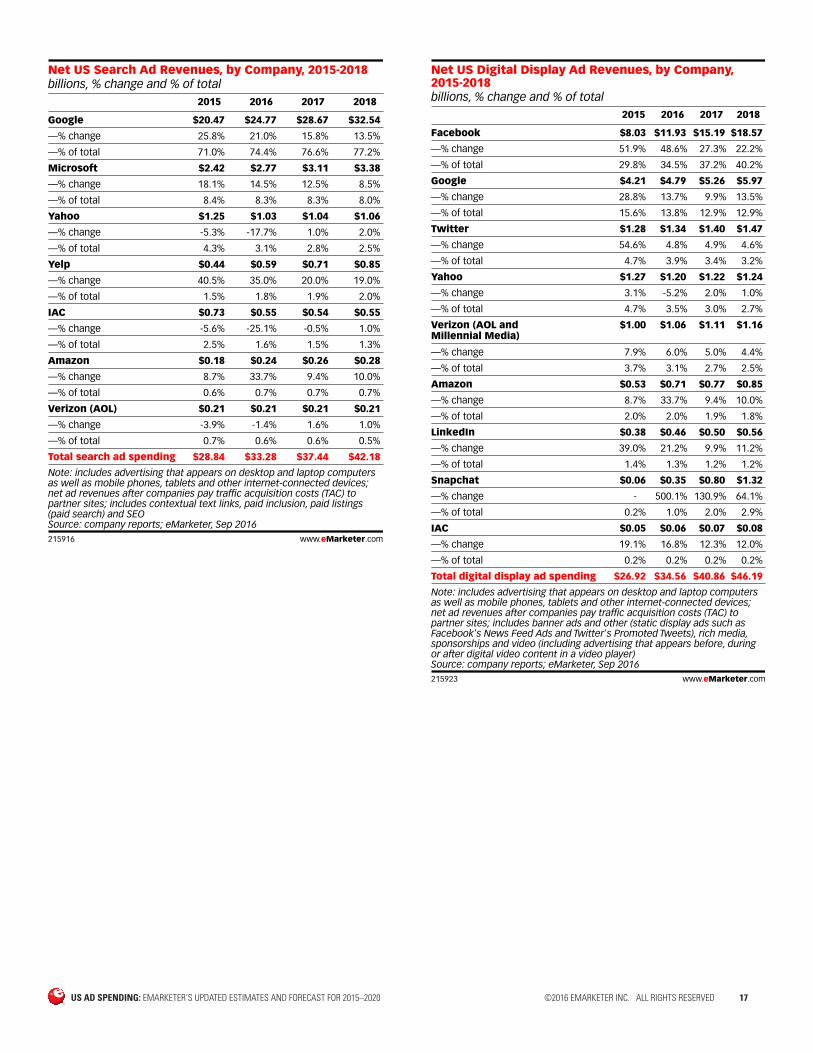
DIGITAL AD SPENDING, BY FORMAT ■ Spending on display—which includes video, sponsorships, rich media, banners and other display formats—will surpass that of search for the first time, reaching $34.56 billion in 2016, equivalent to 47.9% of total digital outlays. By 2020, display’s share of US digital ad spending will pull even further ahead, reaching 50.0%, or $56.63 billion. The main trends driving display’s growth are programmatic advertising, cross-device targeting and measurement, as well as improvements in addressing ad fraud and viewability metrics.
■ Search will command the second-highest share of total digital spend this year—46.2%—to total $33.28 billion. With growth of 15.4% from last year, search won’t climb as steeply as display, but will remain strong throughout the forecast period as advertisers allocate more dollars toward mobile and local search ads.
■ Banners and other display formats, which include many types of native ads on popular social sites like Facebook and Twitter, will capture 41.6% of display ad spending and 20.0% of total digital ad spending in 2016—the largest percentage of any display format. Given the growing popularity of native ads, look for this category to maintain its position as the leading display format through at least 2020.
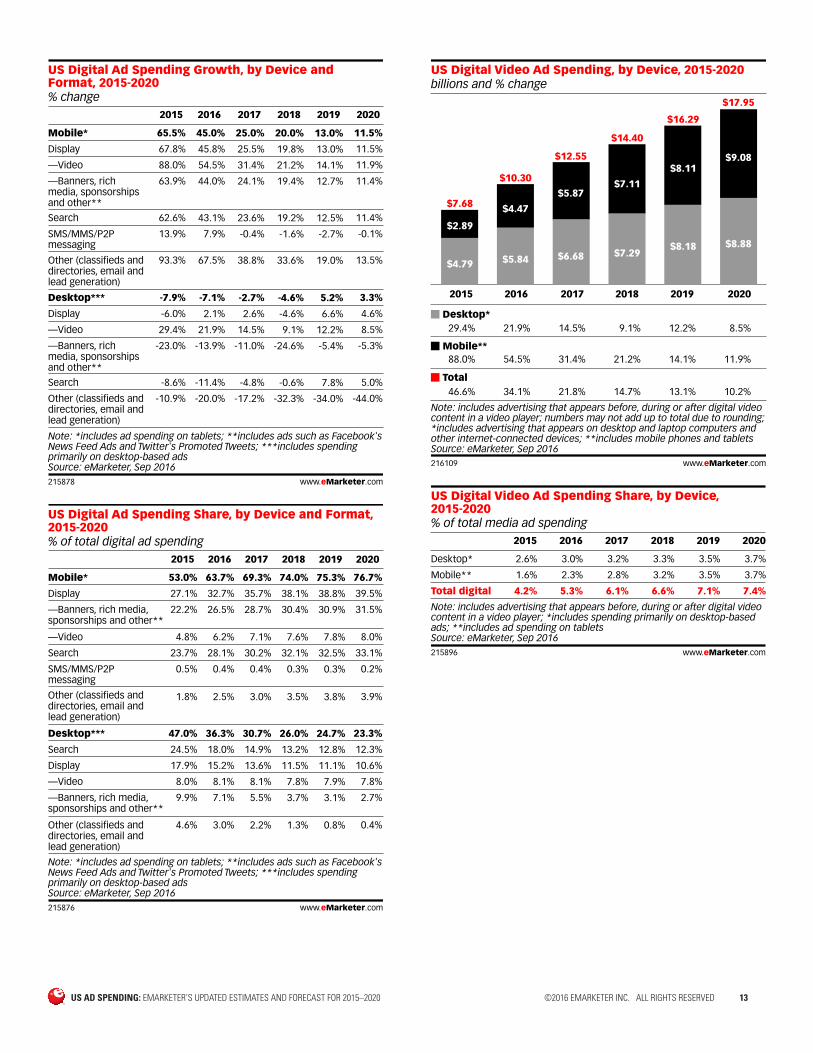
■ Video will also command a large portion of ad spending allocated to digital in 2016: 14.3%, up from 12.8% in 2015. The influx of digital video content on publisher websites, as well as improvements in targeting and measurement, will continue to drive advertiser spending in video. By 2020, video ad spending will near $18 billion, accounting for about 16% of total digital spending. [Editor’s Note: This figure represents ads placed before, during or after video content in a video player but does not include in-feed video advertising on social platforms.]
■ Rich media, which are display-related ads that integrate some component of streaming activity, will be the fastest-growing digital ad format throughout the forecast period. This is primarily driven by the growing adoption of out-stream video ads—that is, ads that play outside of video content, such as between paragraphs of text—and in-feed premium video ads on social platforms. These two ad types have emerged as some of the most popular forms of rich media.
■ Spending on more mature digital ad formats, such as classifieds and directories, email and lead generation, will increase at much slower rates compared with search and display.
■ When examining the formats within digital, eMarketer has revised all of its figures upward from 2015 to 2020 based on larger-than-expected growth in overall digital spending.
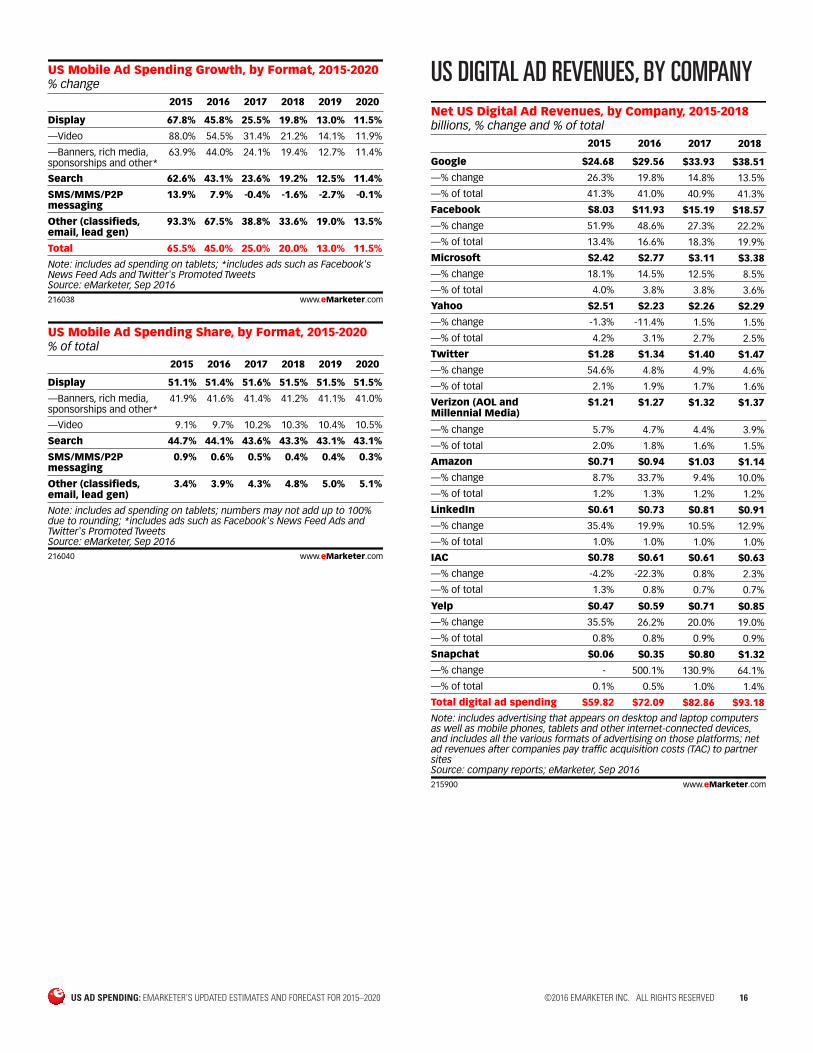
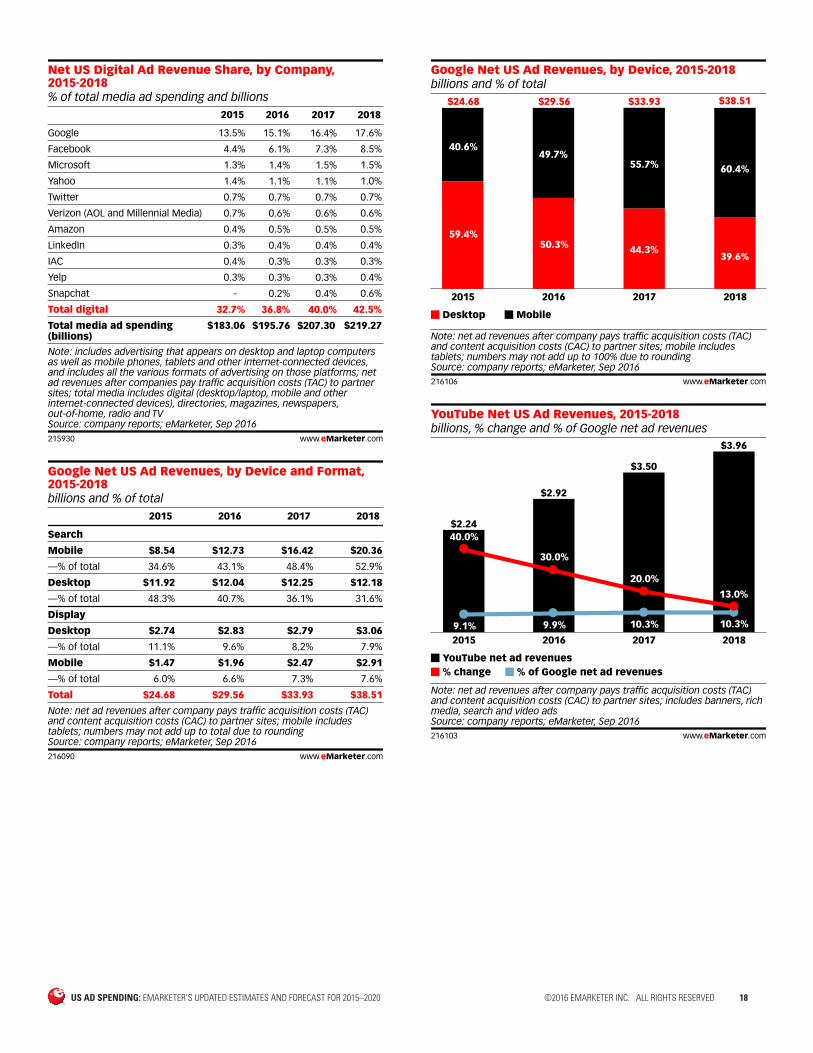
DIGITAL AD REVENUES, BY COMPANY ■ eMarketer is forecasting a stronger year for Google and Facebook—two of the largest digital publishers in the US. Q2 2016 revenue performance for both companies exceeded expectations, leading eMarketer to increase ad revenue forecasts for this year and the next two years. After these adjustments, Google and Facebook will claim about 58% of the US digital advertising market in 2016 and will continue to pull away from rivals, growing their share to 61.2% by 2020.
■ Google will generate nearly $30 billion in US ad revenues this year, commanding 41.0% of the total digital ad market. This represents a growth rate of 19.8% from 2015, a significant jump from previous eMarketer estimates of 9.0%, thanks to the company’s success from mobile search. More than 83%, or $24.77 billion, of Google’s total digital ad earnings in the US will come from search in 2016. Google’s total digital revenues will continue to rise robustly, climbing 14.8% in 2017 and 13.5% in 2018.
US AD SPENDING: EMARKETER’S UPDATED ESTIMATES AND FORECAST FOR 2015–2020 ©2016 EMARKETER INC. ALL RIGHTS RESERVED 6
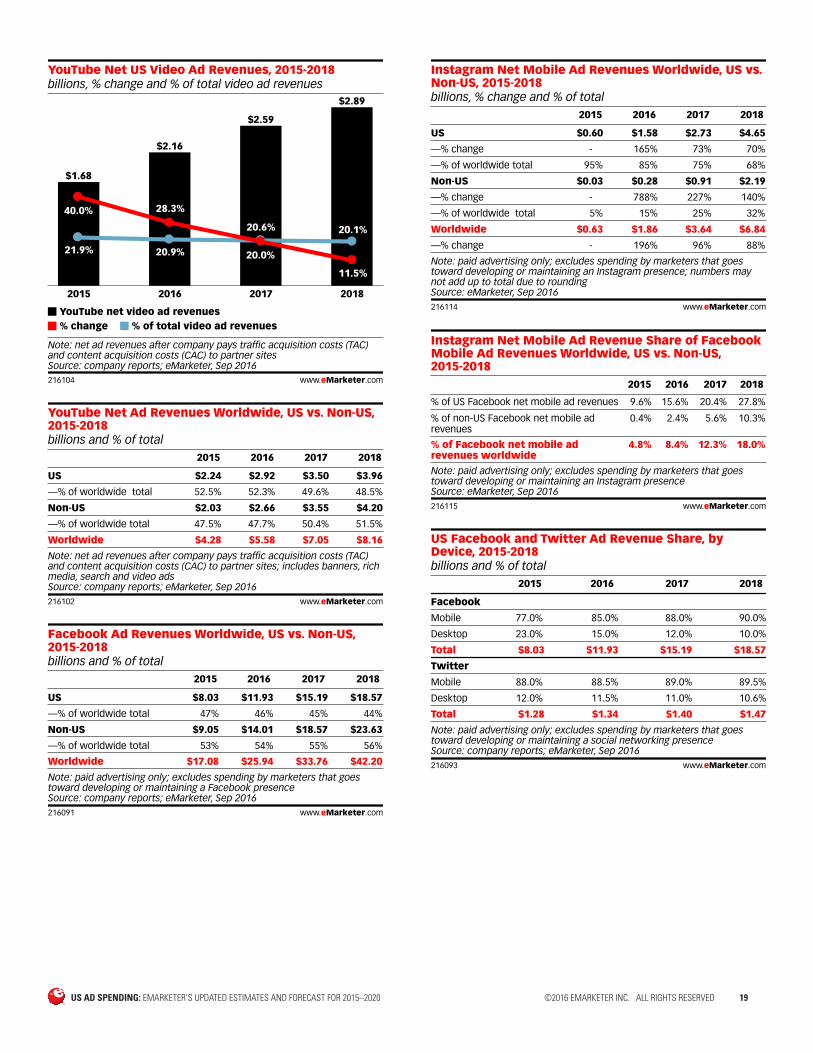
■ Another driver of Google’s financial success is display revenues generated from YouTube. More advertisers have become comfortable with programmatic media buys on YouTube since they first became available on DoubleClick Bid Manager in September 2015. Thanks to its massive scale and rising monthly video consumption, YouTube US net digital ad revenues—which exclude traffic acquisition costs (TAC) and content acquisition costs (CAC) paid to partner sites—will grow by 30.0% in 2016, totaling $2.92 billion. YouTube’s video ad earnings will account for 20.9% of the US digital video ad market this year, while total net revenues—including banner, rich media and other display ads on the site—will account for 9.9% of Google’s digital ad revenues.
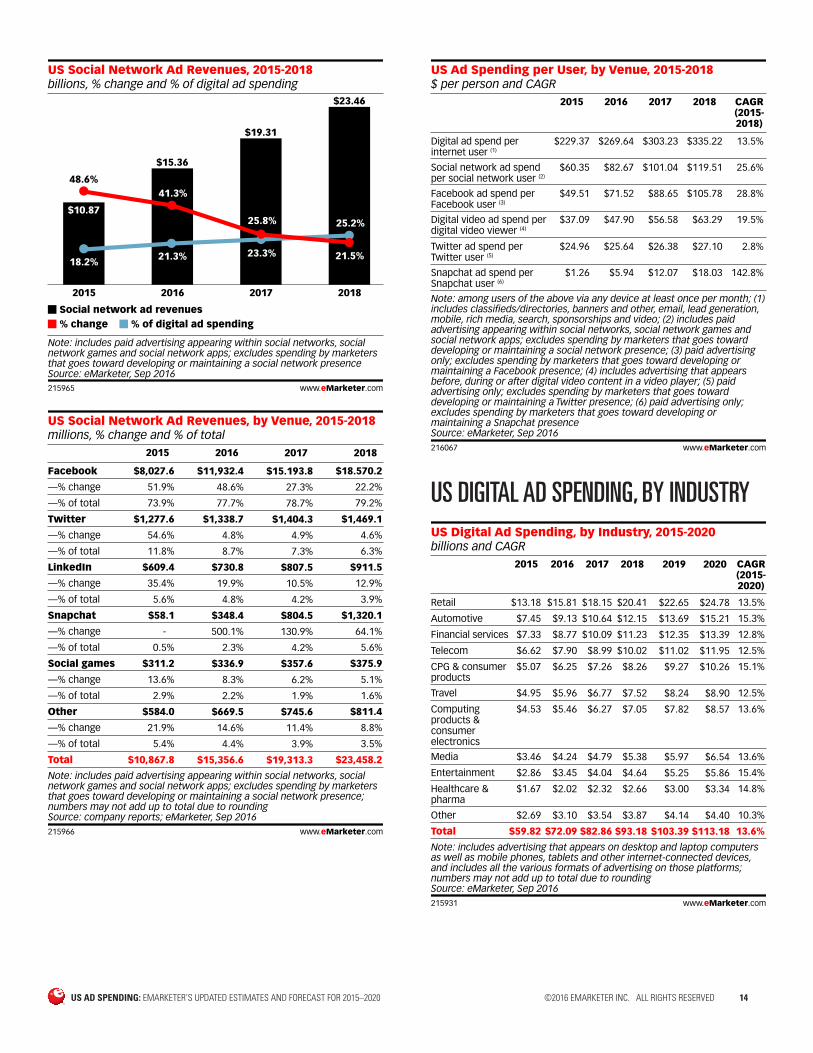
■ eMarketer has raised its projections for Facebook’s US advertising revenue, based on the company’s Q2 2016 revenue performance. This showed mobile advertising exceeding expectations. Facebook, the second-largest digital ad publisher in the US, is expected to generate $11.93 billion in ad revenues in 2016, up 48.6% from last year. Digital ad spending on Facebook will climb by another 27.3% in 2017, and 22.2% in 2018 to reach $18.57 billion. The company’s ad revenue growth remains high because of increasing engagement on its platforms and increasing investment on video ads. In addition, the popularity of Instagram advertising is spurring further gains in Facebook’s overall performance.
■ Instagram has become a significant source of revenue for Facebook. Although Facebook does not break out Instagram ad revenues in its earnings statements, eMarketer projects it will reach $1.58 billion in the US alone in 2016, up 165% from last year—impressive figures considering Instagram opened up advertising to all businesses in September 2015. By leveraging data and ad technologies from Facebook, Instagram will grow its revenues very quickly. By 2020, ad revenues will nearly triple, reaching $4.65 billion.
■ Microsoft will generate $2.77 billion in US digital ad revenues this year, slightly higher than previous estimates, representing a 14.5% rise over 2015. eMarketer forecasts that the company’s US digital ad revenues, which come entirely from search, will swell to $3.38 billion by the end of 2018. Search ad dollars will come from the successful integration of Bing search results into all products and devices running Windows 10.
■ Yahoo will record $2.23 billion in US digital ad revenues in 2016, down 11.4% from last year, as the company fails to make meaningful headway in rebuilding its core advertising business. Search ad revenues will fall 17.7% this year, while display ad revenues will dip 5.2%, according to eMarketer. In its Q2 2016 earnings report, most likely one of its last as an independent company, search and display revenues saw declines, and the company’s “Mavens” products—short for mobile, video, native and social—saw softer growth that fell short of company expectations. (In July 2016, Verizon announced that it would purchase Yahoo for $4.8 billion, a deal that is expected to close in Q1 2017.)
■ eMarketer has lowered its forecast for Twitter’s US ad revenue based on revenues guidance from the company’s Q2 2016 earnings report. User growth in the US is nearly flat, and the company says it’s seeing less overall advertiser demand than expected. US ad revenue growth will fall from 54.6% in 2015 to 4.8% in 2016 to reach $1.34 billion, eMarketer predicts. Some of the challenges facing the company include an inability to attract new users and increased competition for social marketing budgets from newer platforms like Snapchat and Instagram. However, user engagement among existing users is still high, which is a positive sign for the company. And as the platform continues to integrate live video into its content and products, eMarketer expects Twitter to see small but positive gains in ad revenues through 2018.
US AD SPENDING: EMARKETER’S UPDATED ESTIMATES AND FORECAST FOR 2015–2020 ©2016 EMARKETER INC. ALL RIGHTS RESERVED 7
■ US digital ad revenues from Verizon, which include display and a little bit of search ad revenues from Millennial Media and AOL, will total $1.27 billion in 2016, up 4.7% from the previous year. Most of the growth will be sustained by AOL Networks, which includes The Huffington Post, TechCrunch and other properties. Until the acquisition of Yahoo is complete, eMarketer will continue to report Yahoo ad revenues separately from Verizon.
■ Amazon’s US digital ad revenues will surge 33.7% in 2016 to reach $940 million, and eMarketer expects the total will eclipse $1 billion next year. These are higher than previous estimates, based on the success of Amazon’s Prime Day, which exceeded company expectations.
■ LinkedIn’s US digital ad earnings have increased to $730 million since eMarketer’s previous projections as a result of strong Q2 2016 performance from Marketing Solutions, the company’s main advertising business. US digital ad revenues are expected to increase 19.9% this year and 10.5% in 2017. In June 2016, Microsoft announced plans to acquire LinkedIn, and until the deal is complete, eMarketer will continue to report ad revenues from LinkedIn separately from Microsoft.
■ IAC/InterActiveCorp’s US digital ad revenues will fall 22.3% this year to total $610 million. This is down significantly from previous eMarketer predictions due to a dramatic slowdown in the company’s search and applications properties.
■ Yelp will take in $590 million in US digital ad revenues in 2016, up 26.2% from 2015. eMarketer has slightly increased estimates for Yelp this year and for the entire forecast period as local search advertising, the company’s core strength, continues to show steady growth.
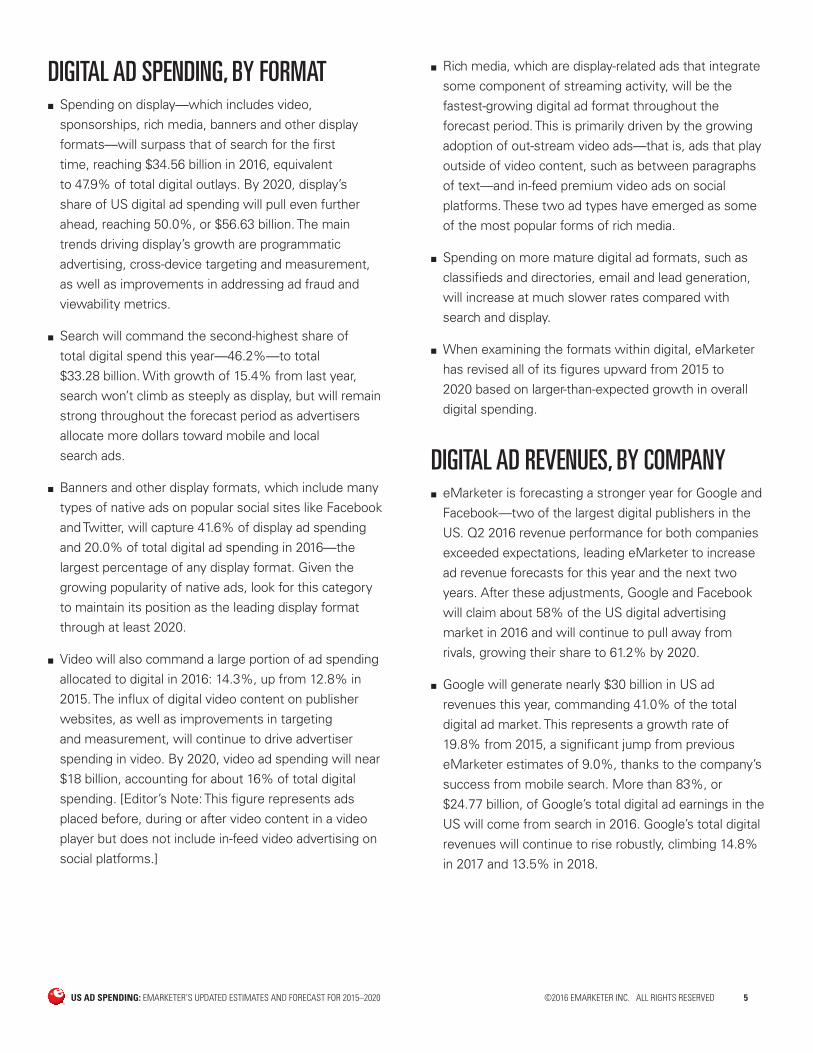
MOBILE AD SPENDING
US advertisers are investing heavily in mobile
channels as they look to follow consumers’ media
consumption habits. US mobile ad spending will total
$45.95 billion in 2016, a 45.0% increase from last year.
US Mobile Ad Spending, 2015-2020
Mobile ad spending(billions)
—% change
—% of digital adspending
—% of total mediaad spending
2015
$31.69
65.5%
53.0%
17.3%
2016
$45.95
45.0%
63.7%
23.5%
2017
$57.44
25.0%
69.3%
27.7%
2018
$68.93
20.0%
74.0%
31.4%
2019
$77.89
13.0%
75.3%
33.7%
2020
$86.84
11.5%
76.7%
35.8%
Note: includes classified, display (banners, rich media, video and other),email, lead generation, messaging-based advertising and searchadvertising; includes ad spending on tabletsSource: eMarketer, Sep 2016215968 www.eMarketer.com
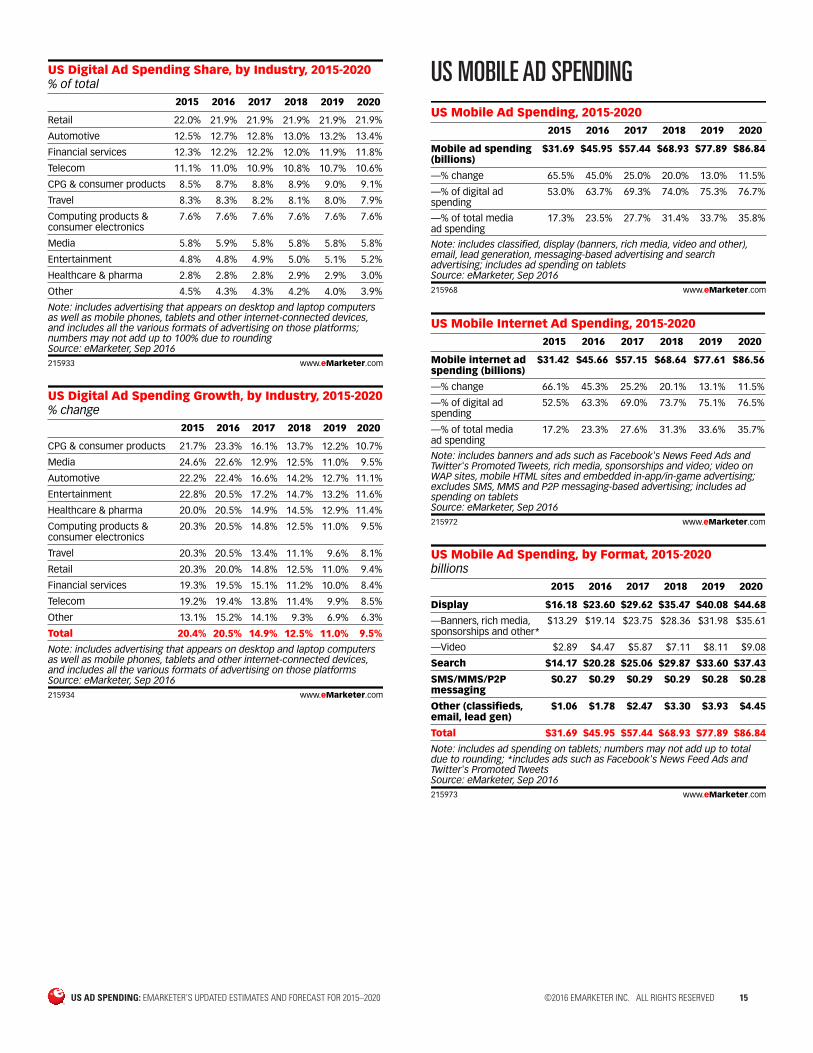
■ Advertiser enthusiasm for mobile is strong due in part to the advancements in programmatic buying, including targeting and measurement, as well as a greater selection of mobile ad formats. By 2020, mobile ad expenditures will climb to $86.84 billion, driven by new advertising opportunities on mobile and funds shifting away from traditional media.
■ Mobile’s share of total US digital ad spending will reach 63.7% this year, up from 53.0% in 2015. Mobile continues to grow faster than digital as a whole, grabbing a bigger slice of the total each year. By 2020, 76.7% of all digital ad spending will go to mobile, while only 23.3% will go toward spending on desktop/laptop devices.
■ Mobile is also making a sizable dent in overall ad spending. eMarketer estimates mobile will account for 23.5% of US paid media advertising this year. By 2019, this share will increase to 33.7%—at that point mobile will surpass TV and become the largest advertising channel in the US.
■ eMarketer has adjusted its forecast for mobile ad spending growth since its March 2016 estimates. eMarketer now expects mobile ad expenditures to increase 45.0% in 2016, up significantly from its previous estimate of 38.0%.
US AD SPENDING: EMARKETER’S UPDATED ESTIMATES AND FORECAST FOR 2015–2020 ©2016 EMARKETER INC. ALL RIGHTS RESERVED 8
MOBILE AD SPENDING, BY FORMAT ■ Mobile display formats—which include banners, rich media, sponsorships, video and other options—are collectively the biggest mobile ad category and will remain so throughout the forecast period. In 2016, spending on mobile display will total $23.60 billion, accounting for 51.4% of total mobile spending. Increased demand for mobile display formats, especially rich media and video, will help fuel growth through 2020, when spending across mobile display will reach $44.68 billion.
■ Spending on mobile search ads is forecast to reach $20.28 billion, or 44.1% of total US spending on mobile this year, up from $14.17 billion in 2015. Mobile search will continue to benefit from advertisers looking to leverage location data to reach consumers.
MOBILE AD REVENUES, BY COMPANY ■ Google is the largest mobile ad publisher and will remain so for the foreseeable future. Google will capture 32.0% of the US mobile ad market in 2016, with revenues on track to reach $14.69 billion. The bulk is generated by the company’s mobile search business, which will total $12.73 billion this year, up 49.0% over 2015, eMarketer estimates. In fact, during Google’s Q2 2016 earnings report, the company credited mobile search as the key force behind its strong quarterly results. Additionally, a number of key enhancements, including expanded text ads across all devices and the ability to place local ads on Google Maps, will help the company generate additional mobile revenues in the next few years.
■ eMarketer projects US mobile ad revenues for Facebook will increase 64.1% this year to reach $10.14 billion. The company continues to make significant inroads in advancing revenues from mobile advertising: Mobile’s share of total digital revenues for Facebook will climb from 77.0% in 2015 to 85.0% in 2016. This growth will be primarily attributed to popular in-feed mobile formats, such as native video, as well as from revenues generated by Instagram. About 15% of Facebook’s mobile ad revenues, a total of $1.58 billion, will come from Instagram this year.
■ Twitter’s mobile advertising business will generate $1.18 billion in revenues this year, making Twitter the third-largest mobile ad publisher in the US—still far behind Google and Facebook, but ahead of Yahoo. In 2016 and 2017, Twitter will have the highest share of total digital ad revenues coming from mobile of any company included in eMarketer’s forecast. Dollars generated from mobile placements will represent 88.5% of Twitter’s overall US advertising earnings in 2016. By comparison, Facebook’s share will be 85.0%.
■ Mobile ad revenues for Yahoo will total $1.07 billion this year, representing 48.0% of the company’s total US digital ad revenues and 2.3% of US mobile ad revenues overall. Mobile revenues for the company will be fairly evenly split between search and display this year, with approximately 55% of mobile revenues coming from search and 45% from display.
■ Pandora will generate $847.1 million in US mobile display ad dollars in 2016, up 17.2% from last year. However, Pandora will face challenges throughout the forecast due to rising content acquisition costs, flattening user growth and increased competition from digital streaming services.
■ YP will generate $765.5 million in US mobile search revenues this year, accounting for 3.8% of the total US mobile search ad market. Mobile ad revenues in the US for the search and directories company will surpass $1 billion by the end of 2018 as marketers continue to spend more on location-based targeted ads.
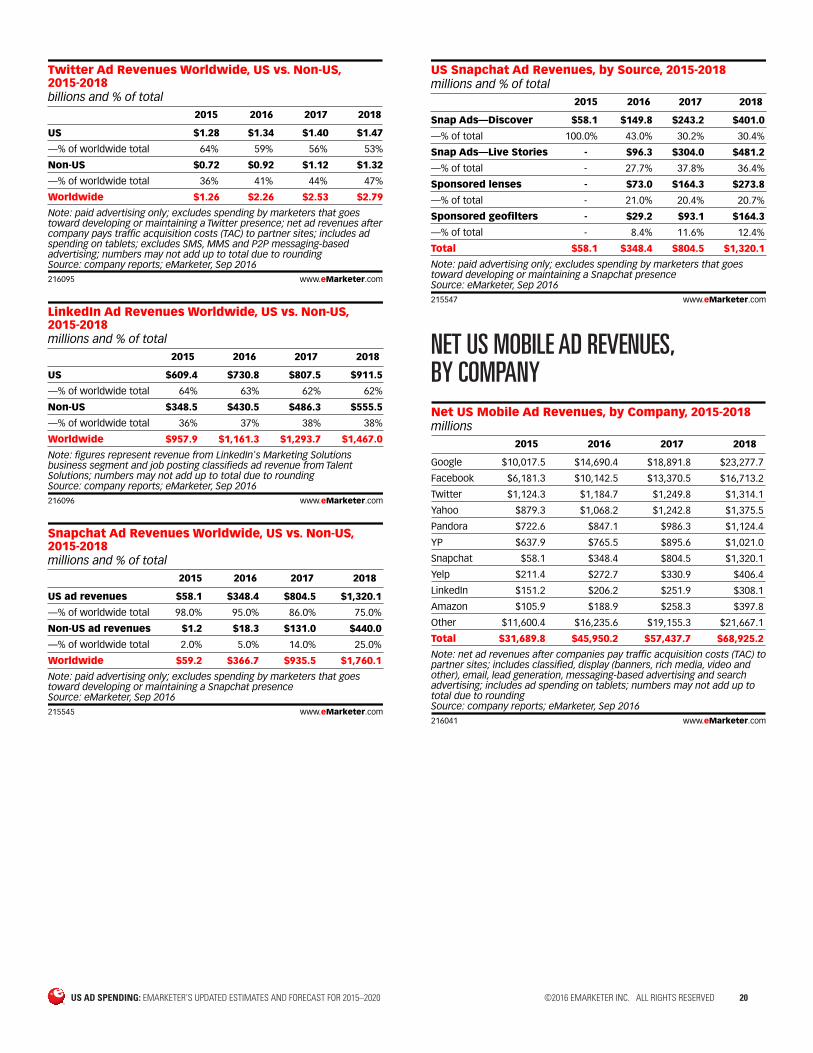
■ For the first time, eMarketer is forecasting net US mobile ad revenues for Snapchat. Over the past year, the company has expanded its portfolio of ad products to include a wider array of video ads, more sponsored geofilters and sponsored lenses. In addition, the company has also invested in an expansion of its API technology. eMarketer expects Snapchat’s US net mobile display advertising revenues to rise from $348.4 million in 2016 and to over $1.32 billion by 2018. At that point, Snapchat will rank among the top three revenue generators for mobile display ads in the US— still far below Facebook ($16.71 billion) and Google ($2.91 billion), but ahead of Twitter ($1.31 billion). [Editor’s Note: Snapchat has not publicly reported advertising revenue figures.]
US AD SPENDING: EMARKETER’S UPDATED ESTIMATES AND FORECAST FOR 2015–2020 ©2016 EMARKETER INC. ALL RIGHTS RESERVED 9
COMPLETE FORECAST
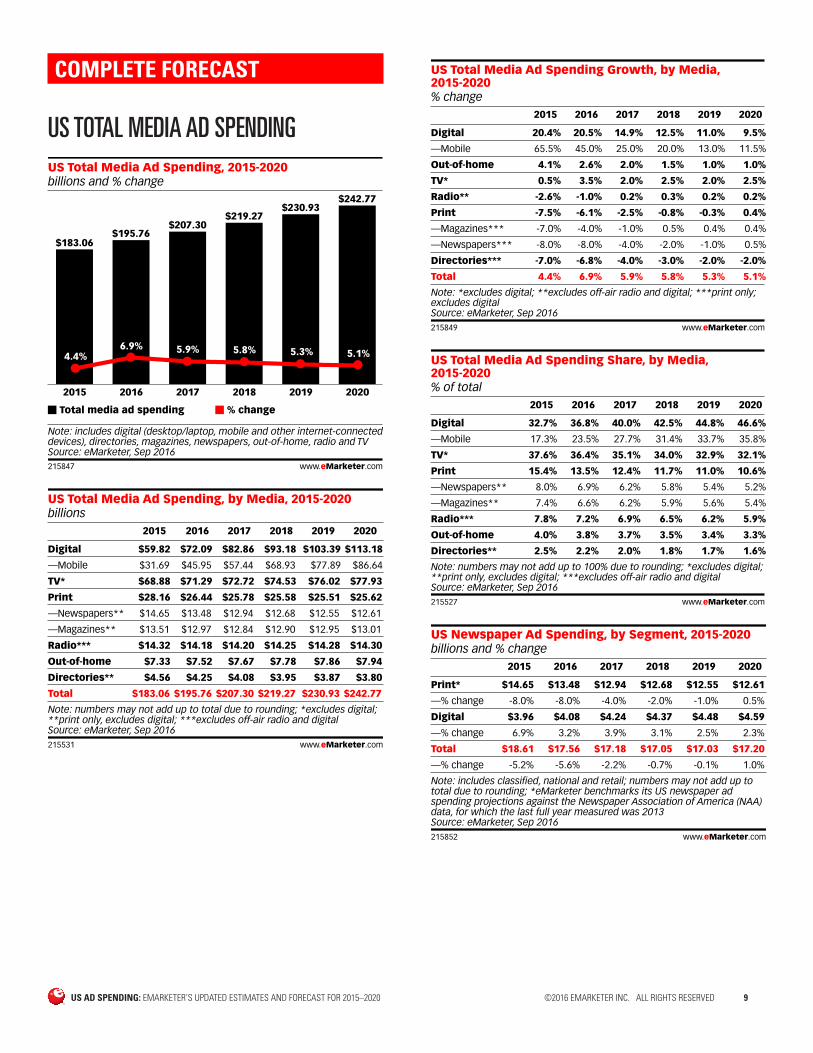
US TOTAL MEDIA AD SPENDING
billions and % changeUS Total Media Ad Spending, 2015-2020
2015
$183.06
4.4%
2016
$195.76
6.9%
2017
$207.30
5.9%
2018
$219.27
5.8%
2019
$230.93
5.3%
2020
$242.77
5.1%
Total media ad spending % change
Note: includes digital (desktop/laptop, mobile and other internet-connecteddevices), directories, magazines, newspapers, out-of-home, radio and TVSource: eMarketer, Sep 2016215847 www.eMarketer.com
billionsUS Total Media Ad Spending, by Media, 2015-2020
2015 2016 2017 2018 2019 2020
Digital $59.82 $72.09 $82.86 $93.18 $103.39 $113.18
—Mobile $31.69 $45.95 $57.44 $68.93 $77.89 $86.64
TV* $68.88 $71.29 $72.72 $74.53 $76.02 $77.93
Print $28.16 $26.44 $25.78 $25.58 $25.51 $25.62
—Newspapers** $14.65 $13.48 $12.94 $12.68 $12.55 $12.61
—Magazines** $13.51 $12.97 $12.84 $12.90 $12.95 $13.01
Radio*** $14.32 $14.18 $14.20 $14.25 $14.28 $14.30
Out-of-home $7.33 $7.52 $7.67 $7.78 $7.86 $7.94
Directories** $4.56 $4.25 $4.08 $3.95 $3.87 $3.80
Total $183.06 $195.76 $207.30 $219.27 $230.93 $242.77
Note: numbers may not add up to total due to rounding; *excludes digital; **print only, excludes digital; ***excludes off-air radio and digitalSource: eMarketer, Sep 2016215531 www.eMarketer.com
% change
US Total Media Ad Spending Growth, by Media,2015-2020
2015 2016 2017 2018 2019 2020
Digital 20.4% 20.5% 14.9% 12.5% 11.0% 9.5%
—Mobile 65.5% 45.0% 25.0% 20.0% 13.0% 11.5%
Out-of-home 4.1% 2.6% 2.0% 1.5% 1.0% 1.0%
TV* 0.5% 3.5% 2.0% 2.5% 2.0% 2.5%
Radio** -2.6% -1.0% 0.2% 0.3% 0.2% 0.2%
Print -7.5% -6.1% -2.5% -0.8% -0.3% 0.4%
—Magazines*** -7.0% -4.0% -1.0% 0.5% 0.4% 0.4%
—Newspapers*** -8.0% -8.0% -4.0% -2.0% -1.0% 0.5%
Directories*** -7.0% -6.8% -4.0% -3.0% -2.0% -2.0%
Total 4.4% 6.9% 5.9% 5.8% 5.3% 5.1%
Note: *excludes digital; **excludes off-air radio and digital; ***print only;excludes digitalSource: eMarketer, Sep 2016215849 www.eMarketer.com
% of total
US Total Media Ad Spending Share, by Media,2015-2020
2015 2016 2017 2018 2019 2020
Digital 32.7% 36.8% 40.0% 42.5% 44.8% 46.6%
—Mobile 17.3% 23.5% 27.7% 31.4% 33.7% 35.8%
TV* 37.6% 36.4% 35.1% 34.0% 32.9% 32.1%
Print 15.4% 13.5% 12.4% 11.7% 11.0% 10.6%
—Newspapers** 8.0% 6.9% 6.2% 5.8% 5.4% 5.2%
—Magazines** 7.4% 6.6% 6.2% 5.9% 5.6% 5.4%
Radio*** 7.8% 7.2% 6.9% 6.5% 6.2% 5.9%
Out-of-home 4.0% 3.8% 3.7% 3.5% 3.4% 3.3%
Directories** 2.5% 2.2% 2.0% 1.8% 1.7% 1.6%
Note: numbers may not add up to 100% due to rounding; *excludes digital;**print only, excludes digital; ***excludes off-air radio and digitalSource: eMarketer, Sep 2016215527 www.eMarketer.com
billions and % changeUS Newspaper Ad Spending, by Segment, 2015-2020
2015 2016 2017 2018 2019 2020
Print* $14.65 $13.48 $12.94 $12.68 $12.55 $12.61
—% change
Digital $3.96 $4.08 $4.24 $4.37 $4.48 $4.59
—% change
Total $18.61 $17.56 $17.18 $17.05 $17.03 $17.20
—% change
-8.0% -8.0% -4.0% -2.0% -1.0% 0.5%
6.9% 3.2% 3.9% 3.1% 2.5% 2.3%
-5.2% -5.6% -2.2% -0.7% -0.1% 1.0%
Note: includes classified, national and retail; numbers may not add up tototal due to rounding; *eMarketer benchmarks its US newspaper adspending projections against the Newspaper Association of America (NAA)data, for which the last full year measured was 2013Source: eMarketer, Sep 2016215852 www.eMarketer.com
US AD SPENDING: EMARKETER’S UPDATED ESTIMATES AND FORECAST FOR 2015–2020 ©2016 EMARKETER INC. ALL RIGHTS RESERVED 10
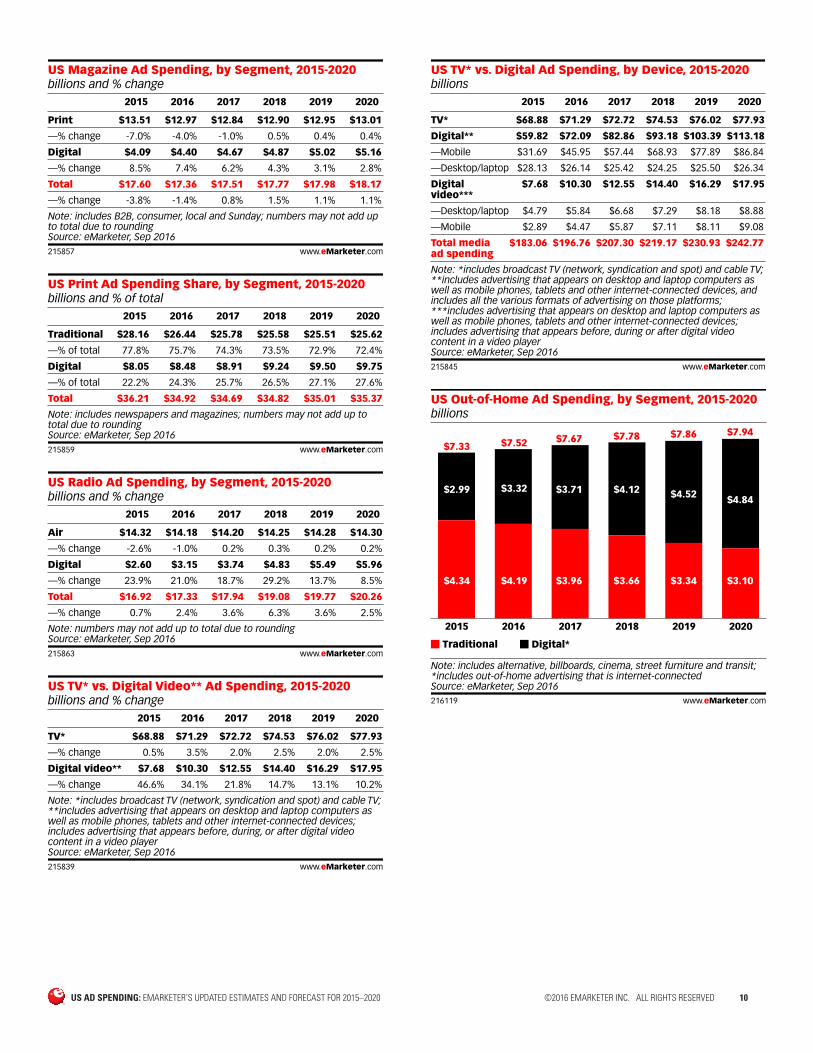
billions and % changeUS Magazine Ad Spending, by Segment, 2015-2020
2015 2016 2017 2018 2019 2020
Print $13.51 $12.97 $12.84 $12.90 $12.95 $13.01
—% change
Digital $4.09 $4.40 $4.67 $4.87 $5.02 $5.16
—% change
Total $17.60 $17.36 $17.51 $17.77 $17.98 $18.17
—% change
-7.0% -4.0% -1.0% 0.5% 0.4% 0.4%
8.5% 7.4% 6.2% 4.3% 3.1% 2.8%
-3.8% -1.4% 0.8% 1.5% 1.1% 1.1%
Note: includes B2B, consumer, local and Sunday; numbers may not add upto total due to roundingSource: eMarketer, Sep 2016215857 www.eMarketer.com
billions and % of totalUS Print Ad Spending Share, by Segment, 2015-2020
2015 2016 2017 2018 2019 2020
Traditional
—% of total 77.8% 75.7% 74.3% 73.5% 72.9% 72.4%
Digital
—% of total 22.2% 24.3% 25.7% 26.5% 27.1% 27.6%
Total
$28.16 $26.44 $25.78 $25.58 $25.51 $25.62
$8.05 $8.48 $8.91 $9.24 $9.50 $9.75
$36.21 $34.92 $34.69 $34.82 $35.01 $35.37
Note: includes newspapers and magazines; numbers may not add up tototal due to roundingSource: eMarketer, Sep 2016215859 www.eMarketer.com
billions and % changeUS Radio Ad Spending, by Segment, 2015-2020
2015 2016 2017 2018 2019 2020
Air
—% change -2.6% -1.0% 0.2% 0.3% 0.2% 0.2%
Digital
—% change 23.9% 21.0% 18.7% 29.2% 13.7% 8.5%
Total
$14.32 $14.18 $14.20 $14.25 $14.28 $14.30
$2.60 $3.15 $3.74 $4.83 $5.49 $5.96
$16.92 $17.33 $17.94 $19.08 $19.77 $20.26
—% change 0.7% 2.4% 3.6% 6.3% 3.6% 2.5%
Note: numbers may not add up to total due to roundingSource: eMarketer, Sep 2016215863 www.eMarketer.com
billions and % changeUS TV* vs. Digital Video** Ad Spending, 2015-2020
2015 2016 2017 2018 2019 2020
TV*
—% change 0.5% 3.5% 2.0% 2.5% 2.0% 2.5%
Digital video**
$68.88 $71.29 $72.72 $74.53 $76.02 $77.93
$7.68 $10.30 $12.55 $14.40 $16.29 $17.95
—% change 46.6% 34.1% 21.8% 14.7% 13.1% 10.2%
Note: *includes broadcast TV (network, syndication and spot) and cable TV;**includes advertising that appears on desktop and laptop computers aswell as mobile phones, tablets and other internet-connected devices;includes advertising that appears before, during, or after digital videocontent in a video playerSource: eMarketer, Sep 2016215839 www.eMarketer.com
billionsUS TV* vs. Digital Ad Spending, by Device, 2015-2020
2015 2016 2017 2018 2019 2020
TV* $68.88 $71.29 $72.72 $74.53 $76.02 $77.93
Digital** $59.82 $72.09 $82.86 $93.18 $103.39 $113.18
—Mobile $31.69 $45.95 $57.44 $68.93 $77.89 $86.84
—Desktop/laptop $28.13 $26.14 $25.42 $24.25 $25.50 $26.34
Digitalvideo***
$7.68 $10.30 $12.55 $14.40 $16.29 $17.95
—Desktop/laptop $4.79 $5.84 $6.68 $7.29 $8.18 $8.88
—Mobile $2.89 $4.47 $5.87 $7.11 $8.11 $9.08
Total media ad spending
$183.06 $196.76 $207.30 $219.17 $230.93 $242.77
Note: *includes broadcast TV (network, syndication and spot) and cable TV;**includes advertising that appears on desktop and laptop computers aswell as mobile phones, tablets and other internet-connected devices, andincludes all the various formats of advertising on those platforms;***includes advertising that appears on desktop and laptop computers aswell as mobile phones, tablets and other internet-connected devices;includes advertising that appears before, during or after digital videocontent in a video playerSource: eMarketer, Sep 2016215845 www.eMarketer.com
billionsUS Out-of-Home Ad Spending, by Segment, 2015-2020
2015
$4.34
$2.99
2016
$4.19
$3.32
2017
$3.96
$3.71
2018
$3.66
$4.12
2019
$3.34
$4.52
2020
$3.10
$4.84
$7.33 $7.52 $7.67 $7.78 $7.86 $7.94
Traditional Digital*
Note: includes alternative, billboards, cinema, street furniture and transit;*includes out-of-home advertising that is internet-connectedSource: eMarketer, Sep 2016216119 www.eMarketer.com
US AD SPENDING: EMARKETER’S UPDATED ESTIMATES AND FORECAST FOR 2015–2020 ©2016 EMARKETER INC. ALL RIGHTS RESERVED 11
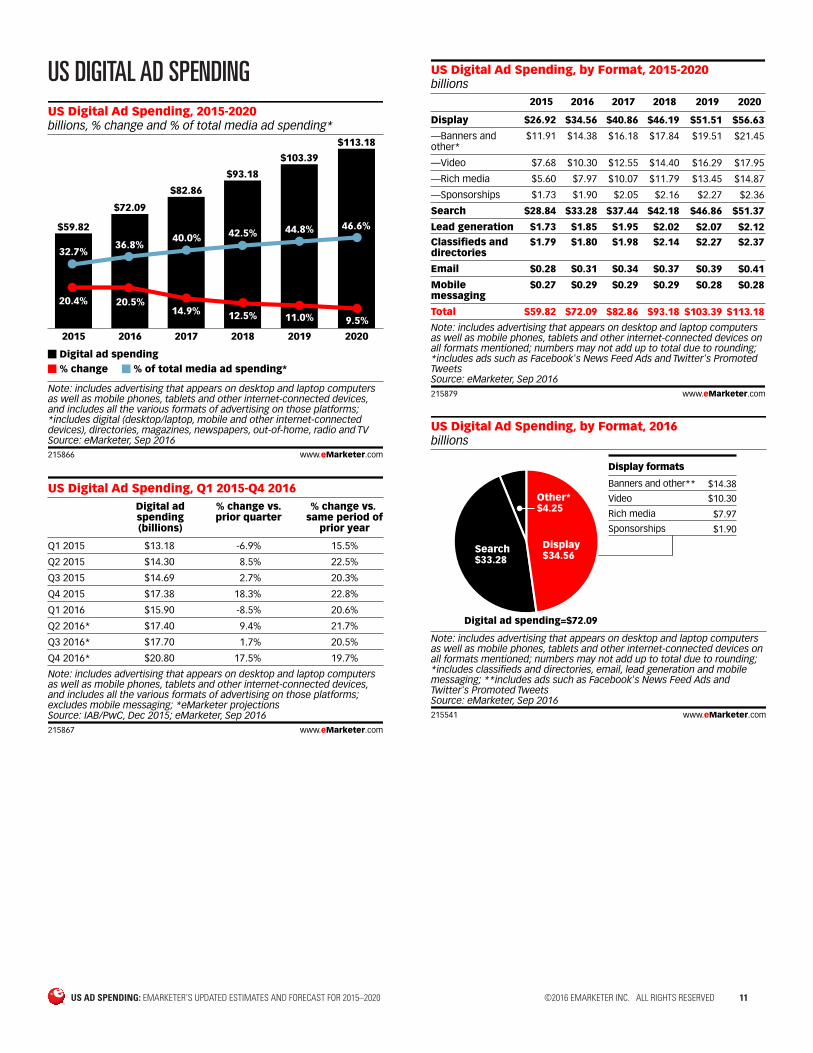
US DIGITAL AD SPENDING
billions, % change and % of total media ad spending*US Digital Ad Spending, 2015-2020
2015
$59.82
2016
$72.09
2017
$82.86
2018
$93.18
2019
$103.39
2020
$113.18
Digital ad spending% change % of total media ad spending*
Note: includes advertising that appears on desktop and laptop computersas well as mobile phones, tablets and other internet-connected devices,and includes all the various formats of advertising on those platforms;*includes digital (desktop/laptop, mobile and other internet-connecteddevices), directories, magazines, newspapers, out-of-home, radio and TVSource: eMarketer, Sep 2016215866 www.eMarketer.com
32.7%36.8%
40.0% 42.5% 44.8% 46.6%
20.4% 20.5%14.9% 12.5% 11.0% 9.5%
US Digital Ad Spending, Q1 2015-Q4 2016Digital adspending(billions)
Q1 2015 $13.18
Q2 2015 $14.30
Q3 2015 $14.69
Q4 2015 $17.38
Q1 2016 $15.90
Q2 2016* $17.40
Q3 2016* $17.70
Q4 2016* $20.80
% change vs.prior quarter
-6.9%
8.5%
2.7%
18.3%
-8.5%
9.4%
1.7%
17.5%
% change vs. same period of
prior year
15.5%
22.5%
20.3%
22.8%
20.6%
21.7%
20.5%
19.7%
Note: includes advertising that appears on desktop and laptop computersas well as mobile phones, tablets and other internet-connected devices,and includes all the various formats of advertising on those platforms;excludes mobile messaging; *eMarketer projectionsSource: IAB/PwC, Dec 2015; eMarketer, Sep 2016215867 www.eMarketer.com
billionsUS Digital Ad Spending, by Format, 2015-2020
Display
—Banners andother*
—Video
—Rich media
—Sponsorships
Search
Lead generation
Classifieds anddirectories
Mobilemessaging
Total
2015
$26.92
$11.91
$7.68
$5.60
$1.73
$28.84
$1.73
$1.79
$0.28
$0.27
$59.82
2016
$34.56
$14.38
$10.30
$7.97
$1.90
$33.28
$1.85
$1.80
$0.31
$0.29
$72.09
2017
$40.86
$16.18
$12.55
$10.07
$2.05
$37.44
$1.95
$1.98
$0.34
$0.29
$82.86
2018
$46.19
$17.84
$14.40
$11.79
$2.16
$42.18
$2.02
$2.14
$0.37
$0.29
$93.18
2019
$51.51
$19.51
$16.29
$13.45
$2.27
$46.86
$2.07
$2.27
$0.39
$0.28
$103.39
2020
$56.63
$21.45
$17.95
$14.87
$2.36
$51.37
$2.12
$2.37
$0.41
$0.28
$113.18
Note: includes advertising that appears on desktop and laptop computersas well as mobile phones, tablets and other internet-connected devices onall formats mentioned; numbers may not add up to total due to rounding;*includes ads such as Facebook's News Feed Ads and Twitter's PromotedTweetsSource: eMarketer, Sep 2016215879 www.eMarketer.com
billionsUS Digital Ad Spending, by Format, 2016
Note: includes advertising that appears on desktop and laptop computersas well as mobile phones, tablets and other internet-connected devices onall formats mentioned; numbers may not add up to total due to rounding;*includes classifieds and directories, email, lead generation and mobilemessaging; **includes ads such as Facebook's News Feed Ads andTwitter's Promoted TweetsSource: eMarketer, Sep 2016215541 www.eMarketer.com
Banners and other**
Video
Rich media
Sponsorships
Display formats
$14.38
$10.30
$7.97
$1.90
Digital ad spending=$72.09
Display$34.56
Search$33.28
Other*$4.25
US AD SPENDING: EMARKETER’S UPDATED ESTIMATES AND FORECAST FOR 2015–2020 ©2016 EMARKETER INC. ALL RIGHTS RESERVED 12
% changeUS Digital Ad Spending Growth, by Format, 2015-2020
2015 2016 2017 2018 2019 2020
Display 27.8% 28.4% 18.2% 13.1% 11.5% 9.9%
—Rich media 50.9% 42.4% 26.4% 17.0% 14.1% 10.6%
—Video 46.6% 34.1% 21.8% 14.7% 13.1% 10.2%
—Banners and other* 13.1% 20.8% 12.5% 10.3% 9.3% 10.0%
—Sponsorships 9.1% 10.2% 7.6% 5.7% 4.8% 4.0%
Search 16.4% 15.4% 12.5% 12.6% 11.1% 9.6%
Email 11.7% 13.2% 9.7% 7.1% 6.5% 5.5%
Mobile messaging 13.9% 7.9% -0.4% -1.6% -2.7% -0.1%
Lead generation 5.8% 7.3% 5.2% 3.4% 2.8% 2.4%
Classifieds and directories 3.2% 0.5% 10.4% 7.8% 6.2% 4.5%
Total 20.4% 20.5% 14.9% 12.5% 11.0% 9.5%
Note: includes advertising that appears on desktop and laptop computersas well as mobile phones, tablets and other internet-connected devices onall formats mentioned; *includes ads such as Facebook's News Feed Adsand Twitter's Promoted TweetsSource: eMarketer, Sep 2016215889 www.eMarketer.com
% of total and billionsUS Digital Ad Spending Share, by Format, 2015-2020
Display
—Banners andother*
—Video
—Rich media
—Sponsorships
Search
Lead generation
Classifieds anddirectories
Mobile messaging
Total
2015
45.0%
19.9%
12.8%
9.4%
2.9%
48.2%
2.9%
3.0%
0.5%
0.5%
$59.82
2016
47.9%
20.0%
14.3%
11.1%
2.6%
46.2%
2.6%
2.5%
0.4%
0.4%
$72.09
2017
49.3%
19.5%
15.1%
12.2%
2.5%
45.2%
2.4%
2.4%
0.4%
0.4%
$82.86
2018
49.6%
19.2%
15.5%
12.7%
2.3%
45.3%
2.2%
2.3%
0.4%
0.3%
$93.18
2019
49.8%
18.9%
15.8%
13.0%
2.2%
45.3%
2.0%
2.2%
0.4%
0.3%
$103.39
2020
50.0%
19.0%
15.9%
13.1%
2.1%
45.4%
1.9%
2.1%
0.4%
0.2%
$113.18
Note: includes advertising that appears on desktop and laptop computersas well as mobile phones, tablets and other internet-connected devices onall formats mentioned; numbers may not add up to 100% due to rounding;*includes ads such as Facebook's News Feed Ads and Twitter's PromotedTweetsSource: eMarketer, Sep 2016215882 www.eMarketer.com
billionsUS Digital Ad Spending, by Device, 2015-2020
2015
$31.69
$28.13
2016
$45.95
$26.14
2017
$57.44
$25.42
2018
$68.93
$24.25
2019
$77.89
$25.50
2020
$86.84
$26.34
Mobile* Desktop**
Note: *includes classifieds, display (banners, rich media, video and other),email, lead generation, messaging-based advertising and search; includesad spending on tablets; **includes spending primarily on desktop-basedadsSource: eMarketer, Sep 2016215868 www.eMarketer.com
billions
US Digital Ad Spending, by Device and Format,2015-2020
Mobile*
Display
—Banners, rich media, sponsorships and other**
—Video
Search
SMS/MMS/P2P messaging
Other (classifieds and directories, email and lead generation)
Desktop***
Search
Display
—Video
—Banners, rich media, sponsorships and other**
Other (classifieds and directories, email and lead generation)
Total
2015
$31.69
$16.18
$13.29
$2.89
$14.17
$0.27
$1.06
$28.13
$14.67
$10.73
$4.79
$5.94
$2.73
$59.82
2016
$45.95
$23.60
$19.14
$4.47
$20.28
$0.29
$1.78
$26.14
$13.00
$10.96
$5.84
$5.12
$2.18
$72.09
2017
$57.44
$29.62
$23.75
$5.87
$25.06
$0.29
$2.47
$25.42
$12.38
$11.24
$6.68
$4.55
$1.81
$82.86
2018
$68.93
$35.47
$28.36
$7.11
$29.87
$0.29
$3.30
$24.25
$12.31
$10.72
$7.29
$3.43
$1.22
$93.18
2019
$77.89
$40.08
$31.98
$8.11
$33.60
$0.28
$3.93
$25.50
$13.27
$11.43
$8.18
$3.25
$0.81
$103.39
2020
$86.84
$44.68
$35.61
$9.08
$37.43
$0.28
$4.45
$26.34
$13.94
$11.95
$8.88
$3.08
$0.45
$113.18
Note: *includes ad spending on tablets; **includes ads such as Facebook'sNews Feed Ads and Twitter's Promoted Tweets; ***includes spendingprimarily on desktop-based adsSource: eMarketer, Sep 2016215874 www.eMarketer.com
US AD SPENDING: EMARKETER’S UPDATED ESTIMATES AND FORECAST FOR 2015–2020 ©2016 EMARKETER INC. ALL RIGHTS RESERVED 13
% change
US Digital Ad Spending Growth, by Device andFormat, 2015-2020
2015 2016 2017 2018 2019 2020
Mobile*
Display
—Video
—Banners, rich media, sponsorshipsand other**
Search
SMS/MMS/P2P messaging
Other (classifieds and directories, email and lead generation)
Desktop***
Display
—Video
—Banners, rich media, sponsorshipsand other**
Search
Other (classifieds and directories, email and lead generation)
65.5%
67.8%
88.0%
63.9%
62.6%
13.9%
93.3%
-7.9%
-6.0%
29.4%
-23.0%
-8.6%
-10.9%
45.0%
45.8%
54.5%
44.0%
43.1%
7.9%
67.5%
-7.1%
2.1%
21.9%
-13.9%
-11.4%
-20.0%
25.0%
25.5%
31.4%
24.1%
23.6%
-0.4%
38.8%
-2.7%
2.6%
14.5%
-11.0%
-4.8%
-17.2%
20.0%
19.8%
21.2%
19.4%
19.2%
-1.6%
33.6%
-4.6%
-4.6%
9.1%
-24.6%
-0.6%
-32.3%
13.0%
13.0%
14.1%
12.7%
12.5%
-2.7%
19.0%
5.2%
6.6%
12.2%
-5.4%
7.8%
-34.0%
11.5%
11.5%
11.9%
11.4%
11.4%
-0.1%
13.5%
3.3%
4.6%
8.5%
-5.3%
5.0%
-44.0%
Note: *includes ad spending on tablets; **includes ads such as Facebook'sNews Feed Ads and Twitter's Promoted Tweets; ***includes spendingprimarily on desktop-based adsSource: eMarketer, Sep 2016215878 www.eMarketer.com
% of total digital ad spending
US Digital Ad Spending Share, by Device and Format,2015-2020
Mobile*
Display
—Banners, rich media, sponsorships and other**
—Video
Search
SMS/MMS/P2P messaging
Other (classifieds and directories, email and lead generation)
Desktop***
Search
Display
—Video
—Banners, rich media, sponsorships and other**
Other (classifieds and directories, email and lead generation)
2015
53.0%
27.1%
22.2%
4.8%
23.7%
0.5%
1.8%
47.0%
24.5%
17.9%
8.0%
9.9%
4.6%
2016
63.7%
32.7%
26.5%
6.2%
28.1%
0.4%
2.5%
36.3%
18.0%
15.2%
8.1%
7.1%
3.0%
2017
69.3%
35.7%
28.7%
7.1%
30.2%
0.4%
3.0%
30.7%
14.9%
13.6%
8.1%
5.5%
2.2%
2018
74.0%
38.1%
30.4%
7.6%
32.1%
0.3%
3.5%
26.0%
13.2%
11.5%
7.8%
3.7%
1.3%
2019
75.3%
38.8%
30.9%
7.8%
32.5%
0.3%
3.8%
24.7%
12.8%
11.1%
7.9%
3.1%
0.8%
2020
76.7%
39.5%
31.5%
8.0%
33.1%
0.2%
3.9%
23.3%
12.3%
10.6%
7.8%
2.7%
0.4%
Note: *includes ad spending on tablets; **includes ads such as Facebook'sNews Feed Ads and Twitter's Promoted Tweets; ***includes spendingprimarily on desktop-based adsSource: eMarketer, Sep 2016215876 www.eMarketer.com
billions and % changeUS Digital Video Ad Spending, by Device, 2015-2020
$4.79
$2.89
$7.68
$5.84
$4.47
$10.30
$6.68
$5.87
$12.55
$7.29
$7.11
$14.40
$8.18
$8.11
$16.29
$8.88
$9.08
$17.95
Note: includes advertising that appears before, during or after digital video content in a video player; numbers may not add up to total due to rounding;*includes advertising that appears on desktop and laptop computers and other internet-connected devices; **includes mobile phones and tabletsSource: eMarketer, Sep 2016216109 www.eMarketer.com
2015
29.4%
88.0%
46.6%
2016
21.9%
54.5%
34.1%
2017
14.5%
31.4%
21.8%
2018
9.1%
21.2%
14.7%
2019
12.2%
14.1%
13.1%
2020
8.5%
11.9%
10.2%
Desktop*
Mobile**
Total
% of total media ad spending
US Digital Video Ad Spending Share, by Device,2015-2020
2015 2016 2017 2018 2019 2020
Desktop* 2.6% 3.0% 3.2% 3.3% 3.5% 3.7%
Mobile** 1.6% 2.3% 2.8% 3.2% 3.5% 3.7%
Total digital 4.2% 5.3% 6.1% 6.6% 7.1% 7.4%
Note: includes advertising that appears before, during or after digital videocontent in a video player; *includes spending primarily on desktop-basedads; **includes ad spending on tabletsSource: eMarketer, Sep 2016215896 www.eMarketer.com
US AD SPENDING: EMARKETER’S UPDATED ESTIMATES AND FORECAST FOR 2015–2020 ©2016 EMARKETER INC. ALL RIGHTS RESERVED 14
billions, % change and % of digital ad spendingUS Social Network Ad Revenues, 2015-2018
2015
$10.87
48.6%
18.2%
2016
$15.36
41.3%
21.3%
2017
$19.31
25.8%
23.3%
2018
$23.46
21.5%
25.2%
Social network ad revenues% change % of digital ad spending
Note: includes paid advertising appearing within social networks, socialnetwork games and social network apps; excludes spending by marketersthat goes toward developing or maintaining a social network presenceSource: eMarketer, Sep 2016215965 www.eMarketer.com
millions, % change and % of totalUS Social Network Ad Revenues, by Venue, 2015-2018
—% change
—% of total
—% change
—% of total
—% change
—% of total
Snapchat
—% change
—% of total
Social games
—% change
—% of total
Other
—% change
—% of total
Total
2015
$8,027.6
51.9%
73.9%
$1,277.6
54.6%
11.8%
$609.4
35.4%
5.6%
$58.1
-
0.5%
$311.2
13.6%
2.9%
$584.0
21.9%
5.4%
$10,867.8
2016
$11,932.4
48.6%
77.7%
$1,338.7
4.8%
8.7%
$730.8
19.9%
4.8%
$348.4
500.1%
2.3%
$336.9
8.3%
2.2%
$669.5
14.6%
4.4%
$15,356.6
2017
$15.193.8
27.3%
78.7%
$1,404.3
4.9%
7.3%
$807.5
10.5%
4.2%
$804.5
130.9%
4.2%
$357.6
6.2%
1.9%
$745.6
11.4%
3.9%
$19,313.3
2018
$18.570.2
22.2%
79.2%
$1,469.1
4.6%
6.3%
$911.5
12.9%
3.9%
$1,320.1
64.1%
5.6%
$375.9
5.1%
1.6%
$811.4
8.8%
3.5%
$23,458.2
Note: includes paid advertising appearing within social networks, socialnetwork games and social network apps; excludes spending by marketersthat goes toward developing or maintaining a social network presence;numbers may not add up to total due to roundingSource: company reports; eMarketer, Sep 2016215966 www.eMarketer.com
$ per person and CAGRUS Ad Spending per User, by Venue, 2015-2018
Digital ad spend per internet user (1)
Social network ad spend per social network user (2)
Facebook ad spend perFacebook user (3)
Digital video ad spend per digital video viewer (4)
Twitter ad spend per Twitter user (5)
Snapchat ad spend perSnapchat user (6)
2015
$229.37
$60.35
$49.51
$37.09
$24.96
$1.26
2016
$269.64
$82.67
$71.52
$47.90
$25.64
$5.94
2017
$303.23
$101.04
$88.65
$56.58
$26.38
$12.07
2018
$335.22
$119.51
$105.78
$63.29
$27.10
$18.03
CAGR(2015-2018)
13.5%
25.6%
28.8%
19.5%
2.8%
142.8%
Note: among users of the above via any device at least once per month; (1)includes classifieds/directories, banners and other, email, lead generation,mobile, rich media, search, sponsorships and video; (2) includes paidadvertising appearing within social networks, social network games andsocial network apps; excludes spending by marketers that goes towarddeveloping or maintaining a social network presence; (3) paid advertisingonly; excludes spending by marketers that goes toward developing ormaintaining a Facebook presence; (4) includes advertising that appearsbefore, during or after digital video content in a video player; (5) paidadvertising only; excludes spending by marketers that goes towarddeveloping or maintaining a Twitter presence; (6) paid advertising only;excludes spending by marketers that goes toward developing ormaintaining a Snapchat presenceSource: eMarketer, Sep 2016216067 www.eMarketer.com
US DIGITAL AD SPENDING, BY INDUSTRY
billions and CAGRUS Digital Ad Spending, by Industry, 2015-2020
Retail
Automotive
Financial services
Telecom
CPG & consumer products
Travel
Computing products & consumerelectronics
Media
Entertainment
Healthcare & pharma
Other
Total
2015
$13.18
$7.45
$7.33
$6.62
$5.07
$4.95
$4.53
$3.46
$2.86
$1.67
$2.69
$59.82
2016
$15.81
$9.13
$8.77
$7.90
$6.25
$5.96
$5.46
$4.24
$3.45
$2.02
$3.10
$72.09
2017
$18.15
$10.64
$10.09
$8.99
$7.26
$6.77
$6.27
$4.79
$4.04
$2.32
$3.54
$82.86
2018
$20.41
$12.15
$11.23
$10.02
$8.26
$7.52
$7.05
$5.38
$4.64
$2.66
$3.87
$93.18
2019
$22.65
$13.69
$12.35
$11.02
$9.27
$8.24
$7.82
$5.97
$5.25
$3.00
$4.14
$103.39
2020
$24.78
$15.21
$13.39
$11.95
$10.26
$8.90
$8.57
$6.54
$5.86
$3.34
$4.40
$113.18
CAGR(2015-2020)
13.5%
15.3%
12.8%
12.5%
15.1%
12.5%
13.6%
13.6%
15.4%
14.8%
10.3%
13.6%
Note: includes advertising that appears on desktop and laptop computersas well as mobile phones, tablets and other internet-connected devices,and includes all the various formats of advertising on those platforms;numbers may not add up to total due to roundingSource: eMarketer, Sep 2016215931 www.eMarketer.com
US AD SPENDING: EMARKETER’S UPDATED ESTIMATES AND FORECAST FOR 2015–2020 ©2016 EMARKETER INC. ALL RIGHTS RESERVED 15
% of totalUS Digital Ad Spending Share, by Industry, 2015-2020
Retail
Automotive
Financial services
Telecom
CPG & consumer products
Travel
Computing products & consumer electronics
Media
Entertainment
Healthcare & pharma
Other
2015
22.0%
12.5%
12.3%
11.1%
8.5%
8.3%
7.6%
5.8%
4.8%
2.8%
4.5%
2016
21.9%
12.7%
12.2%
11.0%
8.7%
8.3%
7.6%
5.9%
4.8%
2.8%
4.3%
2017
21.9%
12.8%
12.2%
10.9%
8.8%
8.2%
7.6%
5.8%
4.9%
2.8%
4.3%
2018
21.9%
13.0%
12.0%
10.8%
8.9%
8.1%
7.6%
5.8%
5.0%
2.9%
4.2%
2019
21.9%
13.2%
11.9%
10.7%
9.0%
8.0%
7.6%
5.8%
5.1%
2.9%
4.0%
2020
21.9%
13.4%
11.8%
10.6%
9.1%
7.9%
7.6%
5.8%
5.2%
3.0%
3.9%
Note: includes advertising that appears on desktop and laptop computersas well as mobile phones, tablets and other internet-connected devices,and includes all the various formats of advertising on those platforms;numbers may not add up to 100% due to roundingSource: eMarketer, Sep 2016215933 www.eMarketer.com
% changeUS Digital Ad Spending Growth, by Industry, 2015-2020
CPG & consumer products
Media
Automotive
Entertainment
Healthcare & pharma
Computing products & consumer electronics
Travel
Retail
Financial services
Telecom
Other
Total
2015
21.7%
24.6%
22.2%
22.8%
20.0%
20.3%
20.3%
20.3%
19.3%
19.2%
13.1%
20.4%
2016
23.3%
22.6%
22.4%
20.5%
20.5%
20.5%
20.5%
20.0%
19.5%
19.4%
15.2%
20.5%
2017
16.1%
12.9%
16.6%
17.2%
14.9%
14.8%
13.4%
14.8%
15.1%
13.8%
14.1%
14.9%
2018
13.7%
12.5%
14.2%
14.7%
14.5%
12.5%
11.1%
12.5%
11.2%
11.4%
9.3%
12.5%
2019
12.2%
11.0%
12.7%
13.2%
12.9%
11.0%
9.6%
11.0%
10.0%
9.9%
6.9%
11.0%
2020
10.7%
9.5%
11.1%
11.6%
11.4%
9.5%
8.1%
9.4%
8.4%
8.5%
6.3%
9.5%
Note: includes advertising that appears on desktop and laptop computersas well as mobile phones, tablets and other internet-connected devices,and includes all the various formats of advertising on those platformsSource: eMarketer, Sep 2016215934 www.eMarketer.com
US MOBILE AD SPENDING US Mobile Ad Spending, 2015-2020
Mobile ad spending(billions)
—% change
—% of digital adspending
—% of total mediaad spending
2015
$31.69
65.5%
53.0%
17.3%
2016
$45.95
45.0%
63.7%
23.5%
2017
$57.44
25.0%
69.3%
27.7%
2018
$68.93
20.0%
74.0%
31.4%
2019
$77.89
13.0%
75.3%
33.7%
2020
$86.84
11.5%
76.7%
35.8%
Note: includes classified, display (banners, rich media, video and other),email, lead generation, messaging-based advertising and searchadvertising; includes ad spending on tabletsSource: eMarketer, Sep 2016215968 www.eMarketer.com
US Mobile Internet Ad Spending, 2015-2020
Mobile internet ad spending (billions)
—% change
—% of digital ad spending
—% of total media ad spending
2015
$31.42
66.1%
52.5%
17.2%
2016
$45.66
45.3%
63.3%
23.3%
2017
$57.15
25.2%
69.0%
27.6%
2018
$68.64
20.1%
73.7%
31.3%
2019
$77.61
13.1%
75.1%
33.6%
2020
$86.56
11.5%
76.5%
35.7%
Note: includes banners and ads such as Facebook's News Feed Ads andTwitter's Promoted Tweets, rich media, sponsorships and video; video onWAP sites, mobile HTML sites and embedded in-app/in-game advertising;excludes SMS, MMS and P2P messaging-based advertising; includes adspending on tabletsSource: eMarketer, Sep 2016215972 www.eMarketer.com
billionsUS Mobile Ad Spending, by Format, 2015-2020
Display
—Banners, rich media,sponsorships and other*
—Video
Search
SMS/MMS/P2Pmessaging
Other (classifieds, email, lead gen)
Total
2015
$16.18
$13.29
$2.89
$14.17
$0.27
$1.06
$31.69
2016
$23.60
$19.14
$4.47
$20.28
$0.29
$1.78
$45.95
2017
$29.62
$23.75
$5.87
$25.06
$0.29
$2.47
$57.44
2018
$35.47
$28.36
$7.11
$29.87
$0.29
$3.30
$68.93
2019
$40.08
$31.98
$8.11
$33.60
$0.28
$3.93
$77.89
2020
$44.68
$35.61
$9.08
$37.43
$0.28
$4.45
$86.84
Note: includes ad spending on tablets; numbers may not add up to totaldue to rounding; *includes ads such as Facebook's News Feed Ads andTwitter's Promoted TweetsSource: eMarketer, Sep 2016215973 www.eMarketer.com
US AD SPENDING: EMARKETER’S UPDATED ESTIMATES AND FORECAST FOR 2015–2020 ©2016 EMARKETER INC. ALL RIGHTS RESERVED 16
% changeUS Mobile Ad Spending Growth, by Format, 2015-2020
Display
—Video
—Banners, rich media,sponsorships and other*
Search
SMS/MMS/P2Pmessaging
Other (classifieds, email, lead gen)
Total
2015
67.8%
88.0%
63.9%
62.6%
13.9%
93.3%
65.5%
2016
45.8%
54.5%
44.0%
43.1%
7.9%
67.5%
45.0%
2017
25.5%
31.4%
24.1%
23.6%
-0.4%
38.8%
25.0%
2018
19.8%
21.2%
19.4%
19.2%
-1.6%
33.6%
20.0%
2019
13.0%
14.1%
12.7%
12.5%
-2.7%
19.0%
13.0%
2020
11.5%
11.9%
11.4%
11.4%
-0.1%
13.5%
11.5%
Note: includes ad spending on tablets; *includes ads such as Facebook'sNews Feed Ads and Twitter's Promoted TweetsSource: eMarketer, Sep 2016216038 www.eMarketer.com
% of totalUS Mobile Ad Spending Share, by Format, 2015-2020
Display
—Banners, rich media,sponsorships and other*
—Video
Search
SMS/MMS/P2Pmessaging
Other (classifieds, email, lead gen)
2015
51.1%
41.9%
9.1%
44.7%
0.9%
3.4%
2016
51.4%
41.6%
9.7%
44.1%
0.6%
3.9%
2017
51.6%
41.4%
10.2%
43.6%
0.5%
4.3%
2018
51.5%
41.2%
10.3%
43.3%
0.4%
4.8%
2019
51.5%
41.1%
10.4%
43.1%
0.4%
5.0%
2020
51.5%
41.0%
10.5%
43.1%
0.3%
5.1%
Note: includes ad spending on tablets; numbers may not add up to 100%due to rounding; *includes ads such as Facebook's News Feed Ads andTwitter's Promoted TweetsSource: eMarketer, Sep 2016216040 www.eMarketer.com
US DIGITAL AD REVENUES, BY COMPANY
billions, % change and % of totalNet US Digital Ad Revenues, by Company, 2015-2018
—% change
—% of total
—% change
—% of total
Microsoft
—% change
—% of total
Yahoo
—% change
—% of total
—% change
—% of total
Verizon (AOL and Millennial Media)
—% change
—% of total
IAC
—% change
—% of total
Amazon
—% change
—% of total
—% change
—% of total
Yelp
—% change
—% of total
Snapchat
—% change
—% of total
Total digital ad spending
2015
$24.68
26.3%
41.3%
$8.03
51.9%
13.4%
$2.42
18.1%
4.0%
$2.51
-1.3%
4.2%
$1.28
54.6%
2.1%
$1.21
5.7%
2.0%
$0.78
-4.2%
1.3%
$0.71
8.7%
1.2%
$0.61
35.4%
1.0%
$0.47
35.5%
0.8%
$0.06
-
0.1%
$59.82
2016
$29.56
19.8%
41.0%
$11.93
48.6%
16.6%
$2.77
14.5%
3.8%
$2.23
-11.4%
3.1%
$1.34
4.8%
1.9%
$1.27
4.7%
1.8%
$0.61
-22.3%
0.8%
$0.94
33.7%
1.3%
$0.73
19.9%
1.0%
$0.59
26.2%
0.8%
$0.35
500.1%
0.5%
$72.09
2017
$33.93
14.8%
40.9%
$15.19
27.3%
18.3%
$3.11
12.5%
3.8%
$2.26
1.5%
2.7%
$1.40
4.9%
1.7%
$1.32
4.4%
1.6%
$0.61
0.8%
0.7%
$1.03
9.4%
1.2%
$0.81
10.5%
1.0%
$0.71
20.0%
0.9%
$0.80
130.9%
1.0%
$82.86
2018
$38.51
13.5%
41.3%
$18.57
22.2%
19.9%
$3.38
8.5%
3.6%
$2.29
1.5%
2.5%
$1.47
4.6%
1.6%
$1.37
3.9%
1.5%
$0.63
2.3%
0.7%
$1.14
10.0%
1.2%
$0.91
12.9%
1.0%
$0.85
19.0%
0.9%
$1.32
64.1%
1.4%
$93.18
Note: includes advertising that appears on desktop and laptop computersas well as mobile phones, tablets and other internet-connected devices,and includes all the various formats of advertising on those platforms; netad revenues after companies pay traffic acquisition costs (TAC) to partnersitesSource: company reports; eMarketer, Sep 2016215900 www.eMarketer.com
US AD SPENDING: EMARKETER’S UPDATED ESTIMATES AND FORECAST FOR 2015–2020 ©2016 EMARKETER INC. ALL RIGHTS RESERVED 17
billions, % change and % of totalNet US Search Ad Revenues, by Company, 2015-2018
2015 2016 2017 2018
—% change 25.8% 21.0% 15.8% 13.5%
—% of total 71.0% 74.4% 76.6% 77.2%
Microsoft
—% change 18.1% 14.5% 12.5% 8.5%
—% of total 8.4% 8.3% 8.3% 8.0%
Yahoo
—% change -5.3% -17.7% 1.0% 2.0%
—% of total 4.3% 3.1% 2.8% 2.5%
Yelp
—% change 40.5% 35.0% 20.0% 19.0%
—% of total 1.5% 1.8% 1.9% 2.0%
IAC
—% change -5.6% -25.1% -0.5% 1.0%
—% of total 2.5% 1.6% 1.5% 1.3%
Amazon
—% change 8.7% 33.7% 9.4% 10.0%
—% of total 0.6% 0.7% 0.7% 0.7%
Verizon (AOL)
—% change -3.9% -1.4% 1.6% 1.0%
—% of total 0.7% 0.6% 0.6% 0.5%
Total search ad spending
$20.47 $24.77 $28.67 $32.54
$2.42 $2.77 $3.11 $3.38
$1.25 $1.03 $1.04 $1.06
$0.44 $0.59 $0.71 $0.85
$0.73 $0.55 $0.54 $0.55
$0.18 $0.24 $0.26 $0.28
$0.21 $0.21 $0.21 $0.21
$28.84 $33.28 $37.44 $42.18
Note: includes advertising that appears on desktop and laptop computersas well as mobile phones, tablets and other internet-connected devices;net ad revenues after companies pay traffic acquisition costs (TAC) topartner sites; includes contextual text links, paid inclusion, paid listings(paid search) and SEOSource: company reports; eMarketer, Sep 2016215916 www.eMarketer.com
billions, % change and % of total
Net US Digital Display Ad Revenues, by Company,2015-2018
2015 2016 2017 2018
—% change 51.9% 48.6% 27.3% 22.2%
—% of total 29.8% 34.5% 37.2% 40.2%
—% change 28.8% 13.7% 9.9% 13.5%
—% of total 15.6% 13.8% 12.9% 12.9%
—% change 54.6% 4.8% 4.9% 4.6%
—% of total 4.7% 3.9% 3.4% 3.2%
Yahoo
—% change 3.1% -5.2% 2.0% 1.0%
—% of total 4.7% 3.5% 3.0% 2.7%
Verizon (AOL and Millennial Media)
—% change 7.9% 6.0% 5.0% 4.4%
—% of total 3.7% 3.1% 2.7% 2.5%
Amazon
—% change 8.7% 33.7% 9.4% 10.0%
—% of total 2.0% 2.0% 1.9% 1.8%
—% change 39.0% 21.2% 9.9% 11.2%
—% of total 1.4% 1.3% 1.2% 1.2%
Snapchat
—% change - 500.1% 130.9% 64.1%
—% of total 0.2% 1.0% 2.0% 2.9%
IAC
—% change 19.1% 16.8% 12.3% 12.0%
—% of total 0.2% 0.2% 0.2% 0.2%
Total digital display ad spending
$8.03 $11.93 $15.19 $18.57
$4.21 $4.79 $5.26 $5.97
$1.28 $1.34 $1.40 $1.47
$1.27 $1.20 $1.22 $1.24
$1.00 $1.06 $1.11 $1.16
$0.53 $0.71 $0.77 $0.85
$0.38 $0.46 $0.50 $0.56
$0.06 $0.35 $0.80 $1.32
$0.05 $0.06 $0.07 $0.08
$26.92 $34.56 $40.86 $46.19
Note: includes advertising that appears on desktop and laptop computersas well as mobile phones, tablets and other internet-connected devices;net ad revenues after companies pay traffic acquisition costs (TAC) topartner sites; includes banner ads and other (static display ads such asFacebook's News Feed Ads and Twitter's Promoted Tweets), rich media,sponsorships and video (including advertising that appears before, duringor after digital video content in a video player)Source: company reports; eMarketer, Sep 2016215923 www.eMarketer.com
US AD SPENDING: EMARKETER’S UPDATED ESTIMATES AND FORECAST FOR 2015–2020 ©2016 EMARKETER INC. ALL RIGHTS RESERVED 18
% of total media ad spending and billions
Net US Digital Ad Revenue Share, by Company,2015-2018
Microsoft
Yahoo
Verizon (AOL and Millennial Media)
Amazon
IAC
Yelp
Snapchat
Total digital
Total media ad spending (billions)
2015
13.5%
4.4%
1.3%
1.4%
0.7%
0.7%
0.4%
0.3%
0.4%
0.3%
-
32.7%
$183.06
2016
15.1%
6.1%
1.4%
1.1%
0.7%
0.6%
0.5%
0.4%
0.3%
0.3%
0.2%
36.8%
$195.76
2017
16.4%
7.3%
1.5%
1.1%
0.7%
0.6%
0.5%
0.4%
0.3%
0.3%
0.4%
40.0%
$207.30
2018
17.6%
8.5%
1.5%
1.0%
0.7%
0.6%
0.5%
0.4%
0.3%
0.4%
0.6%
42.5%
$219.27
Note: includes advertising that appears on desktop and laptop computersas well as mobile phones, tablets and other internet-connected devices,and includes all the various formats of advertising on those platforms; netad revenues after companies pay traffic acquisition costs (TAC) to partnersites; total media includes digital (desktop/laptop, mobile and otherinternet-connected devices), directories, magazines, newspapers,out-of-home, radio and TVSource: company reports; eMarketer, Sep 2016215930 www.eMarketer.com
billions and % of total
Google Net US Ad Revenues, by Device and Format,2015-2018
2015 2016 2017 2018
Search
Mobile
—% of total 34.6% 43.1% 48.4% 52.9%
Desktop
—% of total 48.3% 40.7% 36.1% 31.6%
Display
Desktop
—% of total 11.1% 9.6% 8.2% 7.9%
Mobile
—% of total 6.0% 6.6% 7.3% 7.6%
Total
$8.54 $12.73 $16.42 $20.36
$11.92 $12.04 $12.25 $12.18
$2.74 $2.83 $2.79 $3.06
$1.47 $1.96 $2.47 $2.91
$24.68 $29.56 $33.93 $38.51
Note: net ad revenues after company pays traffic acquisition costs (TAC)and content acquisition costs (CAC) to partner sites; mobile includestablets; numbers may not add up to total due to roundingSource: company reports; eMarketer, Sep 2016216090 www.eMarketer.com
billions and % of totalGoogle Net US Ad Revenues, by Device, 2015-2018
2015
59.4%
40.6%
$24.68
2016
50.3%
49.7%
$29.56
2017
44.3%
55.7%
$33.93
2018
39.6%
60.4%
$38.51
Desktop Mobile
Note: net ad revenues after company pays traffic acquisition costs (TAC)and content acquisition costs (CAC) to partner sites; mobile includestablets; numbers may not add up to 100% due to roundingSource: company reports; eMarketer, Sep 2016216106 www.eMarketer.com
billions, % change and % of Google net ad revenuesYouTube Net US Ad Revenues, 2015-2018
2015
$2.2440.0%
9.1%2016
$2.92
30.0%
9.9%
2017
$3.50
20.0%
10.3%
2018
$3.96
13.0%
10.3%
YouTube net ad revenues% change % of Google net ad revenues
Note: net ad revenues after company pays traffic acquisition costs (TAC)and content acquisition costs (CAC) to partner sites; includes banners, richmedia, search and video adsSource: company reports; eMarketer, Sep 2016216103 www.eMarketer.com
US AD SPENDING: EMARKETER’S UPDATED ESTIMATES AND FORECAST FOR 2015–2020 ©2016 EMARKETER INC. ALL RIGHTS RESERVED 19
billions, % change and % of total video ad revenuesYouTube Net US Video Ad Revenues, 2015-2018
2015
$1.68
40.0%
21.9%
2016
$2.16
28.3%
20.9%
2017
$2.59
20.0%
20.6%
2018
$2.89
11.5%
20.1%
YouTube net video ad revenues% change % of total video ad revenues
Note: net ad revenues after company pays traffic acquisition costs (TAC)and content acquisition costs (CAC) to partner sitesSource: company reports; eMarketer, Sep 2016216104 www.eMarketer.com
billions and % of total
YouTube Net Ad Revenues Worldwide, US vs. Non-US,2015-2018
2015 2016 2017 2018
US
—% of worldwide total 52.5% 52.3% 49.6% 48.5%
Non-US
—% of worldwide total 47.5% 47.7% 50.4% 51.5%
Worldwide
$2.24 $2.92 $3.50 $3.96
$2.03 $2.66 $3.55 $4.20
$4.28 $5.58 $7.05 $8.16
Note: net ad revenues after company pays traffic acquisition costs (TAC)and content acquisition costs (CAC) to partner sites; includes banners, richmedia, search and video adsSource: company reports; eMarketer, Sep 2016216102 www.eMarketer.com
billions and % of total
Facebook Ad Revenues Worldwide, US vs. Non-US,2015-2018
2015 2016 2017 2018
Non-US
—% of worldwide total 53% 54% 55% 56%
US
—% of worldwide total 47% 46% 45% 44%
Worldwide
$9.05 $14.01 $18.57 $23.63
$8.03 $11.93 $15.19 $18.57
$17.08 $25.94 $33.76 $42.20
Note: paid advertising only; excludes spending by marketers that goestoward developing or maintaining a Facebook presenceSource: company reports; eMarketer, Sep 2016216091 www.eMarketer.com
billions, % change and % of total
Instagram Net Mobile Ad Revenues Worldwide, US vs.Non-US, 2015-2018
2015 2016 2017 2018
US $0.60 $1.58 $2.73 $4.65
—% change - 165% 73% 70%
—% of worldwide total 95% 85% 75% 68%
Non-US $0.03 $0.28 $0.91 $2.19
—% change - 788% 227% 140%
—% of worldwide total 5% 15% 25% 32%
Worldwide $0.63 $1.86 $3.64 $6.84
—% change - 196% 96% 88%
Note: paid advertising only; excludes spending by marketers that goestoward developing or maintaining an Instagram presence; numbers maynot add up to total due to roundingSource: eMarketer, Sep 2016216114 www.eMarketer.com
Instagram Net Mobile Ad Revenue Share of FacebookMobile Ad Revenues Worldwide, US vs. Non-US,2015-2018
% of non-US Facebook net mobile adrevenues
% of US Facebook net mobile ad revenues
% of Facebook net mobile adrevenues worldwide
2015
0.4%
9.6%
4.8%
2016
2.4%
15.6%
8.4%
2017
5.6%
20.4%
12.3%
2018
10.3%
27.8%
18.0%
Note: paid advertising only; excludes spending by marketers that goestoward developing or maintaining an Instagram presenceSource: eMarketer, Sep 2016216115 www.eMarketer.com
billions and % of total
US Facebook and Twitter Ad Revenue Share, byDevice, 2015-2018
2015 2016 2017 2018
Mobile 77.0% 85.0% 88.0% 90.0%
Desktop 23.0% 15.0% 12.0% 10.0%
Total
Mobile 88.0% 88.5% 89.0% 89.5%
Desktop 12.0% 11.5% 11.0% 10.6%
Total
$8.03 $11.93 $15.19 $18.57
$1.28 $1.34 $1.40 $1.47
Note: paid advertising only; excludes spending by marketers that goestoward developing or maintaining a social networking presenceSource: company reports; eMarketer, Sep 2016216093 www.eMarketer.com
US AD SPENDING: EMARKETER’S UPDATED ESTIMATES AND FORECAST FOR 2015–2020 ©2016 EMARKETER INC. ALL RIGHTS RESERVED 20
billions and % of total
Twitter Ad Revenues Worldwide, US vs. Non-US,2015-2018
2015 2016 2017 2018
US
—% of worldwide total 64% 59% 56% 53%
Non-US
—% of worldwide total 36% 41% 44% 47%
Worldwide
$1.28 $1.34 $1.40 $1.47
$0.72 $0.92 $1.12 $1.32
$1.26 $2.26 $2.53 $2.79
Note: paid advertising only; excludes spending by marketers that goestoward developing or maintaining a Twitter presence; net ad revenues aftercompany pays traffic acquisition costs (TAC) to partner sites; includes adspending on tablets; excludes SMS, MMS and P2P messaging-basedadvertising; numbers may not add up to total due to roundingSource: company reports; eMarketer, Sep 2016216095 www.eMarketer.com
millions and % of total
LinkedIn Ad Revenues Worldwide, US vs. Non-US,2015-2018
US
—% of worldwide total
Non-US
—% of worldwide total
Worldwide
2015
$609.4
64%
$348.5
36%
$957.9
2016
$730.8
63%
$430.5
37%
$1,161.3
2017
$807.5
62%
$486.3
38%
$1,293.7
2018
$911.5
62%
$555.5
38%
$1,467.0
Note: figures represent revenue from LinkedIn's Marketing Solutionsbusiness segment and job posting classifieds ad revenue from TalentSolutions; numbers may not add up to total due to roundingSource: company reports; eMarketer, Sep 2016216096 www.eMarketer.com
millions and % of total
Snapchat Ad Revenues Worldwide, US vs. Non-US,2015-2018
US ad revenues
—% of worldwide total
Non-US ad revenues
—% of worldwide total
Worldwide
2015
$58.1
98.0%
$1.2
2.0%
$59.2
2016
$348.4
95.0%
$18.3
5.0%
$366.7
2017
$804.5
86.0%
$131.0
14.0%
$935.5
2018
$1,320.1
75.0%
$440.0
25.0%
$1,760.1
Note: paid advertising only; excludes spending by marketers that goestoward developing or maintaining a Snapchat presenceSource: eMarketer, Sep 2016215545 www.eMarketer.com
millions and % of totalUS Snapchat Ad Revenues, by Source, 2015-2018
Snap Ads—Discover
—% of total
Snap Ads—Live Stories
—% of total
Sponsored lenses
—% of total
Sponsored geofilters
—% of total
Total
2015
$58.1
100.0%
-
-
-
-
-
-
$58.1
2016
$149.8
43.0%
$96.3
27.7%
$73.0
21.0%
$29.2
8.4%
$348.4
2017
$243.2
30.2%
$304.0
37.8%
$164.3
20.4%
$93.1
11.6%
$804.5
2018
$401.0
30.4%
$481.2
36.4%
$273.8
20.7%
$164.3
12.4%
$1,320.1
Note: paid advertising only; excludes spending by marketers that goestoward developing or maintaining a Snapchat presenceSource: eMarketer, Sep 2016215547 www.eMarketer.com
NET US MOBILE AD REVENUES, BY COMPANY
millionsNet US Mobile Ad Revenues, by Company, 2015-2018
Yahoo
Pandora
YP
Snapchat
Yelp
Amazon
Other
Total
2015
$10,017.5
$6,181.3
$1,124.3
$879.3
$722.6
$637.9
$58.1
$211.4
$151.2
$105.9
$11,600.4
$31,689.8
2016
$14,690.4
$10,142.5
$1,184.7
$1,068.2
$847.1
$765.5
$348.4
$272.7
$206.2
$188.9
$16,235.6
$45,950.2
2017
$18,891.8
$13,370.5
$1,249.8
$1,242.8
$986.3
$895.6
$804.5
$330.9
$251.9
$258.3
$19,155.3
$57,437.7
2018
$23,277.7
$16,713.2
$1,314.1
$1,375.5
$1,124.4
$1,021.0
$1,320.1
$406.4
$308.1
$397.8
$21,667.1
$68,925.2
Note: net ad revenues after companies pay traffic acquisition costs (TAC) topartner sites; includes classified, display (banners, rich media, video andother), email, lead generation, messaging-based advertising and searchadvertising; includes ad spending on tablets; numbers may not add up tototal due to roundingSource: company reports; eMarketer, Sep 2016216041 www.eMarketer.com
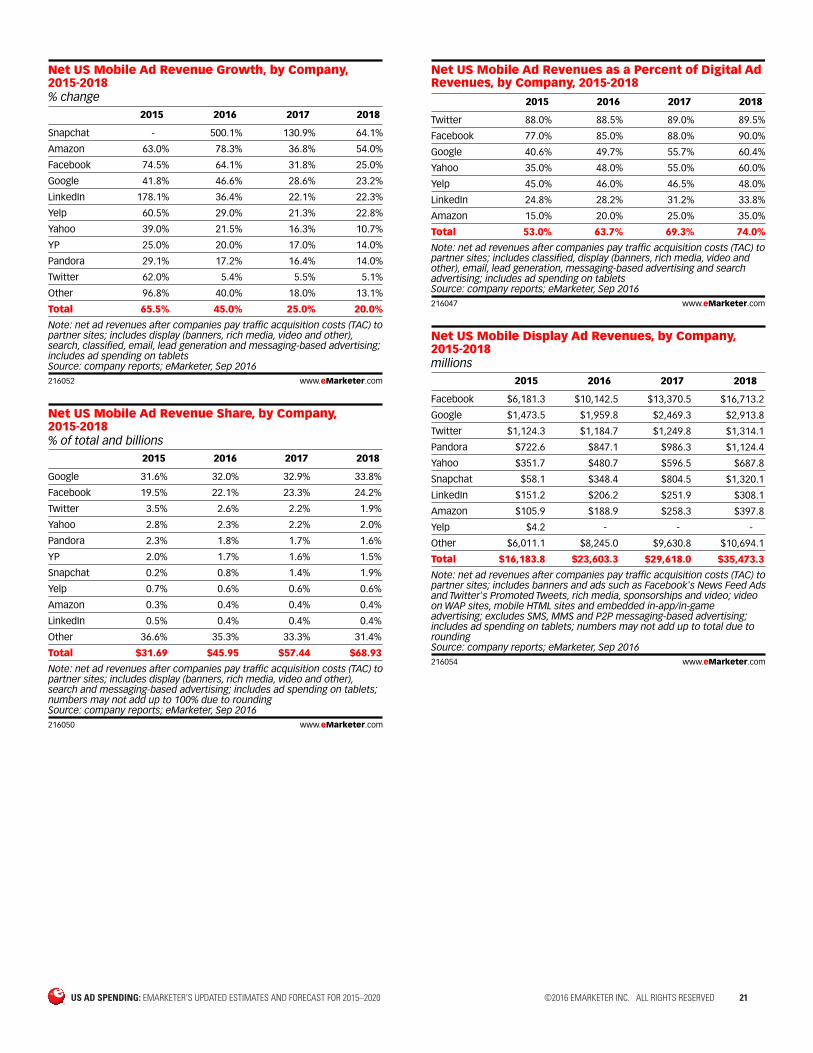
US AD SPENDING: EMARKETER’S UPDATED ESTIMATES AND FORECAST FOR 2015–2020 ©2016 EMARKETER INC. ALL RIGHTS RESERVED 21
% change
Net US Mobile Ad Revenue Growth, by Company,2015-2018
2015 2016 2017 2018
Snapchat - 500.1% 130.9% 64.1%
Amazon 63.0% 78.3% 36.8% 54.0%
Facebook 74.5% 64.1% 31.8% 25.0%
Google 41.8% 46.6% 28.6% 23.2%
LinkedIn 178.1% 36.4% 22.1% 22.3%
Yelp 60.5% 29.0% 21.3% 22.8%
Yahoo 39.0% 21.5% 16.3% 10.7%
YP 25.0% 20.0% 17.0% 14.0%
Pandora 29.1% 17.2% 16.4% 14.0%
Twitter 62.0% 5.4% 5.5% 5.1%
Other 96.8% 40.0% 18.0% 13.1%
Total 65.5% 45.0% 25.0% 20.0%
Note: net ad revenues after companies pay traffic acquisition costs (TAC) topartner sites; includes display (banners, rich media, video and other),search, classified, email, lead generation and messaging-based advertising;includes ad spending on tabletsSource: company reports; eMarketer, Sep 2016216052 www.eMarketer.com
% of total and billions
Net US Mobile Ad Revenue Share, by Company,2015-2018
2015 2016 2017 2018
Google 31.6% 32.0% 32.9% 33.8%
Facebook 19.5% 22.1% 23.3% 24.2%
Twitter 3.5% 2.6% 2.2% 1.9%
Yahoo 2.8% 2.3% 2.2% 2.0%
Pandora 2.3% 1.8% 1.7% 1.6%
YP 2.0% 1.7% 1.6% 1.5%
Snapchat 0.2% 0.8% 1.4% 1.9%
Yelp 0.7% 0.6% 0.6% 0.6%
Amazon 0.3% 0.4% 0.4% 0.4%
LinkedIn 0.5% 0.4% 0.4% 0.4%
Other 36.6% 35.3% 33.3% 31.4%
Total $31.69 $45.95 $57.44 $68.93
Note: net ad revenues after companies pay traffic acquisition costs (TAC) topartner sites; includes display (banners, rich media, video and other),search and messaging-based advertising; includes ad spending on tablets;numbers may not add up to 100% due to roundingSource: company reports; eMarketer, Sep 2016216050 www.eMarketer.com
Net US Mobile Ad Revenues as a Percent of Digital AdRevenues, by Company, 2015-2018
2015 2016 2017 2018
Twitter 88.0% 88.5% 89.0% 89.5%
Facebook 77.0% 85.0% 88.0% 90.0%
Google 40.6% 49.7% 55.7% 60.4%
Yahoo 35.0% 48.0% 55.0% 60.0%
Yelp 45.0% 46.0% 46.5% 48.0%
LinkedIn 24.8% 28.2% 31.2% 33.8%
Amazon 15.0% 20.0% 25.0% 35.0%
Total 53.0% 63.7% 69.3% 74.0%
Note: net ad revenues after companies pay traffic acquisition costs (TAC) topartner sites; includes classified, display (banners, rich media, video andother), email, lead generation, messaging-based advertising and searchadvertising; includes ad spending on tabletsSource: company reports; eMarketer, Sep 2016216047 www.eMarketer.com
millions
Net US Mobile Display Ad Revenues, by Company,2015-2018
Pandora
Yahoo
Snapchat
Amazon
Yelp
Other
Total
2015
$6,181.3
$1,473.5
$1,124.3
$722.6
$351.7
$58.1
$151.2
$105.9
$4.2
$6,011.1
$16,183.8
2016
$10,142.5
$1,959.8
$1,184.7
$847.1
$480.7
$348.4
$206.2
$188.9
-
$8,245.0
$23,603.3
2017
$13,370.5
$2,469.3
$1,249.8
$986.3
$596.5
$804.5
$251.9
$258.3
-
$9,630.8
$29,618.0
2018
$16,713.2
$2,913.8
$1,314.1
$1,124.4
$687.8
$1,320.1
$308.1
$397.8
-
$10,694.1
$35,473.3
Note: net ad revenues after companies pay traffic acquisition costs (TAC) topartner sites; includes banners and ads such as Facebook's News Feed Adsand Twitter's Promoted Tweets, rich media, sponsorships and video; videoon WAP sites, mobile HTML sites and embedded in-app/in-gameadvertising; excludes SMS, MMS and P2P messaging-based advertising;includes ad spending on tablets; numbers may not add up to total due toroundingSource: company reports; eMarketer, Sep 2016216054 www.eMarketer.com
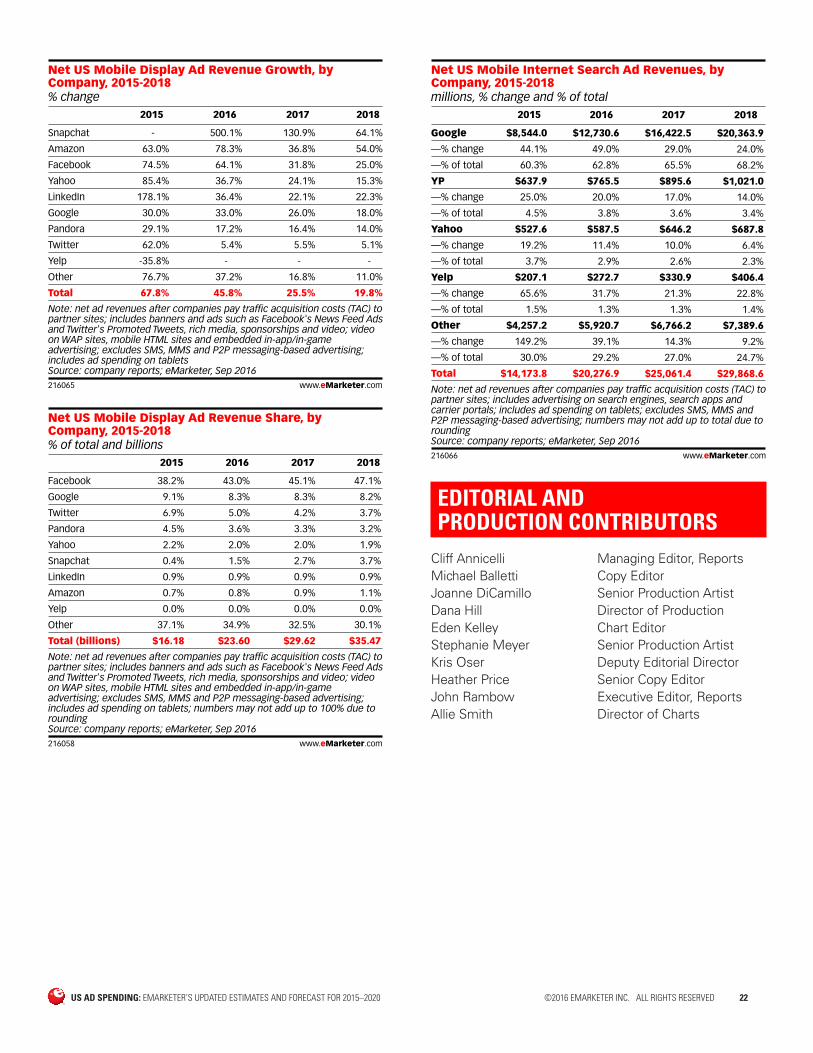
US AD SPENDING: EMARKETER’S UPDATED ESTIMATES AND FORECAST FOR 2015–2020 ©2016 EMARKETER INC. ALL RIGHTS RESERVED 22
% change
Net US Mobile Display Ad Revenue Growth, byCompany, 2015-2018
2015 2016 2017 2018
Snapchat - 500.1% 130.9% 64.1%
Amazon 63.0% 78.3% 36.8% 54.0%
Facebook 74.5% 64.1% 31.8% 25.0%
Yahoo 85.4% 36.7% 24.1% 15.3%
LinkedIn 178.1% 36.4% 22.1% 22.3%
Google 30.0% 33.0% 26.0% 18.0%
Pandora 29.1% 17.2% 16.4% 14.0%
Twitter 62.0% 5.4% 5.5% 5.1%
Yelp -35.8% - - -
Other 76.7% 37.2% 16.8% 11.0%
Total 67.8% 45.8% 25.5% 19.8%
Note: net ad revenues after companies pay traffic acquisition costs (TAC) topartner sites; includes banners and ads such as Facebook's News Feed Adsand Twitter's Promoted Tweets, rich media, sponsorships and video; videoon WAP sites, mobile HTML sites and embedded in-app/in-gameadvertising; excludes SMS, MMS and P2P messaging-based advertising;includes ad spending on tabletsSource: company reports; eMarketer, Sep 2016216065 www.eMarketer.com
% of total and billions
Net US Mobile Display Ad Revenue Share, byCompany, 2015-2018
2015 2016 2017 2018
Facebook 38.2% 43.0% 45.1% 47.1%
Google 9.1% 8.3% 8.3% 8.2%
Twitter 6.9% 5.0% 4.2% 3.7%
Pandora 4.5% 3.6% 3.3% 3.2%
Yahoo 2.2% 2.0% 2.0% 1.9%
Snapchat 0.4% 1.5% 2.7% 3.7%
LinkedIn 0.9% 0.9% 0.9% 0.9%
Amazon 0.7% 0.8% 0.9% 1.1%
Yelp 0.0% 0.0% 0.0% 0.0%
Other 37.1% 34.9% 32.5% 30.1%
Total (billions) $16.18 $23.60 $29.62 $35.47
Note: net ad revenues after companies pay traffic acquisition costs (TAC) topartner sites; includes banners and ads such as Facebook's News Feed Adsand Twitter's Promoted Tweets, rich media, sponsorships and video; videoon WAP sites, mobile HTML sites and embedded in-app/in-gameadvertising; excludes SMS, MMS and P2P messaging-based advertising;includes ad spending on tablets; numbers may not add up to 100% due toroundingSource: company reports; eMarketer, Sep 2016216058 www.eMarketer.com
millions, % change and % of total
Net US Mobile Internet Search Ad Revenues, byCompany, 2015-2018
—% change
—% of total
YP
—% change
—% of total
Yahoo
—% change
—% of total
Yelp
—% change
—% of total
Other
—% change
—% of total
Total
2015
$8,544.0
44.1%
60.3%
$637.9
25.0%
4.5%
$527.6
19.2%
3.7%
$207.1
65.6%
1.5%
$4,257.2
149.2%
30.0%
$14,173.8
2016
$12,730.6
49.0%
62.8%
$765.5
20.0%
3.8%
$587.5
11.4%
2.9%
$272.7
31.7%
1.3%
$5,920.7
39.1%
29.2%
$20,276.9
2017
$16,422.5
29.0%
65.5%
$895.6
17.0%
3.6%
$646.2
10.0%
2.6%
$330.9
21.3%
1.3%
$6,766.2
14.3%
27.0%
$25,061.4
2018
$20,363.9
24.0%
68.2%
$1,021.0
14.0%
3.4%
$687.8
6.4%
2.3%
$406.4
22.8%
1.4%
$7,389.6
9.2%
24.7%
$29,868.6
Note: net ad revenues after companies pay traffic acquisition costs (TAC) topartner sites; includes advertising on search engines, search apps andcarrier portals; includes ad spending on tablets; excludes SMS, MMS andP2P messaging-based advertising; numbers may not add up to total due toroundingSource: company reports; eMarketer, Sep 2016216066 www.eMarketer.com
EDITORIAL AND PRODUCTION CONTRIBUTORS
Cliff Annicelli Managing Editor, ReportsMichael Balletti Copy EditorJoanne DiCamillo Senior Production ArtistDana Hill Director of ProductionEden Kelley Chart EditorStephanie Meyer Senior Production ArtistKris Oser Deputy Editorial DirectorHeather Price Senior Copy EditorJohn Rambow Executive Editor, ReportsAllie Smith Director of Charts
Coverage of a Digital WorldeMarketer data and insights address how consumers spend time and money, and what marketers are doing to reach them in today’s digital world. Get a deeper look at eMarketer coverage, including our reports, benchmarks and forecasts, and charts.
Confidence in the NumbersOur unique approach of analyzing data from multiple research sources provides our customers with the most definitive answers available about the marketplace. Learn why.
Customer StoriesThe world’s top companies across every industry look to eMarketer first for information on digital marketing, media and commerce. Read more about how our clients use eMarketer to make smarter decisions.
Your account team is here to help:Email [email protected] to submit a request for research support, or contact [email protected] or 866-345-3864 to discuss any details related to your account.
The leading research firm for marketing in a digital world.